惠普 Pavilion 14-al103ng 笔记本电脑简短评测
| SD Card Reader | |
| average JPG Copy Test (av. of 3 runs) | |
| HP Pavilion 14-al003ng | |
| HP Pavilion 14-al103ng | |
| Lenovo IdeaPad 510S-14ISK | |
| Medion Akoya S4219 | |
| Dell Latitude 14 3470 | |
| Acer TravelMate X3 X349-M-7261 | |
| maximum AS SSD Seq Read Test (1GB) | |
| Medion Akoya S4219 | |
| HP Pavilion 14-al103ng | |
| Lenovo IdeaPad 510S-14ISK | |
| HP Pavilion 14-al003ng | |
| Dell Latitude 14 3470 | |
| Acer TravelMate X3 X349-M-7261 | |
| Networking | |
| iperf Server (receive) TCP 1 m | |
| Acer TravelMate X3 X349-M-7261 (jseb) | |
| Lenovo IdeaPad 510S-14ISK | |
| Dell Latitude 14 3470 | |
| iperf Client (transmit) TCP 1 m | |
| Acer TravelMate X3 X349-M-7261 (jseb) | |
| Lenovo IdeaPad 510S-14ISK | |
| Dell Latitude 14 3470 | |
| iperf3 transmit AX12 | |
| HP Pavilion 14-al103ng | |
| iperf3 receive AX12 | |
| HP Pavilion 14-al103ng | |
| |||||||||||||||||||||||||
Brightness Distribution: 90 %
Center on Battery: 200 cd/m²
Contrast: 1429:1 (Black: 0.14 cd/m²)
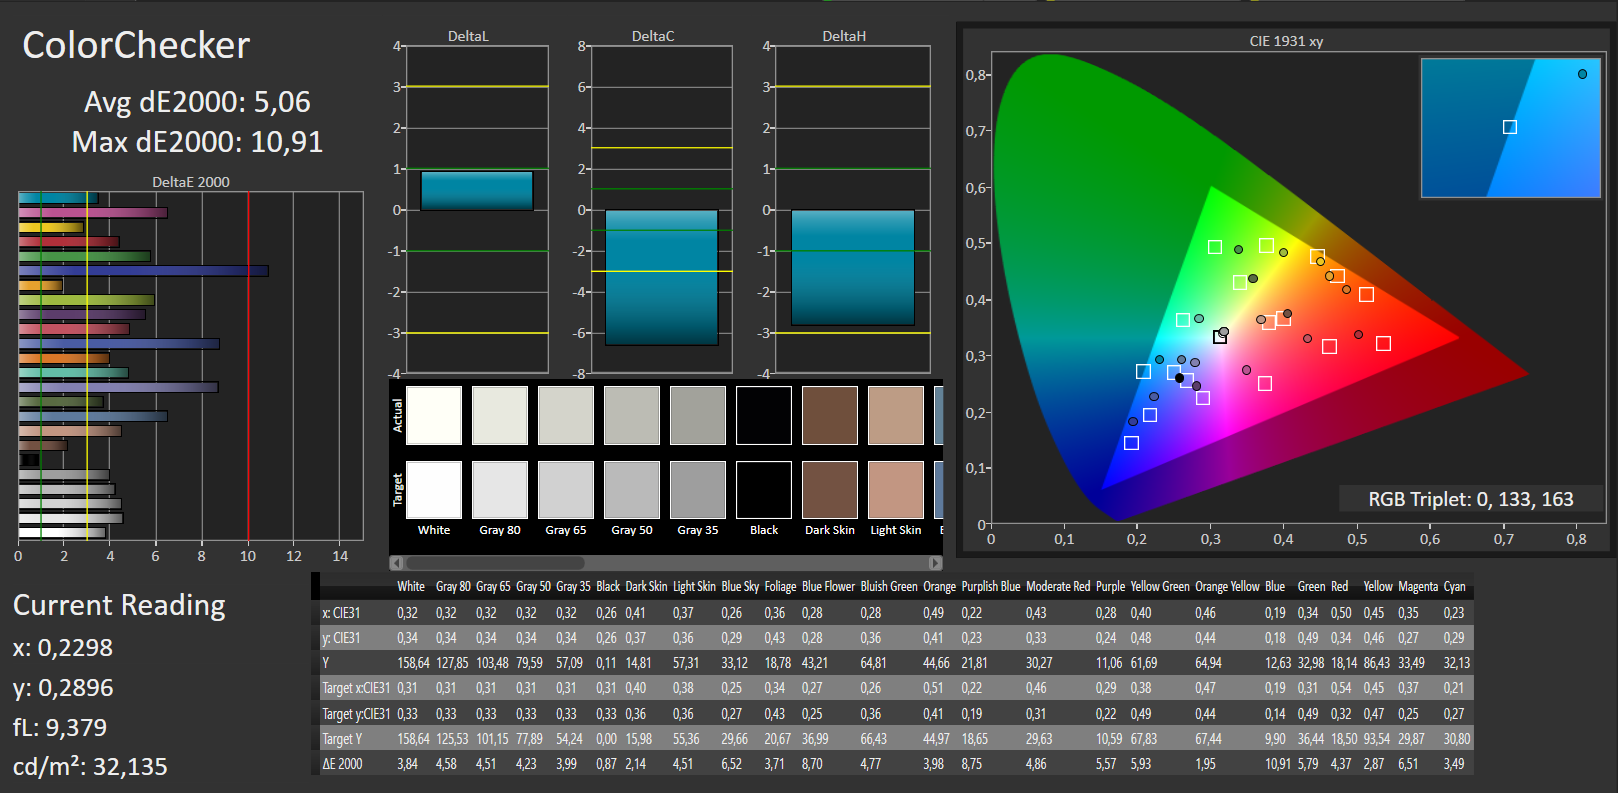
ΔE ColorChecker Calman: 5.06 | ∀{0.5-29.43 Ø4.71}
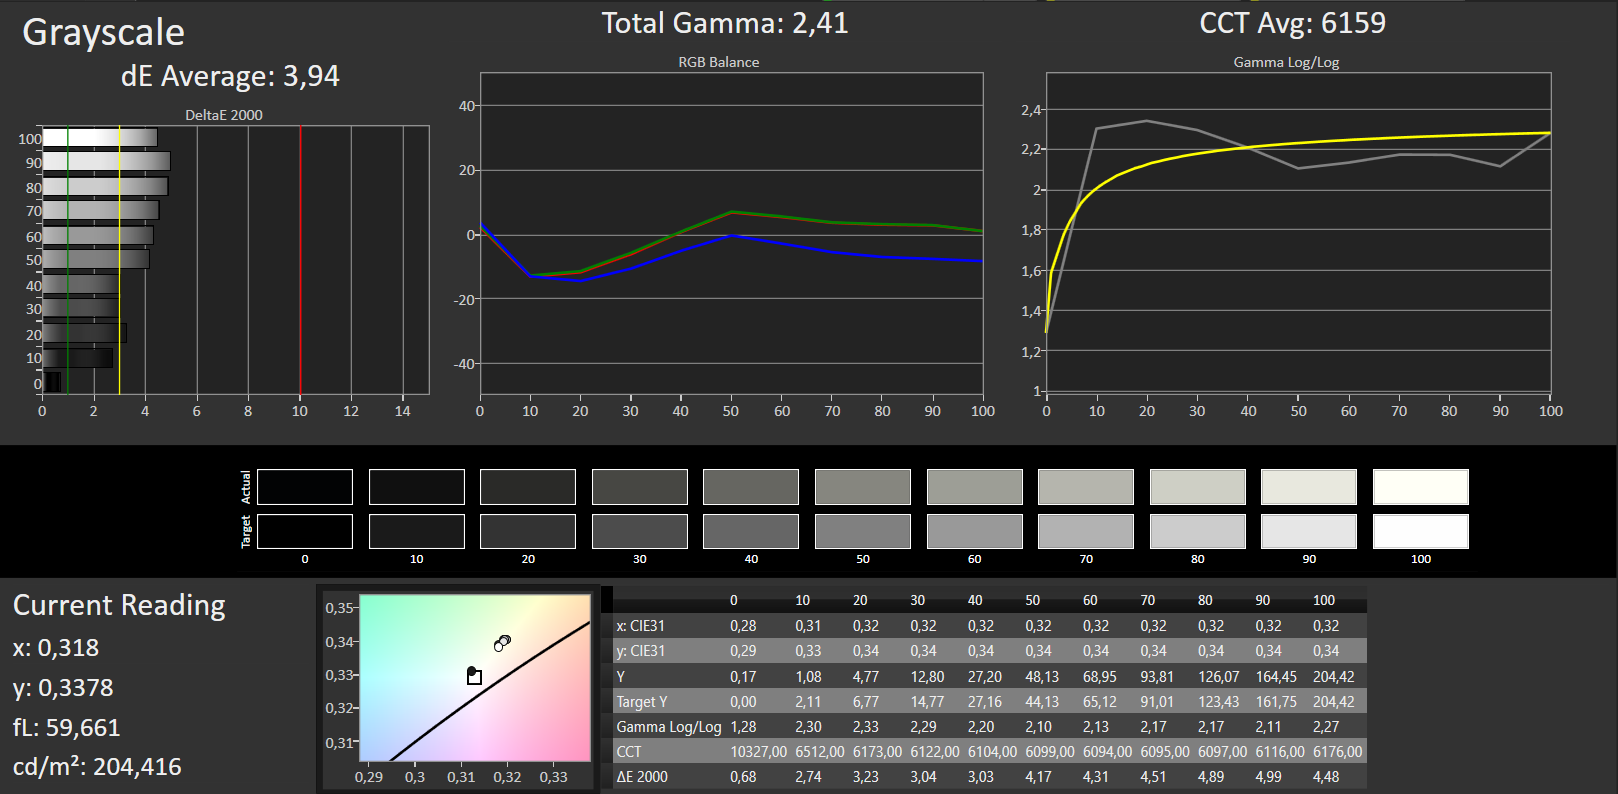
ΔE Greyscale Calman: 3.94 | ∀{0.09-98 Ø4.96}
55% sRGB (Argyll 1.6.3 3D)
35% AdobeRGB 1998 (Argyll 1.6.3 3D)
37.79% AdobeRGB 1998 (Argyll 3D)
54.9% sRGB (Argyll 3D)
36.58% Display P3 (Argyll 3D)
Gamma: 2.41
CCT: 6159 K
| HP Pavilion 14-al103ng IPS, 1920x1080, 14" | HP Pavilion 14-al003ng LED IPS, 1920x1080, 14" | Acer TravelMate X3 X349-M-7261 IPS, 1920x1080, 14" | Dell Latitude 14 3470 TN LED, 1366x768, 14" | Lenovo IdeaPad 510S-14ISK a-Si TFT-LCD, IPS, LED, 1920x1080, 14" | Medion Akoya S4219 IPS, 1920x1080, 14" | |
|---|---|---|---|---|---|---|
| Display | 1% | 10% | 17% | 62% | ||
| Display P3 Coverage (%) | 36.58 | 36.97 1% | 40.21 10% | 42.88 17% | 61.7 69% | |
| sRGB Coverage (%) | 54.9 | 55.6 1% | 60.5 10% | 64.1 17% | 84.8 54% | |
| AdobeRGB 1998 Coverage (%) | 37.79 | 38.2 1% | 41.55 10% | 44.3 17% | 62 64% | |
| Response Times | 19% | 9% | 8% | 10% | 38% | |
| Response Time Grey 50% / Grey 80% * (ms) | 53 ? | 36.4 ? 31% | 42 ? 21% | 47 ? 11% | 45 ? 15% | 33 ? 38% |
| Response Time Black / White * (ms) | 27 ? | 25.2 ? 7% | 28 ? -4% | 26 ? 4% | 26 ? 4% | 17 ? 37% |
| PWM Frequency (Hz) | 50 ? | 50 ? | ||||
| Screen | -9% | -2% | -68% | -1% | 14% | |
| Brightness middle (cd/m²) | 200 | 220 10% | 230 15% | 206 3% | 257 29% | 216 8% |
| Brightness (cd/m²) | 191 | 209 9% | 226 18% | 193 1% | 263 38% | 211 10% |
| Brightness Distribution (%) | 90 | 88 -2% | 86 -4% | 87 -3% | 90 0% | 65 -28% |
| Black Level * (cd/m²) | 0.14 | 0.28 -100% | 0.2 -43% | 0.48 -243% | 0.24 -71% | 0.2 -43% |
| Contrast (:1) | 1429 | 786 -45% | 1150 -20% | 429 -70% | 1071 -25% | 1080 -24% |
| Colorchecker dE 2000 * | 5.06 | 4.58 9% | 5.07 -0% | 11 -117% | 5.44 -8% | 3.7 27% |
| Colorchecker dE 2000 max. * | 10.91 | 11.47 -5% | 10.07 8% | 19.57 -79% | 10.93 -0% | 5.88 46% |
| Greyscale dE 2000 * | 3.94 | 2.34 41% | 3.64 8% | 11.51 -192% | 3.95 -0% | 2.67 32% |
| Gamma | 2.41 91% | 2.26 97% | 2.46 89% | 2.23 99% | 2.29 96% | 2.65 83% |
| CCT | 6159 106% | 6661 98% | 6521 100% | 13671 48% | 6896 94% | 6418 101% |
| Color Space (Percent of AdobeRGB 1998) (%) | 35 | 34.6 -1% | 35 0% | 38.46 10% | 40 14% | 55 57% |
| Color Space (Percent of sRGB) (%) | 55 | 54.2 -1% | 55 0% | 60.61 10% | 64 16% | 85 55% |
| Total Average (Program / Settings) | 5% /
-4% | 3% /
0% | -17% /
-42% | 9% /
4% | 38% /
27% |
* ... smaller is better
Screen Flickering / PWM (Pulse-Width Modulation)
| Screen flickering / PWM not detected | ||
In comparison: 52 % of all tested devices do not use PWM to dim the display. If PWM was detected, an average of 7748 (minimum: 5 - maximum: 343500) Hz was measured. | ||
Display Response Times
| ↔ Response Time Black to White | ||
|---|---|---|
| 27 ms ... rise ↗ and fall ↘ combined | ↗ 8 ms rise | 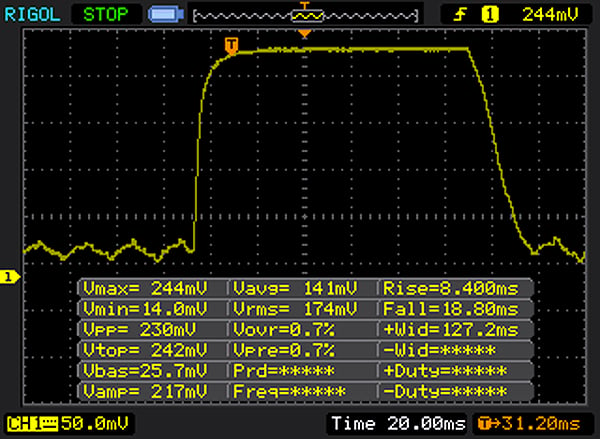 |
| ↘ 19 ms fall | ||
| The screen shows relatively slow response rates in our tests and may be too slow for gamers. In comparison, all tested devices range from 0.1 (minimum) to 240 (maximum) ms. » 67 % of all devices are better. This means that the measured response time is worse than the average of all tested devices (19.8 ms). | ||
| ↔ Response Time 50% Grey to 80% Grey | ||
| 53 ms ... rise ↗ and fall ↘ combined | ↗ 18 ms rise | 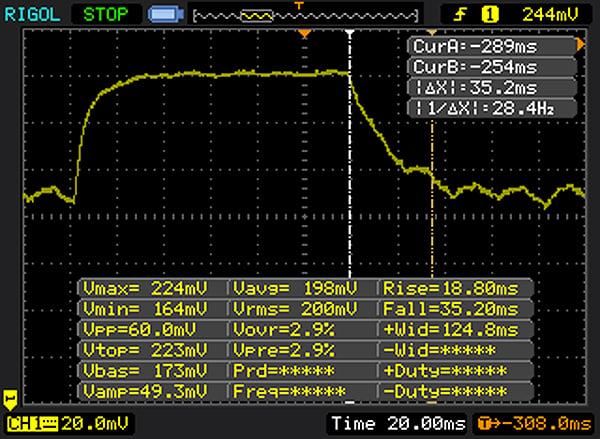 |
| ↘ 35 ms fall | ||
| The screen shows slow response rates in our tests and will be unsatisfactory for gamers. In comparison, all tested devices range from 0.165 (minimum) to 636 (maximum) ms. » 90 % of all devices are better. This means that the measured response time is worse than the average of all tested devices (30.9 ms). | ||
| Cinebench R15 | |
| CPU Single 64Bit | |
| Acer TravelMate X3 X349-M-7261 | |
| HP Pavilion 14-al103ng | |
| Lenovo IdeaPad 510S-14ISK | |
| HP Pavilion 14-al003ng | |
| Dell Latitude 14 3470 | |
| Medion Akoya S4219 | |
| CPU Multi 64Bit | |
| HP Pavilion 14-al103ng | |
| Acer TravelMate X3 X349-M-7261 | |
| Lenovo IdeaPad 510S-14ISK | |
| HP Pavilion 14-al003ng | |
| Dell Latitude 14 3470 | |
| Medion Akoya S4219 | |
| Cinebench R10 | |
| Rendering Multiple CPUs 32Bit | |
| HP Pavilion 14-al103ng | |
| Acer TravelMate X3 X349-M-7261 | |
| Lenovo IdeaPad 510S-14ISK | |
| Medion Akoya S4219 | |
| Rendering Single 32Bit | |
| HP Pavilion 14-al103ng | |
| Acer TravelMate X3 X349-M-7261 | |
| Lenovo IdeaPad 510S-14ISK | |
| Medion Akoya S4219 | |
| Geekbench 3 | |
| 32 Bit Single-Core Score | |
| Acer TravelMate X3 X349-M-7261 | |
| HP Pavilion 14-al103ng | |
| 32 Bit Multi-Core Score | |
| Acer TravelMate X3 X349-M-7261 | |
| HP Pavilion 14-al103ng | |
| Geekbench 4.0 | |
| 64 Bit Single-Core Score | |
| Acer TravelMate X3 X349-M-7261 | |
| HP Pavilion 14-al103ng | |
| 64 Bit Multi-Core Score | |
| Acer TravelMate X3 X349-M-7261 | |
| HP Pavilion 14-al103ng | |
| JetStream 1.1 - 1.1 Total | |
| HP Pavilion 14-al103ng | |
| Acer TravelMate X3 X349-M-7261 | |
| HP Pavilion 14-al003ng | |
| Lenovo IdeaPad 510S-14ISK | |
| Medion Akoya S4219 | |
| PCMark 8 Home Score Accelerated v2 | 3040 points | |
Help | ||
| PCMark 8 - Home Score Accelerated v2 | |
| Lenovo IdeaPad 510S-14ISK | |
| Acer TravelMate X3 X349-M-7261 | |
| HP Pavilion 14-al003ng | |
| Dell Latitude 14 3470 | |
| HP Pavilion 14-al103ng | |
| Medion Akoya S4219 | |

| HP Pavilion 14-al103ng Western Digital Scorpio Blue WD5000LPCX-24C6HT0 | Acer TravelMate X3 X349-M-7261 Liteonit CV3-8D512 | Dell Latitude 14 3470 Toshiba MQ01ACF050 | Lenovo IdeaPad 510S-14ISK Samsung MZYTY256HDHP | Medion Akoya S4219 128 GB eMMC Flash | HP Pavilion 14-al003ng SanDisk Z400s 256 GB M.2 2280 | |
|---|---|---|---|---|---|---|
| CrystalDiskMark 3.0 | 12166% | -3% | 12735% | 1396% | 8742% | |
| Read Seq (MB/s) | 113.3 | 484.1 327% | 108.9 -4% | 510 350% | 151.2 33% | 469.3 314% |
| Write Seq (MB/s) | 110.2 | 449.8 308% | 103.2 -6% | 458.8 316% | 55.7 -49% | 309.1 180% |
| Read 512 (MB/s) | 30.83 | 399.1 1195% | 399.7 1196% | 156.6 408% | ||
| Write 512 (MB/s) | 47.13 | 355.1 653% | 299.3 535% | 46.9 0% | ||
| Read 4k (MB/s) | 0.34 | 33.44 9735% | 0.362 6% | 35.27 10274% | 16.29 4691% | 14 4018% |
| Write 4k (MB/s) | 0.981 | 67.5 6781% | 0.946 -4% | 90.2 9095% | 16.5 1582% | 73.9 7433% |
| Read 4k QD32 (MB/s) | 0.72 | 368.5 51081% | 0.721 0% | 397.7 55136% | 20.62 2764% | 149.5 20664% |
| Write 4k QD32 (MB/s) | 1.026 | 280.6 27249% | 0.901 -12% | 257.3 24978% | 18.86 1738% | 204.6 19842% |
| 3DMark 11 Performance | 1538 points | |
Help | ||
| 3DMark 11 - 1280x720 Performance GPU | |
| HP Pavilion 14-al003ng | |
| Lenovo IdeaPad 510S-14ISK | |
| Acer TravelMate X3 X349-M-7261 | |
| HP Pavilion 14-al103ng | |
| Dell Latitude 14 3470 | |
| Medion Akoya S4219 | |
| low | med. | high | ultra | |
|---|---|---|---|---|
| BioShock Infinite (2013) | 43.5 | 25 | 20.6 | 7.1 |
Noise level
| Idle |
| 31.2 / 31.3 / 31.3 dB(A) |
| Load |
| 32.4 / 34.3 dB(A) |
 | ||
30 dB silent 40 dB(A) audible 50 dB(A) loud |
||
min: | ||
(+) The maximum temperature on the upper side is 37.6 °C / 100 F, compared to the average of 34.3 °C / 94 F, ranging from 21.2 to 62.5 °C for the class Office.
(+) The bottom heats up to a maximum of 36.8 °C / 98 F, compared to the average of 36.8 °C / 98 F
(+) In idle usage, the average temperature for the upper side is 23.1 °C / 74 F, compared to the device average of 29.5 °C / 85 F.
(+) The palmrests and touchpad are reaching skin temperature as a maximum (32.1 °C / 89.8 F) and are therefore not hot.
(-) The average temperature of the palmrest area of similar devices was 27.5 °C / 81.5 F (-4.6 °C / -8.3 F).
HP Pavilion 14-al103ng audio analysis
(±) | speaker loudness is average but good (72 dB)
Bass 100 - 315 Hz
(-) | nearly no bass - on average 29.2% lower than median
(±) | linearity of bass is average (7.9% delta to prev. frequency)
Mids 400 - 2000 Hz
(+) | balanced mids - only 2.1% away from median
(+) | mids are linear (6.2% delta to prev. frequency)
Highs 2 - 16 kHz
(±) | higher highs - on average 5.3% higher than median
(±) | linearity of highs is average (7.9% delta to prev. frequency)
Overall 100 - 16.000 Hz
(±) | linearity of overall sound is average (24.5% difference to median)
Compared to same class
» 71% of all tested devices in this class were better, 8% similar, 21% worse
» The best had a delta of 7%, average was 21%, worst was 53%
Compared to all devices tested
» 74% of all tested devices were better, 6% similar, 20% worse
» The best had a delta of 4%, average was 23%, worst was 134%
Apple MacBook 12 (Early 2016) 1.1 GHz audio analysis
(+) | speakers can play relatively loud (83.6 dB)
Bass 100 - 315 Hz
(±) | reduced bass - on average 11.3% lower than median
(±) | linearity of bass is average (14.2% delta to prev. frequency)
Mids 400 - 2000 Hz
(+) | balanced mids - only 2.4% away from median
(+) | mids are linear (5.5% delta to prev. frequency)
Highs 2 - 16 kHz
(+) | balanced highs - only 2% away from median
(+) | highs are linear (4.5% delta to prev. frequency)
Overall 100 - 16.000 Hz
(+) | overall sound is linear (10.2% difference to median)
Compared to same class
» 7% of all tested devices in this class were better, 2% similar, 90% worse
» The best had a delta of 5%, average was 18%, worst was 53%
Compared to all devices tested
» 5% of all tested devices were better, 1% similar, 94% worse
» The best had a delta of 4%, average was 23%, worst was 134%
| Off / Standby | |
| Idle | |
| Load |
|
Key:
min: | |
| Battery Runtime - WiFi Websurfing | |
| Acer TravelMate X3 X349-M-7261 | |
| Lenovo IdeaPad 510S-14ISK | |
| HP Pavilion 14-al103ng | |
| HP Pavilion 14-al003ng | |
| Medion Akoya S4219 | |
| Dell Latitude 14 3470 | |
Pros
Cons

Pavilion与Skylake model的不同,仅仅存在于处理器和硬盘驱动器方面。惠普的14英寸机型配备了Kaby Lake一代的Core i5处理器,它可以满足大多数用户的需求。当BIOS中风扇选项始终禁用时,笔记本电脑运行安静。 此外,它几乎不发烫。笔记本电脑内部有一个500GB的硬盘驱动器。替换为固态硬盘时,需要打开外壳。 惠普的Pavilion在这方面不是特别方便。
正在寻找一个安静的14英寸的、拥有一个强大处理器的设备,以此作为家庭使用的用户,将会对Pavilion感到满意。
我们不能提供更多的购买理由。惠普对所有组件进行了过度削减。虽然,搭载的是视角稳定的IPS屏幕,但是它亮度过低而且表面反光。14英寸的笔记本电脑是为移动使用而制造的。但是,Pavilion的电池续航能力不支持这一点。除此之外,惠普仅安装快速以太网端口。千兆以太网是当前的标准。该笔记本电脑内部还有一个慢速Wi-Fi模块。在接近600欧元(〜635美元)的价位,买家可以预期获得一个搭载固态硬盘而不是机械硬盘的设备。最后一点,HP仅提供一年保修。
注:本文是基于完整评测的缩减版本,阅读完整的英文评测,请点击这里。
HP Pavilion 14-al103ng
- 12/30/2016 v6 (old)
Sascha Mölck