三星Galaxy Tab S5e (Wi-Fi)平板电脑评测


| |||||||||||||||||||||||||
Brightness Distribution: 90 %
Center on Battery: 452 cd/m²
Contrast: ∞:1 (Black: 0 cd/m²)
ΔE ColorChecker Calman: 1.7 | ∀{0.5-29.43 Ø4.72}
ΔE Greyscale Calman: 2.4 | ∀{0.09-98 Ø4.97}
97.5% sRGB (Calman 2D)
Gamma: 2.07
CCT: 6337 K
| Samsung Galaxy Tab S5e SM-T720 Super AMOLED, 2560x1600, 10.5" | Amazon Fire HD 10 2017 IPS, 1920x1200, 10.1" | Apple iPad Air 3 2019 IPS, 2224x1668, 10.5" | Huawei MediaPad M5 10.8 IPS, 2560x1600, 10.8" | Lenovo Tab P10 IPS, 1920x1200, 10.1" | Samsung Galaxy Tab S4 Super AMOLED, 2560x1600, 10.5" | |
|---|---|---|---|---|---|---|
| Screen | -69% | -2% | -34% | -131% | -14% | |
| Brightness middle (cd/m²) | 452 | 426 -6% | 515 14% | 382 -15% | 522 15% | 474 5% |
| Brightness (cd/m²) | 453 | 399 -12% | 483 7% | 378 -17% | 495 9% | 477 5% |
| Brightness Distribution (%) | 90 | 91 1% | 90 0% | 92 2% | 84 -7% | 91 1% |
| Black Level * (cd/m²) | 0.38 | 0.41 | 0.24 | 0.41 | ||
| Colorchecker dE 2000 * | 1.7 | 4.5 -165% | 1.6 6% | 2.8 -65% | 6.7 -294% | 2.5 -47% |
| Colorchecker dE 2000 max. * | 3.7 | 7.9 -114% | 4.4 -19% | 6 -62% | 12.2 -230% | 5.8 -57% |
| Greyscale dE 2000 * | 2.4 | 5.2 -117% | 2.8 -17% | 3.5 -46% | 9.1 -279% | 2.1 12% |
| Gamma | 2.07 106% | 2.23 99% | 2.21 100% | 2.33 94% | 2.14 103% | 2.08 106% |
| CCT | 6337 103% | 6875 95% | 6944 94% | 6903 94% | 9417 69% | 6281 103% |
| Contrast (:1) | 1121 | 1256 | 1592 | 1273 |
* ... smaller is better
Screen Flickering / PWM (Pulse-Width Modulation)
| Screen flickering / PWM detected | 245.1 Hz | ≤ 99 % brightness setting | 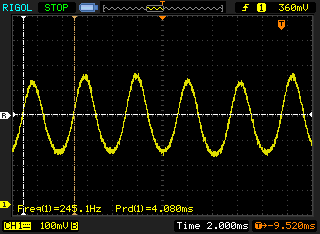 |
The display backlight flickers at 245.1 Hz (worst case, e.g., utilizing PWM) Flickering detected at a brightness setting of 99 % and below. There should be no flickering or PWM above this brightness setting. The frequency of 245.1 Hz is relatively low, so sensitive users will likely notice flickering and experience eyestrain at the stated brightness setting and below. In comparison: 52 % of all tested devices do not use PWM to dim the display. If PWM was detected, an average of 7781 (minimum: 5 - maximum: 343500) Hz was measured. | |||
Display Response Times
| ↔ Response Time Black to White | ||
|---|---|---|
| 4 ms ... rise ↗ and fall ↘ combined | ↗ 2 ms rise | 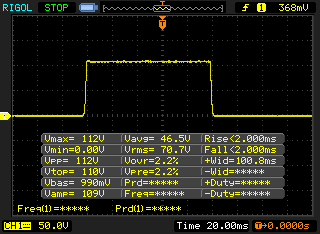 |
| ↘ 2 ms fall | ||
| The screen shows very fast response rates in our tests and should be very well suited for fast-paced gaming. In comparison, all tested devices range from 0.1 (minimum) to 240 (maximum) ms. » 16 % of all devices are better. This means that the measured response time is better than the average of all tested devices (19.8 ms). | ||
| ↔ Response Time 50% Grey to 80% Grey | ||
| 5.6 ms ... rise ↗ and fall ↘ combined | ↗ 2.8 ms rise | 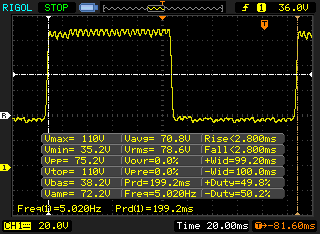 |
| ↘ 2.8 ms fall | ||
| The screen shows very fast response rates in our tests and should be very well suited for fast-paced gaming. In comparison, all tested devices range from 0.165 (minimum) to 636 (maximum) ms. » 18 % of all devices are better. This means that the measured response time is better than the average of all tested devices (31 ms). | ||
| Basemark GPU 1.1 | |
| 1920x1080 Vulkan Medium Offscreen | |
| Samsung Galaxy Tab S4 | |
| Average Qualcomm Snapdragon 670 (12 - 12.5, n=2) | |
| Samsung Galaxy Tab S5e SM-T720 | |
| Vulkan Medium Native | |
| Samsung Galaxy Tab S4 | |
| Average Qualcomm Snapdragon 670 (7.67 - 11.6, n=2) | |
| Samsung Galaxy Tab S5e SM-T720 | |
| 1920x1080 OpenGL Medium Offscreen | |
| Samsung Galaxy Tab S4 | |
| Average Qualcomm Snapdragon 670 (13.1 - 13.8, n=2) | |
| Samsung Galaxy Tab S5e SM-T720 | |
| VRMark - Amber Room | |
| Samsung Galaxy Tab S4 | |
| Average Qualcomm Snapdragon 670 (1423 - 1473, n=2) | |
| Samsung Galaxy Tab S5e SM-T720 | |
| Basemark ES 3.1 / Metal - offscreen Overall Score | |
| Average of class Tablet (255 - 5784, n=7, last 2 years) | |
| Apple iPad Air 3 2019 | |
| Average Qualcomm Snapdragon 670 (444 - 447, n=2) | |
| Samsung Galaxy Tab S5e SM-T720 | |
| Jetstream 2 - 2.0 Total | |
| Average of class Tablet (35.8 - 395, n=57, last 2 years) | |
| Apple iPad Air 3 2019 (Safari Mobile 12) | |
| Samsung Galaxy Tab S5e SM-T720 (Chrome 74.0.3729.136) | |
| Average Qualcomm Snapdragon 670 (32.1 - 33.6, n=4) | |
| WebXPRT 3 - Overall | |
| Average of class Tablet (108 - 480, n=10, last 2 years) | |
| Apple iPad Air 3 2019 (Safari Mobile 12) | |
| Samsung Galaxy Tab S4 (Samsung Browser 8.0) | |
| Samsung Galaxy Tab S5e SM-T720 (Chrome 74.0.3729.136) | |
| Average Qualcomm Snapdragon 670 (53 - 66, n=3) | |
| Speedometer 2.0 - Result 2.0 | |
| Average of class Tablet (2.59 - 790, n=37, last 2 years) | |
| Apple iPad Air 3 2019 (Safari Mobile 12) | |
| Samsung Galaxy Tab S5e SM-T720 (Chrome 74.0.3729.136) | |
| Average Qualcomm Snapdragon 670 (29.6 - 33.7, n=3) | |
| Octane V2 - Total Score | |
| Average of class Tablet (763 - 138481, n=72, last 2 years) | |
| Apple iPad Air 3 2019 (Safari Mobile 12) | |
| Samsung Galaxy Tab S4 (Samsung Browser 8.0) | |
| Samsung Galaxy Tab S5e SM-T720 (Chrome 74.0.3729.136) | |
| Average Qualcomm Snapdragon 670 (10245 - 11312, n=4) | |
| Amazon Fire HD 10 2017 (Amazon Silk 61.2) | |
| Huawei MediaPad M5 10.8 (Chrome 65) | |
| Lenovo Tab P10 (Chrome 71) | |
| Mozilla Kraken 1.1 - Total | |
| Lenovo Tab P10 (Chrome 71) | |
| Huawei MediaPad M5 10.8 (Chrome 65) | |
| Amazon Fire HD 10 2017 (Amazon Silk 61.2) | |
| Average Qualcomm Snapdragon 670 (3361 - 3655, n=4) | |
| Samsung Galaxy Tab S5e SM-T720 (Chrome 74.0.3729.136) | |
| Samsung Galaxy Tab S4 (Samsung Browser 8.0) | |
| Average of class Tablet (243 - 27101, n=66, last 2 years) | |
| Apple iPad Air 3 2019 (Safari Mobile 12) | |
* ... smaller is better
| Samsung Galaxy Tab S5e SM-T720 | Amazon Fire HD 10 2017 | Huawei MediaPad M5 10.8 | Lenovo Tab P10 | Samsung Galaxy Tab S4 | Average 64 GB eMMC Flash | Average of class Tablet | |
|---|---|---|---|---|---|---|---|
| AndroBench 3-5 | -38% | 29% | -7% | 44% | 7% | 780% | |
| Sequential Read 256KB (MB/s) | 294.4 | 262.2 -11% | 247.8 -16% | 276.7 -6% | 741 152% | 278 ? -6% | 2001 ? 580% |
| Sequential Write 256KB (MB/s) | 197.1 | 147.7 -25% | 126.8 -36% | 205.7 4% | 195.8 -1% | 178.6 ? -9% | 1594 ? 709% |
| Random Read 4KB (MB/s) | 79.2 | 27.72 -65% | 54.7 -31% | 53.9 -32% | 142 79% | 60.9 ? -23% | 272 ? 243% |
| Random Write 4KB (MB/s) | 18.79 | 9.37 -50% | 60.8 224% | 15.75 -16% | 24.43 30% | 34.2 ? 82% | 317 ? 1587% |
| Sequential Read 256KB SDCard (MB/s) | 76.1 ? | 55.5 ? -27% | 85.1 ? 12% | 84.3 ? 11% | 80.1 ? 5% | 77.4 ? 2% | |
| Sequential Write 256KB SDCard (MB/s) | 60.8 ? | 30.14 ? -50% | 73.8 ? 21% | 61 ? 0% | 59.1 ? -3% | 58.3 ? -4% |
PUBG Mobile
Dead Trigger 2
Shadow Fight 3
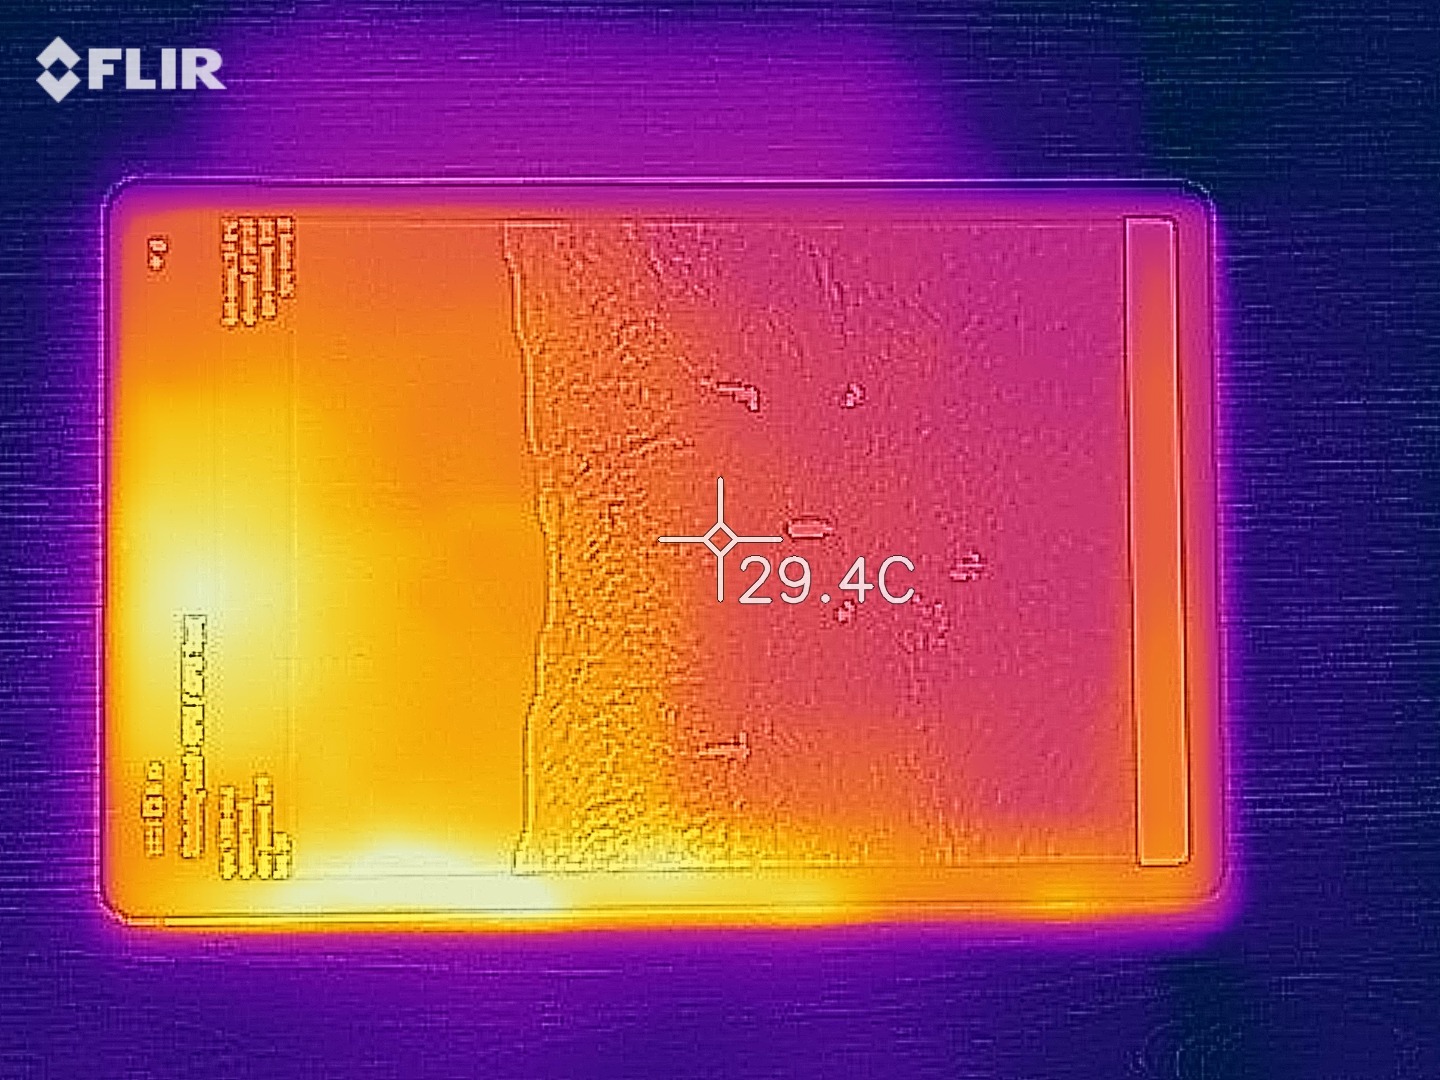
(+) The maximum temperature on the upper side is 33.1 °C / 92 F, compared to the average of 33.6 °C / 92 F, ranging from 20.7 to 53.2 °C for the class Tablet.
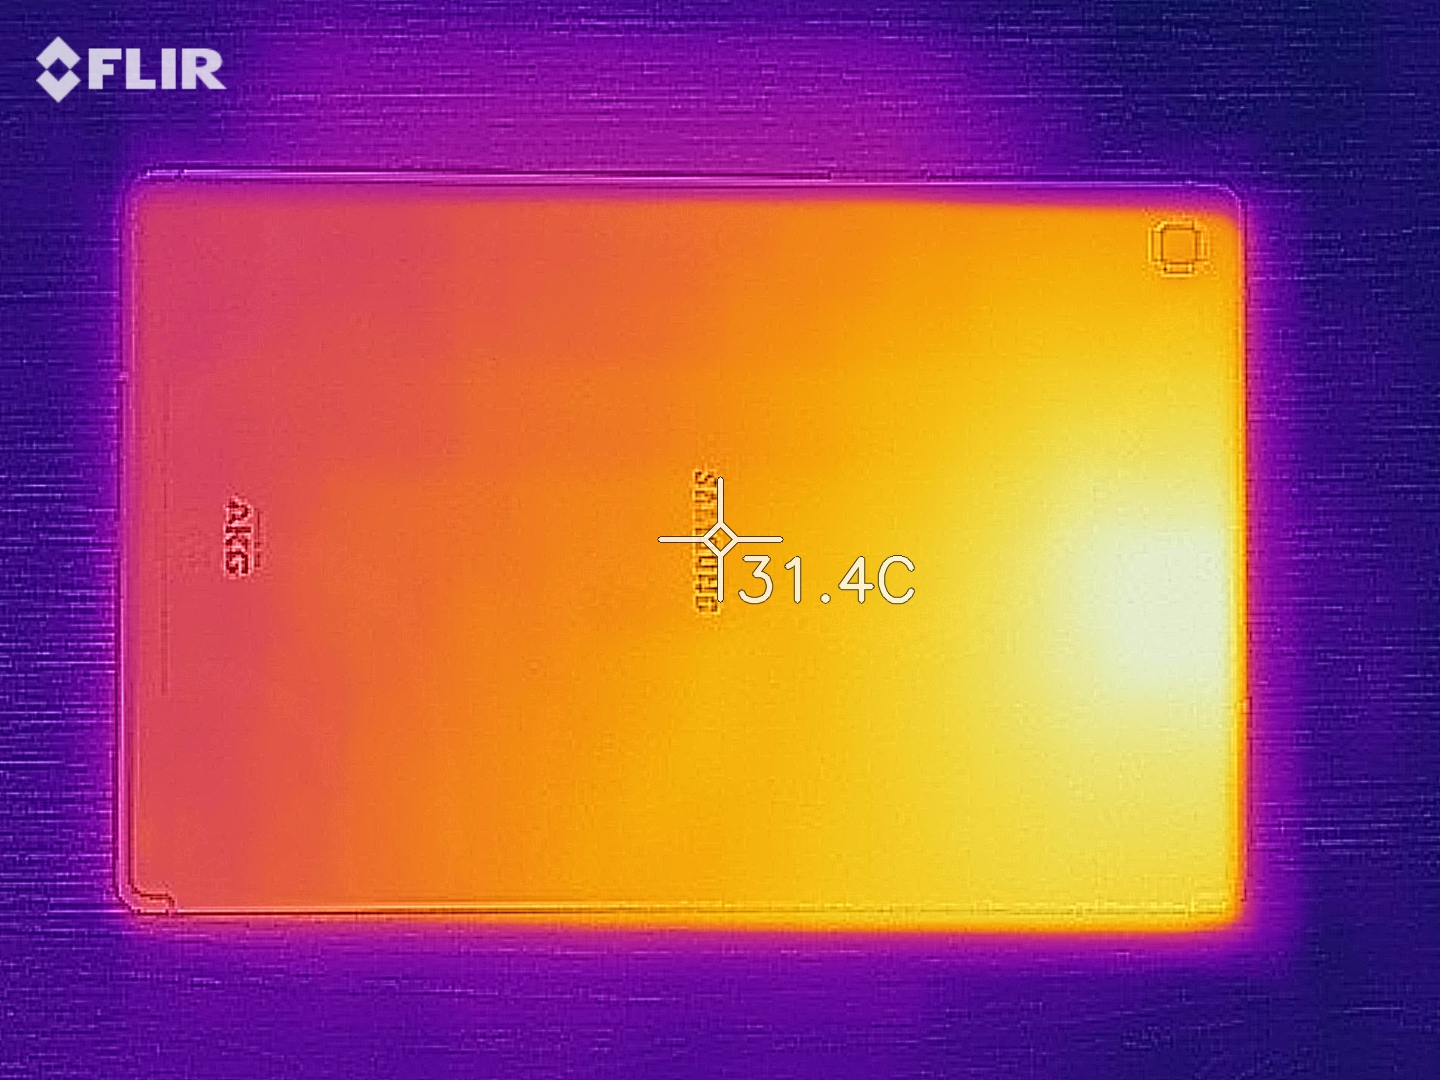
(+) The bottom heats up to a maximum of 31.2 °C / 88 F, compared to the average of 33.2 °C / 92 F
(+) In idle usage, the average temperature for the upper side is 28.8 °C / 84 F, compared to the device average of 30 °C / 86 F.
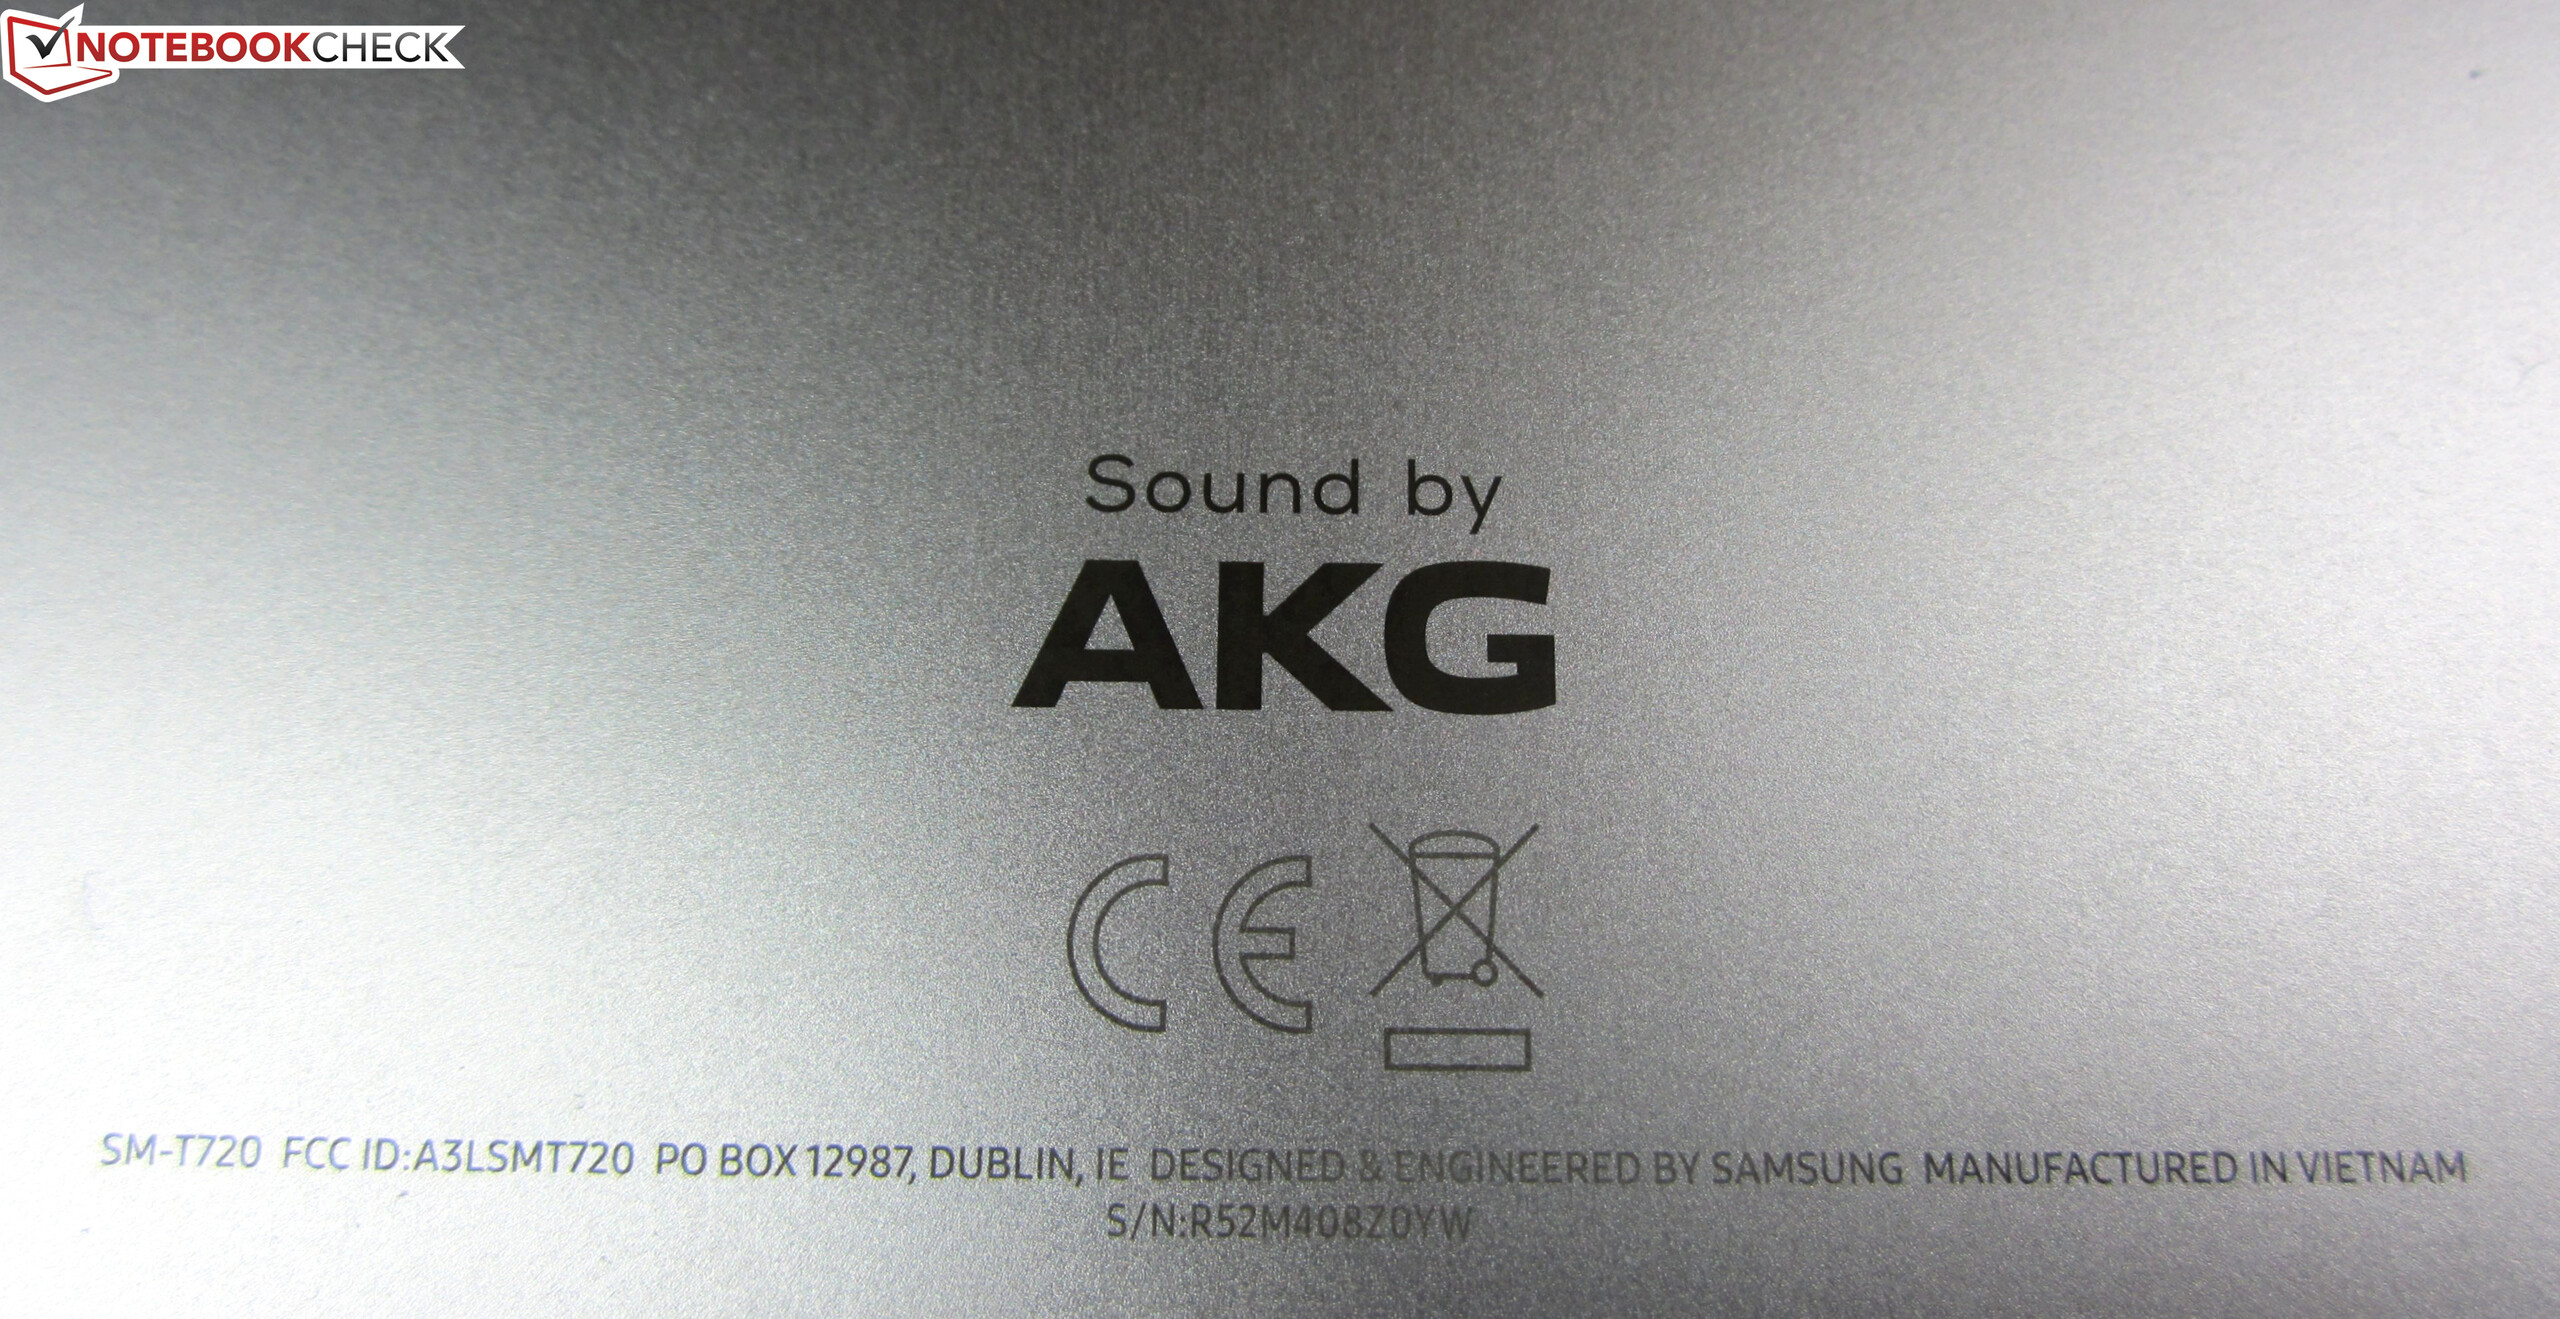
Samsung Galaxy Tab S5e SM-T720 audio analysis
(+) | speakers can play relatively loud (83.3 dB)
Bass 100 - 315 Hz
(±) | reduced bass - on average 14.3% lower than median
(±) | linearity of bass is average (10.4% delta to prev. frequency)
Mids 400 - 2000 Hz
(+) | balanced mids - only 2.8% away from median
(+) | mids are linear (2.8% delta to prev. frequency)
Highs 2 - 16 kHz
(+) | balanced highs - only 1.9% away from median
(+) | highs are linear (3.8% delta to prev. frequency)
Overall 100 - 16.000 Hz
(+) | overall sound is linear (12% difference to median)
Compared to same class
» 15% of all tested devices in this class were better, 5% similar, 80% worse
» The best had a delta of 7%, average was 20%, worst was 129%
Compared to all devices tested
» 9% of all tested devices were better, 2% similar, 88% worse
» The best had a delta of 4%, average was 24%, worst was 134%
Huawei MediaPad M5 10.8 audio analysis
(±) | speaker loudness is average but good (79.9 dB)
Bass 100 - 315 Hz
(±) | reduced bass - on average 11.9% lower than median
(-) | bass is not linear (16.4% delta to prev. frequency)
Mids 400 - 2000 Hz
(+) | balanced mids - only 3.2% away from median
(+) | mids are linear (5.7% delta to prev. frequency)
Highs 2 - 16 kHz
(+) | balanced highs - only 4.6% away from median
(+) | highs are linear (6.9% delta to prev. frequency)
Overall 100 - 16.000 Hz
(±) | linearity of overall sound is average (15.9% difference to median)
Compared to same class
» 35% of all tested devices in this class were better, 6% similar, 59% worse
» The best had a delta of 7%, average was 20%, worst was 129%
Compared to all devices tested
» 25% of all tested devices were better, 5% similar, 70% worse
» The best had a delta of 4%, average was 24%, worst was 134%
| Off / Standby | |
| Idle | |
| Load |
|
Key:
min: | |
| Samsung Galaxy Tab S5e SM-T720 7040 mAh | Amazon Fire HD 10 2017 6300 mAh | Apple iPad Air 3 2019 8134 mAh | Huawei MediaPad M5 10.8 7500 mAh | Lenovo Tab P10 7000 mAh | Samsung Galaxy Tab S4 7300 mAh | |
|---|---|---|---|---|---|---|
| Power Consumption | -26% | -60% | -56% | -3% | -8% | |
| Idle Minimum * (Watt) | 2.07 | 1.55 25% | 2.18 -5% | 2.01 3% | 1.01 51% | 1.76 15% |
| Idle Average * (Watt) | 3.94 | 4.17 -6% | 6.4 -62% | 5.4 -37% | 4.16 -6% | 4.22 -7% |
| Idle Maximum * (Watt) | 3.96 | 4.25 -7% | 6.43 -62% | 5.44 -37% | 4.17 -5% | 4.25 -7% |
| Load Average * (Watt) | 4.07 | 7.13 -75% | 7.48 -84% | 8.55 -110% | 5.45 -34% | 4.52 -11% |
| Load Maximum * (Watt) | 5.73 | 9.63 -68% | 10.65 -86% | 11.53 -101% | 6.9 -20% | 7.35 -28% |
* ... smaller is better
| Samsung Galaxy Tab S5e SM-T720 7040 mAh | Amazon Fire HD 10 2017 6300 mAh | Apple iPad Air 3 2019 8134 mAh | Huawei MediaPad M5 10.8 7500 mAh | Lenovo Tab P10 7000 mAh | Samsung Galaxy Tab S4 7300 mAh | |
|---|---|---|---|---|---|---|
| Battery runtime | -19% | -3% | -11% | 16% | -14% | |
| Reader / Idle (h) | 21.1 | 16 -24% | 25 18% | 22.4 6% | 21.9 4% | 20.5 -3% |
| H.264 (h) | 14.4 | 9.8 -32% | 11.4 -21% | 11.7 -19% | 15.2 6% | 12.3 -15% |
| WiFi v1.3 (h) | 10.4 | 9 -13% | 12.3 18% | 10.8 4% | 16.5 59% | 8.3 -20% |
| Load (h) | 5 | 4.6 -8% | 3.6 -28% | 3.3 -34% | 4.8 -4% | 4.1 -18% |
Pros
Cons
三星Galaxy Tab S5e物超所值,是一款全能的平板电脑。该设备具有明亮且对比度丰富的Super AMOLED 10.5英寸显示屏和流畅的SoC,可以处理最复杂的现代游戏。同样,它的扬声器提供身临其境的游戏体验,而它的电池续航时间可以让您长时间游戏或看电影。
这台平板电脑做工也很好,很轻巧,中端平板电脑并非总是如此。金属设计和窄边框使它看起来比它实际价格更昂贵。此外,包含对DeX的支持和可选的键盘盖使得Tab S5e不仅仅是一个多媒体平板电脑。
虽然有一些弱点,但这些都无关紧要。三星已经为平板电脑配备了普通相机,但省略了NFC这件事令人失望。如果您对PWM敏感,我们还建议您亲自尝试使用Tab S5e,因为屏幕的调光频率可能会在长时间使用时引起眼睛疲劳和头痛。
三星Galaxy Tab S5e是Tab S4和iPad Air(2019)等更昂贵平板电脑的不错的替代品。它实际上提供了大多数人想要的平板电脑所需的一切,但价格更实惠且没有多少妥协。
总的来说,Tab S5e是您目前可以购买的最有性价比的平板电脑之一,而且提供了不错的性能。Tab S4整体上仍然是更好的多媒体平板电脑,因为它具有更强大的SoC,高容量RAM和更快的内部存储。手写笔的包括也提示了Tab S4的地位。
Samsung Galaxy Tab S5e SM-T720
- 08/31/2022 v7 (old)
Manuel Masiero
Price comparison

