英特尔 NUC X15 LAPAC71H 评测:配备英特尔 Arc A730M 的多媒体笔记本电脑,售价 1,050 美元起
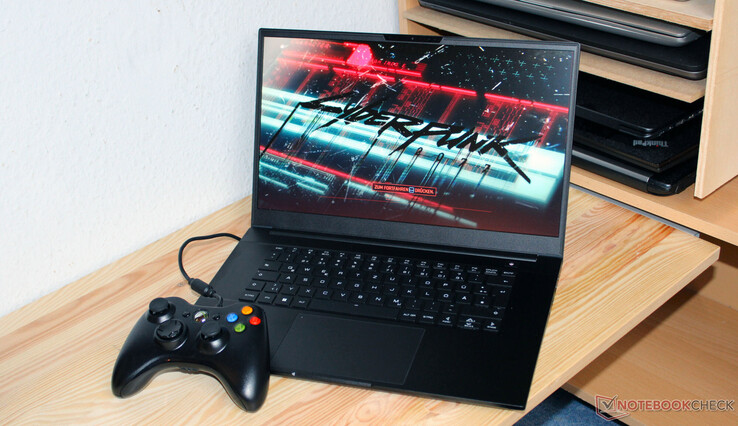
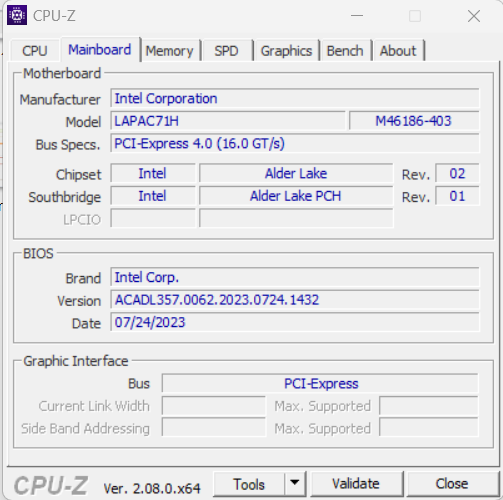
英特尔 NUC X15 是一款面向游戏玩家和创作者的笔记本电脑,在宣布于 2022 年秋季上市后,一年后终于迎来了曙光。这应该主要是一个处理货物的案例:X15 以及整个 NUC 系列已经被英特尔停产。申克分销的笔记本电脑的酷睿 i7-12700H, Arc A730M和 FHD 面板已设定,内存和固态硬盘也可选择。
竞争对手包括Asus TUF A15 FA507,Gigabyte G5 KE,MSI Cyborg 15 A12VF,Dell Inspiron 16 Plus 7630 和Asus VivoBook Pro 16 等设备。
潜在的竞争对手比较
Rating | Date | Model | Weight | Height | Size | Resolution | Price |
|---|---|---|---|---|---|---|---|
| 84.4 % v7 (old) | 10 / 2023 | Intel NUC X15 LAPAC71H i7-12700H, A730M | 2.2 kg | 26.7 mm | 15.60" | 1920x1080 | |
| 86.3 % v7 (old) | 06 / 2023 | Asus TUF A15 FA507 R7 7735HS, GeForce RTX 4050 Laptop GPU | 2.2 kg | 24.9 mm | 15.60" | 1920x1080 | |
| 81.8 % v7 (old) | 04 / 2023 | Gigabyte G5 KE i5-12500H, GeForce RTX 3060 Laptop GPU | 2 kg | 23.9 mm | 15.60" | 1920x1080 | |
| 87.1 % v7 (old) | 08 / 2023 | Dell Inspiron 16 Plus 7630 i7-13700H, GeForce RTX 4060 Laptop GPU | 2.2 kg | 19.95 mm | 16.00" | 2560x1600 | |
| 86.3 % v7 (old) | 05 / 2023 | Asus VivoBook Pro 16 i7-12700H, GeForce RTX 3050 Ti Laptop GPU | 1.9 kg | 20 mm | 16.00" | 2560x1600 | |
| 82.4 % v7 (old) | 04 / 2023 | MSI Cyborg 15 A12VF i7-12650H, GeForce RTX 4060 Laptop GPU | 2 kg | 22.9 mm | 15.60" | 1920x1080 |
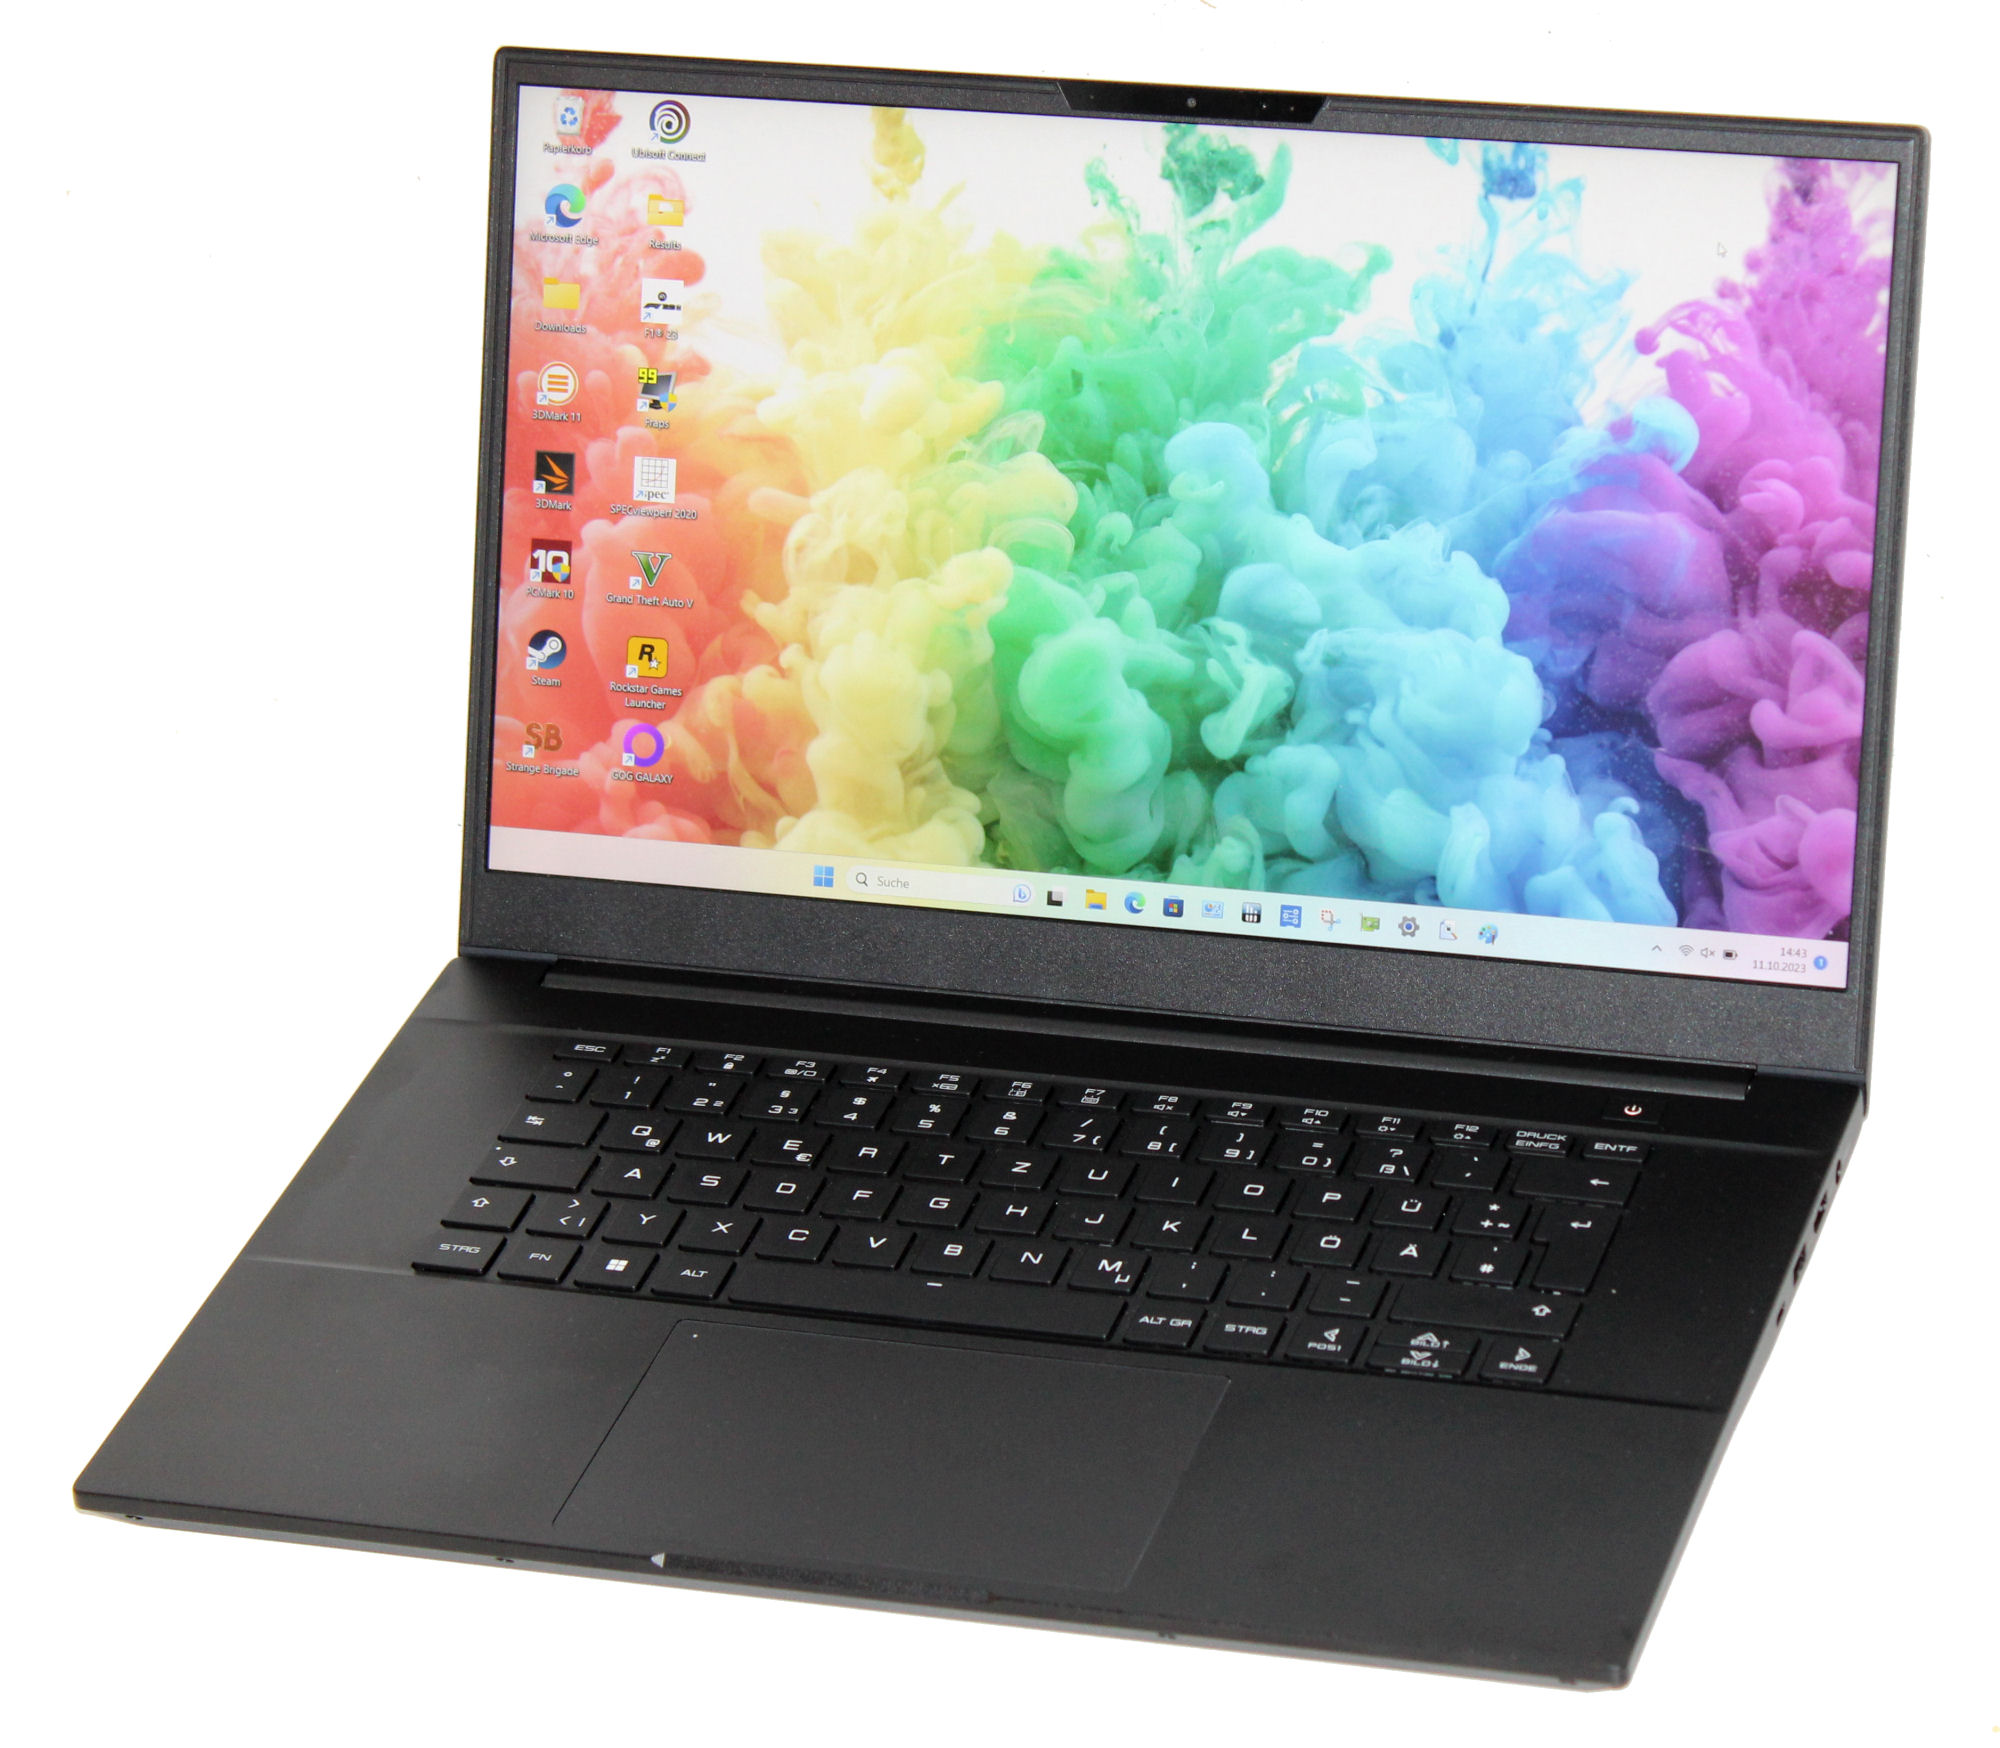
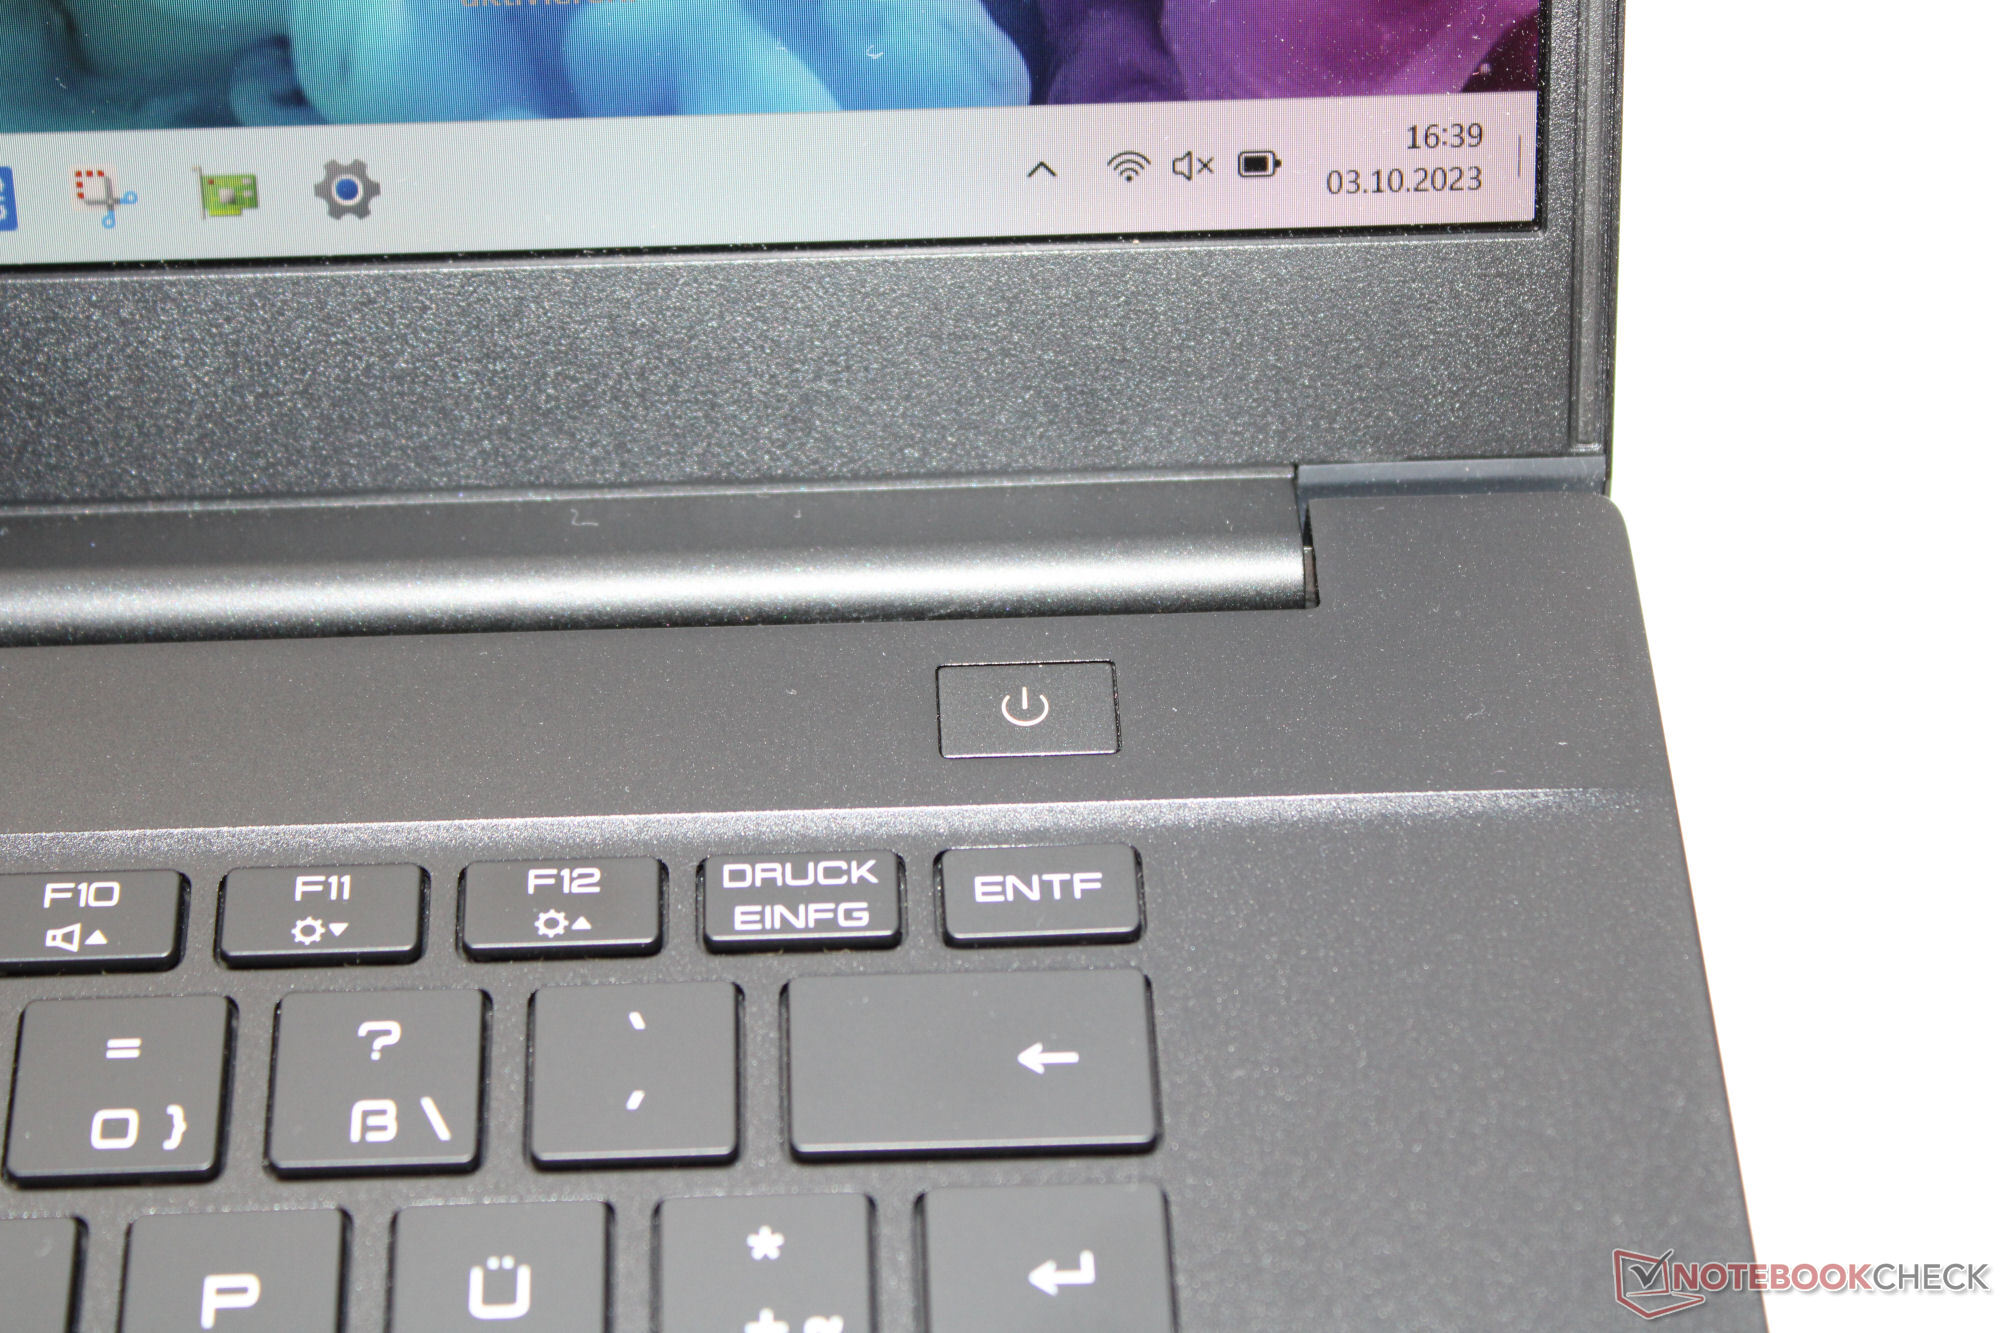
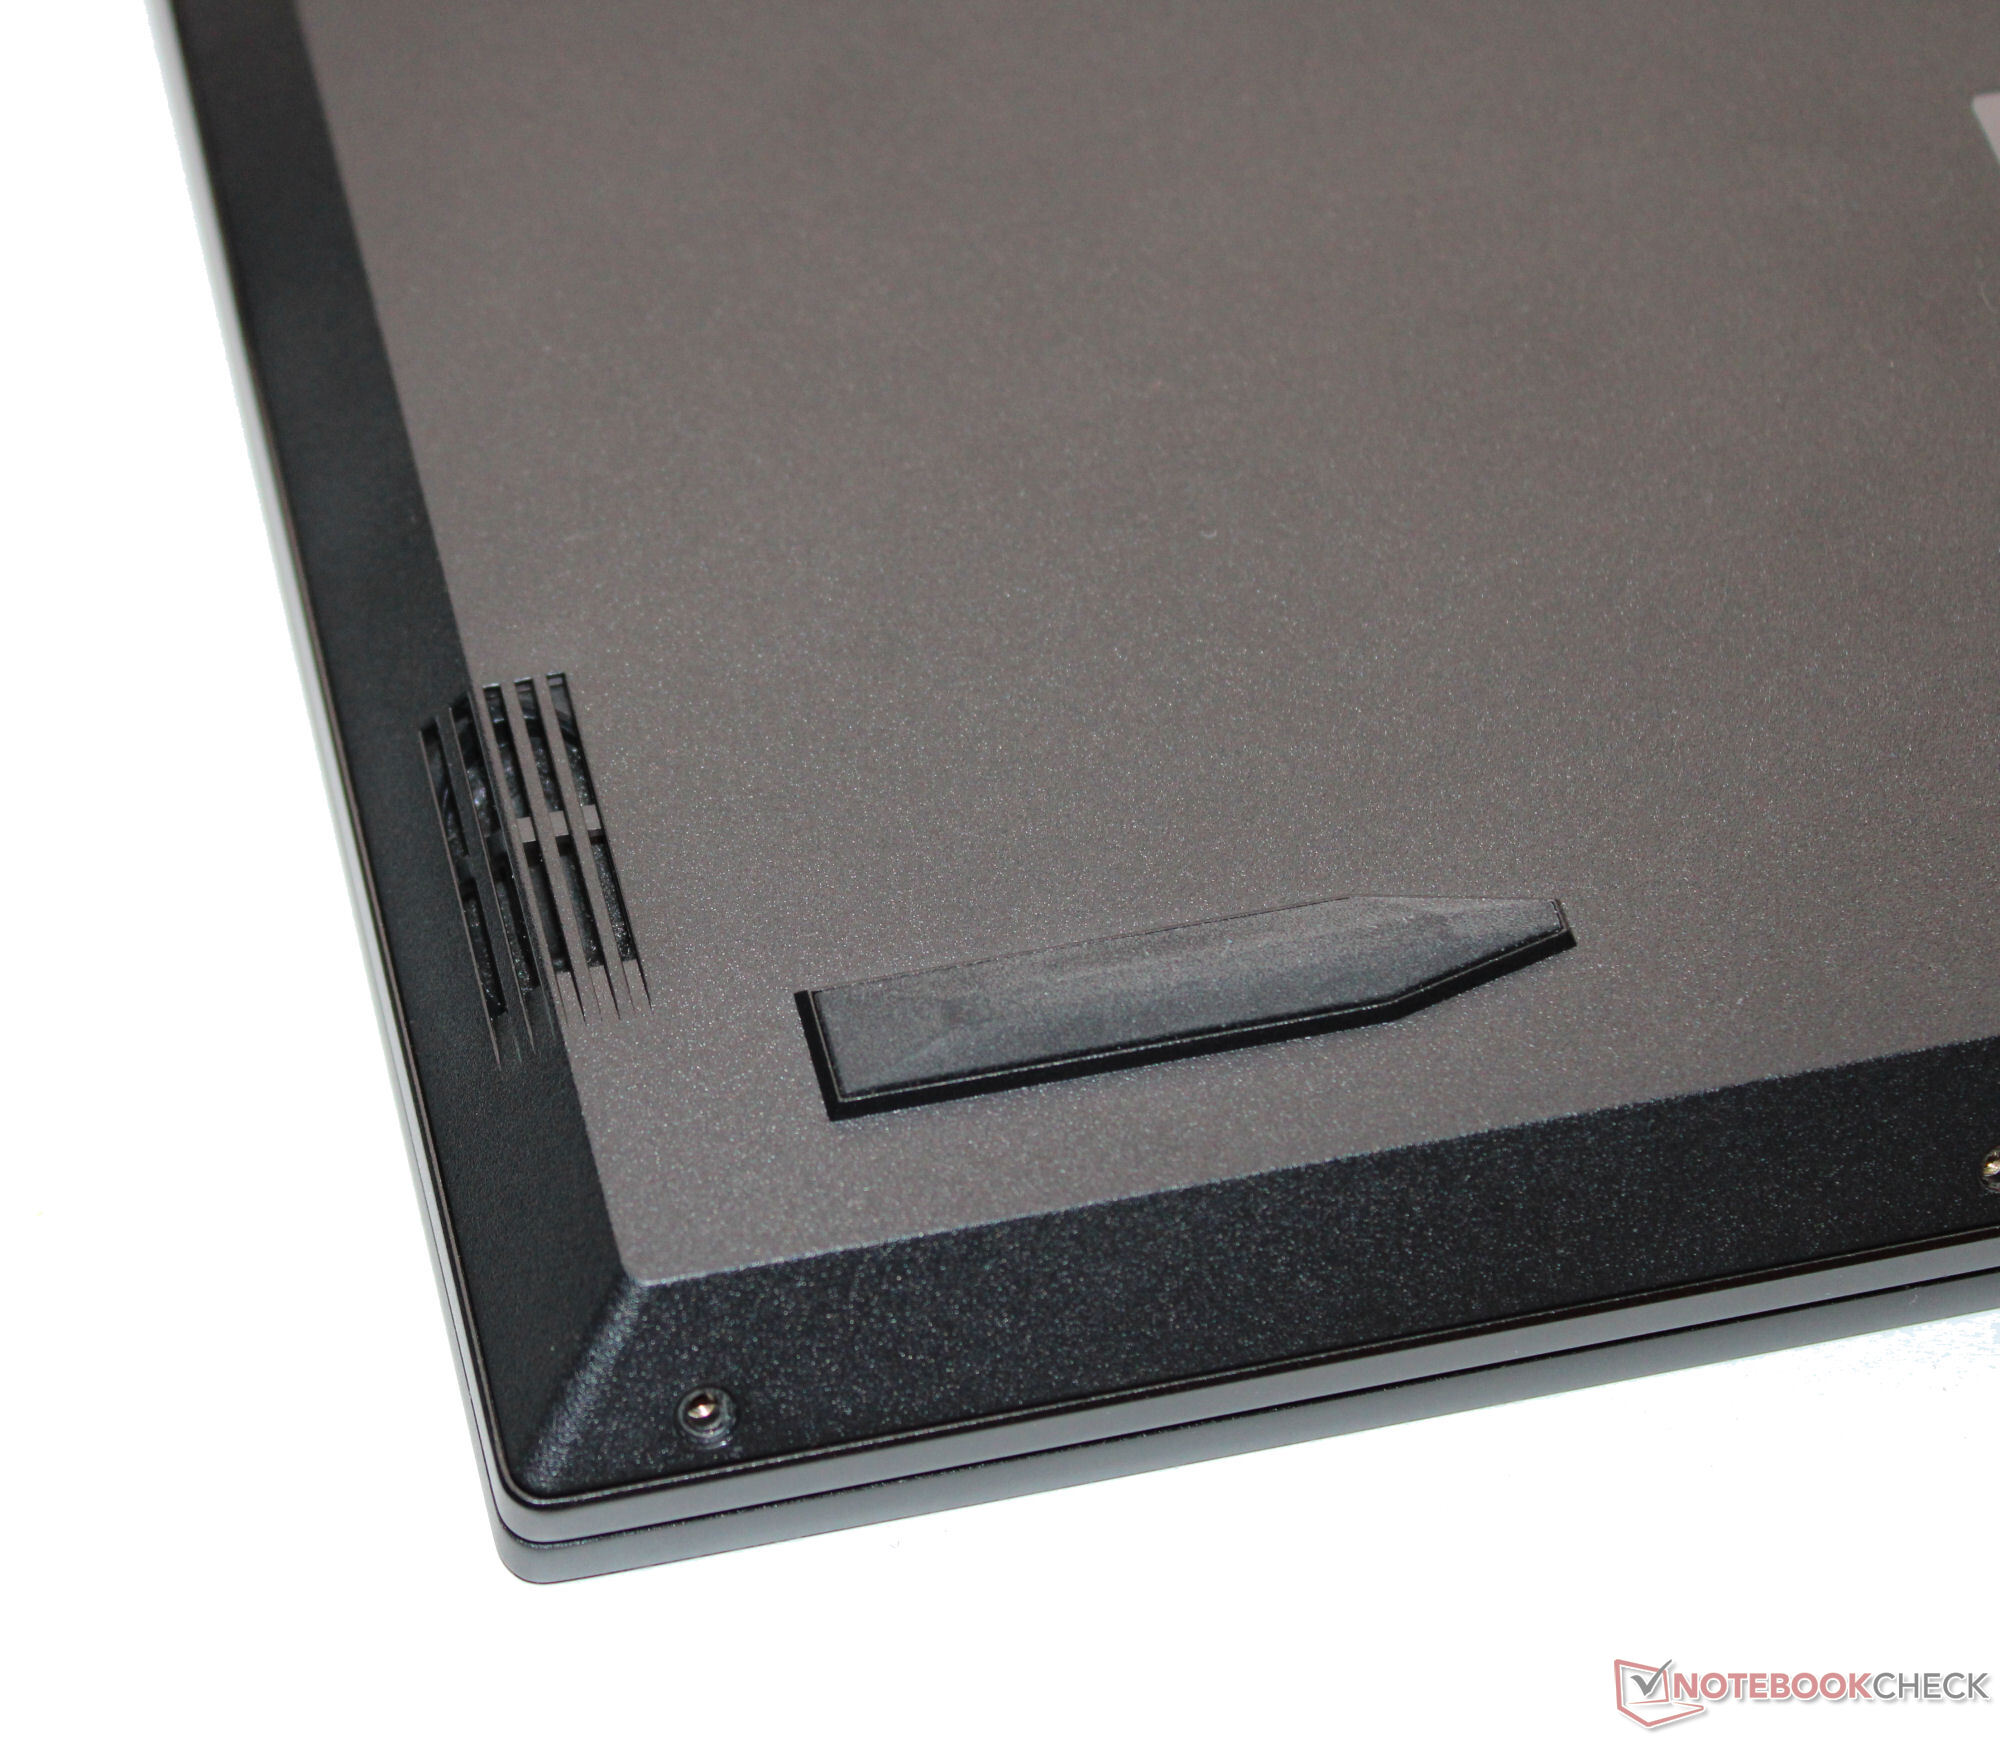
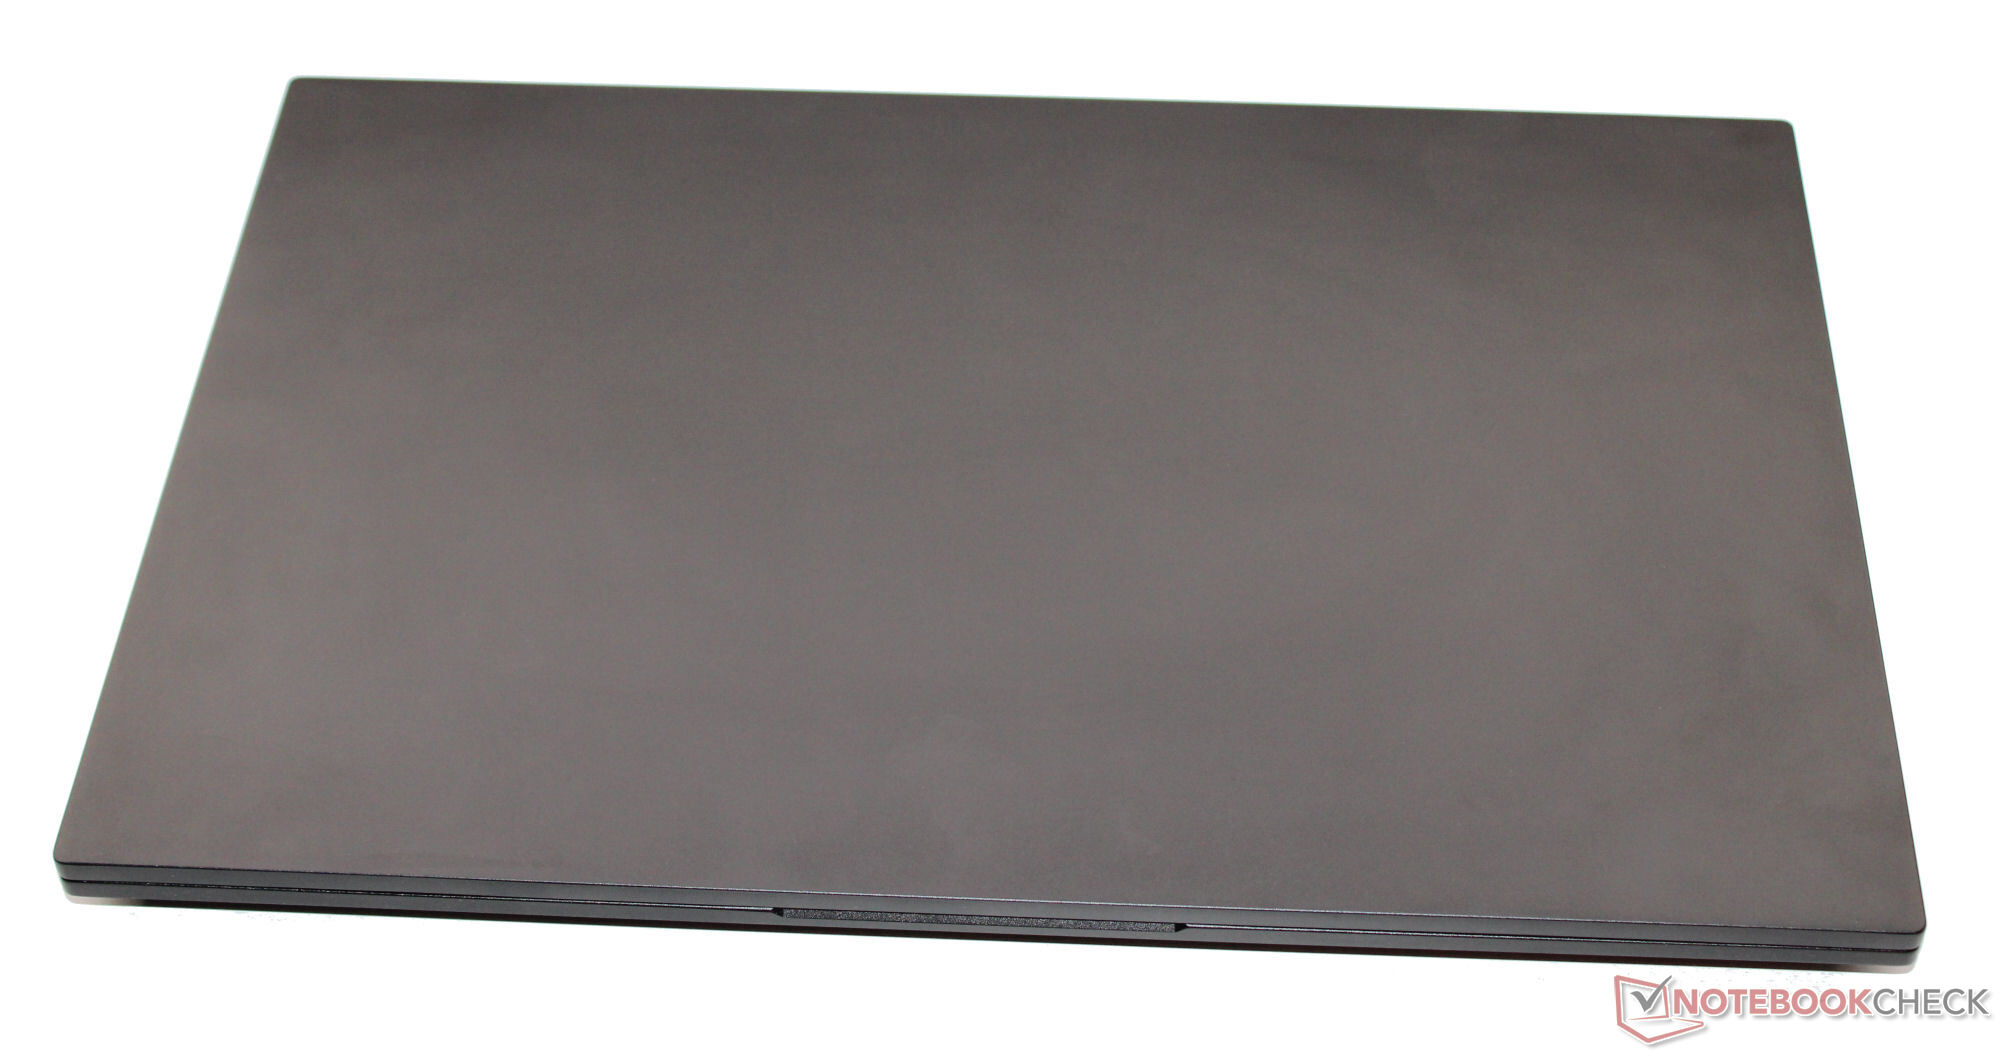
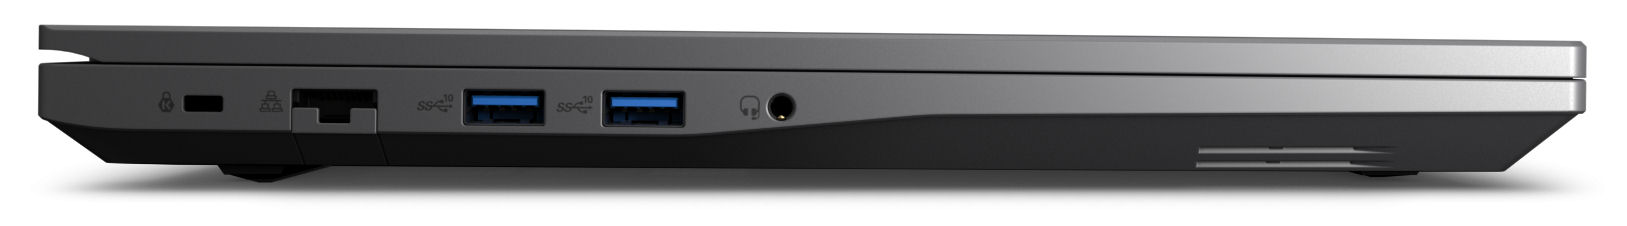
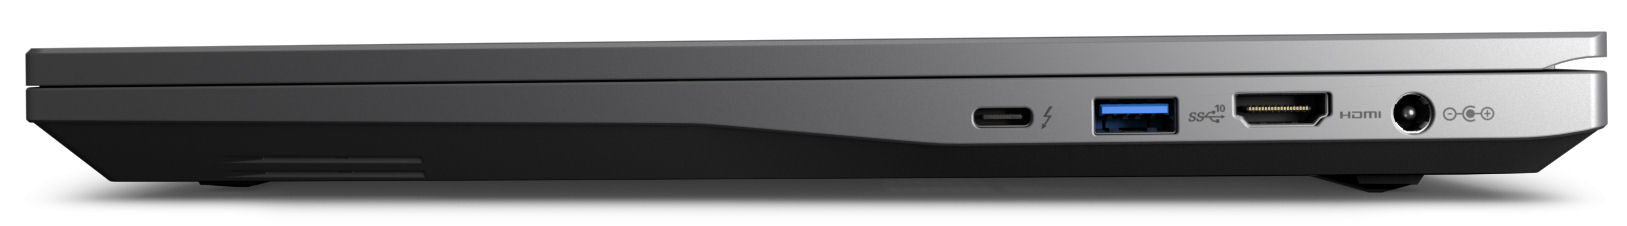
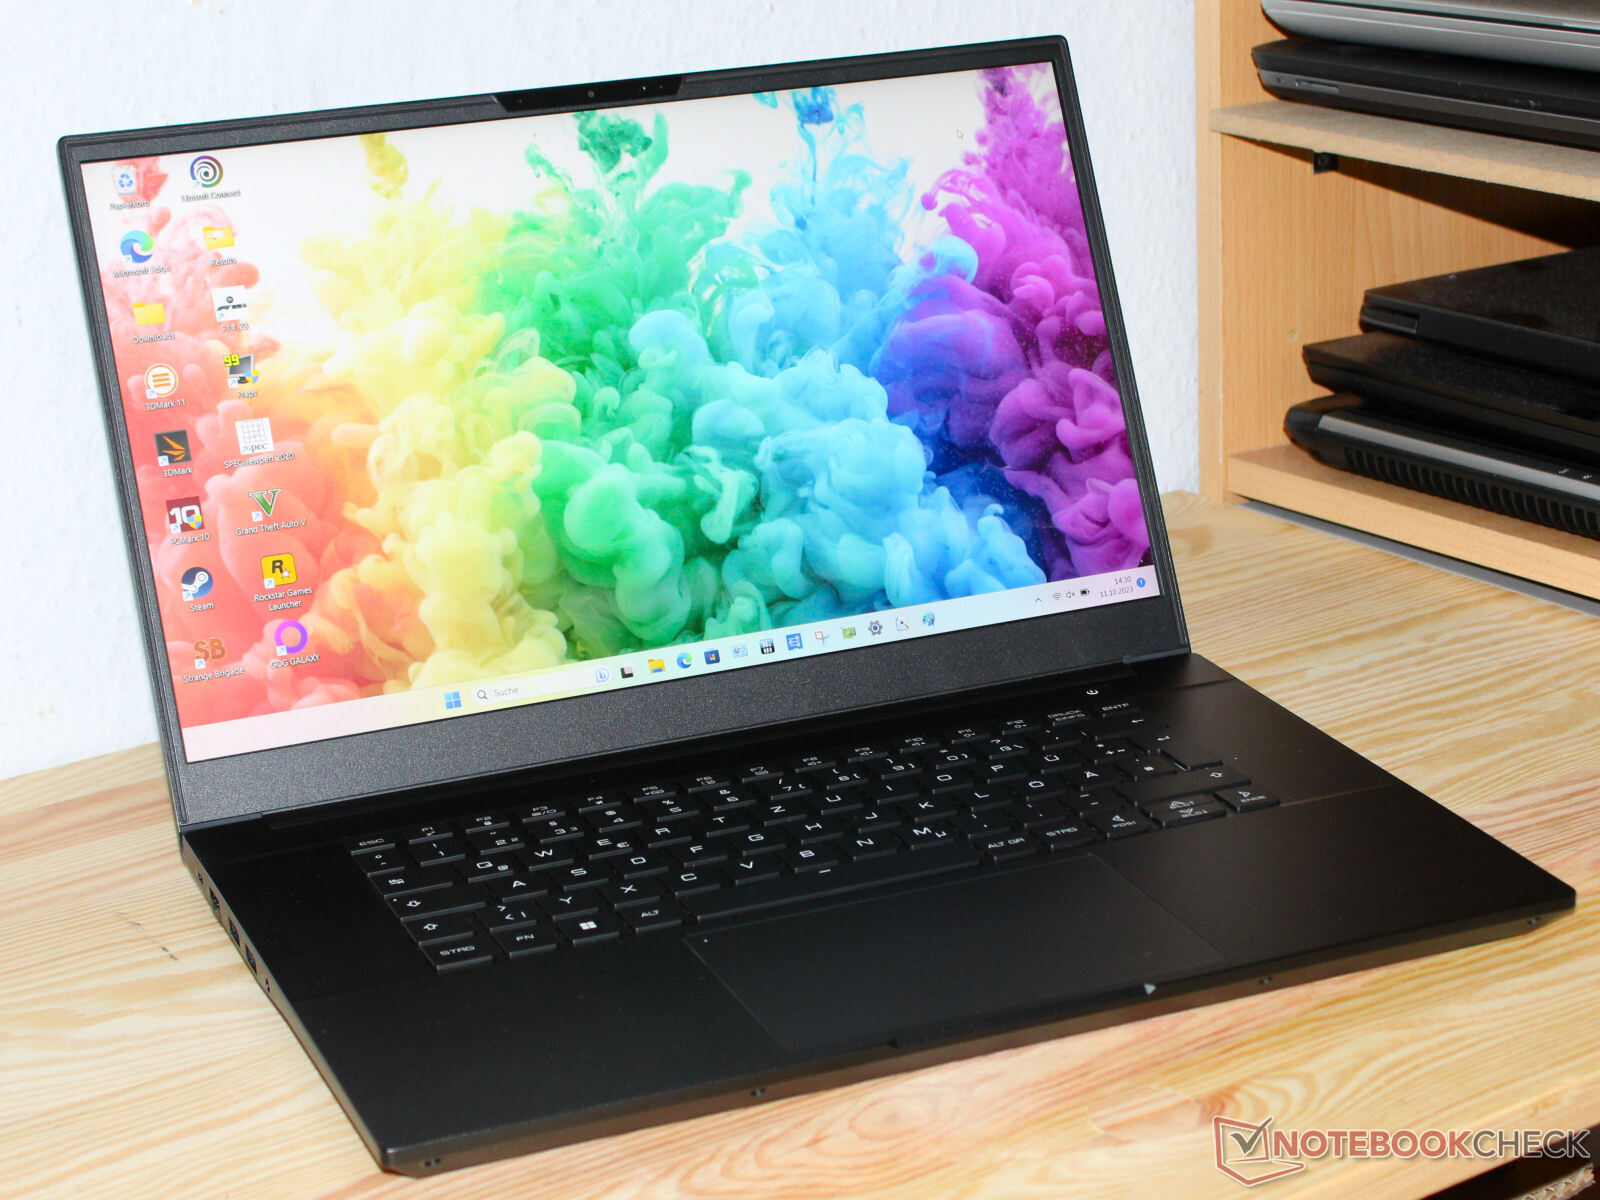
外壳和连接性 - Intel NUC 配备 Thunderbolt 4
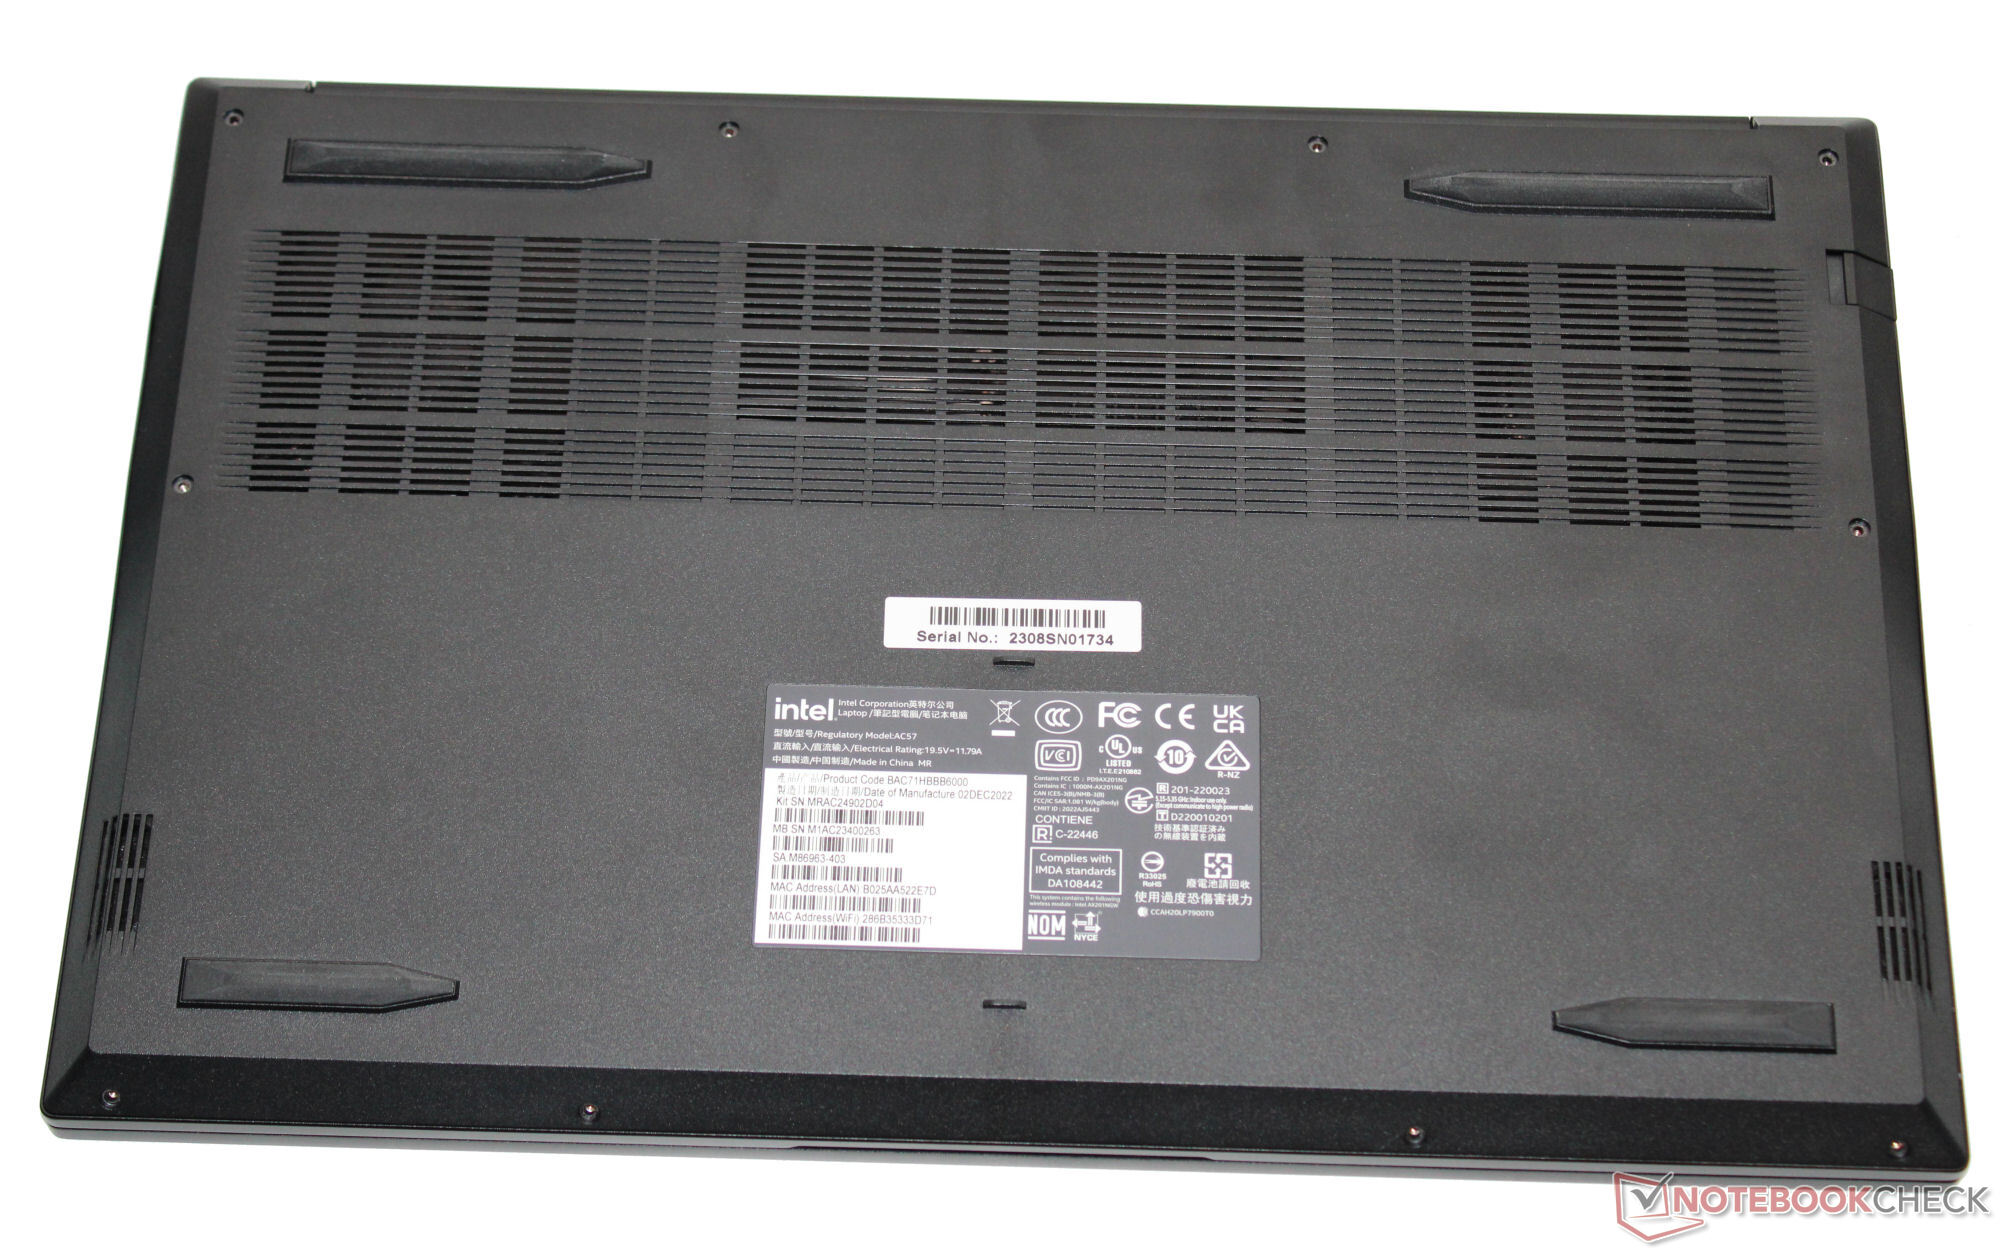
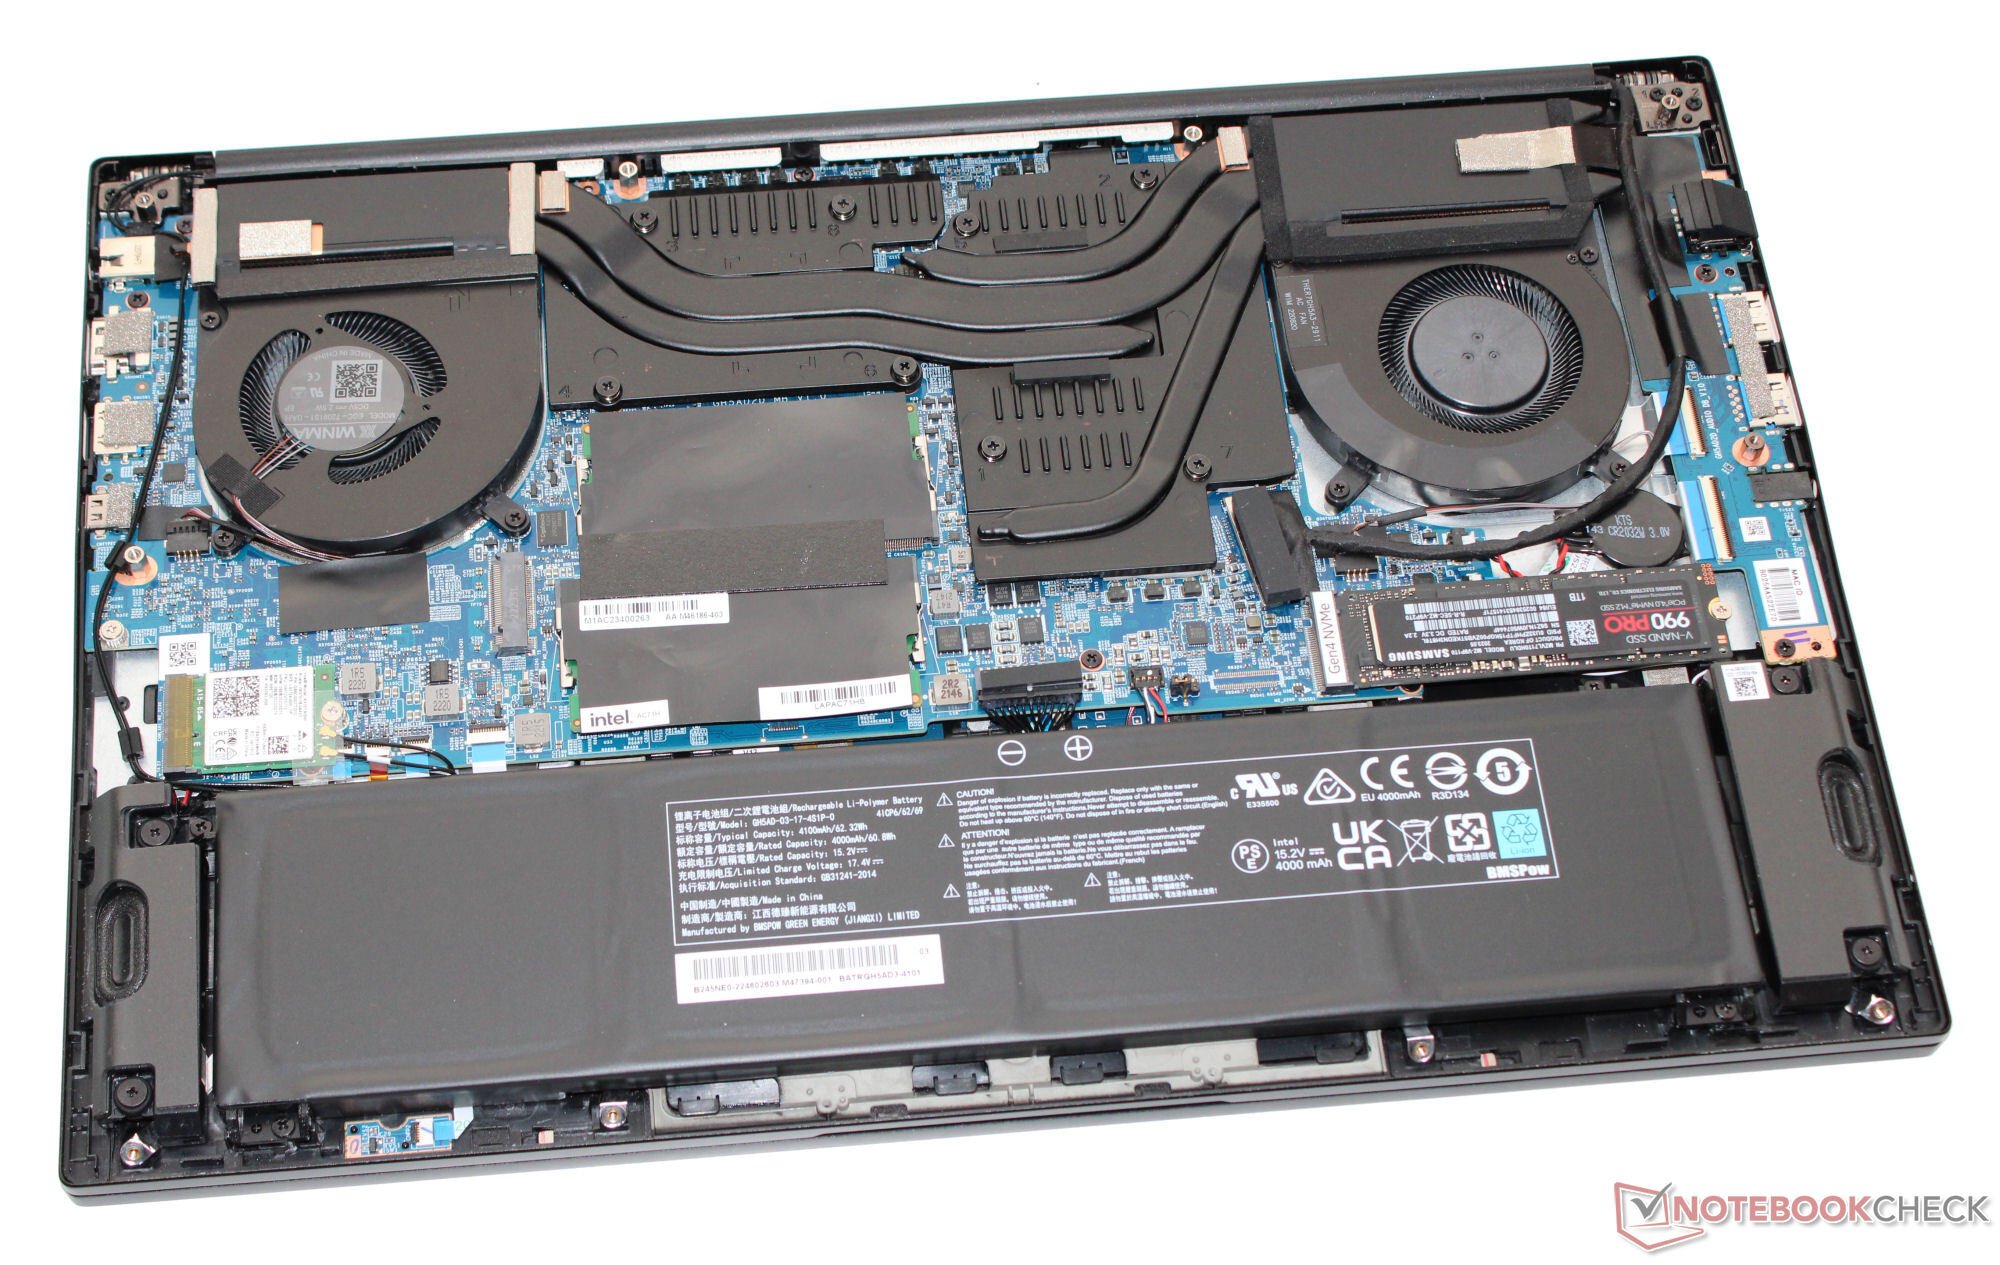
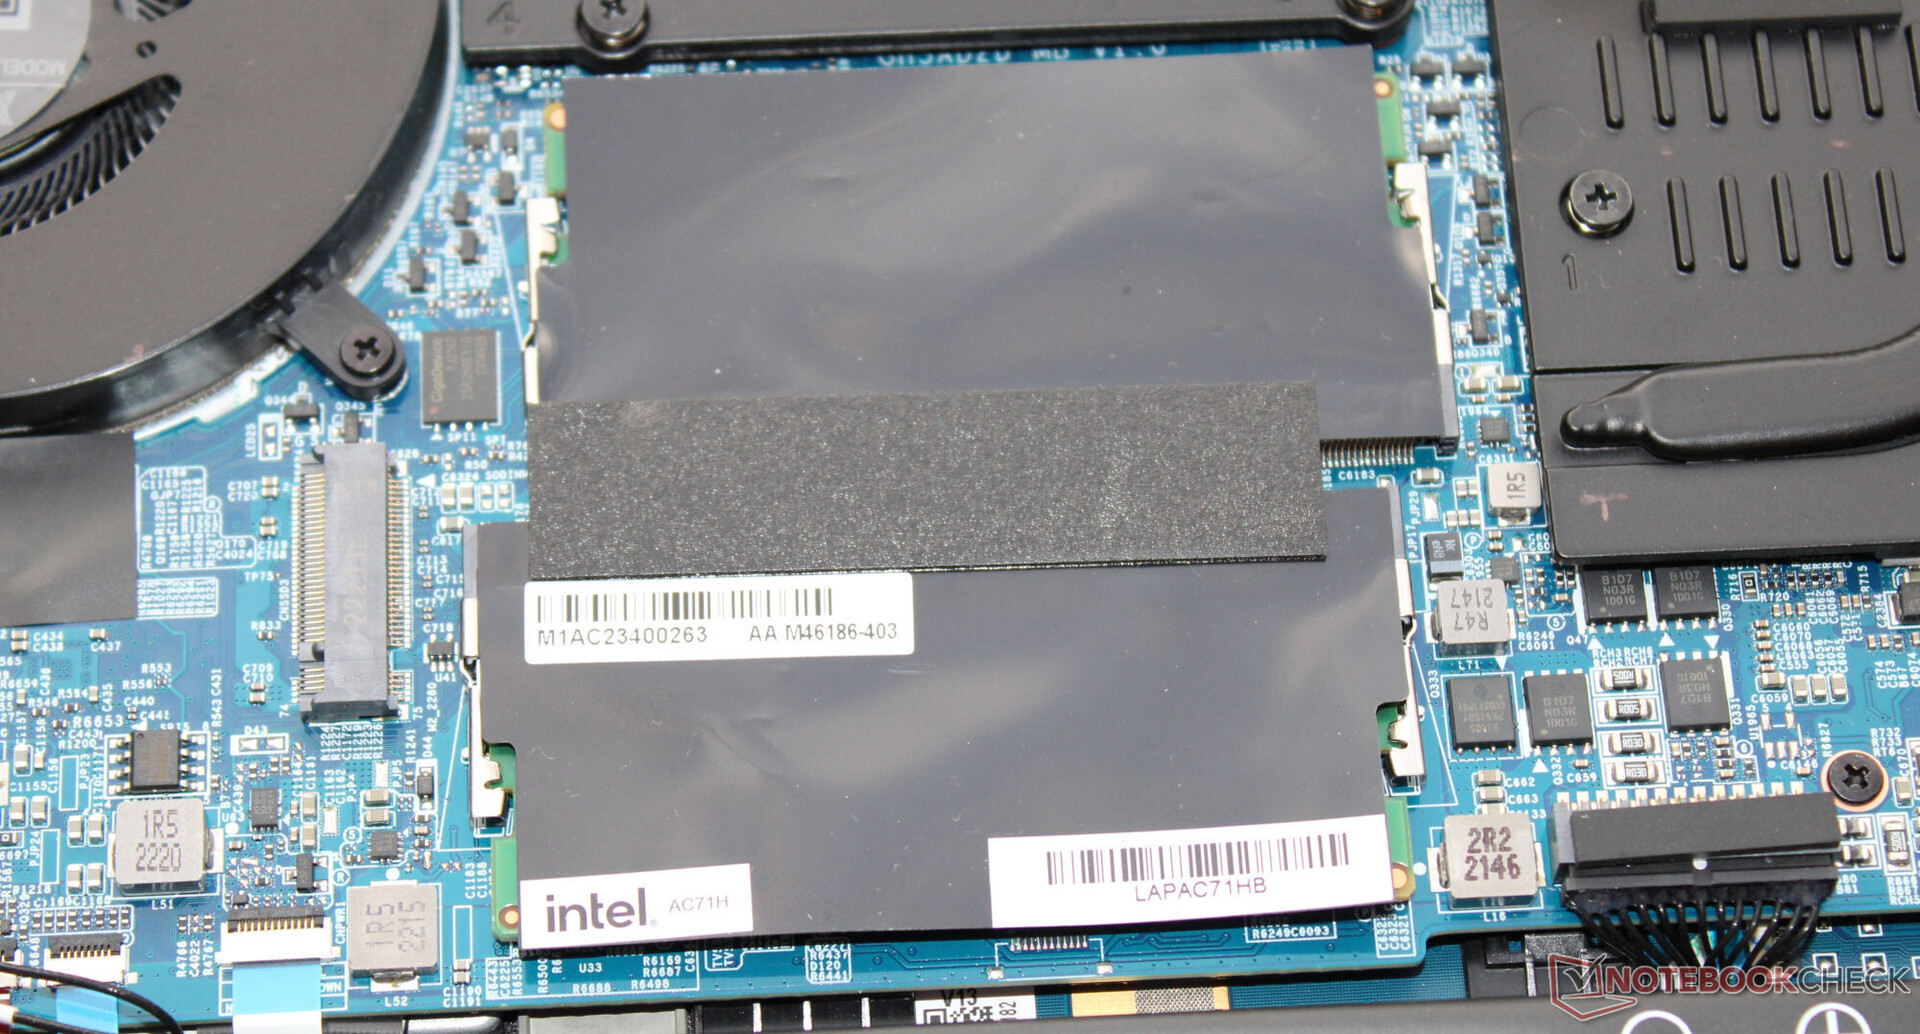
盖子的背面和黑色磨砂外壳的顶部由铝制成,显示屏边框的底部由塑料制成。我们没有注意到任何制造问题。英特尔依靠光滑、简洁的外壳,在专业环境中应该不会引起太多注意。拆开机箱底部后,你可以看到电池(用螺丝固定,不是粘上去的)以及笔记本电脑的其他内部结构。
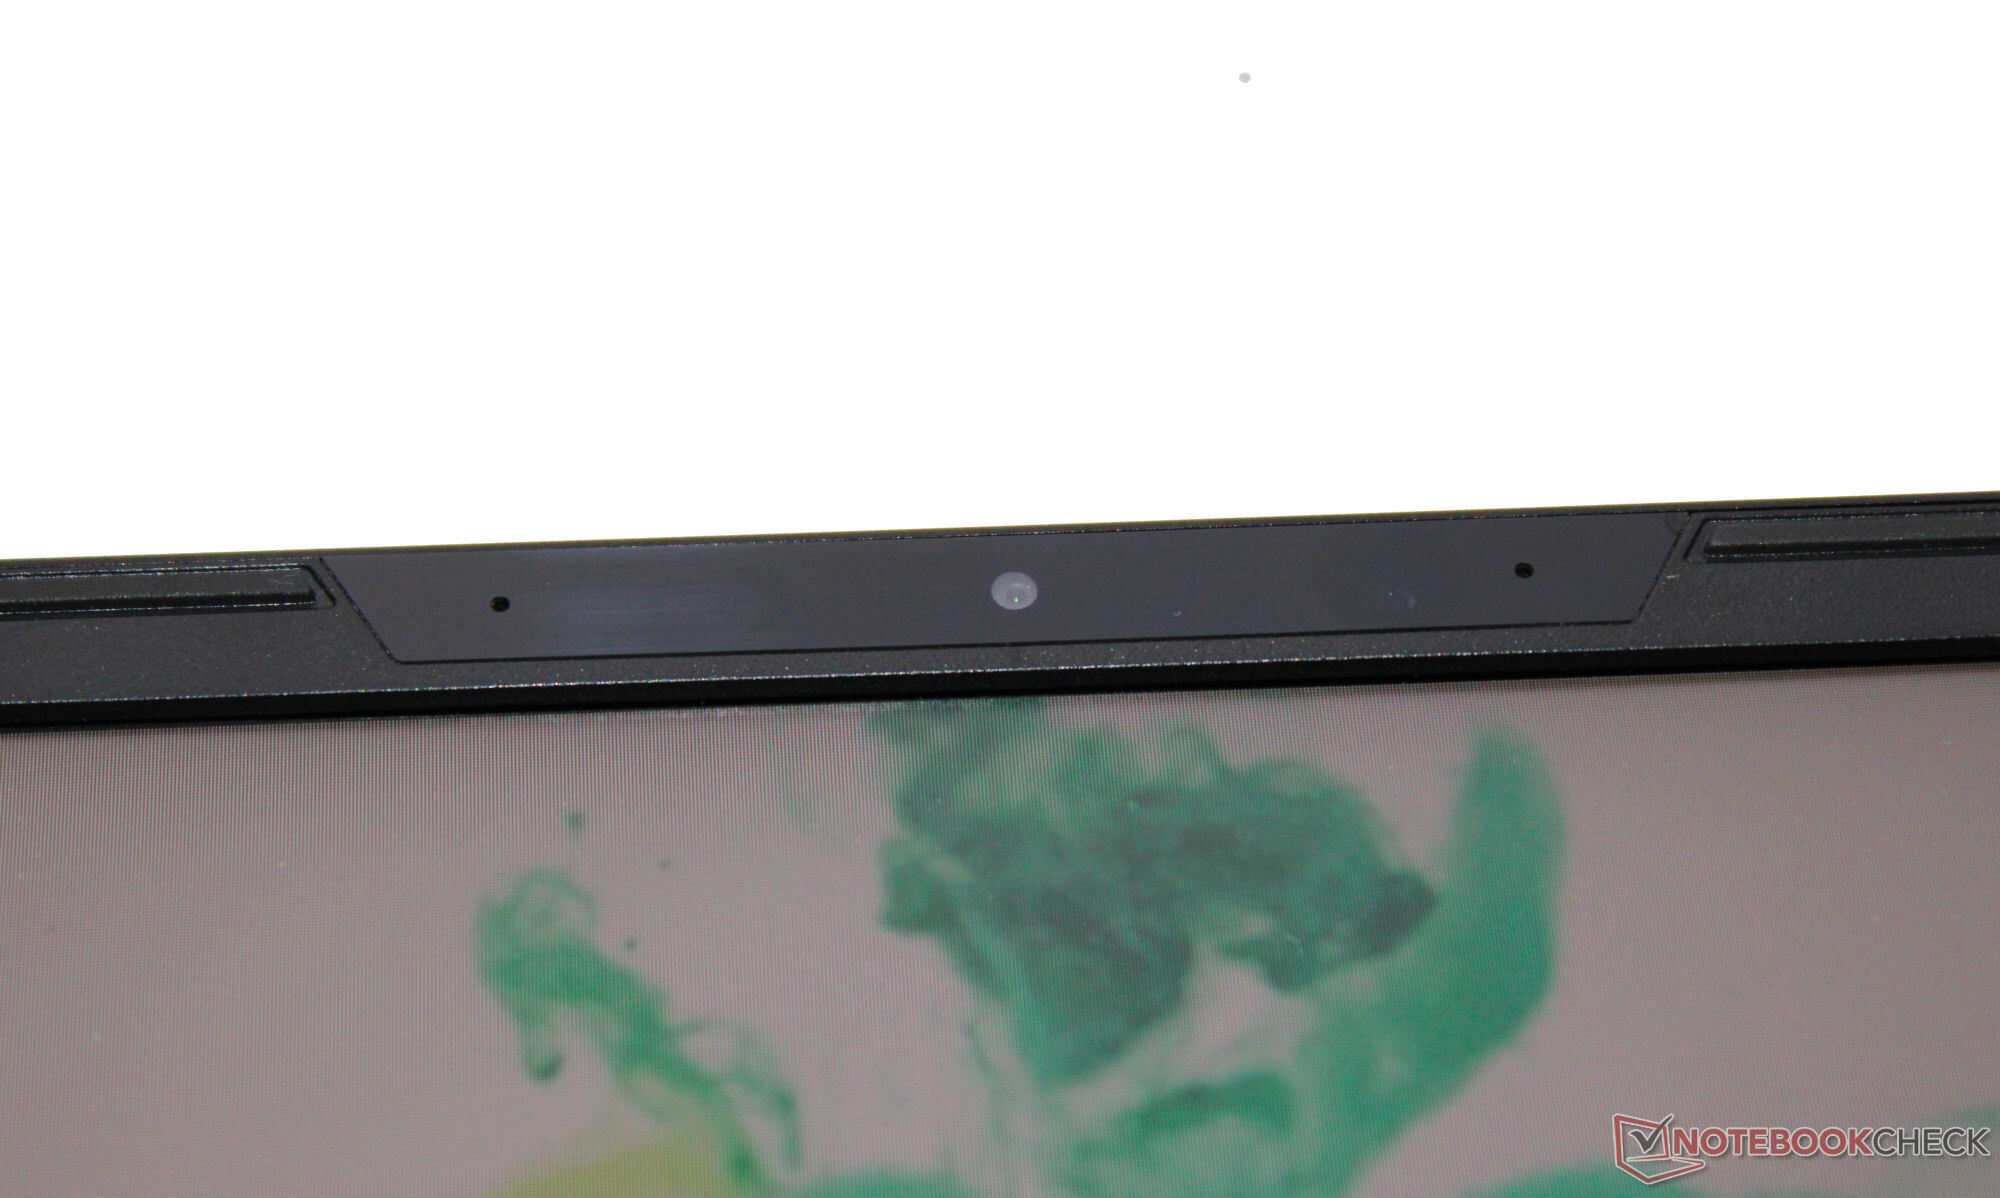
LAPAC71H 配备了三个 USB-A 端口(USB 3.2 Gen 1)和一个 USB-C 端口(Thunderbolt 4/USB 4)。后者不支持 Power Delivery,但可以输出 DisplayPort 信号。这款笔记本电脑总共有两个视频输出端口(1x HDMI、1x DP)。英特尔没有为该设备配备 SD 卡读卡器。它的网络摄像头(0.9MP,最大 1,280 x 720 像素,无遮挡)提供了相当标准的效果。
在最佳条件下(附近没有 WiFi 设备,笔记本电脑和服务器电脑之间的距离较短),它可以实现出色的 WiFi 数据传输速率。笔记本电脑使用的是 WiFi 6E 芯片(英特尔 AX201)。有线连接也由英特尔控制器(I225-V;2.5 GBit/s)负责。
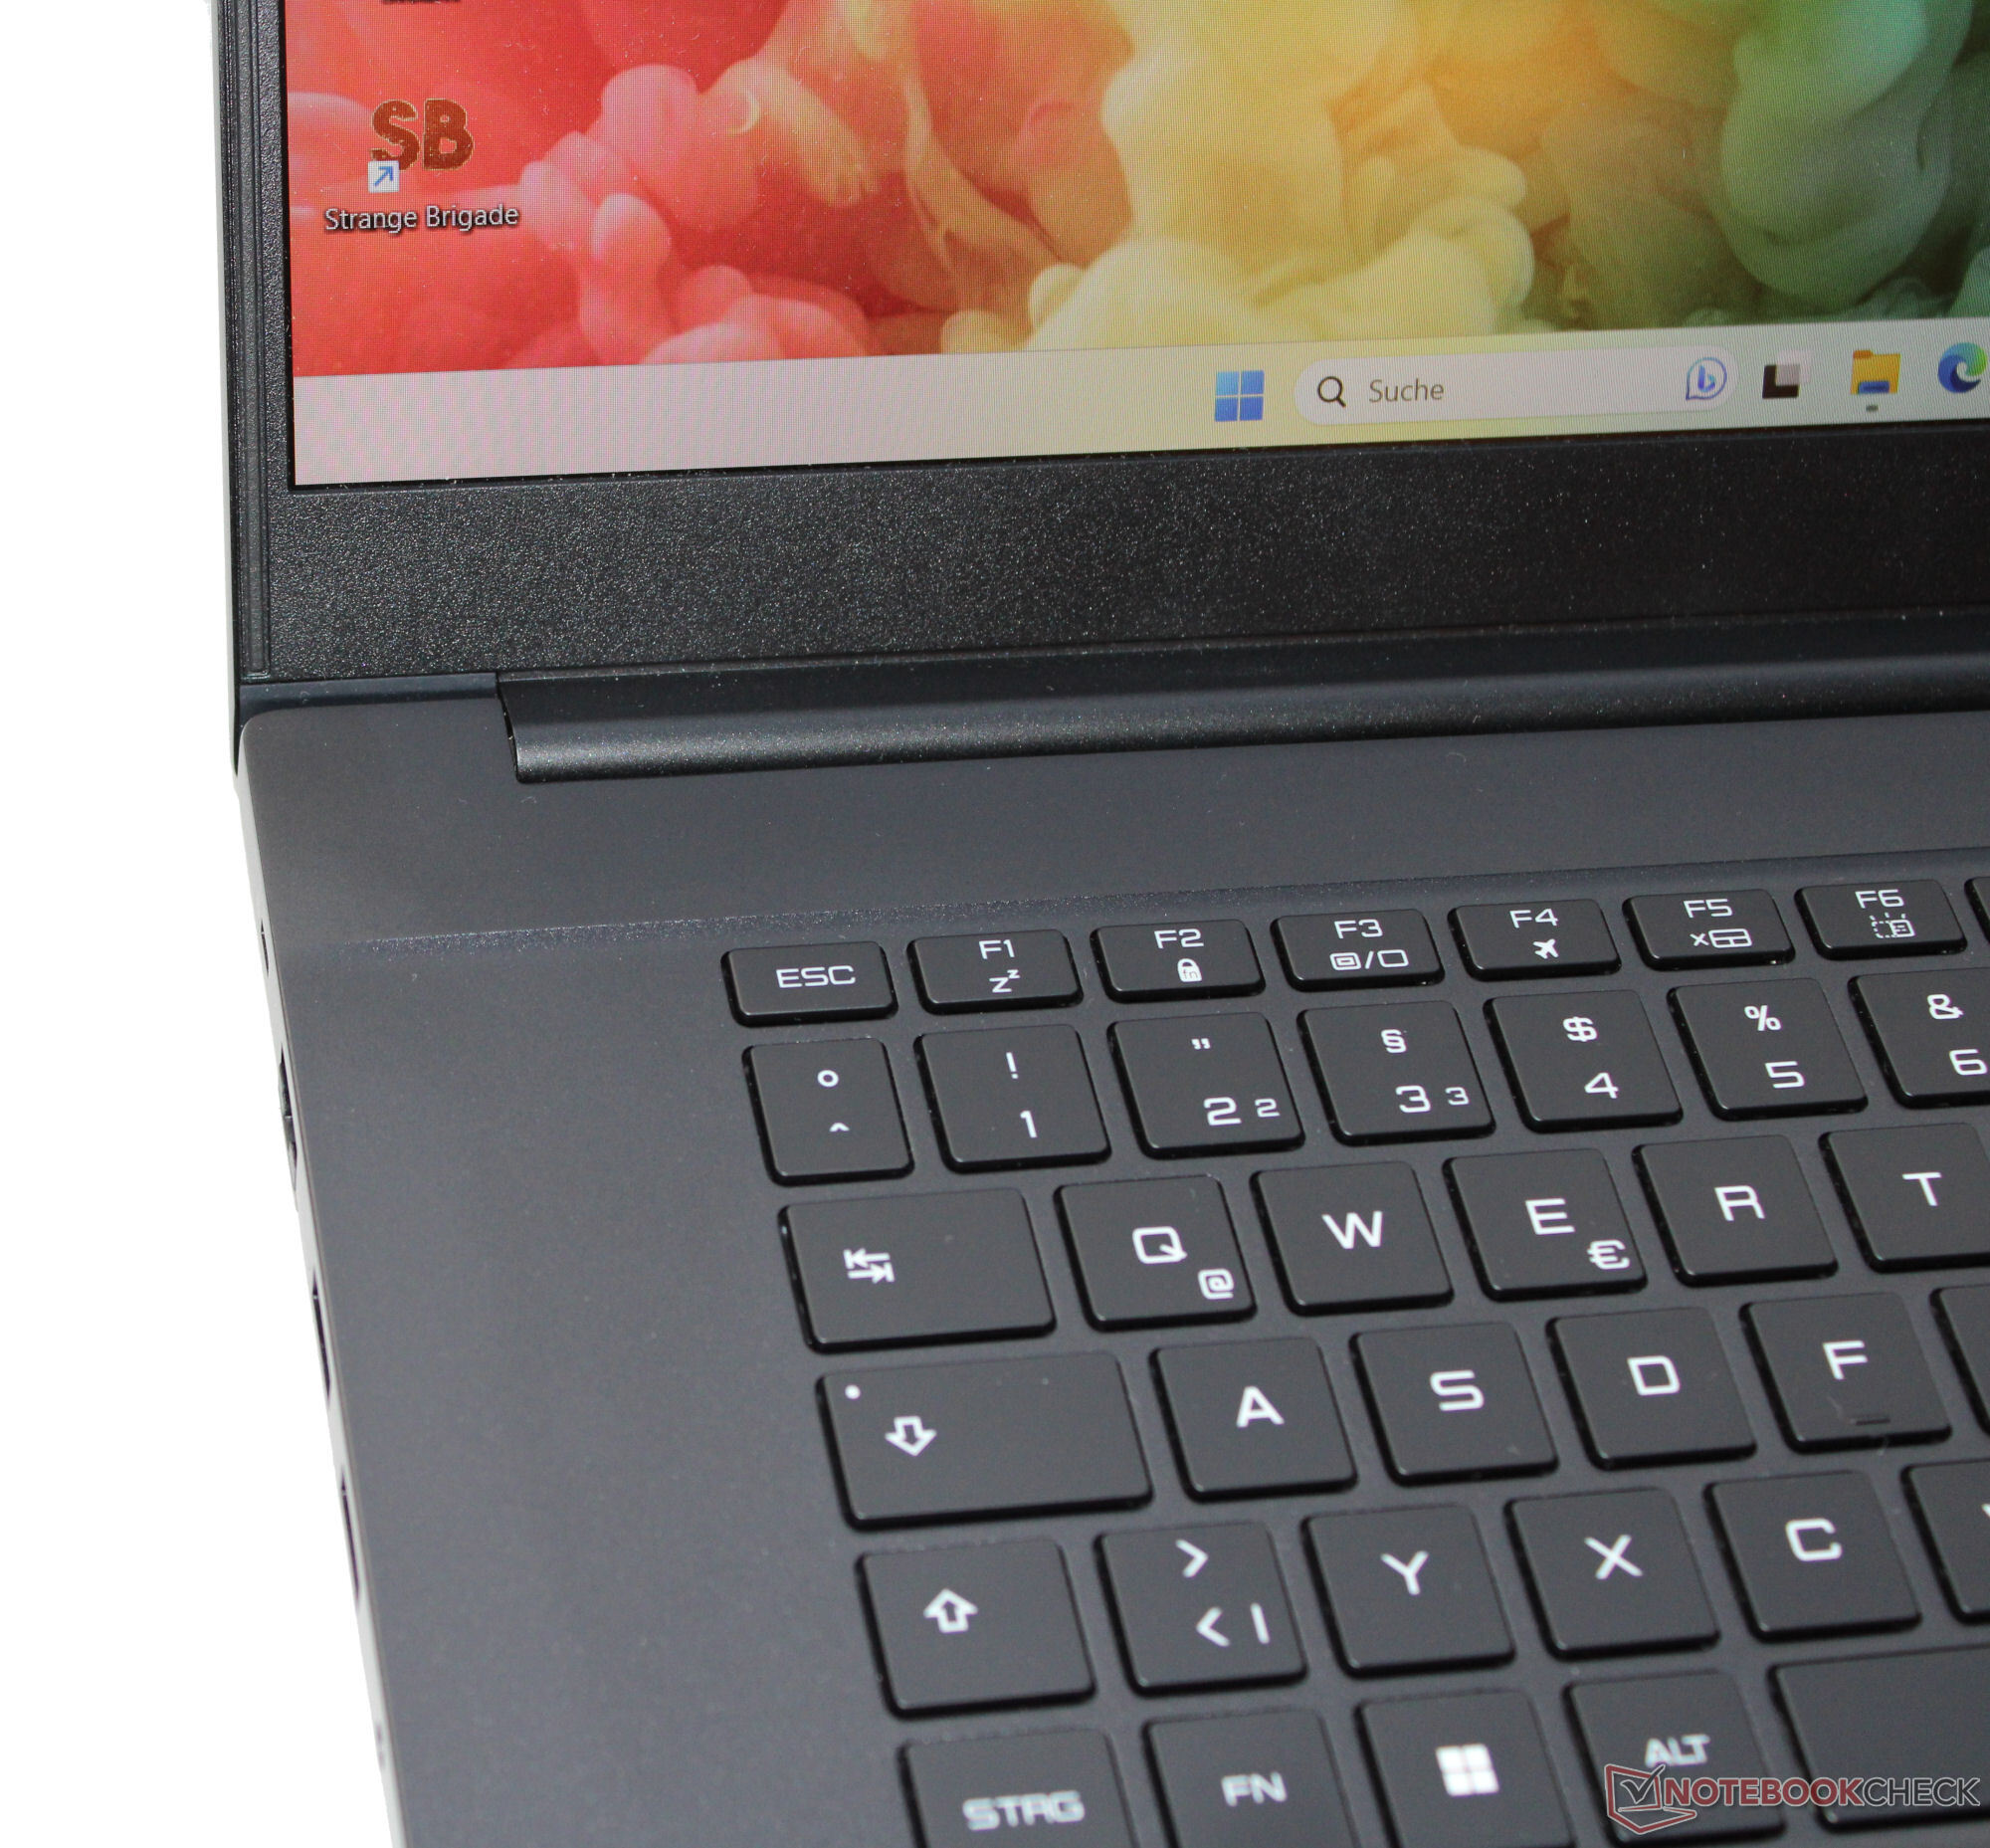
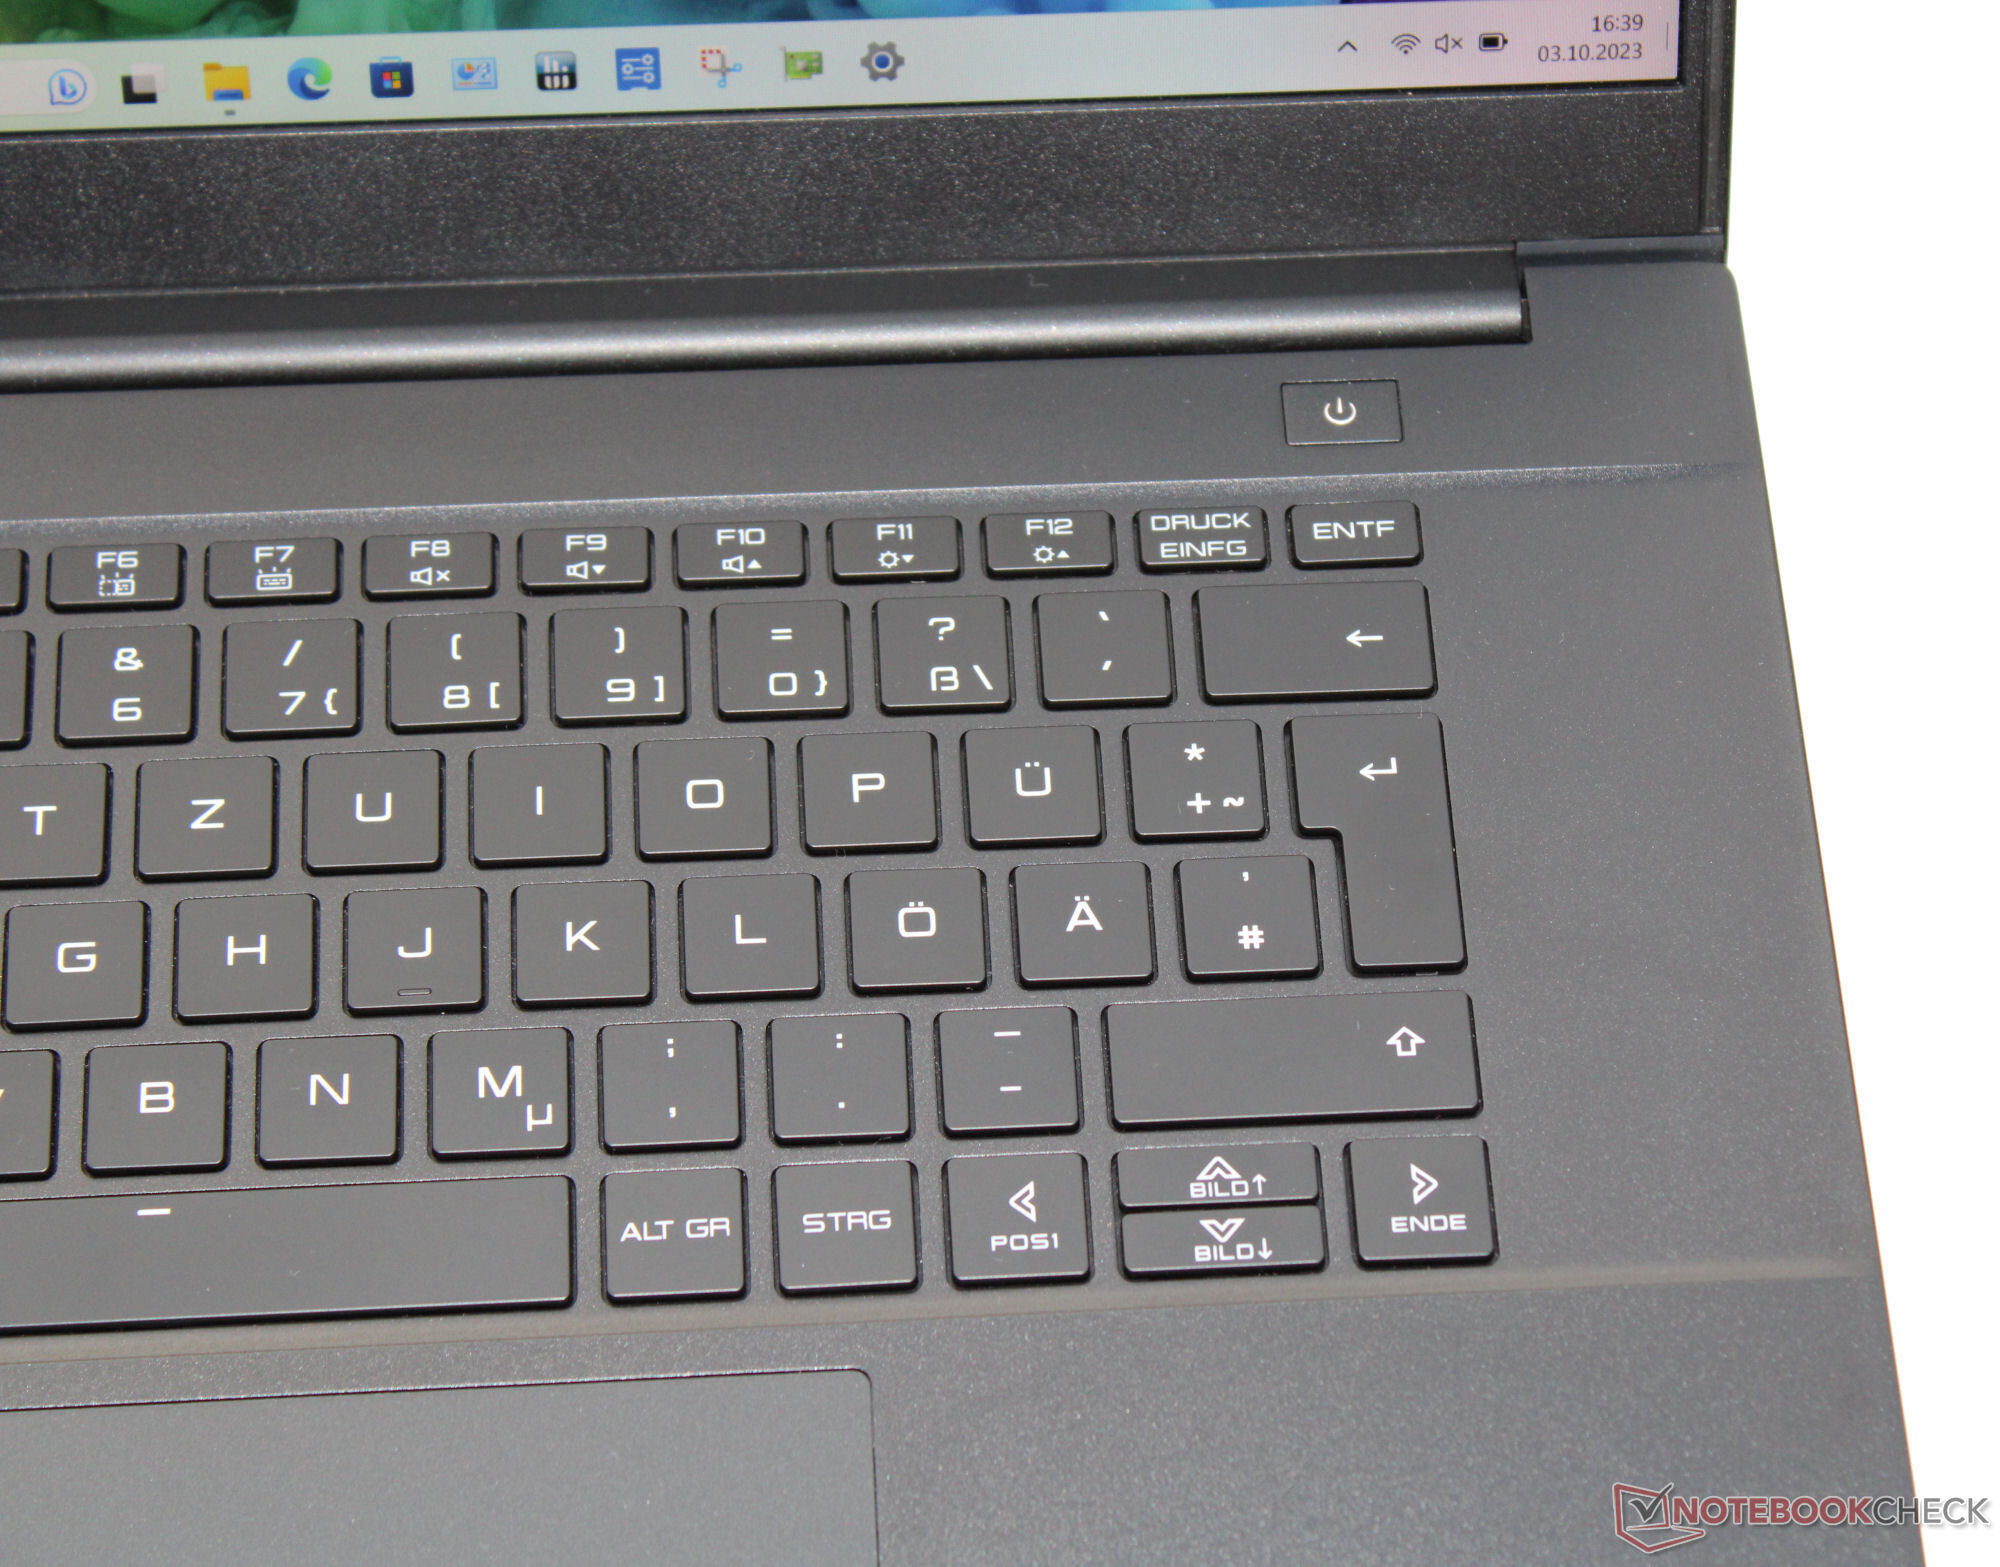
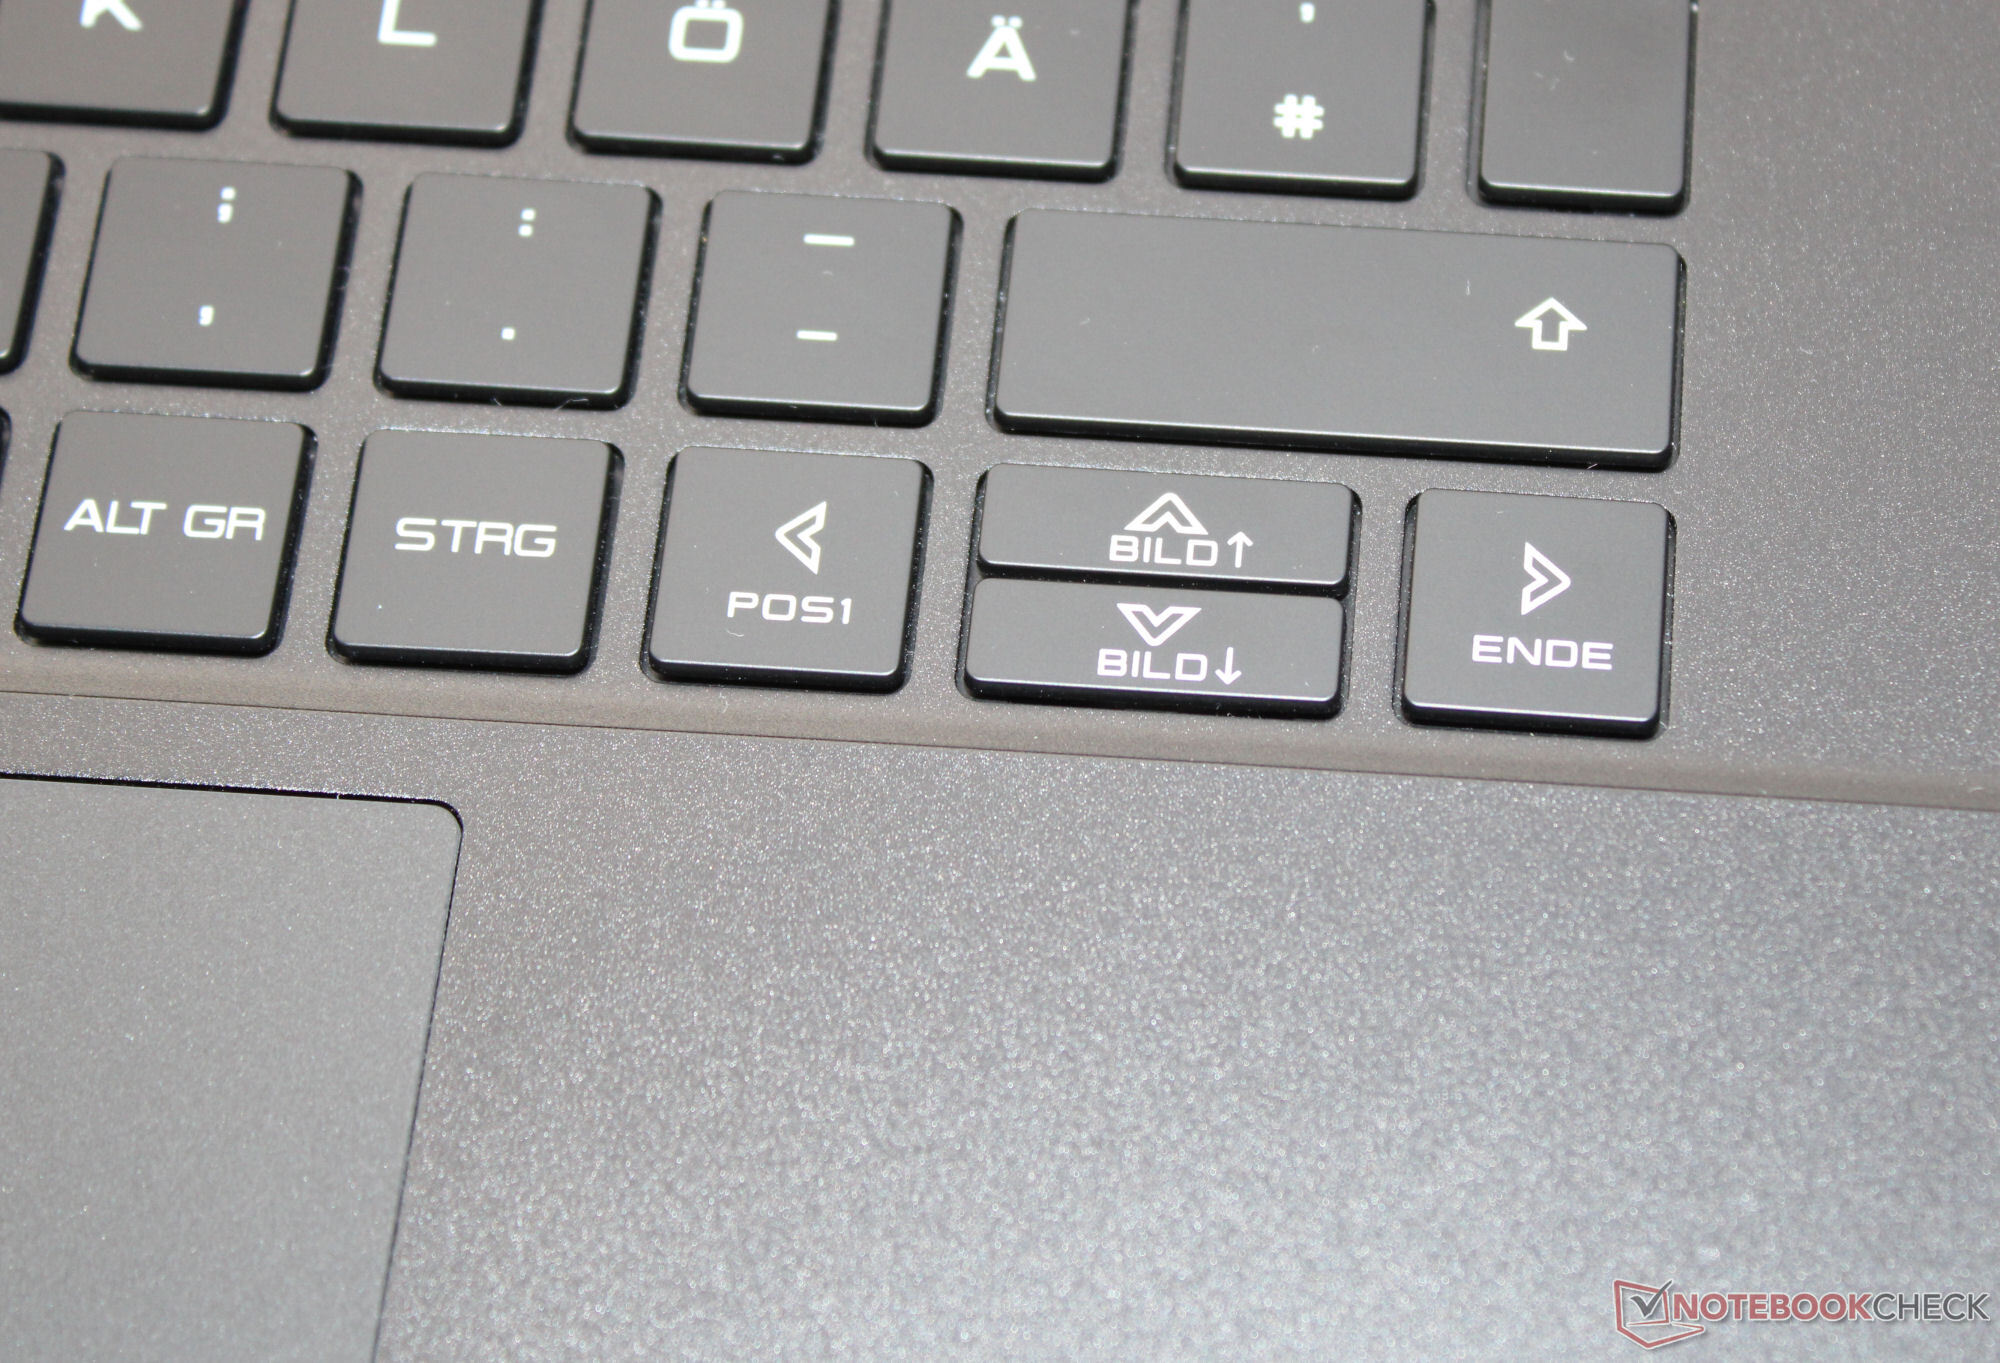


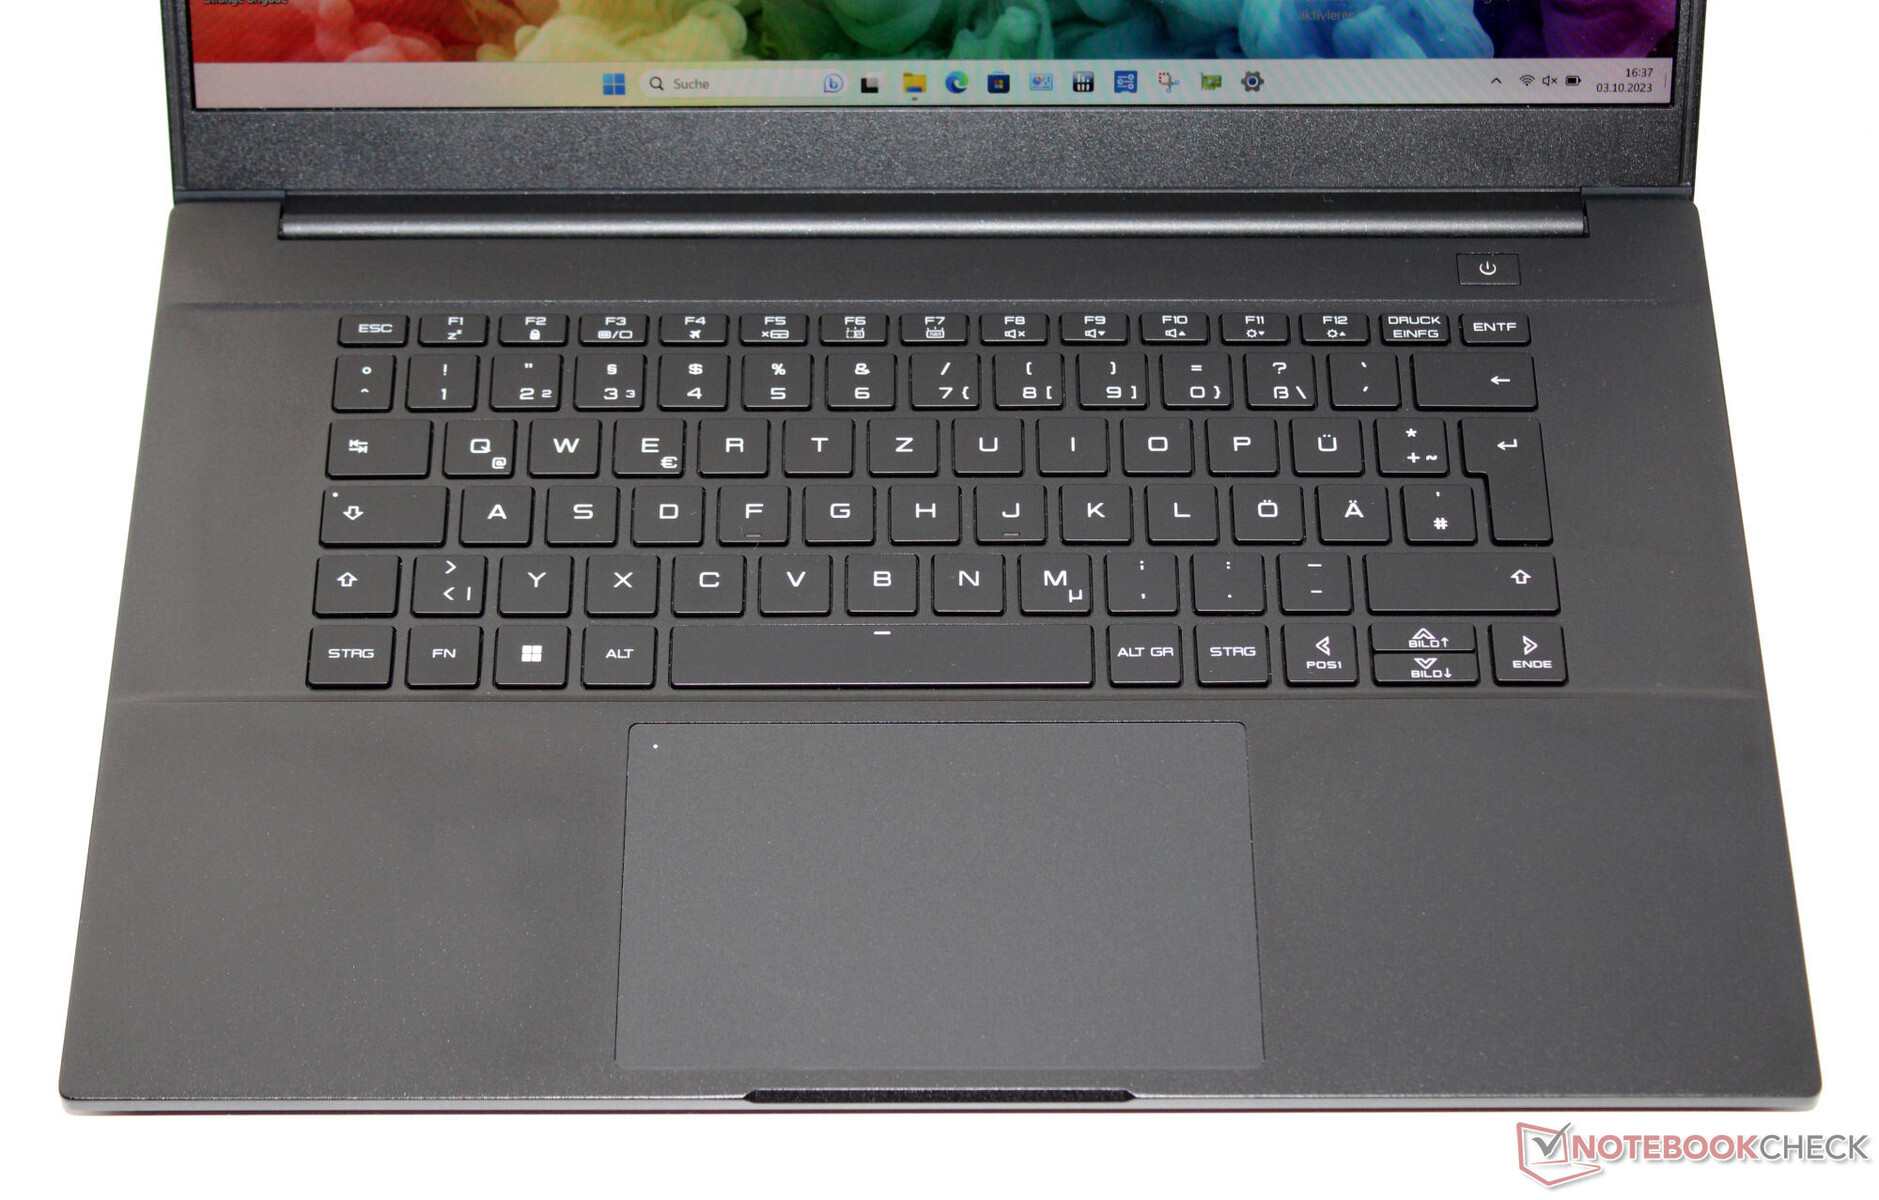
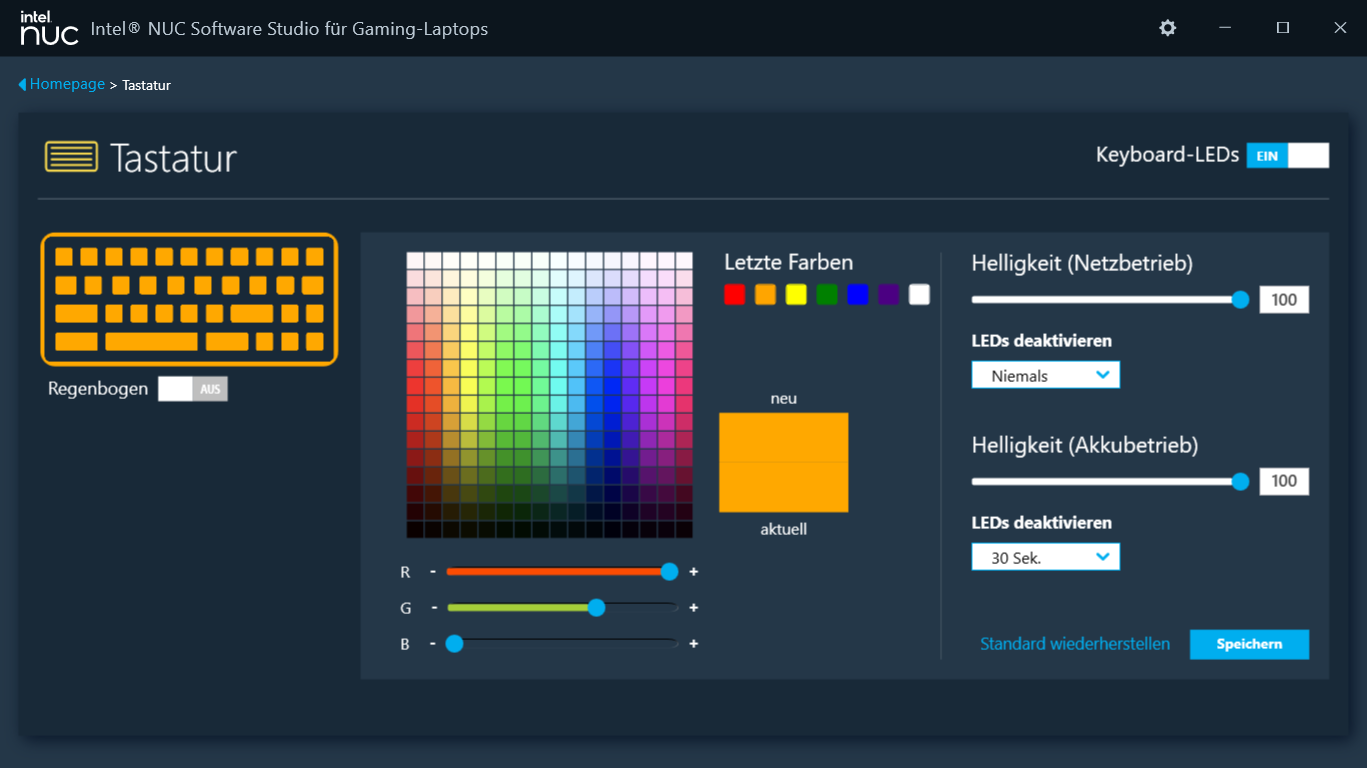
输入设备 - 带有 RGB 灯光的键盘
笔记本电脑的 Chiclet 键盘(RGB 照明)没有数字键盘,尽管有足够的空间放置数字键盘。键盘均匀、平滑,键程适中,按压点清晰。按键阻力可能会更小一些。在键盘上打字时,键盘不会变形。总的来说,英特尔提供了一款适合日常使用的键盘。安装了一块点击板(约 13.3 x 8.3 厘米)作为鼠标的替代品,它的特点是键程较短,按压点清晰。
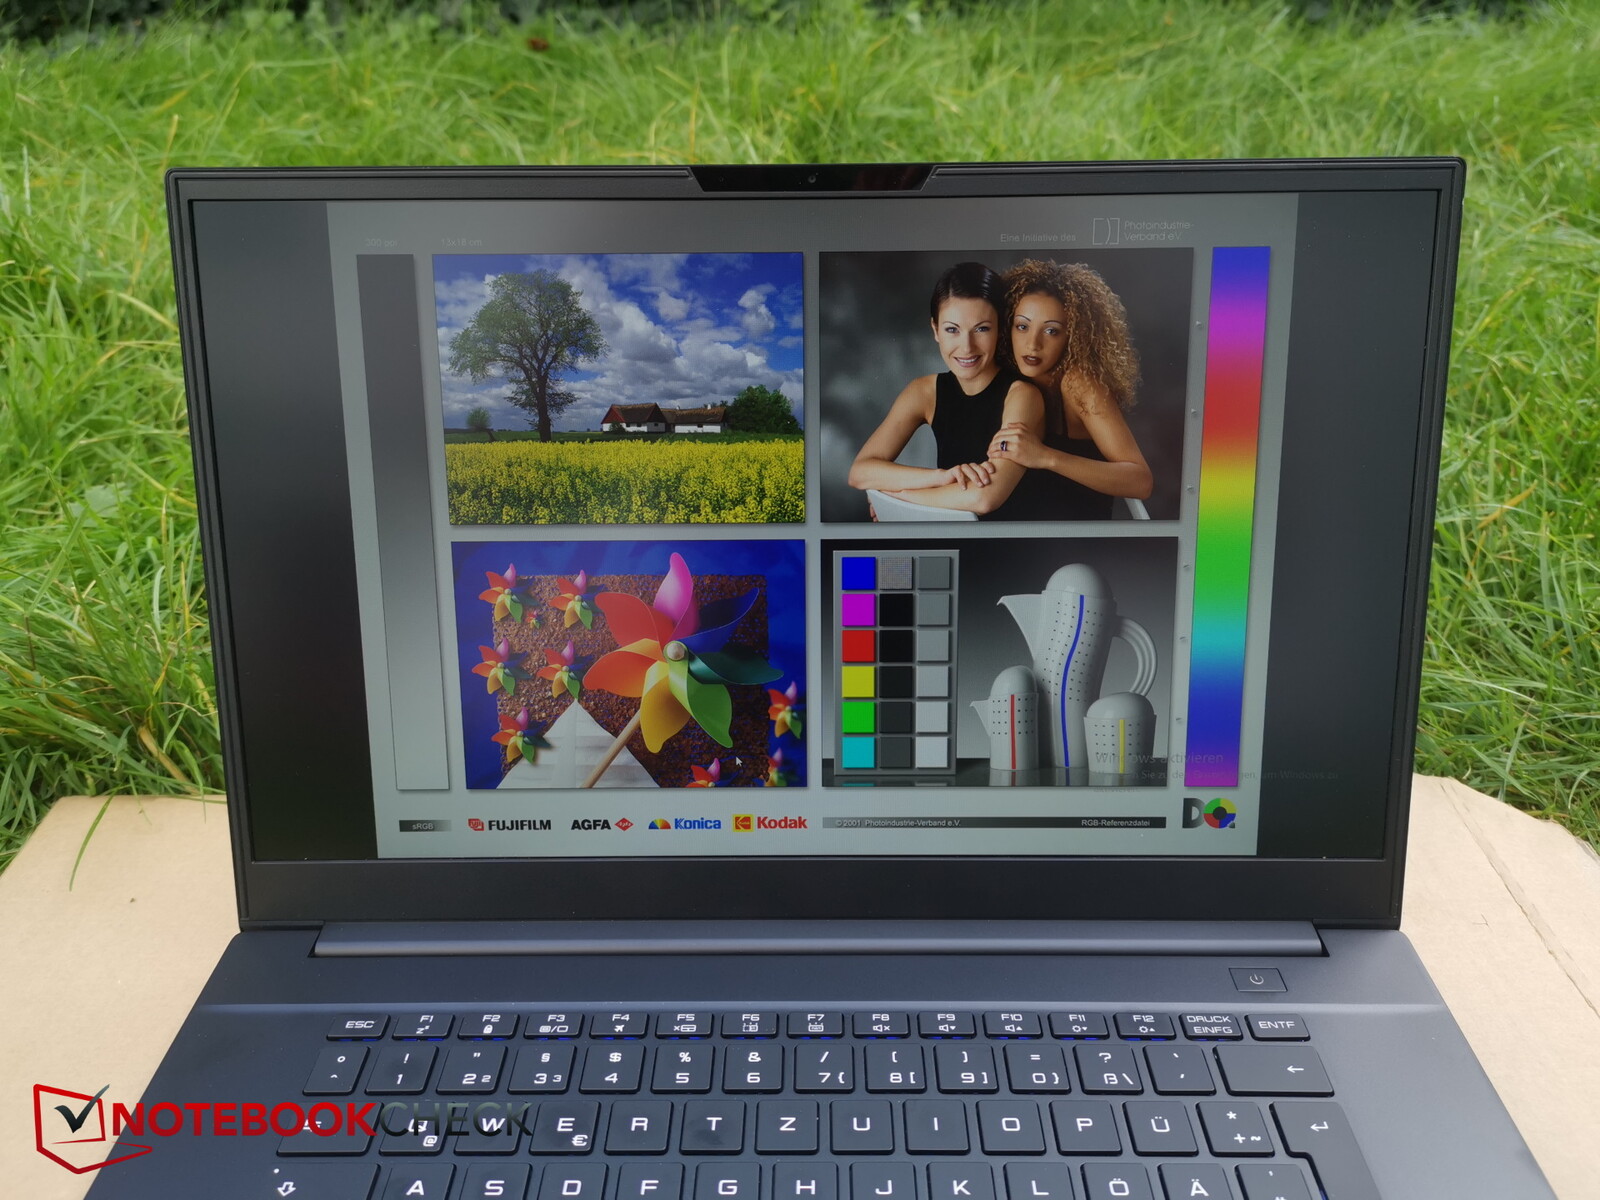
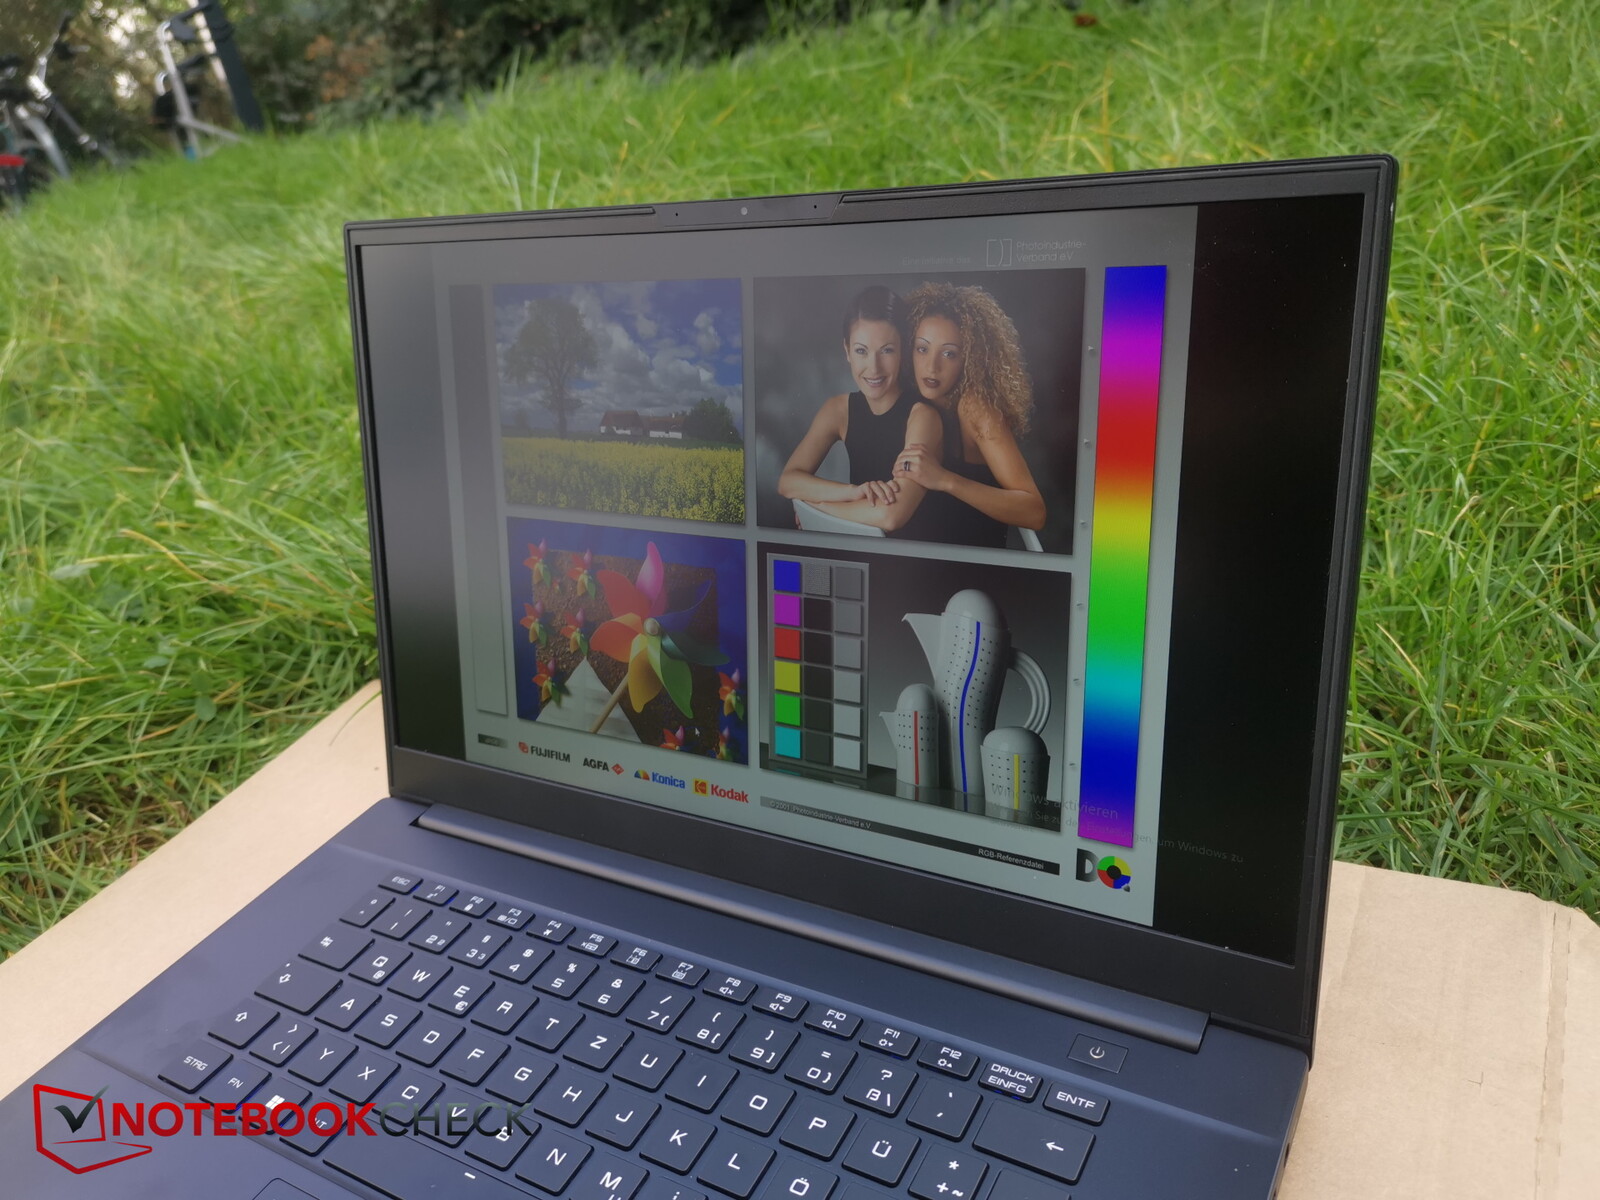
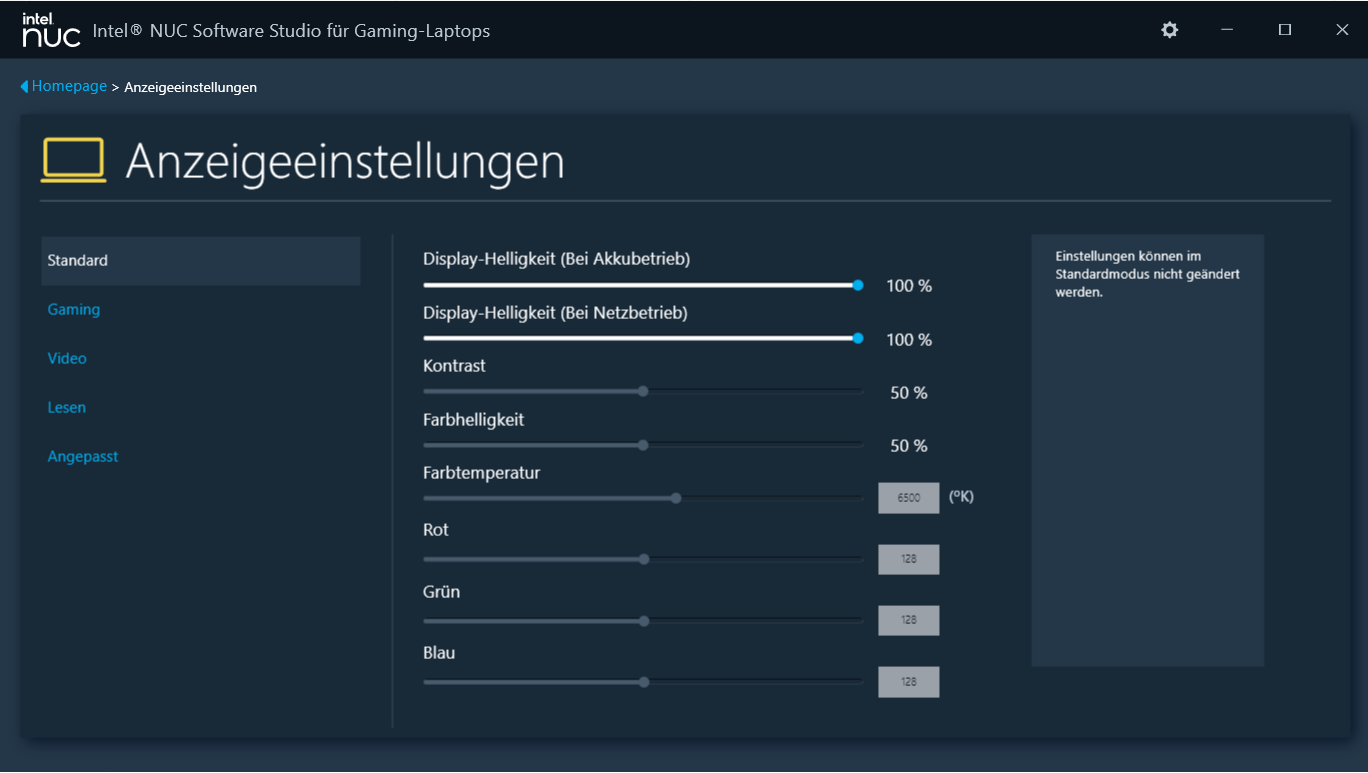
显示屏 - LAPAC71H 采用高对比度 FHD 面板
宽高比为 16:9 的 144 Hz 快速反应面板在任何亮度水平下都不会出现 PWM 闪烁。15.6 英寸显示屏(1,920 x 1,080 像素)的亮度和对比度均达到目标(大于 300 cd/m² 和 1.000:1)。其相对较高的对比度值值得一提。没有其他显示屏可供选择。
| |||||||||||||||||||||||||
Brightness Distribution: 86 %
Center on Battery: 366 cd/m²
Contrast: 2147:1 (Black: 0.17 cd/m²)
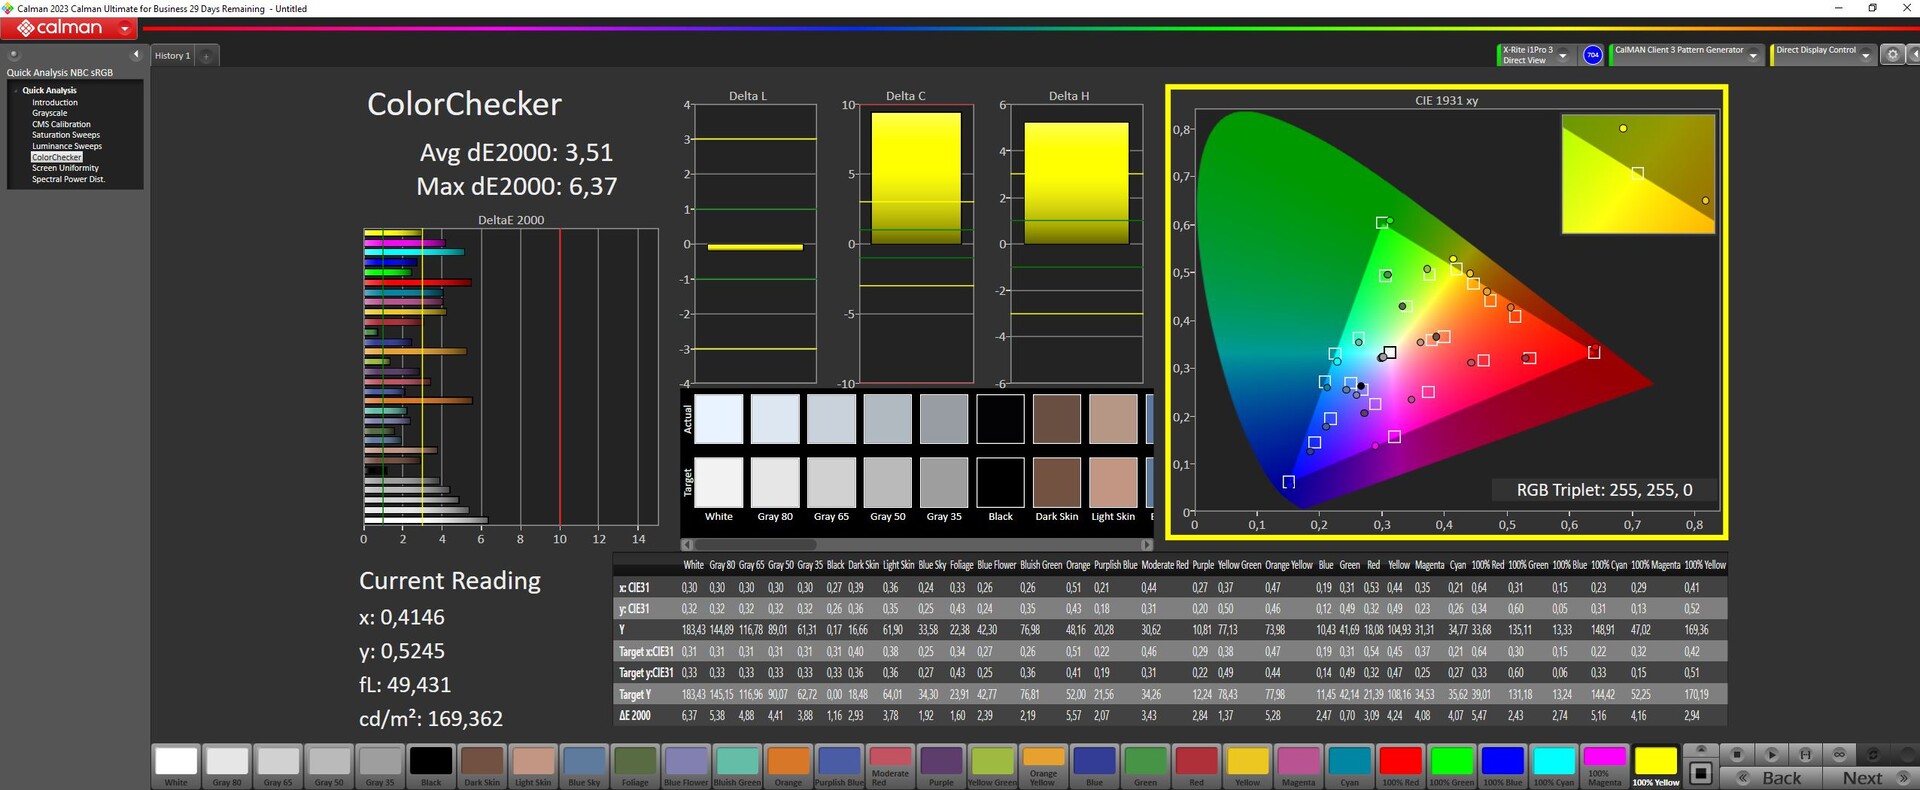
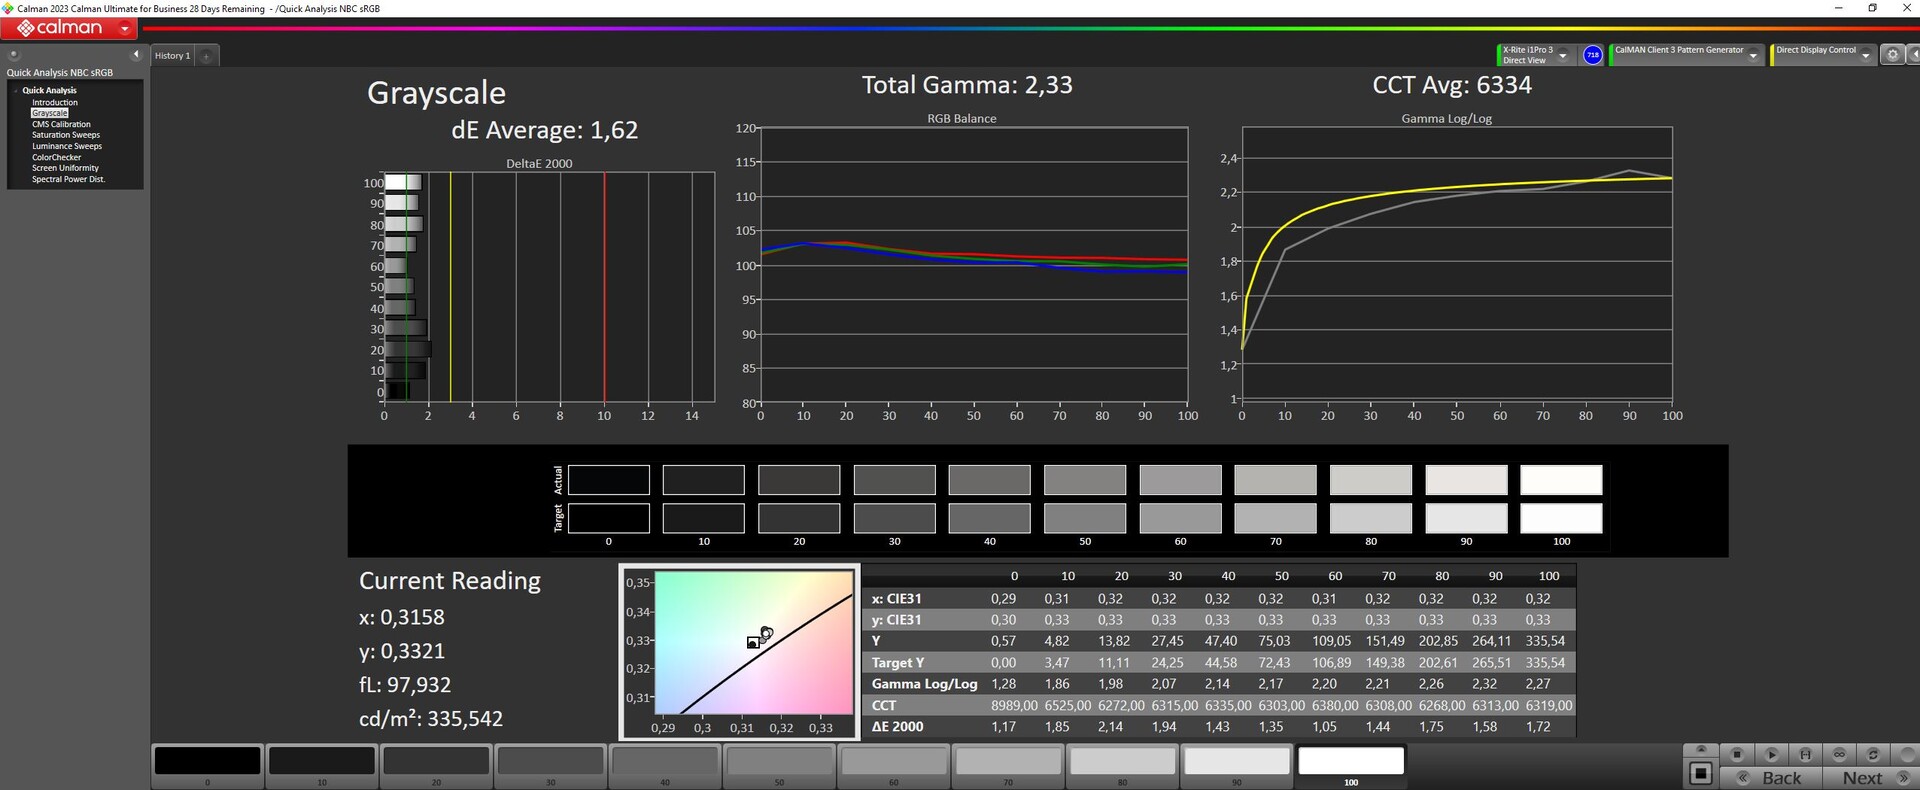
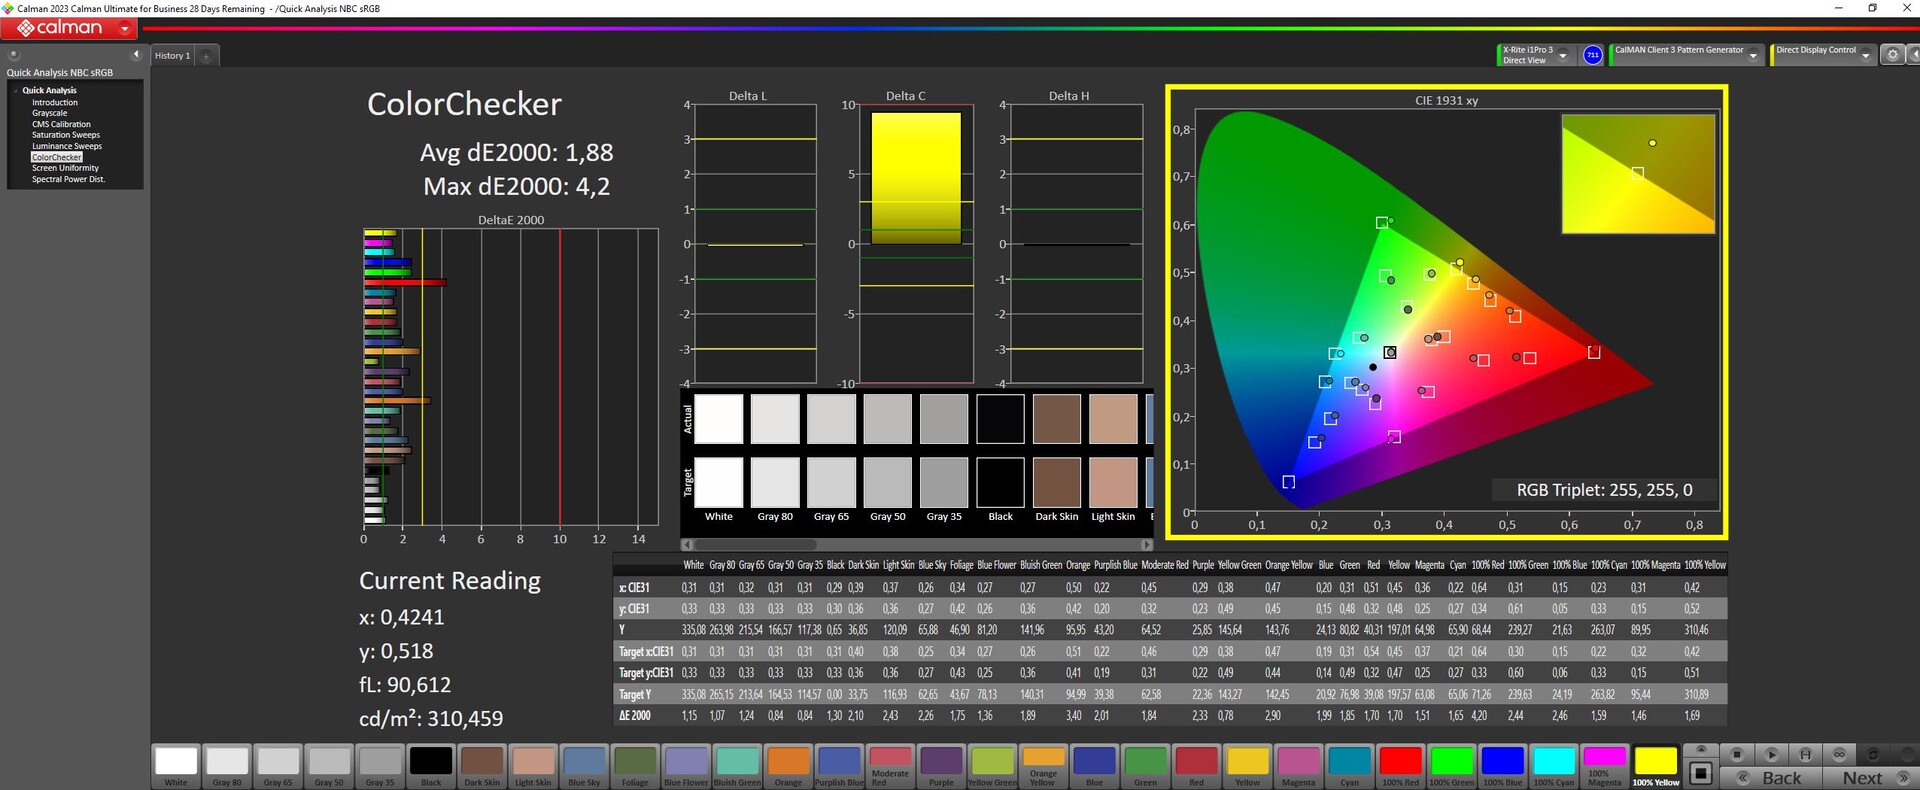
ΔE ColorChecker Calman: 3.51 | ∀{0.5-29.43 Ø4.71}
calibrated: 1.88
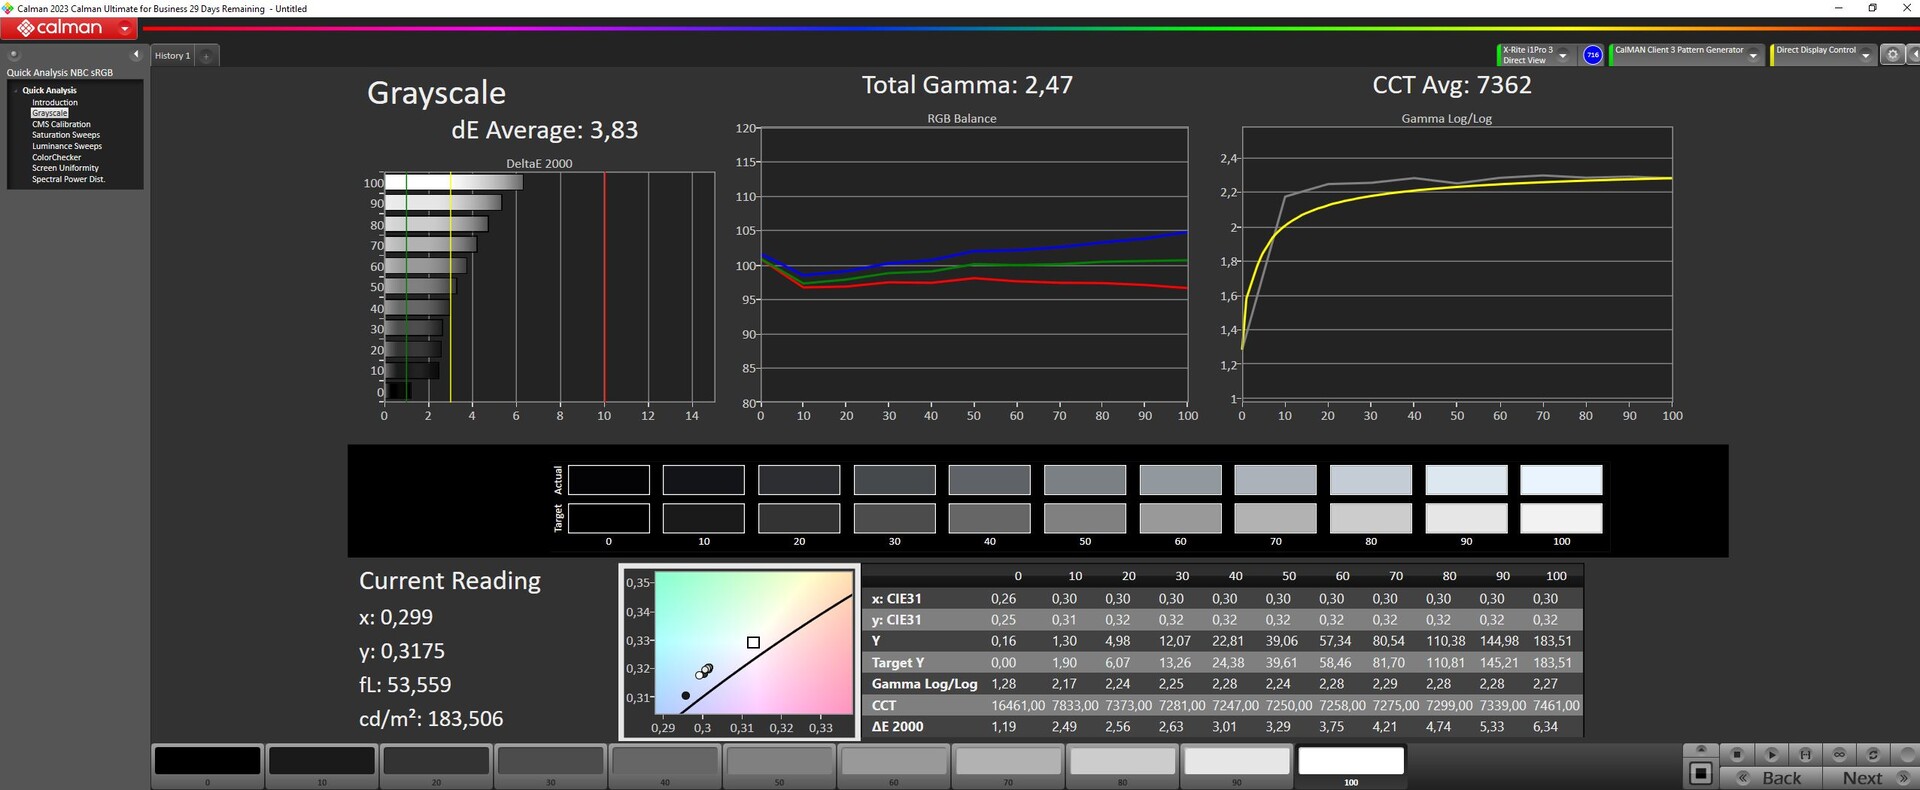
ΔE Greyscale Calman: 3.83 | ∀{0.09-98 Ø4.96}
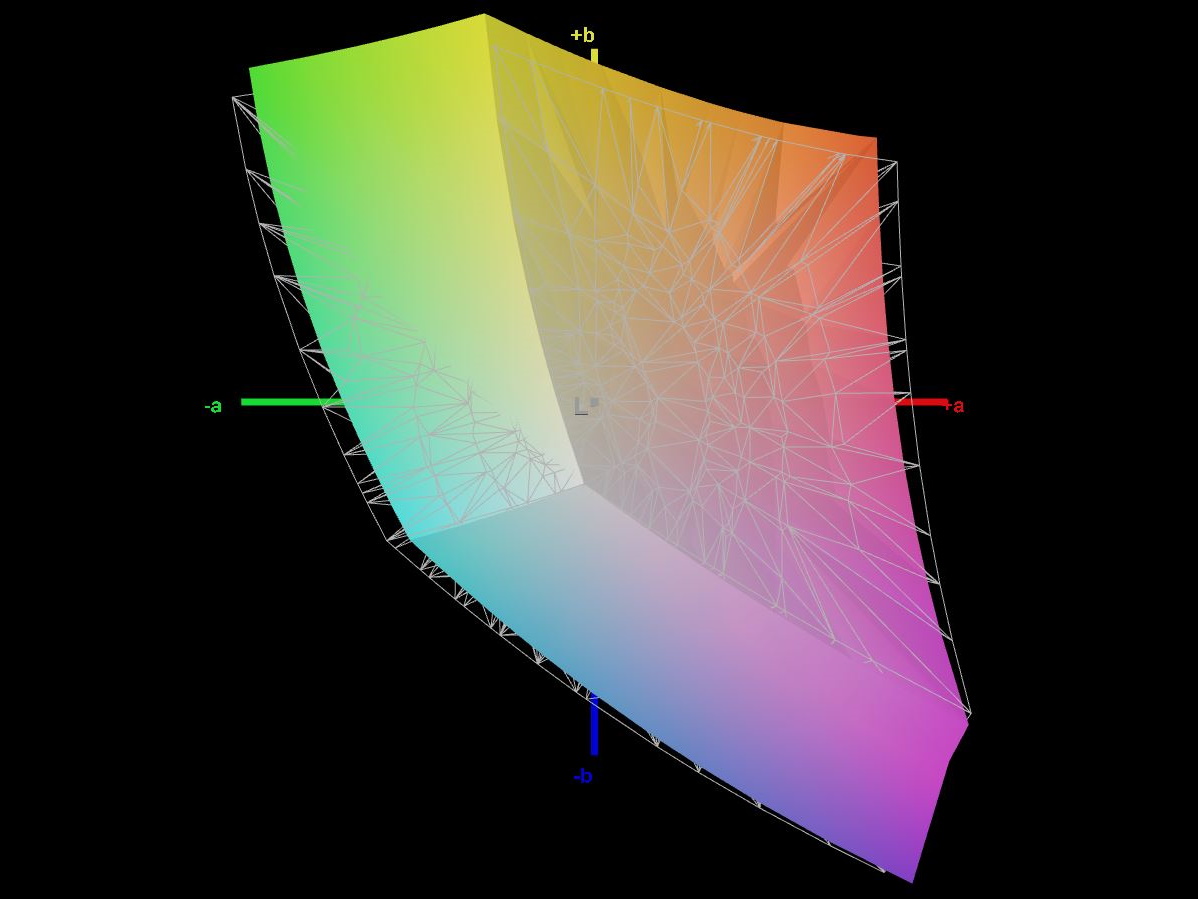
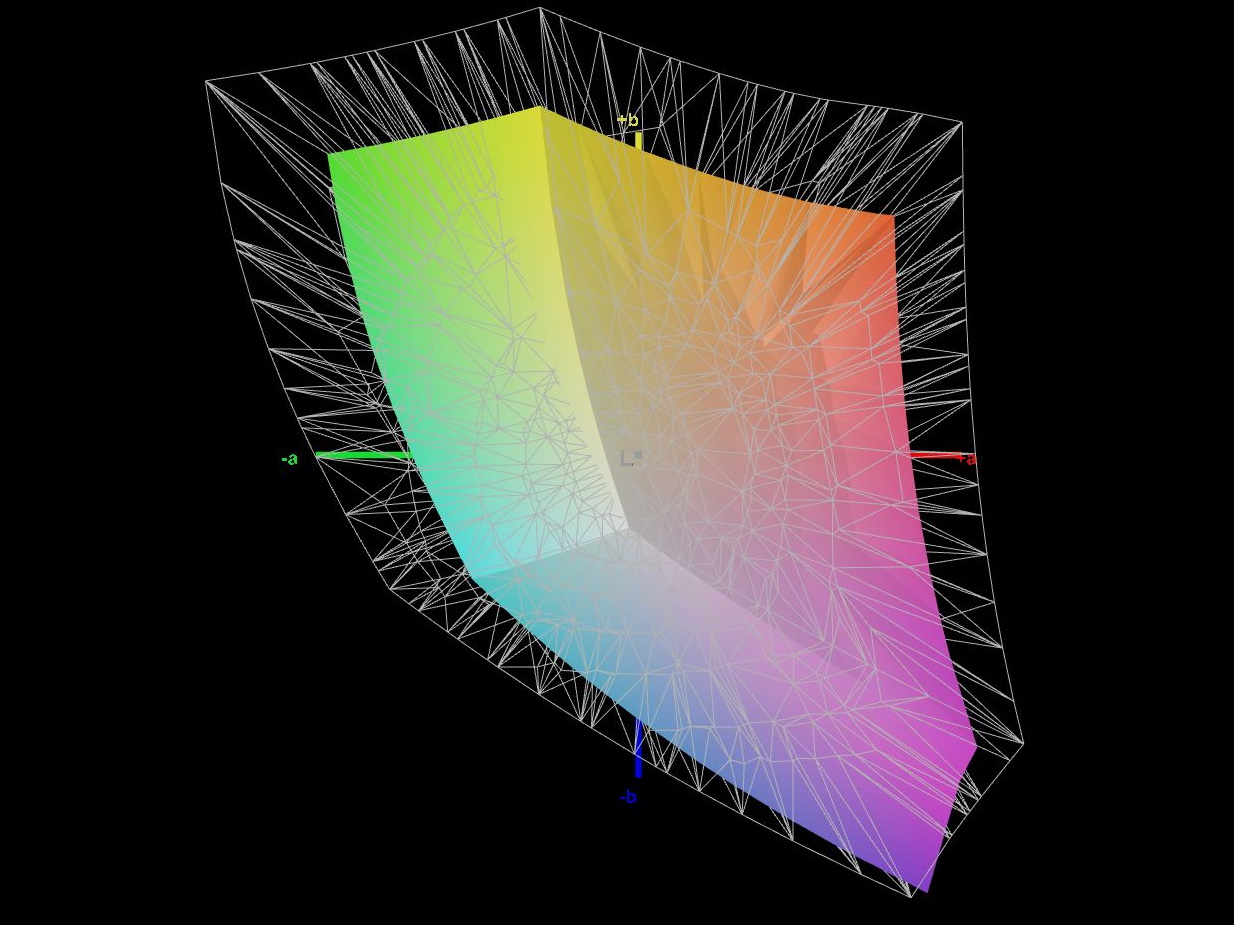
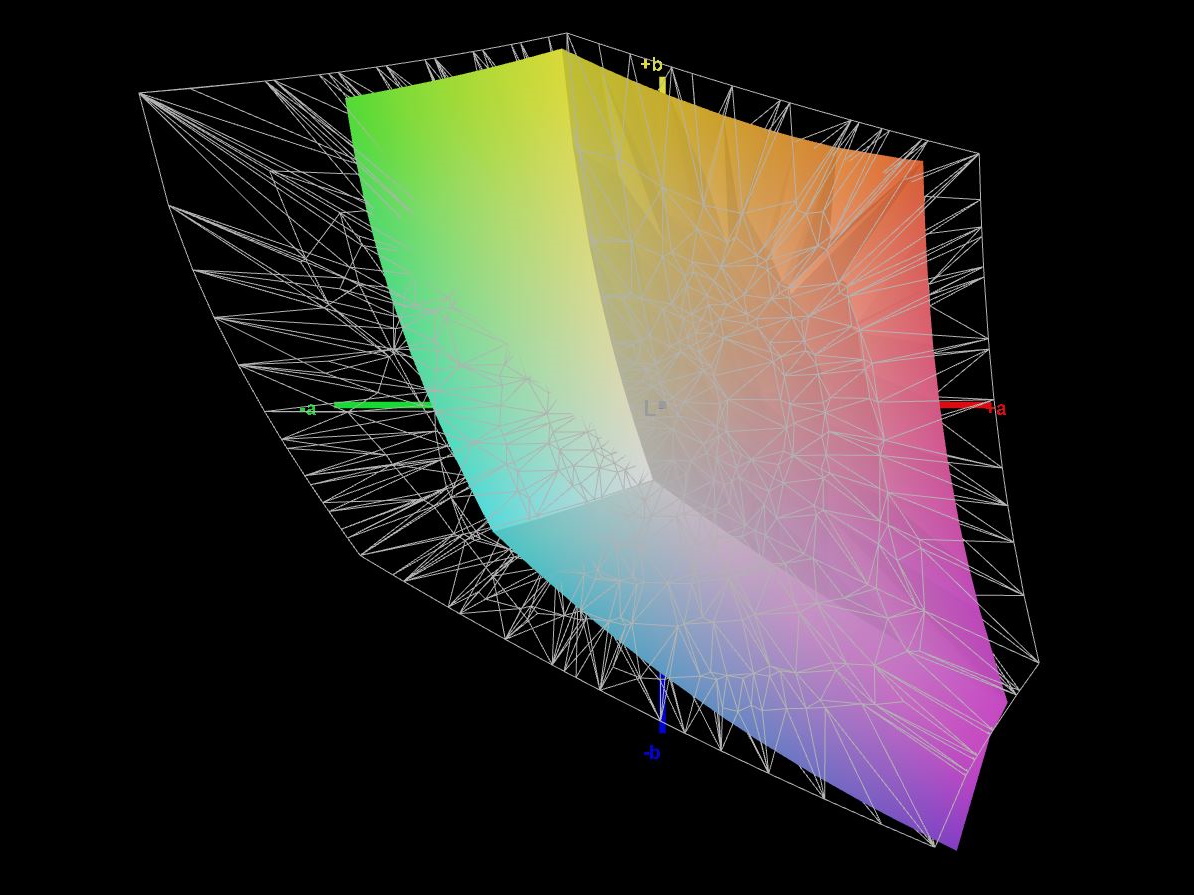
66.3% AdobeRGB 1998 (Argyll 3D)
92.6% sRGB (Argyll 3D)
64.9% Display P3 (Argyll 3D)
Gamma: 2.47
CCT: 7362 K
| Intel NUC X15 LAPAC71H BOE HF NV156FHM-N4G, IPS, 1920x1080, 15.6" | Asus TUF A15 FA507 N156HMA-GA1, IPS, 1920x1080, 15.6" | Gigabyte G5 KE Chi Mei N156HRA-EA1, IPS, 1920x1080, 15.6" | Dell Inspiron 16 Plus 7630 LG Philips 160WQ2, IPS, 2560x1600, 16" | Asus VivoBook Pro 16 Au Optronics B160QAN02.L, IPS, 2560x1600, 16" | MSI Cyborg 15 A12VF AU Optronics B156HAN15.1, IPS, 1920x1080, 15.6" | |
|---|---|---|---|---|---|---|
| Display | 1% | -36% | 8% | 30% | -34% | |
| Display P3 Coverage (%) | 64.9 | 64.9 0% | 40.7 -37% | 70.1 8% | 98.5 52% | 42.3 -35% |
| sRGB Coverage (%) | 92.6 | 96.5 4% | 61 -34% | 99.6 8% | 99.9 8% | 62.6 -32% |
| AdobeRGB 1998 Coverage (%) | 66.3 | 66.6 0% | 42.1 -37% | 72.3 9% | 86.1 30% | 43.7 -34% |
| Response Times | -238% | -199% | -291% | 32% | -137% | |
| Response Time Grey 50% / Grey 80% * (ms) | 7.8 ? | 30.4 ? -290% | 26.64 ? -242% | 35 ? -349% | 2 ? 74% | 22 ? -182% |
| Response Time Black / White * (ms) | 7.3 ? | 20.8 ? -185% | 18.65 ? -155% | 24.2 ? -232% | 8 ? -10% | 14 ? -92% |
| PWM Frequency (Hz) | ||||||
| Screen | 13% | -67% | -10% | 5% | -27% | |
| Brightness middle (cd/m²) | 365 | 288 -21% | 269 -26% | 299.4 -18% | 504 38% | 247 -32% |
| Brightness (cd/m²) | 356 | 271 -24% | 248 -30% | 290 -19% | 465 31% | 234 -34% |
| Brightness Distribution (%) | 86 | 91 6% | 85 -1% | 92 7% | 87 1% | 89 3% |
| Black Level * (cd/m²) | 0.17 | 0.17 -0% | 0.5 -194% | 0.21 -24% | 0.35 -106% | 0.25 -47% |
| Contrast (:1) | 2147 | 1694 -21% | 538 -75% | 1426 -34% | 1440 -33% | 988 -54% |
| Colorchecker dE 2000 * | 3.51 | 1.9 46% | 4.54 -29% | 4.25 -21% | 1.83 48% | 3.78 -8% |
| Colorchecker dE 2000 max. * | 6.37 | 3.3 48% | 17.28 -171% | 6.71 -5% | 5.51 14% | 6.42 -1% |
| Colorchecker dE 2000 calibrated * | 1.88 | 0.9 52% | 3.34 -78% | 0.52 72% | 1.34 29% | 3.94 -110% |
| Greyscale dE 2000 * | 3.83 | 2.7 30% | 3.8 1% | 5.5 -44% | 3.02 21% | 2.16 44% |
| Gamma | 2.47 89% | 2.32 95% | 2.17 101% | 2.35 94% | 2.39 92% | 2.33 94% |
| CCT | 7362 88% | 6535 99% | 7408 88% | 6368 102% | 6688 97% | 6906 94% |
| Total Average (Program / Settings) | -75% /
-25% | -101% /
-79% | -98% /
-46% | 22% /
14% | -66% /
-44% |
* ... smaller is better
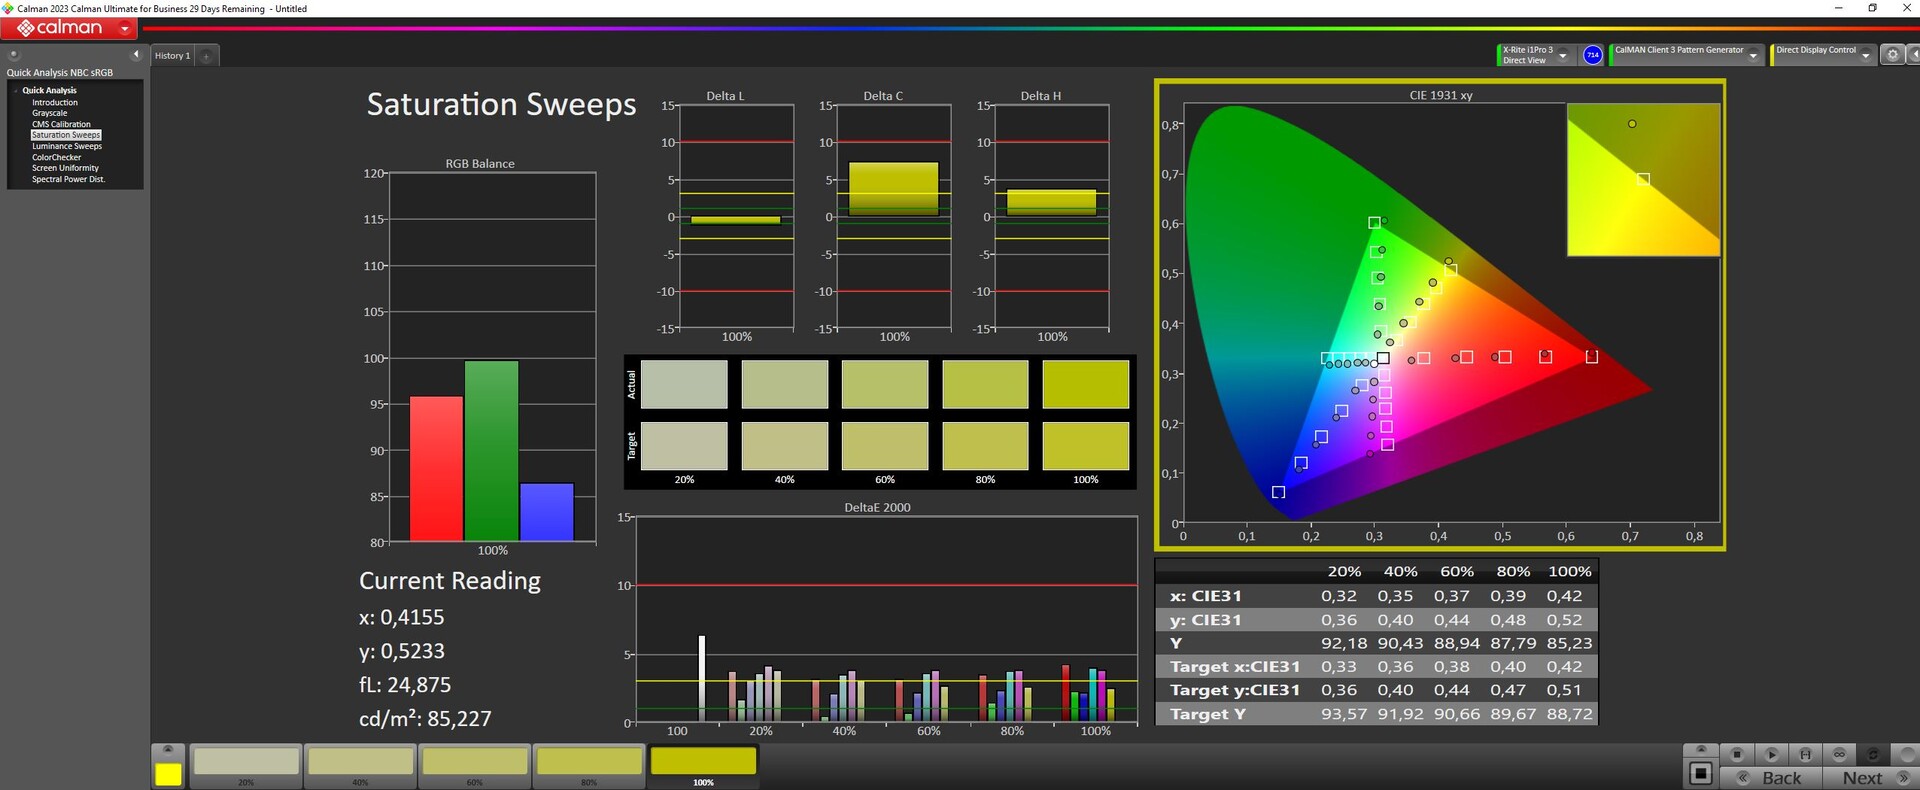
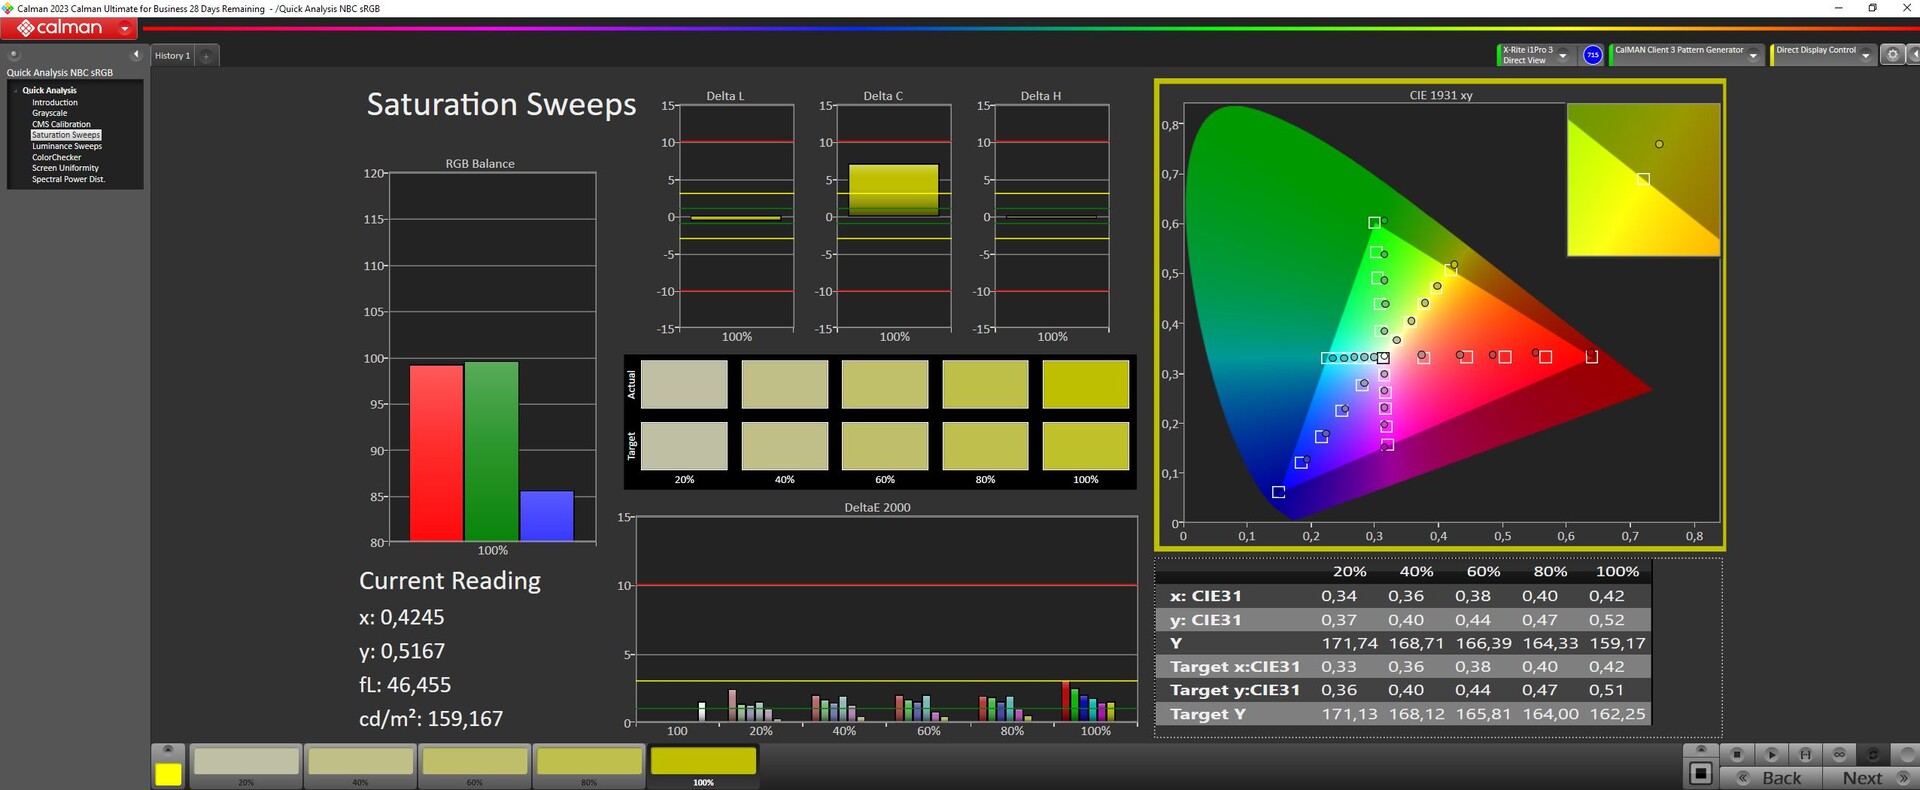
Ex 工作时,显示屏显示的颜色相对较好:偏差约为 3.5,刚刚达到目标(DeltaE < 3)。对屏幕进行校准后,偏差降至 1.9,灰阶色调更加均衡。该面板几乎可以完全覆盖 sRGB 色彩空间,但无法覆盖 AdobeRGB 或 DCI P3。大多数竞争对手的面板都能呈现类似的效果。只有VivoBook的显示屏可以覆盖 P3 色彩空间。
Display Response Times
| ↔ Response Time Black to White | ||
|---|---|---|
| 7.3 ms ... rise ↗ and fall ↘ combined | ↗ 3.3 ms rise | 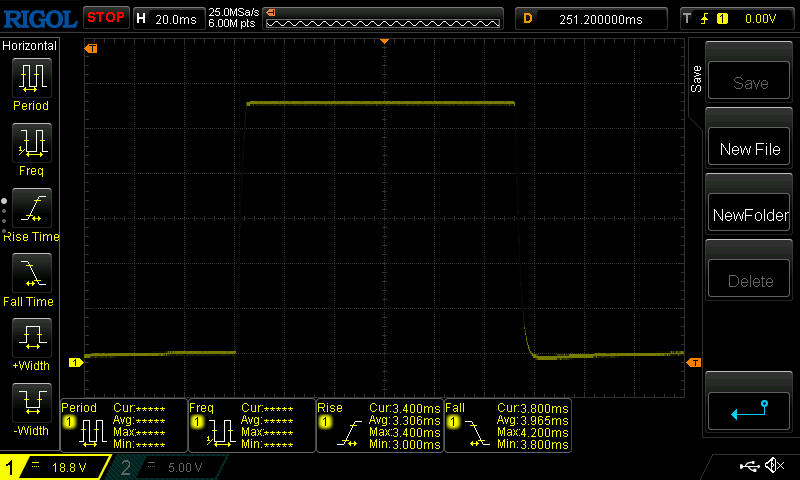 |
| ↘ 4 ms fall | ||
| The screen shows very fast response rates in our tests and should be very well suited for fast-paced gaming. In comparison, all tested devices range from 0.1 (minimum) to 240 (maximum) ms. » 22 % of all devices are better. This means that the measured response time is better than the average of all tested devices (19.8 ms). | ||
| ↔ Response Time 50% Grey to 80% Grey | ||
| 7.8 ms ... rise ↗ and fall ↘ combined | ↗ 3.9 ms rise | 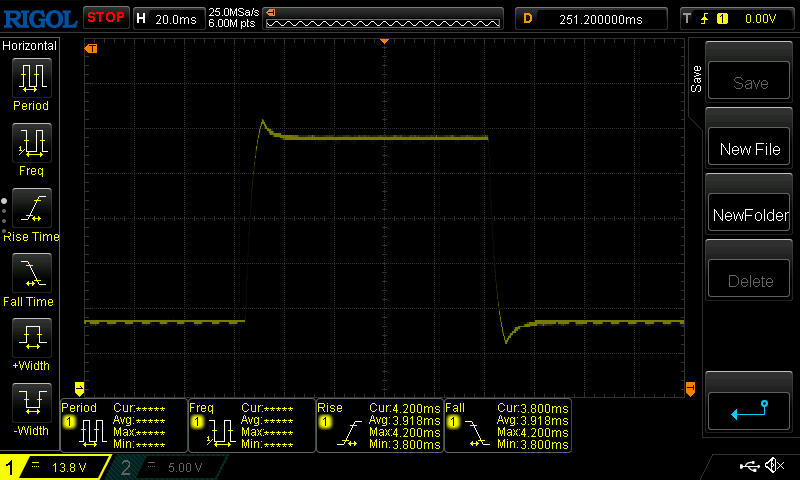 |
| ↘ 3.9 ms fall | ||
| The screen shows very fast response rates in our tests and should be very well suited for fast-paced gaming. In comparison, all tested devices range from 0.165 (minimum) to 636 (maximum) ms. » 21 % of all devices are better. This means that the measured response time is better than the average of all tested devices (31 ms). | ||
Screen Flickering / PWM (Pulse-Width Modulation)
| Screen flickering / PWM not detected | 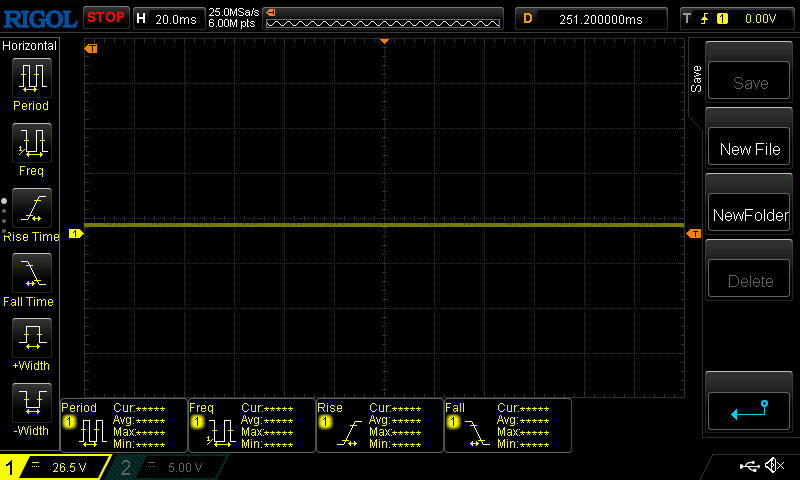 | ||
In comparison: 52 % of all tested devices do not use PWM to dim the display. If PWM was detected, an average of 7754 (minimum: 5 - maximum: 343500) Hz was measured. | |||
视角稳定的 IPS 面板在任何角度都清晰易读。在室外,只要阳光不是太强烈,您就可以阅读显示屏上的内容。

性能 - 英特尔团队为游戏笔记本电脑提供动力
A酷睿 i7-12700H和 Arc A730M为游戏玩家和创作者设计的 Intel NUC X15 LAPAC71H 提供动力。其他选项不详。这款笔记本电脑目前的售价约为 1,050 美元。目前的变体成本约为 1,280 美元。您可能需要考虑 Windows 许可证的额外费用。
测试条件
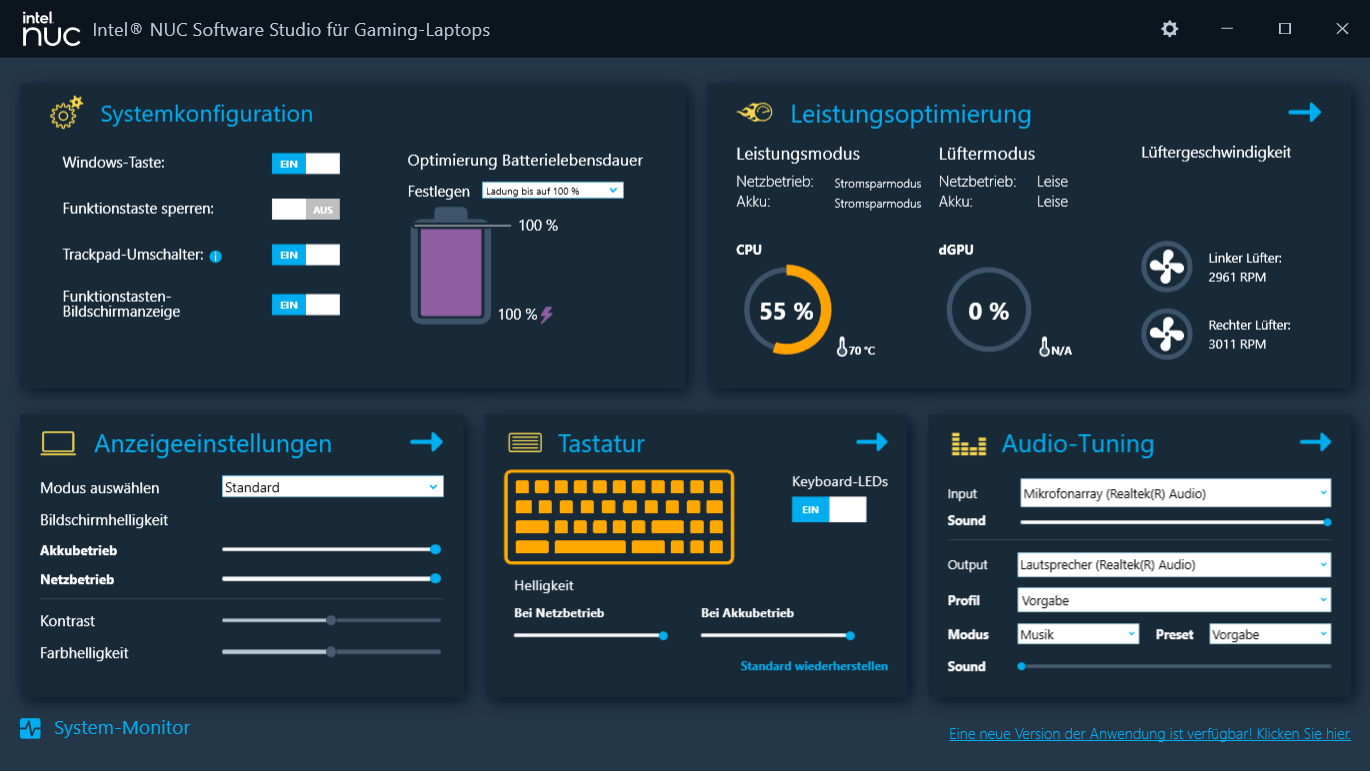
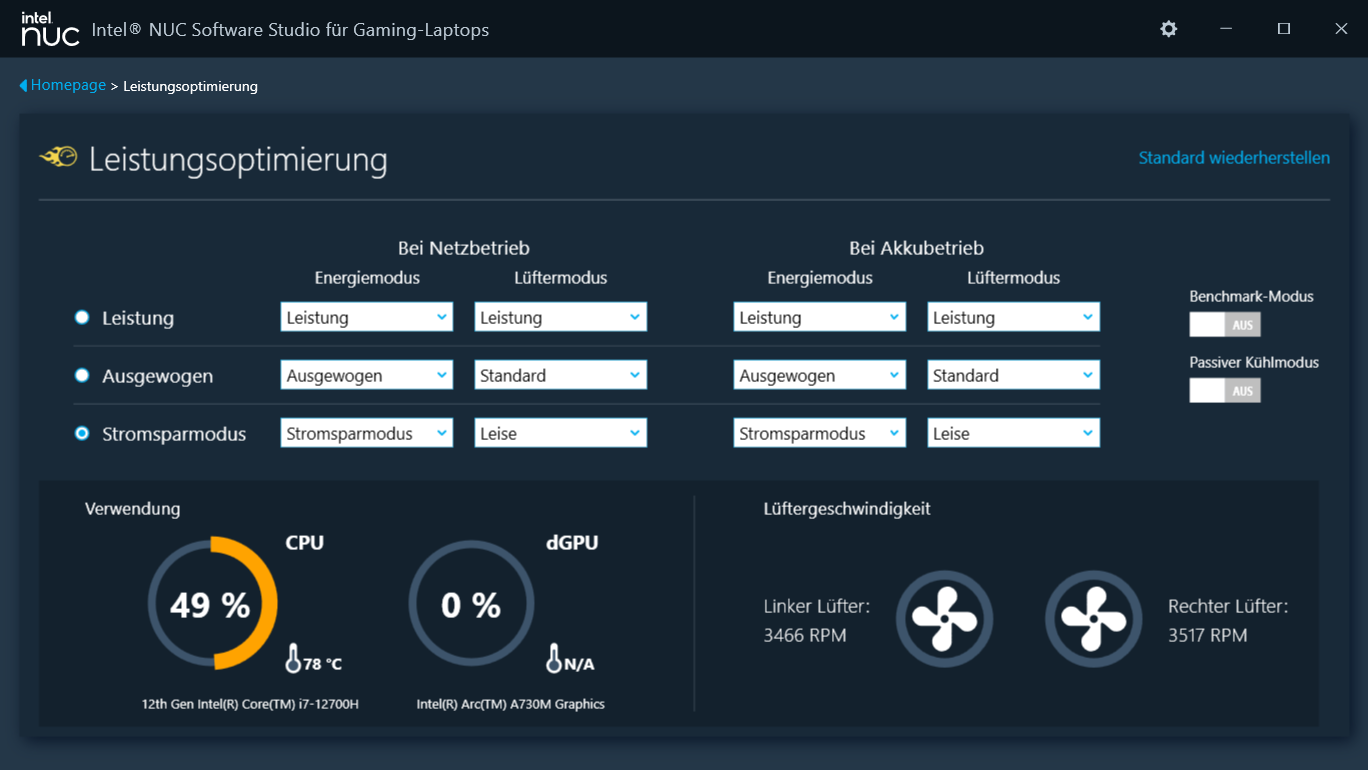
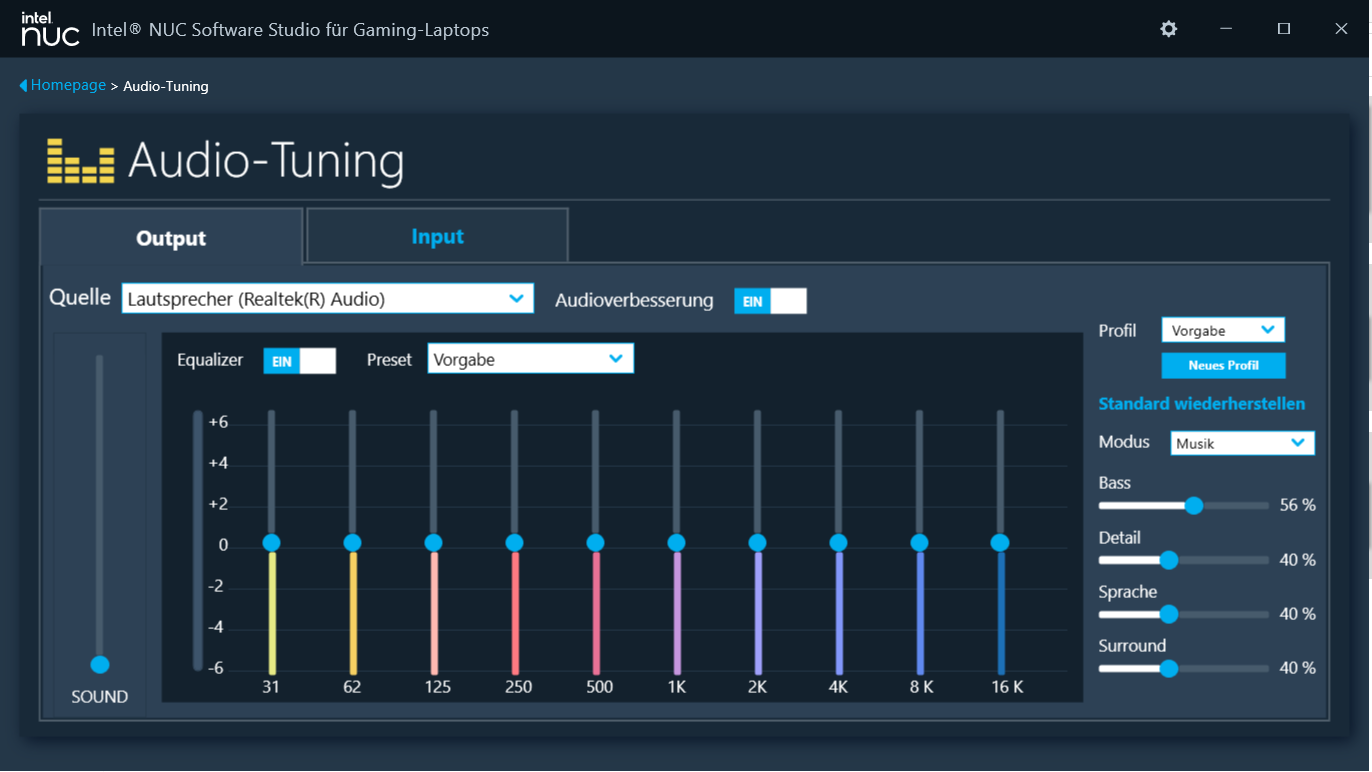
英特尔 NUC 软件工作室(控制中心)提供了三个配置文件来影响其性能和风扇控制(见表)。本测试使用了 "性能"(基准测试)和 "省电模式"(电池测试)配置文件。只有激活 "基准测试模式 "选项后,才能获得最高性能。不过,风扇也会长期全功率运行。
| 性能 | 平衡 | 省电模式 | 基准模式 | |
|---|---|---|---|---|
| 功率限制 1 (HWInfo) | 45 瓦 | 35 瓦 | 35 瓦 | 45 瓦 |
| 功率限制 2 (HWInfo) | 90 瓦 | 80 瓦 | 65 瓦 | 90 瓦 |
| TGP (电弧控制) | 75 瓦 | 65 瓦 | 55 瓦 | 85 瓦 |
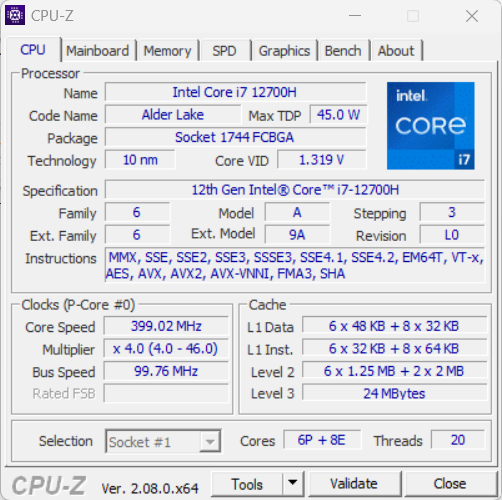
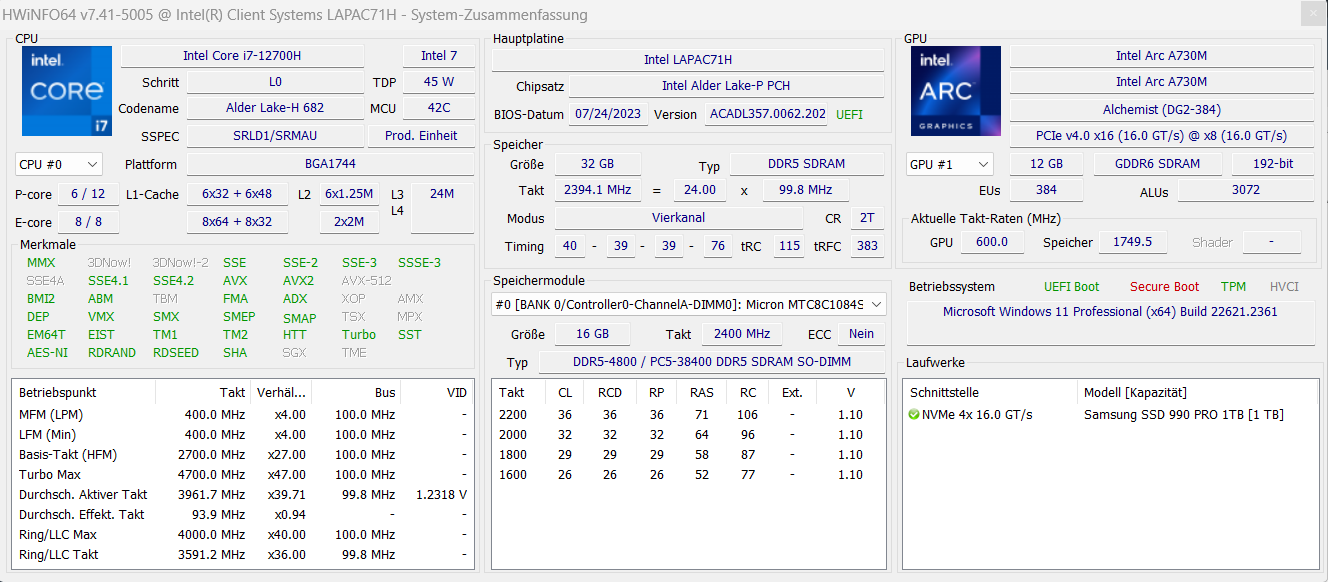
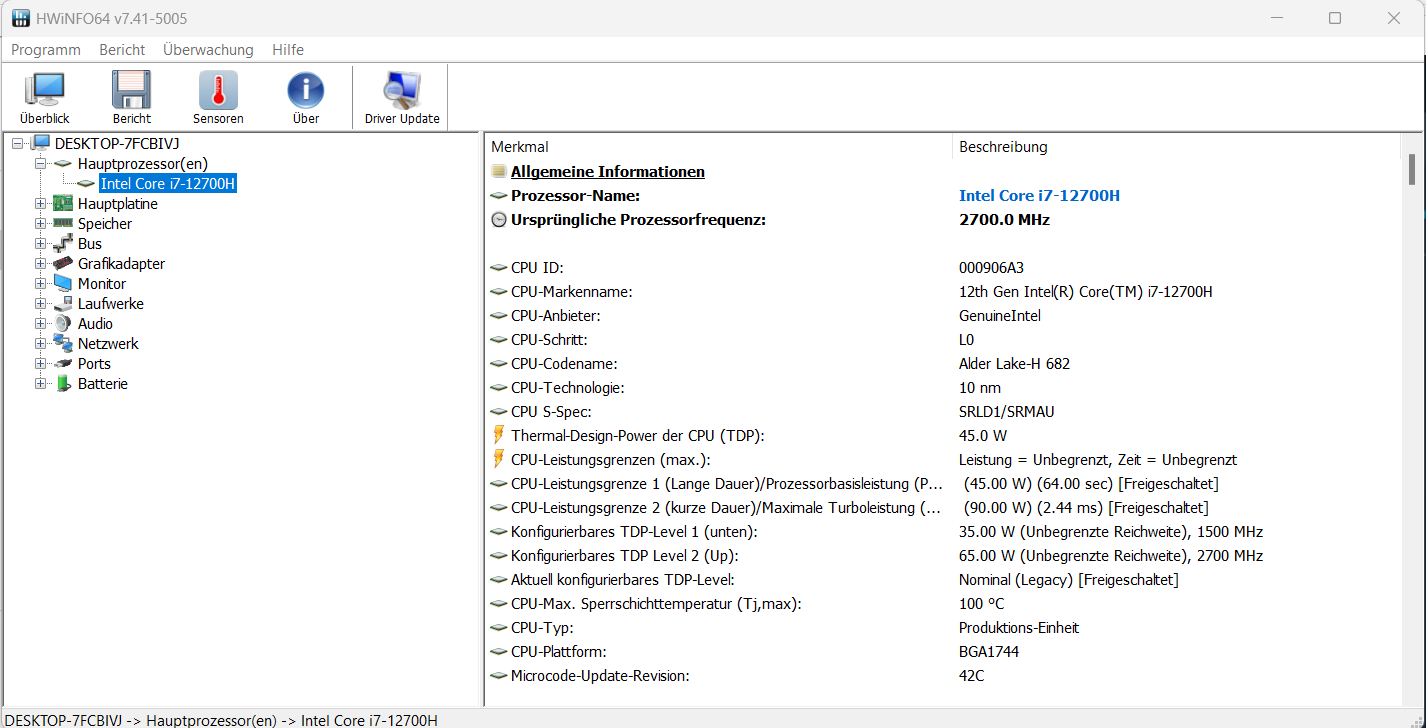
处理器
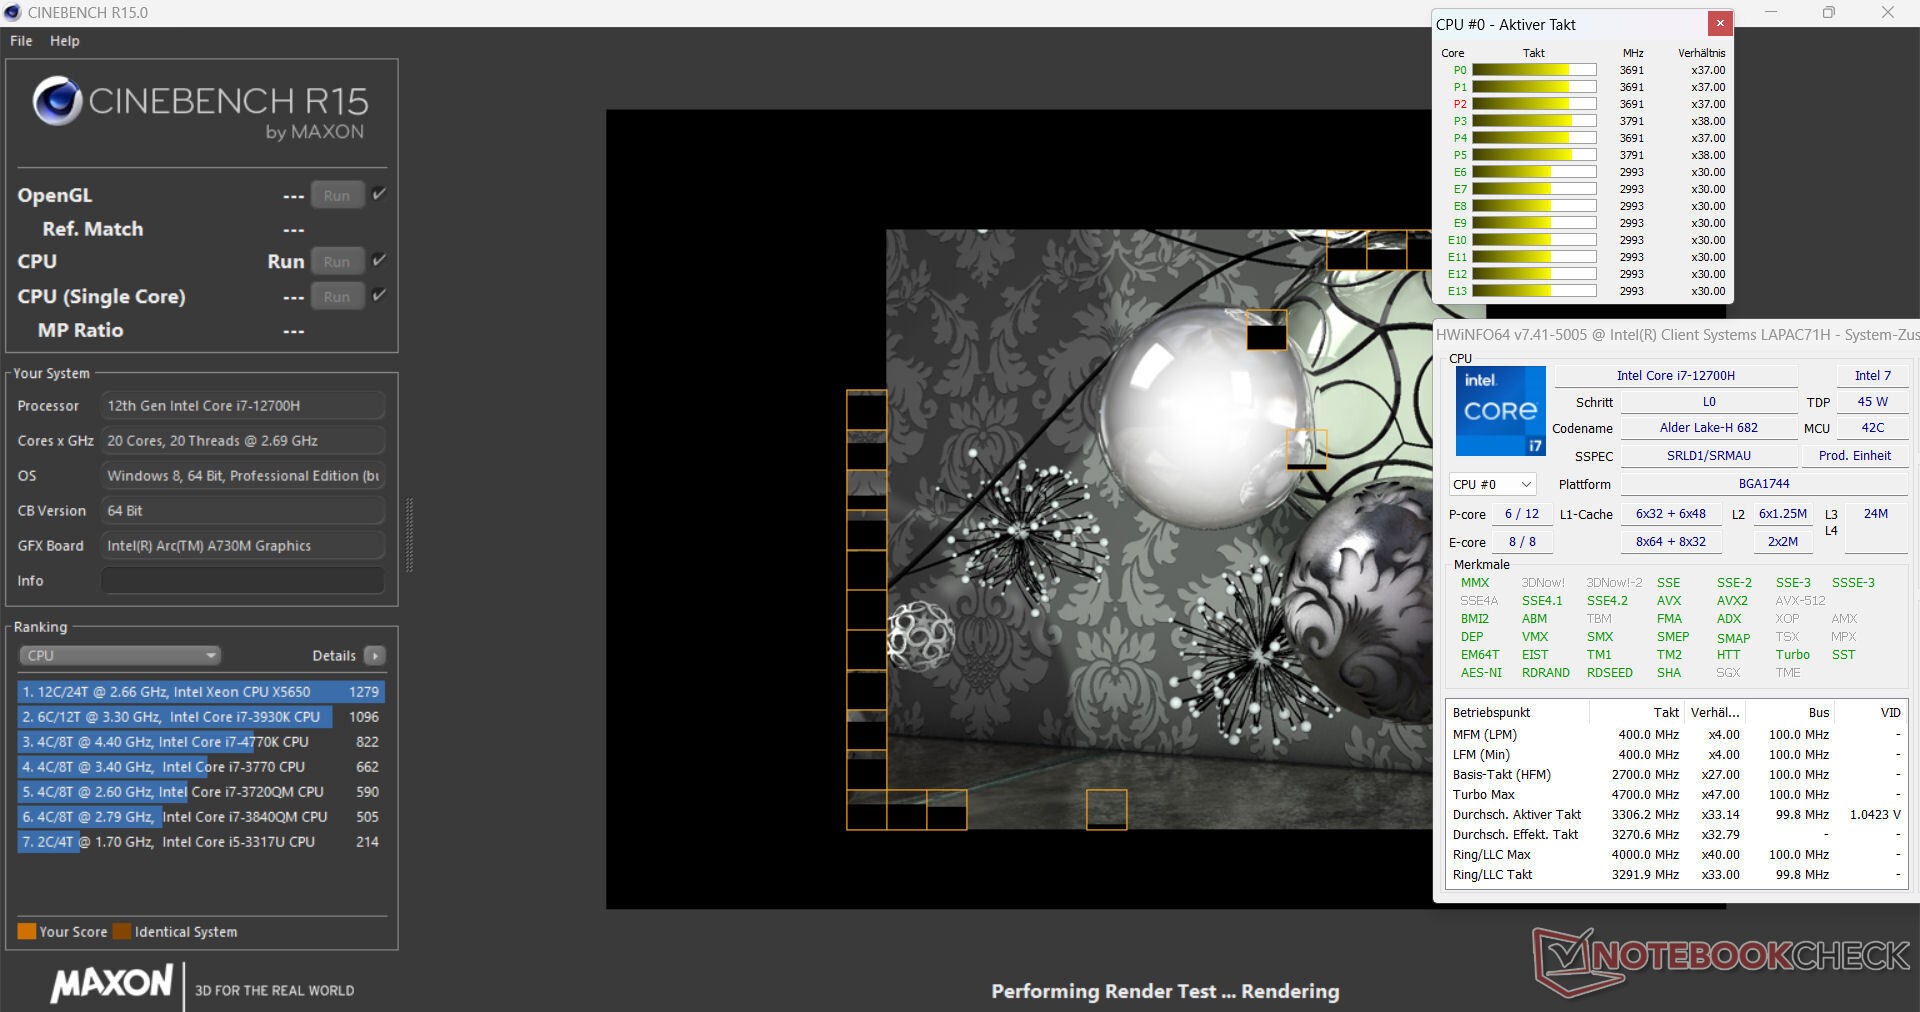
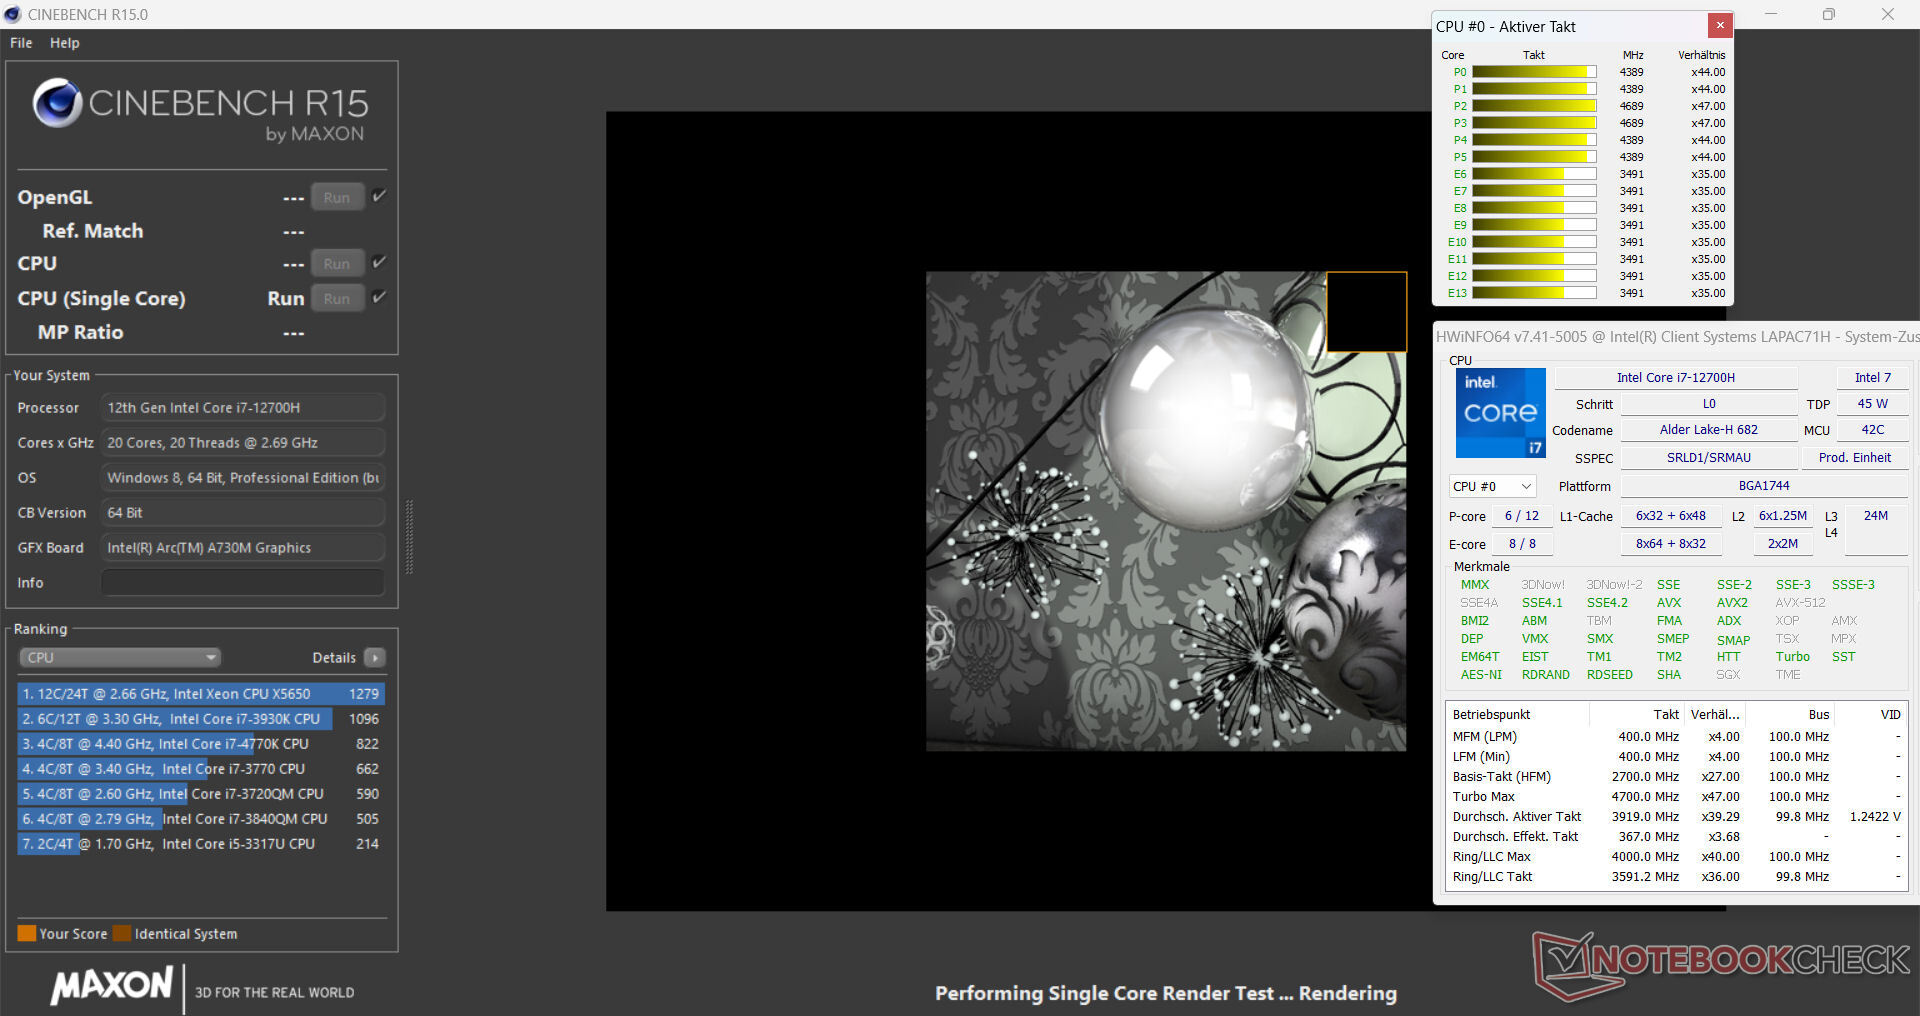
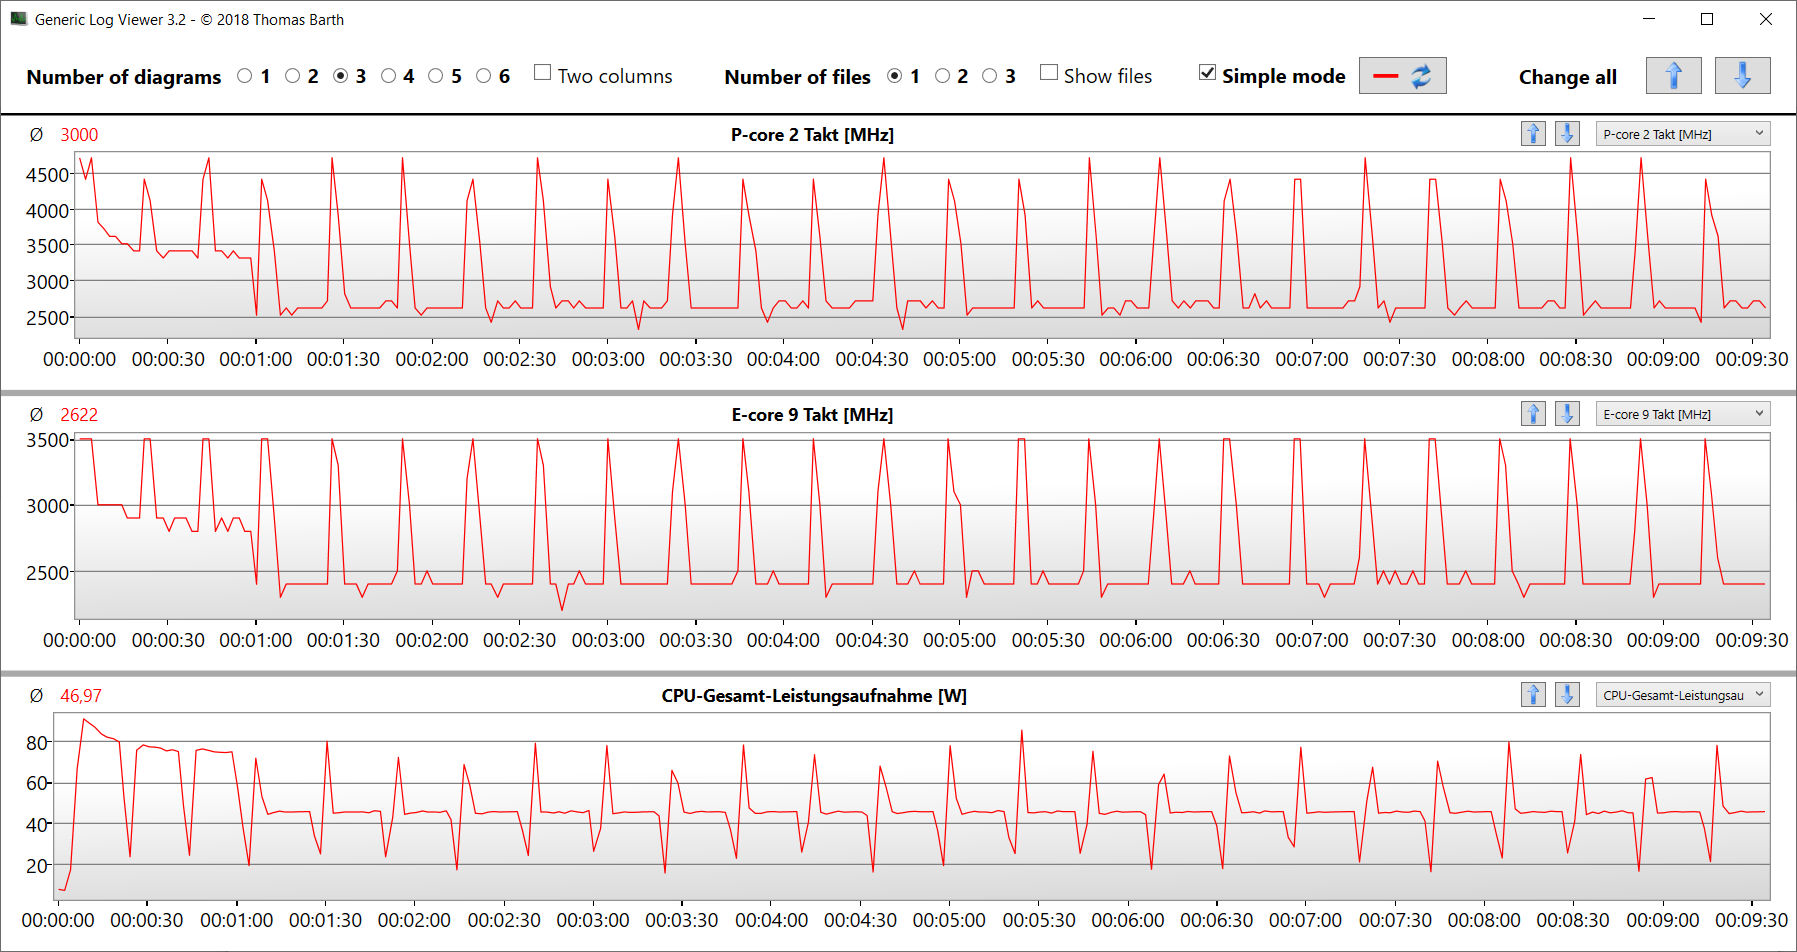
酷睿 i7-12700H 的 14 个 CPU 内核(6P、8E)的最大时钟频率分别为 4.7 GHz(P)和 3.5 GHz(E)。连续的多线程性能(CB15 Loop)导致涡轮时钟在第一次运行到第二次运行时下沉。之后,它保持稳定。
连接电源时,基准测试结果略高于 CPU 平均值。在电池模式下,其相关的单线程性能(213 点)下降幅度小于多线程性能(1012 点)。
Cinebench R15 Multi continuous test
* ... smaller is better
AIDA64: FP32 Ray-Trace | FPU Julia | CPU SHA3 | CPU Queen | FPU SinJulia | FPU Mandel | CPU AES | CPU ZLib | FP64 Ray-Trace | CPU PhotoWorxx
| Performance rating | |
| Average of class Multimedia | |
| Asus TUF A15 FA507 | |
| Intel NUC X15 LAPAC71H | |
| Dell Inspiron 16 Plus 7630 | |
| Gigabyte G5 KE | |
| Asus VivoBook Pro 16 | |
| MSI Cyborg 15 A12VF | |
| Average Intel Core i7-12700H | |
| AIDA64 / FP32 Ray-Trace | |
| Average of class Multimedia (2214 - 50388, n=53, last 2 years) | |
| Asus TUF A15 FA507 | |
| Asus VivoBook Pro 16 | |
| Dell Inspiron 16 Plus 7630 | |
| Intel NUC X15 LAPAC71H | |
| MSI Cyborg 15 A12VF | |
| Gigabyte G5 KE | |
| Average Intel Core i7-12700H (2585 - 17957, n=64) | |
| AIDA64 / FPU Julia | |
| Asus TUF A15 FA507 | |
| Average of class Multimedia (12867 - 201874, n=54, last 2 years) | |
| Asus VivoBook Pro 16 | |
| MSI Cyborg 15 A12VF | |
| Dell Inspiron 16 Plus 7630 | |
| Gigabyte G5 KE | |
| Intel NUC X15 LAPAC71H | |
| Average Intel Core i7-12700H (12439 - 90760, n=64) | |
| AIDA64 / CPU SHA3 | |
| Average of class Multimedia (626 - 8623, n=54, last 2 years) | |
| Asus TUF A15 FA507 | |
| Asus VivoBook Pro 16 | |
| Gigabyte G5 KE | |
| Average Intel Core i7-12700H (833 - 4242, n=64) | |
| Dell Inspiron 16 Plus 7630 | |
| Intel NUC X15 LAPAC71H | |
| MSI Cyborg 15 A12VF | |
| AIDA64 / CPU Queen | |
| Dell Inspiron 16 Plus 7630 | |
| Asus TUF A15 FA507 | |
| Asus VivoBook Pro 16 | |
| Intel NUC X15 LAPAC71H | |
| Average Intel Core i7-12700H (57923 - 103202, n=63) | |
| MSI Cyborg 15 A12VF | |
| Gigabyte G5 KE | |
| Average of class Multimedia (13483 - 181505, n=41, last 2 years) | |
| AIDA64 / FPU SinJulia | |
| Asus TUF A15 FA507 | |
| Average Intel Core i7-12700H (3249 - 9939, n=64) | |
| Asus VivoBook Pro 16 | |
| Dell Inspiron 16 Plus 7630 | |
| Average of class Multimedia (886 - 28794, n=54, last 2 years) | |
| MSI Cyborg 15 A12VF | |
| Intel NUC X15 LAPAC71H | |
| Gigabyte G5 KE | |
| AIDA64 / FPU Mandel | |
| Asus TUF A15 FA507 | |
| Average of class Multimedia (6395 - 105740, n=53, last 2 years) | |
| Asus VivoBook Pro 16 | |
| Dell Inspiron 16 Plus 7630 | |
| Gigabyte G5 KE | |
| Intel NUC X15 LAPAC71H | |
| MSI Cyborg 15 A12VF | |
| Average Intel Core i7-12700H (7135 - 44760, n=64) | |
| AIDA64 / CPU AES | |
| Intel NUC X15 LAPAC71H | |
| Gigabyte G5 KE | |
| Average Intel Core i7-12700H (31839 - 144360, n=64) | |
| Asus TUF A15 FA507 | |
| Asus VivoBook Pro 16 | |
| MSI Cyborg 15 A12VF | |
| Average of class Multimedia (8171 - 126790, n=54, last 2 years) | |
| Dell Inspiron 16 Plus 7630 | |
| AIDA64 / CPU ZLib | |
| Average of class Multimedia (143.8 - 2022, n=54, last 2 years) | |
| Average Intel Core i7-12700H (305 - 1171, n=64) | |
| Asus VivoBook Pro 16 | |
| Gigabyte G5 KE | |
| MSI Cyborg 15 A12VF | |
| Intel NUC X15 LAPAC71H | |
| Dell Inspiron 16 Plus 7630 | |
| Asus TUF A15 FA507 | |
| AIDA64 / FP64 Ray-Trace | |
| Average of class Multimedia (1014 - 26875, n=54, last 2 years) | |
| Asus TUF A15 FA507 | |
| Asus VivoBook Pro 16 | |
| Dell Inspiron 16 Plus 7630 | |
| Gigabyte G5 KE | |
| Intel NUC X15 LAPAC71H | |
| MSI Cyborg 15 A12VF | |
| Average Intel Core i7-12700H (1437 - 9692, n=64) | |
| AIDA64 / CPU PhotoWorxx | |
| Average of class Multimedia (8187 - 88154, n=54, last 2 years) | |
| Intel NUC X15 LAPAC71H | |
| Dell Inspiron 16 Plus 7630 | |
| MSI Cyborg 15 A12VF | |
| Average Intel Core i7-12700H (12863 - 52207, n=64) | |
| Gigabyte G5 KE | |
| Asus TUF A15 FA507 | |
| Asus VivoBook Pro 16 | |
系统性能
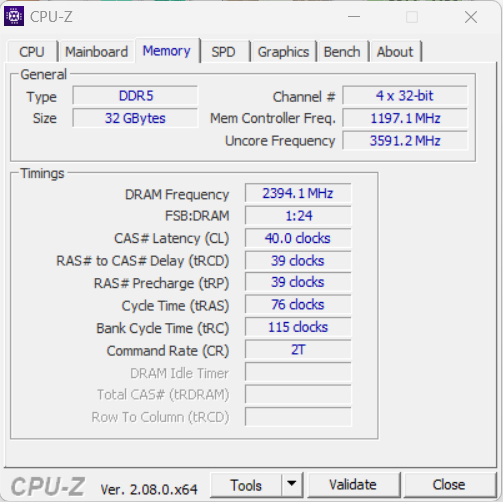
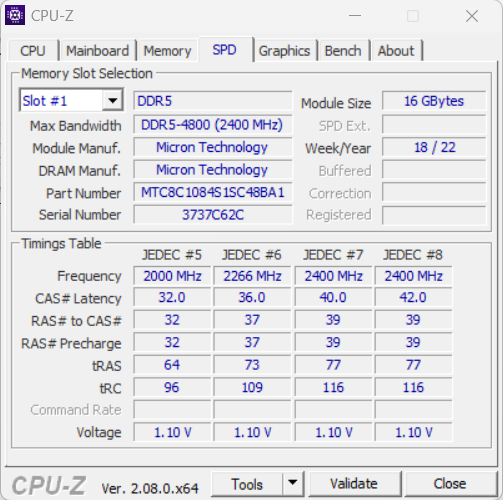
运行流畅的系统并不缺乏计算能力。笔记本电脑在处理游戏、流媒体和渲染时没有任何问题。内存的传输速率达到了 DDR5-4800 内存的正常水平。
CrossMark: Overall | Productivity | Creativity | Responsiveness
| PCMark 10 / Score | |
| Average of class Multimedia (4325 - 10386, n=52, last 2 years) | |
| Dell Inspiron 16 Plus 7630 | |
| Asus TUF A15 FA507 | |
| Gigabyte G5 KE | |
| MSI Cyborg 15 A12VF | |
| Intel NUC X15 LAPAC71H | |
| Average Intel Core i7-12700H, Intel Arc A730M (6830 - 6845, n=2) | |
| Asus VivoBook Pro 16 | |
| PCMark 10 / Essentials | |
| Dell Inspiron 16 Plus 7630 | |
| Gigabyte G5 KE | |
| Average Intel Core i7-12700H, Intel Arc A730M (10529 - 11116, n=2) | |
| MSI Cyborg 15 A12VF | |
| Asus TUF A15 FA507 | |
| Intel NUC X15 LAPAC71H | |
| Average of class Multimedia (8025 - 11664, n=51, last 2 years) | |
| Asus VivoBook Pro 16 | |
| PCMark 10 / Productivity | |
| Average of class Multimedia (7323 - 18233, n=51, last 2 years) | |
| MSI Cyborg 15 A12VF | |
| Gigabyte G5 KE | |
| Dell Inspiron 16 Plus 7630 | |
| Asus TUF A15 FA507 | |
| Asus VivoBook Pro 16 | |
| Average Intel Core i7-12700H, Intel Arc A730M (7070 - 7260, n=2) | |
| Intel NUC X15 LAPAC71H | |
| PCMark 10 / Digital Content Creation | |
| Intel NUC X15 LAPAC71H | |
| Dell Inspiron 16 Plus 7630 | |
| Average Intel Core i7-12700H, Intel Arc A730M (10714 - 11691, n=2) | |
| Average of class Multimedia (3651 - 16240, n=51, last 2 years) | |
| Asus TUF A15 FA507 | |
| Gigabyte G5 KE | |
| Asus VivoBook Pro 16 | |
| MSI Cyborg 15 A12VF | |
| CrossMark / Overall | |
| Intel NUC X15 LAPAC71H | |
| Average Intel Core i7-12700H, Intel Arc A730M (n=1) | |
| Average of class Multimedia (866 - 2728, n=60, last 2 years) | |
| Dell Inspiron 16 Plus 7630 | |
| MSI Cyborg 15 A12VF | |
| Gigabyte G5 KE | |
| Asus VivoBook Pro 16 | |
| Asus TUF A15 FA507 | |
| CrossMark / Productivity | |
| Intel NUC X15 LAPAC71H | |
| Average Intel Core i7-12700H, Intel Arc A730M (n=1) | |
| Average of class Multimedia (931 - 2489, n=60, last 2 years) | |
| Dell Inspiron 16 Plus 7630 | |
| Gigabyte G5 KE | |
| MSI Cyborg 15 A12VF | |
| Asus VivoBook Pro 16 | |
| Asus TUF A15 FA507 | |
| CrossMark / Creativity | |
| Average of class Multimedia (907 - 3465, n=60, last 2 years) | |
| Dell Inspiron 16 Plus 7630 | |
| Intel NUC X15 LAPAC71H | |
| Average Intel Core i7-12700H, Intel Arc A730M (n=1) | |
| MSI Cyborg 15 A12VF | |
| Gigabyte G5 KE | |
| Asus TUF A15 FA507 | |
| Asus VivoBook Pro 16 | |
| CrossMark / Responsiveness | |
| Intel NUC X15 LAPAC71H | |
| Average Intel Core i7-12700H, Intel Arc A730M (n=1) | |
| Gigabyte G5 KE | |
| Asus VivoBook Pro 16 | |
| MSI Cyborg 15 A12VF | |
| Dell Inspiron 16 Plus 7630 | |
| Average of class Multimedia (605 - 2024, n=60, last 2 years) | |
| Asus TUF A15 FA507 | |
| PCMark 10 Score | 6845 points | |
Help | ||
| AIDA64 / Memory Copy | |
| Average of class Multimedia (11299 - 132135, n=54, last 2 years) | |
| Intel NUC X15 LAPAC71H | |
| Dell Inspiron 16 Plus 7630 | |
| MSI Cyborg 15 A12VF | |
| Average Intel Core i7-12700H (25615 - 80511, n=64) | |
| Asus TUF A15 FA507 | |
| Gigabyte G5 KE | |
| Asus VivoBook Pro 16 | |
| AIDA64 / Memory Read | |
| Average of class Multimedia (11624 - 174586, n=54, last 2 years) | |
| Dell Inspiron 16 Plus 7630 | |
| Intel NUC X15 LAPAC71H | |
| MSI Cyborg 15 A12VF | |
| Average Intel Core i7-12700H (25586 - 79442, n=64) | |
| Asus TUF A15 FA507 | |
| Gigabyte G5 KE | |
| Asus VivoBook Pro 16 | |
| AIDA64 / Memory Write | |
| Average of class Multimedia (11755 - 134998, n=54, last 2 years) | |
| Intel NUC X15 LAPAC71H | |
| Dell Inspiron 16 Plus 7630 | |
| MSI Cyborg 15 A12VF | |
| Asus TUF A15 FA507 | |
| Average Intel Core i7-12700H (23679 - 88660, n=64) | |
| Gigabyte G5 KE | |
| Asus VivoBook Pro 16 | |
| AIDA64 / Memory Latency | |
| Average of class Multimedia (7 - 535, n=53, last 2 years) | |
| Gigabyte G5 KE | |
| Dell Inspiron 16 Plus 7630 | |
| Asus VivoBook Pro 16 | |
| MSI Cyborg 15 A12VF | |
| Intel NUC X15 LAPAC71H | |
| Asus TUF A15 FA507 | |
| Average Intel Core i7-12700H (76.2 - 133.9, n=62) | |
* ... smaller is better
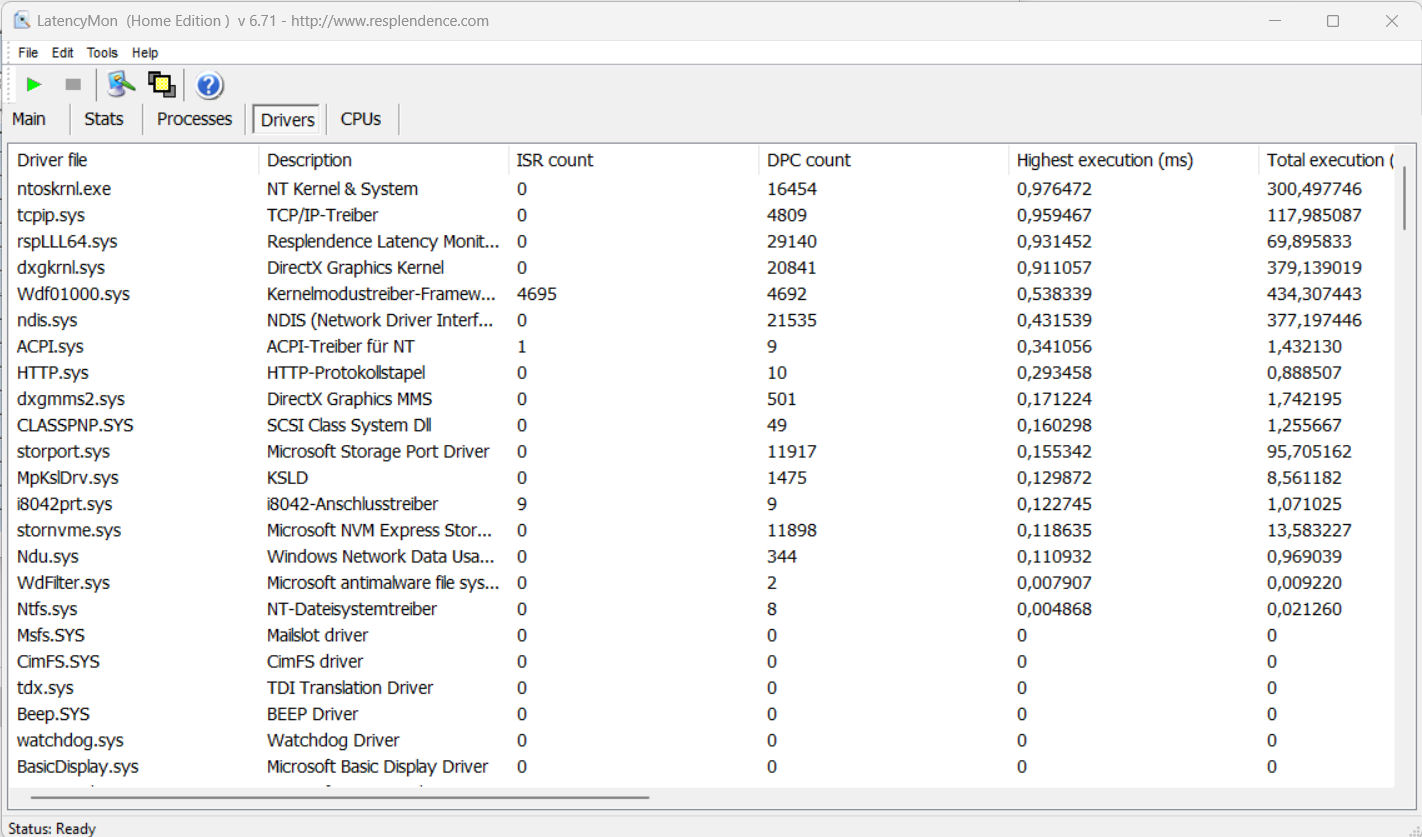
DPC 延迟
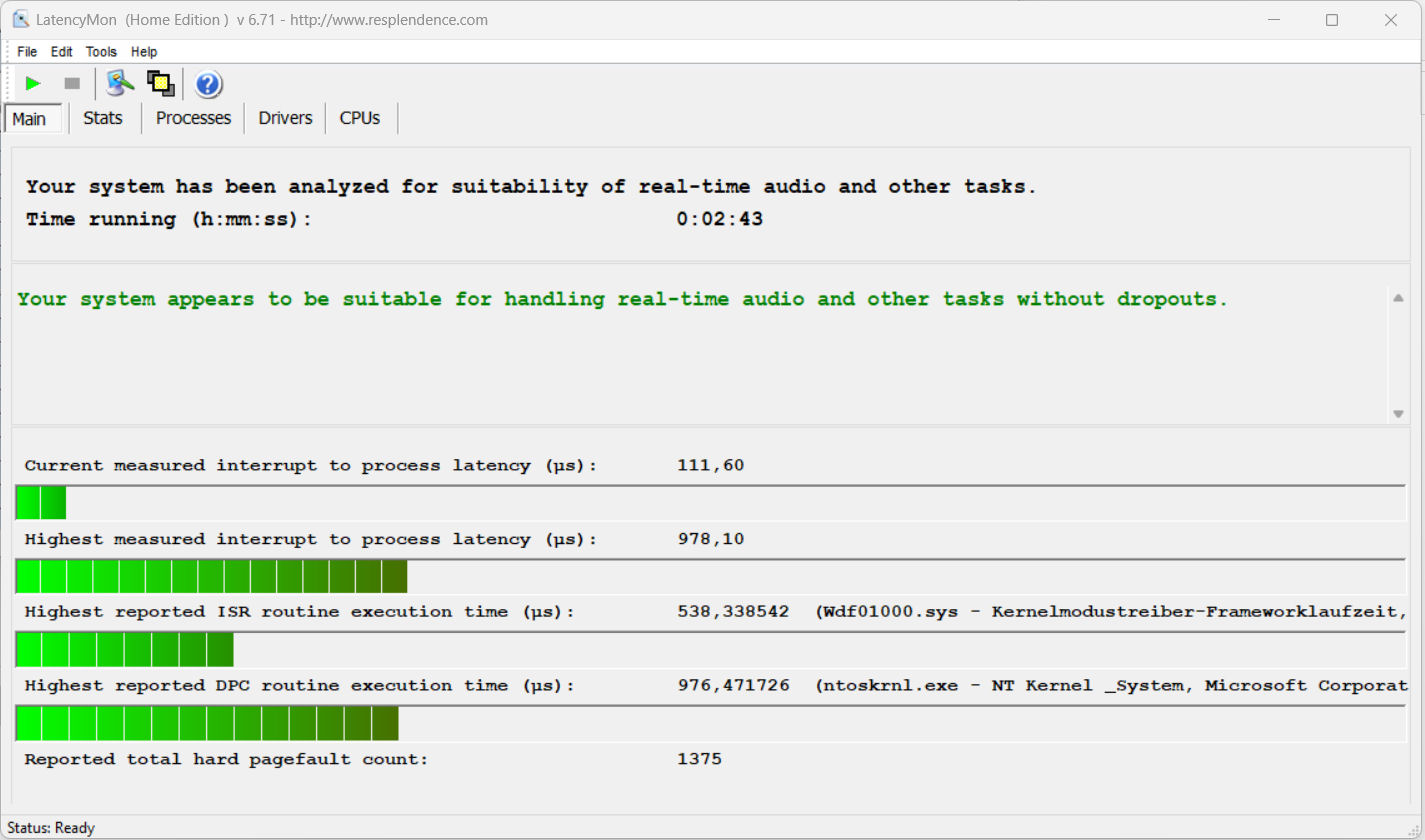
标准延迟监控测试(网上冲浪、4K 视频播放、Prime95 高负载)未发现任何异常。该系统似乎适合实时视频和音频编辑。未来的软件更新可能会带来改进,甚至降低性能。
| DPC Latencies / LatencyMon - interrupt to process latency (max), Web, Youtube, Prime95 | |
| Asus VivoBook Pro 16 | |
| MSI Cyborg 15 A12VF | |
| Dell Inspiron 16 Plus 7630 | |
| Gigabyte G5 KE | |
| Intel NUC X15 LAPAC71H | |
* ... smaller is better
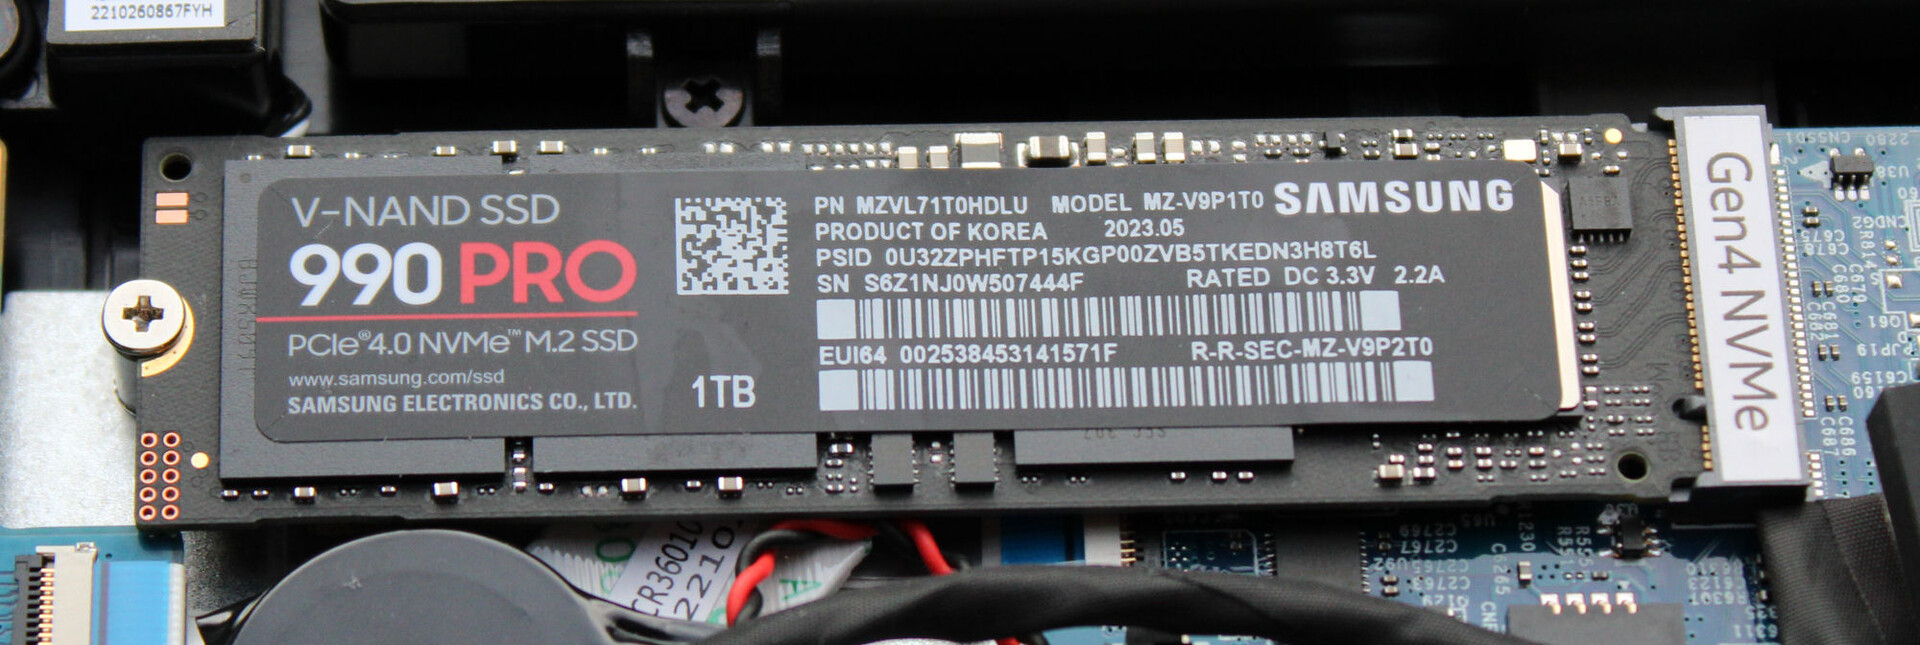
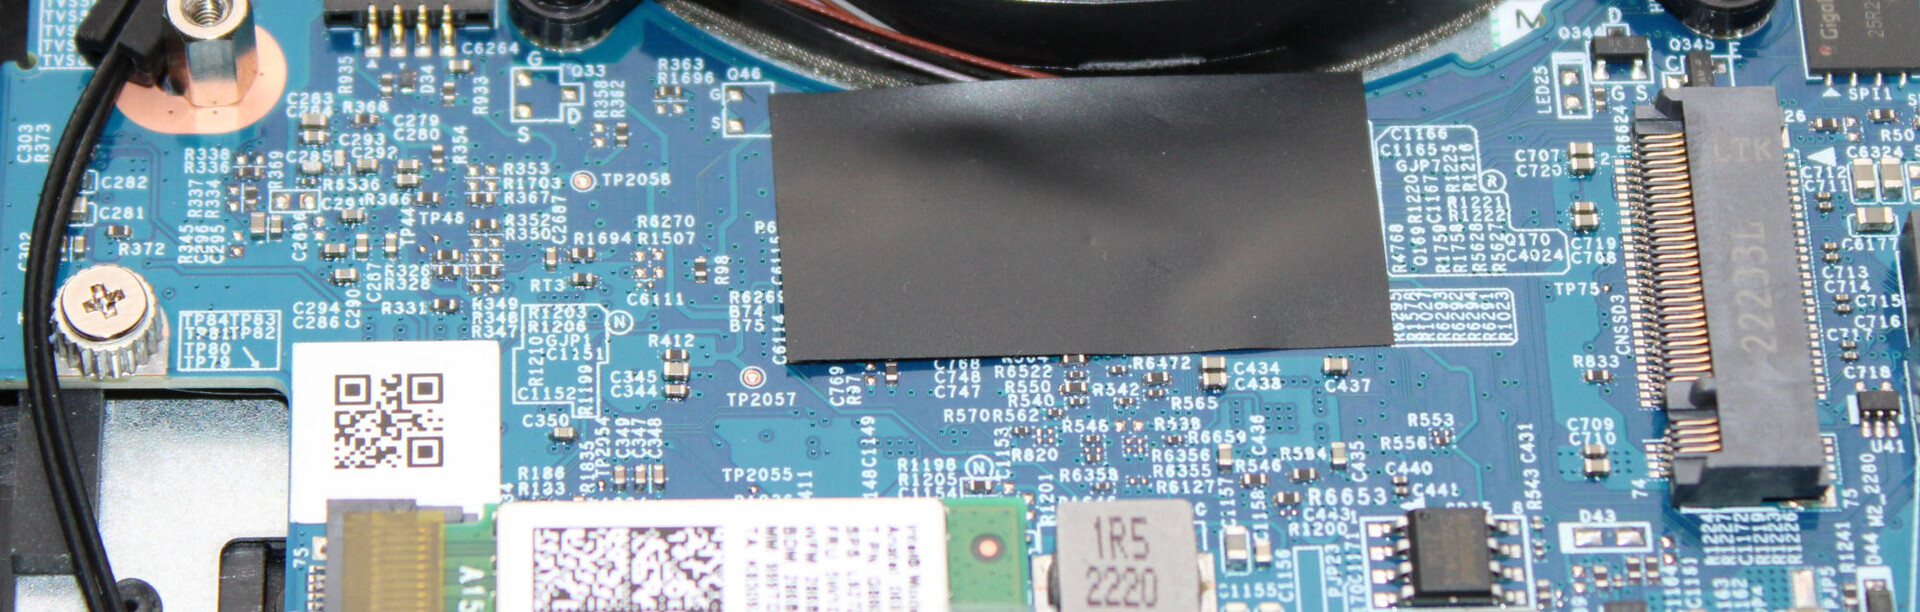
存储设备
笔记本电脑可容纳两个 M.2-2280 SSD(1 个 PCIe 4.0、1 个 PCIe 3.0/SATA)。支持 RAID-0/1。我们测试设备中的三星固态硬盘(1 TB、PCIe 4、M.2-2280)具有出色的传输速率。正面:没有出现热节流现象。

* ... smaller is better
Reading continuous performance: DiskSpd Read Loop, Queue Depth 8
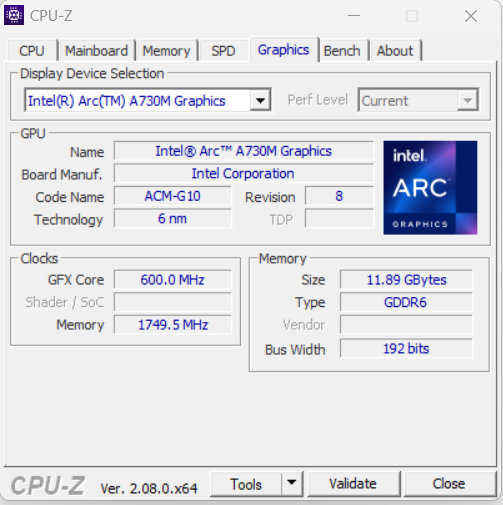
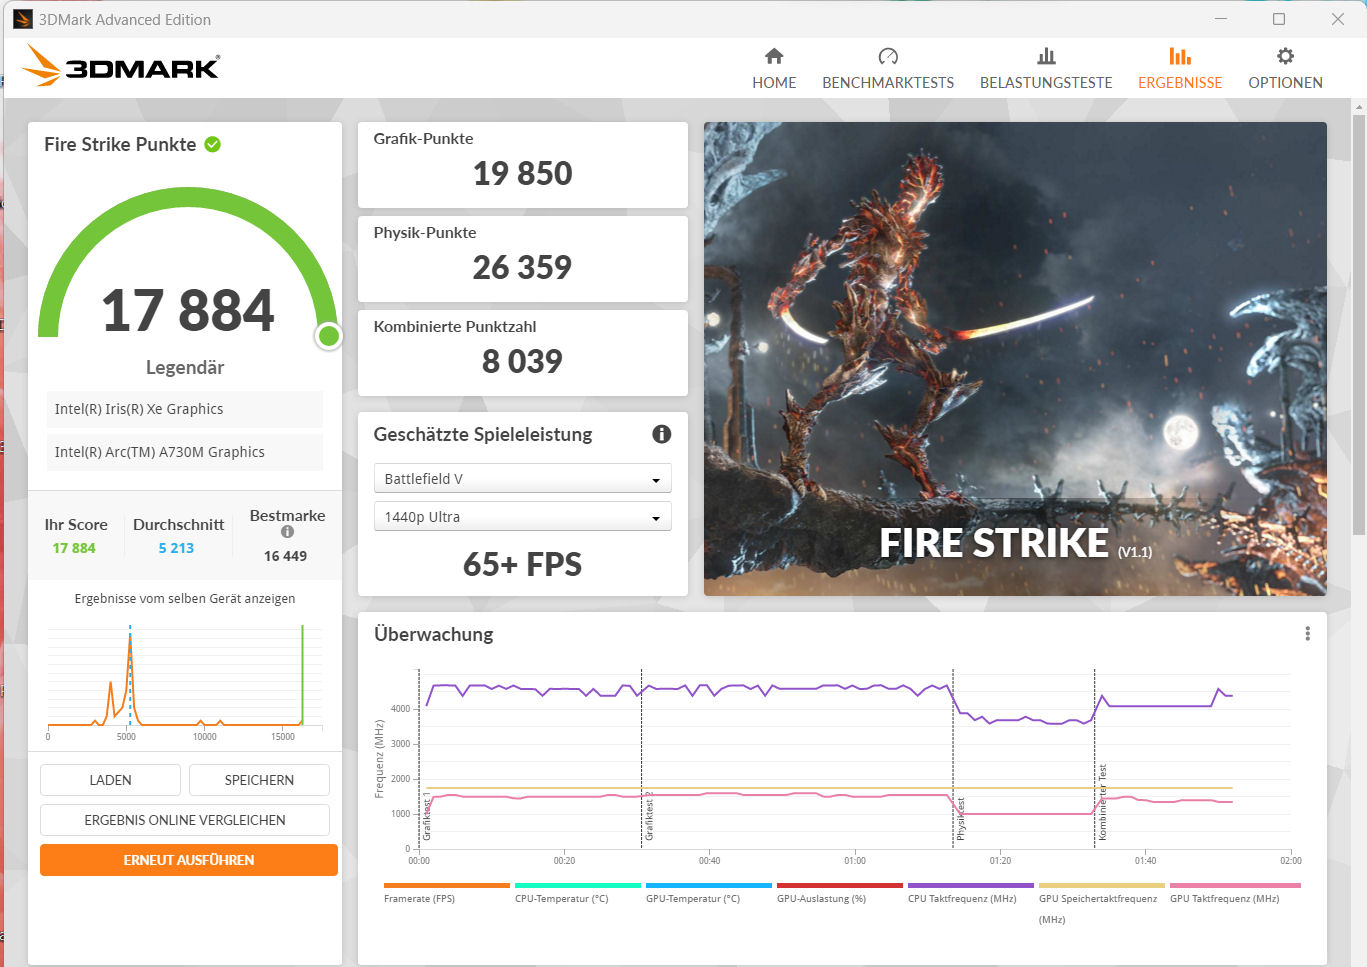
图形卡
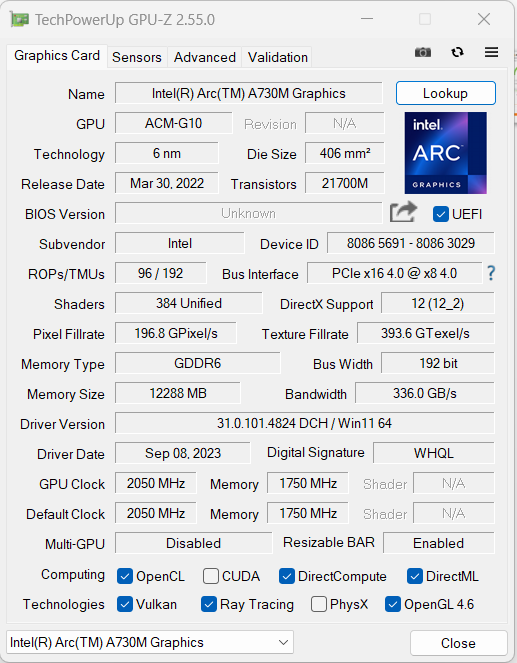
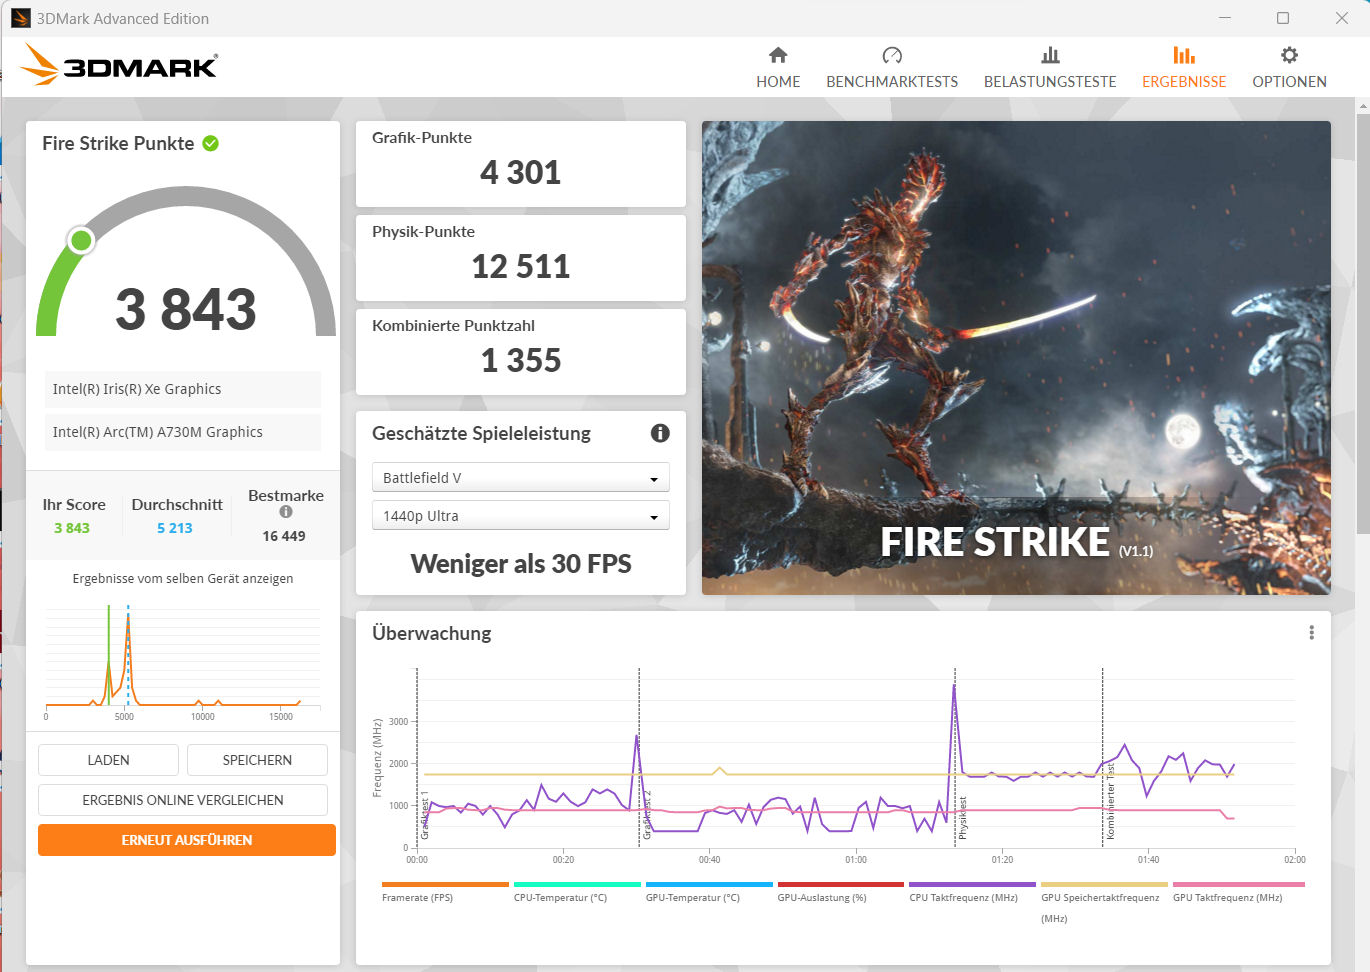
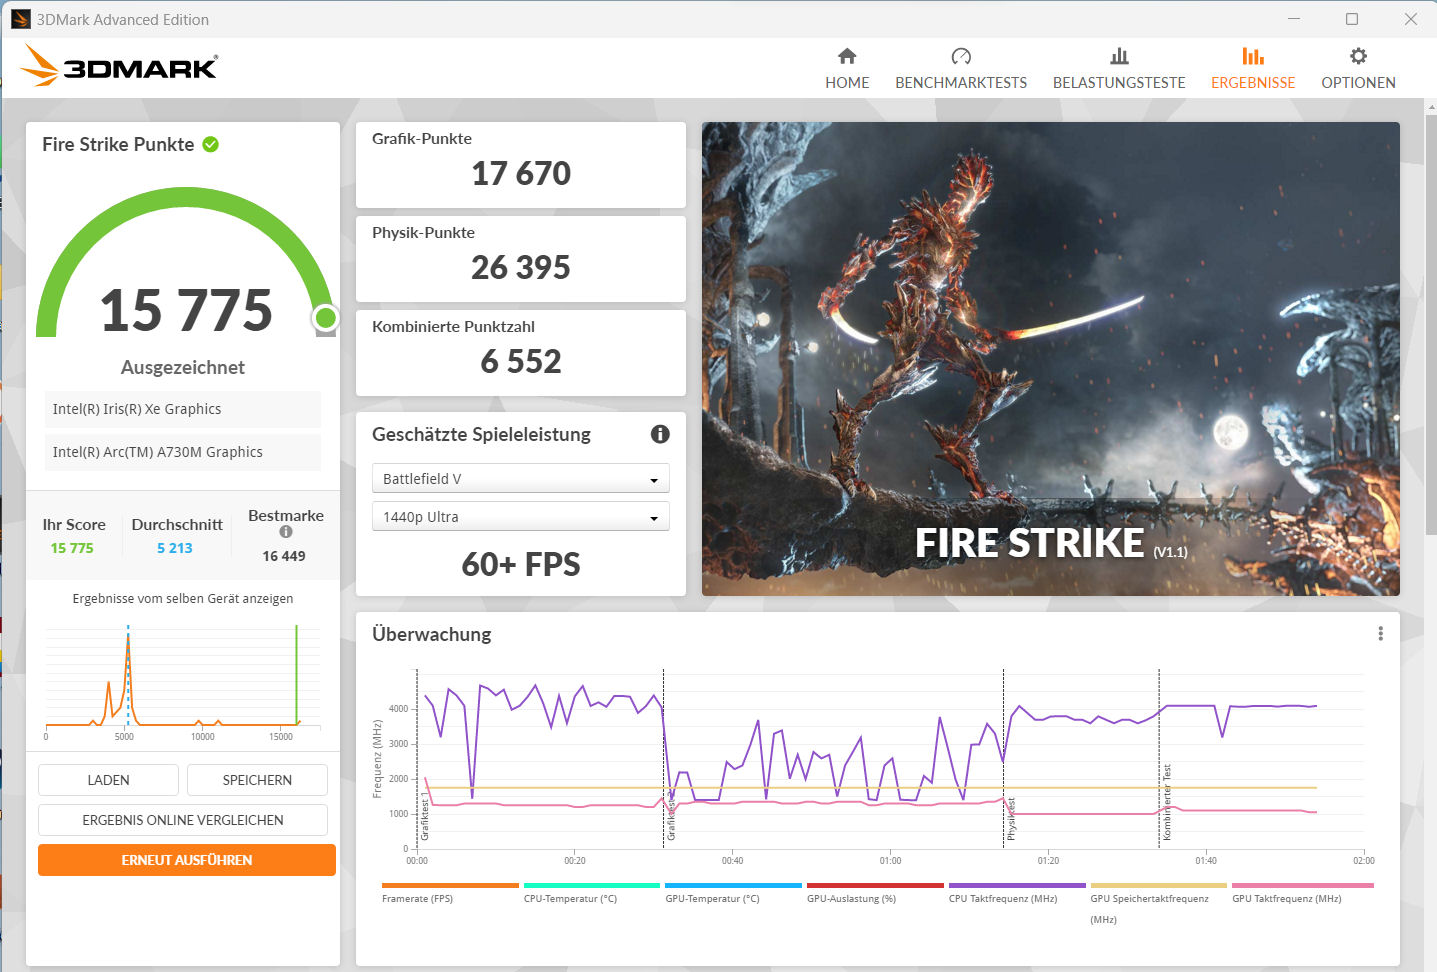
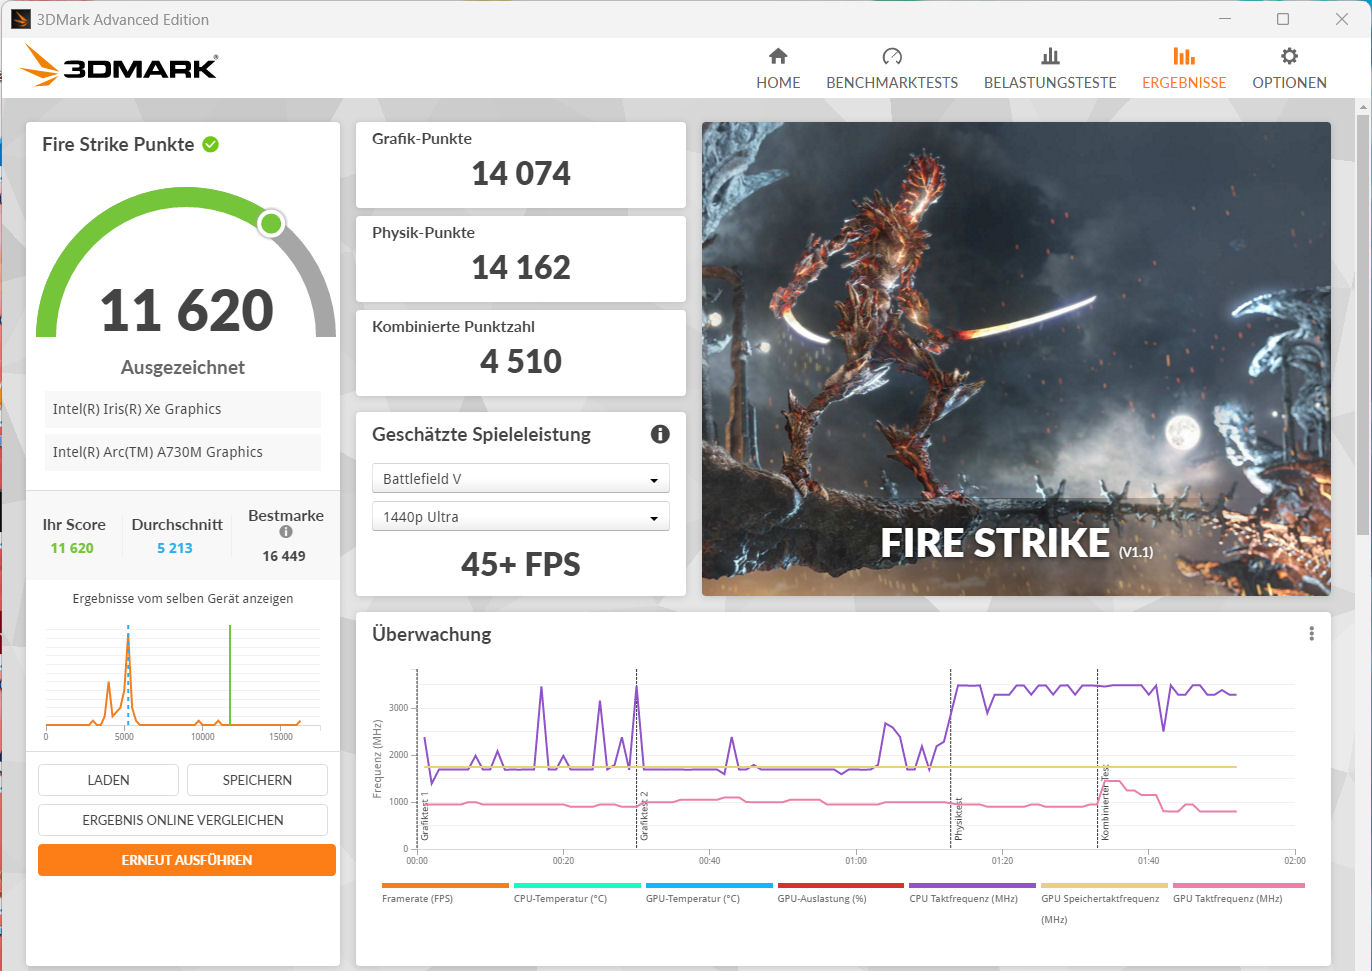
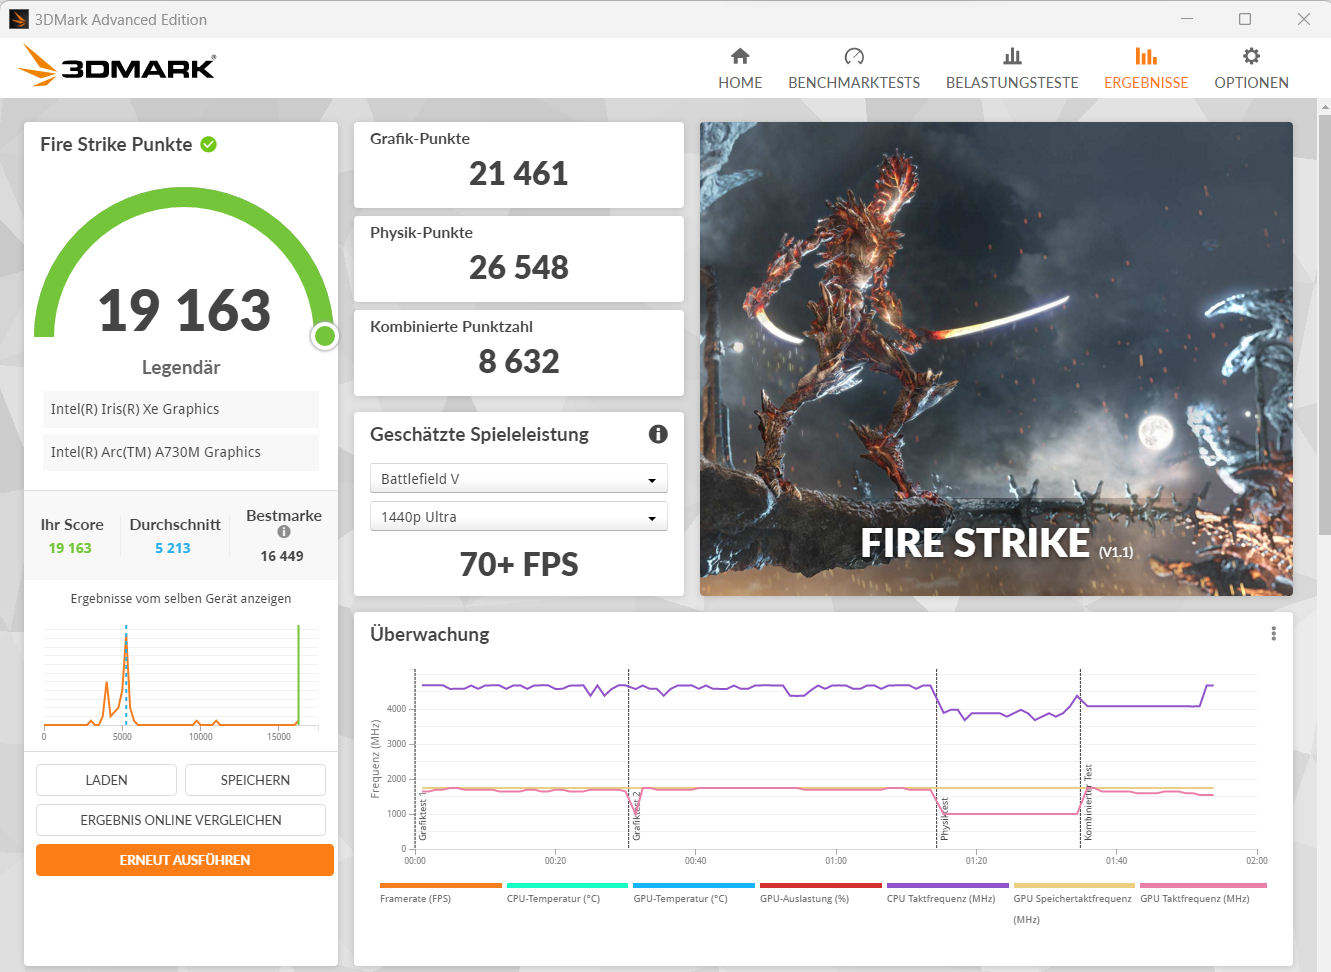
弧形Arc A730M- 英特尔第二强大的移动 DGPU - 最大 TGP 为 85 瓦,依靠超快的 GDDR6 显存(12,288 GB),最高时钟频率可达 2.05 GHz。该图形核心适用于中高设置下的全高清游戏。要求不高的游戏允许更多。
图形处理器的性能很大程度上取决于使用哪种性能模式:性能 "配置文件导致基准测试结果低于(合成基准测试)或与之前确定的 GPU 平均值相当(游戏实践)。当 "基准模式 "激活时,性能达到最高(TGP:85 瓦)。总而言之,GPU 的性能介于GeForce RTX 3050和RTX 3060之间。
| 3DMark Performance rating - Percent | |
| Asus TUF A15 FA507 -1! | |
| Gigabyte G5 KE | |
| MSI Cyborg 15 A12VF | |
| Dell Inspiron 16 Plus 7630 -1! | |
| Average Intel Arc A730M | |
| Intel NUC X15 LAPAC71H | |
| Average of class Multimedia | |
| Asus VivoBook Pro 16 | |
| 3DMark 11 Performance | 23160 points | |
| 3DMark Cloud Gate Standard Score | 46415 points | |
| 3DMark Fire Strike Score | 17884 points | |
| 3DMark Time Spy Score | 7653 points | |
Help | ||
* ... smaller is better
| The Witcher 3 - 1920x1080 Ultra Graphics & Postprocessing (HBAO+) | |
| Dell Inspiron 16 Plus 7630 | |
| Gigabyte G5 KE | |
| Asus TUF A15 FA507 | |
| MSI Cyborg 15 A12VF | |
| Average of class Multimedia (11 - 121, n=7, last 2 years) | |
| Asus VivoBook Pro 16 | |
| Average Intel Arc A730M (39.8 - 49.4, n=2) | |
| Intel NUC X15 LAPAC71H | |
| GTA V - 1920x1080 Highest AA:4xMSAA + FX AF:16x | |
| Gigabyte G5 KE | |
| MSI Cyborg 15 A12VF | |
| Asus TUF A15 FA507 | |
| Average of class Multimedia (7.92 - 141.6, n=55, last 2 years) | |
| Asus VivoBook Pro 16 | |
| Average Intel Arc A730M (40.1 - 43.1, n=3) | |
| Intel NUC X15 LAPAC71H | |
| Final Fantasy XV Benchmark - 1920x1080 High Quality | |
| Gigabyte G5 KE | |
| Dell Inspiron 16 Plus 7630 | |
| Asus TUF A15 FA507 | |
| MSI Cyborg 15 A12VF | |
| Average of class Multimedia (7.61 - 144.4, n=57, last 2 years) | |
| Asus VivoBook Pro 16 | |
| Average Intel Arc A730M (41.1 - 49.7, n=3) | |
| Intel NUC X15 LAPAC71H | |
| Strange Brigade - 1920x1080 ultra AA:ultra AF:16 | |
| Dell Inspiron 16 Plus 7630 | |
| Gigabyte G5 KE | |
| Asus TUF A15 FA507 | |
| MSI Cyborg 15 A12VF | |
| Average Intel Arc A730M (116.6 - 137.7, n=3) | |
| Intel NUC X15 LAPAC71H | |
| Average of class Multimedia (13.3 - 303, n=57, last 2 years) | |
| Asus VivoBook Pro 16 | |
| Dota 2 Reborn - 1920x1080 ultra (3/3) best looking | |
| Dell Inspiron 16 Plus 7630 | |
| Gigabyte G5 KE | |
| MSI Cyborg 15 A12VF | |
| Asus TUF A15 FA507 | |
| Asus VivoBook Pro 16 | |
| Average of class Multimedia (29 - 179.9, n=59, last 2 years) | |
| Intel NUC X15 LAPAC71H | |
| Average Intel Arc A730M (80.4 - 91.9, n=3) | |
Witcher 3 FPS diagram
| low | med. | high | ultra | |
|---|---|---|---|---|
| GTA V (2015) | 177.4 | 170.6 | 94.3 | 40.1 |
| The Witcher 3 (2015) | 267.3 | 190.3 | 106.9 | 39.8 |
| Dota 2 Reborn (2015) | 102.2 | 101.6 | 96.8 | 91.9 |
| Final Fantasy XV Benchmark (2018) | 98.5 | 67.9 | 41.1 | |
| X-Plane 11.11 (2018) | 70.7 | 55.8 | 47.6 | |
| Strange Brigade (2018) | 377 | 167.8 | 140 | 116.6 |
| Control (2019) | 145.7 | 66 | 51.1 | |
| Flight Simulator 2020 (2020) | 69.3 | 44.2 | 33.7 | 25.7 |
| Cyberpunk 2077 1.6 (2022) | 70.5 | 57.5 | 50.4 | 47 |
| Uncharted Legacy of Thieves Collection (2022) | 31.3 | 35.3 | 27.6 | 26.7 |
| Call of Duty Modern Warfare 2 2022 (2022) | 77 | 65 | 56 | 55 |
| Spider-Man Miles Morales (2022) | 60.5 | 58 | 53.4 | 51.4 |
| The Callisto Protocol (2022) | 80.2 | 72.6 | 67.9 | 47.5 |
| Need for Speed Unbound (2022) | 59.8 | 52.5 | 44.7 | 37.9 |
| High On Life (2023) | 147.9 | 110.1 | 80.9 | 64.7 |
| The Witcher 3 v4 (2023) | 126.2 | 102.8 | 51.2 | 44.4 |
| Dead Space Remake (2023) | 48.2 | 46.7 | 42.2 | 41.3 |
| Hogwarts Legacy (2023) | 69.6 | 48.6 | 43.7 | 34.3 |
| Returnal (2023) | 55 | 53 | 49 | 41 |
| Atomic Heart (2023) | 100.1 | 73.3 | 51.1 | 37.5 |
| Company of Heroes 3 (2023) | 111.3 | 90.6 | 74 | 72.8 |
| Sons of the Forest (2023) | 53.1 | 35.2 | 34.9 | 34.2 |
| Resident Evil 4 Remake (2023) | 86.4 | 64.9 | 60 | 41.3 |
| The Last of Us (2023) | 34.3 | 32.2 | 31.3 | 28.7 |
| Star Wars Jedi Survivor (2023) | 44 | 39.4 | 36.7 | 34.7 |
| Diablo 4 (2023) | 129.7 | 115.6 | 104.5 | 87.8 |
| F1 23 (2023) | 164.9 | 150.3 | 109.6 | 33.1 |
| Ratchet & Clank Rift Apart (2023) | 55.4 | 50.7 | 42.5 | 42.1 |
| Atlas Fallen (2023) | 78 | 74.1 | 70.4 | 59.2 |
| Starfield (2023) | 34 | 30.1 | 24.8 | 22 |
| The Crew Motorfest (2023) | 60 | 57 | 50 | 46 |
| Lies of P (2023) | 97 | 85.8 | 75.1 | 67 |
| Baldur's Gate 3 (2023) | 74.6 | 63 | 55.1 | 52.8 |
| Cyberpunk 2077 (2023) | 71.6 | 57 | 50 | 47.7 |
| EA Sports FC 24 (2023) | 121.8 | |||
| Assassin's Creed Mirage (2023) | 60 | 55 | 55 | 44 |
| Total War Pharaoh (2023) | 207.4 | 121.7 | 74.9 | 60.9 |
| Lords of the Fallen (2023) | 45.1 | 40.1 | 36.8 | 35.4 |
排放与功耗 - NUC X15 的运行时间很短
噪音排放
玩游戏时,笔记本电脑的噪音最高可达 51 dB(A)("性能模式")。在 "基准模式 "下,由于风扇持续全速运转,噪音会更大。在闲置模式和日常使用(办公、上网)中,NUC 的噪音要小得多。不过:两个风扇中的一个始终以低速运行。通过激活 NUC 软件工作室中的 "被动冷却模式 "设置,可以避免这种情况。
Noise level
| Idle |
| 23 / 24 / 24 dB(A) |
| Load |
| 50.61 / 50.89 dB(A) |
 | ||
30 dB silent 40 dB(A) audible 50 dB(A) loud |
||
min: | ||
| Intel NUC X15 LAPAC71H A730M, i7-12700H, Samsung 990 Pro 1 TB | Asus TUF A15 FA507 GeForce RTX 4050 Laptop GPU, R7 7735HS, Micron 2400 MTFDKBA512QFM | Gigabyte G5 KE GeForce RTX 3060 Laptop GPU, i5-12500H, Gigabyte AG4512G-SI B10 | Dell Inspiron 16 Plus 7630 GeForce RTX 4060 Laptop GPU, i7-13700H, WD PC SN740 SDDPTQD-1T00 | Asus VivoBook Pro 16 GeForce RTX 3050 Ti Laptop GPU, i7-12700H, Intel SSD 670p SSDPEKNU010TZ | MSI Cyborg 15 A12VF GeForce RTX 4060 Laptop GPU, i7-12650H, Samsung PM9B1 1024GB MZVL41T0HBLB | |
|---|---|---|---|---|---|---|
| Noise | 11% | -15% | 4% | -10% | -28% | |
| off / environment * (dB) | 23 | 23.3 -1% | 19.52 15% | 23.2 -1% | 25.2 -10% | 27 -17% |
| Idle Minimum * (dB) | 23 | 23.3 -1% | 31.05 -35% | 23.2 -1% | 25.2 -10% | 27 -17% |
| Idle Average * (dB) | 24 | 23.3 3% | 31.05 -29% | 23.2 3% | 25.2 -5% | 37.5 -56% |
| Idle Maximum * (dB) | 24 | 23.3 3% | 31.05 -29% | 23.2 3% | 25.2 -5% | 38 -58% |
| Load Average * (dB) | 50.61 | 29.6 42% | 55.66 -10% | 35.1 31% | 55.1 -9% | 56.3 -11% |
| Witcher 3 ultra * (dB) | 50.65 | 43 15% | 55.7 -10% | 52.5 -4% | ||
| Load Maximum * (dB) | 50.89 | 43 16% | 55.51 -9% | 52.5 -3% | 61.5 -21% | 56.3 -11% |
* ... smaller is better
温度
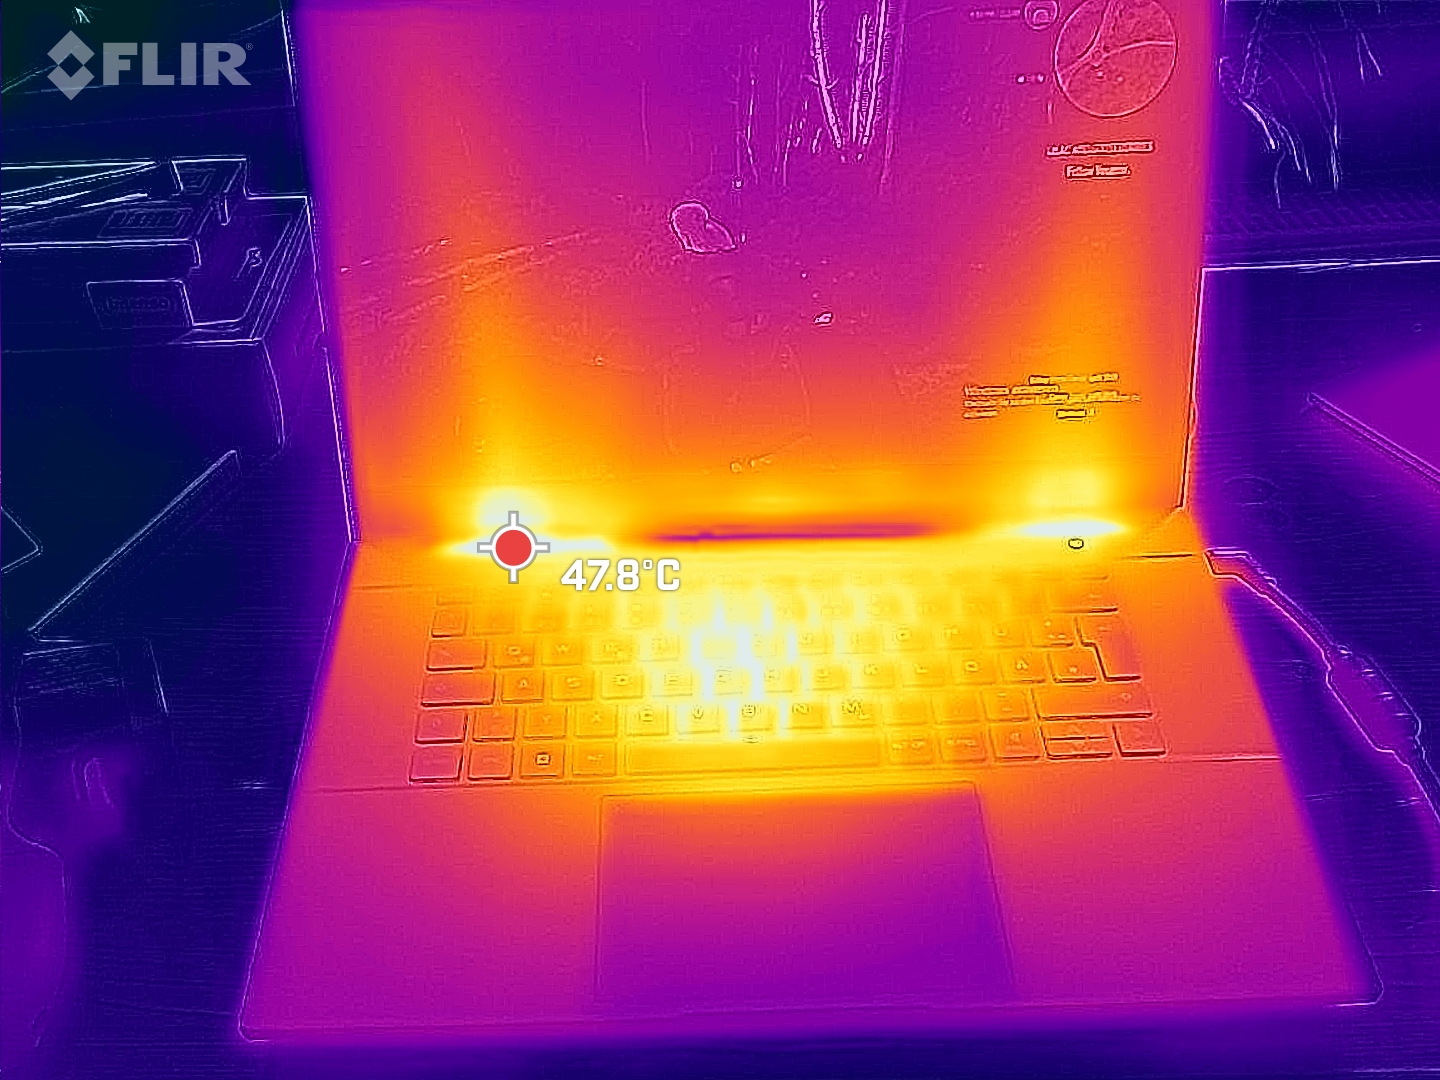
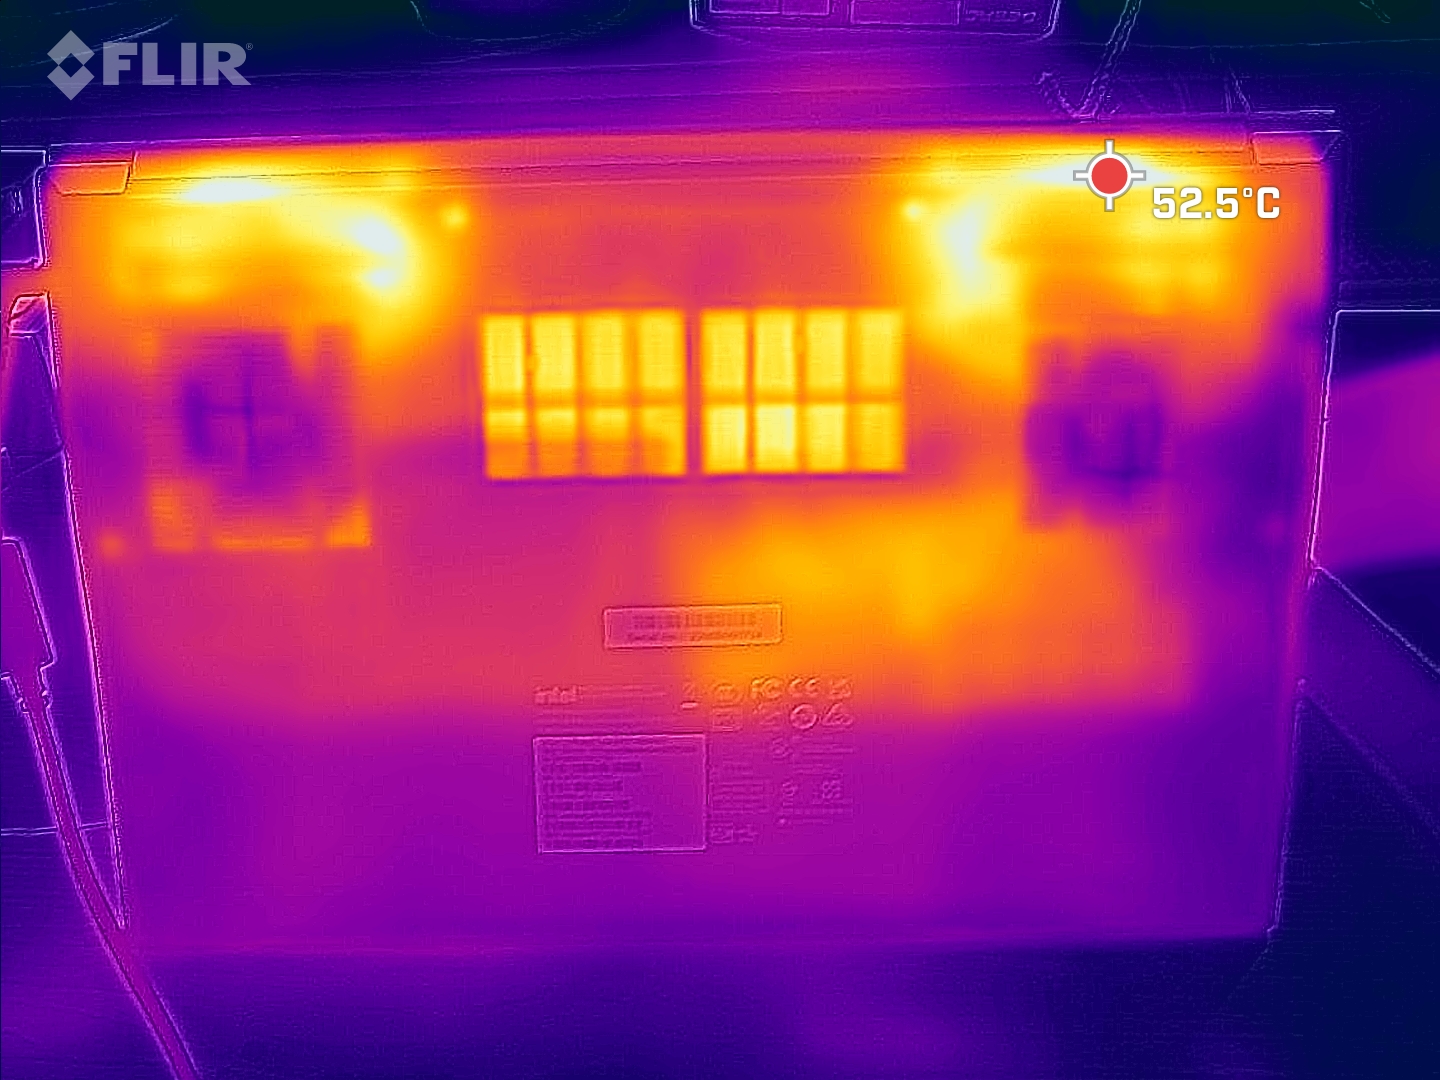
高负载(压力测试、 Witcher 3测试)会导致笔记本电脑某些区域明显发热。总之,这些数值从未达到临界水平。在日常使用中(办公、上网),机箱温度保持在绿色区域内。
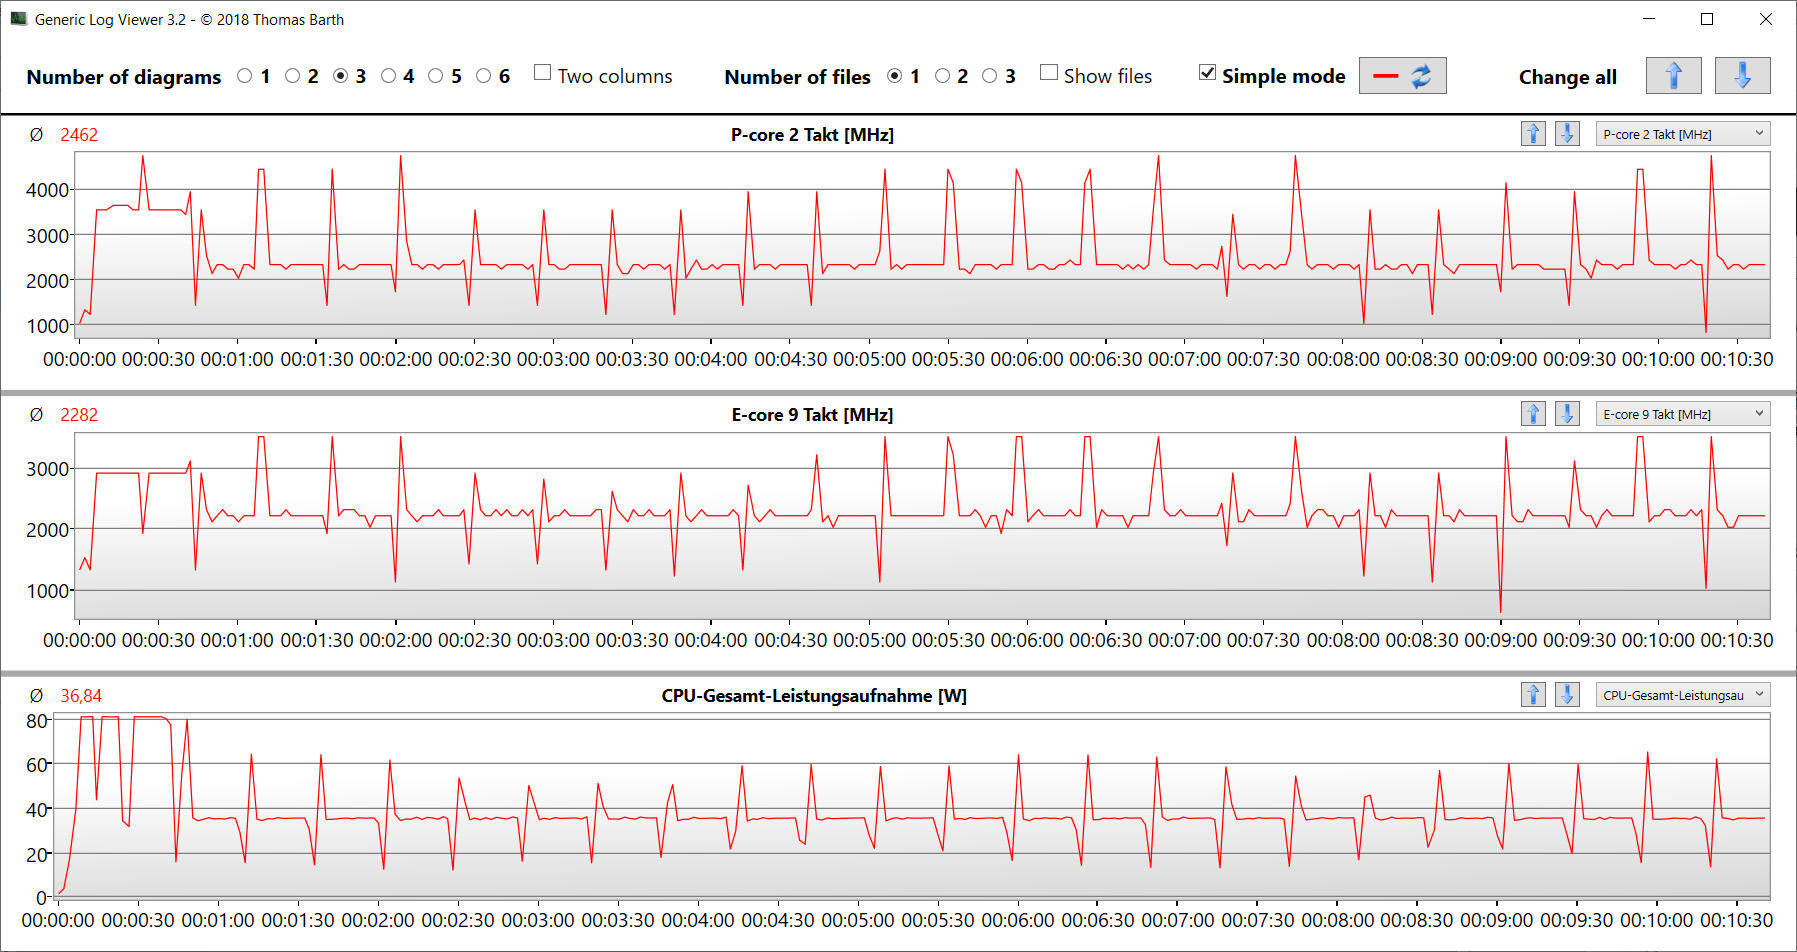
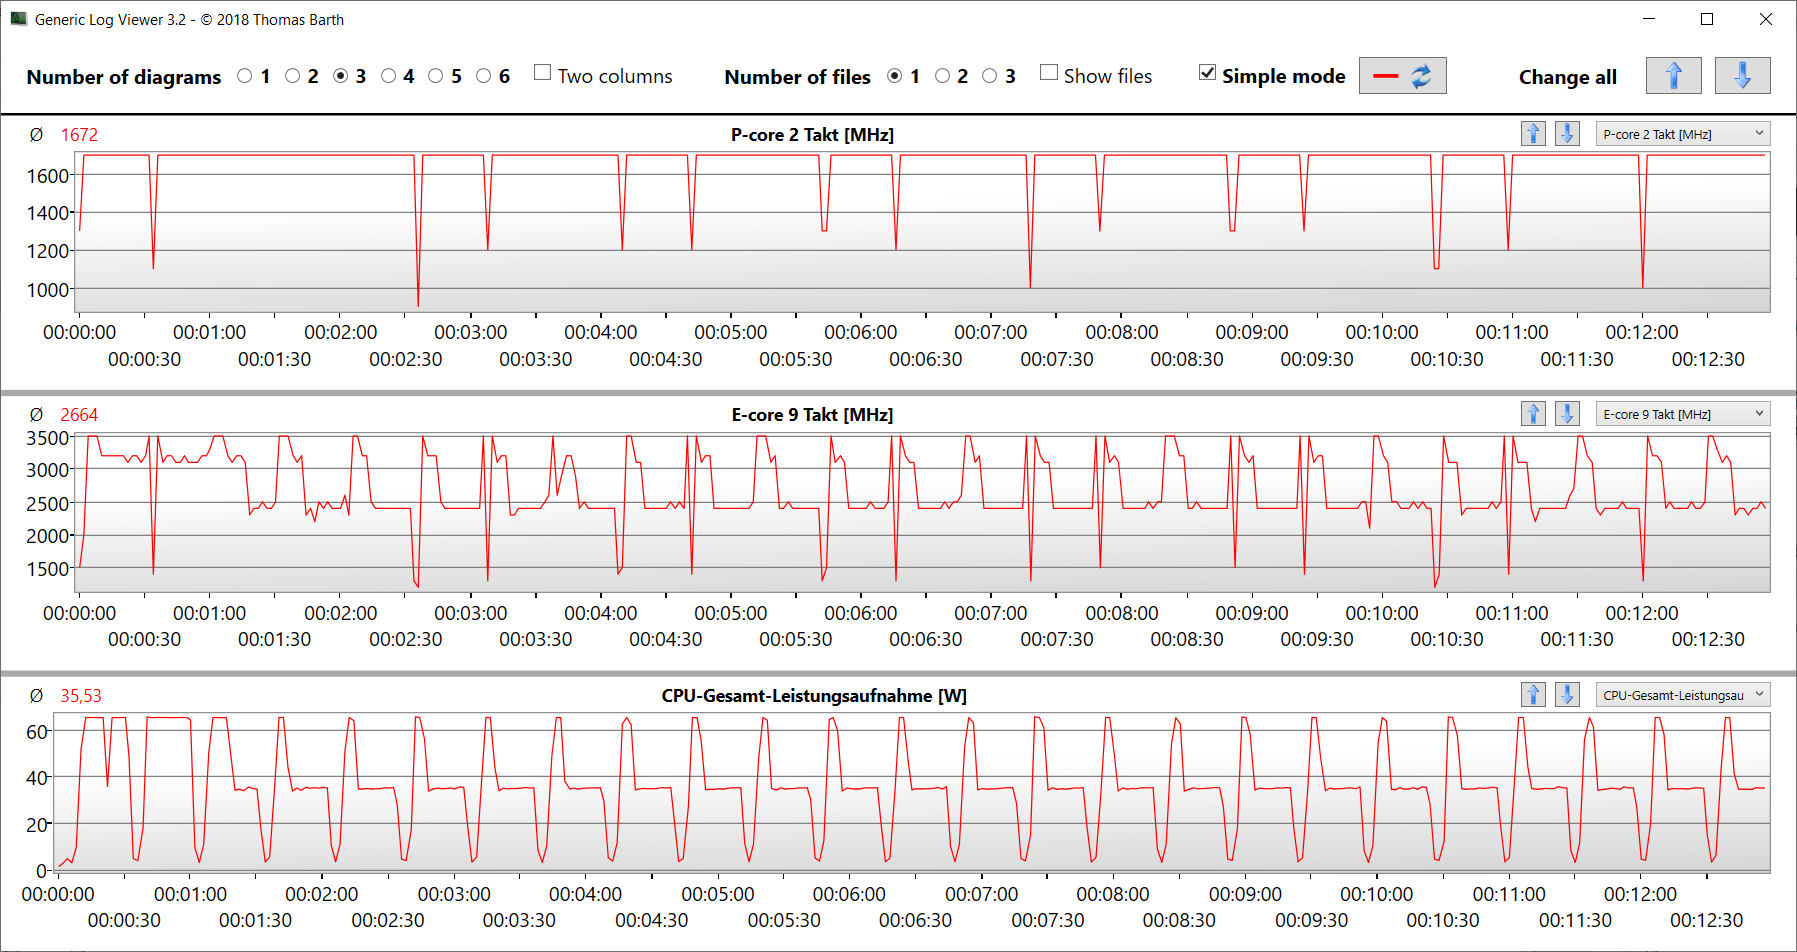
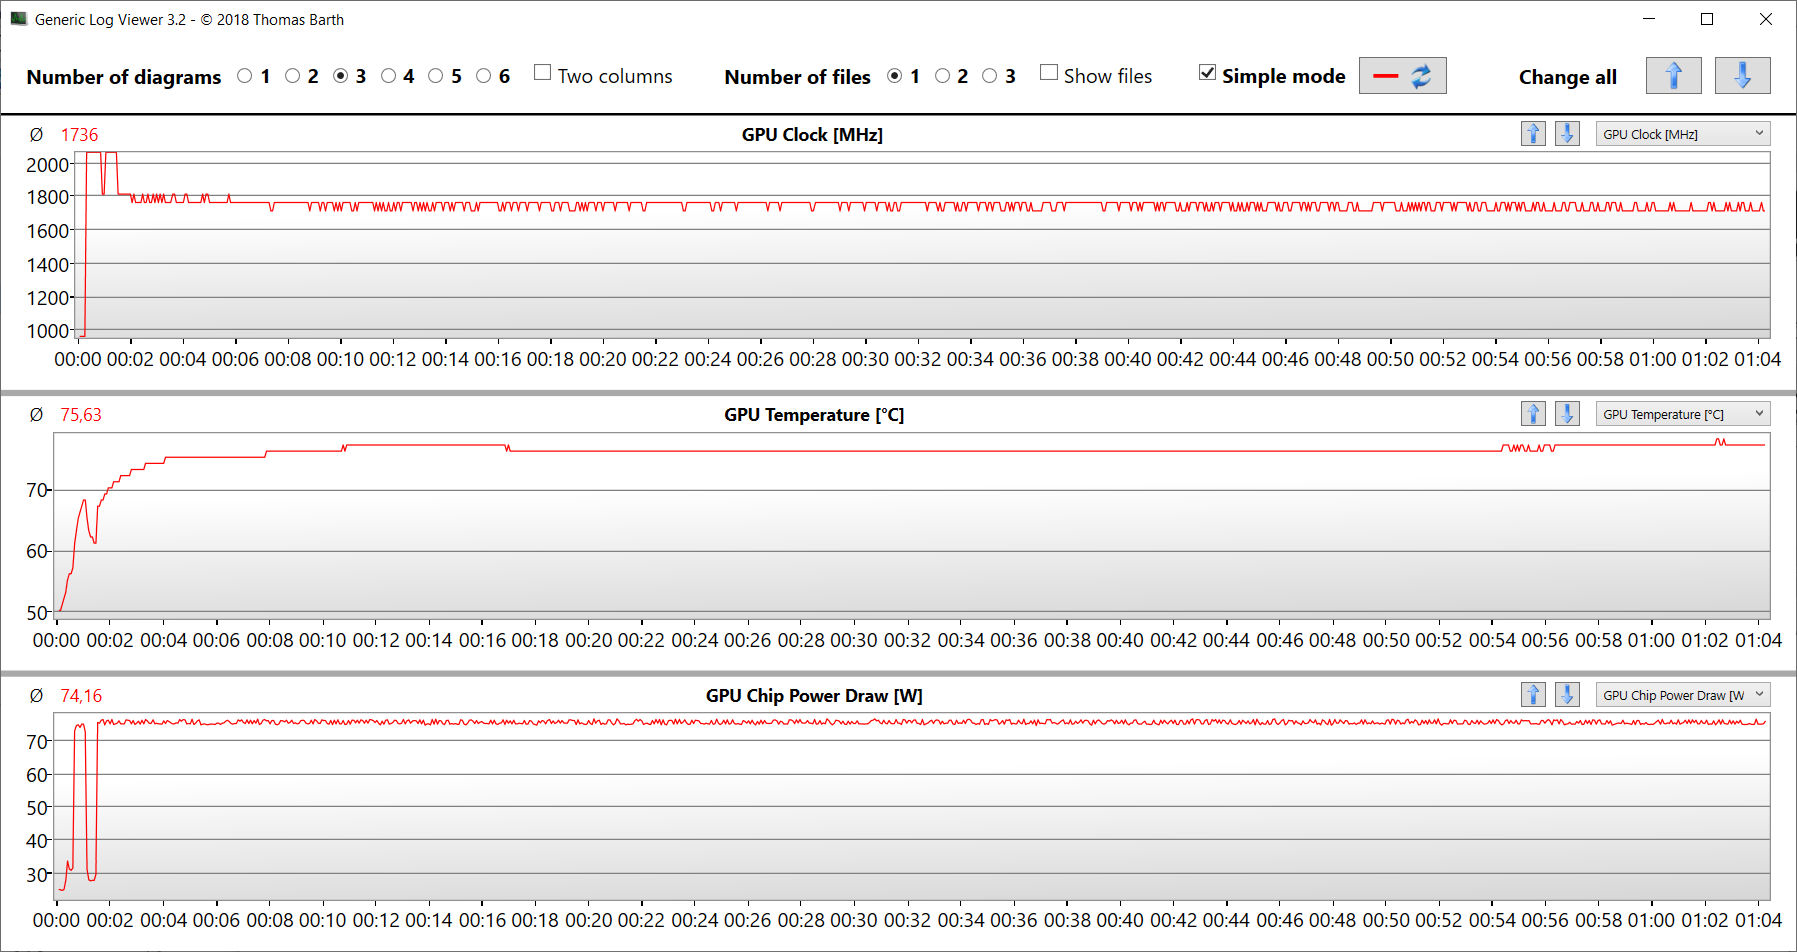
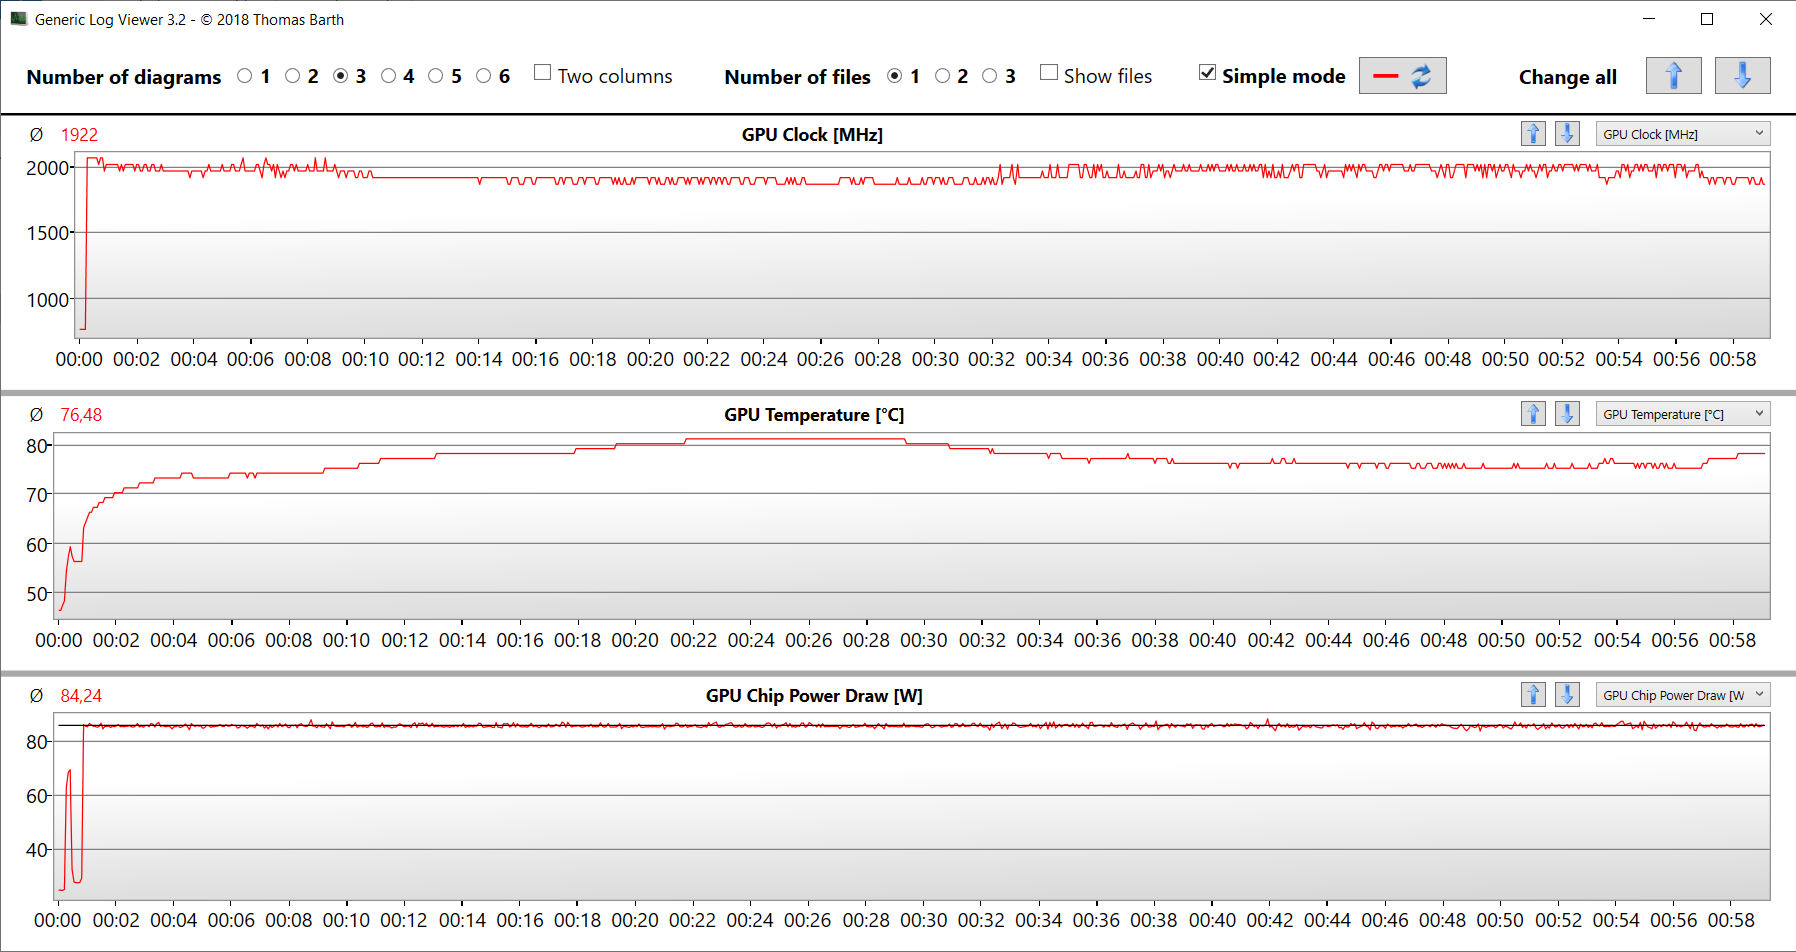
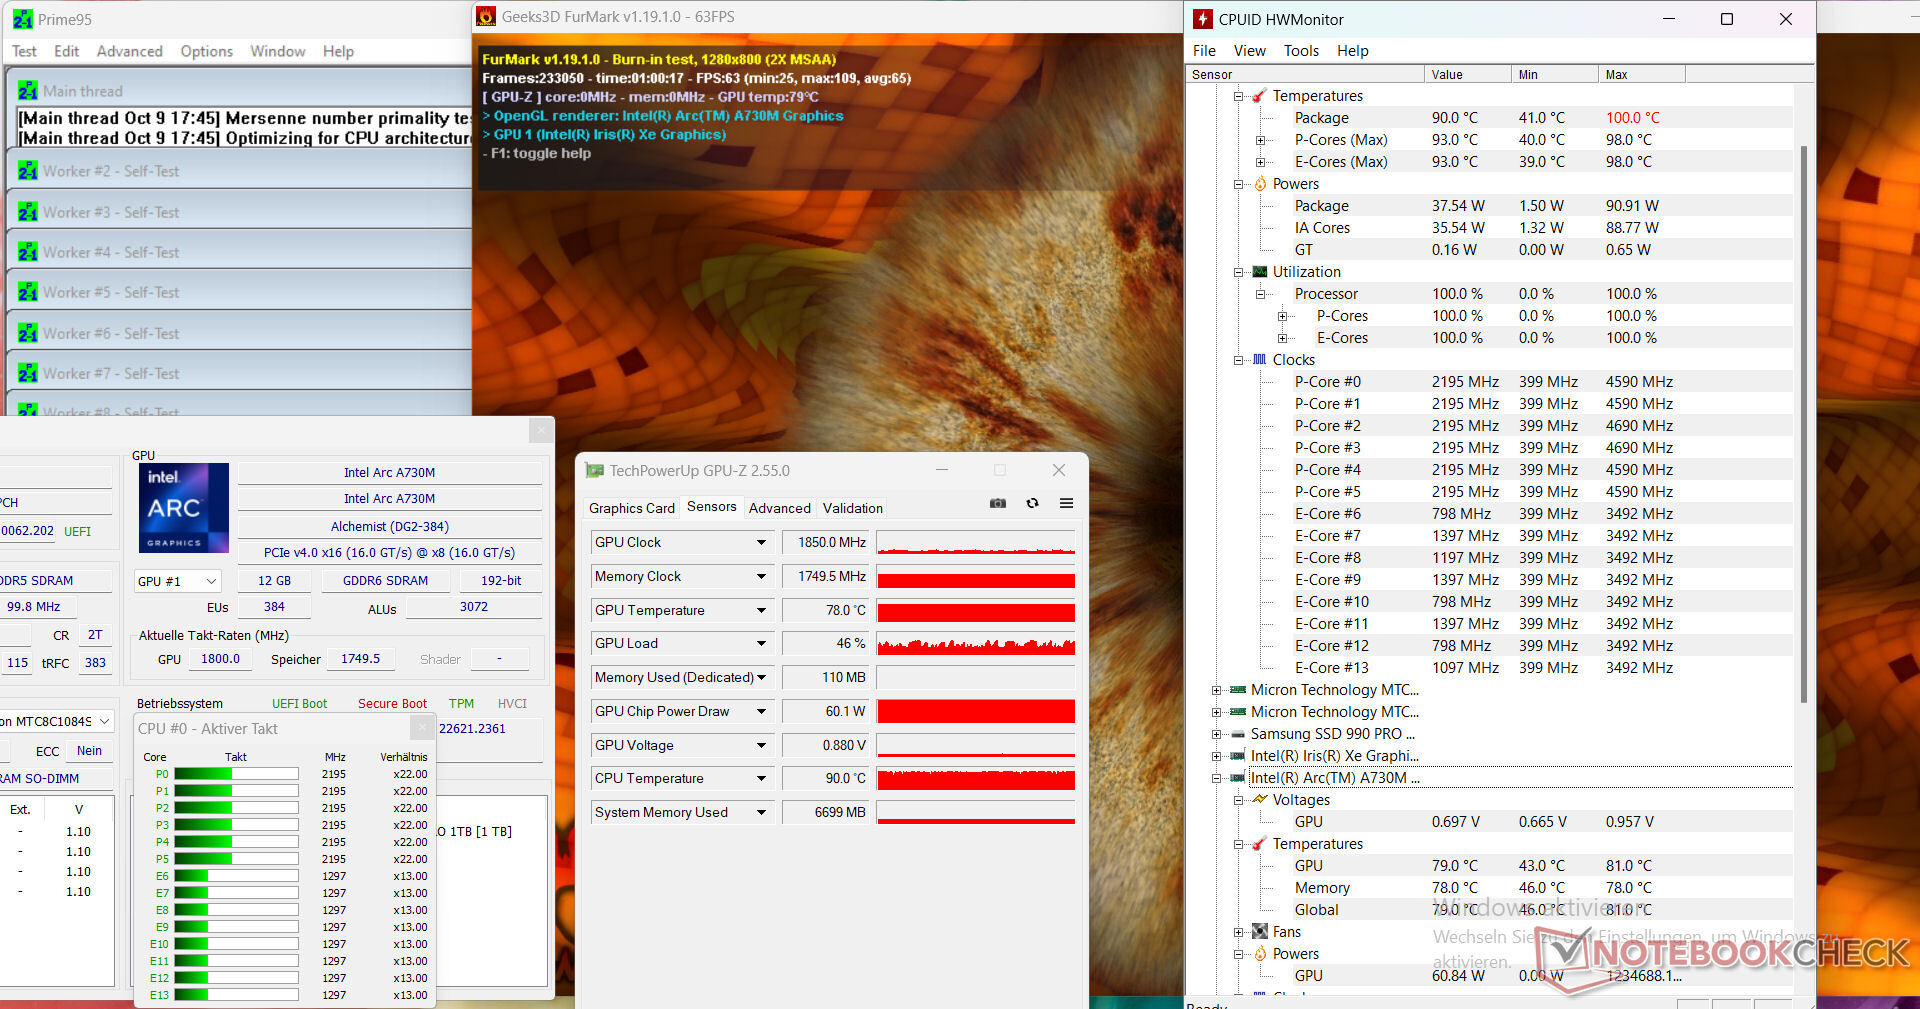
压力测试(Prime95 和 Furmark 连续运行)模拟了极端情况,以测试系统在满负荷情况下的稳定性。CPU 和 GPU 的时钟频率在平均范围内波动。
(-) The maximum temperature on the upper side is 59 °C / 138 F, compared to the average of 36.8 °C / 98 F, ranging from 21 to 71 °C for the class Multimedia.
(-) The bottom heats up to a maximum of 51 °C / 124 F, compared to the average of 39.1 °C / 102 F
(+) In idle usage, the average temperature for the upper side is 27.3 °C / 81 F, compared to the device average of 31.3 °C / 88 F.
(-) Playing The Witcher 3, the average temperature for the upper side is 40.9 °C / 106 F, compared to the device average of 31.3 °C / 88 F.
(±) The palmrests and touchpad can get very hot to the touch with a maximum of 36 °C / 96.8 F.
(-) The average temperature of the palmrest area of similar devices was 28.7 °C / 83.7 F (-7.3 °C / -13.1 F).
| Intel NUC X15 LAPAC71H Intel Core i7-12700H, Intel Arc A730M | Asus TUF A15 FA507 AMD Ryzen 7 7735HS, NVIDIA GeForce RTX 4050 Laptop GPU | Gigabyte G5 KE Intel Core i5-12500H, NVIDIA GeForce RTX 3060 Laptop GPU | Dell Inspiron 16 Plus 7630 Intel Core i7-13700H, NVIDIA GeForce RTX 4060 Laptop GPU | Asus VivoBook Pro 16 Intel Core i7-12700H, NVIDIA GeForce RTX 3050 Ti Laptop GPU | MSI Cyborg 15 A12VF Intel Core i7-12650H, NVIDIA GeForce RTX 4060 Laptop GPU | |
|---|---|---|---|---|---|---|
| Heat | 10% | -12% | -2% | -6% | 13% | |
| Maximum Upper Side * (°C) | 59 | 48.9 17% | 52.6 11% | 47.8 19% | 44.2 25% | 47.5 19% |
| Maximum Bottom * (°C) | 51 | 44.6 13% | 62.4 -22% | 42.2 17% | 53 -4% | 35.5 30% |
| Idle Upper Side * (°C) | 28 | 27.1 3% | 33.6 -20% | 35.2 -26% | 32.1 -15% | 27.7 1% |
| Idle Bottom * (°C) | 30 | 27.5 8% | 34.8 -16% | 35 -17% | 38.4 -28% | 29.5 2% |
* ... smaller is better
发言人
立体声扬声器能产生不错的音效,但几乎没有低音。
Intel NUC X15 LAPAC71H audio analysis
(±) | speaker loudness is average but good (79.38 dB)
Bass 100 - 315 Hz
(-) | nearly no bass - on average 17.1% lower than median
(±) | linearity of bass is average (14.2% delta to prev. frequency)
Mids 400 - 2000 Hz
(+) | balanced mids - only 1.7% away from median
(+) | mids are linear (3.8% delta to prev. frequency)
Highs 2 - 16 kHz
(+) | balanced highs - only 2.2% away from median
(+) | highs are linear (5.4% delta to prev. frequency)
Overall 100 - 16.000 Hz
(+) | overall sound is linear (12.1% difference to median)
Compared to same class
» 22% of all tested devices in this class were better, 3% similar, 76% worse
» The best had a delta of 5%, average was 17%, worst was 45%
Compared to all devices tested
» 10% of all tested devices were better, 2% similar, 88% worse
» The best had a delta of 4%, average was 23%, worst was 134%
Dell Inspiron 16 Plus 7630 audio analysis
(±) | speaker loudness is average but good (81.8 dB)
Bass 100 - 315 Hz
(-) | nearly no bass - on average 17% lower than median
(±) | linearity of bass is average (8.4% delta to prev. frequency)
Mids 400 - 2000 Hz
(±) | higher mids - on average 6.3% higher than median
(+) | mids are linear (6.2% delta to prev. frequency)
Highs 2 - 16 kHz
(+) | balanced highs - only 2.2% away from median
(+) | highs are linear (5.6% delta to prev. frequency)
Overall 100 - 16.000 Hz
(±) | linearity of overall sound is average (15.9% difference to median)
Compared to same class
» 40% of all tested devices in this class were better, 6% similar, 54% worse
» The best had a delta of 5%, average was 17%, worst was 45%
Compared to all devices tested
» 25% of all tested devices were better, 5% similar, 70% worse
» The best had a delta of 4%, average was 23%, worst was 134%
耗电量
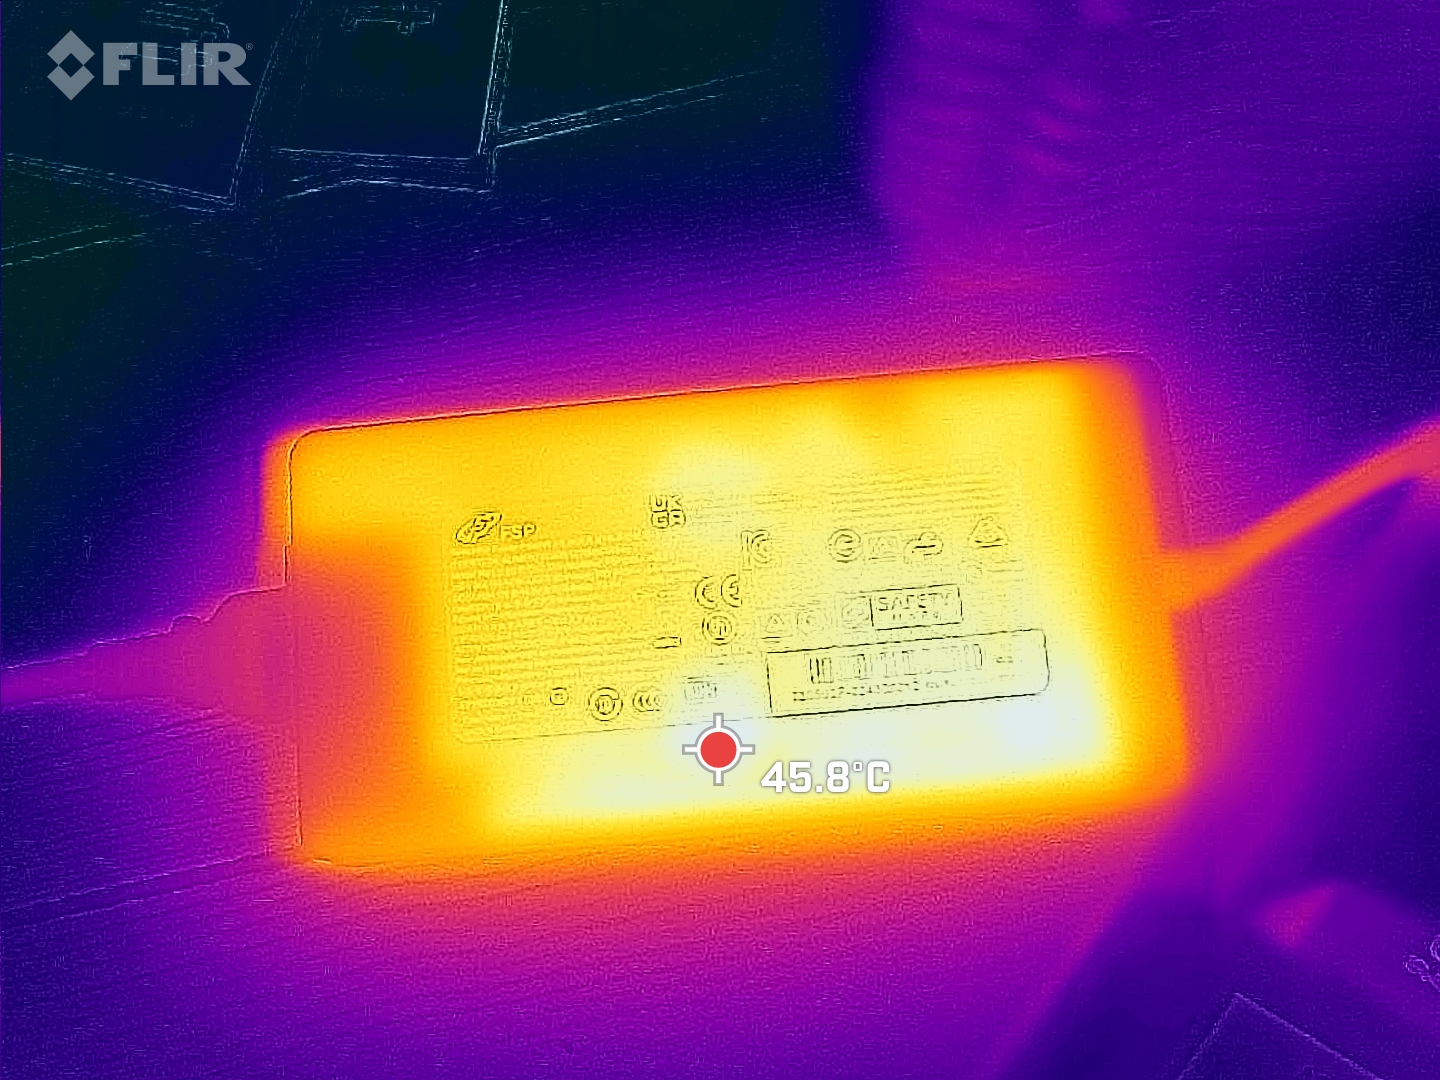
笔记本电脑的功耗符合所安装硬件的预期水平。压力测试和 Witcher 3测试时,功耗水平(略有)波动。附带的电源(230 瓦)功率足够大。
从单位瓦数性能来看,该设备非常耗电。作为对比:微星微星 Cyborg在负载情况下仅需一半左右的功率,但游戏性能却明显更高。该显卡GeForce RTX 4060在微星笔记本电脑中的工作效率要比 Arc 730M 高得多,后者的 TGP 限制为 45 瓦。
| Off / Standby | |
| Idle | |
| Load |
|
Key:
min: | |
| Intel NUC X15 LAPAC71H Intel Core i7-12700H, Intel Arc A730M | Asus TUF A15 FA507 AMD Ryzen 7 7735HS, NVIDIA GeForce RTX 4050 Laptop GPU | Gigabyte G5 KE Intel Core i5-12500H, NVIDIA GeForce RTX 3060 Laptop GPU | Dell Inspiron 16 Plus 7630 Intel Core i7-13700H, NVIDIA GeForce RTX 4060 Laptop GPU | Asus VivoBook Pro 16 Intel Core i7-12700H, NVIDIA GeForce RTX 3050 Ti Laptop GPU | MSI Cyborg 15 A12VF Intel Core i7-12650H, NVIDIA GeForce RTX 4060 Laptop GPU | |
|---|---|---|---|---|---|---|
| Power Consumption | 12% | -1% | -18% | 1% | 32% | |
| Idle Minimum * (Watt) | 7.5 | 8 -7% | 7.66 -2% | 15.6 -108% | 8.7 -16% | 6 20% |
| Idle Average * (Watt) | 11.9 | 12.1 -2% | 10.3 13% | 17.7 -49% | 13.1 -10% | 8.8 26% |
| Idle Maximum * (Watt) | 13.9 | 12.5 10% | 16.05 -15% | 20.6 -48% | 18.3 -32% | 11.9 14% |
| Load Average * (Watt) | 137 | 74.9 45% | 115.8 15% | 87.4 36% | 116 15% | 89 35% |
| Witcher 3 ultra * (Watt) | 166 | 136.6 18% | 168.7 -2% | 121.7 27% | 117.6 29% | 90.3 46% |
| Load Maximum * (Watt) | 203 | 185 9% | 234.6 -16% | 138 32% | 162 20% | 99 51% |
* ... smaller is better
Power consumption Witcher 3 / stress test
Power consumption with external monitor
运行时间
这款 15.6 英寸设备在我们的实际无线局域网测试(使用脚本调用网页时的负载映射)中的运行时间为 5:44 h,虽然还算不错,但并不出色。
Pros
Cons
结论--这里没有讨价还价的余地
英特尔的 NUC X15 面向游戏玩家和创意工作者。这意味着视频和图像编辑、流媒体、渲染和游戏都属于这款笔记本电脑的使用范围。A酷睿 i7-12700H和Arc A730M提供了必要的动力--两款芯片都能以稳定的高时钟频率运行。
英特尔 NUC X15 既没有给人留下深刻印象,也没有让人失望。不过,考虑到其 CPU 性能和高功耗,这款笔记本电脑的价格实在太高了。
与同类竞争产品相比,其低效的 Arc GPU 每瓦性能较低。与目前所有的 GPU(RX7000、RTX 4000)一样,A730M 拥有光线追踪内核和 AV1 支持(解码和编码)--这些都是创造者笔记本电脑所必需的功能。
该设备的排放量在同类产品中属于典型水平。实际运行时间接近 6 小时,可以说是相当不错。它的 USB-C 端口(Thunderbolt 4)不支持 Power Delivery,但可以输出 DisplayPort 信号。此外,这款笔记本电脑还提供扩展选项(扩展坞解决方案、外置 GPU)。总而言之,它配备的 FHD 显示屏(15.6 英寸、IPS、144 Hz)给我们留下了良好的印象。
另一个选择可能是华硕 VivoBook Pro 16:它的总体计算性能略低,但运行时间更长、Power Delivery 和 16:10 屏幕使其受益匪浅。Aorus 15 9KF-E3DE383SH 可能是一款不错的预算替代产品。由于采用了GeForce RTX 4060(TGP:140 瓦),它的游戏性能比 X15 好得多。目前,这款产品的网上售价约为 1,040 美元。我们已经测试过更强大的版本的 Aorus 15。
价格和供应情况
英特尔 NUC X15 LAPAC71H 可通过Schenker 在线商店进行单独配置和订购。.目前的测试设备售价约为 1,280 美元。基本型号(16 GB 内存、500 GB 固态硬盘)的价格约为 1,050 美元。
Intel NUC X15 LAPAC71H
- 10/13/2023 v7 (old)
Sascha Mölck
Transparency
The selection of devices to be reviewed is made by our editorial team. The test sample was provided to the author as a loan by the manufacturer or retailer for the purpose of this review. The lender had no influence on this review, nor did the manufacturer receive a copy of this review before publication. There was no obligation to publish this review. As an independent media company, Notebookcheck is not subjected to the authority of manufacturers, retailers or publishers.
This is how Notebookcheck is testing
Every year, Notebookcheck independently reviews hundreds of laptops and smartphones using standardized procedures to ensure that all results are comparable. We have continuously developed our test methods for around 20 years and set industry standards in the process. In our test labs, high-quality measuring equipment is utilized by experienced technicians and editors. These tests involve a multi-stage validation process. Our complex rating system is based on hundreds of well-founded measurements and benchmarks, which maintains objectivity. Further information on our test methods can be found here.
Price comparison

