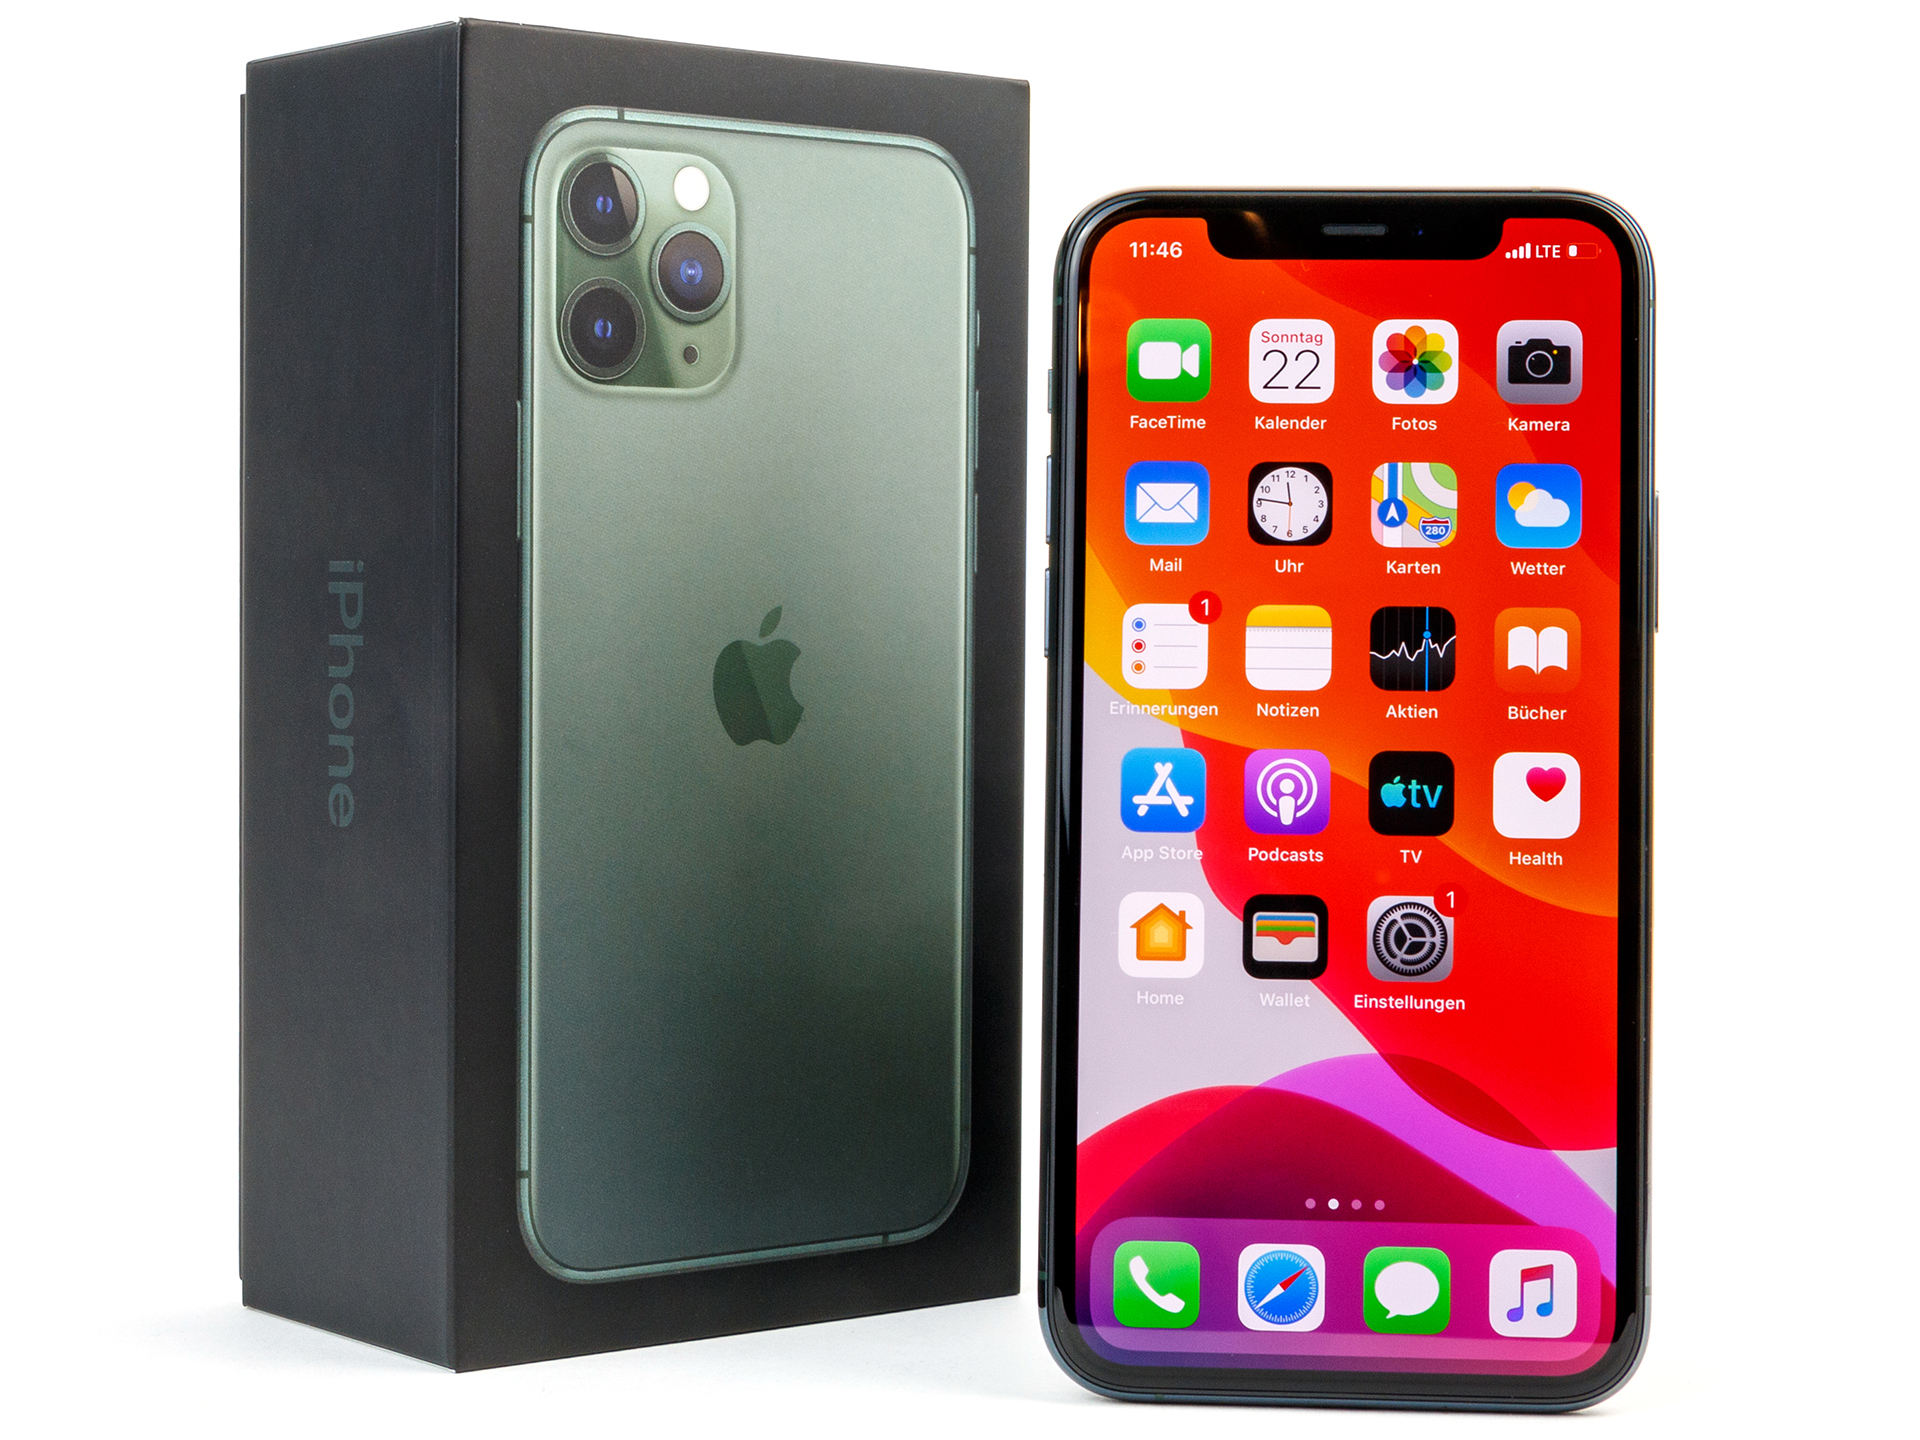
Apple iPhone 11 Pro智能手机评测:后置三摄,功能强大,难以撼动
Video clips


| |||||||||||||||||||||||||
Brightness Distribution: 98 %
Center on Battery: 787 cd/m²
Contrast: ∞:1 (Black: 0 cd/m²)
ΔE ColorChecker Calman: 1.2 | ∀{0.5-29.43 Ø4.72}
ΔE Greyscale Calman: 1.5 | ∀{0.09-98 Ø4.97}
99.4% sRGB (Calman 2D)
Gamma: 2.2
CCT: 6339 K
| Apple iPhone 11 Pro OLED, 2436x1125, 5.8" | Apple iPhone XS OLED, 2436x1125, 5.8" | Samsung Galaxy S10 Plus OLED, 3040x1440, 6.4" | Huawei P30 Pro OLED, 2340x1080, 6.5" | OnePlus 7 Pro AMOLED, 3120x1440, 6.7" | LG G8s ThinQ P-OLED, 2248x1080, 6.2" | |
|---|---|---|---|---|---|---|
| Screen | -10% | -87% | -31% | -13% | -84% | |
| Brightness middle (cd/m²) | 787 | 639 -19% | 710 -10% | 597 -24% | 586 -26% | 539 -32% |
| Brightness (cd/m²) | 793 | 637 -20% | 721 -9% | 608 -23% | 584 -26% | 556 -30% |
| Brightness Distribution (%) | 98 | 94 -4% | 97 -1% | 89 -9% | 97 -1% | 88 -10% |
| Black Level * (cd/m²) | ||||||
| Colorchecker dE 2000 * | 1.2 | 1 17% | 3.7 -208% | 2.2 -83% | 1.39 -16% | 3.78 -215% |
| Colorchecker dE 2000 max. * | 2.6 | 2.2 15% | 10.3 -296% | 3.6 -38% | 2.7 -4% | 6.95 -167% |
| Greyscale dE 2000 * | 1.5 | 2.2 -47% | 1.5 -0% | 1.6 -7% | 1.6 -7% | 2.2 -47% |
| Gamma | 2.2 100% | 1.9 116% | 2.1 105% | 2.23 99% | 2.243 98% | 2.274 97% |
| CCT | 6339 103% | 6364 102% | 6611 98% | 6268 104% | 6672 97% | 6013 108% |
* ... smaller is better
Screen Flickering / PWM (Pulse-Width Modulation)
| Screen flickering / PWM detected | 290.7 Hz | ≤ 99 % brightness setting | 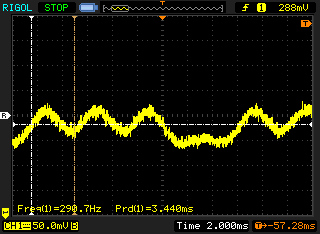 |
The display backlight flickers at 290.7 Hz (worst case, e.g., utilizing PWM) Flickering detected at a brightness setting of 99 % and below. There should be no flickering or PWM above this brightness setting. The frequency of 290.7 Hz is relatively high, so most users sensitive to PWM should not notice any flickering. However, there are reports that some users are still sensitive to PWM at 500 Hz and above, so be aware. In comparison: 52 % of all tested devices do not use PWM to dim the display. If PWM was detected, an average of 7763 (minimum: 5 - maximum: 343500) Hz was measured. | |||
Display Response Times
| ↔ Response Time Black to White | ||
|---|---|---|
| 3.2 ms ... rise ↗ and fall ↘ combined | ↗ 2 ms rise | 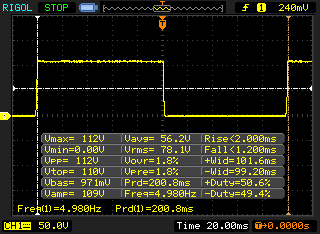 |
| ↘ 1.2 ms fall | ||
| The screen shows very fast response rates in our tests and should be very well suited for fast-paced gaming. In comparison, all tested devices range from 0.1 (minimum) to 240 (maximum) ms. » 15 % of all devices are better. This means that the measured response time is better than the average of all tested devices (19.8 ms). | ||
| ↔ Response Time 50% Grey to 80% Grey | ||
| 11.6 ms ... rise ↗ and fall ↘ combined | ↗ 3.6 ms rise | 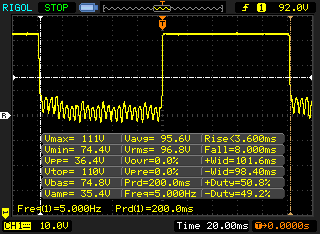 |
| ↘ 8 ms fall | ||
| The screen shows good response rates in our tests, but may be too slow for competitive gamers. In comparison, all tested devices range from 0.165 (minimum) to 636 (maximum) ms. » 25 % of all devices are better. This means that the measured response time is better than the average of all tested devices (31 ms). | ||
| Jetstream 2 - 2.0 Total | |
| Average of class Smartphone (60.2 - 423, n=126, last 2 years) | |
| Average Apple A13 Bionic (128.5 - 142.2, n=5) | |
| Apple iPhone 11 (Safari Mobile 13.0) | |
| Apple iPhone 11 Pro Max (Safari Mobile 13.1) | |
| Apple iPhone 11 Pro (Safari Mobile 13.0) | |
| Apple iPhone XS | |
| OnePlus 7 Pro (Chrome 74) | |
| Huawei P30 Pro (Chrome 73) | |
| Asus ZenFone 6 ZS630KL (Chrome 75) | |
| LG G8s ThinQ (Chrome 75) | |
| Samsung Galaxy S10 Plus (Samung Browser 9.0) | |
| JetStream 1.1 - 1.1 Total | |
| Apple iPhone 11 Pro Max (Safari Mobile 13.1) | |
| Apple iPhone 11 Pro (Safari Mobile 13.0) | |
| Apple iPhone 11 (Safari Mobile 13.0) | |
| Average Apple A13 Bionic (279 - 302, n=5) | |
| Apple iPad Pro 11 2018 (Safari 13) | |
| Apple iPhone XS (Safari Mobile 12.0) | |
| Asus ZenFone 6 ZS630KL (Chrome 75) | |
| LG G8s ThinQ (Chrome 75) | |
| Samsung Galaxy S10 Plus (Samsung Browser 9.0) | |
| Speedometer 2.0 - Result 2.0 | |
| Average of class Smartphone (49.3 - 733, n=89, last 2 years) | |
| Average Apple A13 Bionic (153 - 171, n=5) | |
| Apple iPhone 11 (Safari Mobile 13.0) | |
| Apple iPhone 11 Pro Max (Safari Mobile 13.1) | |
| Apple iPhone 11 Pro (Safari Mobile 13.0) | |
| Apple iPad Pro 11 2018 (IOS 12.1.1) | |
| Apple iPhone XS (Safari Mobile 12) | |
| Huawei P30 Pro (Chrome 73) | |
| Asus ZenFone 6 ZS630KL (Chrome 75) | |
| LG G8s ThinQ (Chome 75) | |
| OnePlus 7 Pro (Chome 74) | |
| Samsung Galaxy S10 Plus (Samsung Browser 9.0) | |
| WebXPRT 3 - Overall | |
| Apple iPhone 11 (Safari Mobile 13.0) | |
| Apple iPhone 11 Pro (Safari Mobile 13.0) | |
| Apple iPhone 11 Pro Max (Safari Mobile 13.1) | |
| Average Apple A13 Bionic (146 - 202, n=5) | |
| Average of class Smartphone (104 - 380, n=12, last 2 years) | |
| Apple iPad Pro 11 2018 (Safari 13) | |
| Apple iPhone XS (Safari Mobile 12.0) | |
| Huawei P30 Pro (Chrome 73) | |
| Samsung Galaxy S10 Plus (Samsung Browser 9.0) | |
| OnePlus 7 Pro (Chrome 74) | |
| Asus ZenFone 6 ZS630KL (Chrome 75) | |
| LG G8s ThinQ (Chrome 75) | |
| Octane V2 - Total Score | |
| Average of class Smartphone (2800 - 126661, n=157, last 2 years) | |
| Apple iPhone 11 Pro Max (Safari Mobile 13.1) | |
| Apple iPhone 11 Pro (Safari Mobile 13.0) | |
| Apple iPhone 11 (Safari Mobile 13.0) | |
| Average Apple A13 Bionic (47288 - 49388, n=5) | |
| Apple iPad Pro 11 2018 (Safari 13) | |
| Apple iPhone XS (Safari Mobile 12.0) | |
| OnePlus 7 Pro (Chrome 74) | |
| Asus ZenFone 6 ZS630KL (Chrome 75) | |
| LG G8s ThinQ (Chrome 75) | |
| Huawei P30 Pro (Chrome 73) | |
| Samsung Galaxy S10 Plus (Samsung Browser 9.0) | |
| Mozilla Kraken 1.1 - Total | |
| LG G8s ThinQ (Chrome 75) | |
| Asus ZenFone 6 ZS630KL (Chrome 75) | |
| Huawei P30 Pro (Chrome 73) | |
| OnePlus 7 Pro (Chrome 74) | |
| Samsung Galaxy S10 Plus (Samsung Browser 9.0) | |
| Average of class Smartphone (257 - 28190, n=135, last 2 years) | |
| Apple iPhone XS (Safari Mobile 12.0) | |
| Apple iPad Pro 11 2018 (Safari 13) | |
| Apple iPhone 11 (Safari Mobile 13.0) | |
| Apple iPhone 11 Pro (Safari Mobile 13.0) | |
| Apple iPhone 11 Pro Max (Safari Mobile 13.1) | |
| Average Apple A13 Bionic (545 - 573, n=5) | |
* ... smaller is better
PUBG Mobile
Battle Bay
Asphalt 9: Legends
(+) The maximum temperature on the upper side is 38.8 °C / 102 F, compared to the average of 35.3 °C / 96 F, ranging from 21.9 to 247 °C for the class Smartphone.
(±) The bottom heats up to a maximum of 42.2 °C / 108 F, compared to the average of 34 °C / 93 F
(±) In idle usage, the average temperature for the upper side is 33.4 °C / 92 F, compared to the device average of 33 °C / 91 F.
Apple iPhone 11 Pro audio analysis
(+) | speakers can play relatively loud (85 dB)
Bass 100 - 315 Hz
(-) | nearly no bass - on average 15.9% lower than median
(±) | linearity of bass is average (11% delta to prev. frequency)
Mids 400 - 2000 Hz
(+) | balanced mids - only 4.8% away from median
(±) | linearity of mids is average (7% delta to prev. frequency)
Highs 2 - 16 kHz
(±) | higher highs - on average 9.3% higher than median
(+) | highs are linear (2.9% delta to prev. frequency)
Overall 100 - 16.000 Hz
(±) | linearity of overall sound is average (19.1% difference to median)
Compared to same class
» 25% of all tested devices in this class were better, 9% similar, 66% worse
» The best had a delta of 11%, average was 34%, worst was 134%
Compared to all devices tested
» 46% of all tested devices were better, 7% similar, 47% worse
» The best had a delta of 4%, average was 24%, worst was 134%
Samsung Galaxy S10 Plus audio analysis
(+) | speakers can play relatively loud (87.8 dB)
Bass 100 - 315 Hz
(-) | nearly no bass - on average 24.6% lower than median
(±) | linearity of bass is average (13.9% delta to prev. frequency)
Mids 400 - 2000 Hz
(+) | balanced mids - only 3.7% away from median
(+) | mids are linear (3% delta to prev. frequency)
Highs 2 - 16 kHz
(+) | balanced highs - only 4.8% away from median
(+) | highs are linear (2.8% delta to prev. frequency)
Overall 100 - 16.000 Hz
(±) | linearity of overall sound is average (16.9% difference to median)
Compared to same class
» 10% of all tested devices in this class were better, 7% similar, 83% worse
» The best had a delta of 11%, average was 34%, worst was 134%
Compared to all devices tested
» 30% of all tested devices were better, 8% similar, 62% worse
» The best had a delta of 4%, average was 24%, worst was 134%
| Off / Standby | |
| Idle | |
| Load |
|
Key:
min: | |
| Apple iPhone 11 Pro 3046 mAh | Apple iPhone XS 2658 mAh | Samsung Galaxy S10 Plus 4100 mAh | Huawei P30 Pro 4200 mAh | OnePlus 7 Pro 4000 mAh | LG G8s ThinQ 3550 mAh | Average Apple A13 Bionic | Average of class Smartphone | |
|---|---|---|---|---|---|---|---|---|
| Power Consumption | -5% | -33% | -26% | -43% | -46% | -47% | -46% | |
| Idle Minimum * (Watt) | 0.58 | 0.95 -64% | 0.73 -26% | 0.68 -17% | 0.9 -55% | 1.2 -107% | 0.76 ? -31% | 0.87 ? -50% |
| Idle Average * (Watt) | 1.99 | 1.34 33% | 1.53 23% | 2.6 -31% | 1.8 10% | 1.6 20% | 3.39 ? -70% | 1.467 ? 26% |
| Idle Maximum * (Watt) | 2.03 | 1.48 27% | 2.07 -2% | 2.77 -36% | 2.9 -43% | 2 1% | 3.44 ? -69% | 1.655 ? 18% |
| Load Average * (Watt) | 3.13 | 4 -28% | 6.03 -93% | 3.74 -19% | 5.5 -76% | 5 -60% | 4.66 ? -49% | 6.79 ? -117% |
| Load Maximum * (Watt) | 5.43 | 5.13 6% | 9.18 -69% | 6.82 -26% | 8.2 -51% | 10 -84% | 6.42 ? -18% | 11.3 ? -108% |
* ... smaller is better
| Apple iPhone 11 Pro 3046 mAh | Apple iPhone XS 2658 mAh | Samsung Galaxy S10 Plus 4100 mAh | Huawei P30 Pro 4200 mAh | OnePlus 7 Pro 4000 mAh | LG G8s ThinQ 3550 mAh | Asus ZenFone 6 ZS630KL 5000 mAh | |
|---|---|---|---|---|---|---|---|
| Battery runtime | -29% | -30% | 4% | -18% | -25% | 32% | |
| Reader / Idle (h) | 34.7 | 24 -31% | 26 -25% | 32.8 -5% | 29.1 -16% | 28.2 -19% | 35.2 1% |
| H.264 (h) | 17.4 | 12.4 -29% | 15.4 -11% | 19.9 14% | 13.4 -23% | 12.6 -28% | 35.6 105% |
| WiFi v1.3 (h) | 13.2 | 9.5 -28% | 8.1 -39% | 14 6% | 12.8 -3% | 11.6 -12% | 13.4 2% |
| Load (h) | 5.6 | 4.1 -27% | 3.1 -45% | 5.7 2% | 3.9 -30% | 3.4 -39% | 6.8 21% |
Pros
Cons
总结
iPhone 11 Pro是目前市场上最好的小型智能手机之一,目前很少有OEM提供5.8英寸旗舰产品。苹果还为其设备配备了比其前任产品更大的电池,这有助于其实现出色的运行时间。
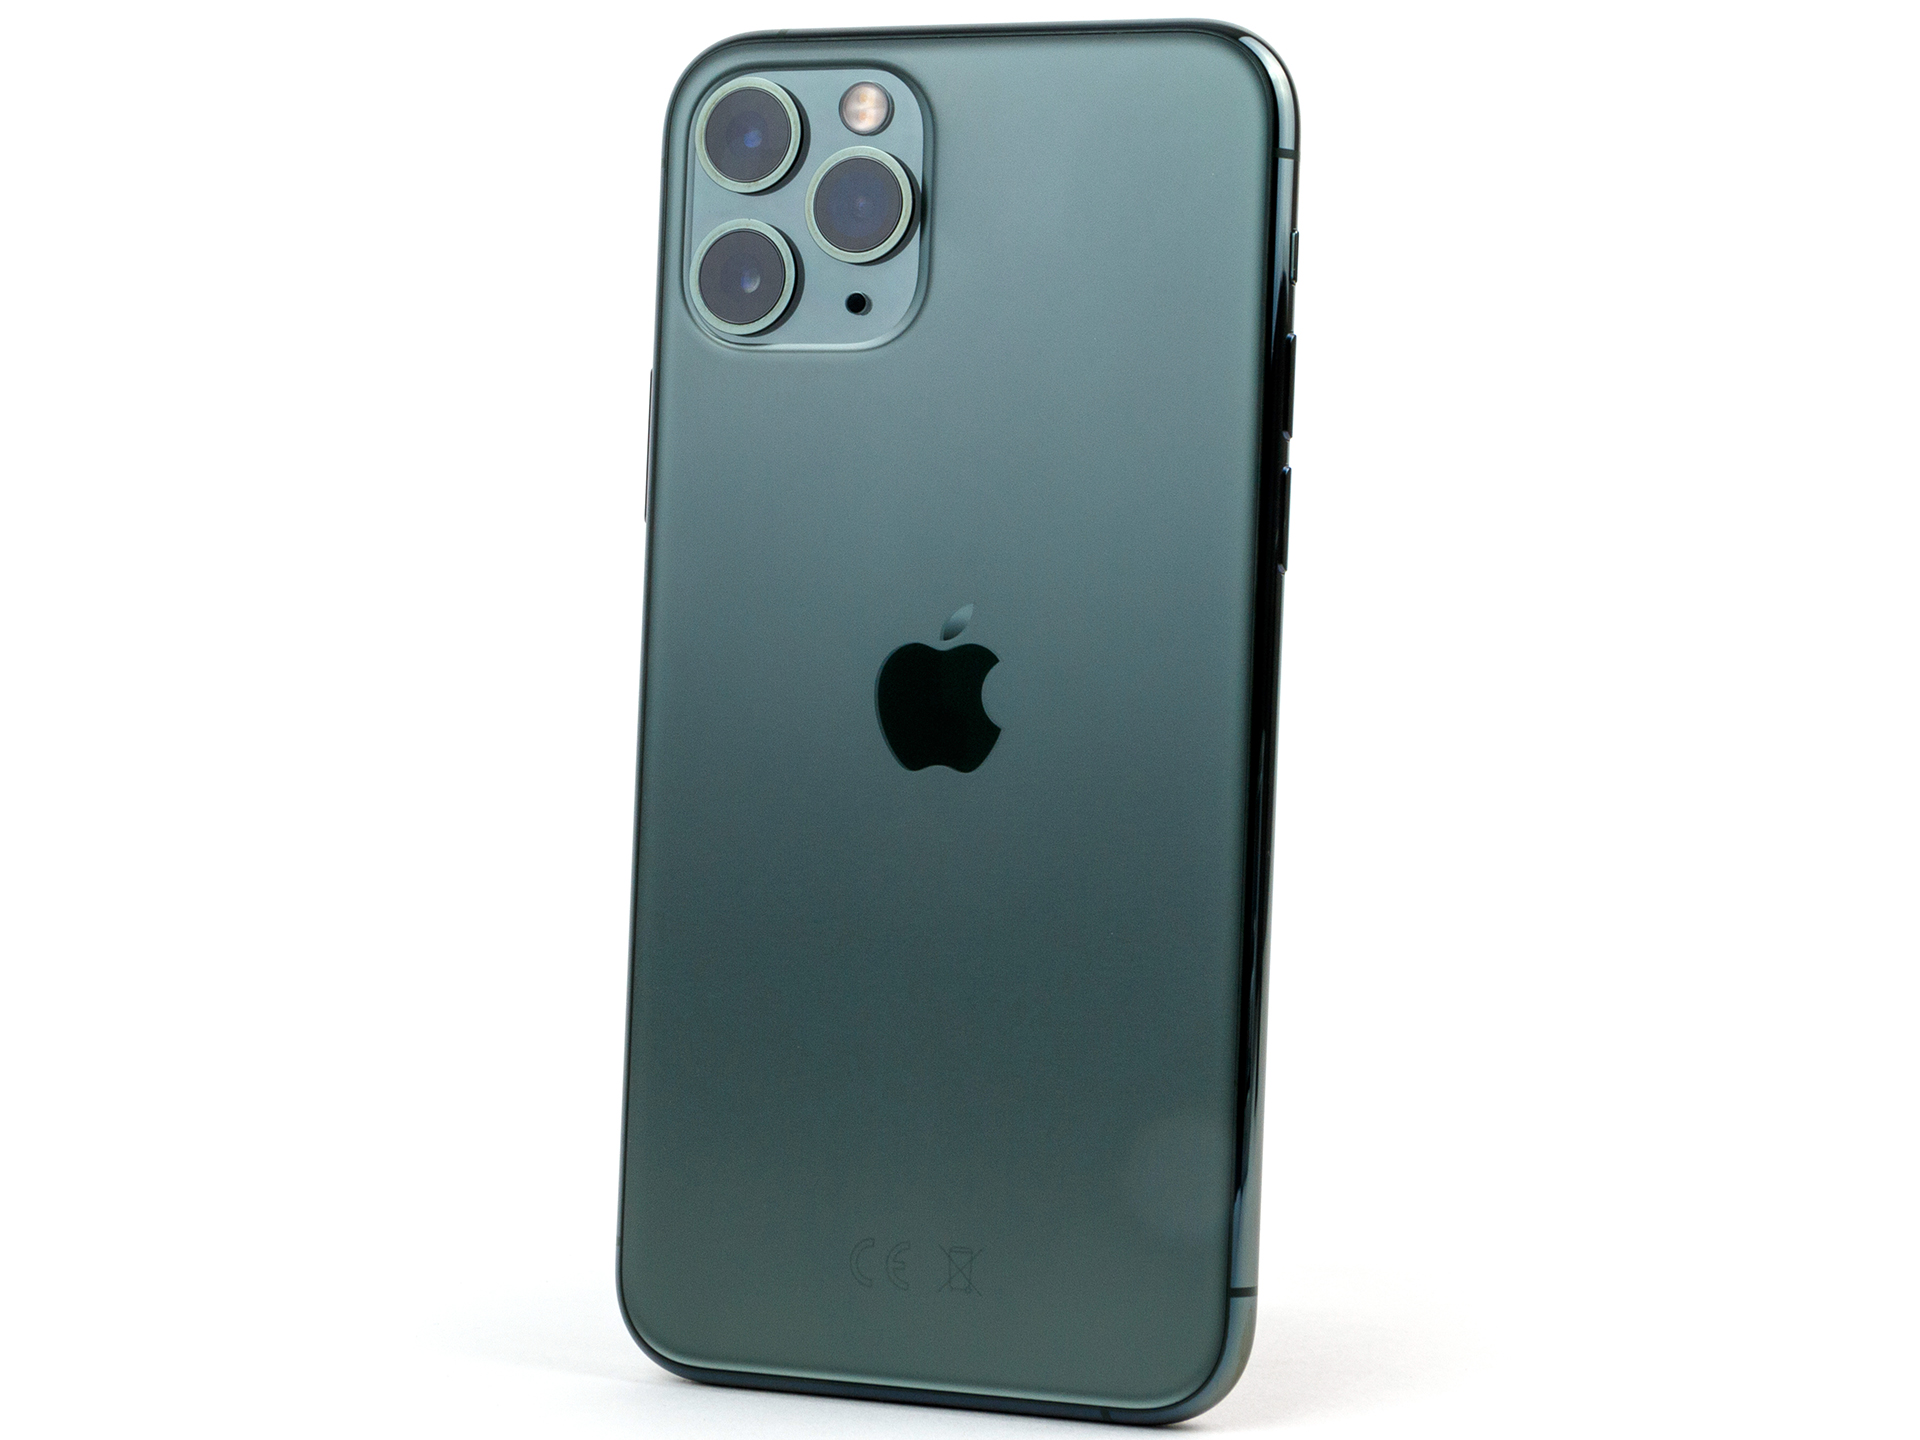
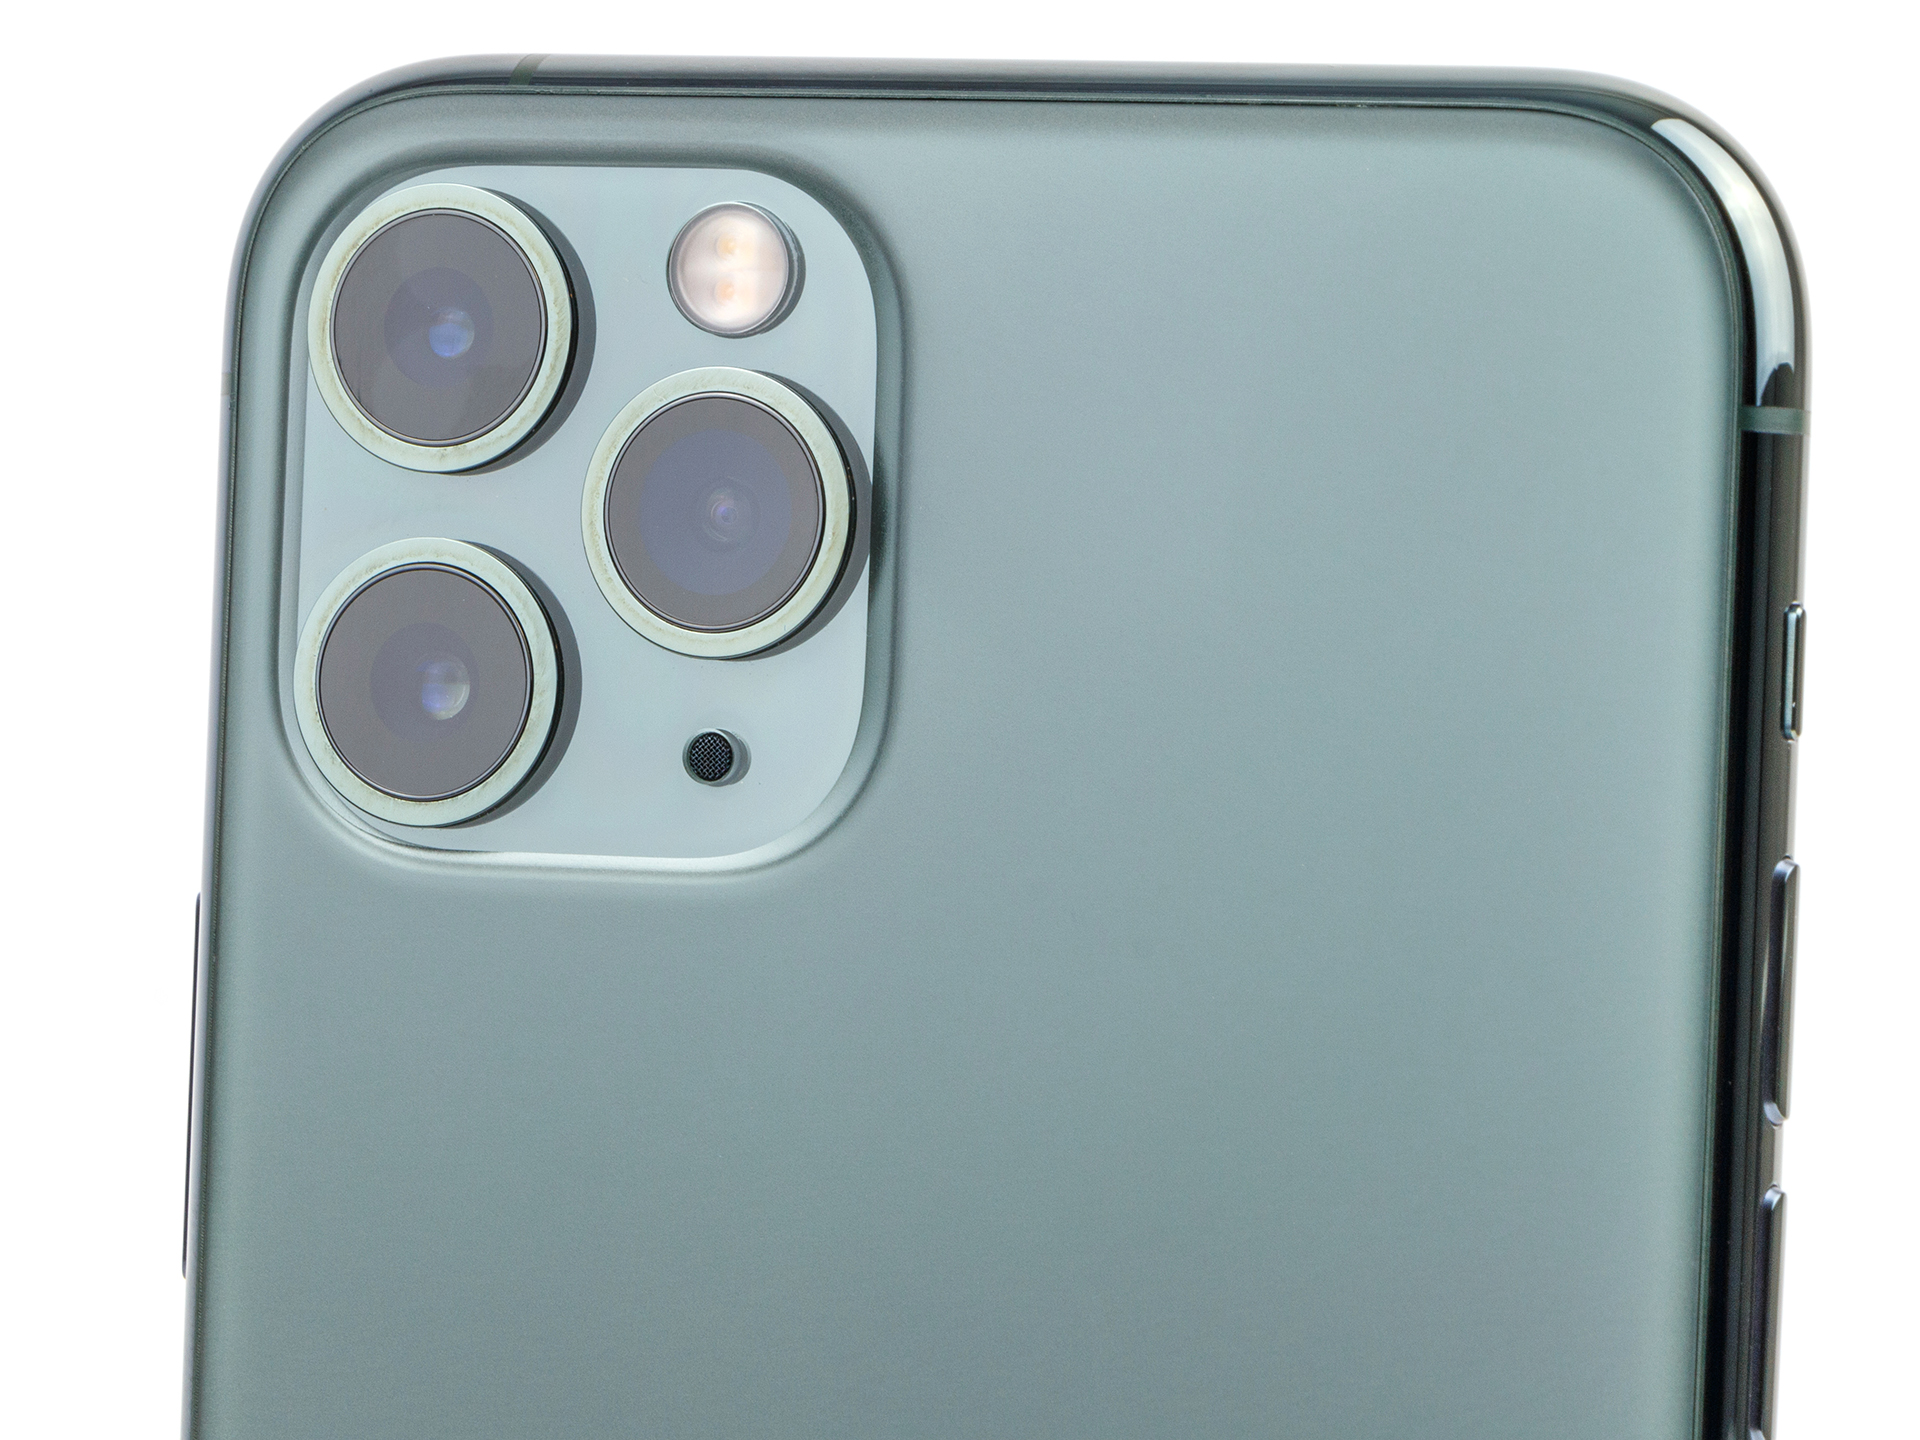
苹果在相机方面也取得了长足的进步,终于发布了带有三摄的iPhone。尽管它们在拍摄时在镜头之间切换的能力有限,但这些都以其出色的视频功能给人留下深刻的印象。
苹果iPhone 11 Pro凭借其出色的电池寿命和改进的相机获得了很高的评价。但是,其一般般的扬声器可能会让一些人失望。
苹果公司这次忽略的一个领域是音频。我们的评测单元中的扬声器会失真,并会产生过多的回响,缺乏真正的高分辨率蓝牙音频编解码器也使我们感到困惑。也还是取消了耳机接口。总体而言,只能说我们期待的是它能在此价格范围内提供更多服务。
此外,包含64 GB型号似乎无法拍摄UHD和60 FPS视频,因为这些视频的文件很大。同样,即使没有可选的5G,即使新技术尚未成熟,iPhone 11系列也感觉有些过时。简而言之,iPhone 11 Pro是出色的旗舰产品,但也有其缺点。
Apple iPhone 11 Pro
- 08/31/2022 v7 (old)
Daniel Schmidt
Price comparison

