宏碁 Swift 5 SF514-51-59AV 笔记本简短评测


| SD Card Reader | |
| average JPG Copy Test (av. of 3 runs) | |
| Dell XPS 13 9360 FHD i5 | |
| Lenovo IdeaPad 510S-13IKB 80V00026GE | |
| Acer Swift 5 SF514-51-59AV | |
| Medion Akoya S3409-MD60234 | |
| maximum AS SSD Seq Read Test (1GB) | |
| Dell XPS 13 9360 FHD i5 | |
| Acer Swift 5 SF514-51-59AV | |
| Lenovo IdeaPad 510S-13IKB 80V00026GE | |
| Medion Akoya S3409-MD60234 | |
| Networking | |
| iperf Server (receive) TCP 1 m | |
| Asus Zenbook 3 UX390UA-GS041T (jseb) | |
| Acer Swift 5 SF514-51-59AV (jseb) | |
| Medion Akoya S3409-MD60234 (jseb) | |
| Lenovo IdeaPad 510S-13IKB 80V00026GE | |
| iperf Client (transmit) TCP 1 m | |
| Acer Swift 5 SF514-51-59AV (jseb) | |
| Asus Zenbook 3 UX390UA-GS041T (jseb) | |
| Medion Akoya S3409-MD60234 (jseb) | |
| Lenovo IdeaPad 510S-13IKB 80V00026GE | |
| |||||||||||||||||||||||||
Brightness Distribution: 79 %
Center on Battery: 393 cd/m²
Contrast: 1355:1 (Black: 0.29 cd/m²)
ΔE ColorChecker Calman: 6.17 | ∀{0.5-29.43 Ø4.71}
ΔE Greyscale Calman: 6.8 | ∀{0.09-98 Ø4.96}
91% sRGB (Argyll 1.6.3 3D)
51% AdobeRGB 1998 (Argyll 1.6.3 3D)
64.3% AdobeRGB 1998 (Argyll 3D)
91.3% sRGB (Argyll 3D)
62.8% Display P3 (Argyll 3D)
Gamma: 2.27
CCT: 6873 K
| Acer Swift 5 SF514-51-59AV AU Optronics B140HAN3.2, , 1920x1080, 14" | Lenovo IdeaPad 510S-13IKB 80V00026GE LG Philips LP133WF2-SPL1, , 1920x1080, 13.3" | Medion Akoya S3409-MD60234 LG Philips LP133QD1-SPA3, , 3200x1800, 13.3" | Dell XPS 13 9360 FHD i5 Sharp SHP1449 LQ133M1, , 1920x1080, 13.3" | Asus Zenbook 3 UX390UA-GS041T AUO B125HAN03.0 AUO306D, , 1920x1080, 12.5" | |
|---|---|---|---|---|---|
| Display | -38% | -1% | -21% | 1% | |
| Display P3 Coverage (%) | 62.8 | 38.61 -39% | 64.6 3% | 48.94 -22% | 64.7 3% |
| sRGB Coverage (%) | 91.3 | 57.9 -37% | 87.3 -4% | 73.3 -20% | 89.6 -2% |
| AdobeRGB 1998 Coverage (%) | 64.3 | 39.92 -38% | 63.8 -1% | 50.5 -21% | 65.4 2% |
| Response Times | 19% | 22% | 9% | 24% | |
| Response Time Grey 50% / Grey 80% * (ms) | 51 ? | 39 ? 24% | 34 ? 33% | 32.8 ? 36% | 30 ? 41% |
| Response Time Black / White * (ms) | 28 ? | 24 ? 14% | 25 ? 11% | 33.2 ? -19% | 26 ? 7% |
| PWM Frequency (Hz) | 250 ? | 50 ? | |||
| Screen | -10% | -10% | 4% | 1% | |
| Brightness middle (cd/m²) | 393 | 259 -34% | 295 -25% | 351.2 -11% | 355 -10% |
| Brightness (cd/m²) | 338 | 253 -25% | 283 -16% | 325 -4% | 341 1% |
| Brightness Distribution (%) | 79 | 82 4% | 88 11% | 89 13% | 87 10% |
| Black Level * (cd/m²) | 0.29 | 0.33 -14% | 0.65 -124% | 0.195 33% | 0.3 -3% |
| Contrast (:1) | 1355 | 785 -42% | 454 -66% | 1801 33% | 1183 -13% |
| Colorchecker dE 2000 * | 6.17 | 5.12 17% | 4 35% | 7.4 -20% | 5.97 3% |
| Colorchecker dE 2000 max. * | 11.21 | 10.12 10% | 7.26 35% | 9.08 19% | 10.55 6% |
| Greyscale dE 2000 * | 6.8 | 3.8 44% | 3.38 50% | 6.71 1% | 6.45 5% |
| Gamma | 2.27 97% | 2.39 92% | 2.38 92% | 2.74 80% | 2.45 90% |
| CCT | 6873 95% | 7405 88% | 6520 100% | 7222 90% | 7694 84% |
| Color Space (Percent of AdobeRGB 1998) (%) | 51 | 37 -27% | 57 12% | 50.48 -1% | 58 14% |
| Color Space (Percent of sRGB) (%) | 91 | 58 -36% | 85 -7% | 73.31 -19% | 89 -2% |
| Total Average (Program / Settings) | -10% /
-12% | 4% /
-4% | -3% /
-0% | 9% /
4% |
* ... smaller is better
Display Response Times
| ↔ Response Time Black to White | ||
|---|---|---|
| 28 ms ... rise ↗ and fall ↘ combined | ↗ 7 ms rise | 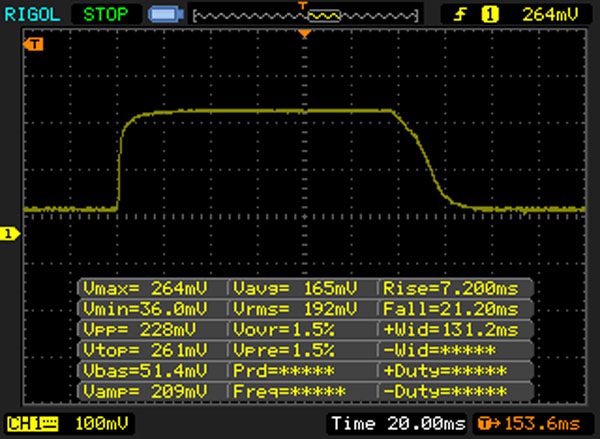 |
| ↘ 21 ms fall | ||
| The screen shows relatively slow response rates in our tests and may be too slow for gamers. In comparison, all tested devices range from 0.1 (minimum) to 240 (maximum) ms. » 71 % of all devices are better. This means that the measured response time is worse than the average of all tested devices (19.8 ms). | ||
| ↔ Response Time 50% Grey to 80% Grey | ||
| 51 ms ... rise ↗ and fall ↘ combined | ↗ 20 ms rise | 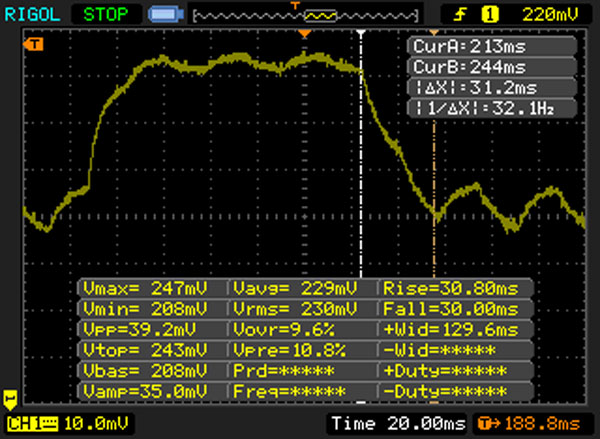 |
| ↘ 31 ms fall | ||
| The screen shows slow response rates in our tests and will be unsatisfactory for gamers. In comparison, all tested devices range from 0.165 (minimum) to 636 (maximum) ms. » 87 % of all devices are better. This means that the measured response time is worse than the average of all tested devices (31 ms). | ||
Screen Flickering / PWM (Pulse-Width Modulation)
| Screen flickering / PWM not detected | ||
In comparison: 52 % of all tested devices do not use PWM to dim the display. If PWM was detected, an average of 7754 (minimum: 5 - maximum: 343500) Hz was measured. | ||
| PCMark 8 - Home Score Accelerated v2 | |
| Lenovo IdeaPad 510S-13IKB 80V00026GE | |
| Dell XPS 13 9360 FHD i5 | |
| Acer Swift 5 SF514-51-59AV | |
| Medion Akoya S3409-MD60234 | |
| Asus Zenbook 3 UX390UA-GS041T | |
| PCMark 7 Score | 5367 points | |
| PCMark 8 Home Score Accelerated v2 | 3370 points | |
Help | ||
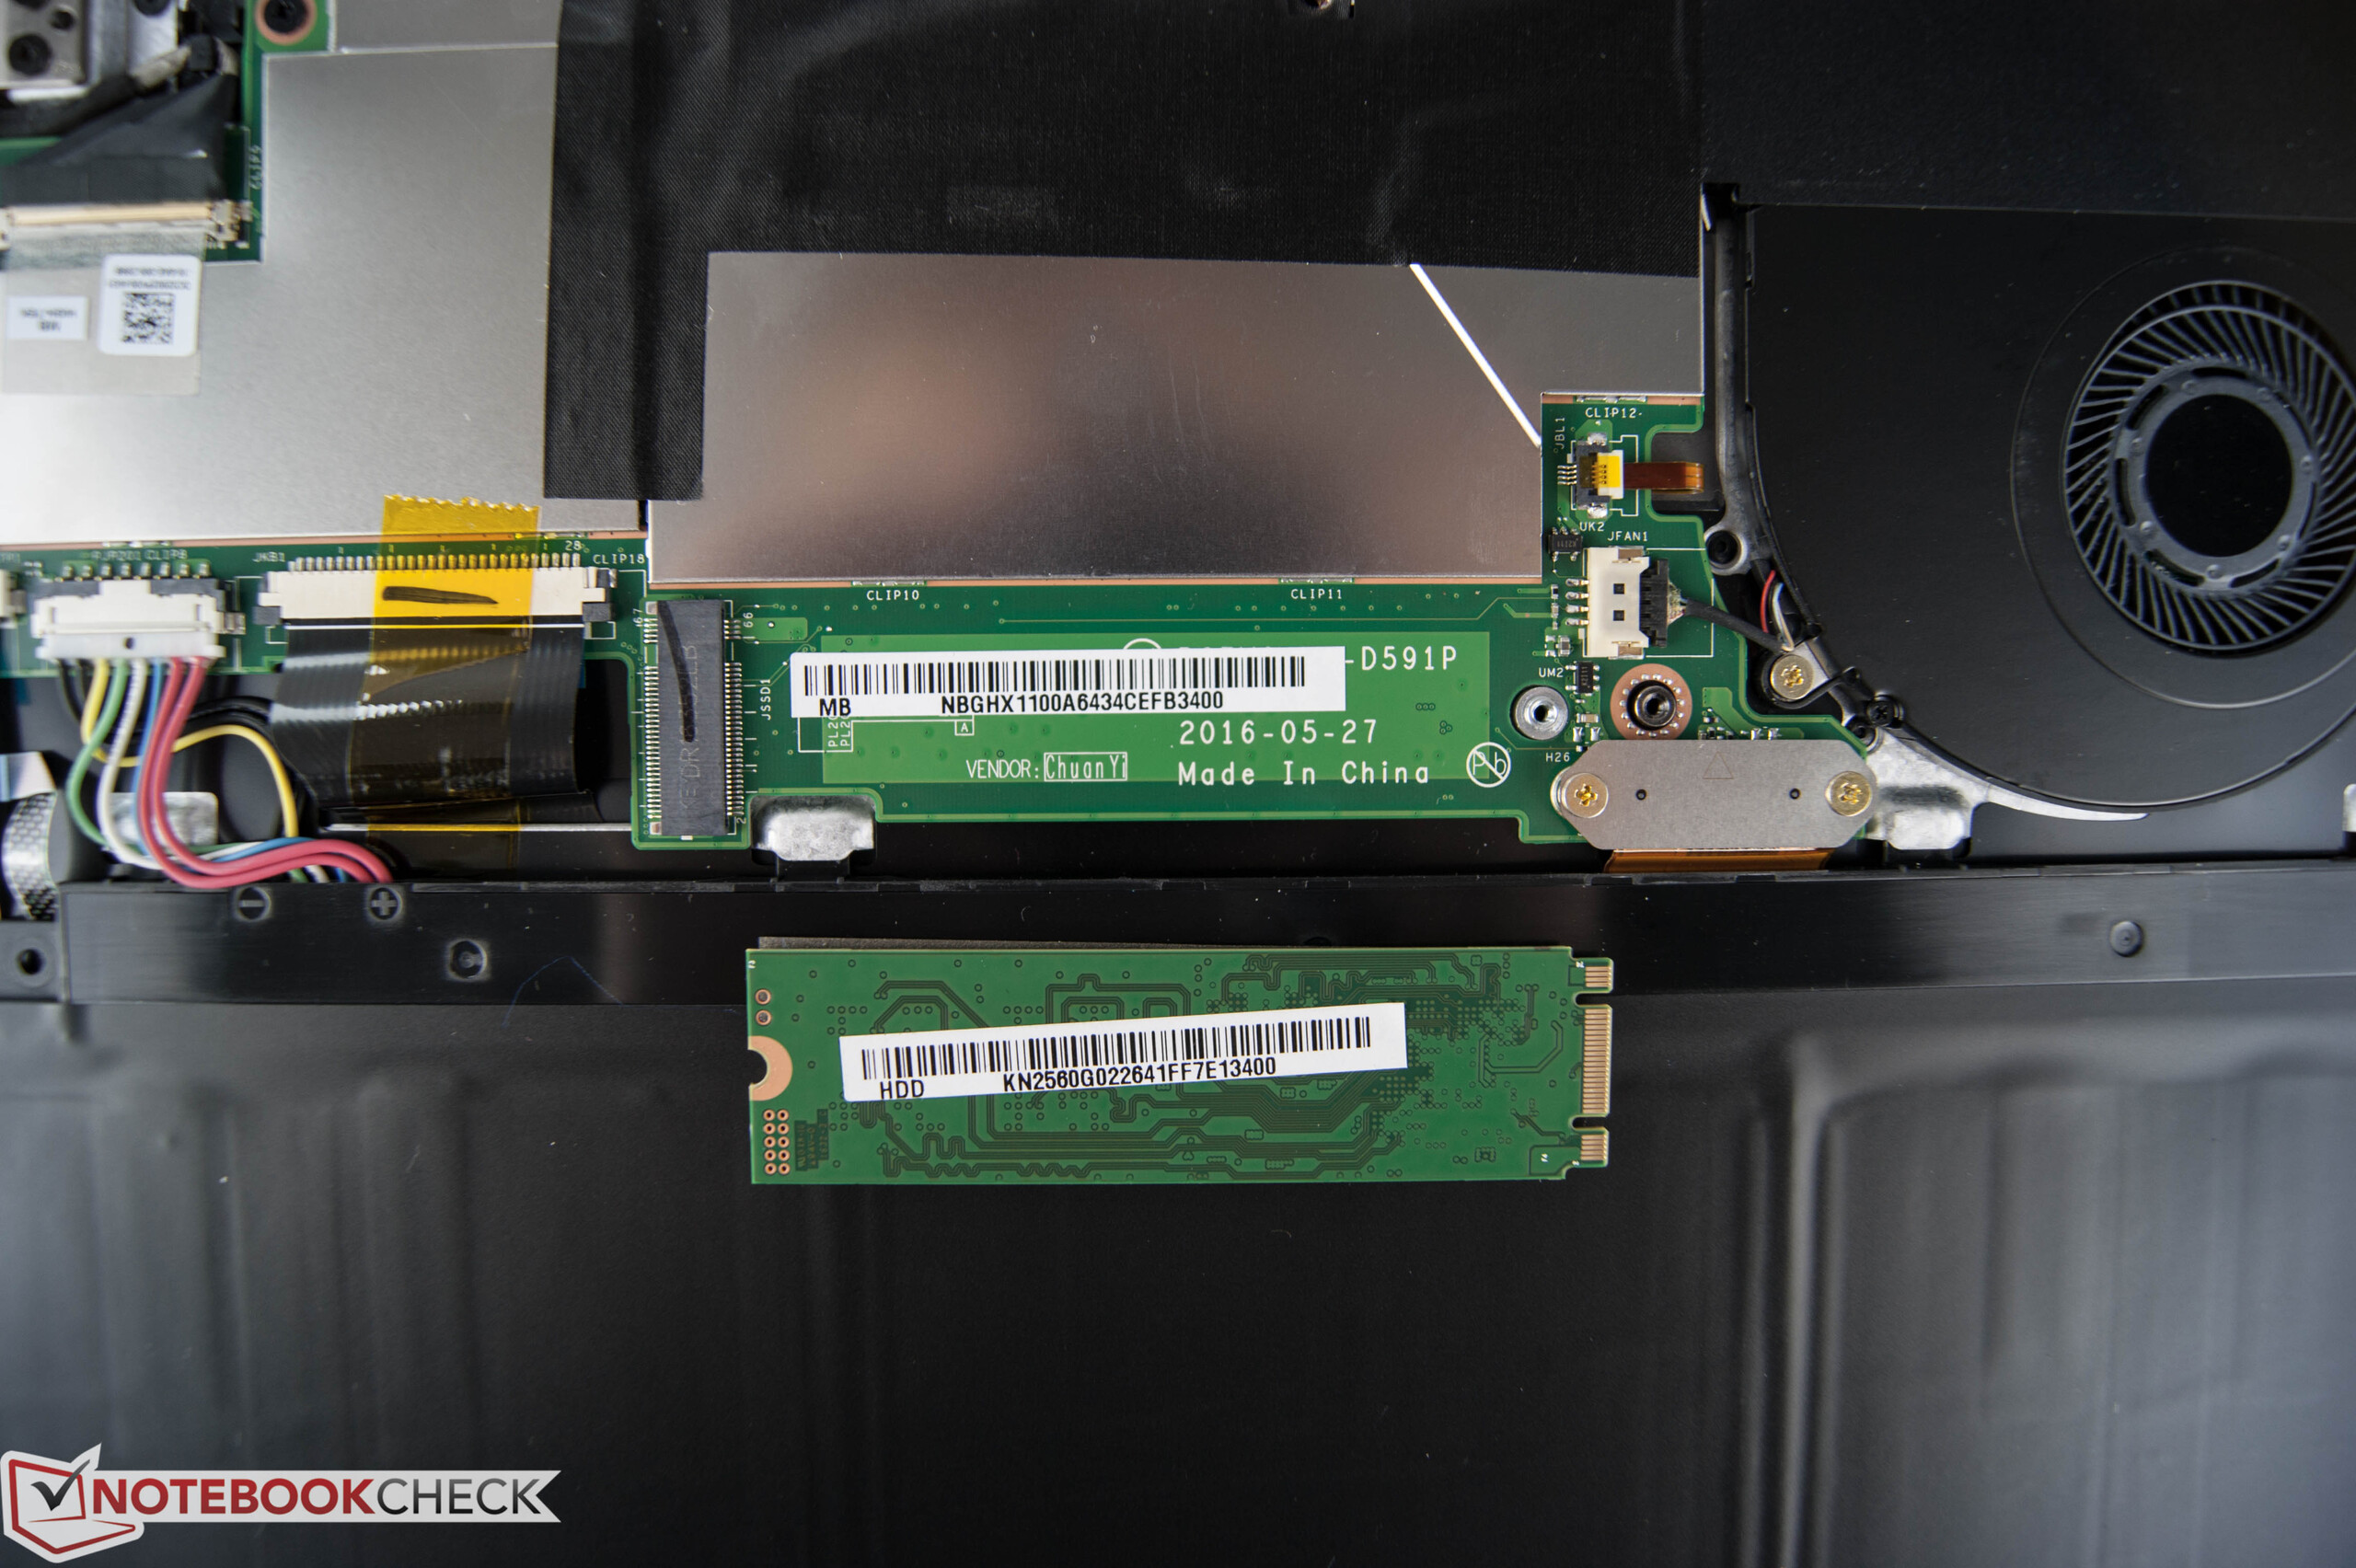
| Acer Swift 5 SF514-51-59AV SK Hynix HFS256G39TND-N210A | Lenovo IdeaPad 510S-13IKB 80V00026GE Samsung MZYTY256HDHP | Medion Akoya S3409-MD60234 Phison S10C-512G | Dell XPS 13 9360 FHD i5 Toshiba NVMe THNSN5256GPUK | Asus Zenbook 3 UX390UA-GS041T SK Hynix Canvas SC300 512GB M.2 (HFS512G39MND) | |
|---|---|---|---|---|---|
| CrystalDiskMark 3.0 | 15% | 25% | 87% | 15% | |
| Read Seq (MB/s) | 517 | 494.5 -4% | 522 1% | 1233 138% | 508 -2% |
| Write Seq (MB/s) | 258.1 | 494.1 91% | 384.4 49% | 733 184% | 454.4 76% |
| Read 512 (MB/s) | 355 | 383.9 8% | 412 16% | 1036 192% | 335.5 -5% |
| Write 512 (MB/s) | 258.5 | 155.5 -40% | 395.5 53% | 439.9 70% | 413.9 60% |
| Read 4k (MB/s) | 29.65 | 36.08 22% | 34.07 15% | 29.31 -1% | 28.13 -5% |
| Write 4k (MB/s) | 77.3 | 96.4 25% | 100.9 31% | 116.9 51% | 69.8 -10% |
| Read 4k QD32 (MB/s) | 277.1 | 403.3 46% | 316.3 14% | 479.2 73% | 245.7 -11% |
| Write 4k QD32 (MB/s) | 242.5 | 176.4 -27% | 286.4 18% | 218.3 -10% | 277.6 14% |

| 3DMark - 1280x720 Cloud Gate Standard Graphics | |
| Acer Swift 5 SF514-51-59AV | |
| Dell XPS 13 9360 FHD i5 | |
| Asus Zenbook 3 UX390UA-GS041T | |
| Medion Akoya S3409-MD60234 | |
| Lenovo IdeaPad 510S-13IKB 80V00026GE | |
| HP 15-ay116ng | |
| Lenovo Yoga 710-14IKB 80V4002HGE | |
| 3DMark 11 Performance | 1684 points | |
| 3DMark Cloud Gate Standard Score | 6378 points | |
Help | ||
| BioShock Infinite | |
| 1366x768 Medium Preset | |
| Acer Swift 5 SF514-51-59AV | |
| Medion Akoya S3409-MD60234 | |
| Asus Zenbook 3 UX390UA-GS041T | |
| Lenovo IdeaPad 510S-13IKB 80V00026GE | |
| 1366x768 High Preset | |
| Acer Swift 5 SF514-51-59AV | |
| Medion Akoya S3409-MD60234 | |
| Lenovo IdeaPad 510S-13IKB 80V00026GE | |
| Asus Zenbook 3 UX390UA-GS041T | |
| low | med. | high | ultra | |
|---|---|---|---|---|
| BioShock Infinite (2013) | 51 | 30.9 | 25.6 | 8.2 |
| The Witcher 3 (2015) | 12.1 | 8.4 | 4.2 | |
| Rise of the Tomb Raider (2016) | 20.23 | 11.42 | 6.42 | 4.8 |
Noise level
| Idle |
| 30.5 / 30.5 / 30.5 dB(A) |
| Load |
| 32.25 / 32.6 dB(A) |
 | ||
30 dB silent 40 dB(A) audible 50 dB(A) loud |
||
min: | ||
(+) The maximum temperature on the upper side is 39.4 °C / 103 F, compared to the average of 35.9 °C / 97 F, ranging from 21.4 to 59 °C for the class Subnotebook.
(±) The bottom heats up to a maximum of 40 °C / 104 F, compared to the average of 39.2 °C / 103 F
(+) In idle usage, the average temperature for the upper side is 24 °C / 75 F, compared to the device average of 30.8 °C / 87 F.
(+) The palmrests and touchpad are cooler than skin temperature with a maximum of 27.3 °C / 81.1 F and are therefore cool to the touch.
(±) The average temperature of the palmrest area of similar devices was 28.2 °C / 82.8 F (+0.9 °C / 1.7 F).
Acer Swift 5 SF514-51-59AV audio analysis
(-) | not very loud speakers (66 dB)
Bass 100 - 315 Hz
(±) | reduced bass - on average 14.7% lower than median
(±) | linearity of bass is average (13.5% delta to prev. frequency)
Mids 400 - 2000 Hz
(±) | higher mids - on average 5.3% higher than median
(±) | linearity of mids is average (7.3% delta to prev. frequency)
Highs 2 - 16 kHz
(+) | balanced highs - only 3.9% away from median
(±) | linearity of highs is average (8.1% delta to prev. frequency)
Overall 100 - 16.000 Hz
(±) | linearity of overall sound is average (22% difference to median)
Compared to same class
» 75% of all tested devices in this class were better, 6% similar, 19% worse
» The best had a delta of 5%, average was 18%, worst was 53%
Compared to all devices tested
» 64% of all tested devices were better, 6% similar, 30% worse
» The best had a delta of 4%, average was 23%, worst was 134%
Apple MacBook 12 (Early 2016) 1.1 GHz audio analysis
(+) | speakers can play relatively loud (83.6 dB)
Bass 100 - 315 Hz
(±) | reduced bass - on average 11.3% lower than median
(±) | linearity of bass is average (14.2% delta to prev. frequency)
Mids 400 - 2000 Hz
(+) | balanced mids - only 2.4% away from median
(+) | mids are linear (5.5% delta to prev. frequency)
Highs 2 - 16 kHz
(+) | balanced highs - only 2% away from median
(+) | highs are linear (4.5% delta to prev. frequency)
Overall 100 - 16.000 Hz
(+) | overall sound is linear (10.2% difference to median)
Compared to same class
» 7% of all tested devices in this class were better, 2% similar, 90% worse
» The best had a delta of 5%, average was 18%, worst was 53%
Compared to all devices tested
» 5% of all tested devices were better, 1% similar, 94% worse
» The best had a delta of 4%, average was 23%, worst was 134%
| Off / Standby | |
| Idle | |
| Load |
|
Key:
min: | |
| Acer Swift 5 SF514-51-59AV i5-7200U, HD Graphics 620, SK Hynix HFS256G39TND-N210A, IPS, 1920x1080, 14" | Lenovo IdeaPad 510S-13IKB 80V00026GE i7-7500U, HD Graphics 620, Samsung MZYTY256HDHP, IPS, 1920x1080, 13.3" | Medion Akoya S3409-MD60234 i7-7500U, HD Graphics 620, Phison S10C-512G, IPS, 3200x1800, 13.3" | Dell XPS 13 9360 FHD i5 i5-7200U, HD Graphics 620, Toshiba NVMe THNSN5256GPUK, IPS, 1920x1080, 13.3" | Asus Zenbook 3 UX390UA-GS041T i5-7200U, HD Graphics 620, SK Hynix Canvas SC300 512GB M.2 (HFS512G39MND), IPS, 1920x1080, 12.5" | |
|---|---|---|---|---|---|
| Power Consumption | 16% | -11% | 24% | 10% | |
| Idle Minimum * (Watt) | 3.6 | 3.3 8% | 4.2 -17% | 4.1 -14% | 3.3 8% |
| Idle Average * (Watt) | 7 | 5.8 17% | 9 -29% | 4.2 40% | 6.2 11% |
| Idle Maximum * (Watt) | 9.3 | 7.4 20% | 10.6 -14% | 5.1 45% | 10.4 -12% |
| Load Average * (Watt) | 37 | 29.2 21% | 34 8% | 22.1 40% | 28 24% |
| Load Maximum * (Watt) | 32.6 | 28.6 12% | 33 -1% | 29.4 10% | 25.7 21% |
* ... smaller is better
| Acer Swift 5 SF514-51-59AV i5-7200U, HD Graphics 620, 53.9 Wh | Lenovo IdeaPad 510S-13IKB 80V00026GE i7-7500U, HD Graphics 620, 35 Wh | Medion Akoya S3409-MD60234 i7-7500U, HD Graphics 620, 45 Wh | Dell XPS 13 9360 FHD i5 i5-7200U, HD Graphics 620, 60 Wh | Asus Zenbook 3 UX390UA-GS041T i5-7200U, HD Graphics 620, 40 Wh | |
|---|---|---|---|---|---|
| Battery runtime | -24% | -35% | 35% | -18% | |
| Reader / Idle (h) | 16.9 | 10.8 -36% | 12 -29% | 21.6 28% | 14.1 -17% |
| H.264 (h) | 9.3 | 5.5 -41% | 4.1 -56% | 6.4 -31% | |
| WiFi v1.3 (h) | 9.2 | 5.7 -38% | 4.6 -50% | 11.3 23% | 6.6 -28% |
| Load (h) | 1.7 | 2 18% | 1.6 -6% | 2.6 53% | 1.8 6% |
Pros
Cons
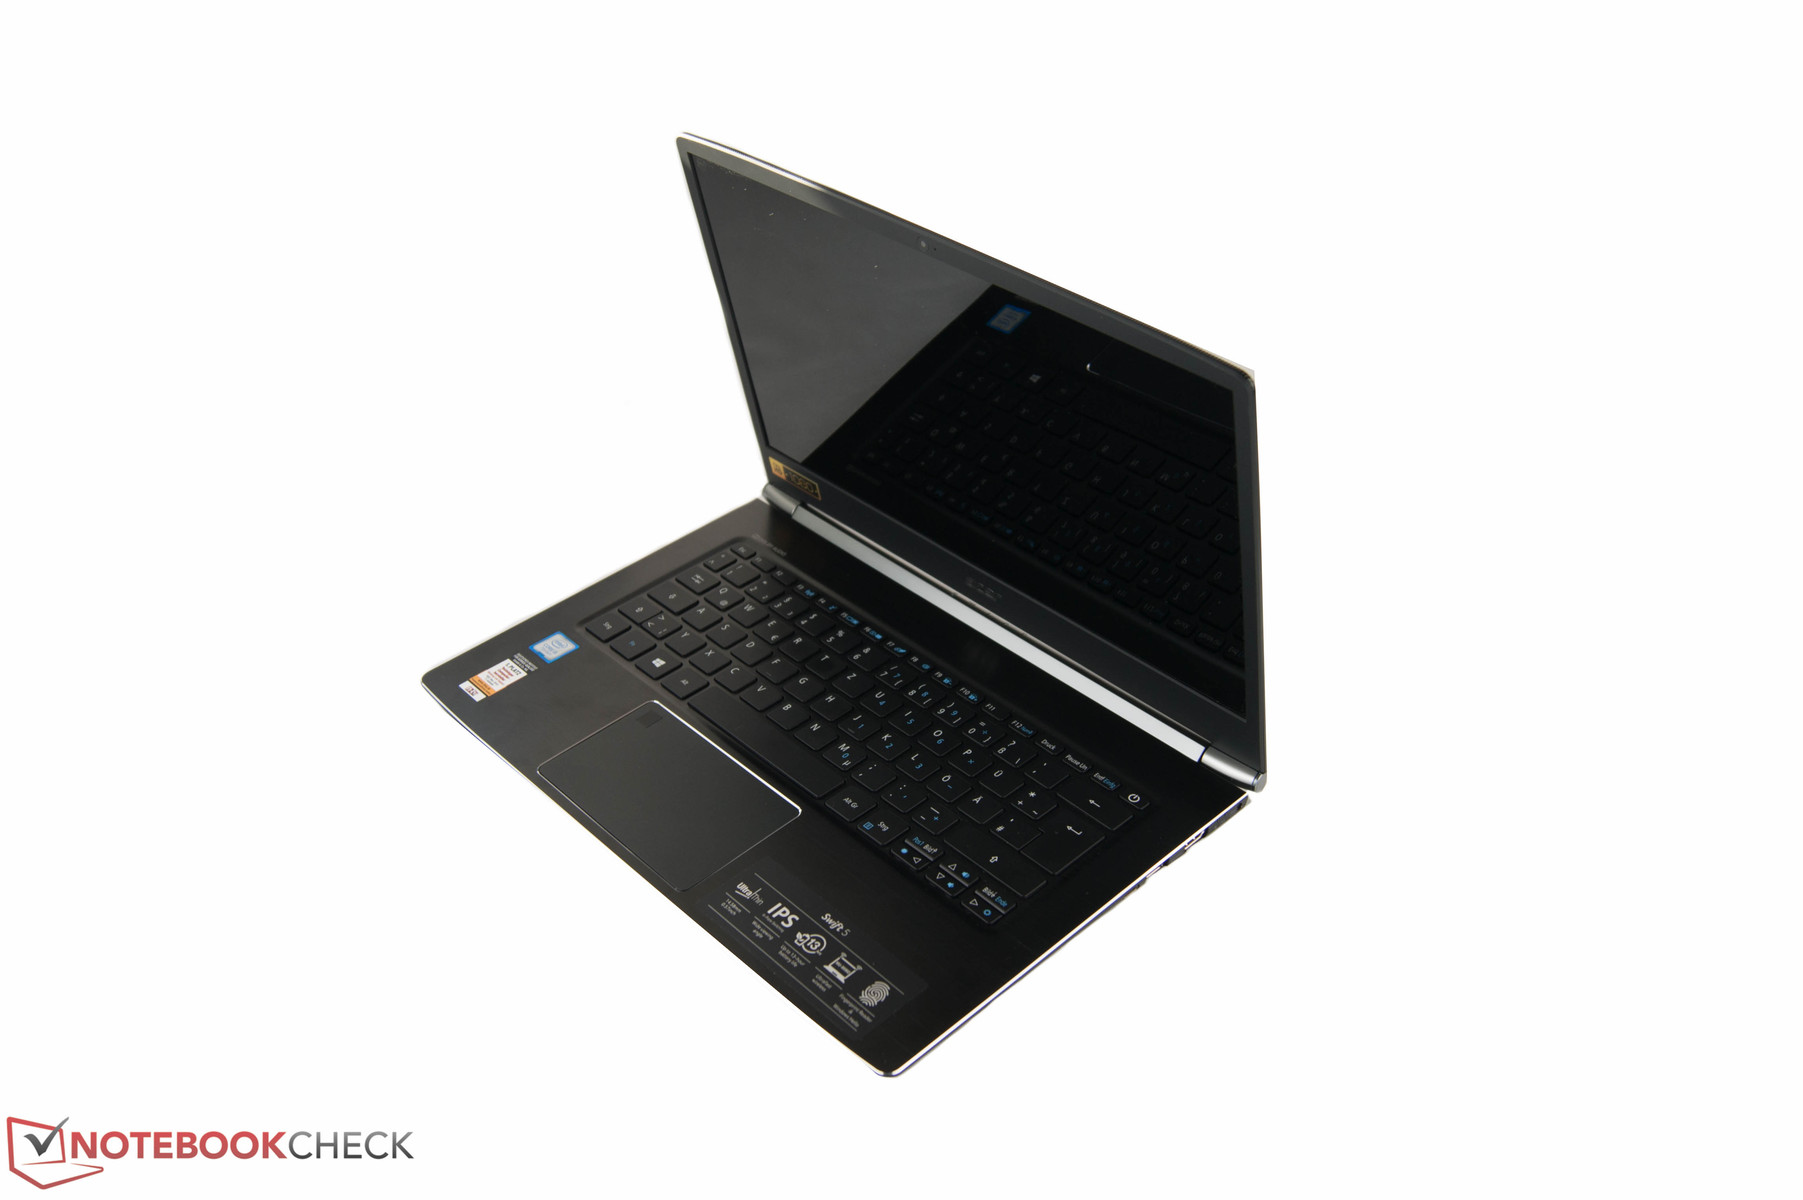
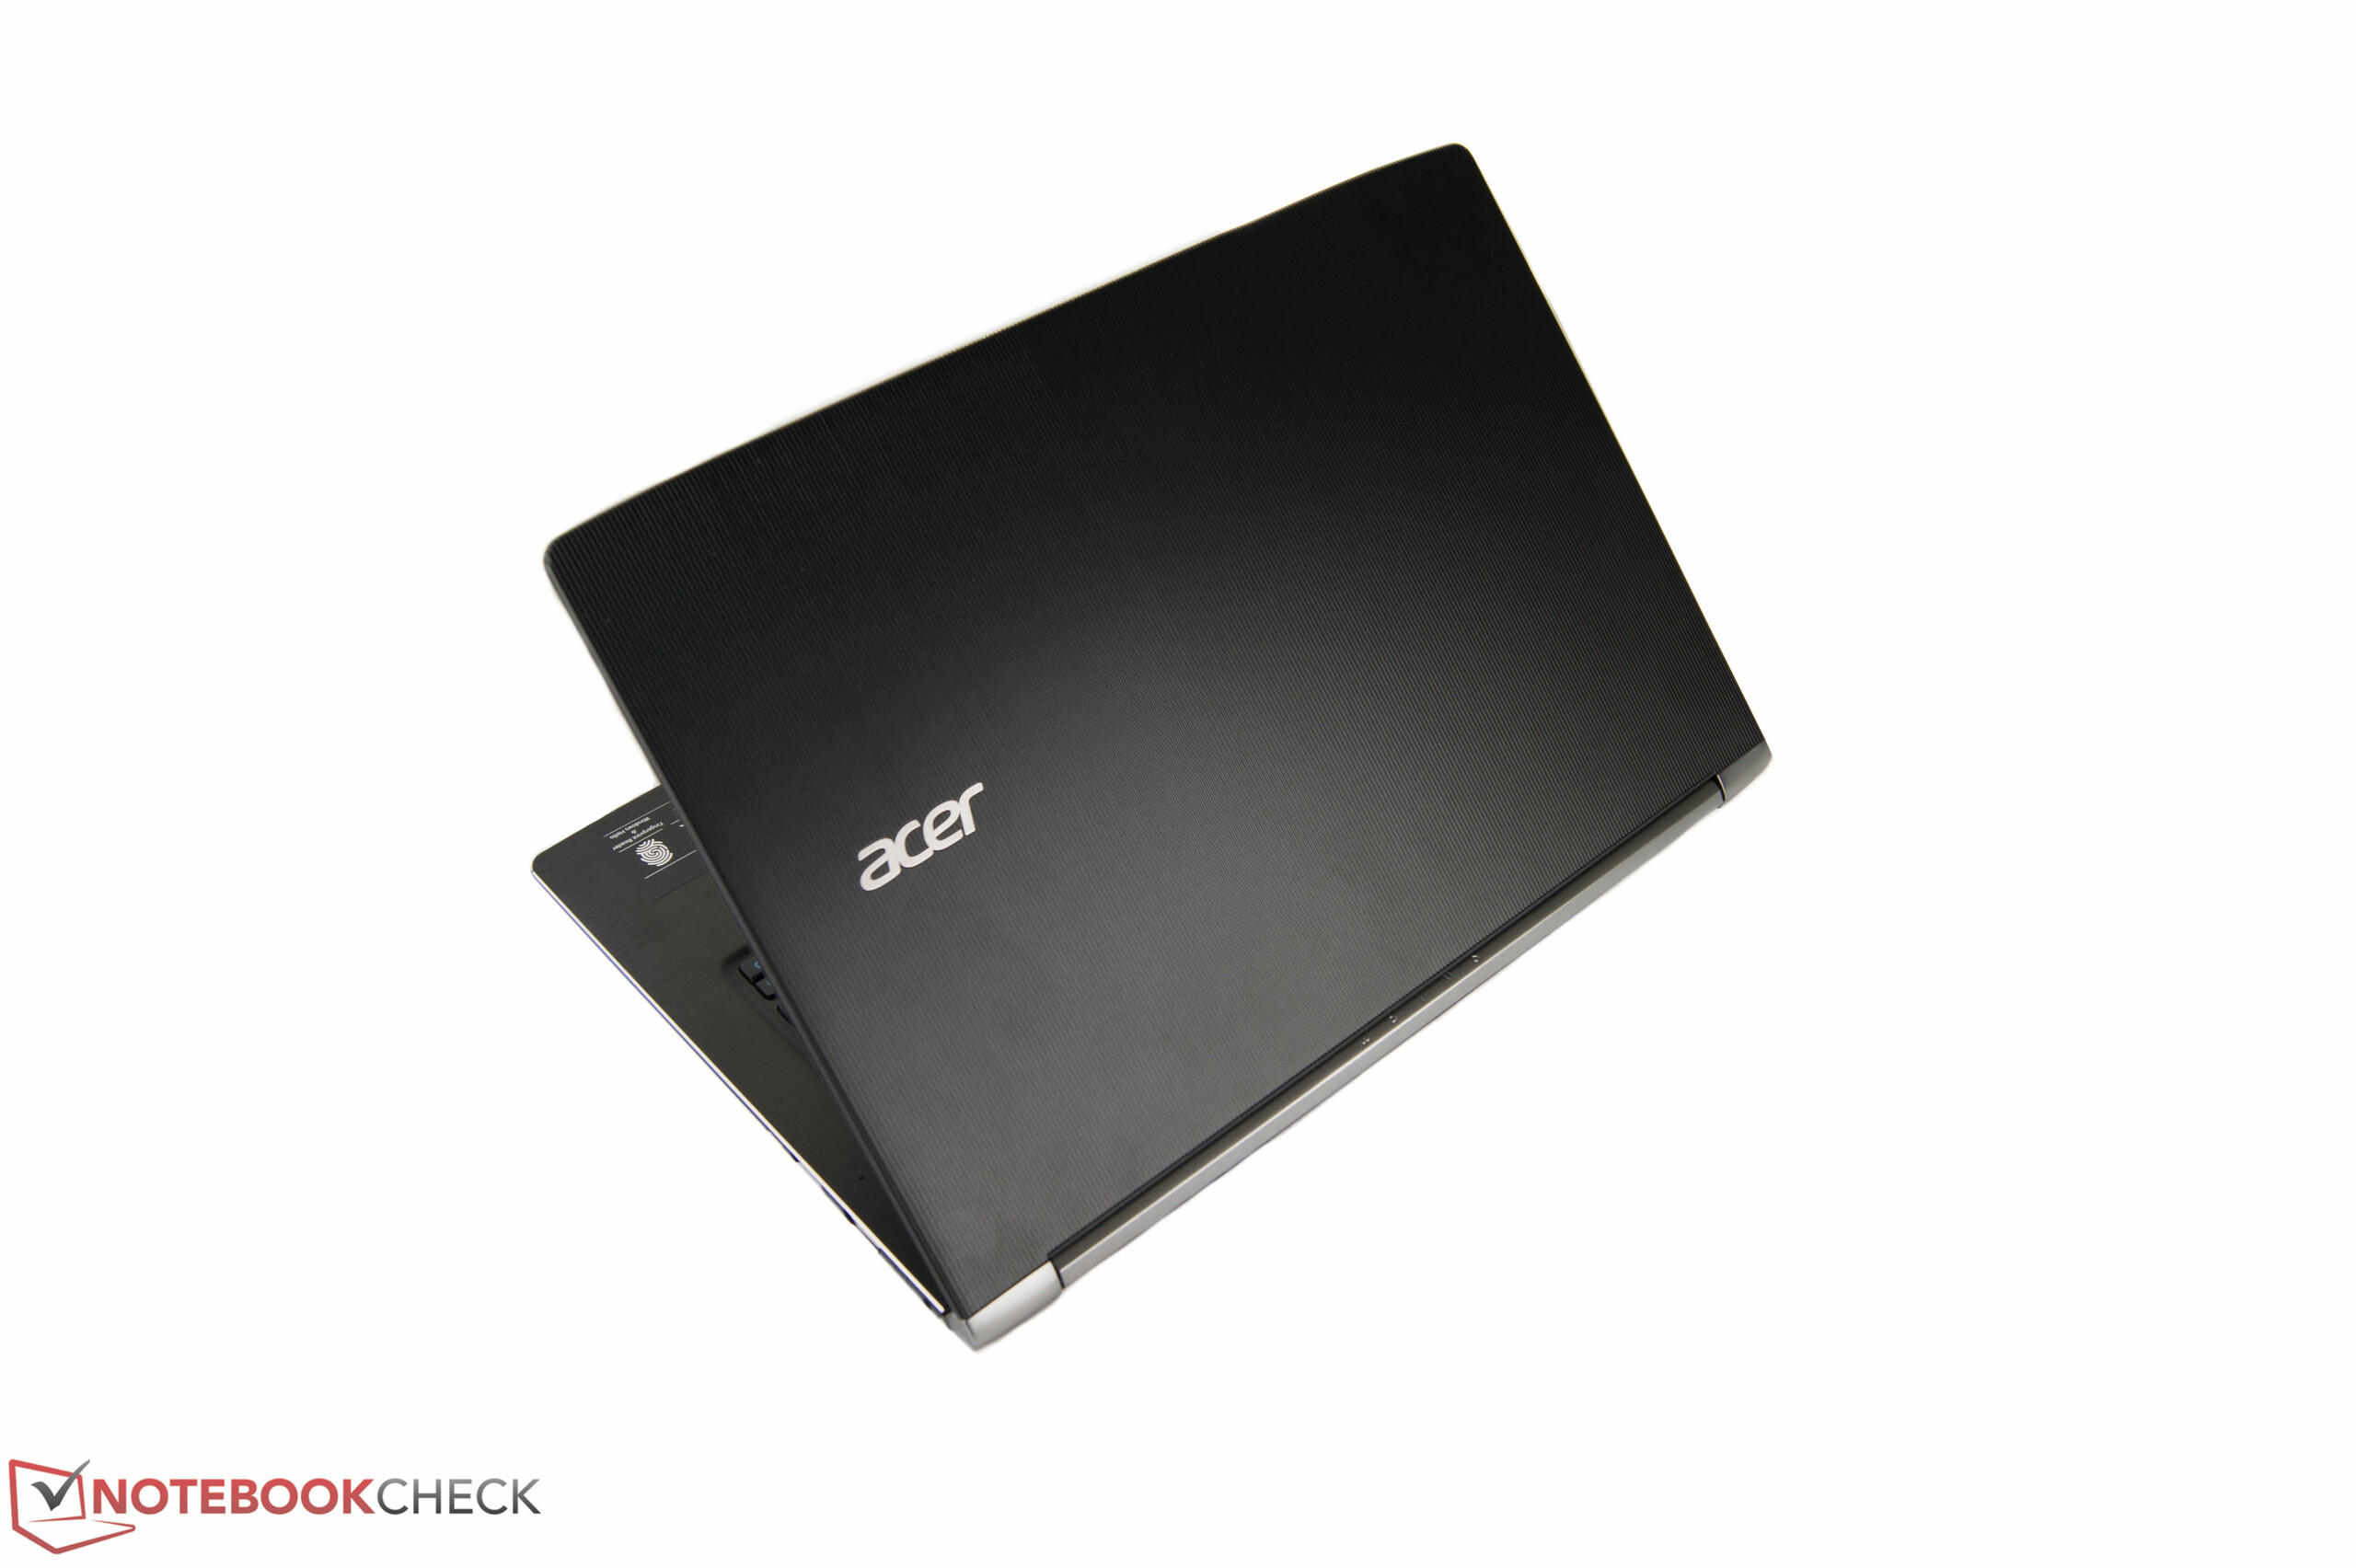
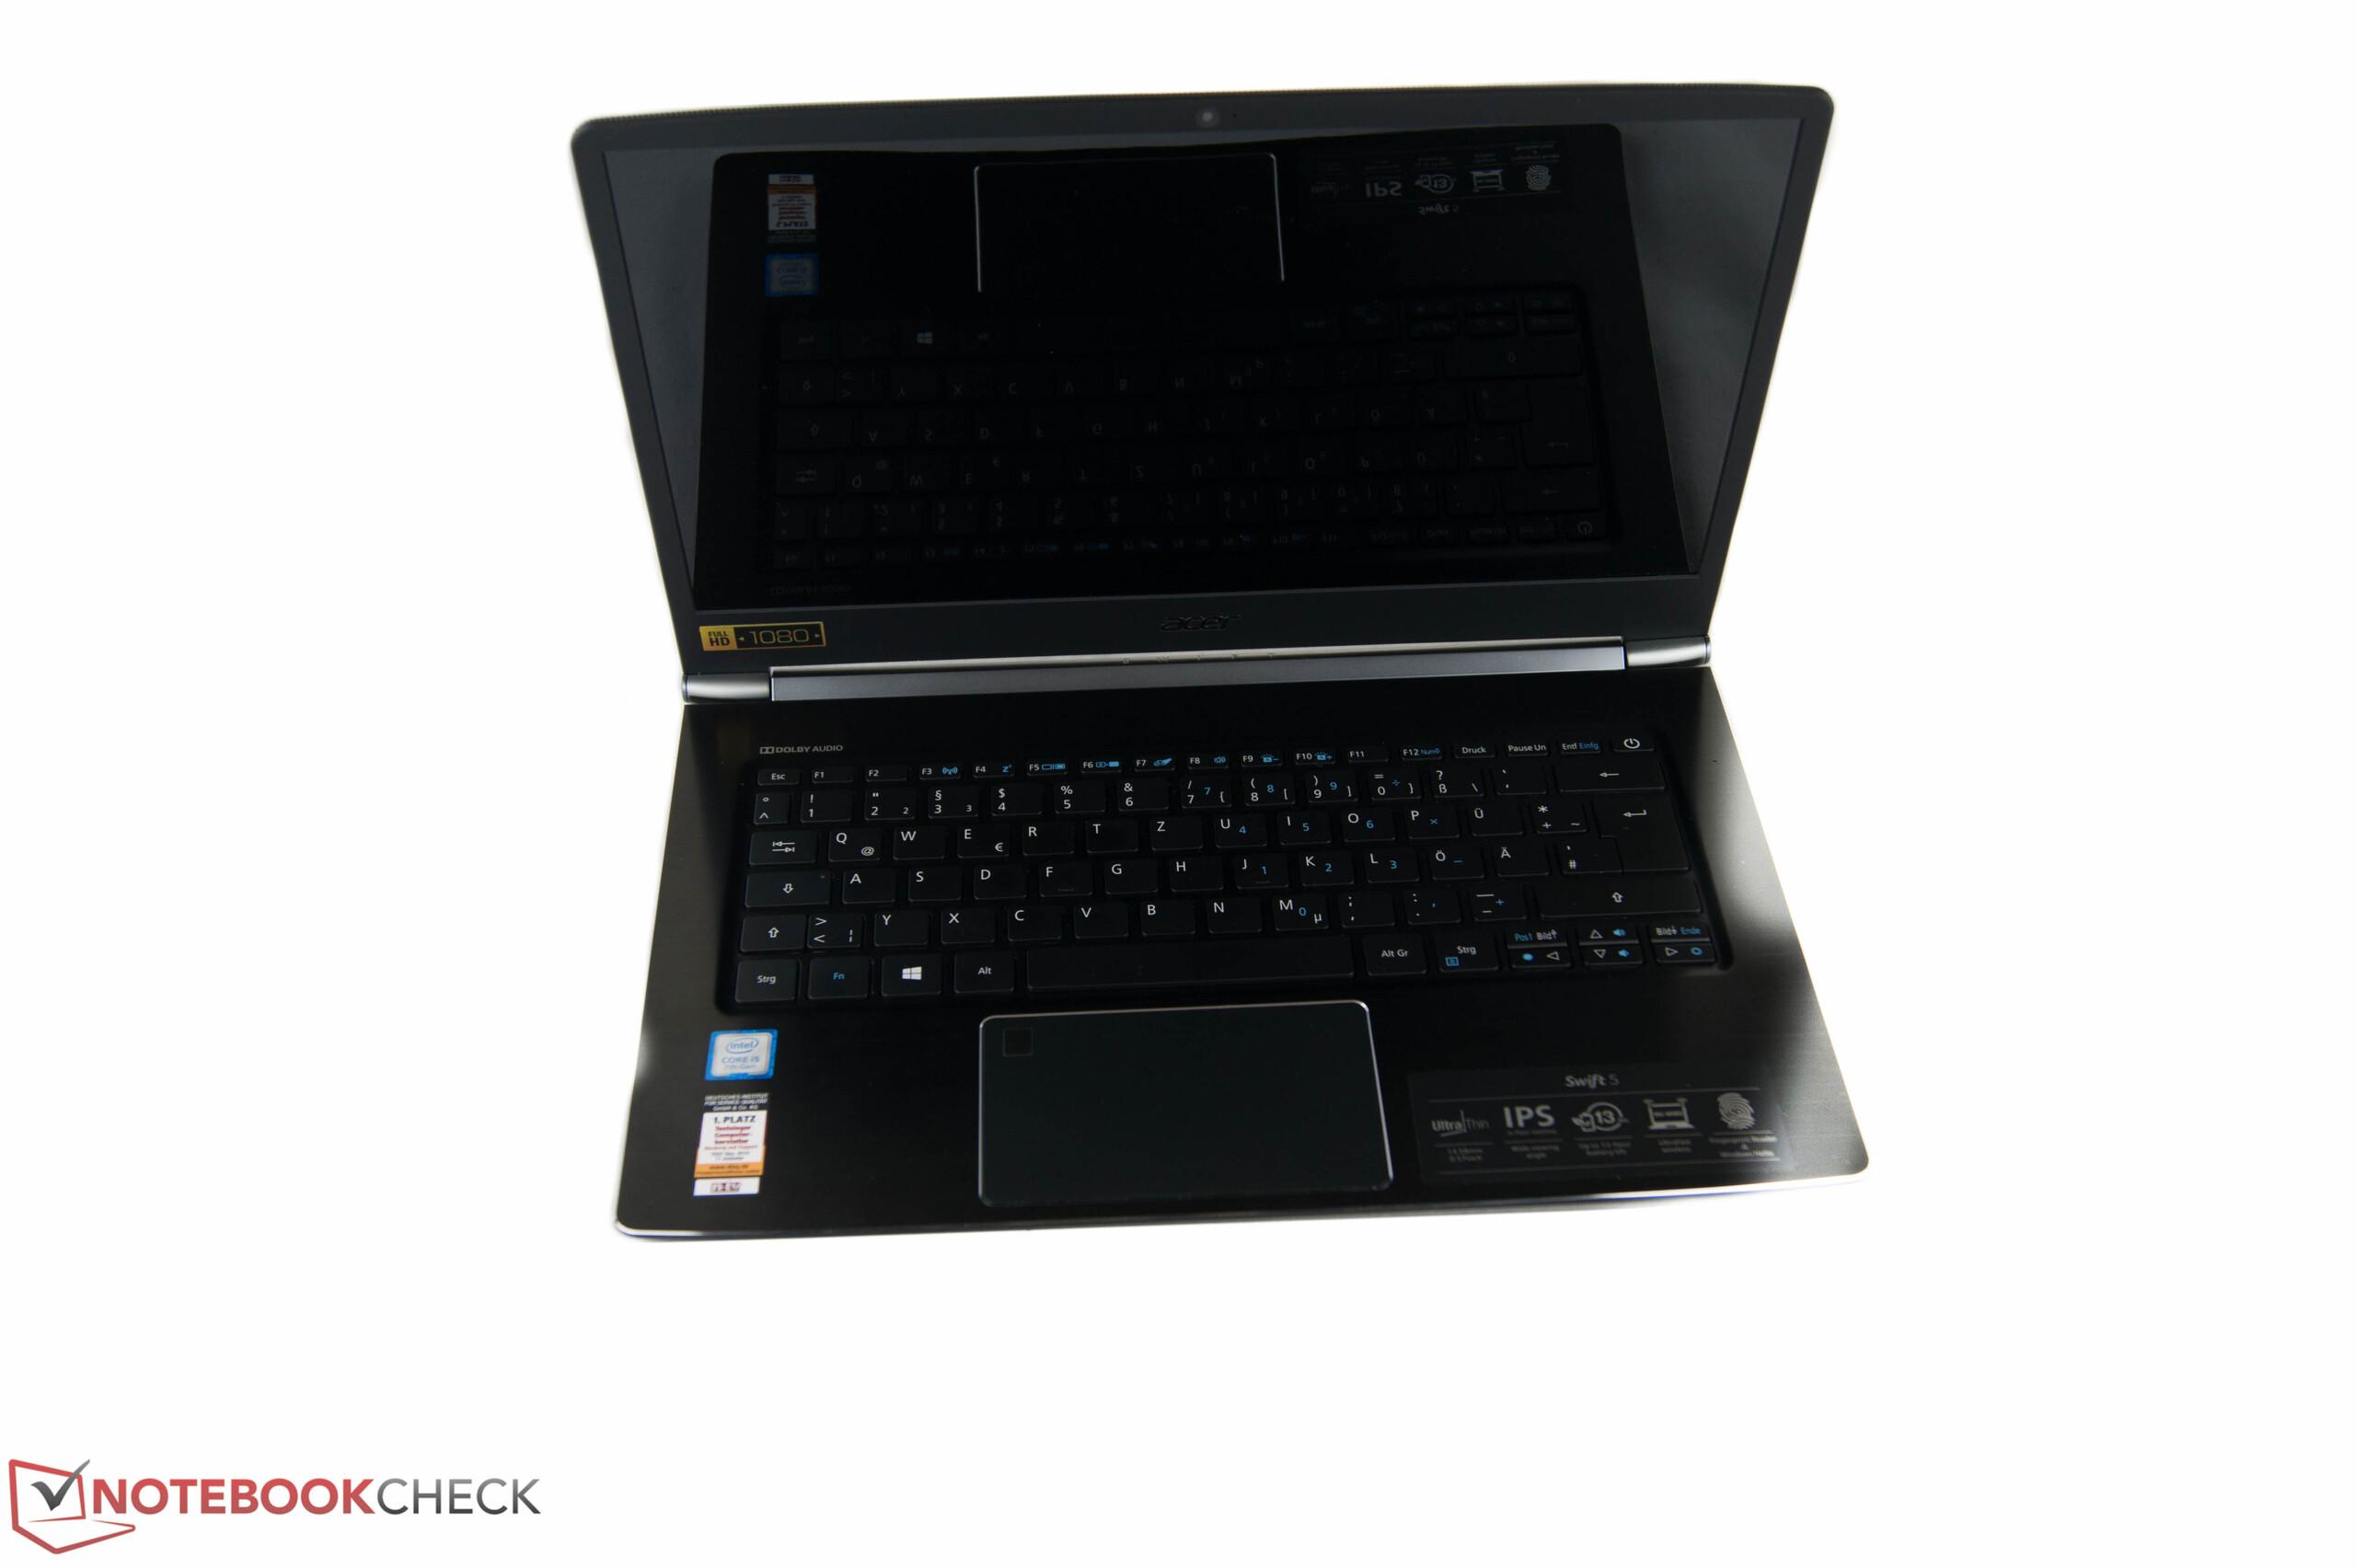
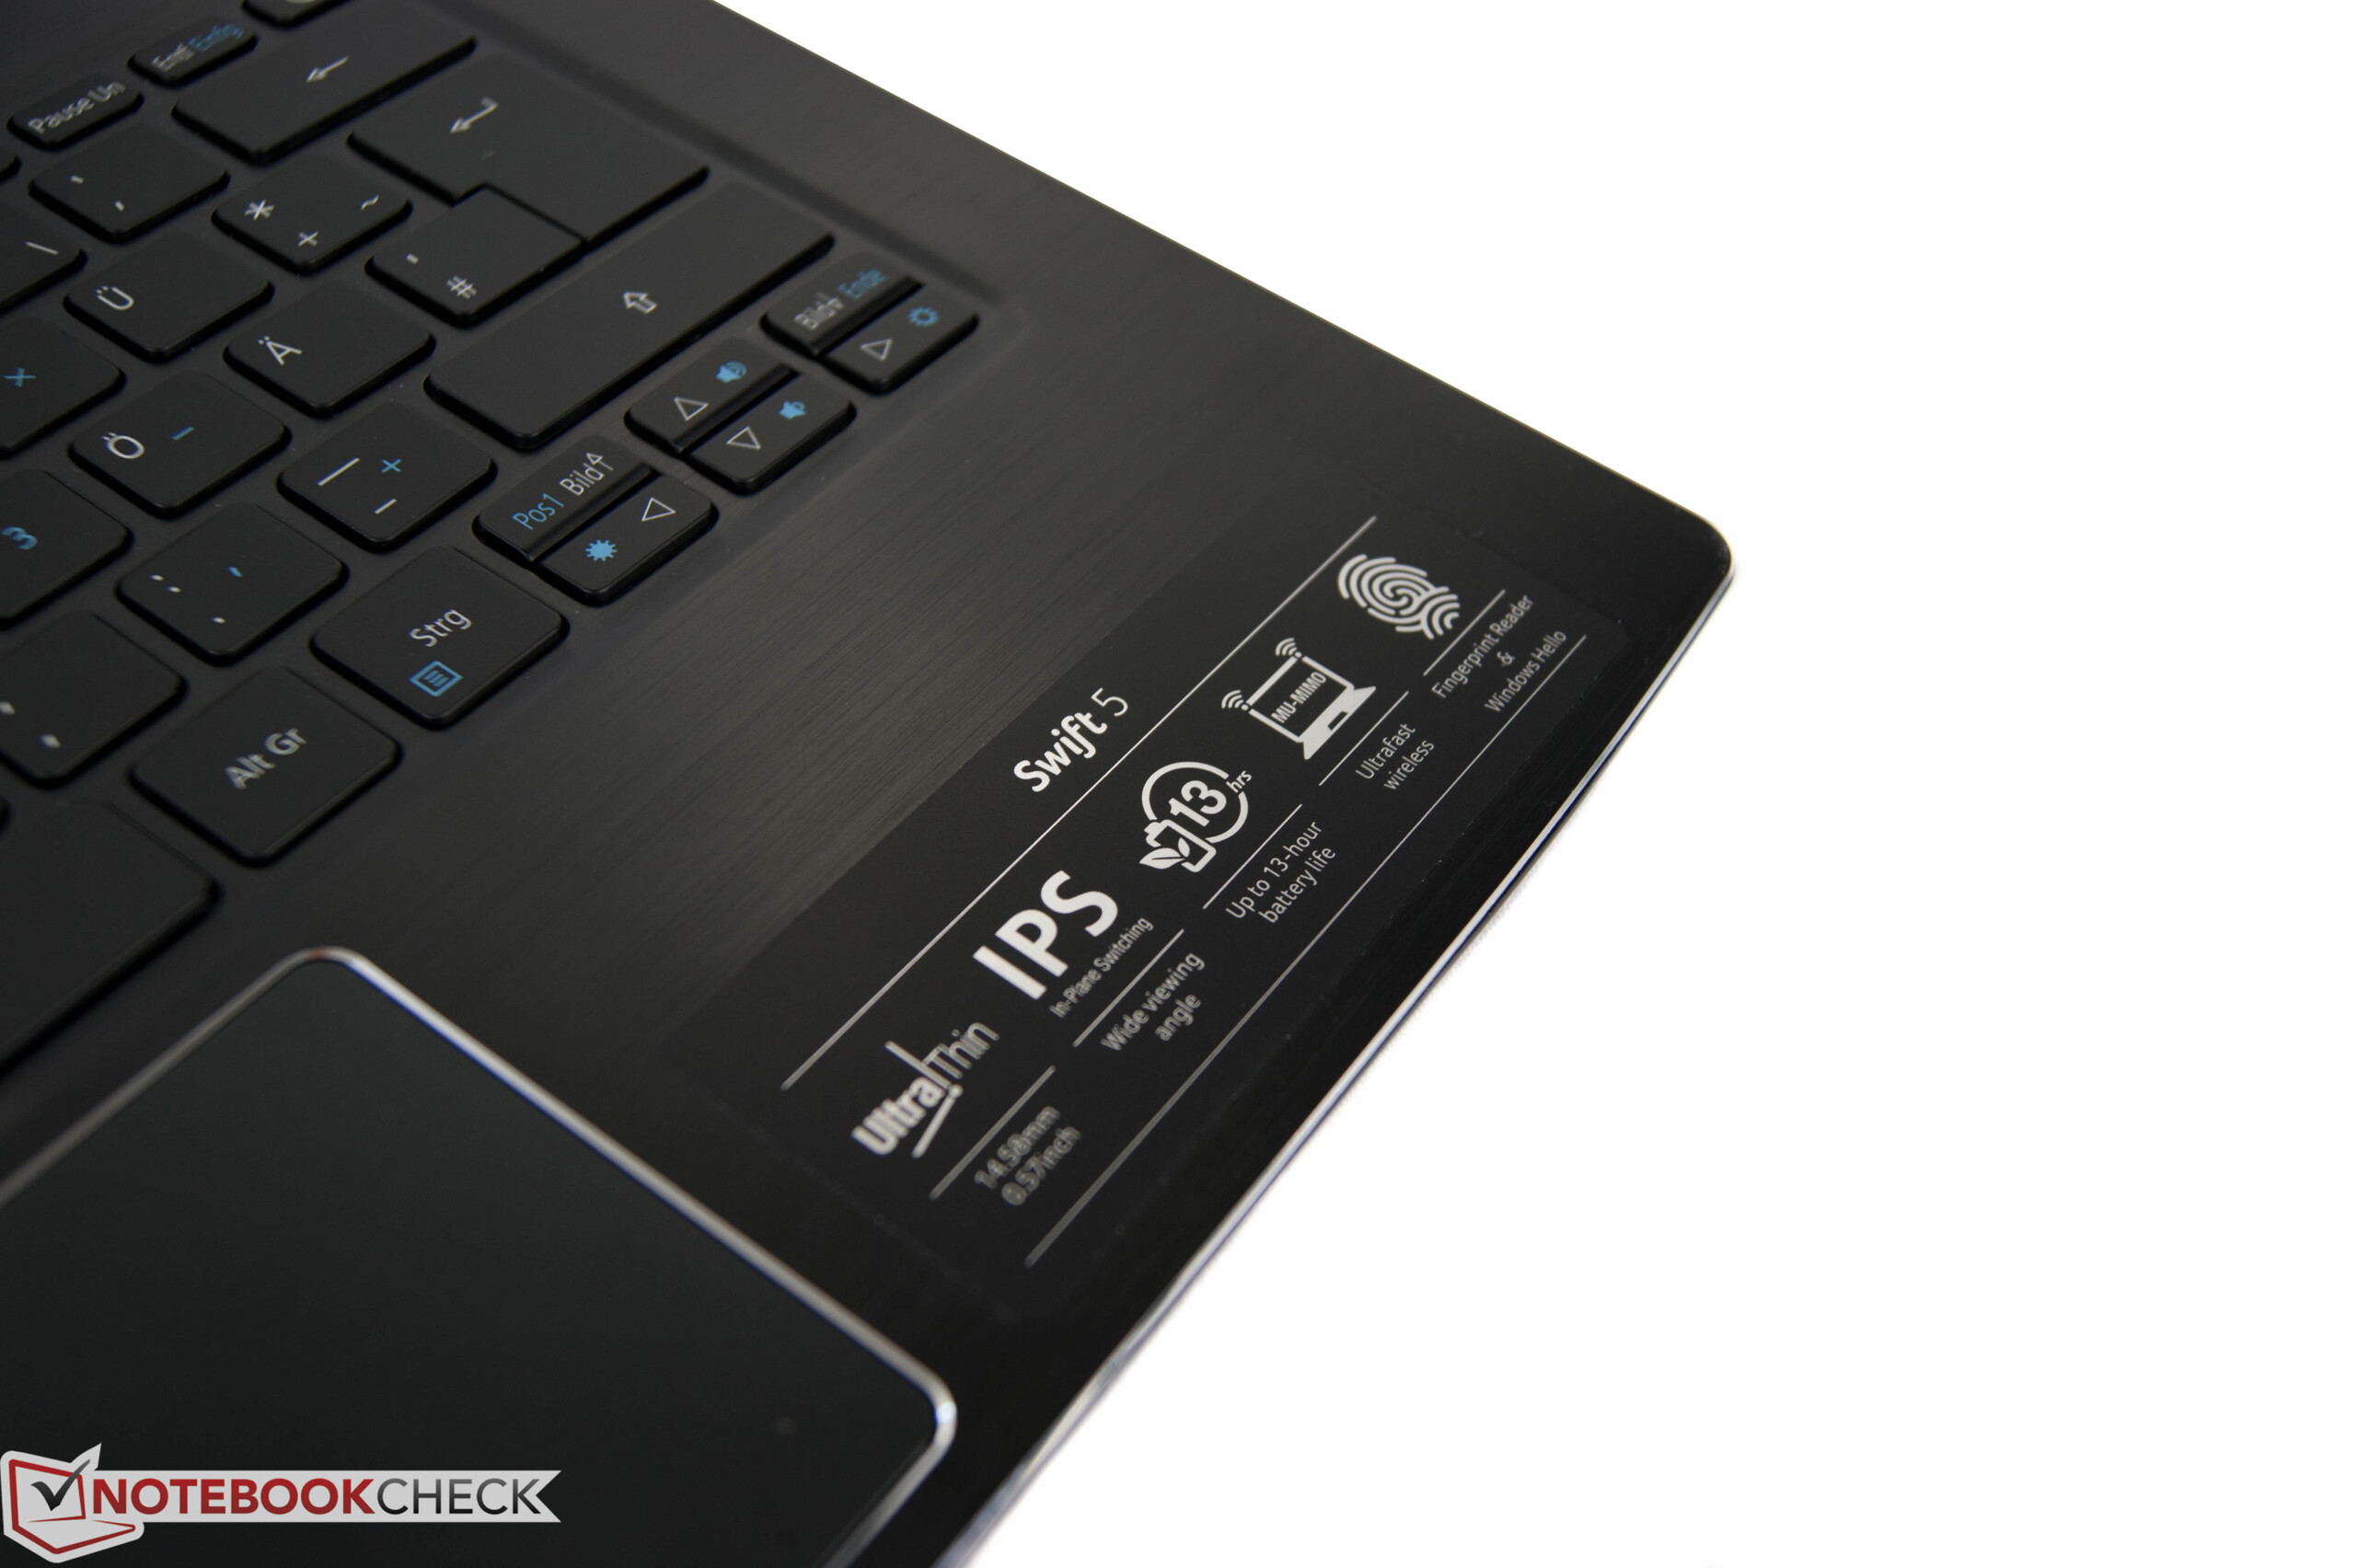
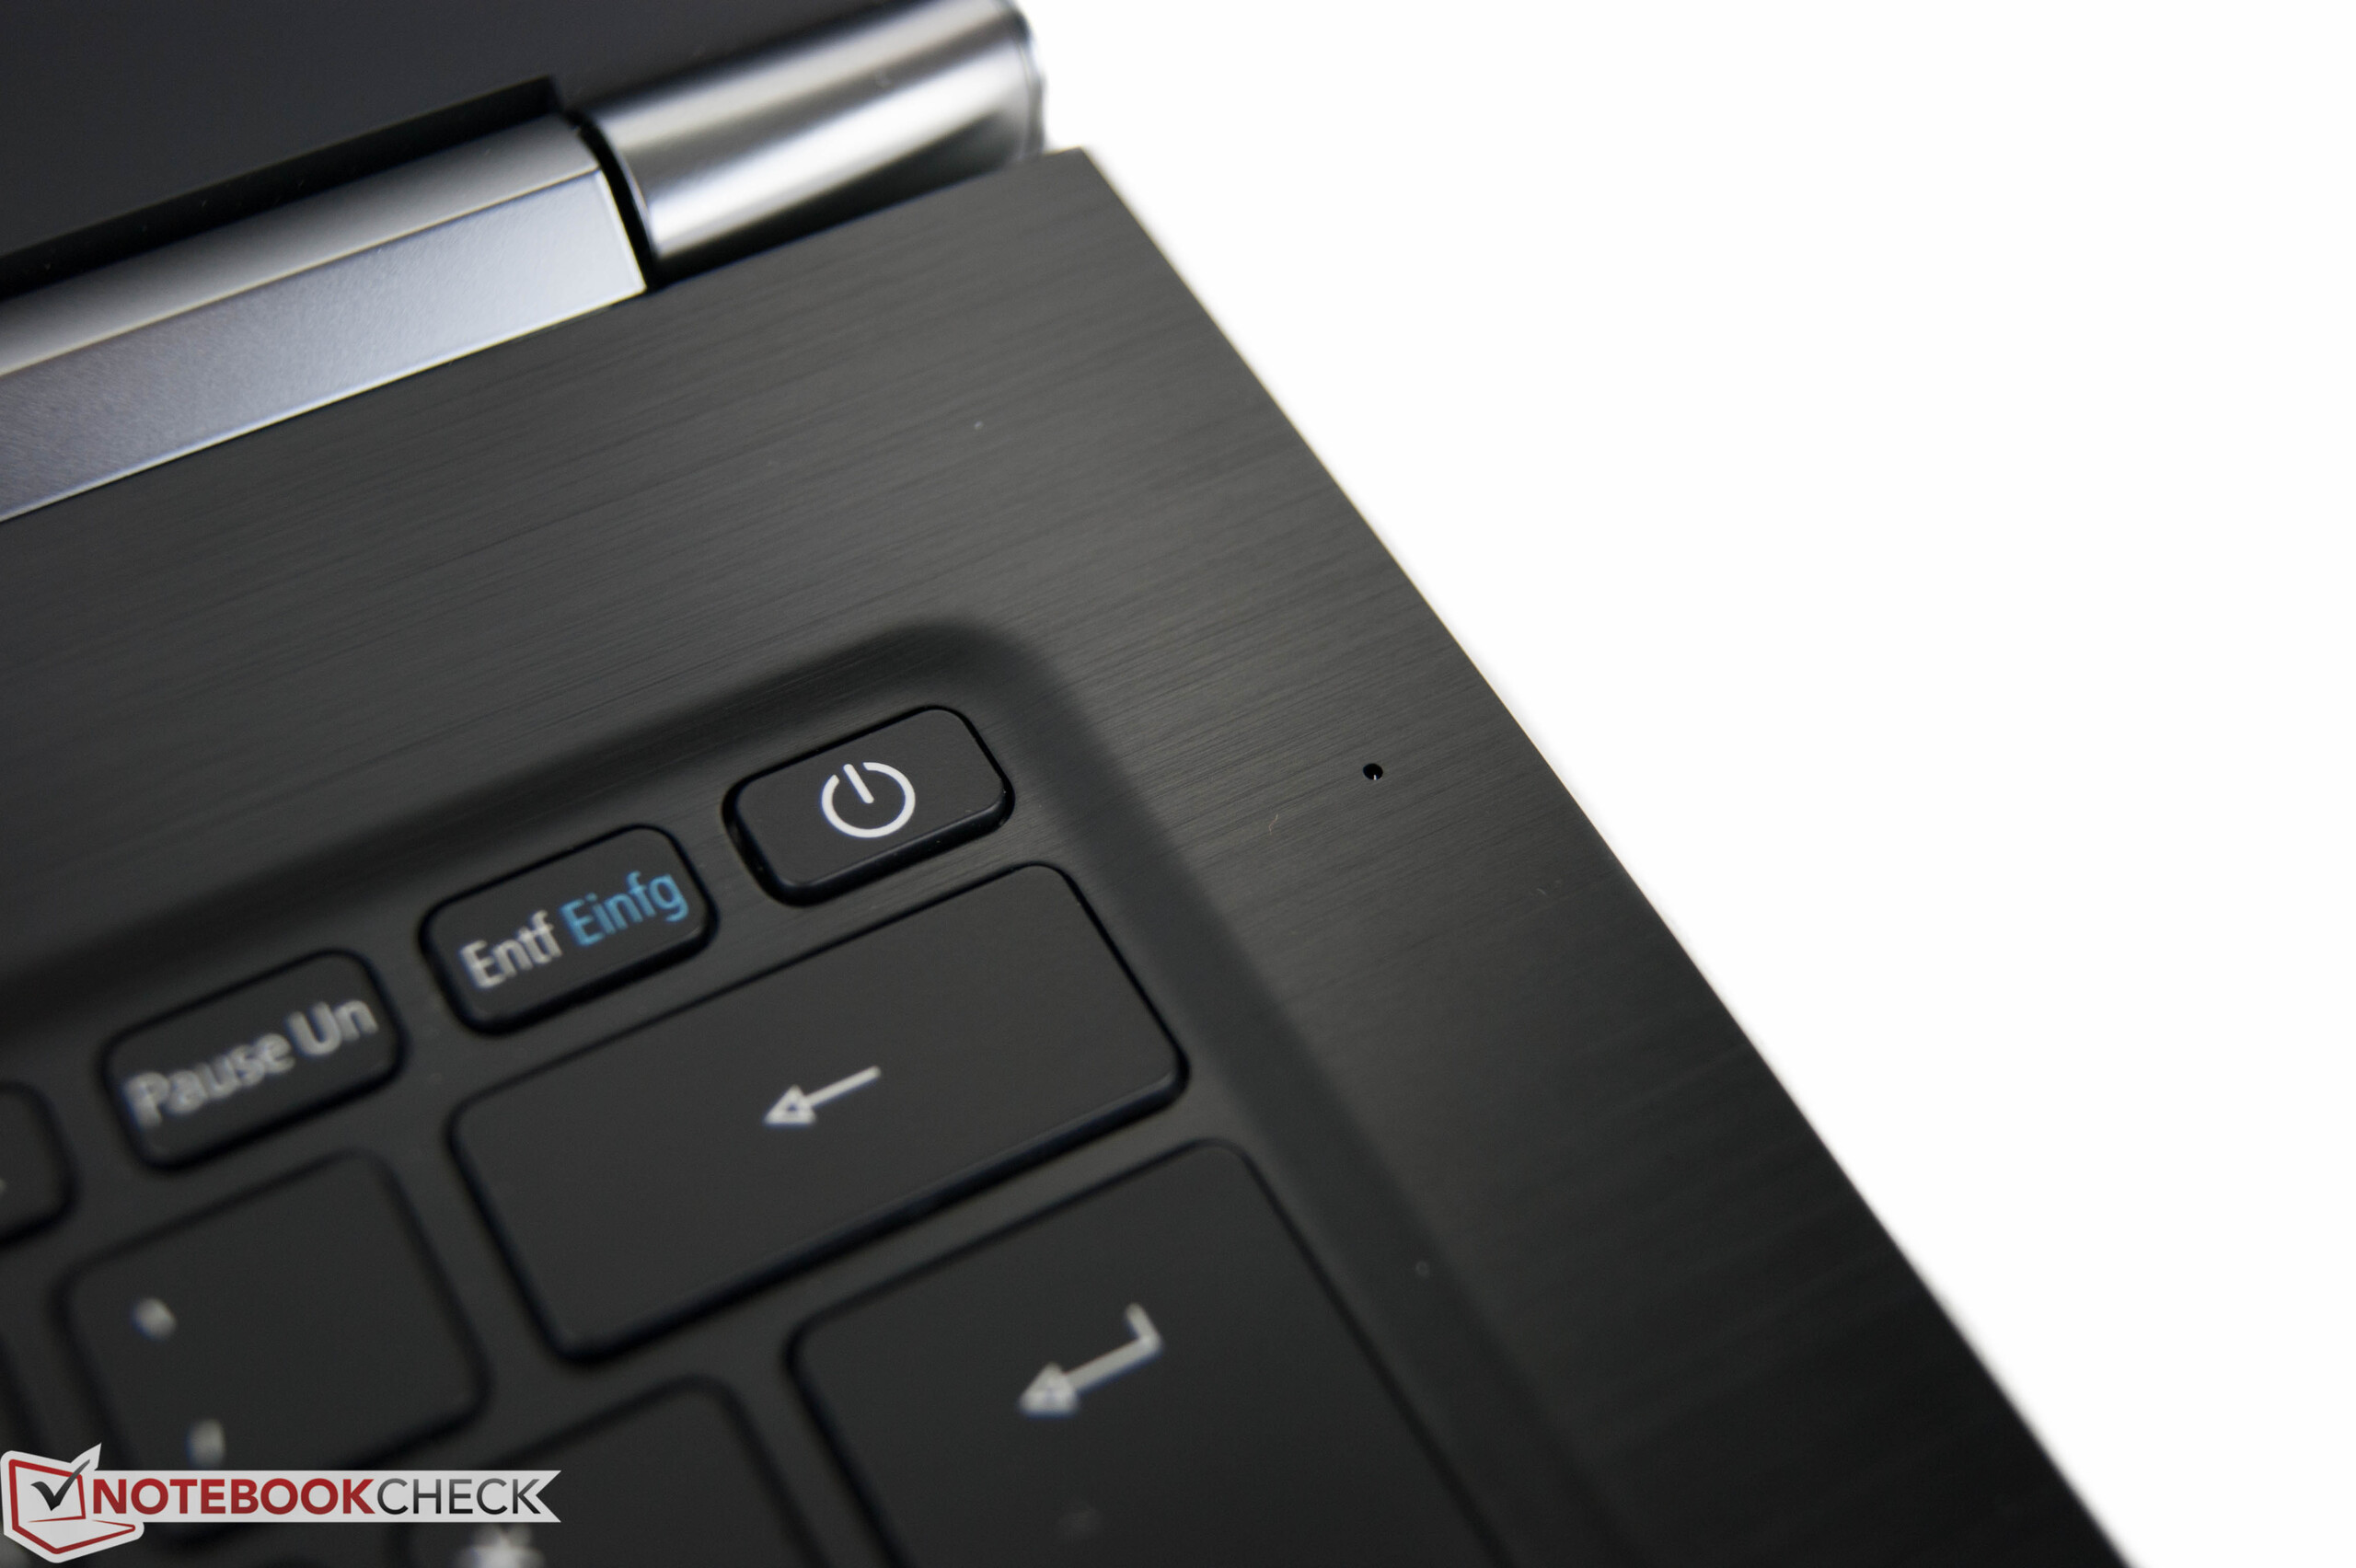
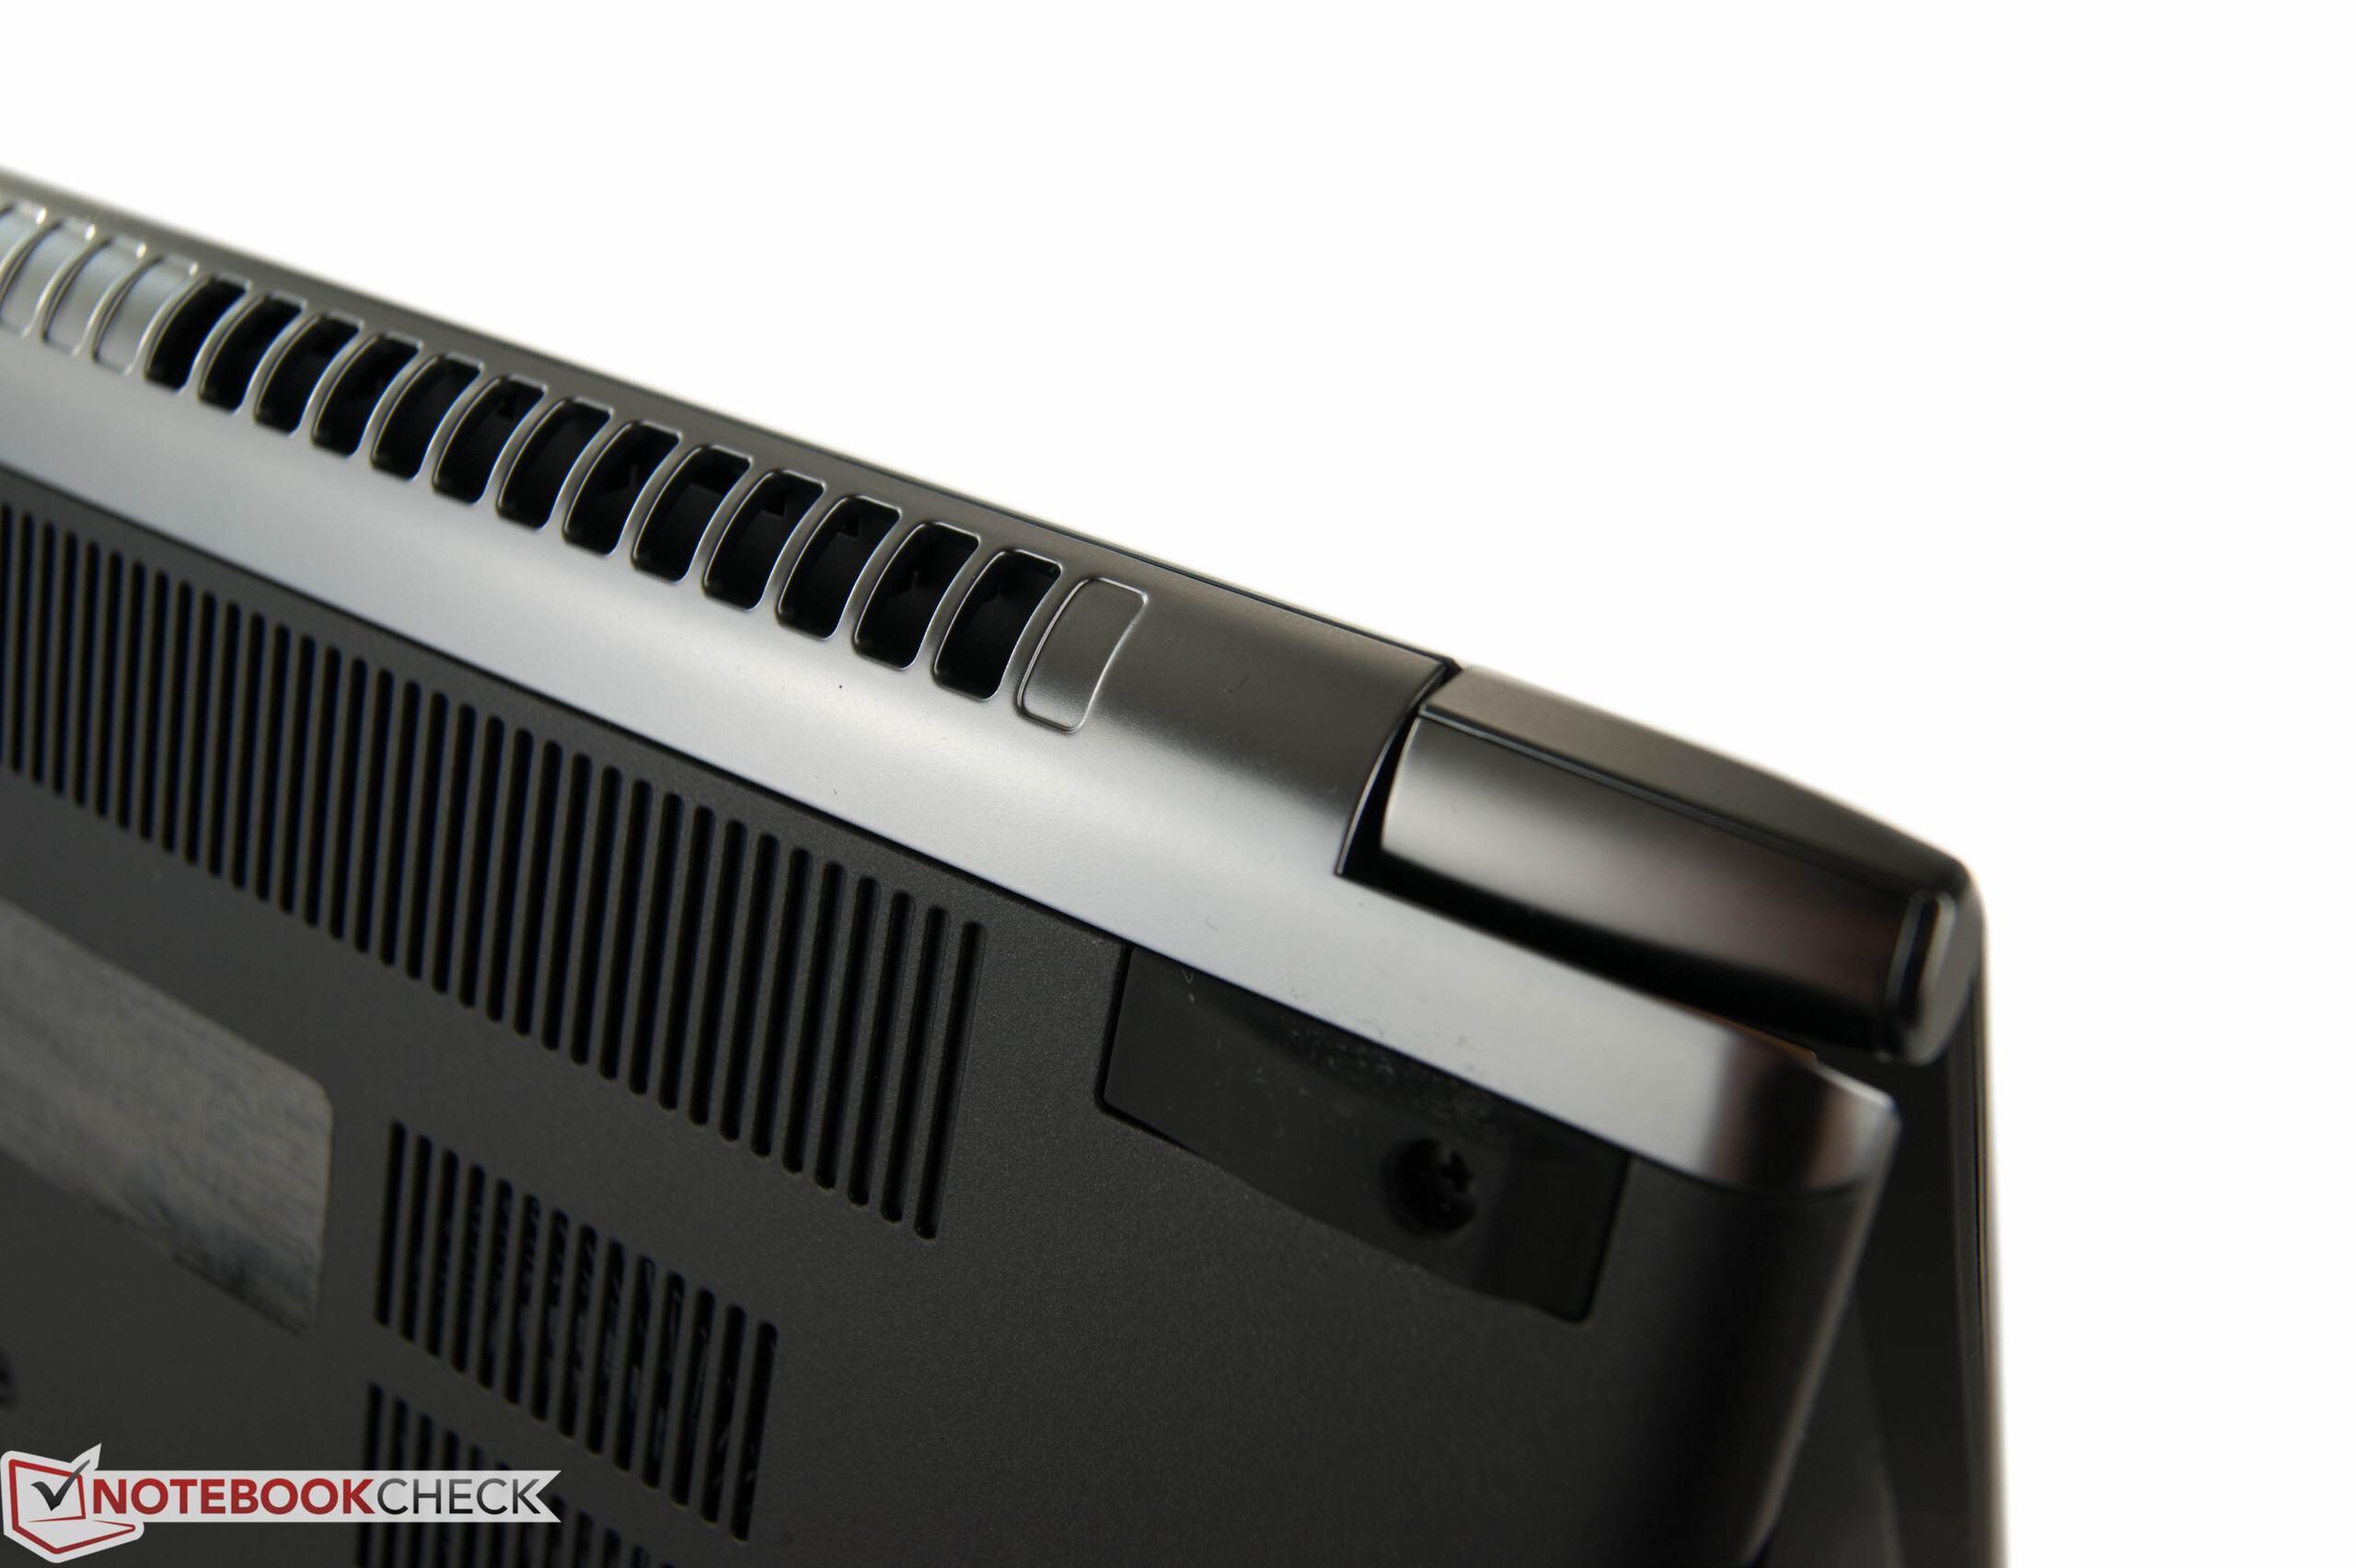
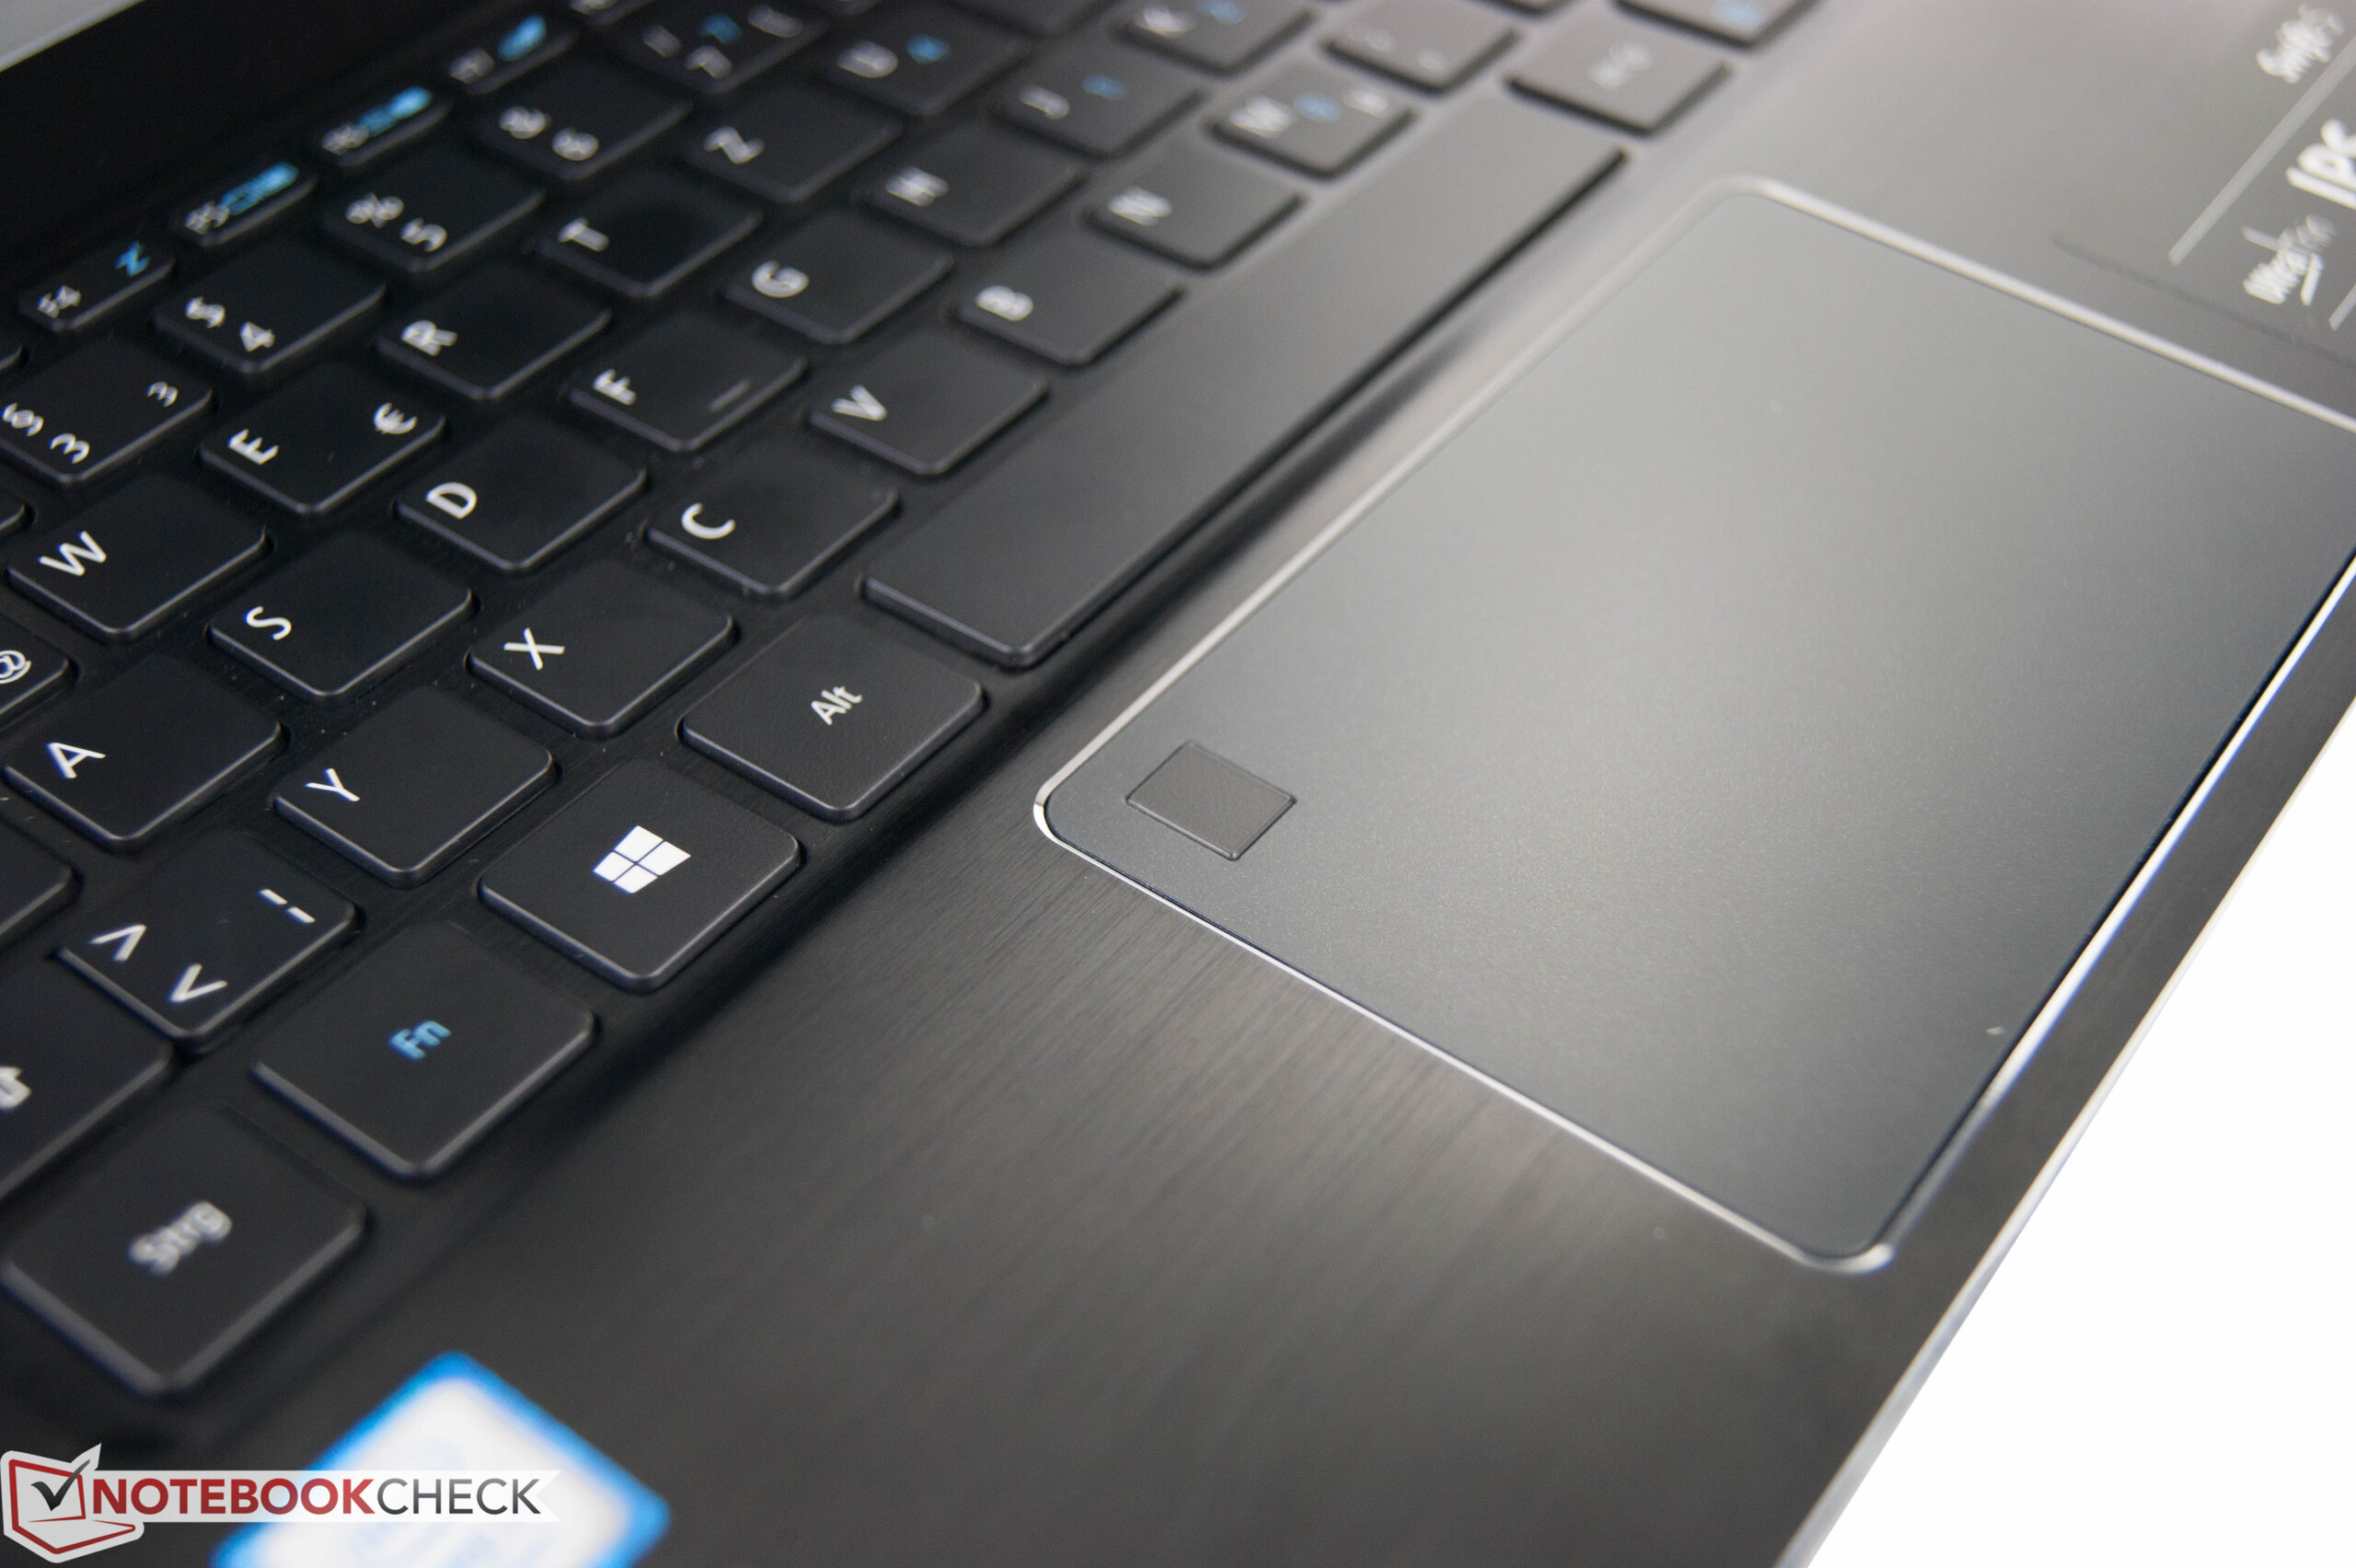
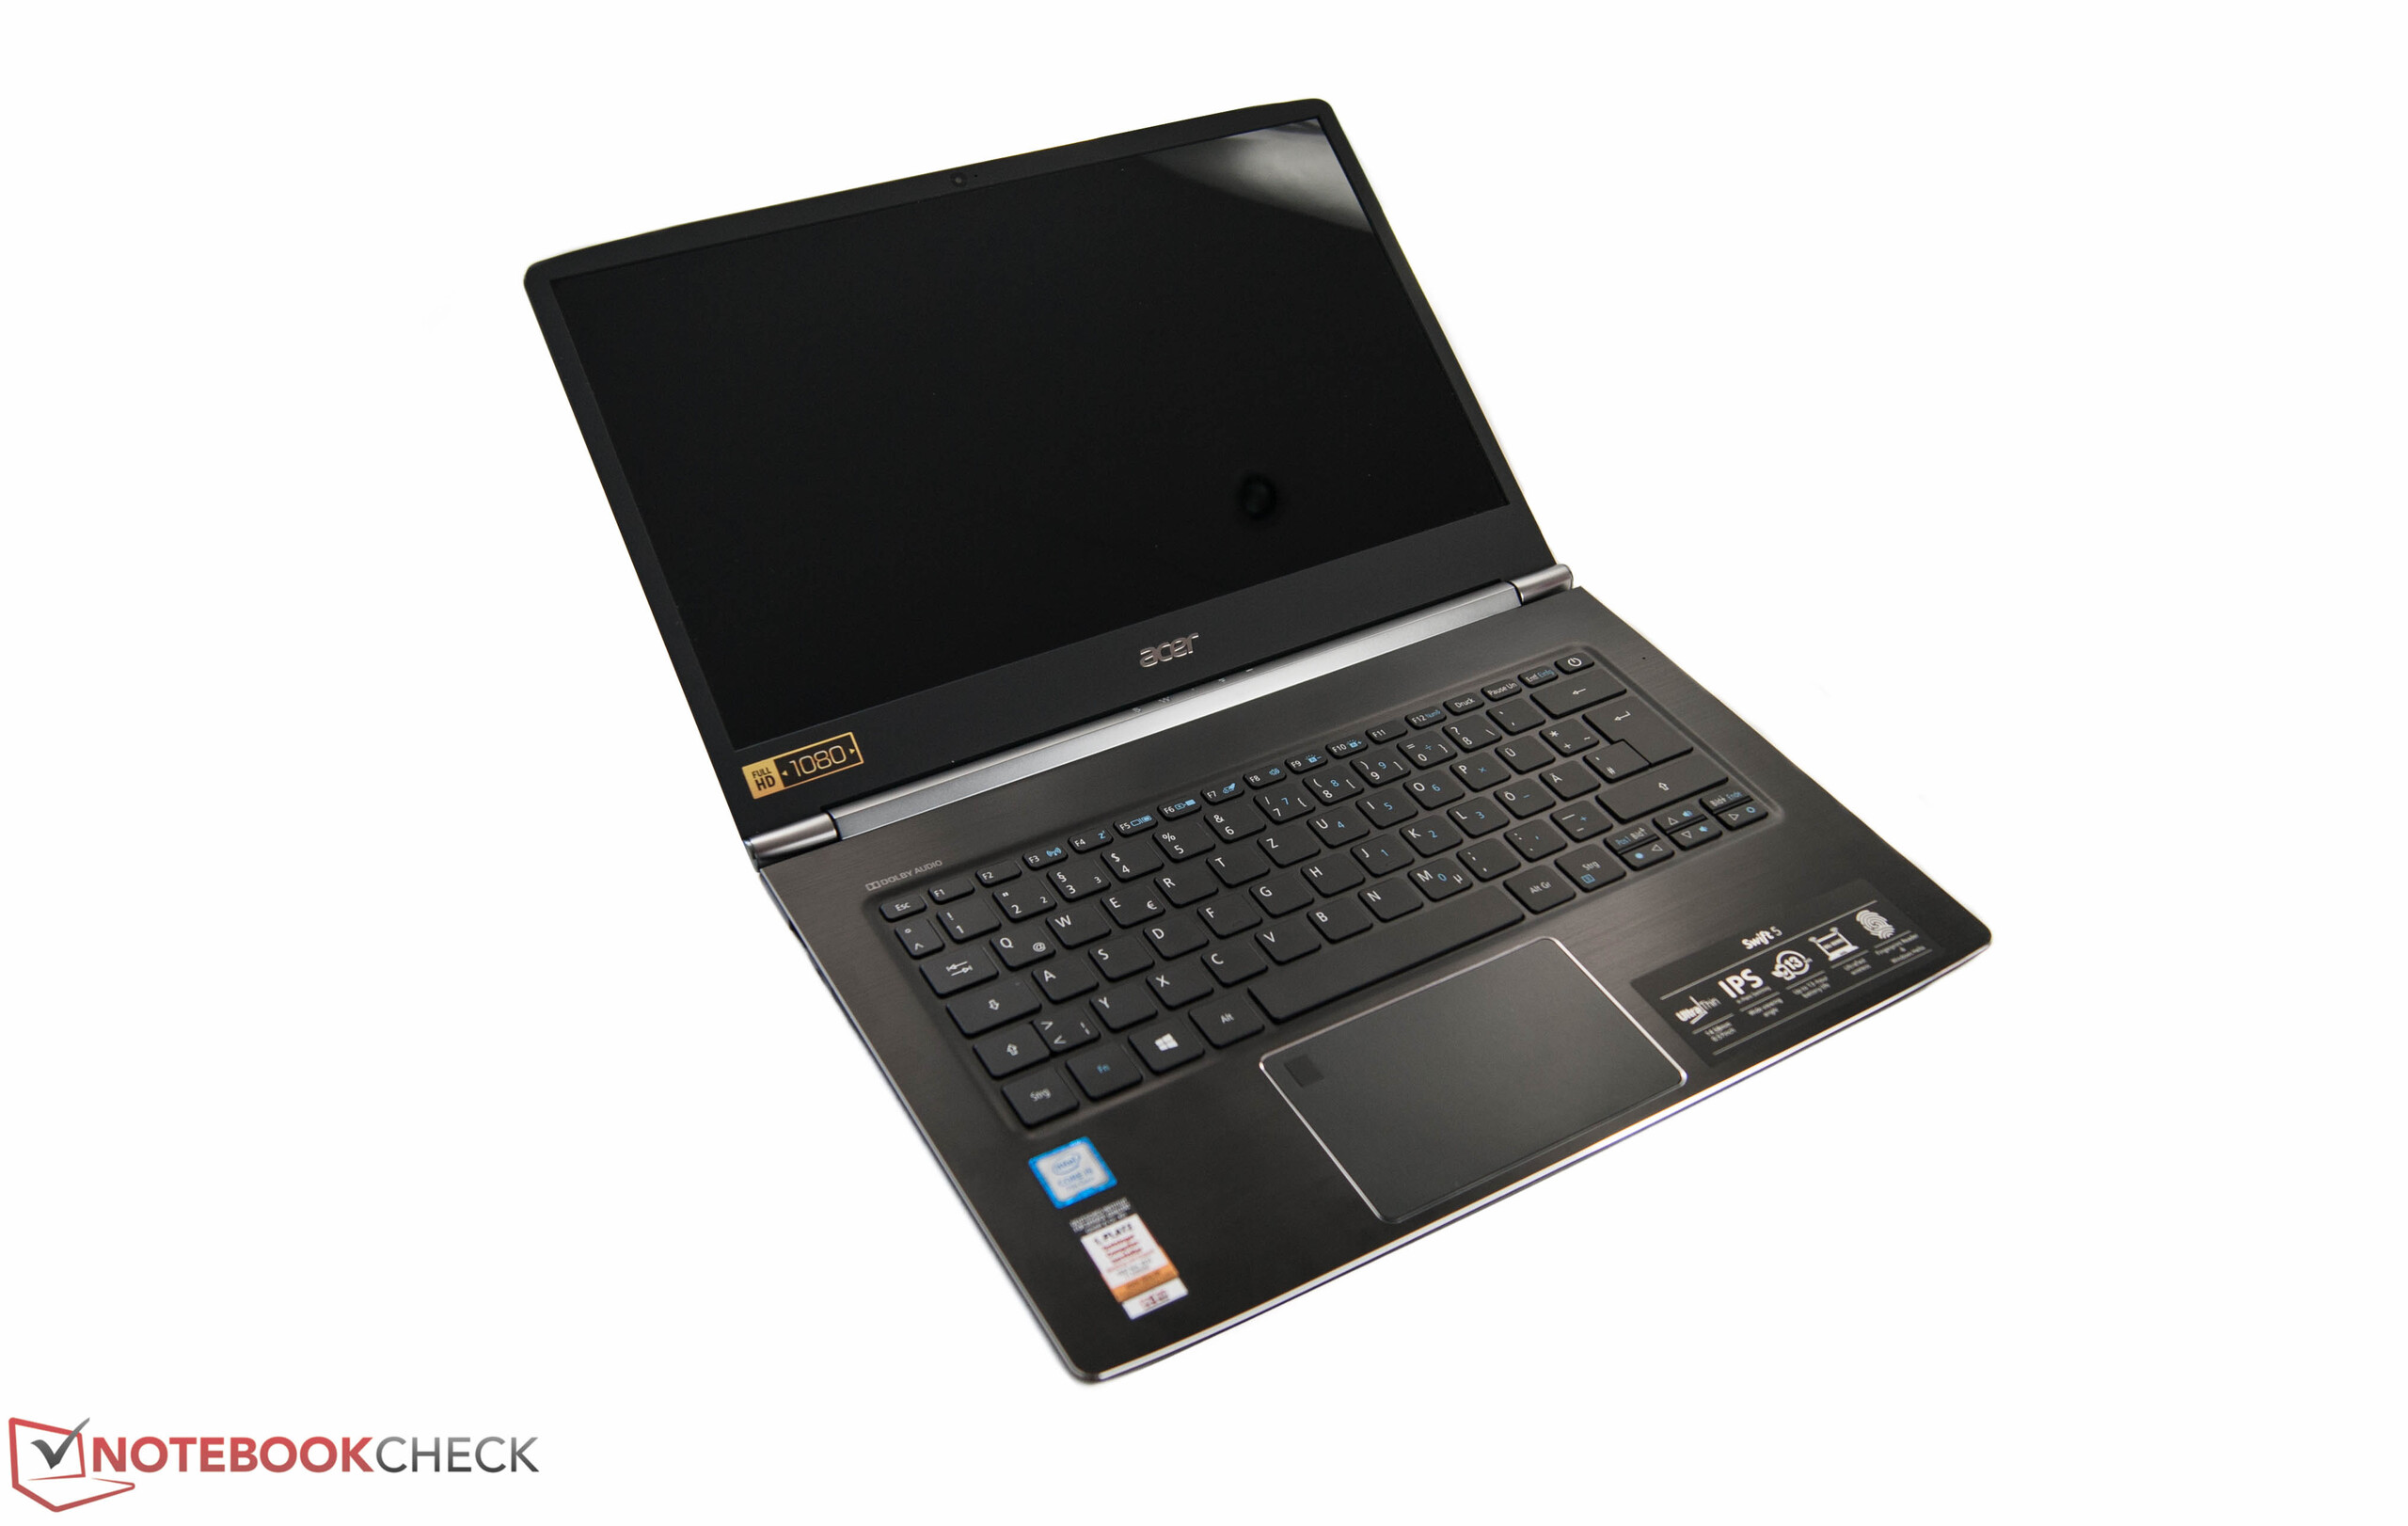
成功的组合:宏碁将纤薄的机身和足够的性能结合起来,同时也没有忘记重要的散热。我们喜欢纤薄的外壳设计,特别是超窄边框。这还不是全部:宏碁加入了坚固的金属元素并用出色的制造工艺使我们满意,只有键盘模块不是那么好。键程相对偏短,但我们对它稳定的压力触发点及打字时的低噪音感到满意。镜面IPS屏幕有着全高清的分辨率,并在亮度及对比度测试中表现出色。Swift 5的硬件配置是十分平衡的,处理器在负载下基本上能够发挥出其最大的性能,这在它的竞争对手上是不多见的。考虑到它的性能表现,它的温度表现就还是可以的了。对于轻薄本来说最后的重点是续航时间,虽然Swift 5的续航能力不如戴尔XPS13,但依旧可以满足一天的不插电使用。
宏碁的新Swift 5结合了轻薄本几乎所有的重要元素,而且售价实际上仅在900欧元(约合947美元)的入门价位。
如果经常在路上的话应该看看戴尔 XPS 13 9360。它的雾面屏及超长续航时间令我们满意,而且它更加轻薄。来自华硕的竞品售价为1500欧元(约合1610美元)。
注:本文是基于完整评测的缩减版本,阅读完整的英文评测,请点击这里。
Acer Swift 5 SF514-51-59AV
- 12/22/2016 v6 (old)
Nino Ricchizzi
Price comparison
