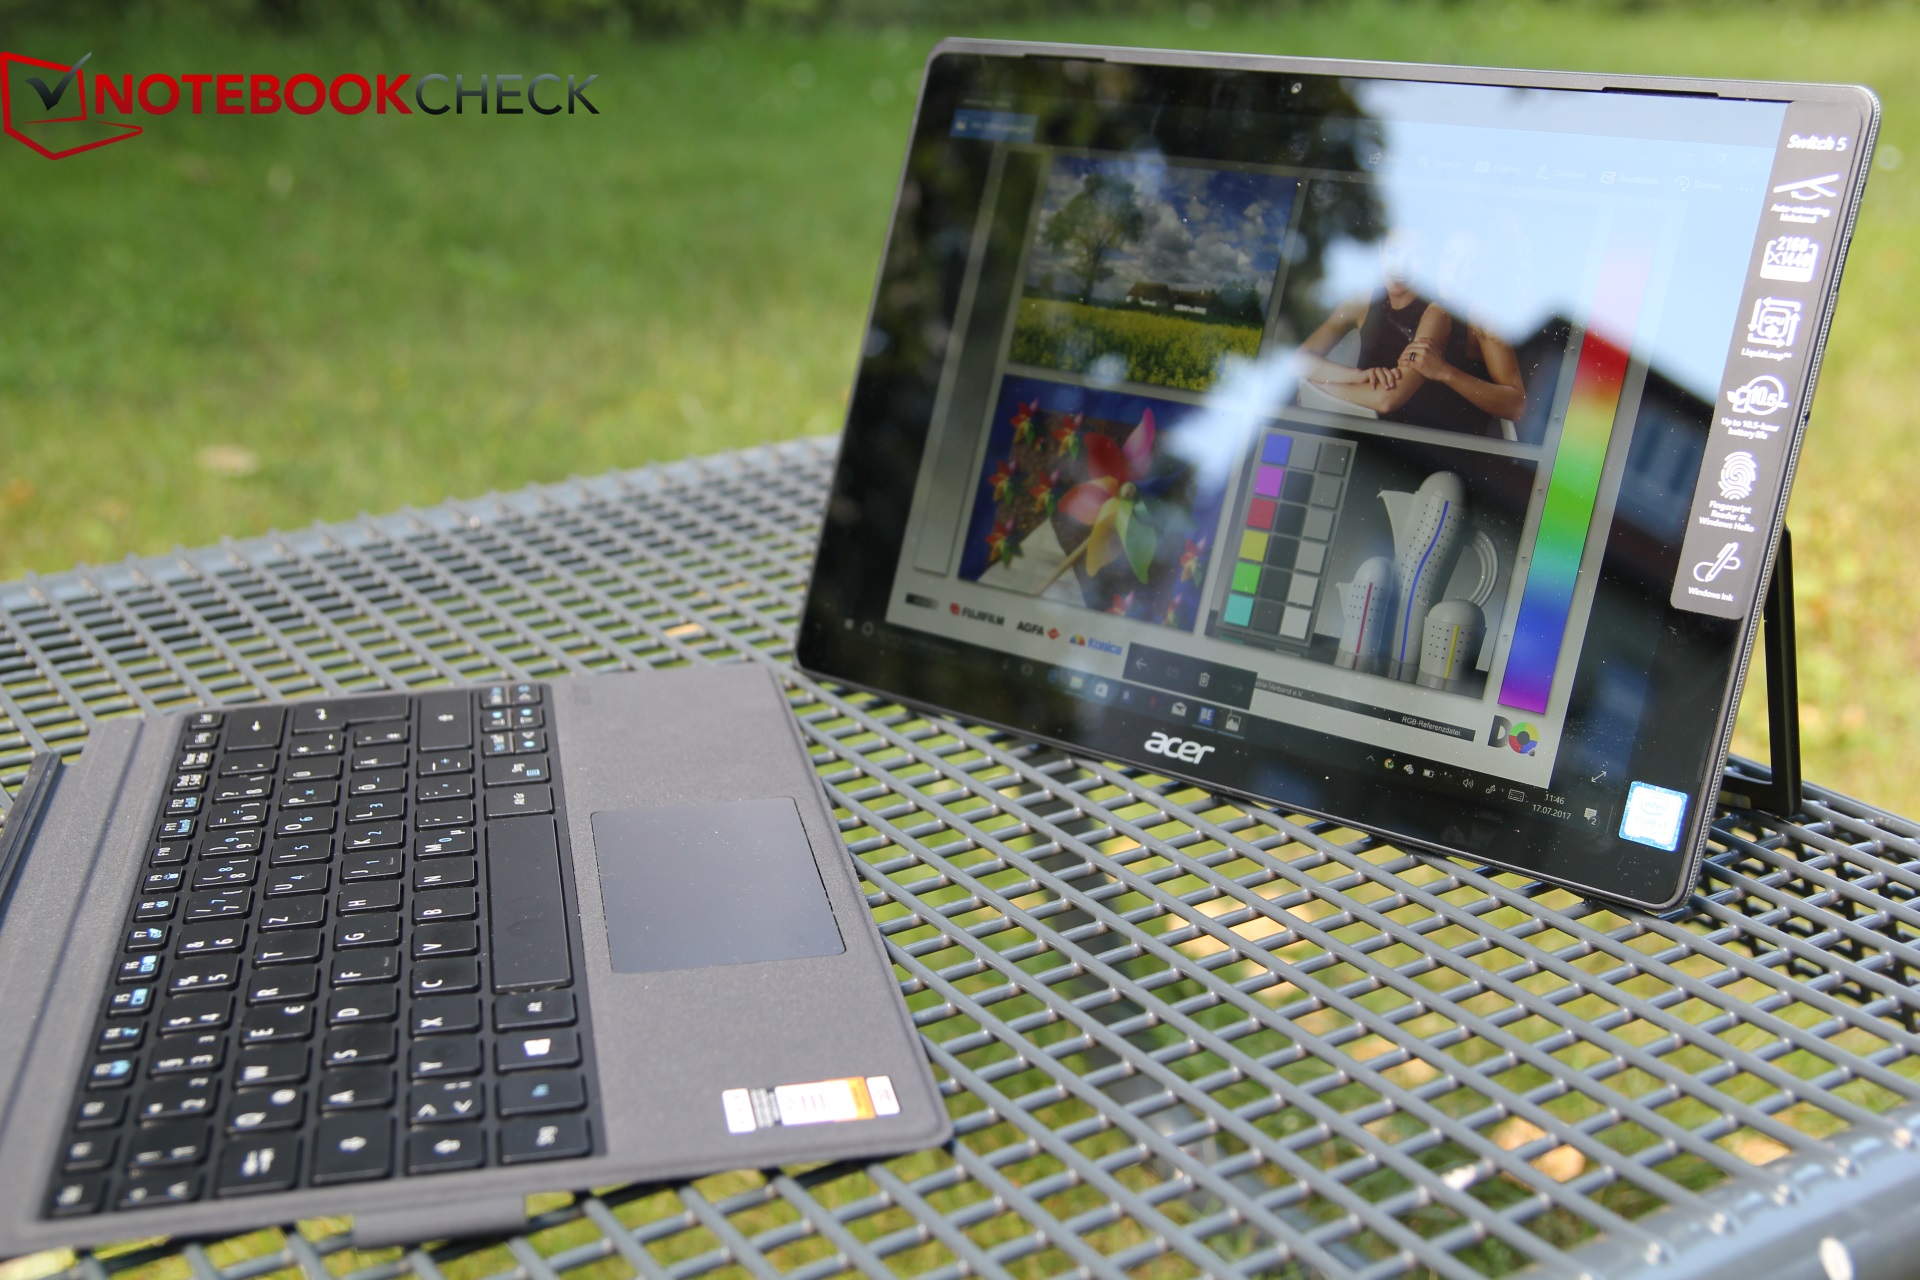
宏碁 Switch 5 (7500U, 512 GB) 变形本简短评测
| |||||||||||||||||||||||||
Brightness Distribution: 75 %
Center on Battery: 369 cd/m²
Contrast: 802:1 (Black: 0.46 cd/m²)
ΔE ColorChecker Calman: 5.52 | ∀{0.5-29.43 Ø4.71}
ΔE Greyscale Calman: 6.95 | ∀{0.09-98 Ø4.96}
88% sRGB (Argyll 1.6.3 3D)
56% AdobeRGB 1998 (Argyll 1.6.3 3D)
60.6% AdobeRGB 1998 (Argyll 3D)
87.5% sRGB (Argyll 3D)
58.8% Display P3 (Argyll 3D)
Gamma: 2.58
CCT: 7009 K
| Acer Switch 5 SW512-52-5819 WST KL.1200w.004, , 2160x1440, 12" | Microsoft Surface Pro (2017) i5 LG Display LP123WQ112604, , 2736x1824, 12.3" | HP Elite x2 1012 G1 LG Philips, , 1920x1280, 12.1" | Dell Latitude 12 5285 2-in-1 BOE06DC, , 1920x1280, 12.3" | Lenovo Ideapad Miix 720-12IKB AUO B120YAN01 / AUO106F, , 2880x1920, 12" | Acer Aspire Switch Alpha 12 SA5-271-70EQ WST KL.1200W.002 WST2216, , 2160x1440, 12" | |
|---|---|---|---|---|---|---|
| Display | 14% | -12% | 7% | 8% | -5% | |
| Display P3 Coverage (%) | 58.8 | 67.6 15% | 53.8 -9% | 62.8 7% | 65.2 11% | 55.7 -5% |
| sRGB Coverage (%) | 87.5 | 99 13% | 73.7 -16% | 94 7% | 91 4% | 82.7 -5% |
| AdobeRGB 1998 Coverage (%) | 60.6 | 69.1 14% | 53.8 -11% | 64.7 7% | 66.1 9% | 56.9 -6% |
| Response Times | -13% | 11% | -17% | -7% | 18% | |
| Response Time Grey 50% / Grey 80% * (ms) | 37 ? | 42 ? -14% | 33.2 ? 10% | 42.4 ? -15% | 45 ? -22% | 21 ? 43% |
| Response Time Black / White * (ms) | 26 ? | 29 ? -12% | 22.8 ? 12% | 30.8 ? -18% | 24 ? 8% | 28 ? -8% |
| PWM Frequency (Hz) | 21000 | 210.1 ? | 50 ? | |||
| Screen | 32% | -2% | 26% | 16% | -9% | |
| Brightness middle (cd/m²) | 369 | 417 13% | 322 -13% | 523.2 42% | 406 10% | 391 6% |
| Brightness (cd/m²) | 331 | 401 21% | 319 -4% | 522 58% | 396 20% | 367 11% |
| Brightness Distribution (%) | 75 | 88 17% | 97 29% | 88 17% | 88 17% | 87 16% |
| Black Level * (cd/m²) | 0.46 | 0.29 37% | 0.42 9% | 0.42 9% | 0.3 35% | 0.56 -22% |
| Contrast (:1) | 802 | 1438 79% | 767 -4% | 1246 55% | 1353 69% | 698 -13% |
| Colorchecker dE 2000 * | 5.52 | 3.63 34% | 6.02 -9% | 4 28% | 5.28 4% | 6.96 -26% |
| Colorchecker dE 2000 max. * | 9.29 | 6.74 27% | 10.06 -8% | 8.6 7% | 9.83 -6% | 13.43 -45% |
| Greyscale dE 2000 * | 6.95 | 2.18 69% | 6.29 9% | 5.5 21% | 6.71 3% | 7.44 -7% |
| Gamma | 2.58 85% | 3.09 71% | 2.4 92% | 2.16 102% | 2.29 96% | 2.41 91% |
| CCT | 7009 93% | 6767 96% | 7712 84% | 7546 86% | 6532 100% | 8126 80% |
| Color Space (Percent of AdobeRGB 1998) (%) | 56 | 63 13% | 47.8 -15% | 64.86 16% | 59 5% | 53 -5% |
| Color Space (Percent of sRGB) (%) | 88 | 99 13% | 73.2 -17% | 93.97 7% | 91 3% | 83 -6% |
| Total Average (Program / Settings) | 11% /
23% | -1% /
-2% | 5% /
17% | 6% /
11% | 1% /
-5% |
* ... smaller is better
Display Response Times
| ↔ Response Time Black to White | ||
|---|---|---|
| 26 ms ... rise ↗ and fall ↘ combined | ↗ 14 ms rise | 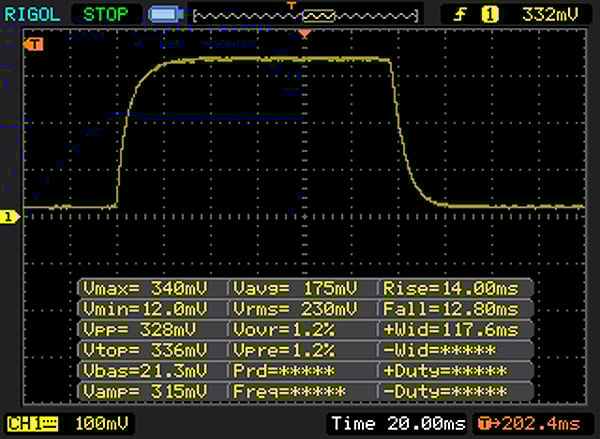 |
| ↘ 12 ms fall | ||
| The screen shows relatively slow response rates in our tests and may be too slow for gamers. In comparison, all tested devices range from 0.1 (minimum) to 240 (maximum) ms. » 63 % of all devices are better. This means that the measured response time is worse than the average of all tested devices (19.8 ms). | ||
| ↔ Response Time 50% Grey to 80% Grey | ||
| 37 ms ... rise ↗ and fall ↘ combined | ↗ 19 ms rise | 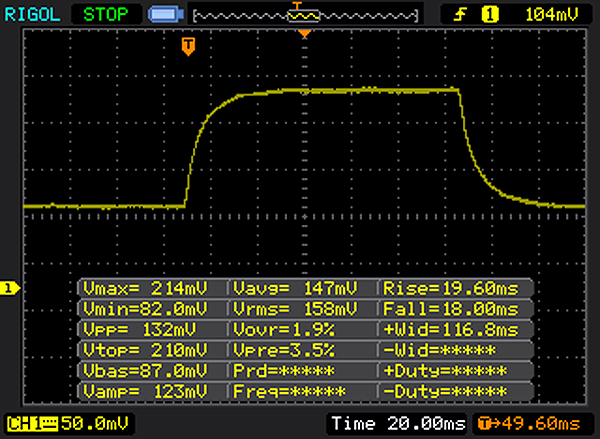 |
| ↘ 18 ms fall | ||
| The screen shows slow response rates in our tests and will be unsatisfactory for gamers. In comparison, all tested devices range from 0.165 (minimum) to 636 (maximum) ms. » 53 % of all devices are better. This means that the measured response time is worse than the average of all tested devices (31 ms). | ||
Screen Flickering / PWM (Pulse-Width Modulation)
| Screen flickering / PWM not detected | ||
In comparison: 52 % of all tested devices do not use PWM to dim the display. If PWM was detected, an average of 7754 (minimum: 5 - maximum: 343500) Hz was measured. | ||
| Cinebench R10 | |
| Rendering Single CPUs 64Bit | |
| Acer Switch 5 SW512-52-5819 | |
| Rendering Multiple CPUs 64Bit | |
| Acer Switch 5 SW512-52-5819 | |
| PCMark 8 Home Score Accelerated v2 | 3556 points | |
| PCMark 8 Work Score Accelerated v2 | 4585 points | |
| PCMark 10 Score | 3448 points | |
Help | ||
| Acer Switch 5 SW512-52-5819 Intel SSD 600p SSDPEKKW512G7 | Microsoft Surface Pro (2017) i5 Samsung PM971 KUS030202M | HP Elite x2 1012 G1 Liteon L8H-256V2G | Dell Latitude 12 5285 2-in-1 Samsung PM961 MZVLW256HEHP | Lenovo Ideapad Miix 720-12IKB Samsung SSD PM961 1TB M.2 PCIe 3.0 x4 NVMe (MZVLW1T0) | Acer Aspire Switch Alpha 12 SA5-271-70EQ Lite-On CV1-8B512 M.2 512 GB | |
|---|---|---|---|---|---|---|
| CrystalDiskMark 3.0 | -8% | -40% | -1% | 80% | -35% | |
| Read Seq (MB/s) | 1066 | 723 -32% | 501 -53% | 1294 21% | 2408 126% | 496.6 -53% |
| Write Seq (MB/s) | 593 | 853 44% | 297.2 -50% | 865 46% | 1702 187% | 415.3 -30% |
| Read 512 (MB/s) | 653 | 225 -66% | 351.7 -46% | 406 -38% | 1301 99% | 335.9 -49% |
| Write 512 (MB/s) | 535 | 445 -17% | 295.7 -45% | 589 10% | 1288 141% | 384 -28% |
| Read 4k (MB/s) | 35.92 | 46 28% | 28.31 -21% | 31.75 -12% | 53.6 49% | 32.38 -10% |
| Write 4k (MB/s) | 128.3 | 125 -3% | 90.3 -30% | 72.2 -44% | 162.2 26% | 81.8 -36% |
| Read 4k QD32 (MB/s) | 460.6 | 423 -8% | 285 -38% | 493.3 7% | 504 9% | 296.3 -36% |
| Write 4k QD32 (MB/s) | 425.4 | 373 -12% | 268.4 -37% | 434.5 2% | 420.8 -1% | 260.3 -39% |

| 3DMark 11 - 1280x720 Performance GPU | |
| Acer Switch 5 SW512-52-5819 | |
| Dell Latitude 12 5285 2-in-1 | |
| Acer Aspire Switch Alpha 12 SA5-271-70EQ | |
| Lenovo Ideapad Miix 720-12IKB | |
| HP Elite x2 1012 G1 | |
| 3DMark 11 Performance | 1778 points | |
| 3DMark Cloud Gate Standard Score | 6743 points | |
| 3DMark Fire Strike Score | 944 points | |
Help | ||
| Rise of the Tomb Raider | |
| 1024x768 Lowest Preset | |
| Acer Switch 5 SW512-52-5819 | |
| Lenovo Ideapad Miix 720-12IKB | |
| Acer Aspire Switch Alpha 12 SA5-271-70EQ | |
| Microsoft Surface Pro (2017) i5 | |
| 1366x768 Medium Preset AF:2x | |
| Acer Switch 5 SW512-52-5819 | |
| Lenovo Ideapad Miix 720-12IKB | |
| Microsoft Surface Pro (2017) i5 | |
| Acer Aspire Switch Alpha 12 SA5-271-70EQ | |
| low | med. | high | ultra | |
|---|---|---|---|---|
| BioShock Infinite (2013) | 60.4 | 31.59 | 27.95 | 8.51 |
| Rise of the Tomb Raider (2016) | 18.45 | 11.78 | 6.25 | 4.4 |
| Rocket League (2017) | 56.8 | 27.48 | 18.35 |
(±) The maximum temperature on the upper side is 44.7 °C / 112 F, compared to the average of 35.4 °C / 96 F, ranging from 19.6 to 60 °C for the class Convertible.
(-) The bottom heats up to a maximum of 47.5 °C / 118 F, compared to the average of 36.9 °C / 98 F
(+) In idle usage, the average temperature for the upper side is 28.3 °C / 83 F, compared to the device average of 30.3 °C / 87 F.
(-) The palmrests and touchpad can get very hot to the touch with a maximum of 44.7 °C / 112.5 F.
(-) The average temperature of the palmrest area of similar devices was 28 °C / 82.4 F (-16.7 °C / -30.1 F).
| Acer Switch 5 SW512-52-5819 HD Graphics 620, i7-7500U, Intel SSD 600p SSDPEKKW512G7 | Microsoft Surface Pro (2017) i5 HD Graphics 620, i5-7300U, Samsung PM971 KUS030202M | HP Elite x2 1012 G1 HD Graphics 515, 6Y54, Liteon L8H-256V2G | Dell Latitude 12 5285 2-in-1 HD Graphics 620, i7-7600U, Samsung PM961 MZVLW256HEHP | Lenovo Ideapad Miix 720-12IKB HD Graphics 620, i7-7500U, Samsung SSD PM961 1TB M.2 PCIe 3.0 x4 NVMe (MZVLW1T0) | Acer Aspire Switch Alpha 12 SA5-271-56HM HD Graphics 520, 6200U, Kingston RBU-SNS8152S3256GG2 | |
|---|---|---|---|---|---|---|
| Heat | -1% | 8% | 5% | -4% | -1% | |
| Maximum Upper Side * (°C) | 44.7 | 39.2 12% | 39 13% | 38.2 15% | 42 6% | 46.7 -4% |
| Maximum Bottom * (°C) | 47.5 | 40.3 15% | 41.2 13% | 48.6 -2% | 43.6 8% | 51 -7% |
| Idle Upper Side * (°C) | 29.7 | 37 -25% | 29.5 1% | 29.6 -0% | 32.8 -10% | 29.5 1% |
| Idle Bottom * (°C) | 30.7 | 32.3 -5% | 29.8 3% | 28.8 6% | 36.4 -19% | 28.6 7% |
* ... smaller is better
Acer Switch 5 SW512-52-5819 audio analysis
(-) | not very loud speakers (69 dB)
Bass 100 - 315 Hz
(-) | nearly no bass - on average 26.3% lower than median
(+) | bass is linear (6.6% delta to prev. frequency)
Mids 400 - 2000 Hz
(±) | reduced mids - on average 6.8% lower than median
(±) | linearity of mids is average (10.4% delta to prev. frequency)
Highs 2 - 16 kHz
(+) | balanced highs - only 2.8% away from median
(+) | highs are linear (3.8% delta to prev. frequency)
Overall 100 - 16.000 Hz
(±) | linearity of overall sound is average (26.7% difference to median)
Compared to same class
» 83% of all tested devices in this class were better, 3% similar, 14% worse
» The best had a delta of 6%, average was 20%, worst was 57%
Compared to all devices tested
» 82% of all tested devices were better, 4% similar, 14% worse
» The best had a delta of 4%, average was 23%, worst was 134%
Microsoft Surface Pro (2017) i5 audio analysis
(-) | not very loud speakers (68 dB)
Bass 100 - 315 Hz
(±) | reduced bass - on average 9.7% lower than median
(±) | linearity of bass is average (7% delta to prev. frequency)
Mids 400 - 2000 Hz
(+) | balanced mids - only 4.6% away from median
(+) | mids are linear (6.3% delta to prev. frequency)
Highs 2 - 16 kHz
(+) | balanced highs - only 2.1% away from median
(+) | highs are linear (5.2% delta to prev. frequency)
Overall 100 - 16.000 Hz
(±) | linearity of overall sound is average (18.2% difference to median)
Compared to same class
» 40% of all tested devices in this class were better, 7% similar, 53% worse
» The best had a delta of 6%, average was 20%, worst was 57%
Compared to all devices tested
» 39% of all tested devices were better, 8% similar, 53% worse
» The best had a delta of 4%, average was 23%, worst was 134%
Acer Aspire Switch Alpha 12 SA5-271-56HM audio analysis
(±) | speaker loudness is average but good (73 dB)
Analysis not possible as minimum curve is missing or too high
| Off / Standby | |
| Idle | |
| Load |
|
Key:
min: | |
| Acer Switch 5 SW512-52-5819 i7-7500U, HD Graphics 620, Intel SSD 600p SSDPEKKW512G7, IPS, 2160x1440, 12" | Microsoft Surface Pro (2017) i5 i5-7300U, HD Graphics 620, Samsung PM971 KUS030202M, IPS, 2736x1824, 12.3" | HP Elite x2 1012 G1 6Y54, HD Graphics 515, Liteon L8H-256V2G, IPS, 1920x1280, 12.1" | Dell Latitude 12 5285 2-in-1 i7-7600U, HD Graphics 620, Samsung PM961 MZVLW256HEHP, IPS, 1920x1280, 12.3" | Lenovo Ideapad Miix 720-12IKB i7-7500U, HD Graphics 620, Samsung SSD PM961 1TB M.2 PCIe 3.0 x4 NVMe (MZVLW1T0), IPS, 2880x1920, 12" | Acer Aspire Switch Alpha 12 SA5-271-56HM 6200U, HD Graphics 520, Kingston RBU-SNS8152S3256GG2, IPS, 2160x1440, 12" | |
|---|---|---|---|---|---|---|
| Power Consumption | 0% | 2% | 0% | -1% | -32% | |
| Idle Minimum * (Watt) | 3.86 | 3.6 7% | 3.7 4% | 2.85 26% | 3.5 9% | 7.3 -89% |
| Idle Average * (Watt) | 6.4 | 8.1 -27% | 6.8 -6% | 6.76 -6% | 7.2 -13% | 10 -56% |
| Idle Maximum * (Watt) | 7.17 | 8.7 -21% | 7.6 -6% | 6.91 4% | 7.9 -10% | 10.15 -42% |
| Load Average * (Watt) | 30.5 | 25.5 16% | 22.5 26% | 32.88 -8% | 29.6 3% | 25.2 17% |
| Load Maximum * (Watt) | 32.4 | 23.5 27% | 34.5 -6% | 37.41 -15% | 30.8 5% | 29.3 10% |
* ... smaller is better
| Acer Switch 5 SW512-52-5819 i7-7500U, HD Graphics 620, Wh | Microsoft Surface Pro (2017) i5 i5-7300U, HD Graphics 620, 45 Wh | HP Elite x2 1012 G1 6Y54, HD Graphics 515, 37 Wh | Dell Latitude 12 5285 2-in-1 i7-7600U, HD Graphics 620, 42 Wh | Lenovo Ideapad Miix 720-12IKB i7-7500U, HD Graphics 620, 41 Wh | Acer Aspire Switch Alpha 12 SA5-271-56HM 6200U, HD Graphics 520, 37 Wh | |
|---|---|---|---|---|---|---|
| Battery runtime | 78% | 22% | 33% | 6% | 0% | |
| Reader / Idle (h) | 11.9 | 17.6 48% | 12.2 3% | 17.9 50% | 11.9 0% | 10.7 -10% |
| WiFi v1.3 (h) | 5.9 | 12.4 110% | 7.4 25% | 8.1 37% | 5.8 -2% | 5.4 -8% |
| Load (h) | 1.6 | 2.8 75% | 2.2 38% | 1.8 13% | 1.9 19% | 1.9 19% |
| H.264 (h) | 7.2 | 7.8 |
Pros
Cons
宏碁新一代 Switch 5 试图以高应用性能、低价格挑战 Surface Pro 。这两方面都很成功,同时,该机也具有其他的一些决定性的优势:
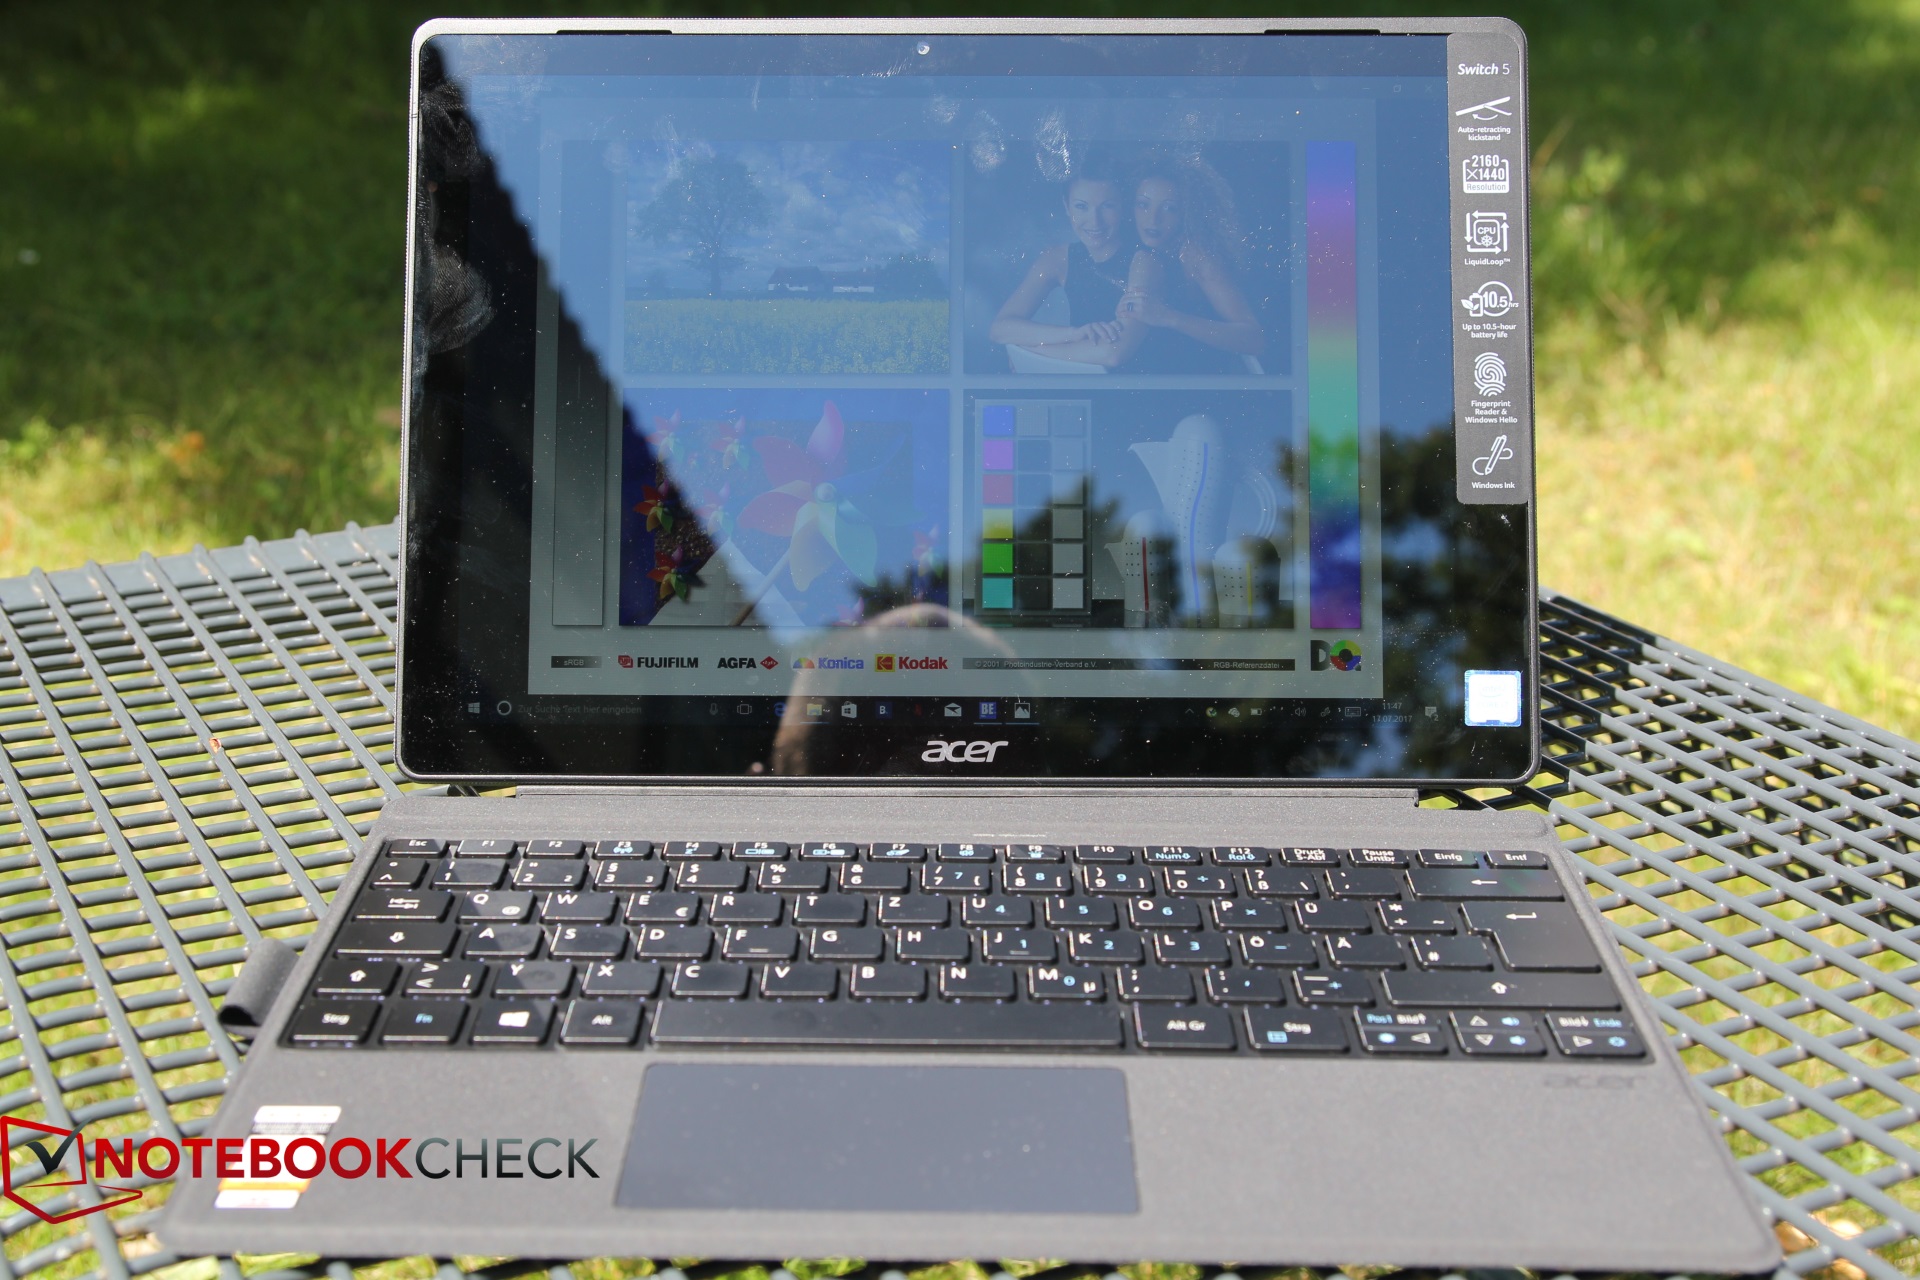
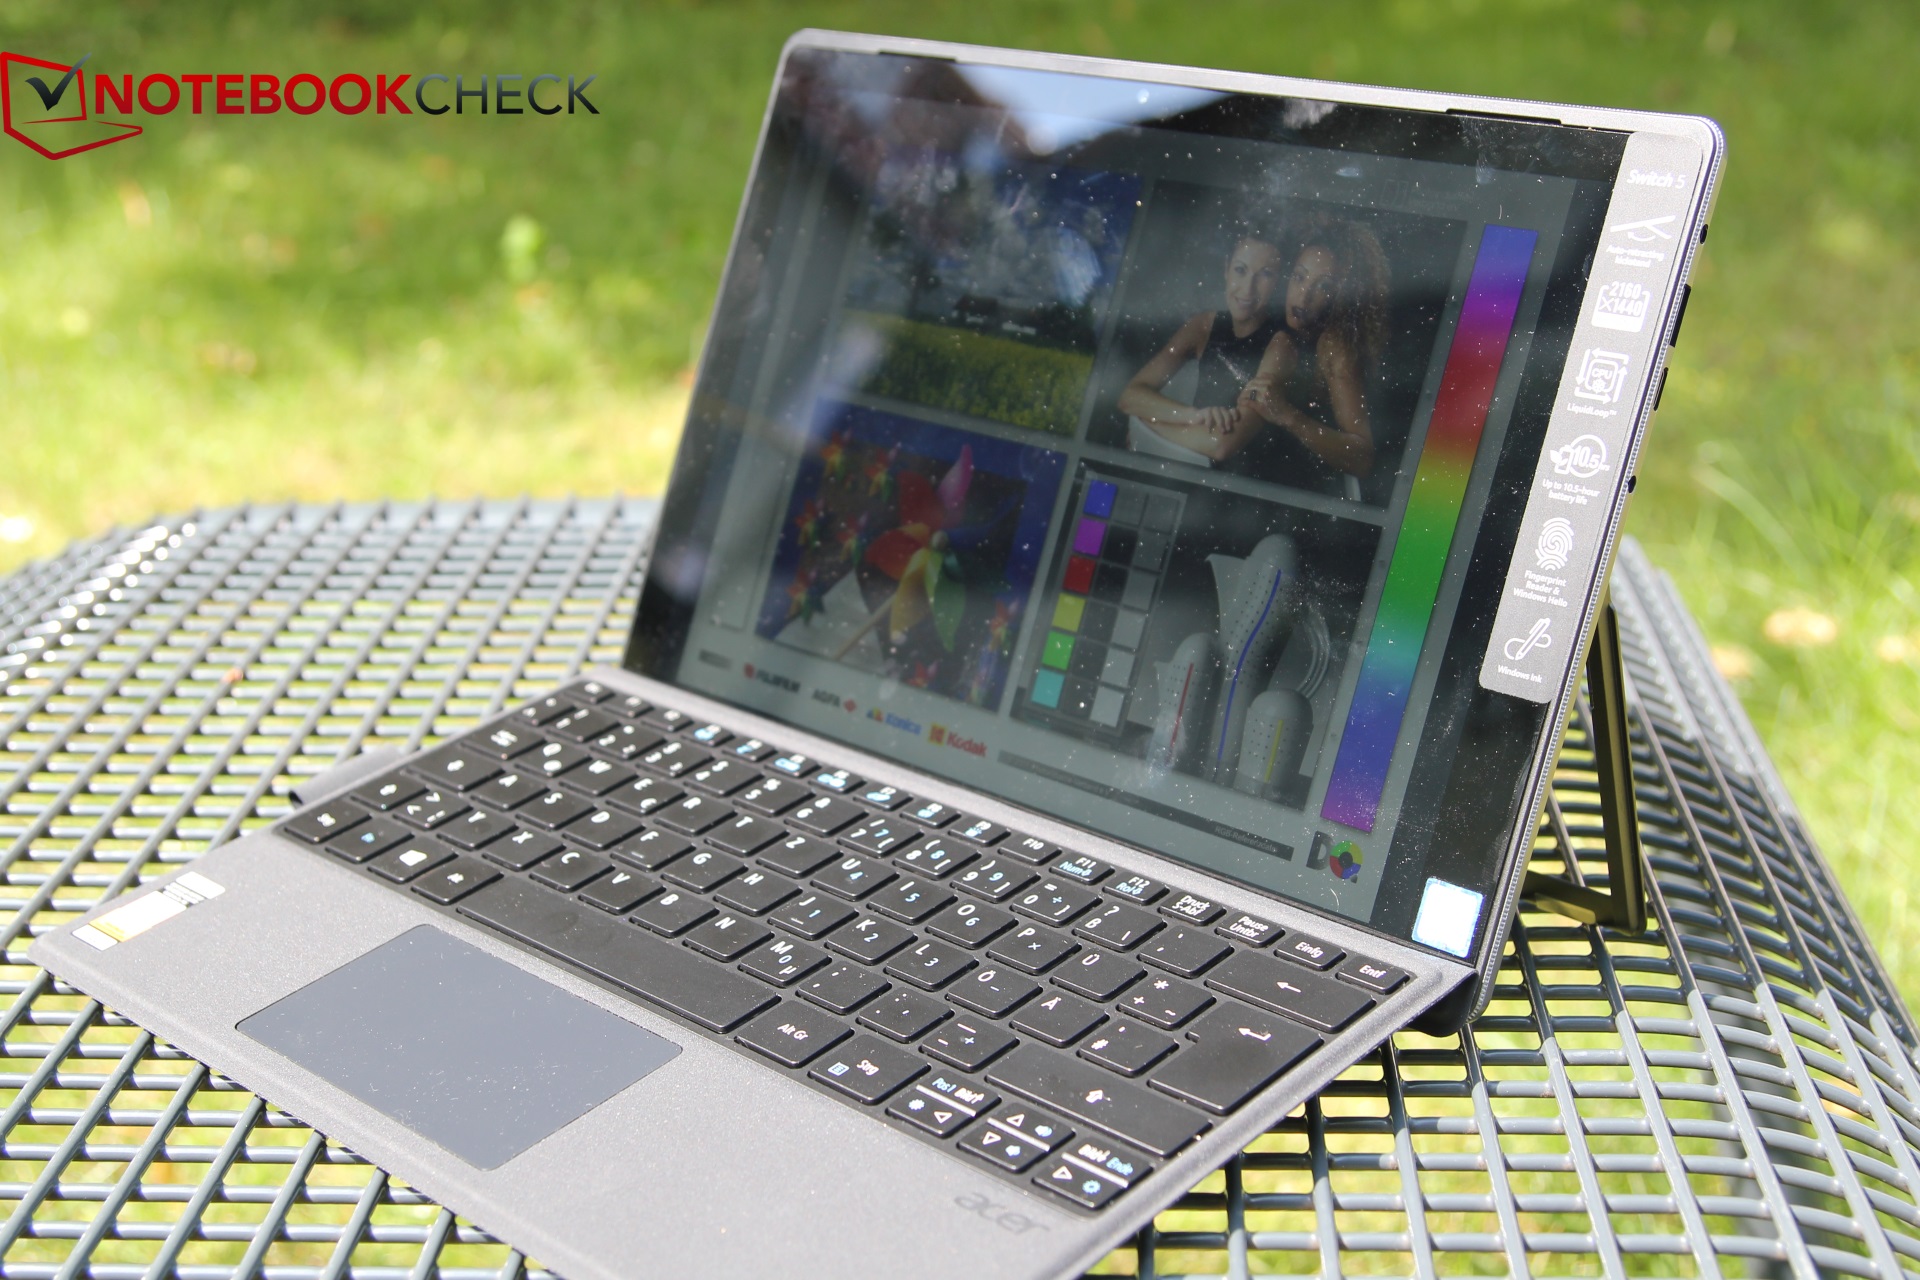
高性能的硬件水平配合相对强大的应用以及图形能力,作为代价:电池续航短,而且发热显著。低价格直接反应在屏幕上,虽然说也还不错,却比不上Surface Pro的。
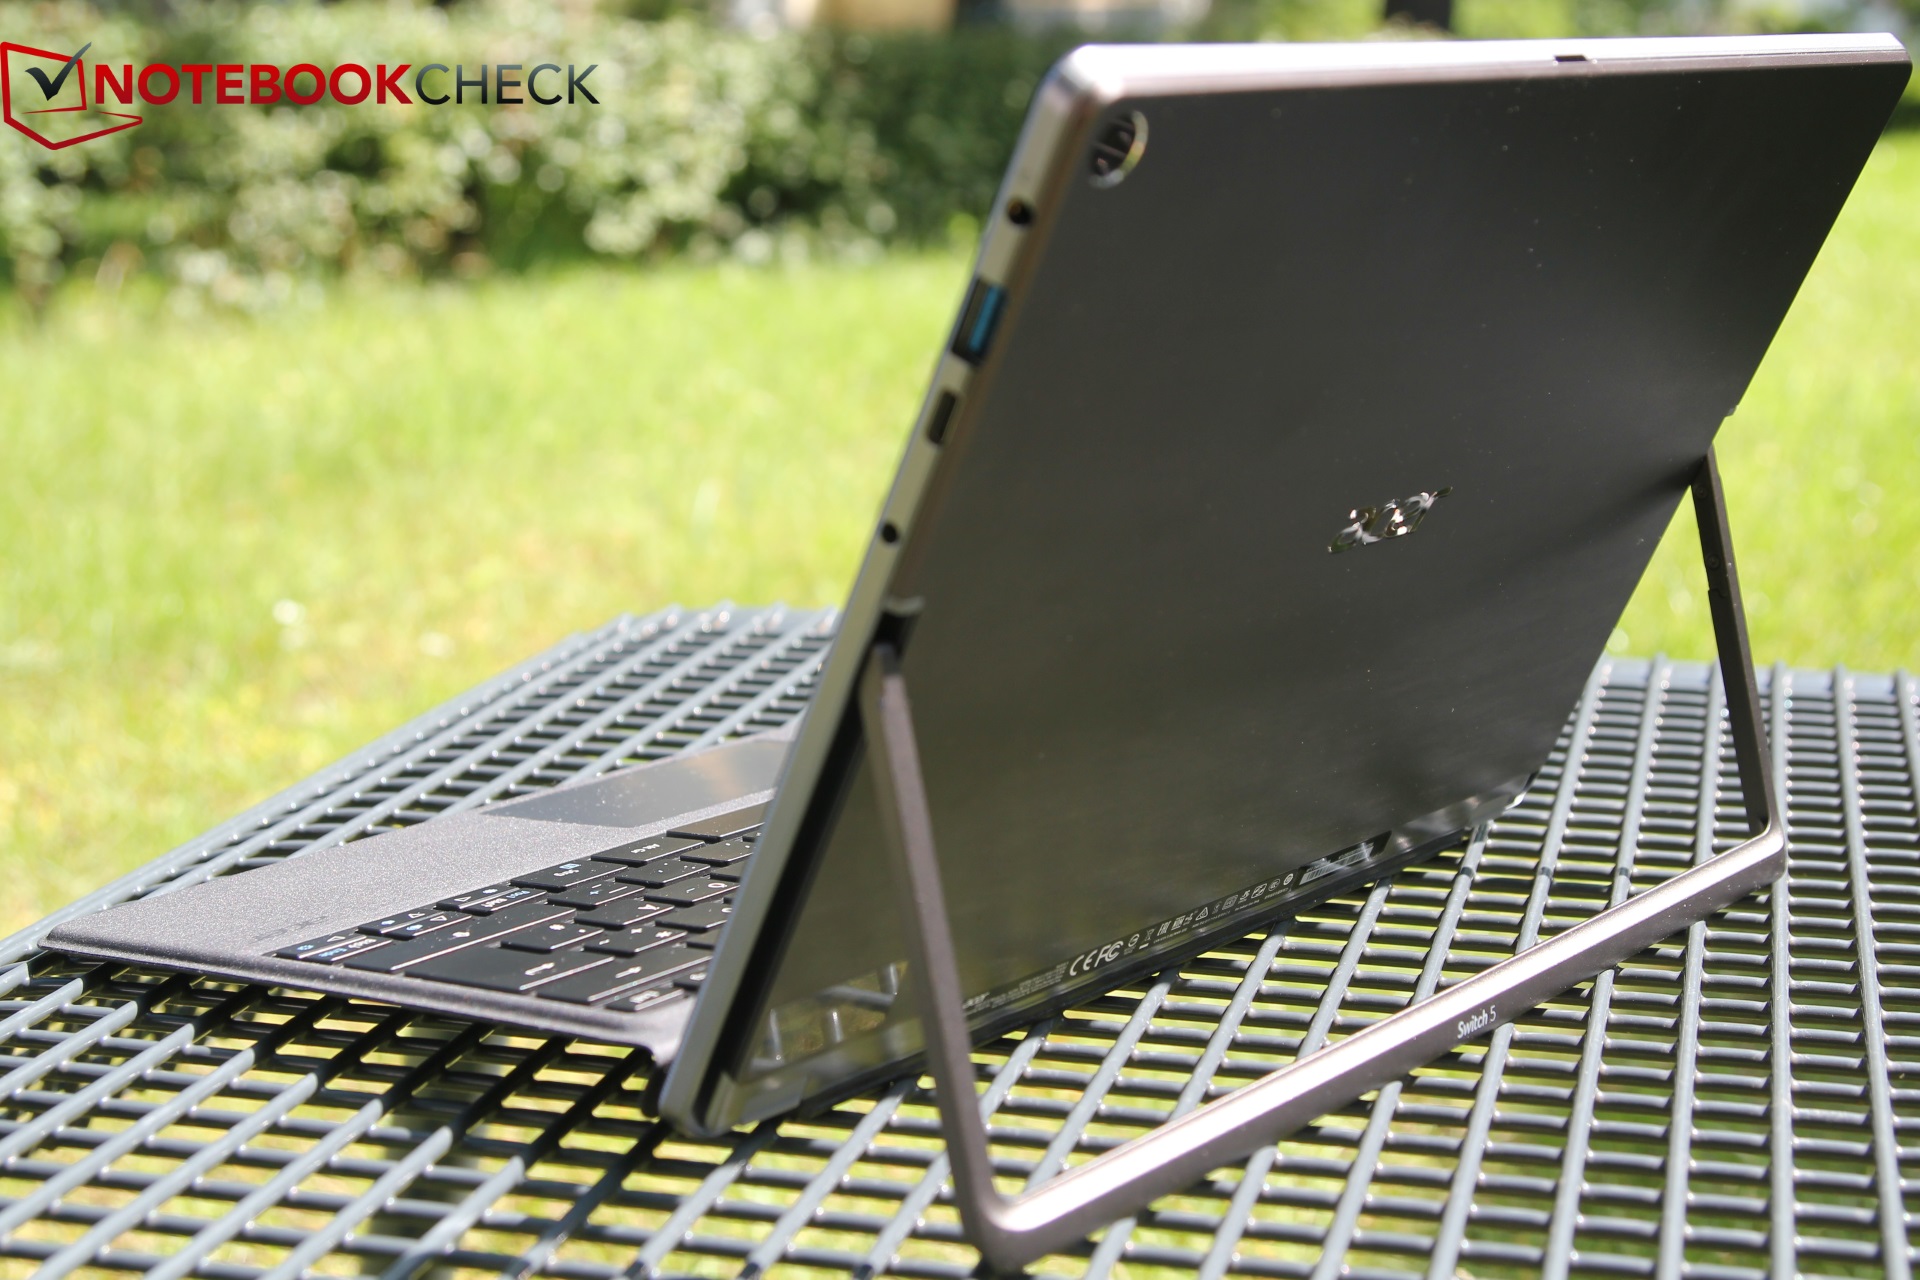
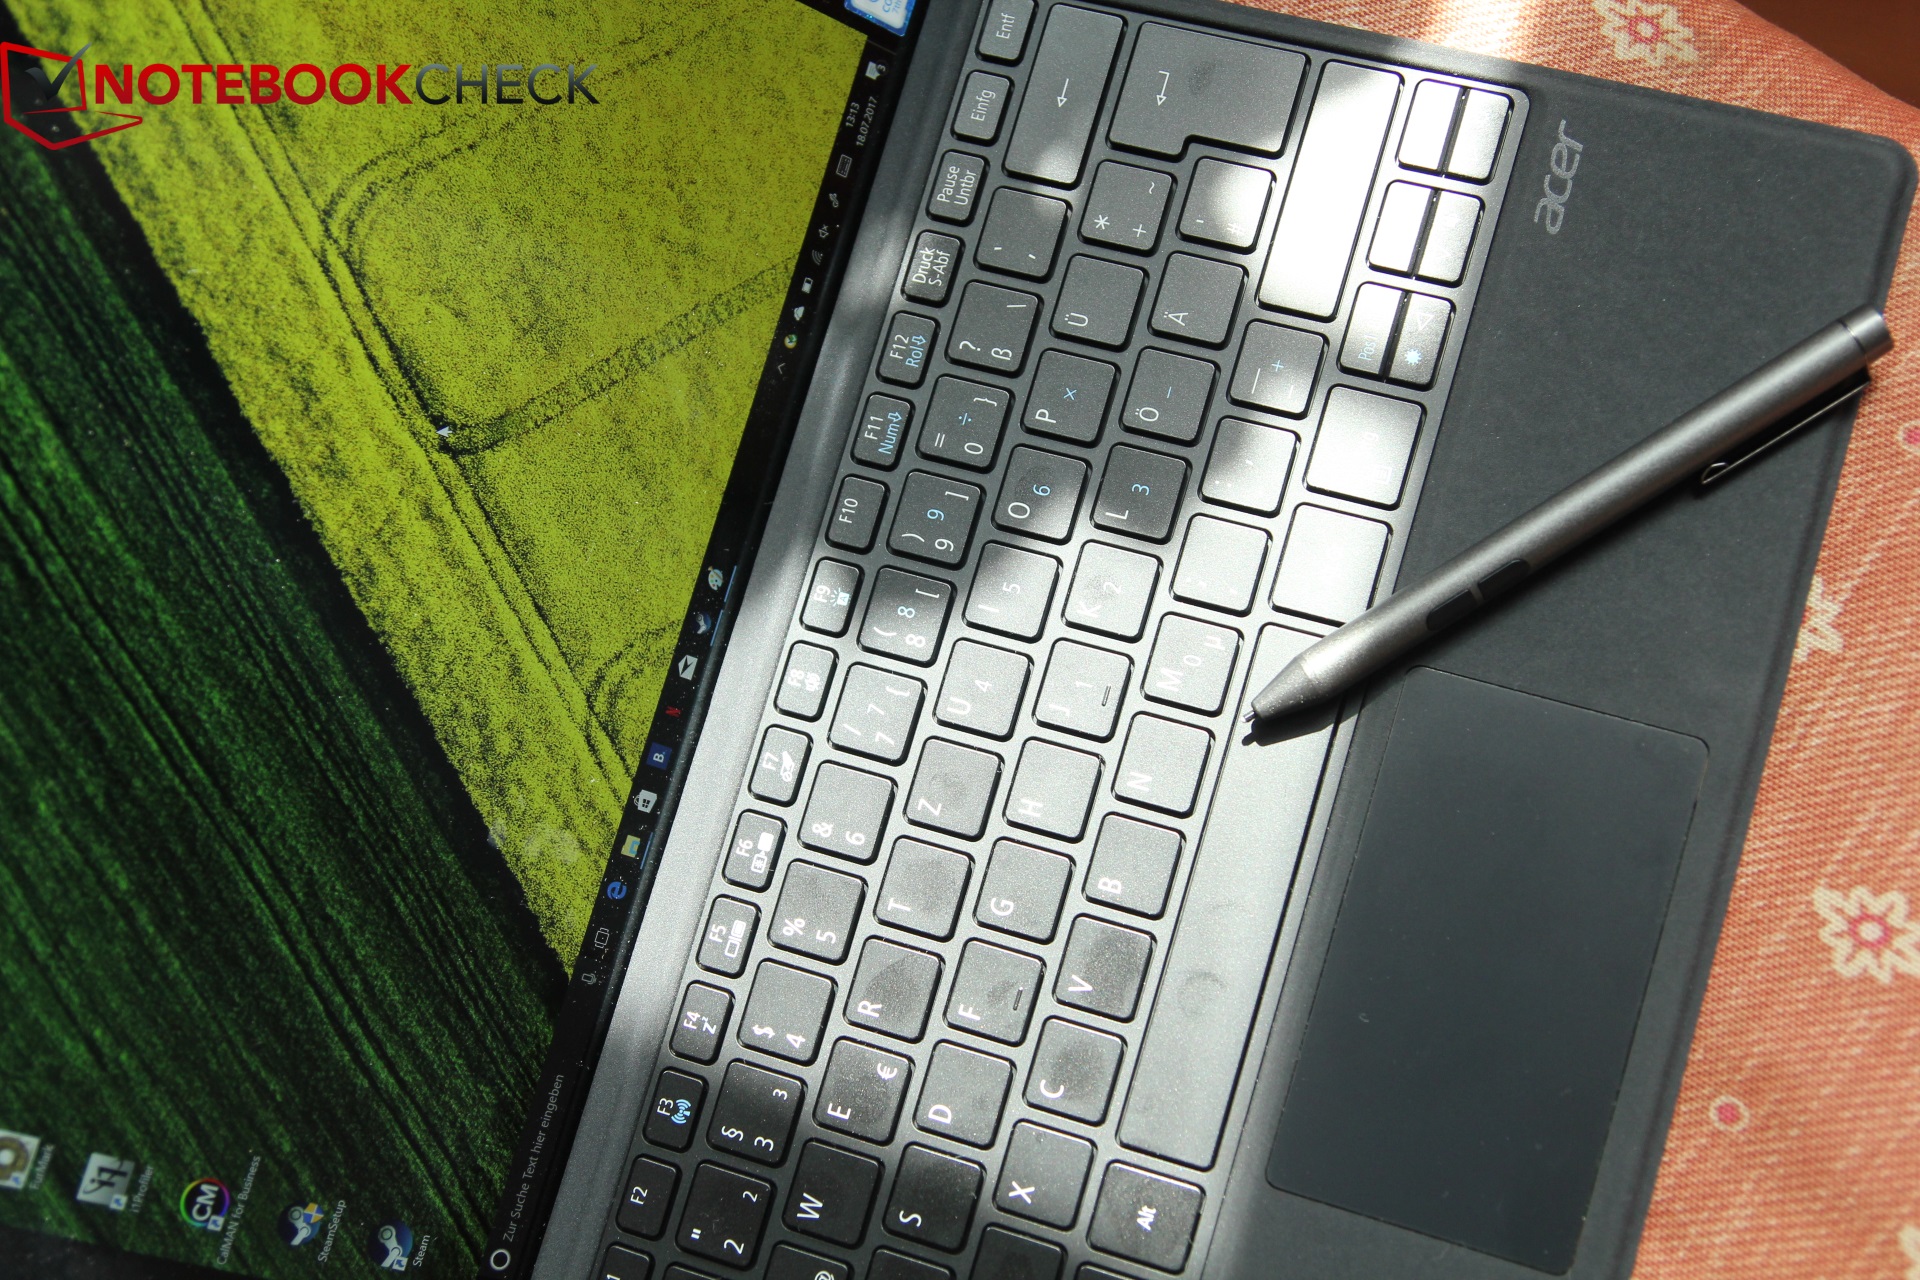
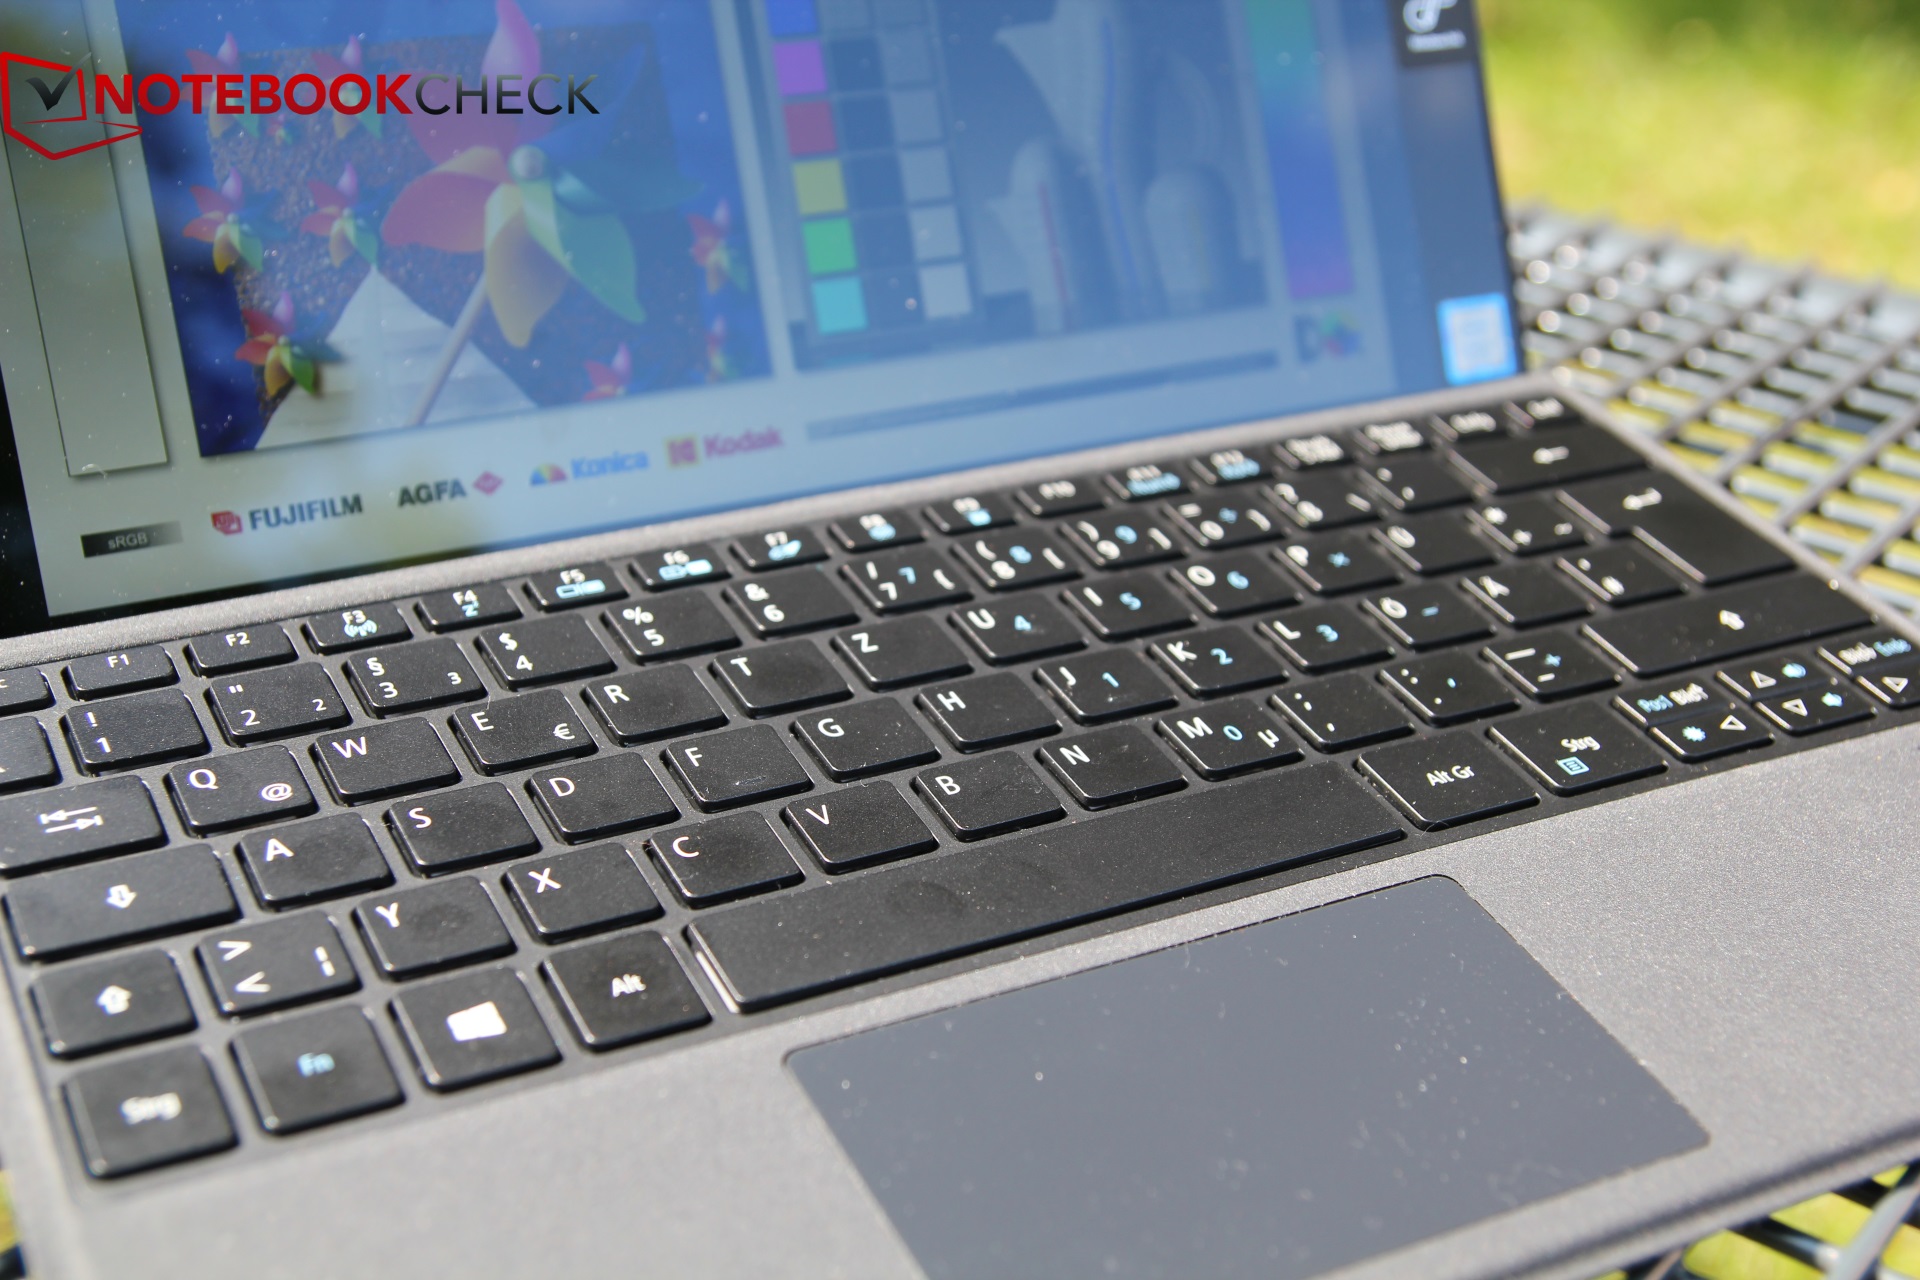
撇开单纯的性能表现不说,我们很高兴宏碁包括了键盘底座和触笔的事实。而这些配件使得Surface Pro的价格变高。输入配件的质量很好,屏幕的触控功能也是如此。配备指纹扫描器,键盘背光。
宏碁 Switch 5性能优秀,输入配件优异,价格相对实惠。
备选方案
该机高配版价格在1299欧元(1000美元),而配置较低版本价格在116欧元(800美元),这样的价格落在了市面上2合1机器的价格区间内。而Dell's Latitude 12 5285 则是一台类似的、性能更好、屏幕更优秀的机器。尽管分辨率较低,但其亮度,对比度,照明度和色彩空间覆盖率都令人信服。不过,戴尔的设备也容易发烫。
如果购买者侧重于屏幕、续航时间以及设备温度,那么可以选择 Surface Pro机型中的一款。类似价格下的配置较弱,也没有触控笔和键盘底座。所以,全套设备的话,它会更贵,但是,质量也更好。
注:本文是基于完整评测的缩减版本,阅读完整的英文评测,请点击这里。
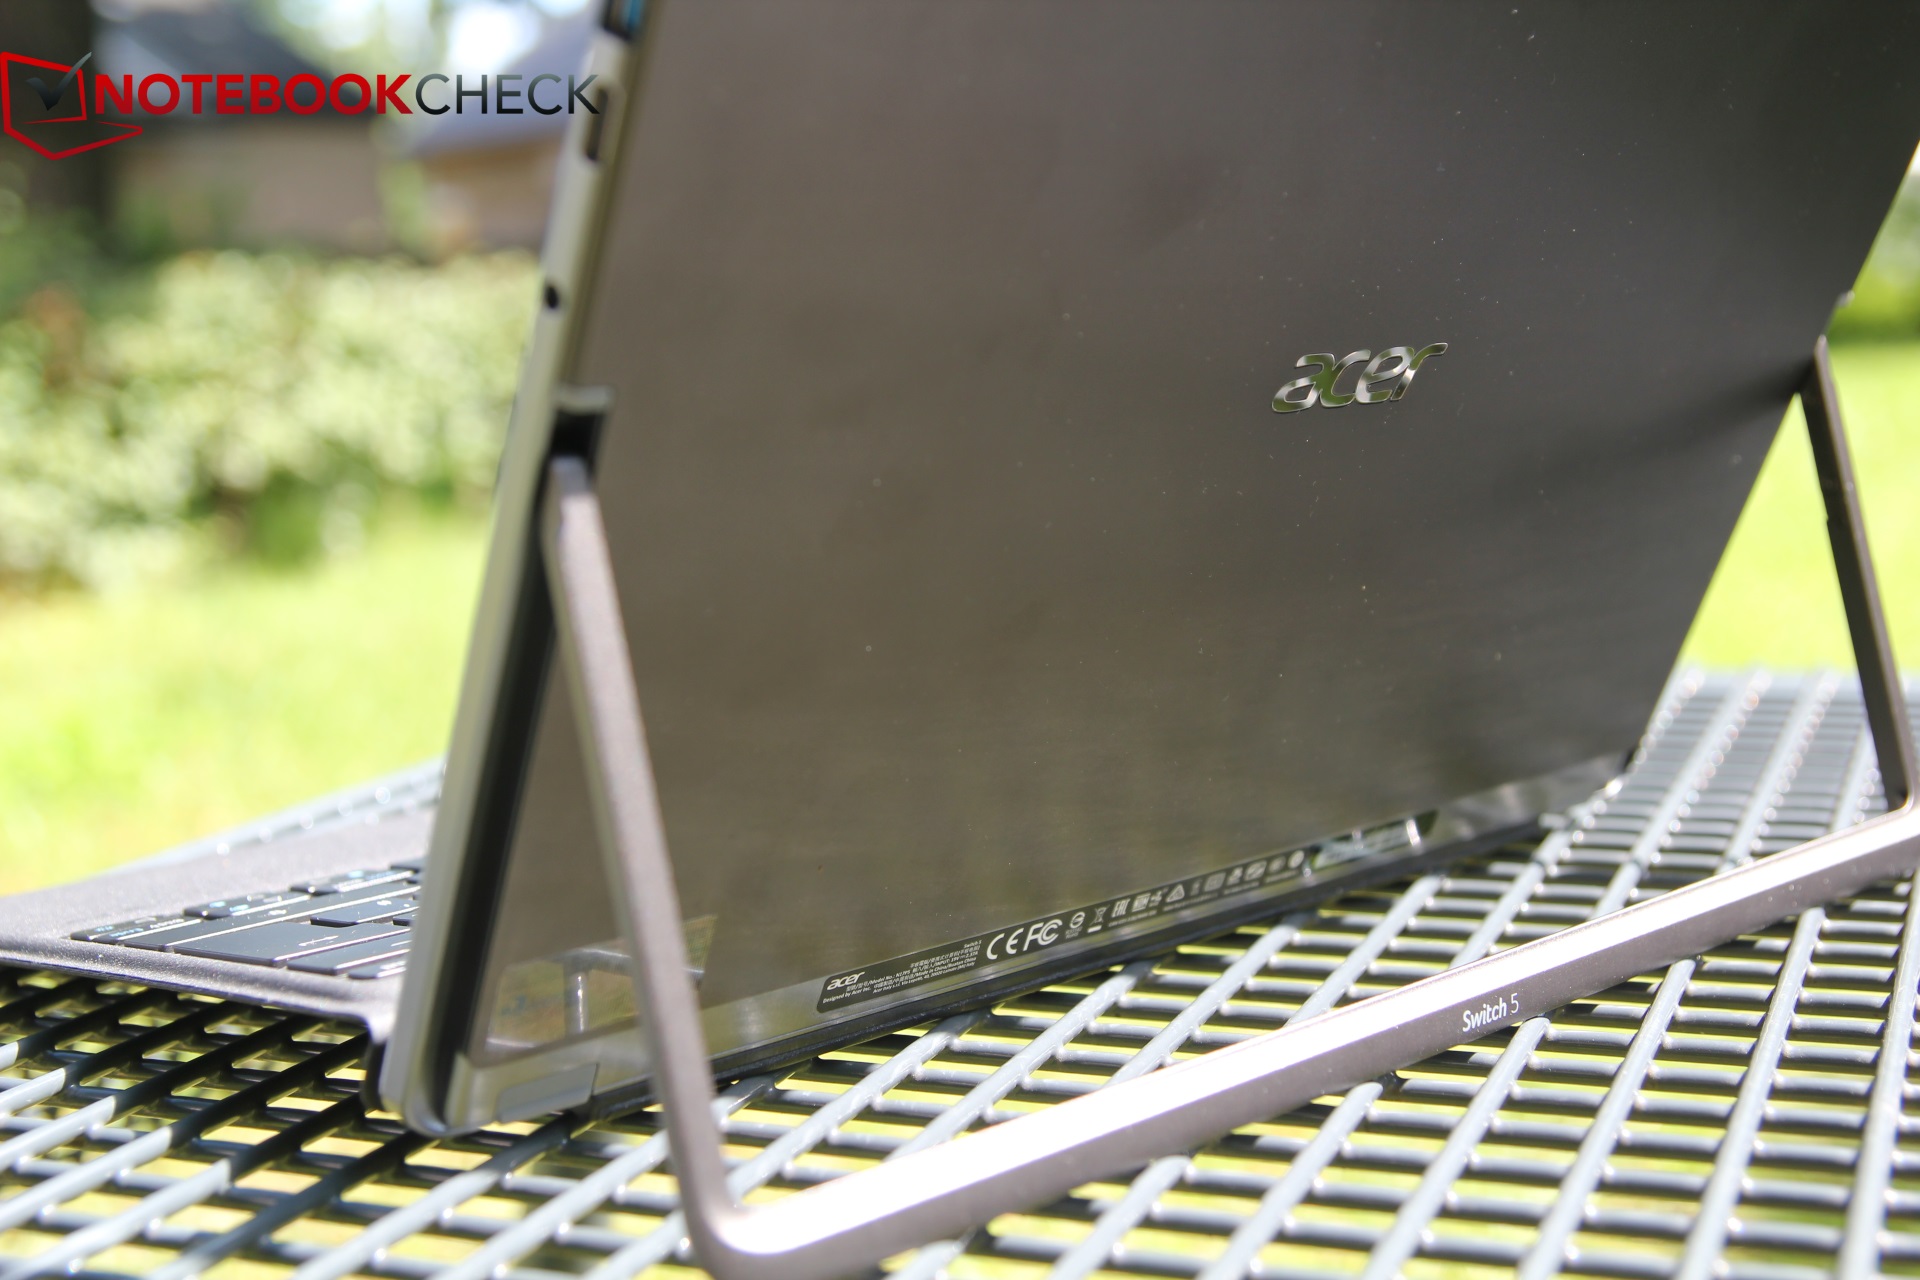
Acer Switch 5 SW512-52-5819
- 10/05/2017 v6 (old)
Christian Hintze