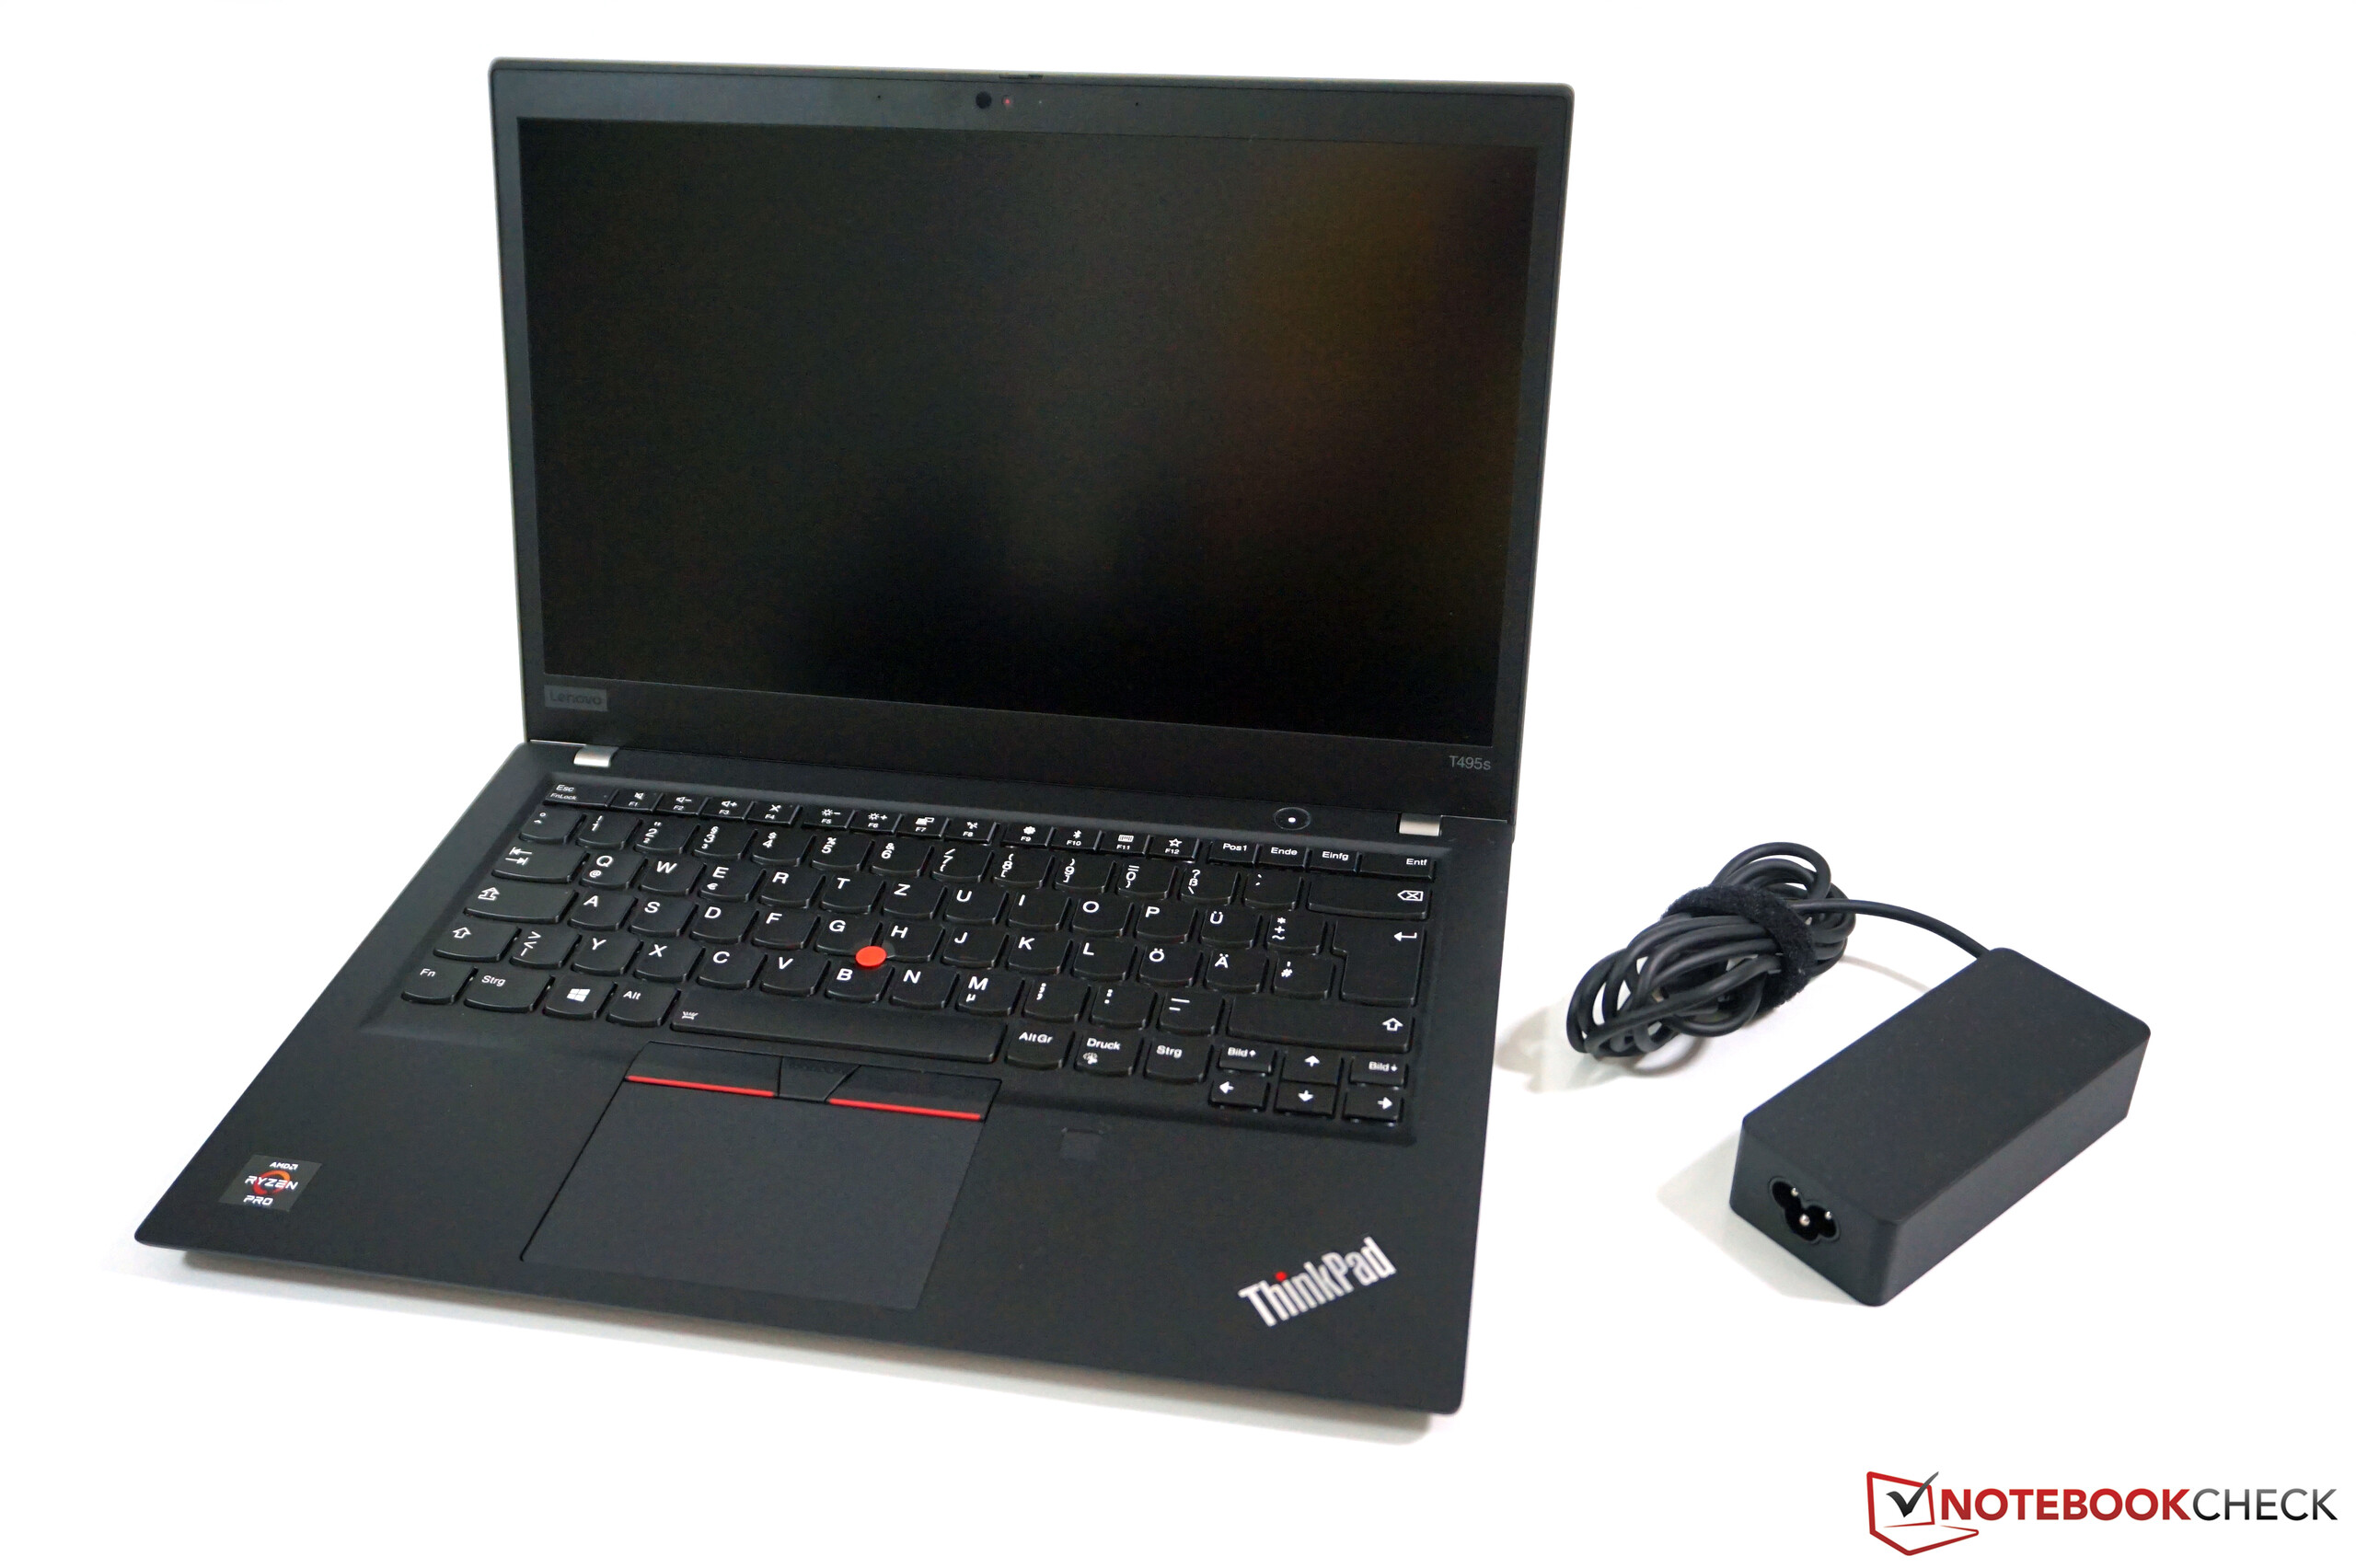
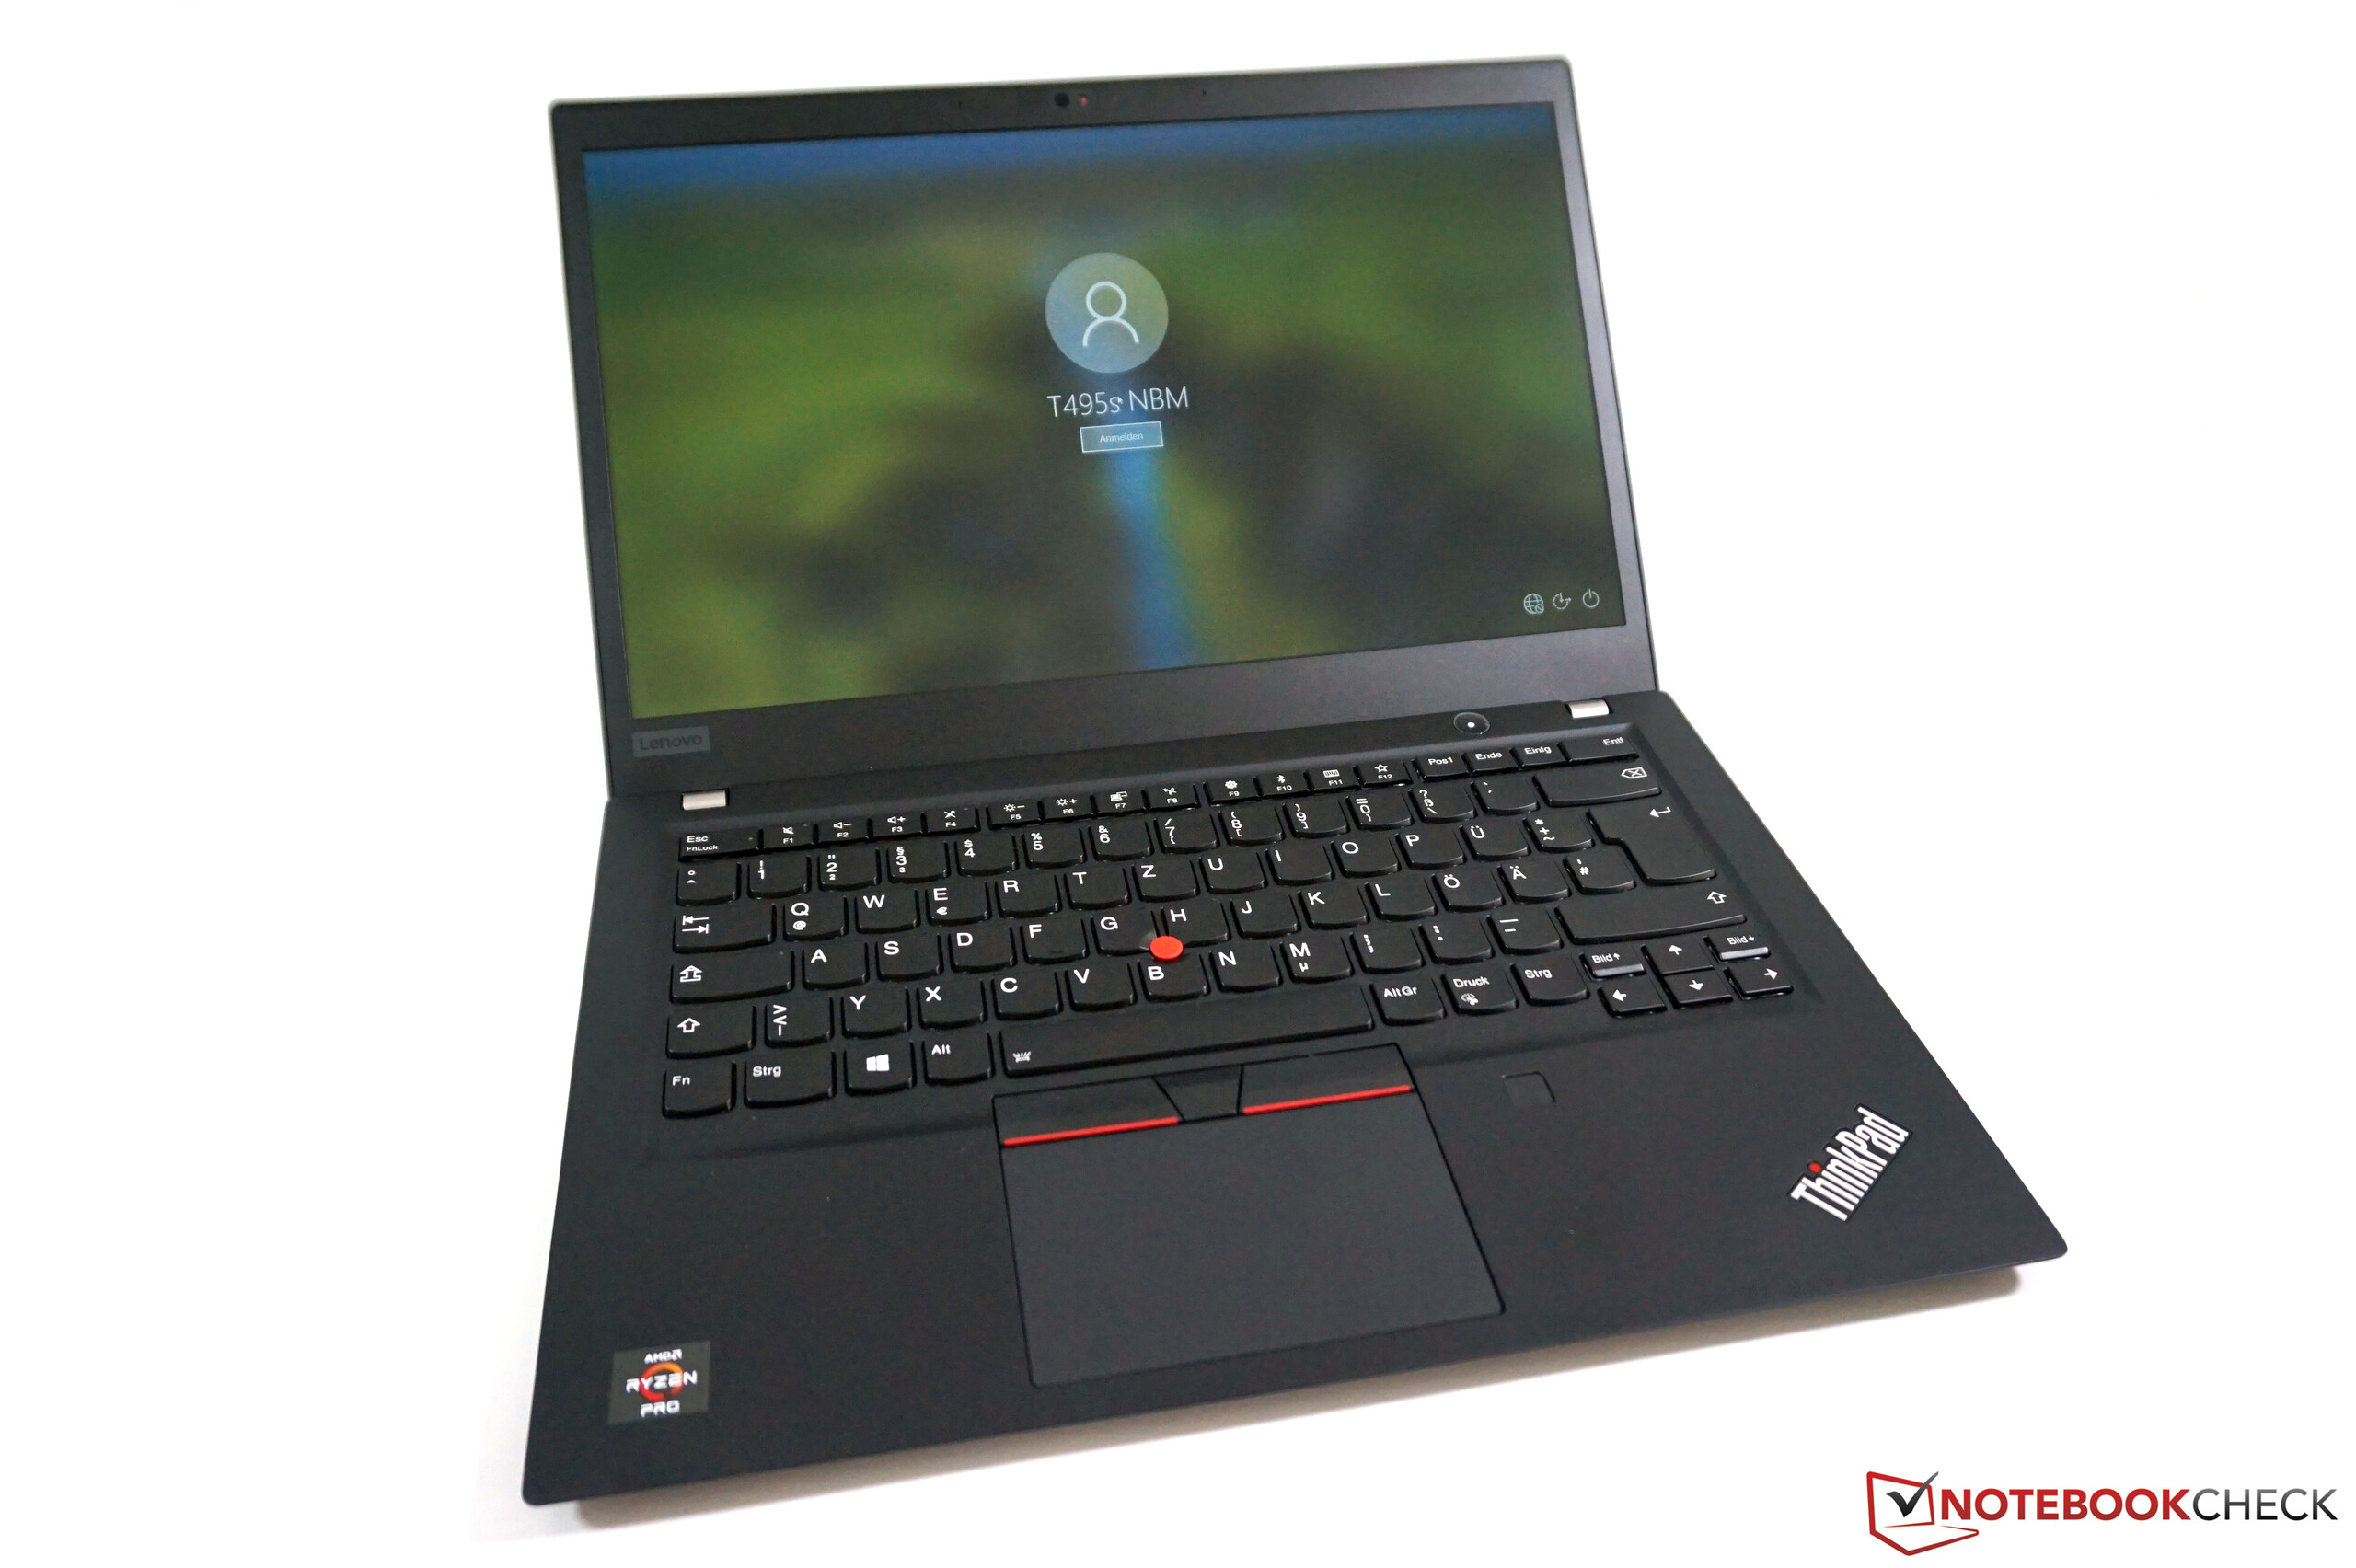
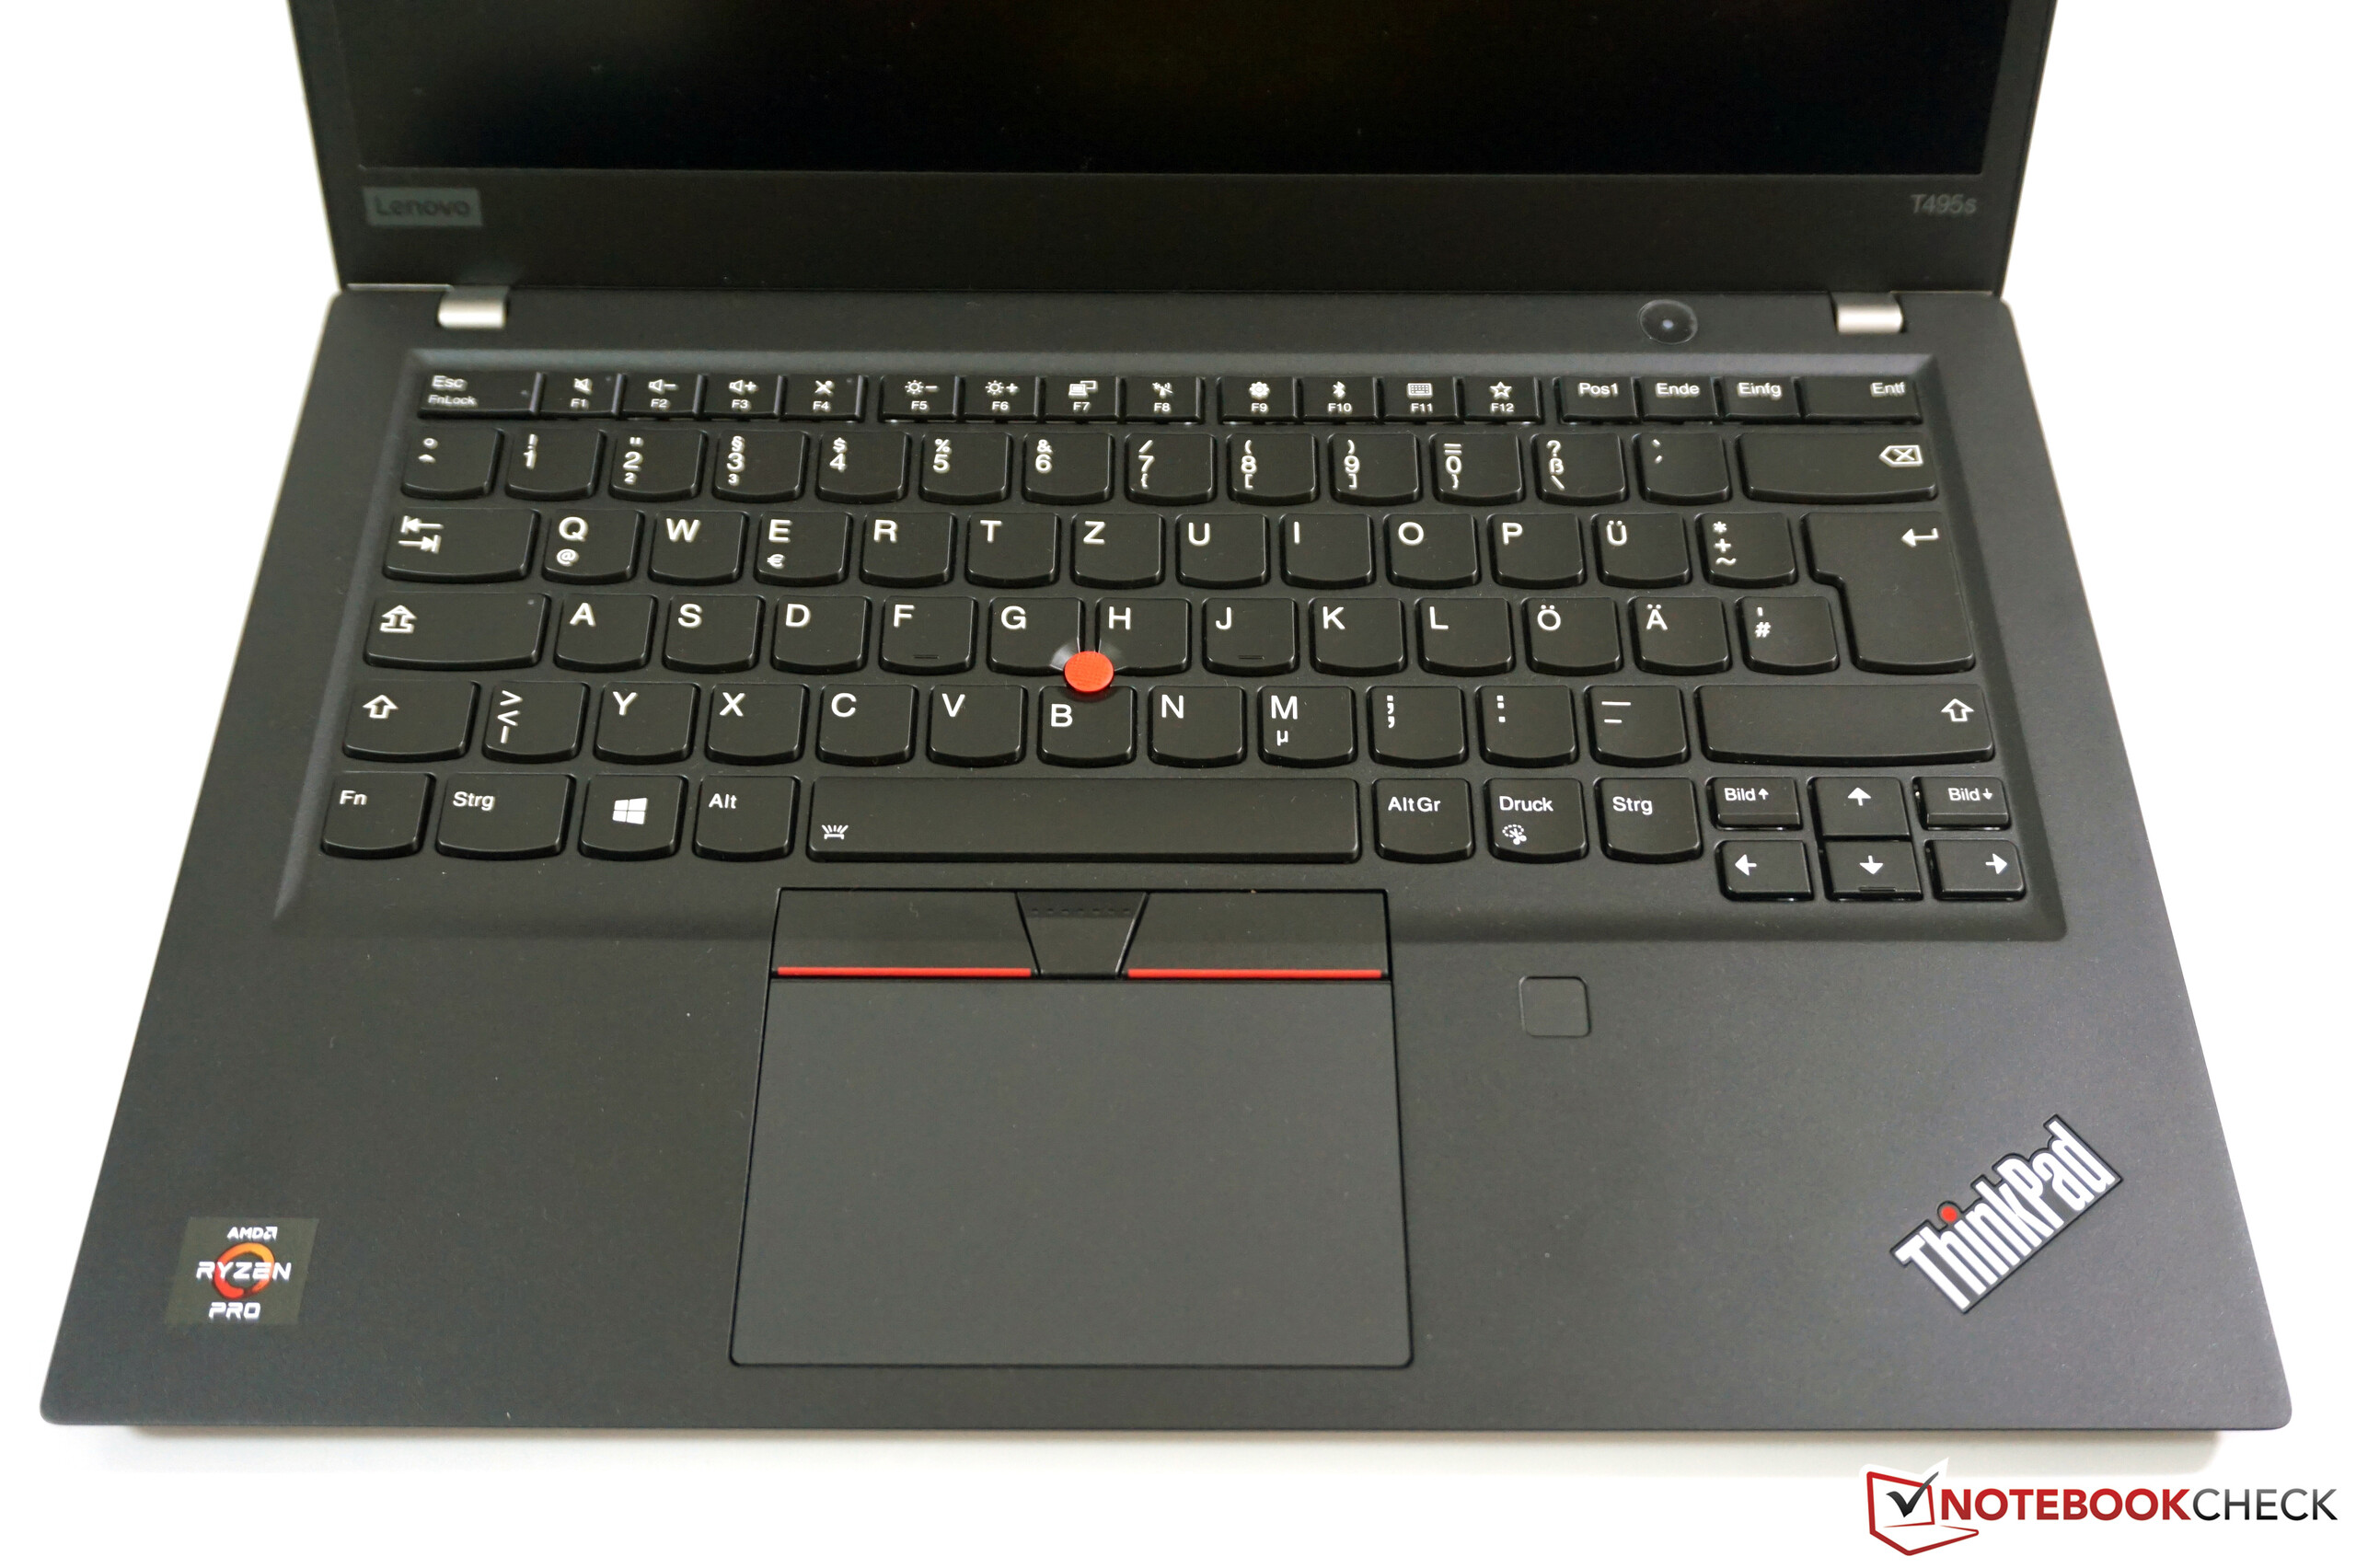
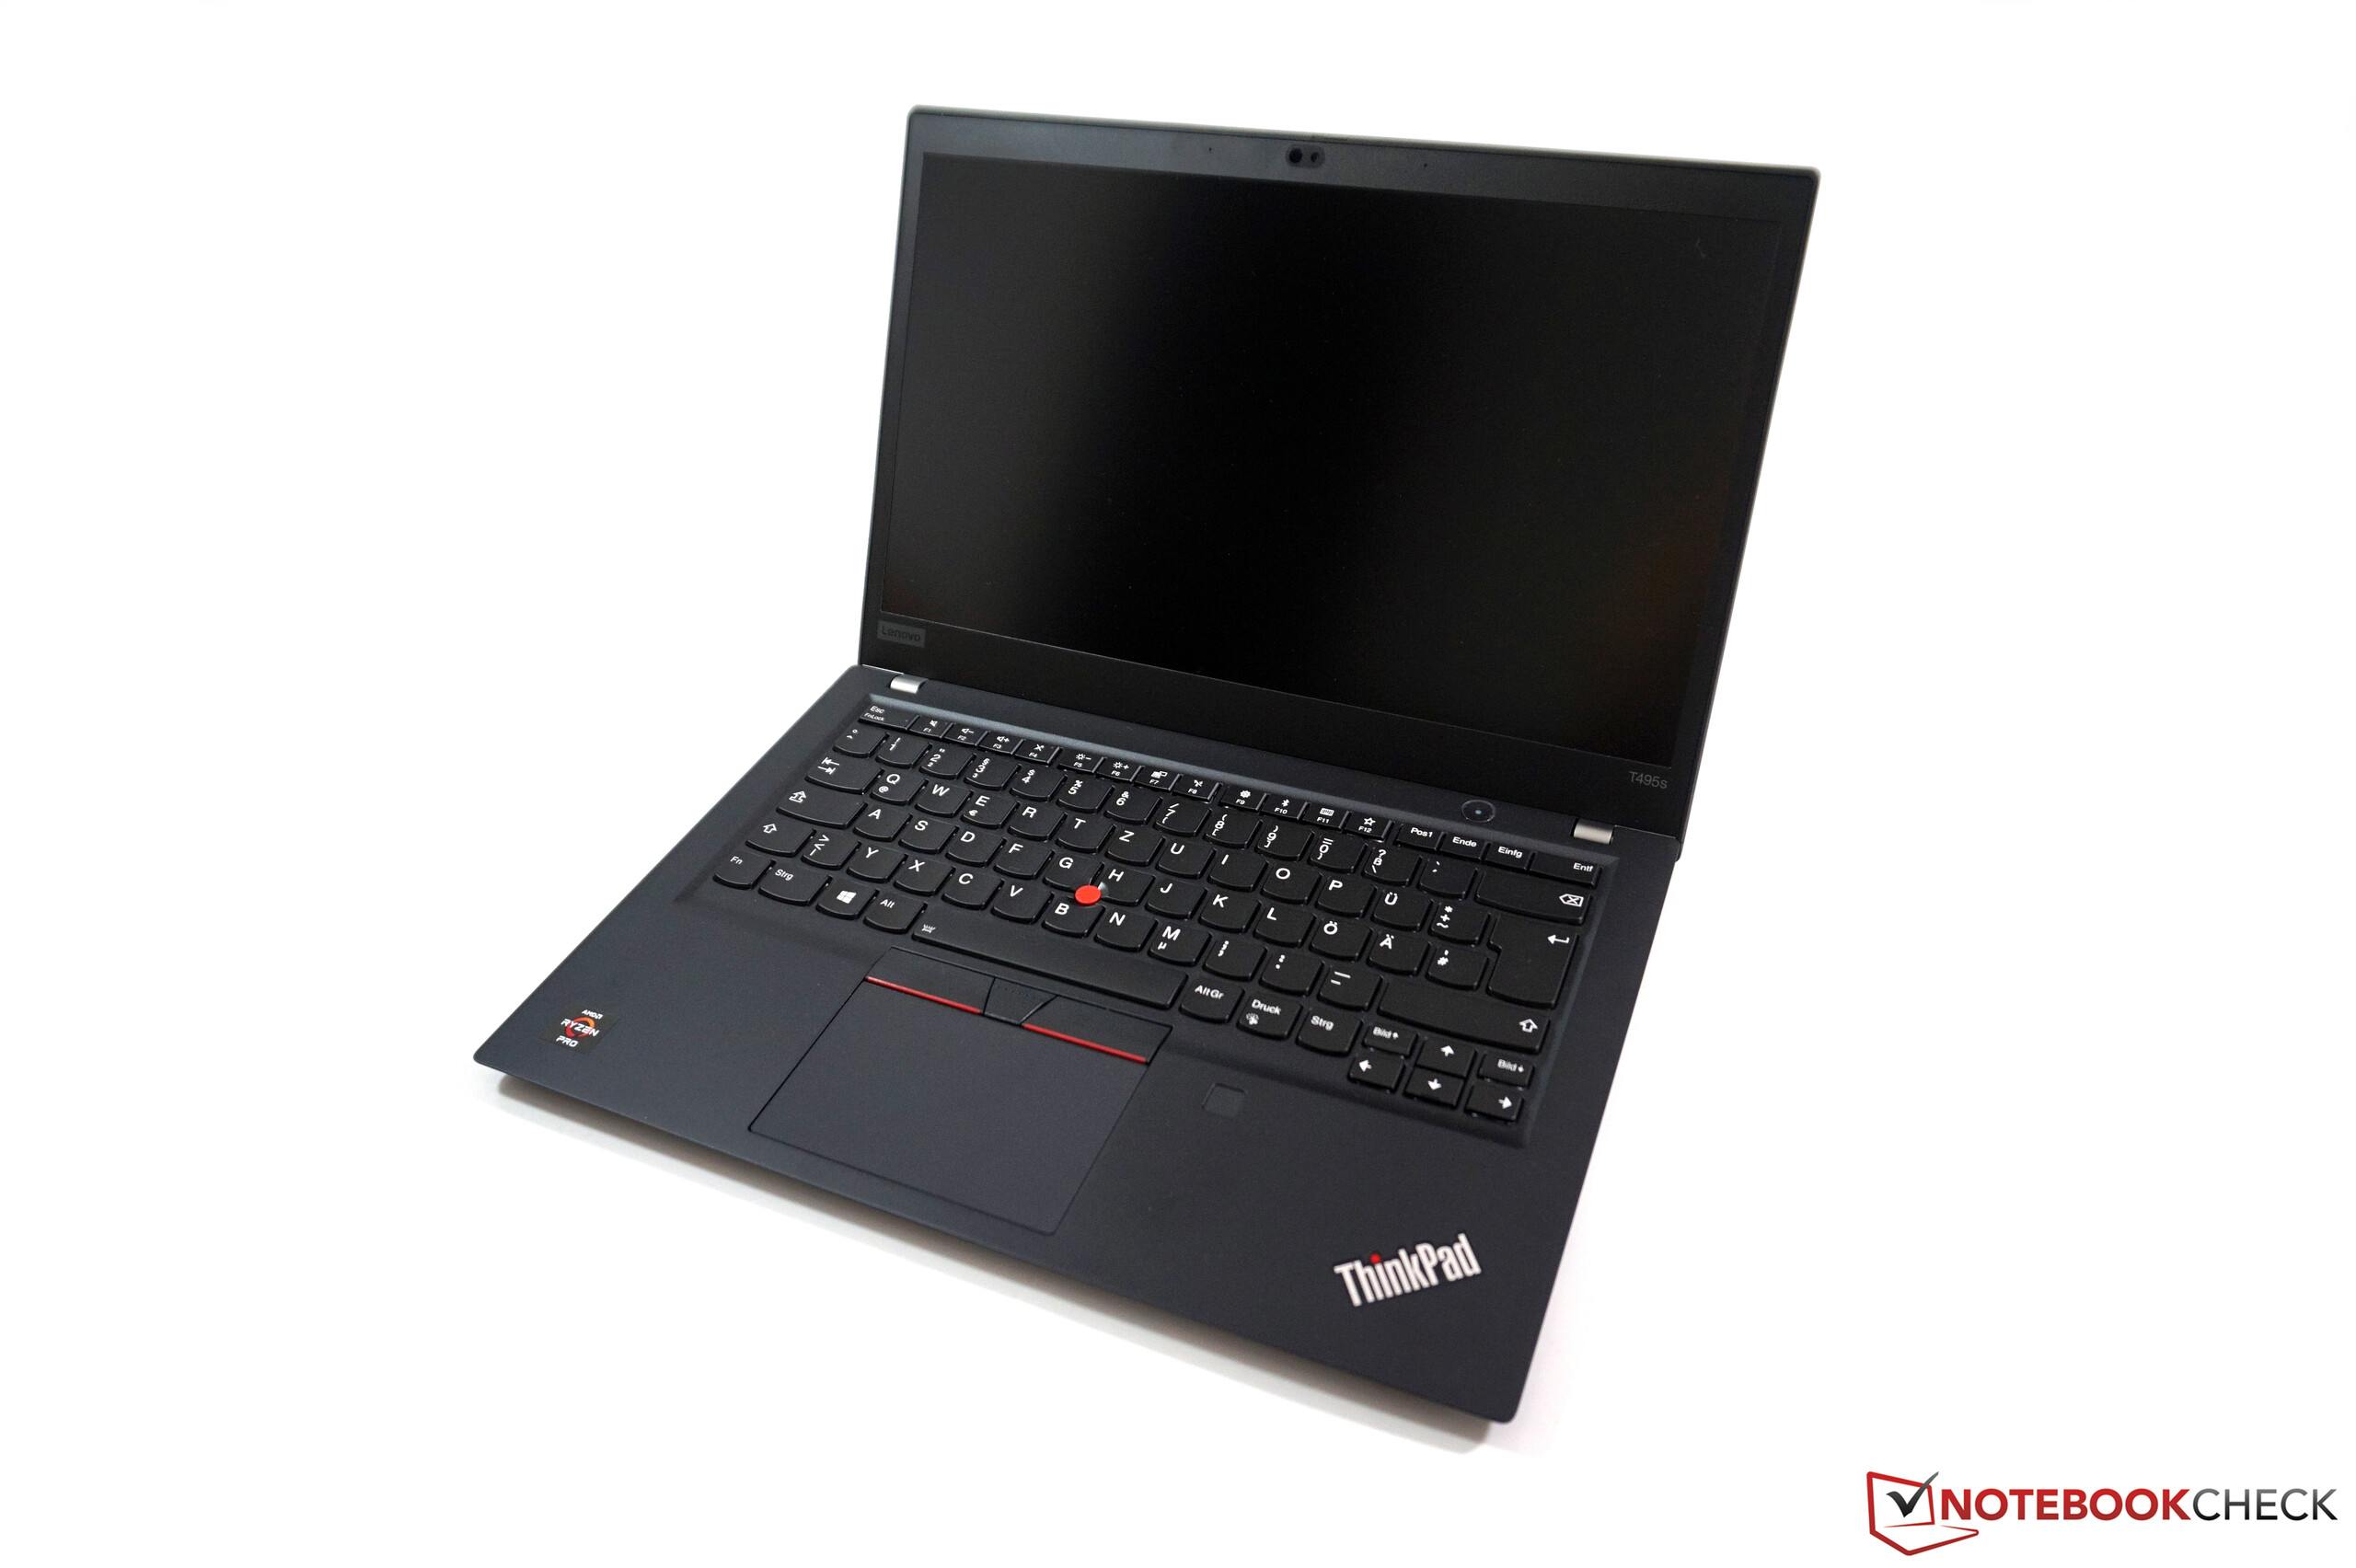
联想ThinkPad T495s笔记本电脑评测:配备AMD处理器的商务本,但风扇有点令人不爽
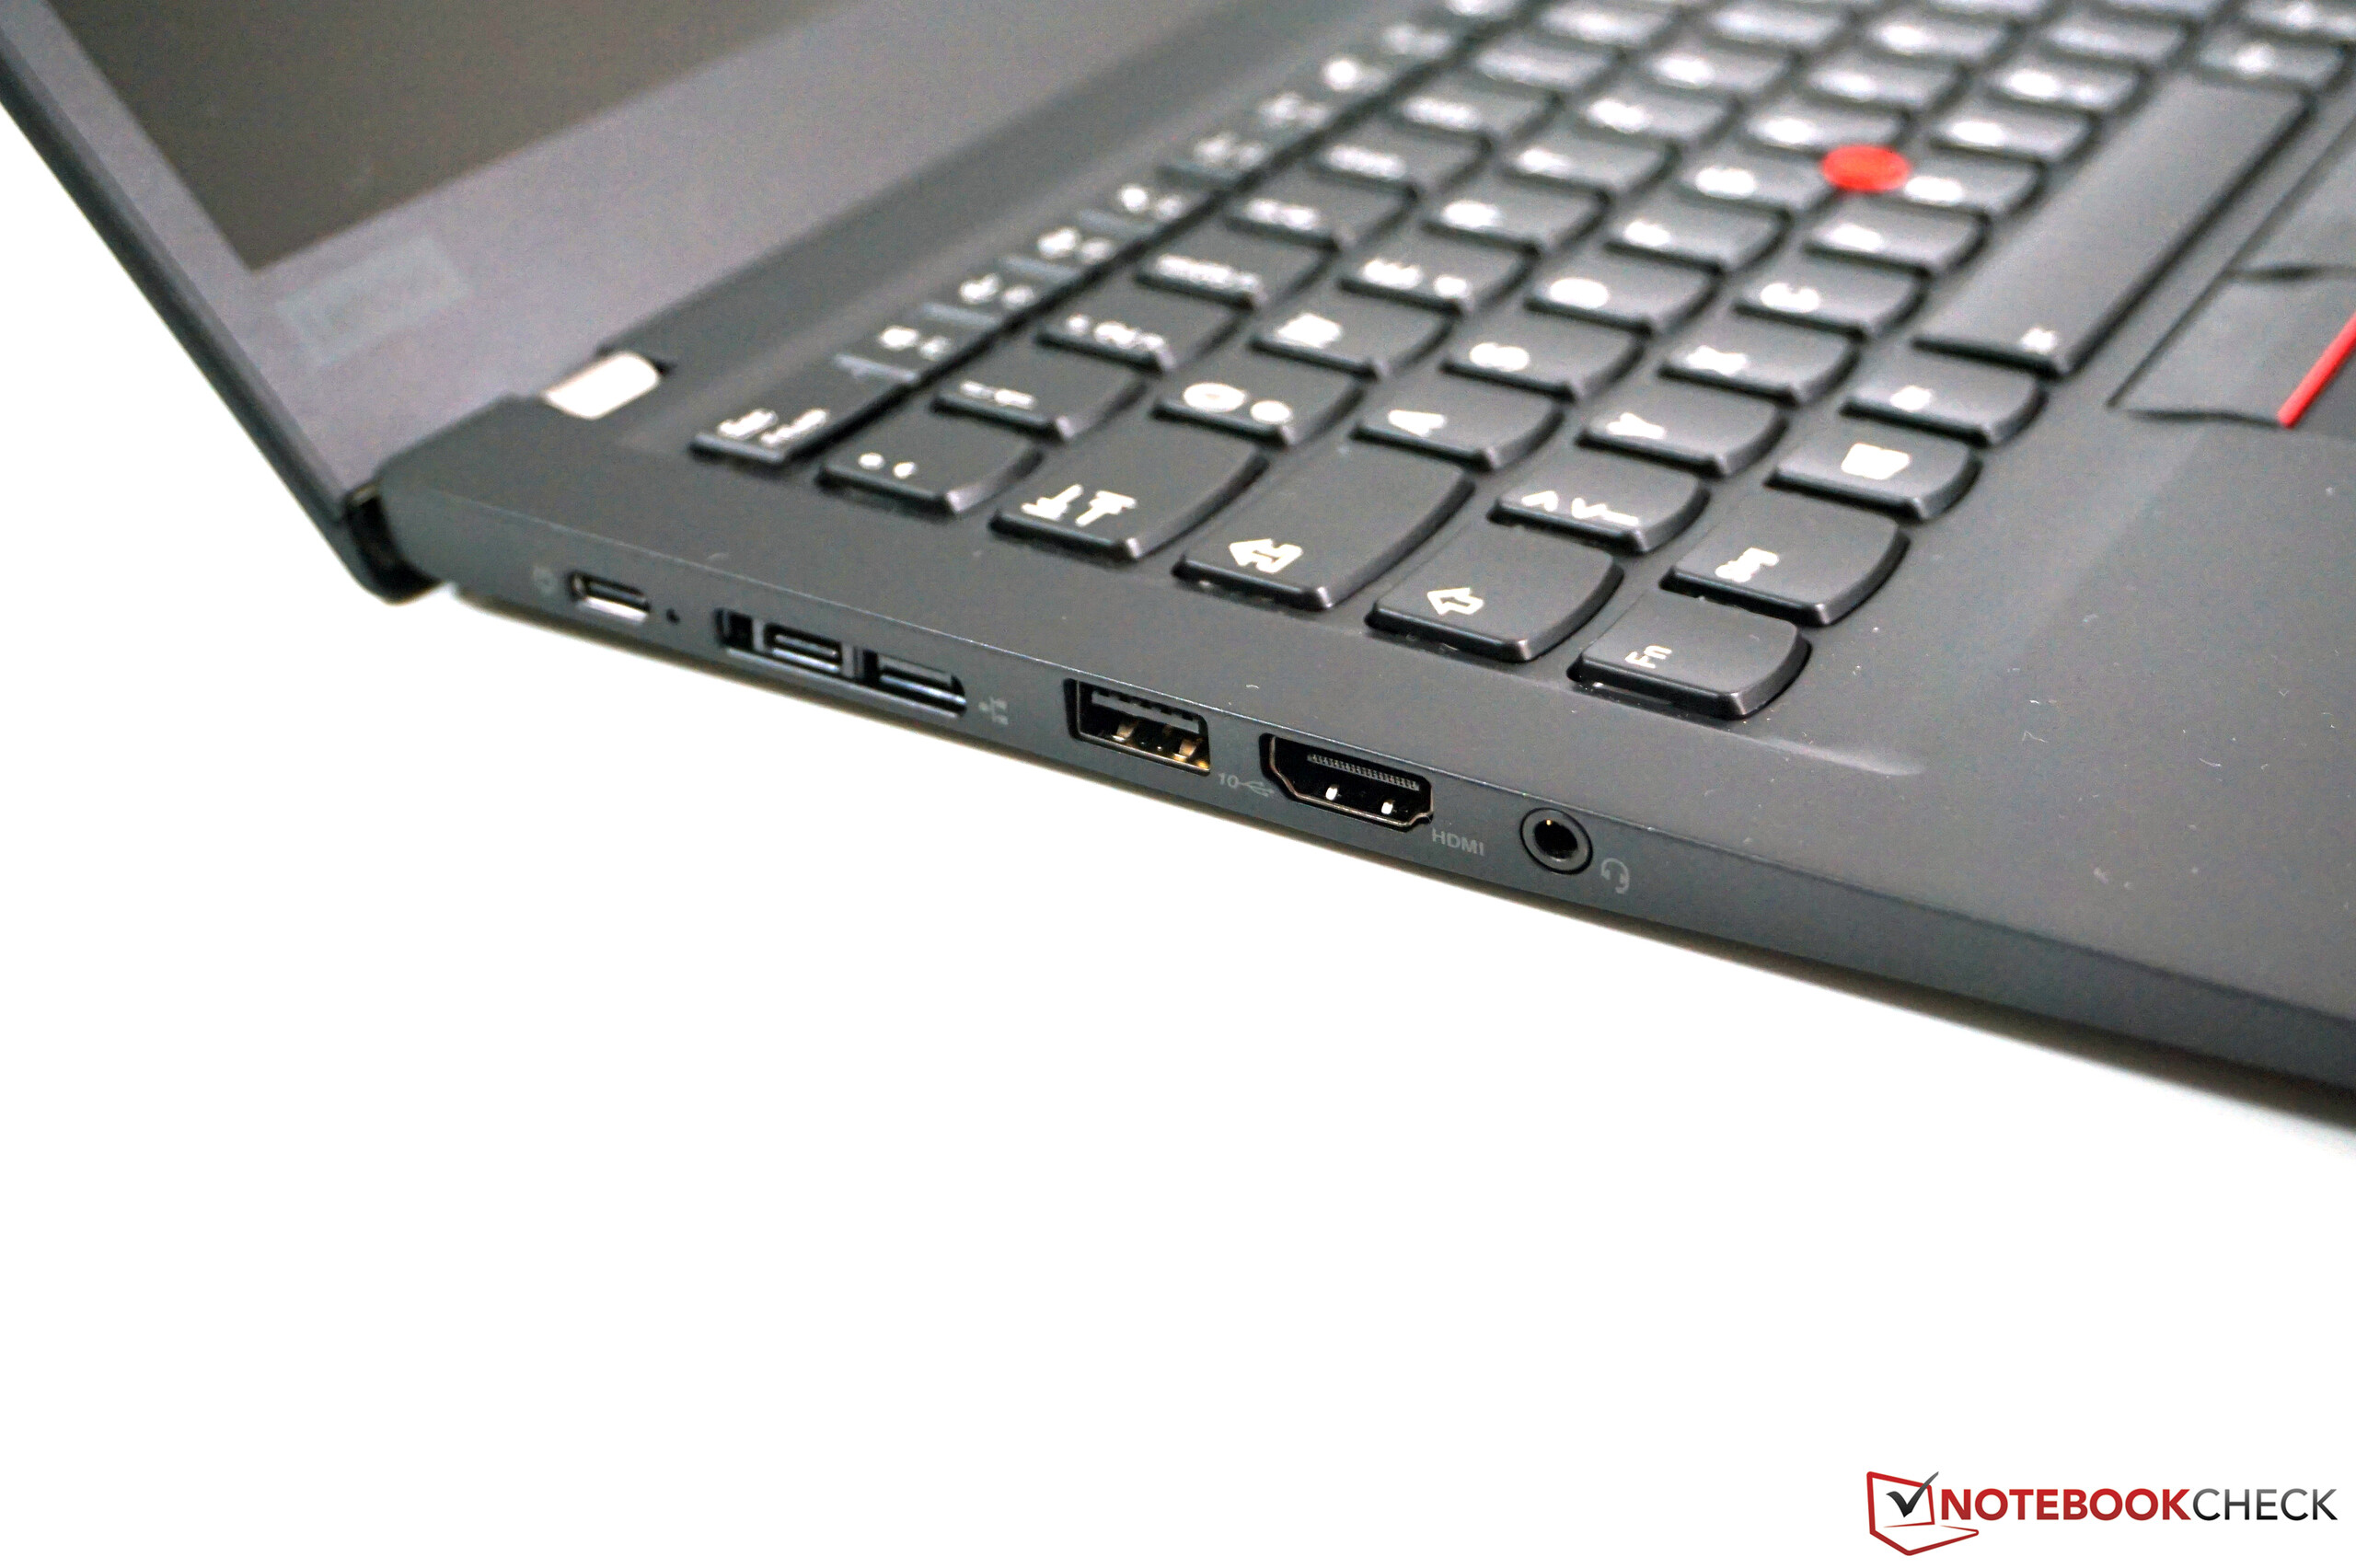
| SD Card Reader | |
| average JPG Copy Test (av. of 3 runs) | |
| Lenovo ThinkPad T495s-20QKS01E00 (Toshiba Exceria Pro M501 64 GB UHS-II) | |
| Lenovo ThinkPad T495-20NKS01Y00 (Toshiba Exceria Pro M501 64 GB UHS-II) | |
| Lenovo ThinkPad T480s-20L8S02E00 (Toshiba Exceria Pro SDXC 64 GB UHS-II) | |
| Lenovo ThinkPad T490s-20NYS02A00 (Toshiba Exceria Pro M501) | |
| Average of class Office (19.8 - 198.5, n=22, last 2 years) | |
| maximum AS SSD Seq Read Test (1GB) | |
| Lenovo ThinkPad T495-20NKS01Y00 (Toshiba Exceria Pro M501 64 GB UHS-II) | |
| Lenovo ThinkPad T495s-20QKS01E00 (Toshiba Exceria Pro M501 64 GB UHS-II) | |
| Lenovo ThinkPad T490s-20NYS02A00 (Toshiba Exceria Pro M501) | |
| Lenovo ThinkPad T480s-20L8S02E00 (Toshiba Exceria Pro SDXC 64 GB UHS-II) | |
| Average of class Office (27.4 - 249, n=21, last 2 years) | |
| |||||||||||||||||||||||||
Brightness Distribution: 87 %
Center on Battery: 380 cd/m²
Contrast: 1727:1 (Black: 0.22 cd/m²)
ΔE ColorChecker Calman: 4 | ∀{0.5-29.43 Ø4.72}
calibrated: 1.2
ΔE Greyscale Calman: 4.4 | ∀{0.09-98 Ø4.97}
96.6% sRGB (Argyll 1.6.3 3D)
62.2% AdobeRGB 1998 (Argyll 1.6.3 3D)
68.3% AdobeRGB 1998 (Argyll 3D)
96.8% sRGB (Argyll 3D)
67% Display P3 (Argyll 3D)
Gamma: 2.54
CCT: 6963 K
| Lenovo ThinkPad T495s-20QKS01E00 B140HAN05.7, , 1920x1080, 14" | Lenovo ThinkPad T495-20NKS01Y00 N140HCG-GQ2, , 1920x1080, 14" | Lenovo ThinkPad T490s-20NYS02A00 B140HAN05.7, , 1920x1080, 14" | Lenovo ThinkPad T490-20N3S02L00 NE140FHM-N61, , 1920x1080, 14" | Lenovo ThinkPad X1 Carbon 2019-20QES01L00 LP140WF9_SPF1, , 1920x1080, 14" | |
|---|---|---|---|---|---|
| Display | 1% | 0% | -1% | -3% | |
| Display P3 Coverage (%) | 67 | 67 0% | 67.1 0% | 69.3 3% | 64.5 -4% |
| sRGB Coverage (%) | 96.8 | 98.5 2% | 97.6 1% | 92.2 -5% | 95.8 -1% |
| AdobeRGB 1998 Coverage (%) | 68.3 | 69.2 1% | 68.5 0% | 67.4 -1% | 65.7 -4% |
| Response Times | 54% | -2% | -22% | 27% | |
| Response Time Grey 50% / Grey 80% * (ms) | 60.8 ? | 32.4 ? 47% | 61.6 ? -1% | 74 ? -22% | 44.8 ? 26% |
| Response Time Black / White * (ms) | 37.6 ? | 15.2 ? 60% | 38.8 ? -3% | 45.6 ? -21% | 27.6 ? 27% |
| PWM Frequency (Hz) | 26040 ? | 2451 ? | |||
| Screen | 8% | 4% | -16% | -9% | |
| Brightness middle (cd/m²) | 380 | 420 11% | 391 3% | 418 10% | 381 0% |
| Brightness (cd/m²) | 381 | 391 3% | 389 2% | 400 5% | 375 -2% |
| Brightness Distribution (%) | 87 | 88 1% | 87 0% | 88 1% | 94 8% |
| Black Level * (cd/m²) | 0.22 | 0.29 -32% | 0.23 -5% | 0.24 -9% | 0.24 -9% |
| Contrast (:1) | 1727 | 1448 -16% | 1700 -2% | 1742 1% | 1588 -8% |
| Colorchecker dE 2000 * | 4 | 2.1 47% | 3.4 15% | 4.7 -18% | 4.6 -15% |
| Colorchecker dE 2000 max. * | 5.7 | 5.5 4% | 4.7 18% | 8.7 -53% | 8.5 -49% |
| Colorchecker dE 2000 calibrated * | 1.2 | 0.7 42% | 1.1 8% | 2.1 -75% | 1.2 -0% |
| Greyscale dE 2000 * | 4.4 | 3.4 23% | 4 9% | 5.9 -34% | 5.1 -16% |
| Gamma | 2.54 87% | 2.22 99% | 2.49 88% | 2.06 107% | 2.52 87% |
| CCT | 6963 93% | 7168 91% | 6809 95% | 7350 88% | 7052 92% |
| Color Space (Percent of AdobeRGB 1998) (%) | 62.2 | 63.5 2% | 62.4 0% | 59.9 -4% | 60.7 -2% |
| Color Space (Percent of sRGB) (%) | 96.6 | 98.6 2% | 97.4 1% | 92.1 -5% | 95.7 -1% |
| Total Average (Program / Settings) | 21% /
12% | 1% /
3% | -13% /
-14% | 5% /
-3% |
* ... smaller is better
Display Response Times
| ↔ Response Time Black to White | ||
|---|---|---|
| 37.6 ms ... rise ↗ and fall ↘ combined | ↗ 19.6 ms rise | 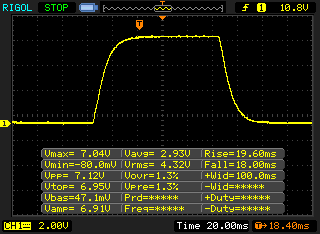 |
| ↘ 18 ms fall | ||
| The screen shows slow response rates in our tests and will be unsatisfactory for gamers. In comparison, all tested devices range from 0.1 (minimum) to 240 (maximum) ms. » 95 % of all devices are better. This means that the measured response time is worse than the average of all tested devices (19.8 ms). | ||
| ↔ Response Time 50% Grey to 80% Grey | ||
| 60.8 ms ... rise ↗ and fall ↘ combined | ↗ 30.8 ms rise | 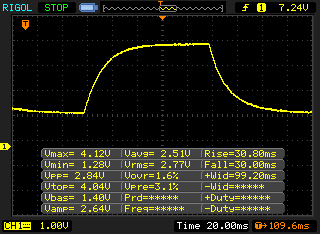 |
| ↘ 30 ms fall | ||
| The screen shows slow response rates in our tests and will be unsatisfactory for gamers. In comparison, all tested devices range from 0.165 (minimum) to 636 (maximum) ms. » 96 % of all devices are better. This means that the measured response time is worse than the average of all tested devices (31 ms). | ||
Screen Flickering / PWM (Pulse-Width Modulation)
| Screen flickering / PWM not detected | 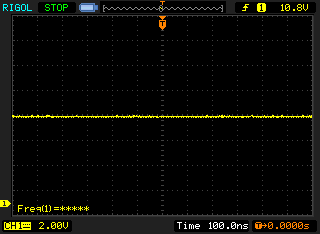 | ||
In comparison: 52 % of all tested devices do not use PWM to dim the display. If PWM was detected, an average of 7781 (minimum: 5 - maximum: 343500) Hz was measured. | |||


| PCMark 8 Home Score Accelerated v2 | 4161 points | |
| PCMark 8 Work Score Accelerated v2 | 5077 points | |
| PCMark 10 Score | 3762 points | |
Help | ||

| 3DMark 11 Performance | 3883 points | |
| 3DMark Cloud Gate Standard Score | 6532 points | |
| 3DMark Fire Strike Score | 2187 points | |
| 3DMark Time Spy Score | 827 points | |
Help | ||
| low | med. | high | ultra | |
|---|---|---|---|---|
| BioShock Infinite (2013) | 106.4 | 22 | ||
| Dota 2 Reborn (2015) | 73 | 63 | 36.5 | 33 |
| X-Plane 11.11 (2018) | 28.4 | 22 | 19.7 |
Noise level
| Idle |
| 28.9 / 28.9 / 28.9 dB(A) |
| Load |
| 31.5 / 33.8 dB(A) |
 | ||
30 dB silent 40 dB(A) audible 50 dB(A) loud |
||
min: | ||
| Lenovo ThinkPad T495s-20QKS01E00 Vega 10, R7 PRO 3700U, Samsung PM981a MZVLB1T0HBLR | Lenovo ThinkPad T495-20NKS01Y00 Vega 8, R5 PRO 3500U, Samsung SSD PM981 MZVLB512HAJQ | Lenovo ThinkPad T490s-20NYS02A00 UHD Graphics 620, i5-8265U, Intel SSD Pro 7600p SSDPEKKF512G8L | Lenovo ThinkPad X1 Carbon 2019-20QE000VGE UHD Graphics 620, i7-8665U, WDC PC SN720 SDAQNTW-512G | Lenovo ThinkPad T490-20N3S02L00 GeForce MX250, i7-8565U, Toshiba XG5 KXG50ZNV512G | |
|---|---|---|---|---|---|
| Noise | 3% | -3% | 2% | -5% | |
| off / environment * (dB) | 28.9 | 28.4 2% | 29.4 -2% | 28.4 2% | 29.4 -2% |
| Idle Minimum * (dB) | 28.9 | 28.4 2% | 29.4 -2% | 28.4 2% | 29.4 -2% |
| Idle Average * (dB) | 28.9 | 28.4 2% | 29.4 -2% | 28.4 2% | 29.4 -2% |
| Idle Maximum * (dB) | 28.9 | 29.4 -2% | 30.9 -7% | 28.6 1% | 29.4 -2% |
| Load Average * (dB) | 31.5 | 29.9 5% | 33.3 -6% | 31.5 -0% | 34.7 -10% |
| Load Maximum * (dB) | 33.8 | 31.4 7% | 33.3 1% | 33.1 2% | 37.2 -10% |
| Witcher 3 ultra * (dB) | 34.7 |
* ... smaller is better
(±) The maximum temperature on the upper side is 44.4 °C / 112 F, compared to the average of 34.3 °C / 94 F, ranging from 21.2 to 62.5 °C for the class Office.
(±) The bottom heats up to a maximum of 44 °C / 111 F, compared to the average of 36.8 °C / 98 F
(+) In idle usage, the average temperature for the upper side is 25.7 °C / 78 F, compared to the device average of 29.5 °C / 85 F.
(+) The palmrests and touchpad are cooler than skin temperature with a maximum of 30.4 °C / 86.7 F and are therefore cool to the touch.
(-) The average temperature of the palmrest area of similar devices was 27.5 °C / 81.5 F (-2.9 °C / -5.2 F).
Lenovo ThinkPad T495s-20QKS01E00 audio analysis
(-) | not very loud speakers (70.6 dB)
Bass 100 - 315 Hz
(±) | reduced bass - on average 14.2% lower than median
(±) | linearity of bass is average (12.8% delta to prev. frequency)
Mids 400 - 2000 Hz
(±) | higher mids - on average 6.3% higher than median
(±) | linearity of mids is average (9.2% delta to prev. frequency)
Highs 2 - 16 kHz
(+) | balanced highs - only 3.6% away from median
(±) | linearity of highs is average (12.4% delta to prev. frequency)
Overall 100 - 16.000 Hz
(±) | linearity of overall sound is average (25% difference to median)
Compared to same class
» 74% of all tested devices in this class were better, 7% similar, 19% worse
» The best had a delta of 7%, average was 21%, worst was 53%
Compared to all devices tested
» 76% of all tested devices were better, 5% similar, 19% worse
» The best had a delta of 4%, average was 24%, worst was 134%
Lenovo ThinkPad T490-20N3S02L00 audio analysis
(-) | not very loud speakers (70.9 dB)
Bass 100 - 315 Hz
(-) | nearly no bass - on average 20.8% lower than median
(±) | linearity of bass is average (8.7% delta to prev. frequency)
Mids 400 - 2000 Hz
(±) | higher mids - on average 5.5% higher than median
(±) | linearity of mids is average (8.8% delta to prev. frequency)
Highs 2 - 16 kHz
(+) | balanced highs - only 3.4% away from median
(±) | linearity of highs is average (7.3% delta to prev. frequency)
Overall 100 - 16.000 Hz
(±) | linearity of overall sound is average (28.9% difference to median)
Compared to same class
» 90% of all tested devices in this class were better, 2% similar, 8% worse
» The best had a delta of 7%, average was 21%, worst was 53%
Compared to all devices tested
» 87% of all tested devices were better, 2% similar, 11% worse
» The best had a delta of 4%, average was 24%, worst was 134%
| Off / Standby | |
| Idle | |
| Load |
|
Key:
min: | |
| Lenovo ThinkPad T495s-20QKS01E00 R7 PRO 3700U, Vega 10, Samsung PM981a MZVLB1T0HBLR, IPS, 1920x1080, 14" | Lenovo ThinkPad T490s-20NYS02A00 i5-8265U, UHD Graphics 620, Intel SSD Pro 7600p SSDPEKKF512G8L, IPS, 1920x1080, 14" | Lenovo ThinkPad T495-20NKS01Y00 R5 PRO 3500U, Vega 8, Samsung SSD PM981 MZVLB512HAJQ, IPS, 1920x1080, 14" | Lenovo ThinkPad X1 Carbon 2019-20QE000VGE i7-8665U, UHD Graphics 620, WDC PC SN720 SDAQNTW-512G, IPS, 2560x1440, 14" | Lenovo ThinkPad T480s-20L8S02E00 i5-8550U, GeForce MX150, Samsung SSD PM981 MZVLB512HAJQ, IPS LED, 2560x1440, 14" | |
|---|---|---|---|---|---|
| Power Consumption | 11% | -1% | 3% | -15% | |
| Idle Minimum * (Watt) | 4.7 | 2.62 44% | 5.1 -9% | 3 36% | 3.4 28% |
| Idle Average * (Watt) | 7.28 | 5.16 29% | 7.7 -6% | 6.3 13% | 7.5 -3% |
| Idle Maximum * (Watt) | 9.48 | 8.7 8% | 10.7 -13% | 8.9 6% | 10.8 -14% |
| Load Average * (Watt) | 35.3 | 40 -13% | 35.8 -1% | 40.8 -16% | 55.4 -57% |
| Load Maximum * (Watt) | 55.5 | 64 -15% | 43.2 22% | 67.5 -22% | 70.3 -27% |
| Witcher 3 ultra * (Watt) | 34 |
* ... smaller is better
| Lenovo ThinkPad T495s-20QKS01E00 R7 PRO 3700U, Vega 10, 57 Wh | Lenovo ThinkPad T490s-20NYS02A00 i5-8265U, UHD Graphics 620, 57 Wh | Lenovo ThinkPad T495-20NKS01Y00 R5 PRO 3500U, Vega 8, 50 Wh | Lenovo ThinkPad T480s-20L8S02E00 i5-8550U, GeForce MX150, 57 Wh | Lenovo ThinkPad X1 Carbon 2019-20QES01L00 i7-8565U, UHD Graphics 620, 51 Wh | Average of class Office | |
|---|---|---|---|---|---|---|
| Battery runtime | 0% | -13% | -24% | -13% | 17% | |
| H.264 (h) | 12.5 | 13.9 11% | 11.8 -6% | 9.2 -26% | 11.5 -8% | 15 ? 20% |
| WiFi v1.3 (h) | 11.3 | 10.1 -11% | 9.1 -19% | 8.8 -22% | 9.4 -17% | 12.9 ? 14% |
Pros
Cons
Verdict – The AMD ThinkPad offers a better price-performance ratio

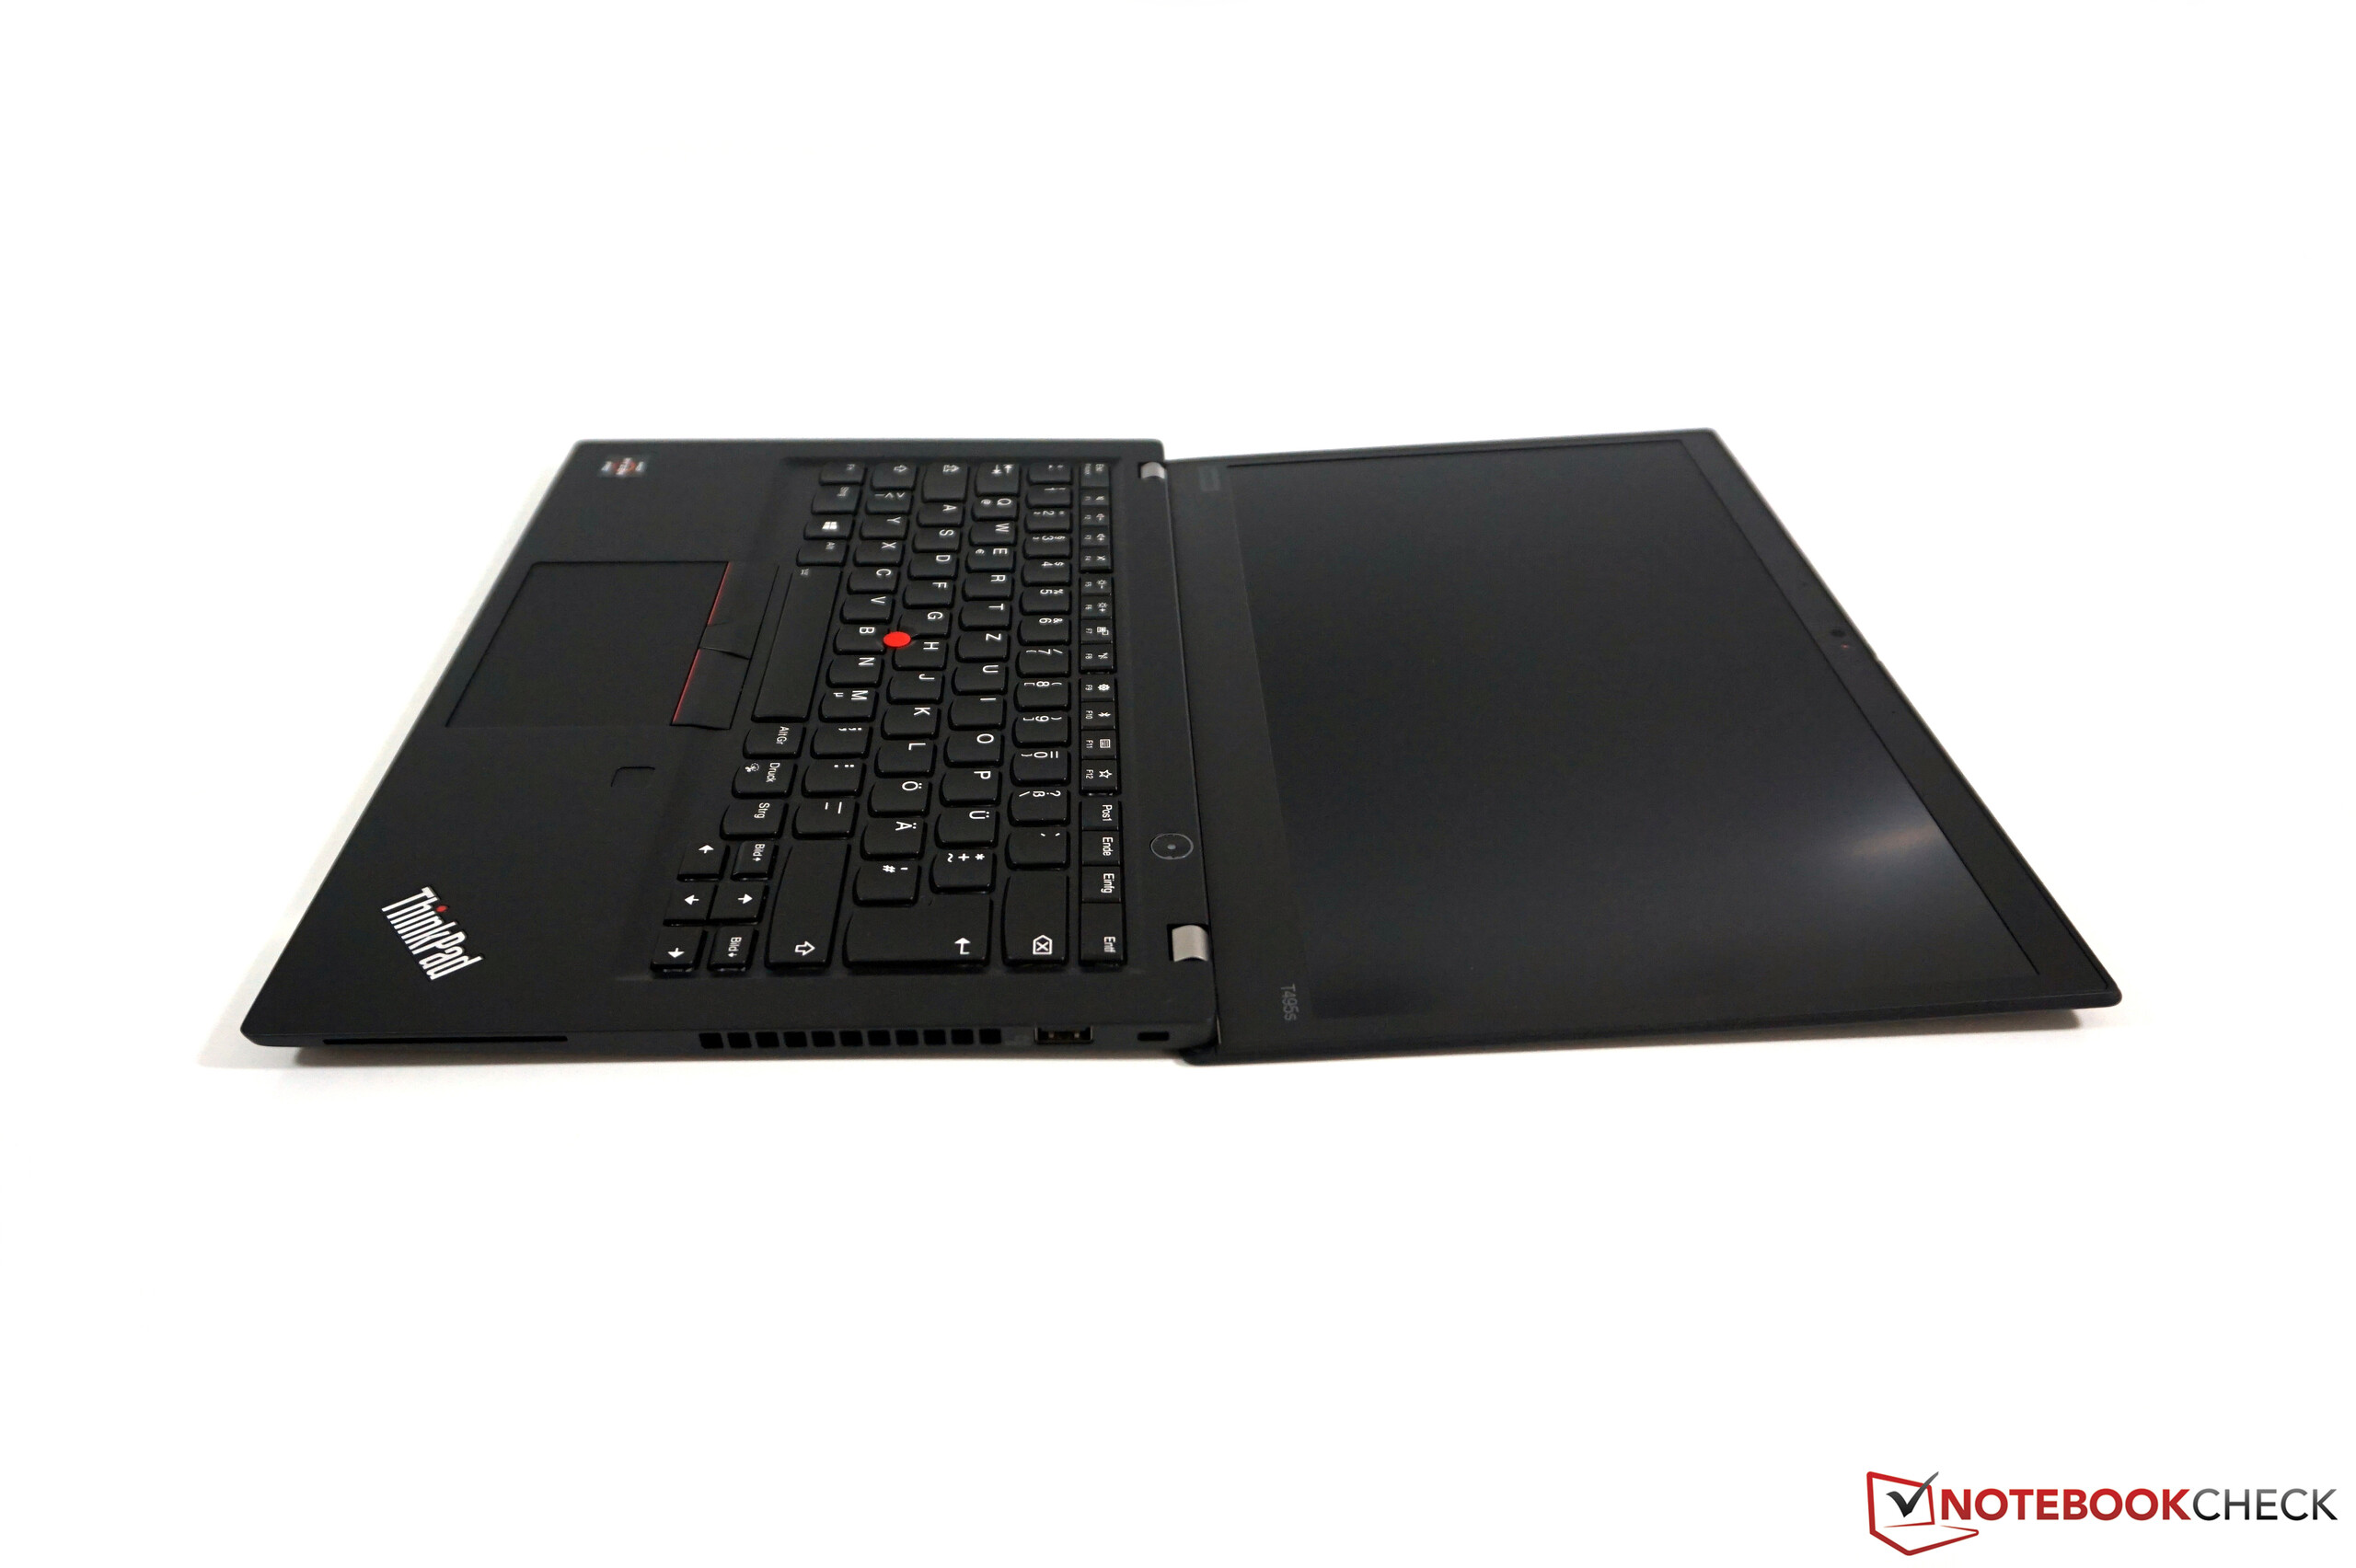
联想用ThinkPad T495s提供了继ThinkPad T495. 之后的又一款出色的办公笔记本。虽然由于散热系统薄弱,无法利用Ryzen 7 Pro处理器的全部性能,但配备Intel处理器的T490s也是一样。两种系统都能为办公中的大多数任务提供足够的性能。续航时间也特别强,因此AMD ThinkPad不再存在缺点。无论如何,两种型号的机身和键盘都是相同的。
但是,有一个很大的缺点,因为风扇产生的高频噪声与T490s的风扇相比非常令人讨厌。即使联想可以在性能要求较低的任务中经常关闭风扇,而轻松避免此问题。另一方面,缺少Thunderbolt-3连接对于许多用户而言并不构成问题。
“凭借ThinkPad T495s,联想提供了一个非常出色的,而且价格实惠的替代品,可替代基于Intel的ThinkPad T490s。如果不是因为高频的风扇噪音问题,那么T495s将收到我们的无条件推荐。”
但是,也有价格,在这方面,AMD ThinkPad显然遥遥领先。有至少300欧元(〜330美元)的价格优势,而且我们这里提供的Campus版本只要1299欧元(〜1429美元),性价比非常强。
注意:由于我们评级系统的v7更新,ThinkPad T490s的评级从92%降低至89%。 ThinkPad T495s仅得到88%分主要归因于高频风扇。
Lenovo ThinkPad T495s-20QKS01E00
- 09/24/2019 v7 (old)
Andreas Osthoff
Price comparison

