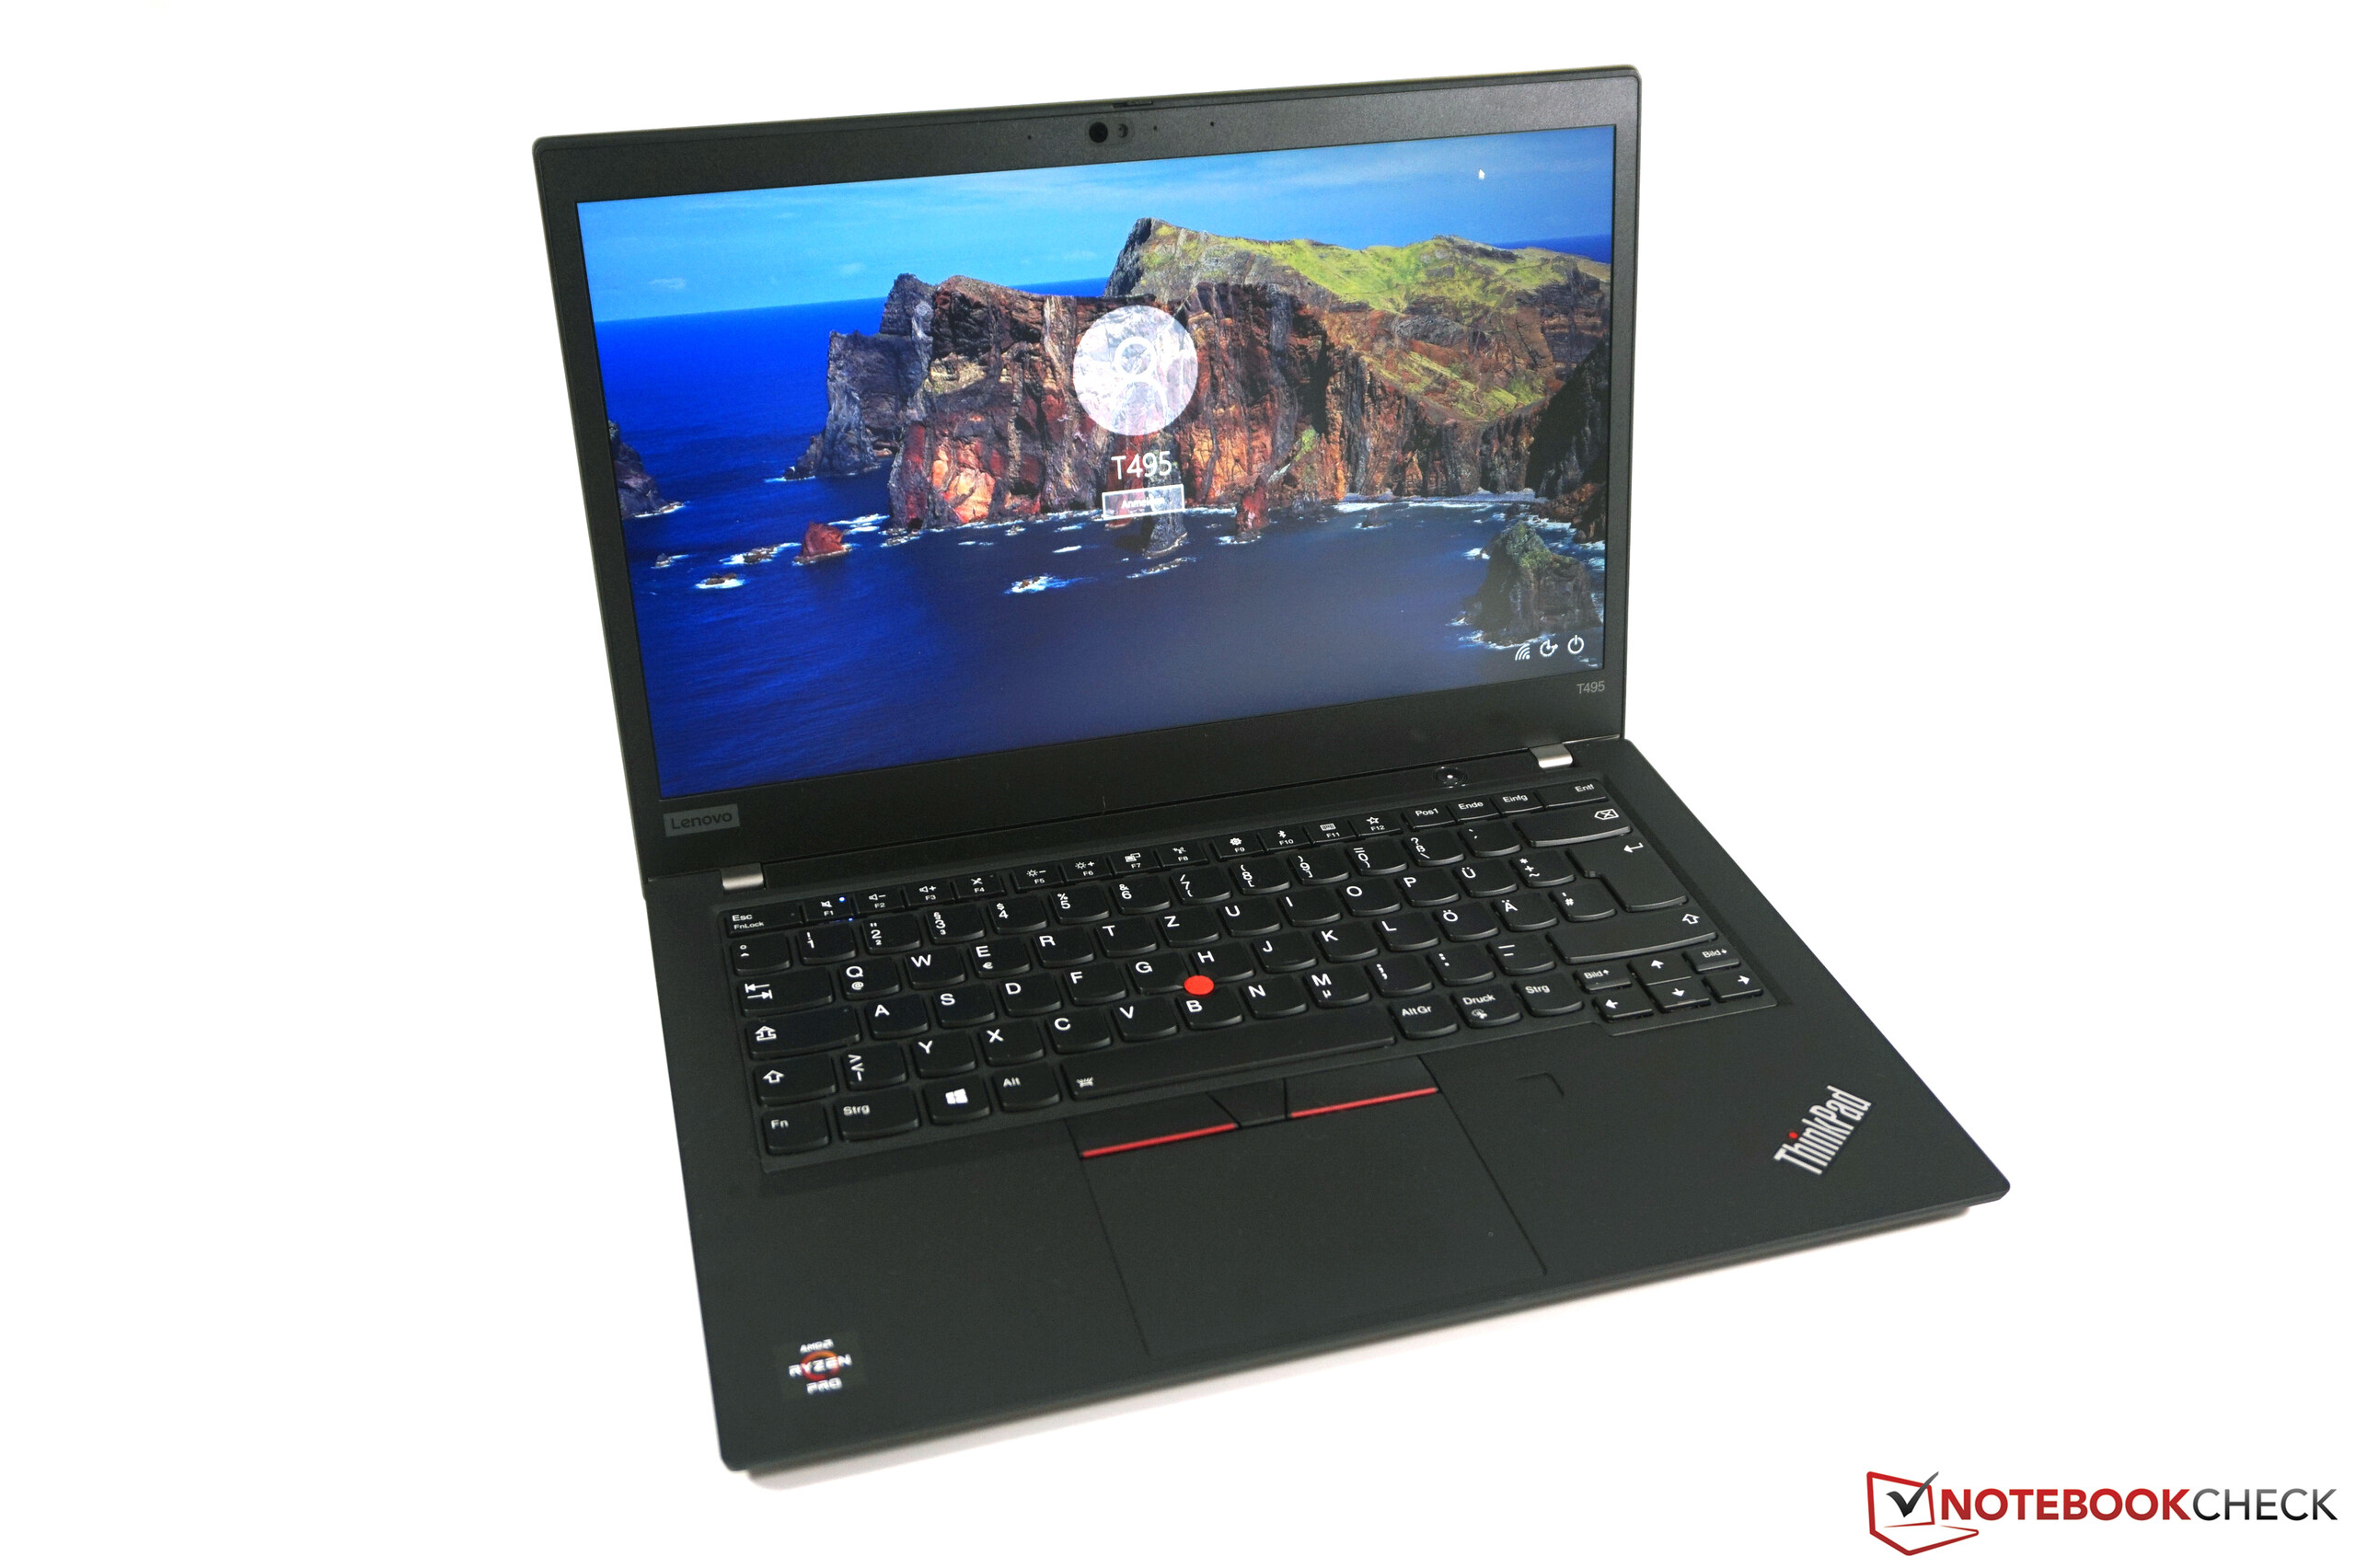
联想ThinkPad T495笔记本电脑评测:配备AMD处理器的商务本,屏幕续航双升级
| SD Card Reader | |
| average JPG Copy Test (av. of 3 runs) | |
| Dell Latitude 7490 (Toshiba Exceria Pro M501 UHS-II) | |
| Lenovo ThinkPad T495-20NKS01Y00 (Toshiba Exceria Pro M501 64 GB UHS-II) | |
| Lenovo ThinkPad T490-20N3S02L00 (Toshiba Exceria Pro M501) | |
| Lenovo ThinkPad T490s-20NYS02A00 (Toshiba Exceria Pro M501) | |
| Average of class Office (19.8 - 198.5, n=22, last 2 years) | |
| maximum AS SSD Seq Read Test (1GB) | |
| Dell Latitude 7490 (Toshiba Exceria Pro M501 UHS-II) | |
| Lenovo ThinkPad T495-20NKS01Y00 (Toshiba Exceria Pro M501 64 GB UHS-II) | |
| Lenovo ThinkPad T490s-20NYS02A00 (Toshiba Exceria Pro M501) | |
| Lenovo ThinkPad T490-20N3S02L00 (Toshiba Exceria Pro M501) | |
| Average of class Office (27.4 - 249, n=21, last 2 years) | |
| Networking | |
| iperf3 transmit AX12 | |
| Lenovo ThinkPad T490-20N3S02L00 | |
| Lenovo ThinkPad T495-20NKS01Y00 | |
| HP EliteBook 745 G5 3UN74EA | |
| Lenovo ThinkPad A485-20MU000CGE | |
| Dell Latitude 7490 | |
| iperf3 receive AX12 | |
| Lenovo ThinkPad T490-20N3S02L00 | |
| Dell Latitude 7490 | |
| Lenovo ThinkPad T495-20NKS01Y00 | |
| Lenovo ThinkPad A485-20MU000CGE | |
| HP EliteBook 745 G5 3UN74EA | |
| |||||||||||||||||||||||||
Brightness Distribution: 88 %
Center on Battery: 423 cd/m²
Contrast: 1448:1 (Black: 0.29 cd/m²)
ΔE ColorChecker Calman: 2.1 | ∀{0.5-29.43 Ø4.71}
calibrated: 0.7
ΔE Greyscale Calman: 3.4 | ∀{0.09-98 Ø4.96}
98.6% sRGB (Argyll 1.6.3 3D)
63.5% AdobeRGB 1998 (Argyll 1.6.3 3D)
69.2% AdobeRGB 1998 (Argyll 3D)
98.5% sRGB (Argyll 3D)
67% Display P3 (Argyll 3D)
Gamma: 2.22
CCT: 7168 K
| Lenovo ThinkPad T495-20NKS01Y00 N140HCG-GQ2, , 1920x1080, 14" | Lenovo ThinkPad T490-20N3S02L00 NE140FHM-N61, , 1920x1080, 14" | Lenovo ThinkPad T490s-20NYS02A00 B140HAN05.7, , 1920x1080, 14" | Lenovo ThinkPad X1 Carbon 2019-20QES01L00 LP140WF9_SPF1, , 1920x1080, 14" | |
|---|---|---|---|---|
| Display | -2% | -1% | -4% | |
| Display P3 Coverage (%) | 67 | 69.3 3% | 67.1 0% | 64.5 -4% |
| sRGB Coverage (%) | 98.5 | 92.2 -6% | 97.6 -1% | 95.8 -3% |
| AdobeRGB 1998 Coverage (%) | 69.2 | 67.4 -3% | 68.5 -1% | 65.7 -5% |
| Response Times | -164% | -123% | -60% | |
| Response Time Grey 50% / Grey 80% * (ms) | 32.4 ? | 74 ? -128% | 61.6 ? -90% | 44.8 ? -38% |
| Response Time Black / White * (ms) | 15.2 ? | 45.6 ? -200% | 38.8 ? -155% | 27.6 ? -82% |
| PWM Frequency (Hz) | 26040 ? | 2451 ? | ||
| Screen | -39% | -9% | -26% | |
| Brightness middle (cd/m²) | 420 | 418 0% | 391 -7% | 381 -9% |
| Brightness (cd/m²) | 391 | 400 2% | 389 -1% | 375 -4% |
| Brightness Distribution (%) | 88 | 88 0% | 87 -1% | 94 7% |
| Black Level * (cd/m²) | 0.29 | 0.24 17% | 0.23 21% | 0.24 17% |
| Contrast (:1) | 1448 | 1742 20% | 1700 17% | 1588 10% |
| Colorchecker dE 2000 * | 2.1 | 4.7 -124% | 3.4 -62% | 4.6 -119% |
| Colorchecker dE 2000 max. * | 5.5 | 8.7 -58% | 4.7 15% | 8.5 -55% |
| Colorchecker dE 2000 calibrated * | 0.7 | 2.1 -200% | 1.1 -57% | 1.2 -71% |
| Greyscale dE 2000 * | 3.4 | 5.9 -74% | 4 -18% | 5.1 -50% |
| Gamma | 2.22 99% | 2.06 107% | 2.49 88% | 2.52 87% |
| CCT | 7168 91% | 7350 88% | 6809 95% | 7052 92% |
| Color Space (Percent of AdobeRGB 1998) (%) | 63.5 | 59.9 -6% | 62.4 -2% | 60.7 -4% |
| Color Space (Percent of sRGB) (%) | 98.6 | 92.1 -7% | 97.4 -1% | 95.7 -3% |
| Total Average (Program / Settings) | -68% /
-48% | -44% /
-21% | -30% /
-26% |
* ... smaller is better
Display Response Times
| ↔ Response Time Black to White | ||
|---|---|---|
| 15.2 ms ... rise ↗ and fall ↘ combined | ↗ 6.8 ms rise | 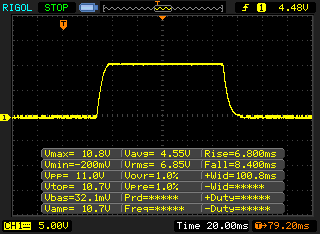 |
| ↘ 8.4 ms fall | ||
| The screen shows good response rates in our tests, but may be too slow for competitive gamers. In comparison, all tested devices range from 0.1 (minimum) to 240 (maximum) ms. » 37 % of all devices are better. This means that the measured response time is better than the average of all tested devices (19.8 ms). | ||
| ↔ Response Time 50% Grey to 80% Grey | ||
| 32.4 ms ... rise ↗ and fall ↘ combined | ↗ 16.4 ms rise | 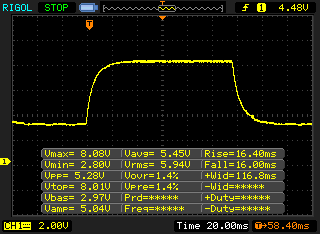 |
| ↘ 16 ms fall | ||
| The screen shows slow response rates in our tests and will be unsatisfactory for gamers. In comparison, all tested devices range from 0.165 (minimum) to 636 (maximum) ms. » 44 % of all devices are better. This means that the measured response time is similar to the average of all tested devices (31 ms). | ||
Screen Flickering / PWM (Pulse-Width Modulation)
| Screen flickering / PWM detected | 26040 Hz | ≤ 50 % brightness setting | 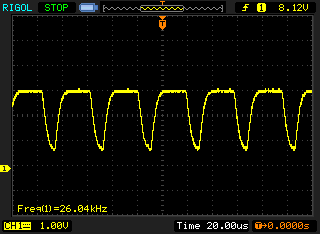 |
The display backlight flickers at 26040 Hz (worst case, e.g., utilizing PWM) Flickering detected at a brightness setting of 50 % and below. There should be no flickering or PWM above this brightness setting. The frequency of 26040 Hz is quite high, so most users sensitive to PWM should not notice any flickering. In comparison: 52 % of all tested devices do not use PWM to dim the display. If PWM was detected, an average of 7754 (minimum: 5 - maximum: 343500) Hz was measured. | |||
| Cinebench R15 | |
| CPU Single 64Bit | |
| Average of class Office (99.5 - 316, n=77, last 2 years) | |
| Lenovo ThinkPad T490-20N3S02L00 | |
| Lenovo ThinkPad T490-20N2004EGE | |
| Lenovo ThinkPad T490s-20NYS02A00 | |
| Dell Latitude 7490 | |
| Lenovo ThinkPad T495-20NKS01Y00 | |
| HP EliteBook 745 G5 3UN74EA | |
| Average AMD Ryzen 5 PRO 3500U (140 - 144, n=2) | |
| Lenovo ThinkPad E495-20NE000JGE | |
| Lenovo ThinkPad A485-20MU000CGE | |
| CPU Multi 64Bit | |
| Average of class Office (250 - 3380, n=77, last 2 years) | |
| Lenovo ThinkPad T490s-20NYS02A00 | |
| Lenovo ThinkPad T490-20N3S02L00 | |
| Lenovo ThinkPad E495-20NE000JGE | |
| HP EliteBook 745 G5 3UN74EA | |
| Average AMD Ryzen 5 PRO 3500U (611 - 637, n=2) | |
| Lenovo ThinkPad T490-20N2004EGE | |
| Lenovo ThinkPad T495-20NKS01Y00 | |
| Dell Latitude 7490 | |
| Lenovo ThinkPad A485-20MU000CGE | |
| PCMark 8 | |
| Home Score Accelerated v2 | |
| Average of class Office (n=1last 2 years) | |
| Lenovo ThinkPad T495-20NKS01Y00 | |
| Lenovo ThinkPad T490-20N3S02L00 | |
| Dell Latitude 7490 | |
| Average AMD Ryzen 5 PRO 3500U, AMD Radeon RX Vega 8 (Ryzen 2000/3000) (3311 - 4072, n=2) | |
| Lenovo ThinkPad T490-20N2004EGE | |
| HP EliteBook 745 G5 3UN74EA | |
| Lenovo ThinkPad A485-20MU000CGE | |
| Creative Score Accelerated v2 | |
| Lenovo ThinkPad T490-20N3S02L00 | |
| Lenovo ThinkPad T495-20NKS01Y00 | |
| Average AMD Ryzen 5 PRO 3500U, AMD Radeon RX Vega 8 (Ryzen 2000/3000) (n=1) | |
| Work Score Accelerated v2 | |
| Average of class Office (n=1last 2 years) | |
| Lenovo ThinkPad T490-20N3S02L00 | |
| Dell Latitude 7490 | |
| Lenovo ThinkPad T495-20NKS01Y00 | |
| Lenovo ThinkPad T490-20N2004EGE | |
| Average AMD Ryzen 5 PRO 3500U, AMD Radeon RX Vega 8 (Ryzen 2000/3000) (4558 - 4880, n=2) | |
| HP EliteBook 745 G5 3UN74EA | |
| Lenovo ThinkPad A485-20MU000CGE | |
| PCMark 8 Home Score Accelerated v2 | 4072 points | |
| PCMark 8 Creative Score Accelerated v2 | 4947 points | |
| PCMark 8 Work Score Accelerated v2 | 4880 points | |
| PCMark 10 Score | 3818 points | |
Help | ||
| Lenovo ThinkPad T495-20NKS01Y00 Samsung SSD PM981 MZVLB512HAJQ | Lenovo ThinkPad T490-20N3S02L00 Toshiba XG5 KXG50ZNV512G | Lenovo ThinkPad A485-20MU000CGE Samsung SSD PM981 MZVLB256HAHQ | Dell Latitude 7490 Toshiba KSG60ZMV256G | HP EliteBook 745 G5 3UN74EA Toshiba XG5 KXG50ZNV256G | |
|---|---|---|---|---|---|
| CrystalDiskMark 5.2 / 6 | -12% | -33% | -61% | -34% | |
| Write 4K (MB/s) | 137.7 | 126.6 -8% | 114.8 -17% | 79.4 -42% | 119.5 -13% |
| Read 4K (MB/s) | 44.11 | 43.61 -1% | 41.33 -6% | 27.37 -38% | 31.9 -28% |
| Write Seq (MB/s) | 2714 | 1342 -51% | 1271 -53% | 343.9 -87% | 351.1 -87% |
| Read Seq (MB/s) | 2665 | 1251 -53% | 1171 -56% | 472.7 -82% | 1665 -38% |
| Write 4K Q32T1 (MB/s) | 251.2 | 297.7 19% | 218.4 -13% | 206 -18% | 268.4 7% |
| Read 4K Q32T1 (MB/s) | 336.6 | 376.4 12% | 308.5 -8% | 188.3 -44% | 333.1 -1% |
| Write Seq Q32T1 (MB/s) | 2994 | 2969 -1% | 1460 -51% | 343.3 -89% | 351.8 -88% |
| Read Seq Q32T1 (MB/s) | 3547 | 3228 -9% | 1529 -57% | 533 -85% | 2705 -24% |
| Write 4K Q8T8 (MB/s) | 1246 | 1208 | 356 | ||
| Read 4K Q8T8 (MB/s) | 1397 | 983 | 453.2 | ||
| AS SSD | 5% | -51% | -74% | -79% | |
| Seq Read (MB/s) | 2661 | 2571 -3% | 1224 -54% | 486.2 -82% | 1682 -37% |
| Seq Write (MB/s) | 2330 | 2294 -2% | 1118 -52% | 294.9 -87% | 189 -92% |
| 4K Read (MB/s) | 48.28 | 52.8 9% | 42.46 -12% | 26.66 -45% | 26.77 -45% |
| 4K Write (MB/s) | 94.7 | 154.1 63% | 77.4 -18% | 79.2 -16% | 85.3 -10% |
| 4K-64 Read (MB/s) | 1475 | 1464 -1% | 559 -62% | 316.1 -79% | 420.5 -71% |
| 4K-64 Write (MB/s) | 1494 | 1350 -10% | 378.1 -75% | 248.1 -83% | 321.5 -78% |
| Access Time Read * (ms) | 0.046 | 0.061 -33% | 0.081 -76% | 0.112 -143% | 0.172 -274% |
| Access Time Write * (ms) | 0.041 | 0.026 37% | 0.049 -20% | 0.056 -37% | 0.061 -49% |
| Score Read (Points) | 1790 | 1773 -1% | 724 -60% | 391 -78% | 615 -66% |
| Score Write (Points) | 1822 | 1733 -5% | 567 -69% | 357 -80% | 426 -77% |
| Score Total (Points) | 4514 | 4406 -2% | 1669 -63% | 947 -79% | 1288 -71% |
| Copy ISO MB/s (MB/s) | 1963 | 812 | 282.5 | ||
| Copy Program MB/s (MB/s) | 440.5 | 209.4 | 212.2 | ||
| Copy Game MB/s (MB/s) | 1173 | 356.1 | 302.9 | ||
| Total Average (Program / Settings) | -4% /
-2% | -42% /
-43% | -68% /
-68% | -57% /
-60% |
* ... smaller is better

| 3DMark 11 Performance | 3670 points | |
| 3DMark Ice Storm Standard Score | 76723 points | |
| 3DMark Cloud Gate Standard Score | 12398 points | |
| 3DMark Fire Strike Score | 2141 points | |
| 3DMark Time Spy Score | 779 points | |
Help | ||
| BioShock Infinite | |
| 1920x1080 Ultra Preset, DX11 (DDOF) | |
| Lenovo ThinkPad T490-20N3S02L00 | |
| Lenovo ThinkPad T495-20NKS01Y00 | |
| 1366x768 High Preset | |
| Lenovo ThinkPad T490-20N3S02L00 | |
| Lenovo ThinkPad T495-20NKS01Y00 | |
| Lenovo ThinkPad T490-20N2004EGE | |
| 1366x768 Medium Preset | |
| Lenovo ThinkPad T490-20N3S02L00 | |
| Lenovo ThinkPad T495-20NKS01Y00 | |
| Lenovo ThinkPad T490-20N2004EGE | |
| 1280x720 Very Low Preset | |
| Lenovo ThinkPad T490-20N3S02L00 | |
| Lenovo ThinkPad T495-20NKS01Y00 | |
| Lenovo ThinkPad T490-20N2004EGE | |
| low | med. | high | ultra | |
|---|---|---|---|---|
| BioShock Infinite (2013) | 107.1 | 70.8 | 59.3 | 19.7 |
| Dota 2 Reborn (2015) | 69 | 64 | 38 | 35.2 |
| X-Plane 11.11 (2018) | 26.8 | 19.9 | 18.6 |
Noise level
| Idle |
| 28.4 / 28.4 / 29.4 dB(A) |
| Load |
| 29.9 / 31.4 dB(A) |
 | ||
30 dB silent 40 dB(A) audible 50 dB(A) loud |
||
min: | ||
(±) The maximum temperature on the upper side is 43.9 °C / 111 F, compared to the average of 34.3 °C / 94 F, ranging from 21.2 to 62.5 °C for the class Office.
(-) The bottom heats up to a maximum of 49.6 °C / 121 F, compared to the average of 36.8 °C / 98 F
(+) In idle usage, the average temperature for the upper side is 25.9 °C / 79 F, compared to the device average of 29.5 °C / 85 F.
(+) The palmrests and touchpad are reaching skin temperature as a maximum (32 °C / 89.6 F) and are therefore not hot.
(-) The average temperature of the palmrest area of similar devices was 27.5 °C / 81.5 F (-4.5 °C / -8.1 F).
| Off / Standby | |
| Idle | |
| Load |
|
Key:
min: | |
| Lenovo ThinkPad T495-20NKS01Y00 R5 PRO 3500U, Vega 8, Samsung SSD PM981 MZVLB512HAJQ, IPS, 1920x1080, 14" | Lenovo ThinkPad T490-20N3S02L00 i7-8565U, GeForce MX250, Toshiba XG5 KXG50ZNV512G, IGZO IPS LED, 1920x1080, 14" | Lenovo ThinkPad T490-20N2004EGE i5-8265U, UHD Graphics 620, Toshiba KXG5AZNV256G, IGZO IPS LED, 1920x1080, 14" | Lenovo ThinkPad A485-20MU000CGE R5 PRO 2500U, Vega 8, Samsung SSD PM981 MZVLB256HAHQ, IPS LED, 1920x1080, 14" | Dell Latitude 7490 i5-8350U, UHD Graphics 620, Toshiba KSG60ZMV256G, IPS, 1920x1080, 14" | HP EliteBook 745 G5 3UN74EA R7 2700U, Vega 10, Toshiba XG5 KXG50ZNV256G, IPS LED, 1920x1080, 14" | Average AMD Radeon RX Vega 8 (Ryzen 2000/3000) | Average of class Office | |
|---|---|---|---|---|---|---|---|---|
| Power Consumption | -4% | 19% | -10% | 30% | 2% | -6% | -6% | |
| Idle Minimum * (Watt) | 5.1 | 2.16 58% | 2.34 54% | 5.3 -4% | 2 61% | 4.9 4% | 5.68 ? -11% | 4.26 ? 16% |
| Idle Average * (Watt) | 7.7 | 5.04 35% | 5.22 32% | 8.3 -8% | 4.7 39% | 8.1 -5% | 8.75 ? -14% | 7.31 ? 5% |
| Idle Maximum * (Watt) | 10.7 | 8.64 19% | 8.82 18% | 11.4 -7% | 5.7 47% | 10.6 1% | 10.1 ? 6% | 8.55 ? 20% |
| Load Average * (Watt) | 35.8 | 63.2 -77% | 35.8 -0% | 42 -17% | 38.4 -7% | 32.2 10% | 37.8 ? -6% | 43.8 ? -22% |
| Load Maximum * (Watt) | 43.2 | 67.5 -56% | 47.3 -9% | 48.8 -13% | 38.9 10% | 42.3 2% | 46.2 ? -7% | 64.5 ? -49% |
| Witcher 3 ultra * (Watt) | 50 |
* ... smaller is better
| Lenovo ThinkPad T495-20NKS01Y00 R5 PRO 3500U, Vega 8, 50 Wh | Lenovo ThinkPad T490-20N3S02L00 i7-8565U, GeForce MX250, 50 Wh | Lenovo ThinkPad T490-20N2004EGE i5-8265U, UHD Graphics 620, 50 Wh | Lenovo ThinkPad A485-20MU000CGE R5 PRO 2500U, Vega 8, 48 Wh | Dell Latitude 7490 i5-8350U, UHD Graphics 620, 60 Wh | HP EliteBook 745 G5 3UN74EA R7 2700U, Vega 10, 50 Wh | Average of class Office | |
|---|---|---|---|---|---|---|---|
| Battery runtime | -17% | 20% | -41% | 0% | -24% | 27% | |
| H.264 (h) | 11.8 | 8.7 -26% | 11.3 -4% | 6.1 -48% | 7.1 -40% | 15.5 ? 31% | |
| WiFi v1.3 (h) | 9.1 | 9.1 0% | 9.5 4% | 5.5 -40% | 9.1 0% | 6.6 -27% | 13.2 ? 45% |
| Load (h) | 1.7 | 1.3 -24% | 2.7 59% | 1.1 -35% | 1.6 -6% | 1.808 ? 6% |
Pros
Cons
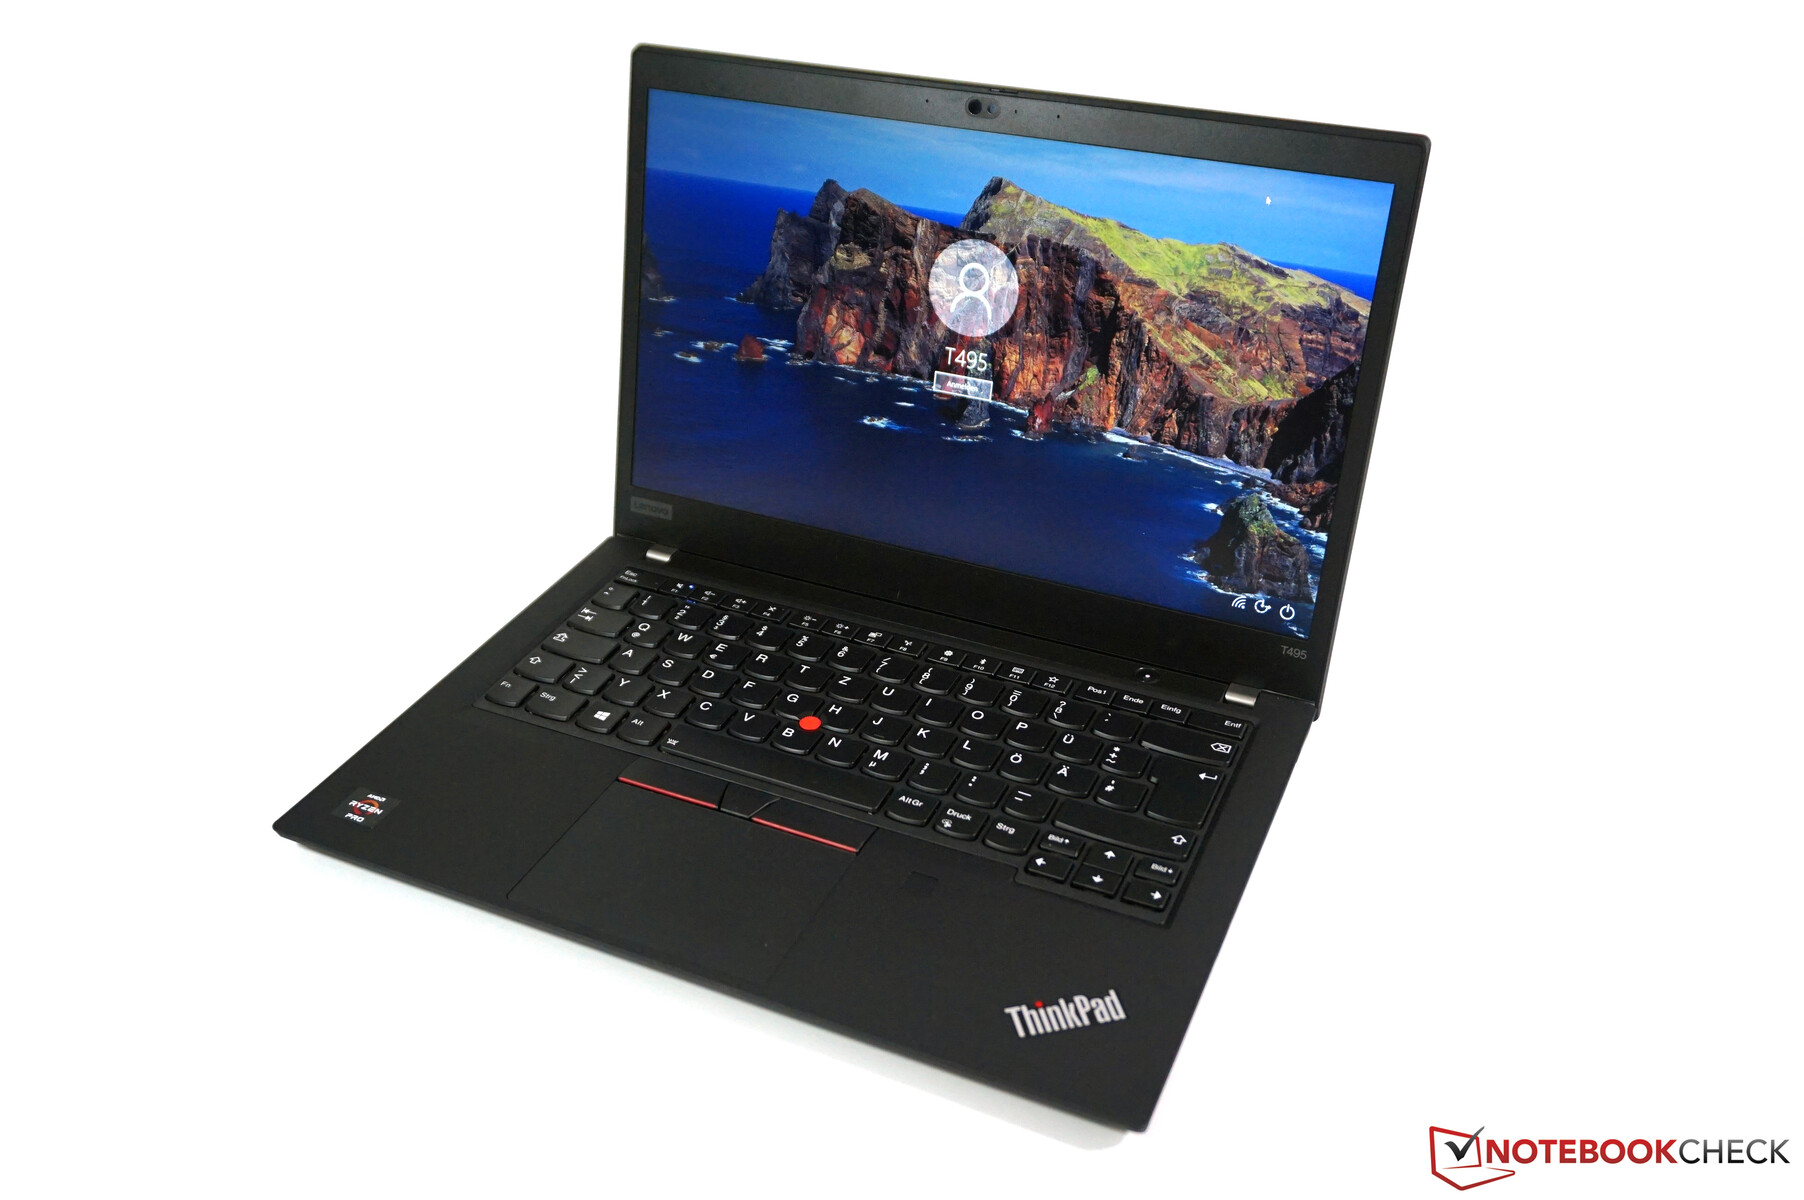
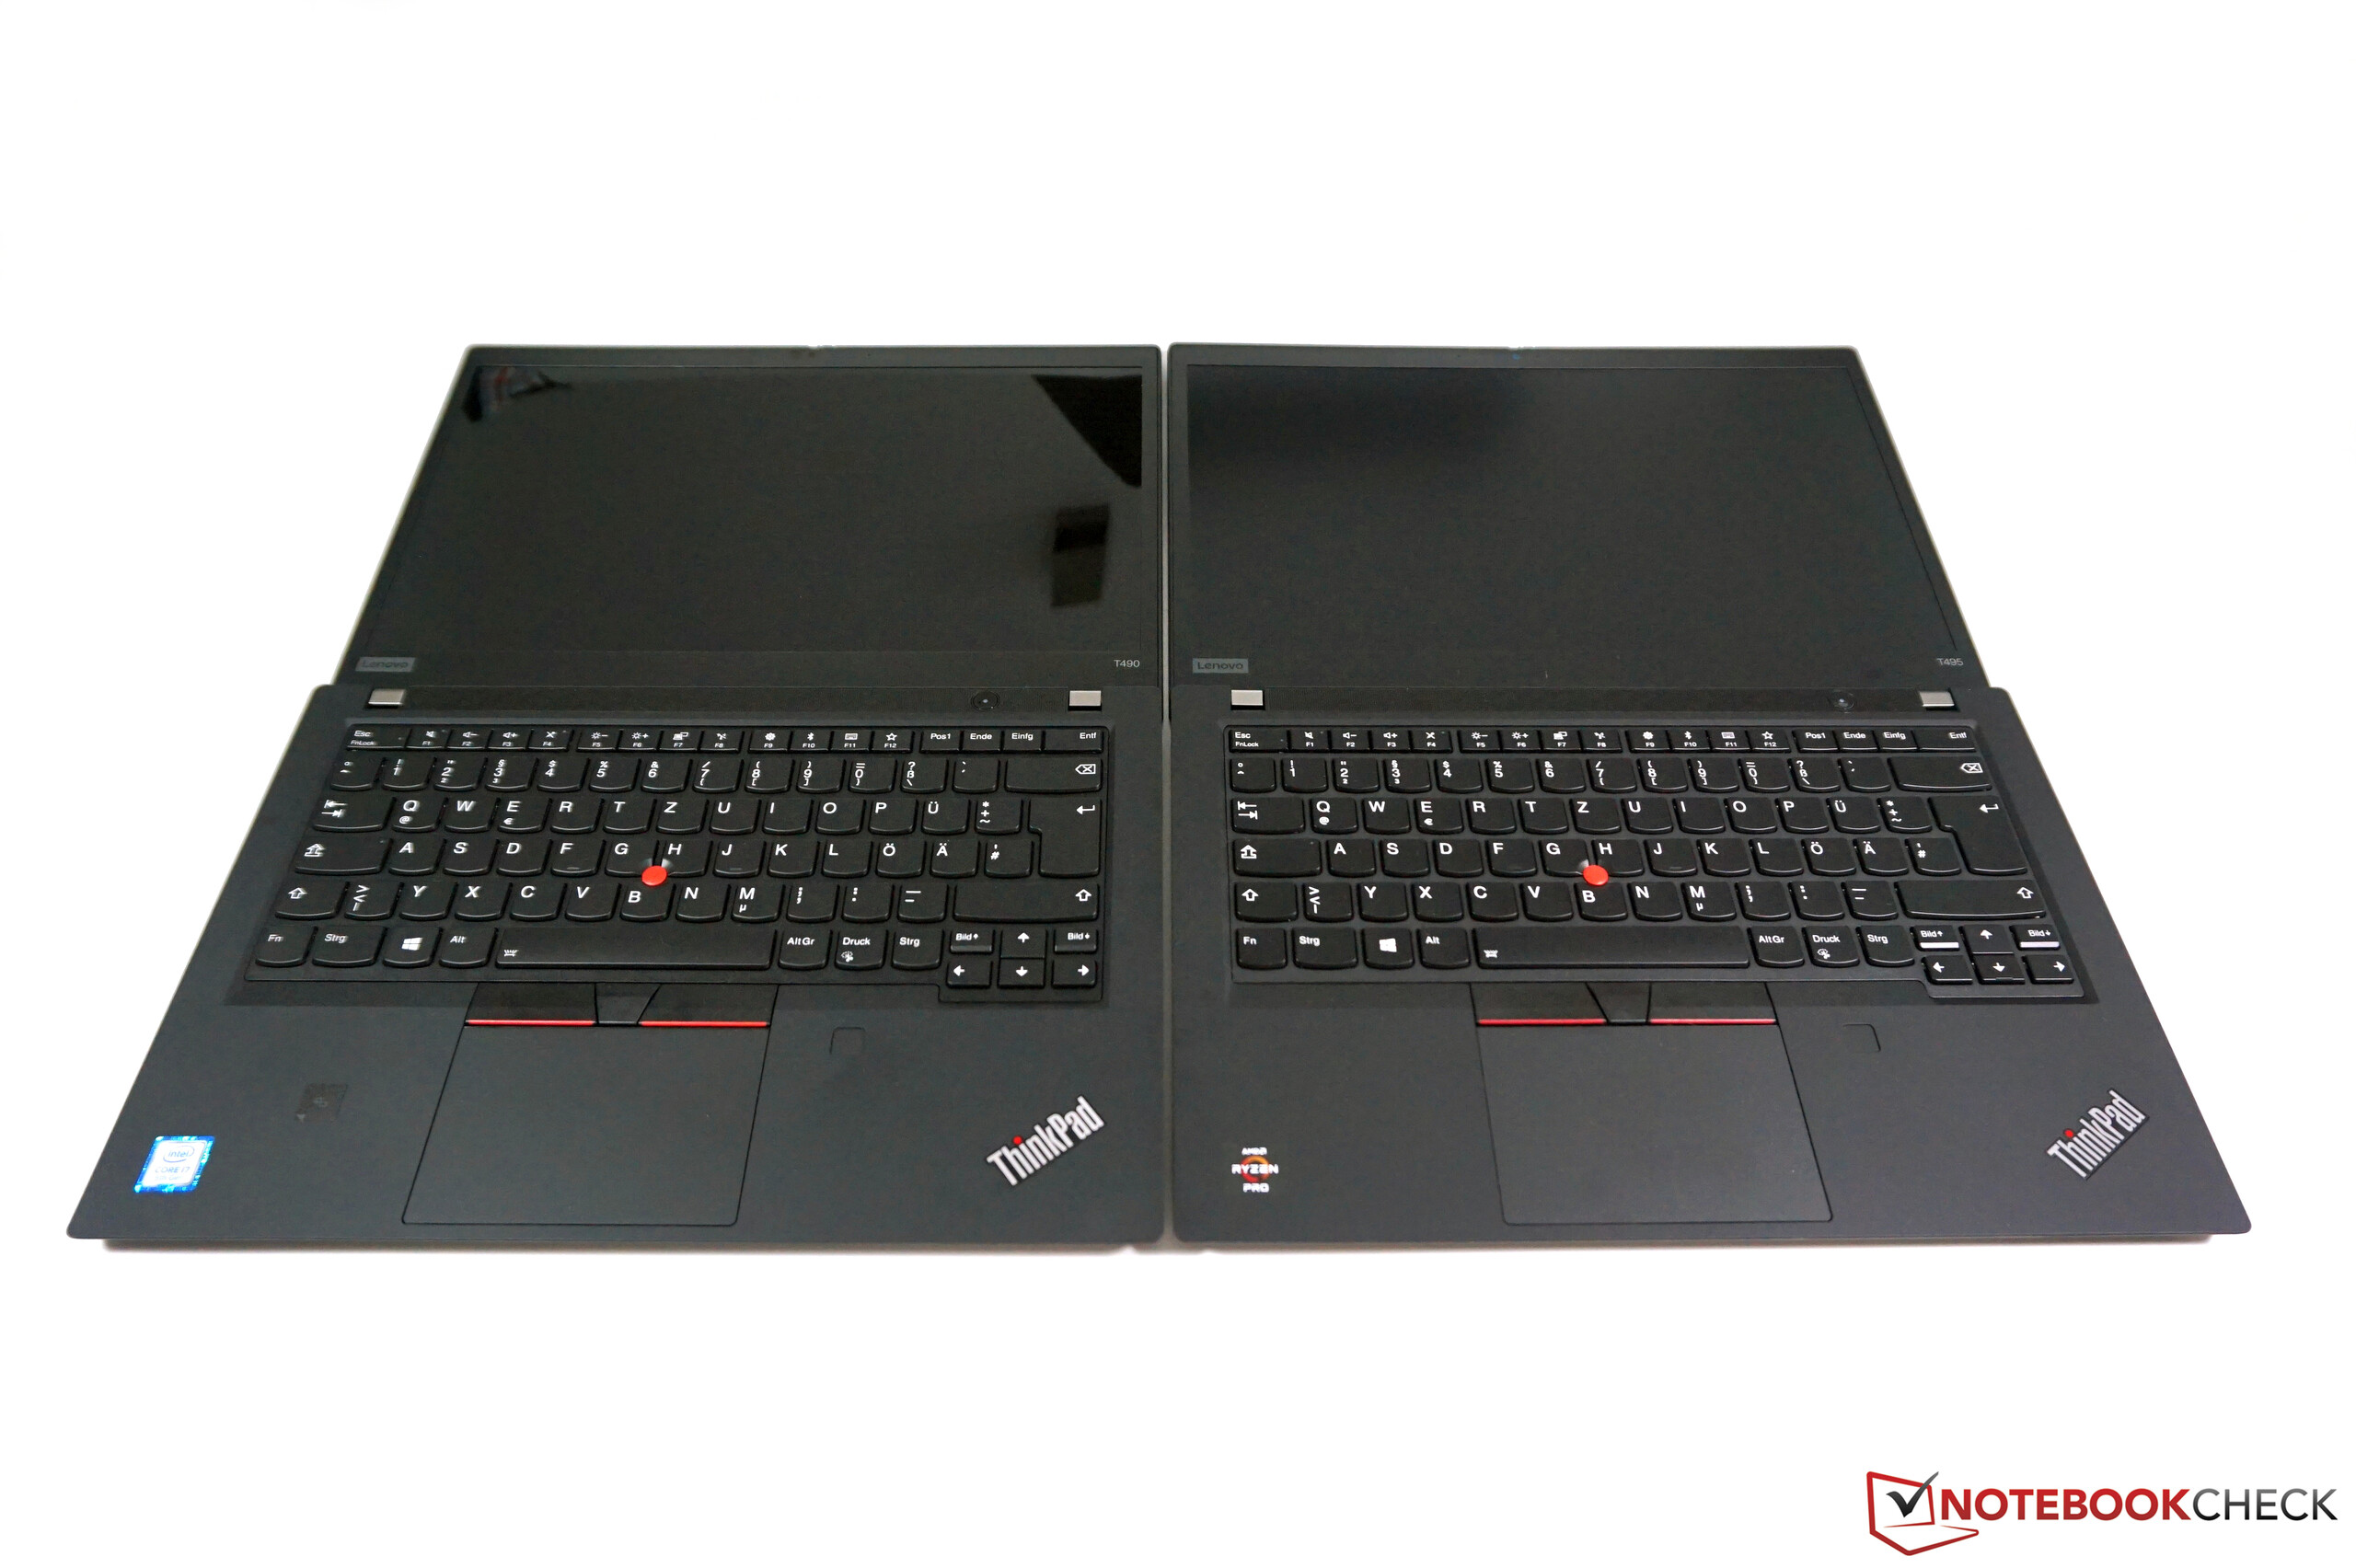
ThinkPad T495是联想首款配备AMD的商务笔记本电脑。与A系列不同,它没有太多妥协。模具和屏幕是相同的,除了缺少WQHD HDR选项外,续航时间也终于可以相提并论了。
唯一真正的缺点是缺少Thunderbolt 3和总体CPU性能略有不足。不幸的是,后者似乎是联想施加的人为限制,特别是考虑到配备Intel的T490消耗更多的能量。尽管如此,T495的四核仍然足够强大和快速,特别是对于办公室笔记本电脑来说。
出色的显示效果,较长的电池续航和良好的性能。考虑到其较低的价格,ThinkPad T495可以替代配备Intel的ThinkPad T490。唯一真正的缺点是缺少Thunderbolt 3端口。这对您是否重要取决于您打算如何使用它,但这绝对不是办公室笔记本电脑的必备配置。
我们也非常喜欢低功耗FHD屏幕。凭借其明亮的高对比度和很高的出厂色彩精度,它非常适合在sRGB色域下进行照片编辑。我们还认为FHD对于14英寸面板来说是足够高的分辨率,它有助于解决缩放问题。
总的来说,我们不得不承认,ThinkPad T495比T490更好,尤其是考虑到其较低的价格。
请注意,我们最近更新了评分系统,有关详细信息,请参见此处。使用新的V7评分系统,ThinkPad T495得分为89%。如果使用旧的V6评分系统,则得分为90%。
Lenovo ThinkPad T495-20NKS01Y00
- 09/12/2019 v7 (old)
Andreas Osthoff
Price comparison

