联想ThinkPad T490s(i5-8265U, 低功耗FHD)笔记本电脑评测

| SD Card Reader | |
| average JPG Copy Test (av. of 3 runs) | |
| Dell Latitude 7490 (Toshiba Exceria Pro M501 UHS-II) | |
| Lenovo ThinkPad T480s-20L7002AUS (Toshiba Exceria Pro SDXC 64 GB UHS-II) | |
| Fujitsu LifeBook U748 (Toshiba Exceria Pro SDXC 64 GB UHS-II) | |
| Lenovo ThinkPad T490s-20NYS02A00 (Toshiba Exceria Pro M501) | |
| Average of class Office (22.4 - 198.5, n=22, last 2 years) | |
| maximum AS SSD Seq Read Test (1GB) | |
| Dell Latitude 7490 (Toshiba Exceria Pro M501 UHS-II) | |
| Lenovo ThinkPad T490s-20NYS02A00 (Toshiba Exceria Pro M501) | |
| Lenovo ThinkPad T480s-20L7002AUS (Toshiba Exceria Pro SDXC 64 GB UHS-II) | |
| Fujitsu LifeBook U748 (Toshiba Exceria Pro SDXC 64 GB UHS-II) | |
| Average of class Office (27.4 - 249, n=20, last 2 years) | |
| Networking | |
| iperf3 transmit AX12 | |
| Lenovo ThinkPad T490s-20NYS02A00 | |
| Lenovo ThinkPad T480s-20L7002AUS | |
| HP EliteBook 840 G5-3JX66EA | |
| Dell Latitude 7490 | |
| Lenovo ThinkPad X1 Carbon G6-20KG0025UK | |
| Fujitsu LifeBook U748 | |
| iperf3 receive AX12 | |
| Dell Latitude 7490 | |
| Lenovo ThinkPad T490s-20NYS02A00 | |
| HP EliteBook 840 G5-3JX66EA | |
| Fujitsu LifeBook U748 | |
| Lenovo ThinkPad T480s-20L7002AUS | |
| Lenovo ThinkPad X1 Carbon G6-20KG0025UK | |
| |||||||||||||||||||||||||
Brightness Distribution: 87 %
Center on Battery: 391 cd/m²
Contrast: 1700:1 (Black: 0.23 cd/m²)
ΔE ColorChecker Calman: 3.4 | ∀{0.5-29.43 Ø4.73}
calibrated: 1.1
ΔE Greyscale Calman: 4 | ∀{0.09-98 Ø4.97}
97.4% sRGB (Argyll 1.6.3 3D)
62.4% AdobeRGB 1998 (Argyll 1.6.3 3D)
68.5% AdobeRGB 1998 (Argyll 3D)
97.6% sRGB (Argyll 3D)
67.1% Display P3 (Argyll 3D)
Gamma: 2.49
CCT: 6809 K
| Lenovo ThinkPad T490s-20NYS02A00 B140HAN05.7, , 1920x1080, 14" | Lenovo ThinkPad T480s-20L7002AUS NV140FHM-N46, , 1920x1080, 14" | Lenovo ThinkPad T490-20N3S02L00 NE140FHM-N61, , 1920x1080, 14" | Lenovo ThinkPad X1 Carbon G6-20KG0025UK Lenovo LEN40A9 / AUO B140HAK02.3, , 1920x1080, 14" | Fujitsu LifeBook U748 LG, LP140WF6-SPF1, , 1920x1080, 14" | HP EliteBook 840 G5-3JX66EA AUO3B3D, , 1920x1080, 14" | Dell Latitude 7490 AUO503D (D04YD_B140HAN), , 1920x1080, 14" | |
|---|---|---|---|---|---|---|---|
| Display | -40% | -2% | 0% | -10% | -1% | ||
| Display P3 Coverage (%) | 67.1 | 39.69 -41% | 69.3 3% | 68.3 2% | 60.2 -10% | 66.6 -1% | |
| sRGB Coverage (%) | 97.6 | 59.2 -39% | 92.2 -6% | 94.9 -3% | 88.2 -10% | 96.8 -1% | |
| AdobeRGB 1998 Coverage (%) | 68.5 | 41 -40% | 67.4 -2% | 69.3 1% | 61.3 -11% | 67.9 -1% | |
| Response Times | 21% | -19% | 36% | 37% | 25% | 25% | |
| Response Time Grey 50% / Grey 80% * (ms) | 61.6 ? | 44 ? 29% | 74 ? -20% | 40 ? 35% | 39.2 ? 36% | 42.4 ? 31% | 41.6 ? 32% |
| Response Time Black / White * (ms) | 38.8 ? | 34 ? 12% | 45.6 ? -18% | 25 ? 36% | 24.4 ? 37% | 31.6 ? 19% | 32 ? 18% |
| PWM Frequency (Hz) | 990 | 2451 ? | |||||
| Screen | -82% | -24% | -0% | -12% | -33% | -37% | |
| Brightness middle (cd/m²) | 391 | 288.3 -26% | 418 7% | 298 -24% | 334 -15% | 414 6% | 308.6 -21% |
| Brightness (cd/m²) | 389 | 281 -28% | 400 3% | 287 -26% | 313 -20% | 387 -1% | 294 -24% |
| Brightness Distribution (%) | 87 | 86 -1% | 88 1% | 91 5% | 89 2% | 87 0% | 89 2% |
| Black Level * (cd/m²) | 0.23 | 0.21 9% | 0.24 -4% | 0.2 13% | 0.41 -78% | 0.25 -9% | 0.23 -0% |
| Contrast (:1) | 1700 | 1373 -19% | 1742 2% | 1490 -12% | 815 -52% | 1656 -3% | 1342 -21% |
| Colorchecker dE 2000 * | 3.4 | 6.16 -81% | 4.7 -38% | 2.19 36% | 2.2 35% | 5.5 -62% | 6.07 -79% |
| Colorchecker dE 2000 max. * | 4.7 | 18.99 -304% | 8.7 -85% | 4.39 7% | 5.7 -21% | 9.9 -111% | 10.58 -125% |
| Colorchecker dE 2000 calibrated * | 1.1 | 4.51 -310% | 2.1 -91% | 1.67 -52% | 2.3 -109% | 1.67 -52% | |
| Greyscale dE 2000 * | 4 | 6.3 -58% | 5.9 -48% | 1.97 51% | 2.9 27% | 6.4 -60% | 7.3 -83% |
| Gamma | 2.49 88% | 2.517 87% | 2.06 107% | 2.43 91% | 2.34 94% | 2.31 95% | 2.061 107% |
| CCT | 6809 95% | 6886 94% | 7350 88% | 6571 99% | 6855 95% | 7811 83% | 7269 89% |
| Color Space (Percent of AdobeRGB 1998) (%) | 62.4 | 37.67 -40% | 59.9 -4% | 62 -1% | 65.3 5% | 56.9 -9% | 62 -1% |
| Color Space (Percent of sRGB) (%) | 97.4 | 58.9 -40% | 92.1 -5% | 95 -2% | 91.8 -6% | 88.1 -10% | 97 0% |
| Total Average (Program / Settings) | -34% /
-61% | -15% /
-19% | 12% /
4% | 13% /
-4% | -6% /
-22% | -4% /
-22% |
* ... smaller is better
Display Response Times
| ↔ Response Time Black to White | ||
|---|---|---|
| 38.8 ms ... rise ↗ and fall ↘ combined | ↗ 21.2 ms rise | 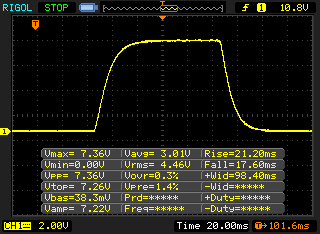 |
| ↘ 17.6 ms fall | ||
| The screen shows slow response rates in our tests and will be unsatisfactory for gamers. In comparison, all tested devices range from 0.1 (minimum) to 240 (maximum) ms. » 96 % of all devices are better. This means that the measured response time is worse than the average of all tested devices (19.9 ms). | ||
| ↔ Response Time 50% Grey to 80% Grey | ||
| 61.6 ms ... rise ↗ and fall ↘ combined | ↗ 30.8 ms rise | 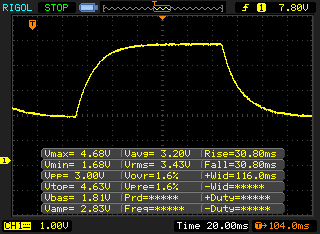 |
| ↘ 30.8 ms fall | ||
| The screen shows slow response rates in our tests and will be unsatisfactory for gamers. In comparison, all tested devices range from 0.165 (minimum) to 636 (maximum) ms. » 97 % of all devices are better. This means that the measured response time is worse than the average of all tested devices (31.1 ms). | ||
Screen Flickering / PWM (Pulse-Width Modulation)
| Screen flickering / PWM not detected |  | ||
In comparison: 52 % of all tested devices do not use PWM to dim the display. If PWM was detected, an average of 7798 (minimum: 5 - maximum: 343500) Hz was measured. | |||


| Cinebench R15 | |
| CPU Single 64Bit | |
| Average of class Office (99.5 - 312, n=74, last 2 years) | |
| Lenovo ThinkPad T490s-20NYS02A00 | |
| Average Intel Core i5-8265U (111 - 164, n=35) | |
| Dell Latitude 7490 | |
| Lenovo ThinkPad X1 Carbon G6-20KG0025UK | |
| Fujitsu LifeBook U748 | |
| HP EliteBook 840 G5-3JX66EA | |
| Lenovo ThinkPad T480s-20L7002AUS | |
| CPU Multi 64Bit | |
| Average of class Office (250 - 3380, n=74, last 2 years) | |
| Lenovo ThinkPad T480s-20L7002AUS | |
| Lenovo ThinkPad T490s-20NYS02A00 | |
| Lenovo ThinkPad X1 Carbon G6-20KG0025UK | |
| Average Intel Core i5-8265U (457 - 750, n=38) | |
| HP EliteBook 840 G5-3JX66EA | |
| Dell Latitude 7490 | |
| Fujitsu LifeBook U748 | |
| PCMark 8 | |
| Home Score Accelerated v2 | |
| Average of class Office (n=1last 2 years) | |
| Lenovo ThinkPad T490s-20NYS02A00 | |
| Dell Latitude 7490 | |
| Lenovo ThinkPad X1 Carbon G6-20KG0025UK | |
| Lenovo ThinkPad T480s-20L7002AUS | |
| HP EliteBook 840 G5-3JX66EA | |
| Fujitsu LifeBook U748 | |
| Average Intel Core i5-8265U, Intel UHD Graphics 620 (2747 - 4244, n=24) | |
| Work Score Accelerated v2 | |
| Average of class Office (n=1last 2 years) | |
| Lenovo ThinkPad T490s-20NYS02A00 | |
| Dell Latitude 7490 | |
| HP EliteBook 840 G5-3JX66EA | |
| Fujitsu LifeBook U748 | |
| Average Intel Core i5-8265U, Intel UHD Graphics 620 (3132 - 4927, n=23) | |
| Lenovo ThinkPad X1 Carbon G6-20KG0025UK | |
| PCMark 8 Home Score Accelerated v2 | 4244 points | |
| PCMark 8 Creative Score Accelerated v2 | 5323 points | |
| PCMark 8 Work Score Accelerated v2 | 4927 points | |
| PCMark 10 Score | 3985 points | |
Help | ||
| Lenovo ThinkPad T490s-20NYS02A00 Intel SSD Pro 7600p SSDPEKKF512G8L | Lenovo ThinkPad T480s-20L7002AUS Samsung PM961 MZVLW256HEHP | Lenovo ThinkPad X1 Carbon G6-20KG0025UK Lenovo LENSE20256GMSP34MEAT2TA | Fujitsu LifeBook U748 Samsung PM961 MZVLW256HEHP | HP EliteBook 840 G5-3JX66EA Toshiba XG5 KXG50ZNV256G | Dell Latitude 7490 Toshiba KSG60ZMV256G | Average Intel SSD Pro 7600p SSDPEKKF512G8L | |
|---|---|---|---|---|---|---|---|
| CrystalDiskMark 5.2 / 6 | -15% | -15% | 18% | -27% | -56% | 12% | |
| Write 4K (MB/s) | 122 | 105.8 -13% | 116.4 -5% | 135.5 11% | 92.8 -24% | 79.4 -35% | 133.9 ? 10% |
| Read 4K (MB/s) | 45.56 | 40.79 -10% | 45.75 0% | 43.76 -4% | 30.67 -33% | 27.37 -40% | 59.1 ? 30% |
| Write Seq (MB/s) | 1497 | 1204 -20% | 455.1 -70% | 1006 -33% | 353.2 -76% | 343.9 -77% | 1378 ? -8% |
| Read Seq (MB/s) | 2385 | 1065 -55% | 1818 -24% | 1761 -26% | 1937 -19% | 472.7 -80% | 2341 ? -2% |
| Write 4K Q32T1 (MB/s) | 240.9 | 219.2 -9% | 248.9 3% | 660 174% | 358 49% | 206 -14% | 355 ? 47% |
| Read 4K Q32T1 (MB/s) | 338 | 304.3 -10% | 358 6% | 432.6 28% | 253.1 -25% | 188.3 -44% | 429 ? 27% |
| Write Seq Q32T1 (MB/s) | 1528 | 1267 -17% | 1191 -22% | 1231 -19% | 359.6 -76% | 343.3 -78% | 1514 ? -1% |
| Read Seq Q32T1 (MB/s) | 2915 | 3303 13% | 2755 -5% | 3220 10% | 2613 -10% | 533 -82% | 2677 ? -8% |
| AS SSD | -12% | -80% | -13% | -128% | -81% | -2% | |
| Seq Read (MB/s) | 2654 | 2094 -21% | 2365 -11% | 1569 -41% | 1611 -39% | 486.2 -82% | 2408 ? -9% |
| Seq Write (MB/s) | 1341 | 1172 -13% | 1220 -9% | 805 -40% | 339 -75% | 294.9 -78% | 1318 ? -2% |
| 4K Read (MB/s) | 65.6 | 42.09 -36% | 35.67 -46% | 45.42 -31% | 29.01 -56% | 26.66 -59% | 60.9 ? -7% |
| 4K Write (MB/s) | 164.4 | 97.8 -41% | 87.6 -47% | 144.3 -12% | 93.6 -43% | 79.2 -52% | 153.3 ? -7% |
| 4K-64 Read (MB/s) | 761 | 1183 55% | 446.1 -41% | 1203 58% | 413.3 -46% | 316.1 -58% | 811 ? 7% |
| 4K-64 Write (MB/s) | 927 | 706 -24% | 195.8 -79% | 516 -44% | 248.3 -73% | 248.1 -73% | 895 ? -3% |
| Access Time Read * (ms) | 0.033 | 0.055 -67% | 0.108 -227% | 0.052 -58% | 0.321 -873% | 0.112 -239% | 0.0376 ? -14% |
| Access Time Write * (ms) | 0.039 | 0.038 3% | 0.144 -269% | 0.025 36% | 0.053 -36% | 0.056 -44% | 0.0352 ? 10% |
| Score Read (Points) | 1092 | 1435 31% | 718 -34% | 1405 29% | 603 -45% | 391 -64% | 1113 ? 2% |
| Score Write (Points) | 1226 | 921 -25% | 405 -67% | 741 -40% | 376 -69% | 357 -71% | 1180 ? -4% |
| Score Total (Points) | 2831 | 3048 8% | 1443 -49% | 2833 0% | 1232 -56% | 947 -67% | 2825 ? 0% |
| Copy ISO MB/s (MB/s) | 733 | 319.2 | 1474 ? | ||||
| Copy Program MB/s (MB/s) | 210.9 | 168.2 | 460 ? | ||||
| Copy Game MB/s (MB/s) | 549 | 309.3 | 964 ? | ||||
| Total Average (Program / Settings) | -14% /
-13% | -48% /
-52% | 3% /
-0% | -78% /
-86% | -69% /
-70% | 5% /
4% |
* ... smaller is better

| 3DMark 11 - 1280x720 Performance GPU | |
| Average of class Office (2551 - 18313, n=68, last 2 years) | |
| Lenovo ThinkPad E485-20KU000NGE | |
| Lenovo ThinkPad T480s-20L8S02E00 | |
| Lenovo ThinkPad X1 Carbon G6-20KG0025UK | |
| Lenovo ThinkPad T490s-20NYS02A00 | |
| Average Intel UHD Graphics 620 (1144 - 3432, n=244) | |
| Lenovo ThinkPad T480s-20L7002AUS | |
| HP EliteBook 840 G5-3JX66EA | |
| Dell Latitude 7490 | |
| Fujitsu LifeBook U748 | |
| 3DMark | |
| 1280x720 Cloud Gate Standard Graphics | |
| Average of class Office (11640 - 118515, n=37, last 2 years) | |
| Lenovo ThinkPad T480s-20L8S02E00 | |
| Lenovo ThinkPad E485-20KU000NGE | |
| Lenovo ThinkPad T490s-20NYS02A00 | |
| Lenovo ThinkPad X1 Carbon G6-20KG0025UK | |
| Average Intel UHD Graphics 620 (6205 - 16400, n=225) | |
| HP EliteBook 840 G5-3JX66EA | |
| Fujitsu LifeBook U748 | |
| Dell Latitude 7490 | |
| 1920x1080 Fire Strike Graphics | |
| Average of class Office (736 - 21871, n=72, last 2 years) | |
| Lenovo ThinkPad T480s-20L8S02E00 | |
| Lenovo ThinkPad E485-20KU000NGE | |
| Lenovo ThinkPad T490s-20NYS02A00 | |
| Lenovo ThinkPad X1 Carbon G6-20KG0025UK | |
| Average Intel UHD Graphics 620 (557 - 2608, n=213) | |
| HP EliteBook 840 G5-3JX66EA | |
| Dell Latitude 7490 | |
| Fujitsu LifeBook U748 | |
| 2560x1440 Time Spy Graphics | |
| Average of class Office (493 - 6679, n=67, last 2 years) | |
| Lenovo ThinkPad E485-20KU000NGE | |
| Average Intel UHD Graphics 620 (299 - 797, n=88) | |
| Fujitsu LifeBook U748 | |
| HP EliteBook 840 G5-3JX66EA | |
| 3DMark 11 Performance | 2079 points | |
| 3DMark Cloud Gate Standard Score | 10155 points | |
| 3DMark Fire Strike Score | 1217 points | |
Help | ||
| low | med. | high | ultra | |
|---|---|---|---|---|
| BioShock Infinite (2013) | 58.7 | 35.3 | 30.5 | 10.3 |
| The Witcher 3 (2015) | 17 | |||
| Dota 2 Reborn (2015) | 86 | 53.3 | 22 | 19.5 |
| Rocket League (2017) | 90.5 | 37.5 | 24.7 | |
| X-Plane 11.11 (2018) | 31.1 | 19.3 | 17.4 |
Noise level
| Idle |
| 29.4 / 29.4 / 30.9 dB(A) |
| Load |
| 33.3 / 33.3 dB(A) |
 | ||
30 dB silent 40 dB(A) audible 50 dB(A) loud |
||
min: | ||
| Lenovo ThinkPad T490s-20NYS02A00 UHD Graphics 620, i5-8265U, Intel SSD Pro 7600p SSDPEKKF512G8L | Lenovo ThinkPad T480s-20L7002AUS UHD Graphics 620, i5-8250U, Samsung PM961 MZVLW256HEHP | Lenovo ThinkPad X1 Carbon G6-20KG0025UK UHD Graphics 620, i5-8350U, Lenovo LENSE20256GMSP34MEAT2TA | Fujitsu LifeBook U748 UHD Graphics 620, i5-8250U, Samsung PM961 MZVLW256HEHP | HP EliteBook 840 G5-3JX66EA UHD Graphics 620, i5-8250U, Toshiba XG5 KXG50ZNV256G | Dell Latitude 7490 UHD Graphics 620, i5-8350U, Toshiba KSG60ZMV256G | |
|---|---|---|---|---|---|---|
| Noise | -2% | 1% | -1% | -2% | 1% | |
| off / environment * (dB) | 29.4 | 28.1 4% | 30.25 -3% | 29.3 -0% | 28.8 2% | 28.2 4% |
| Idle Minimum * (dB) | 29.4 | 28.1 4% | 30.25 -3% | 29.3 -0% | 28.8 2% | 28.2 4% |
| Idle Average * (dB) | 29.4 | 28.1 4% | 30.25 -3% | 29.3 -0% | 28.8 2% | 28.2 4% |
| Idle Maximum * (dB) | 30.9 | 28.1 9% | 30.25 2% | 29.9 3% | 33.1 -7% | 28.7 7% |
| Load Average * (dB) | 33.3 | 35.5 -7% | 31.3 6% | 32.5 2% | 35.2 -6% | 29.9 10% |
| Load Maximum * (dB) | 33.3 | 41.5 -25% | 31.3 6% | 36.6 -10% | 35.2 -6% | 40.2 -21% |
* ... smaller is better
(±) The maximum temperature on the upper side is 43.3 °C / 110 F, compared to the average of 34.3 °C / 94 F, ranging from 21.2 to 62.5 °C for the class Office.
(-) The bottom heats up to a maximum of 45.1 °C / 113 F, compared to the average of 36.8 °C / 98 F
(+) In idle usage, the average temperature for the upper side is 24.4 °C / 76 F, compared to the device average of 29.5 °C / 85 F.
(+) The palmrests and touchpad are cooler than skin temperature with a maximum of 27.8 °C / 82 F and are therefore cool to the touch.
(±) The average temperature of the palmrest area of similar devices was 27.5 °C / 81.5 F (-0.3 °C / -0.5 F).
Lenovo ThinkPad T490s-20NYS02A00 audio analysis
(-) | not very loud speakers (70.2 dB)
Bass 100 - 315 Hz
(-) | nearly no bass - on average 19.1% lower than median
(±) | linearity of bass is average (10% delta to prev. frequency)
Mids 400 - 2000 Hz
(±) | higher mids - on average 5.2% higher than median
(+) | mids are linear (6.5% delta to prev. frequency)
Highs 2 - 16 kHz
(+) | balanced highs - only 2.5% away from median
(+) | highs are linear (6.3% delta to prev. frequency)
Overall 100 - 16.000 Hz
(±) | linearity of overall sound is average (27% difference to median)
Compared to same class
» 83% of all tested devices in this class were better, 6% similar, 11% worse
» The best had a delta of 7%, average was 21%, worst was 53%
Compared to all devices tested
» 83% of all tested devices were better, 4% similar, 14% worse
» The best had a delta of 4%, average was 24%, worst was 134%
HP EliteBook 840 G5-3JX66EA audio analysis
(+) | speakers can play relatively loud (85.8 dB)
Bass 100 - 315 Hz
(-) | nearly no bass - on average 24.7% lower than median
(±) | linearity of bass is average (10.1% delta to prev. frequency)
Mids 400 - 2000 Hz
(+) | balanced mids - only 3.3% away from median
(+) | mids are linear (4.9% delta to prev. frequency)
Highs 2 - 16 kHz
(±) | higher highs - on average 7.1% higher than median
(+) | highs are linear (4.3% delta to prev. frequency)
Overall 100 - 16.000 Hz
(±) | linearity of overall sound is average (20.6% difference to median)
Compared to same class
» 47% of all tested devices in this class were better, 9% similar, 44% worse
» The best had a delta of 7%, average was 21%, worst was 53%
Compared to all devices tested
» 55% of all tested devices were better, 8% similar, 37% worse
» The best had a delta of 4%, average was 24%, worst was 134%
Dell Latitude 7490 audio analysis
(±) | speaker loudness is average but good (77.3 dB)
Bass 100 - 315 Hz
(±) | reduced bass - on average 13.6% lower than median
(±) | linearity of bass is average (10.5% delta to prev. frequency)
Mids 400 - 2000 Hz
(+) | balanced mids - only 3.9% away from median
(±) | linearity of mids is average (7.3% delta to prev. frequency)
Highs 2 - 16 kHz
(+) | balanced highs - only 3.4% away from median
(±) | linearity of highs is average (8.8% delta to prev. frequency)
Overall 100 - 16.000 Hz
(±) | linearity of overall sound is average (18.8% difference to median)
Compared to same class
» 34% of all tested devices in this class were better, 7% similar, 58% worse
» The best had a delta of 7%, average was 21%, worst was 53%
Compared to all devices tested
» 43% of all tested devices were better, 8% similar, 49% worse
» The best had a delta of 4%, average was 24%, worst was 134%
| Off / Standby | |
| Idle | |
| Load |
|
Key:
min: | |
| Lenovo ThinkPad T490s-20NYS02A00 i5-8265U, UHD Graphics 620, Intel SSD Pro 7600p SSDPEKKF512G8L, IPS, 1920x1080, 14" | Lenovo ThinkPad T480s-20L7002AUS i5-8250U, UHD Graphics 620, Samsung PM961 MZVLW256HEHP, TFT-LCD, 1920x1080, 14" | Lenovo ThinkPad X1 Carbon G6-20KG0025UK i5-8350U, UHD Graphics 620, Lenovo LENSE20256GMSP34MEAT2TA, IPS, 1920x1080, 14" | Fujitsu LifeBook U748 i5-8250U, UHD Graphics 620, Samsung PM961 MZVLW256HEHP, IPS, 1920x1080, 14" | HP EliteBook 840 G5-3JX66EA i5-8250U, UHD Graphics 620, Toshiba XG5 KXG50ZNV256G, IPS, 1920x1080, 14" | Dell Latitude 7490 i5-8350U, UHD Graphics 620, Toshiba KSG60ZMV256G, IPS, 1920x1080, 14" | Average Intel UHD Graphics 620 | Average of class Office | |
|---|---|---|---|---|---|---|---|---|
| Power Consumption | 5% | -8% | 1% | -10% | 22% | -8% | -23% | |
| Idle Minimum * (Watt) | 2.62 | 3.1 -18% | 4.7 -79% | 3.33 -27% | 3.2 -22% | 2 24% | 3.81 ? -45% | 4.4 ? -68% |
| Idle Average * (Watt) | 5.16 | 6.4 -24% | 7.3 -41% | 6.9 -34% | 6.6 -28% | 4.7 9% | 6.94 ? -34% | 7.32 ? -42% |
| Idle Maximum * (Watt) | 8.7 | 9.4 -8% | 9.4 -8% | 8.2 6% | 9.5 -9% | 5.7 34% | 8.75 ? -1% | 8.56 ? 2% |
| Load Average * (Watt) | 40 | 29.8 25% | 28 30% | 29.4 26% | 36.2 9% | 38.4 4% | 35 ? 12% | 42.5 ? -6% |
| Load Maximum * (Watt) | 64 | 31.2 51% | 28.2 56% | 43.4 32% | 65.6 -2% | 38.9 39% | 47.5 ? 26% | 64.1 ? -0% |
* ... smaller is better
| Lenovo ThinkPad T490s-20NYS02A00 i5-8265U, UHD Graphics 620, 57 Wh | Lenovo ThinkPad T480s-20L7002AUS i5-8250U, UHD Graphics 620, 57 Wh | Lenovo ThinkPad X1 Carbon G6-20KG0025UK i5-8350U, UHD Graphics 620, 57 Wh | Fujitsu LifeBook U748 i5-8250U, UHD Graphics 620, 50 Wh | HP EliteBook 840 G5-3JX66EA i5-8250U, UHD Graphics 620, 50 Wh | Dell Latitude 7490 i5-8350U, UHD Graphics 620, 60 Wh | Average of class Office | |
|---|---|---|---|---|---|---|---|
| Battery runtime | -11% | -2% | -28% | -8% | -10% | 14% | |
| H.264 (h) | 13.9 | 11 -21% | 6.6 -53% | 6.7 -52% | 15 ? 8% | ||
| WiFi v1.3 (h) | 10.1 | 9 -11% | 10.4 3% | 6.5 -36% | 7.5 -26% | 9.1 -10% | 12.9 ? 28% |
| Load (h) | 1.7 | 1.9 12% | 1.8 6% | 2.6 53% | 1.807 ? 6% | ||
| Reader / Idle (h) | 24.5 | 15.6 | 19 | 23.7 ? |
Pros
Cons

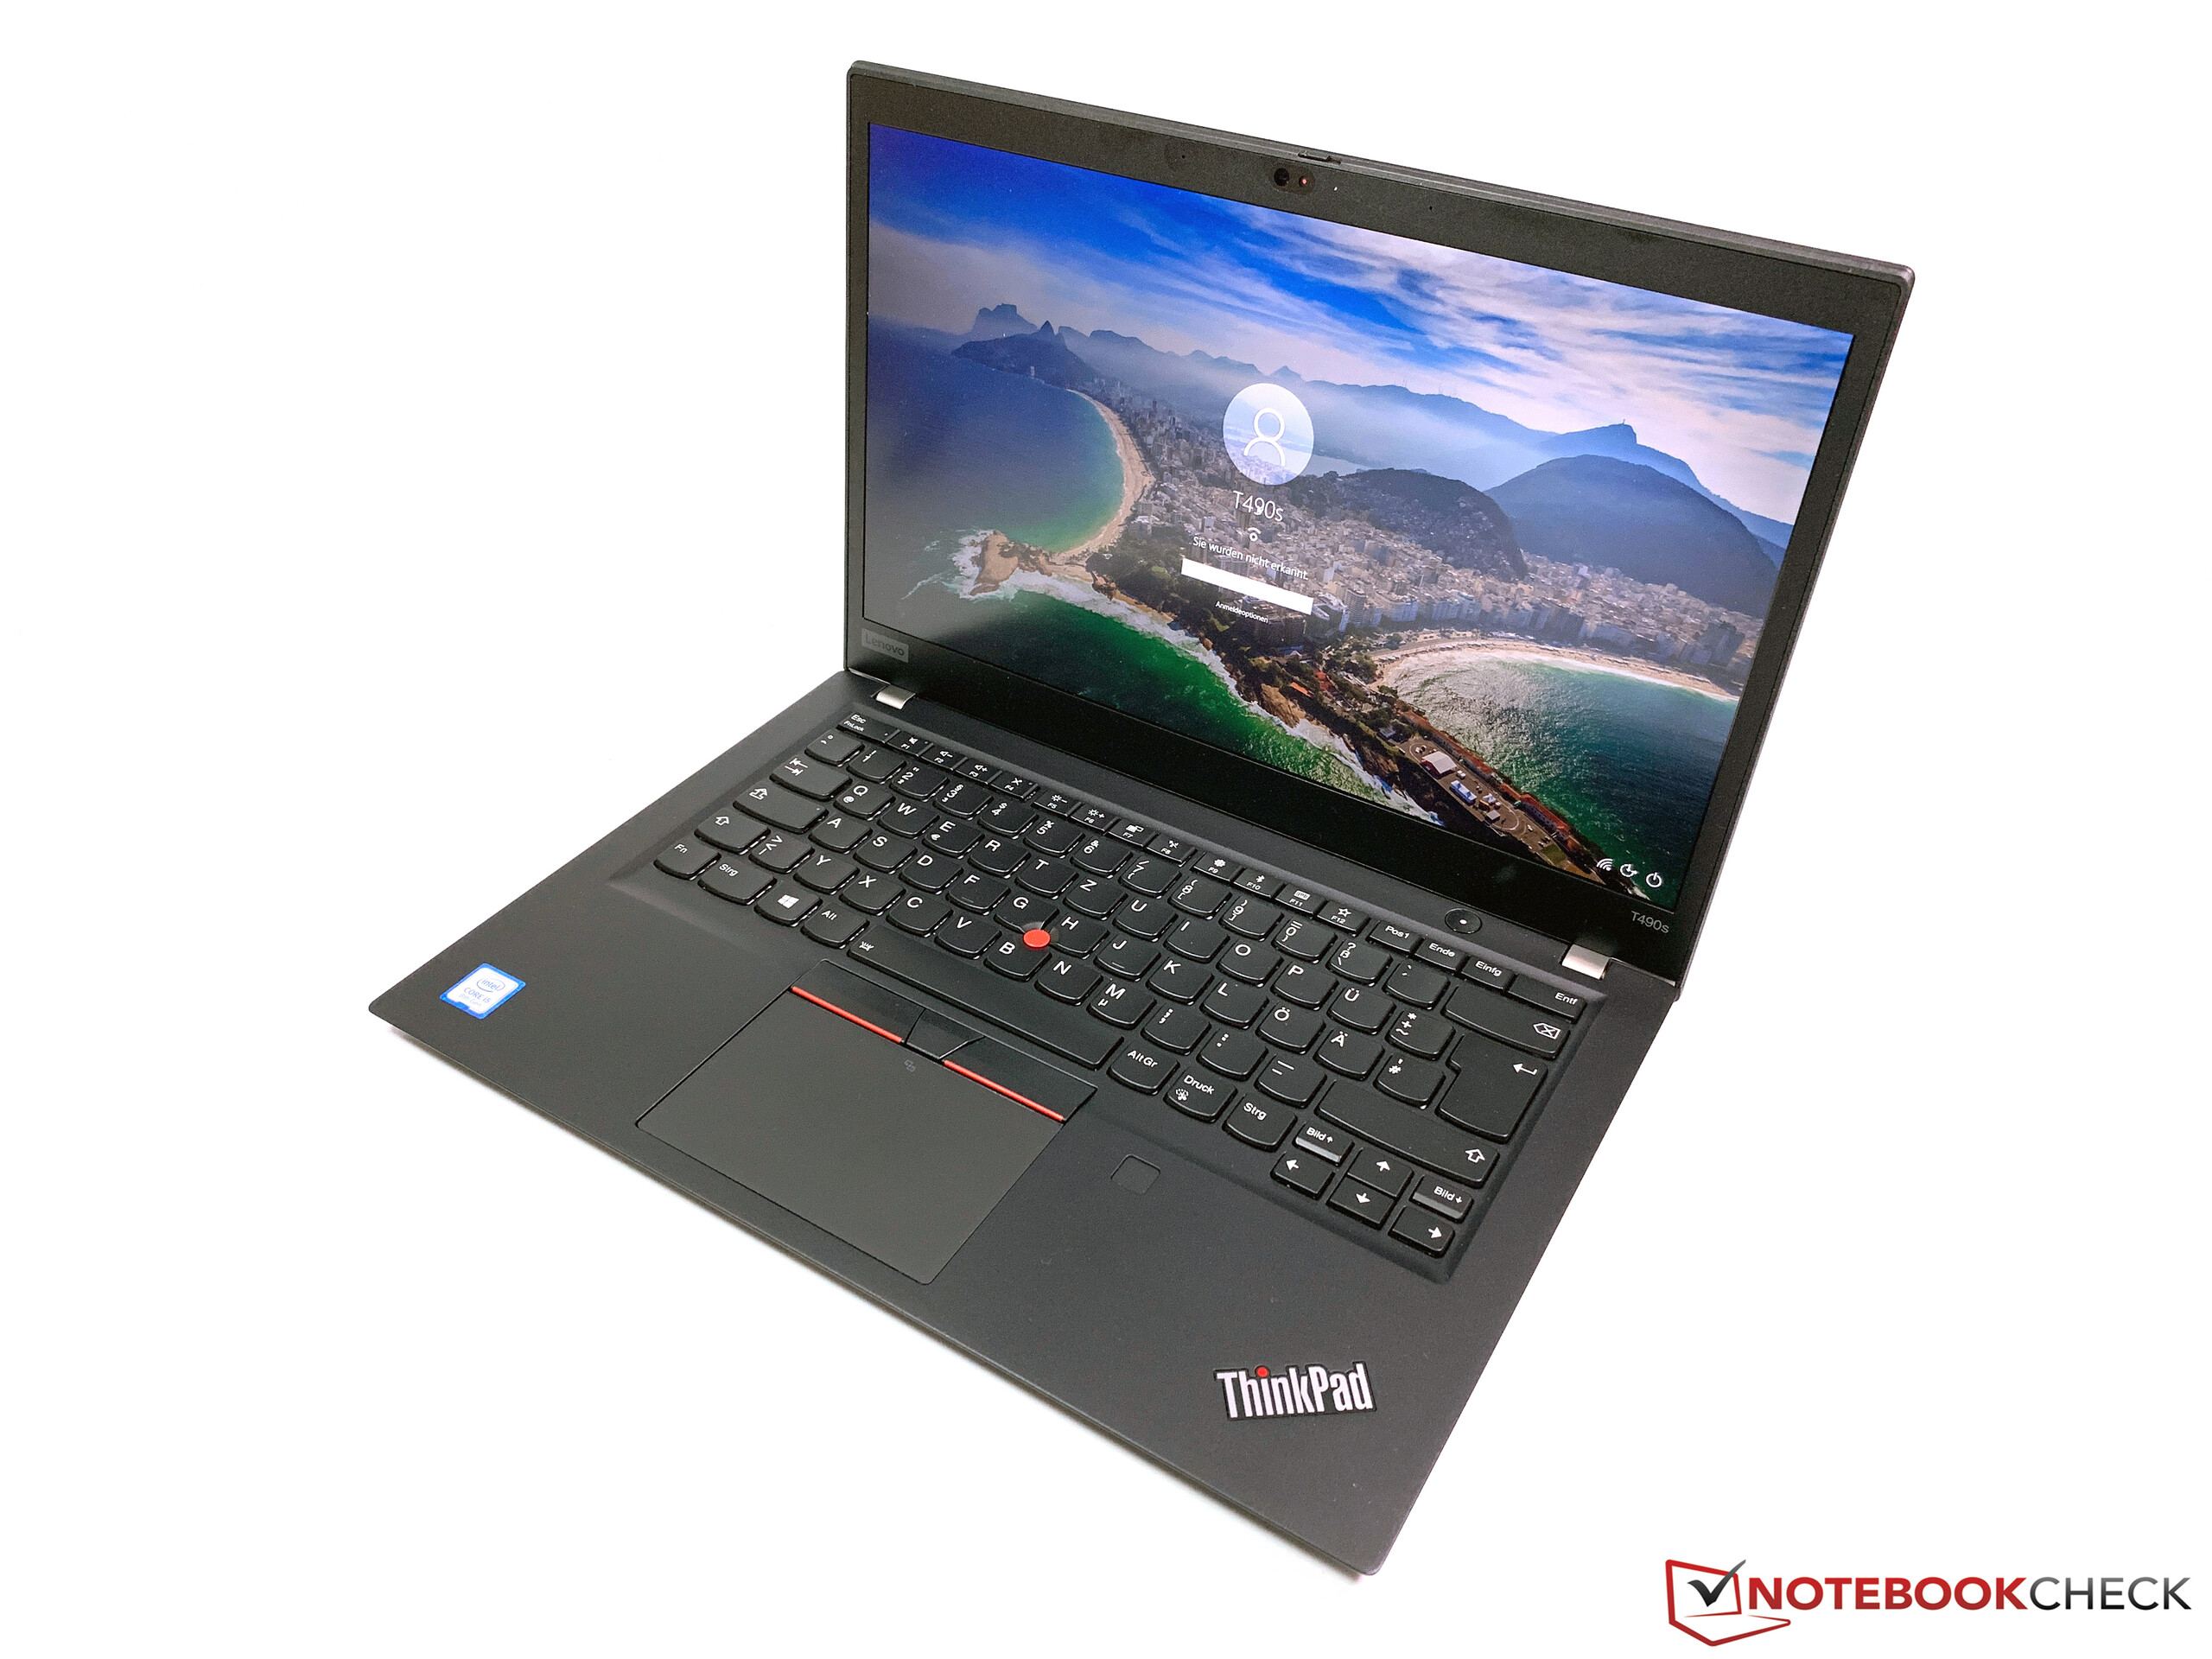
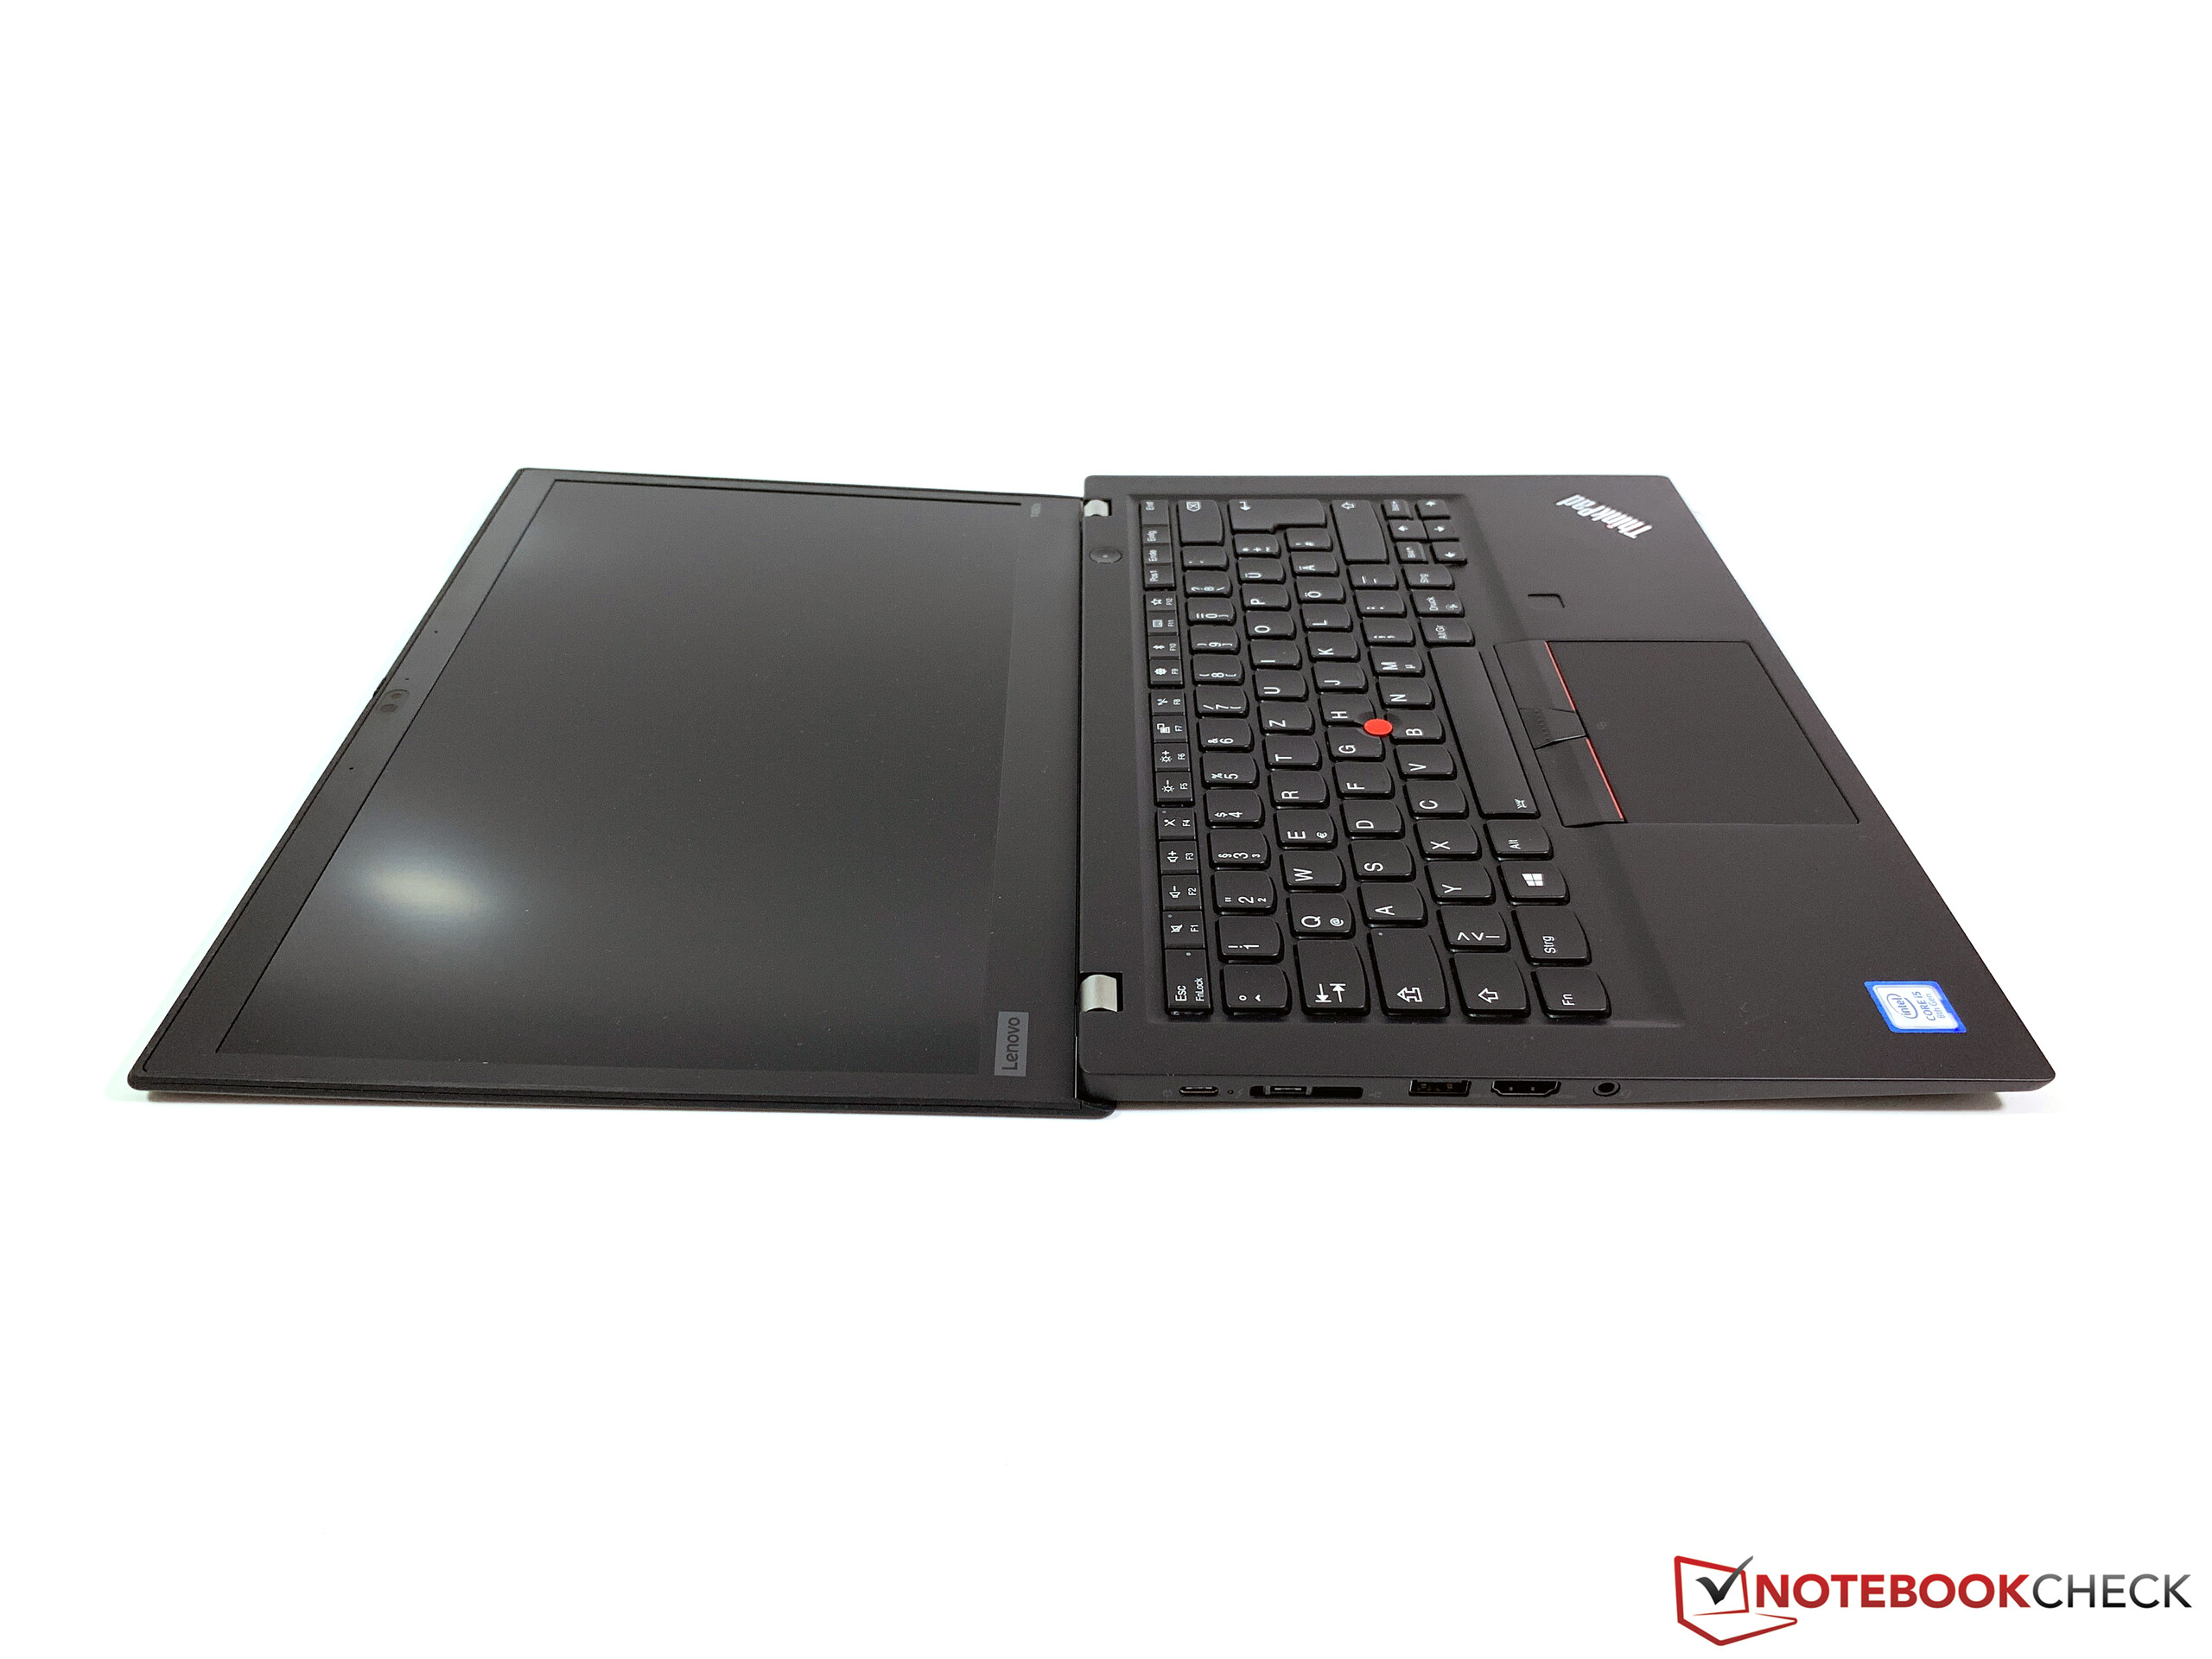
这次我们可以长话短说:ThinkPad T490s是一款非常优秀的商务笔记本电脑,也是目前最好的笔记本之一。仅8999元的售价也具有一定的性价比。”
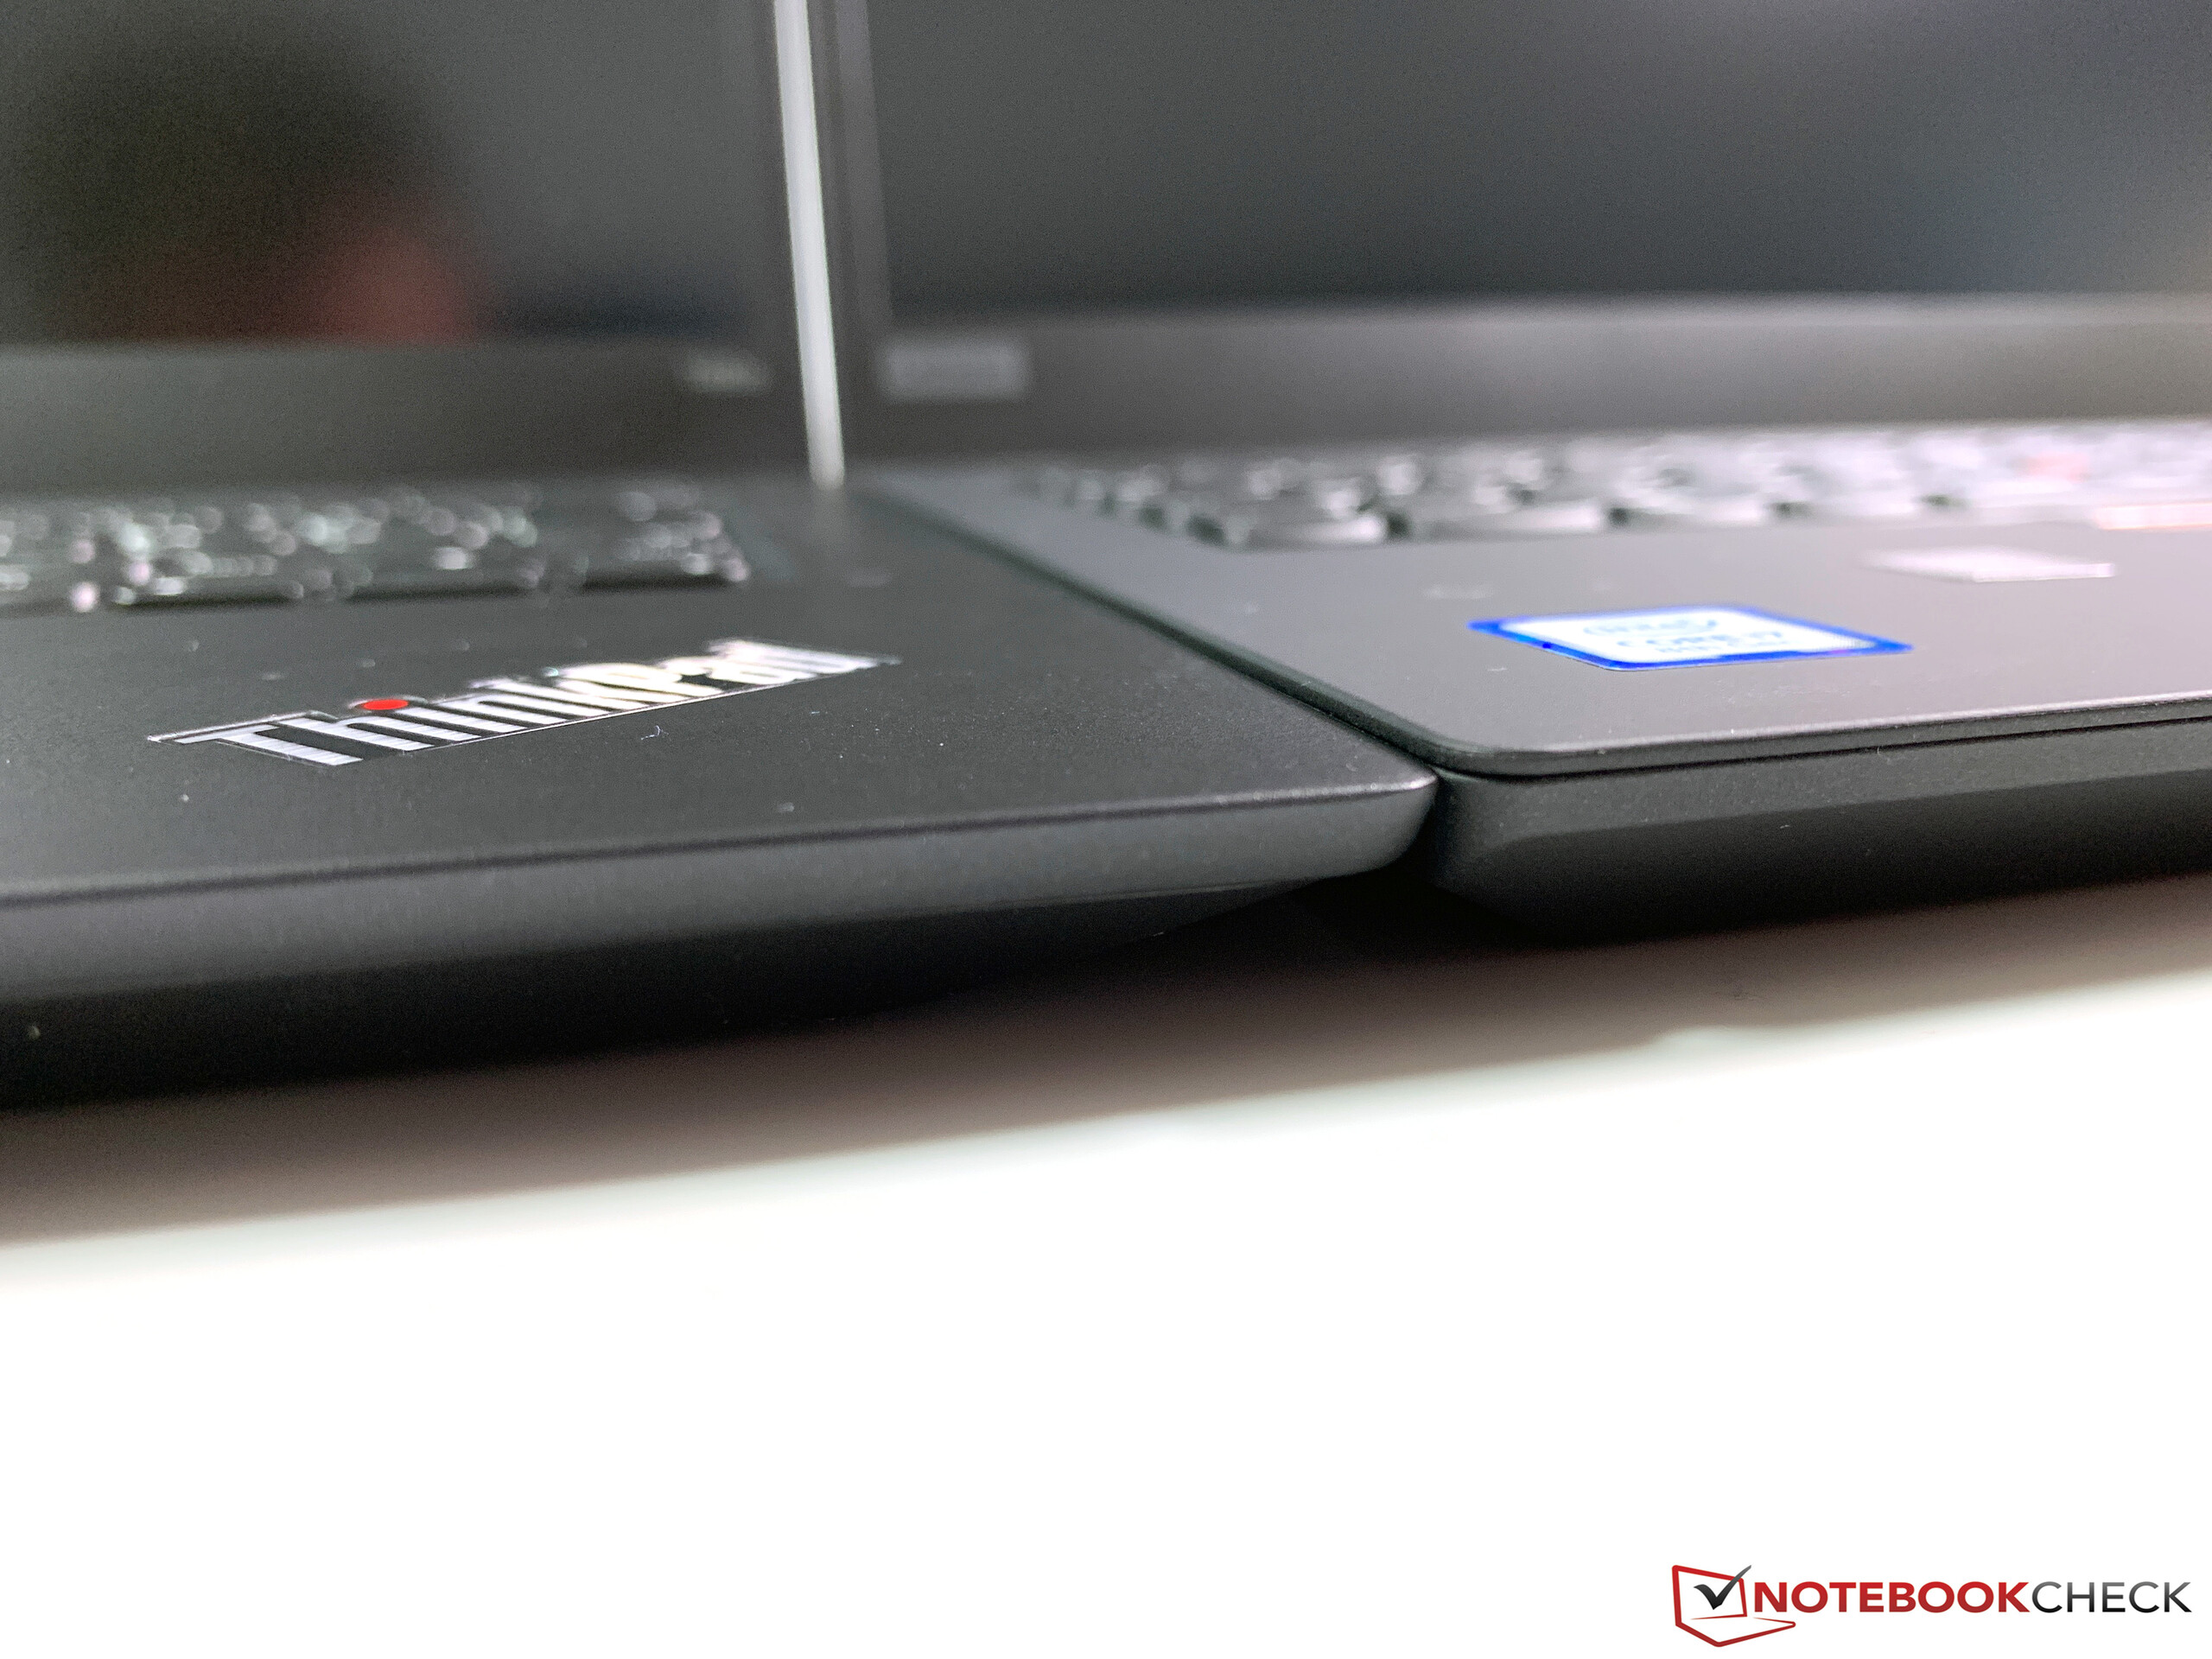
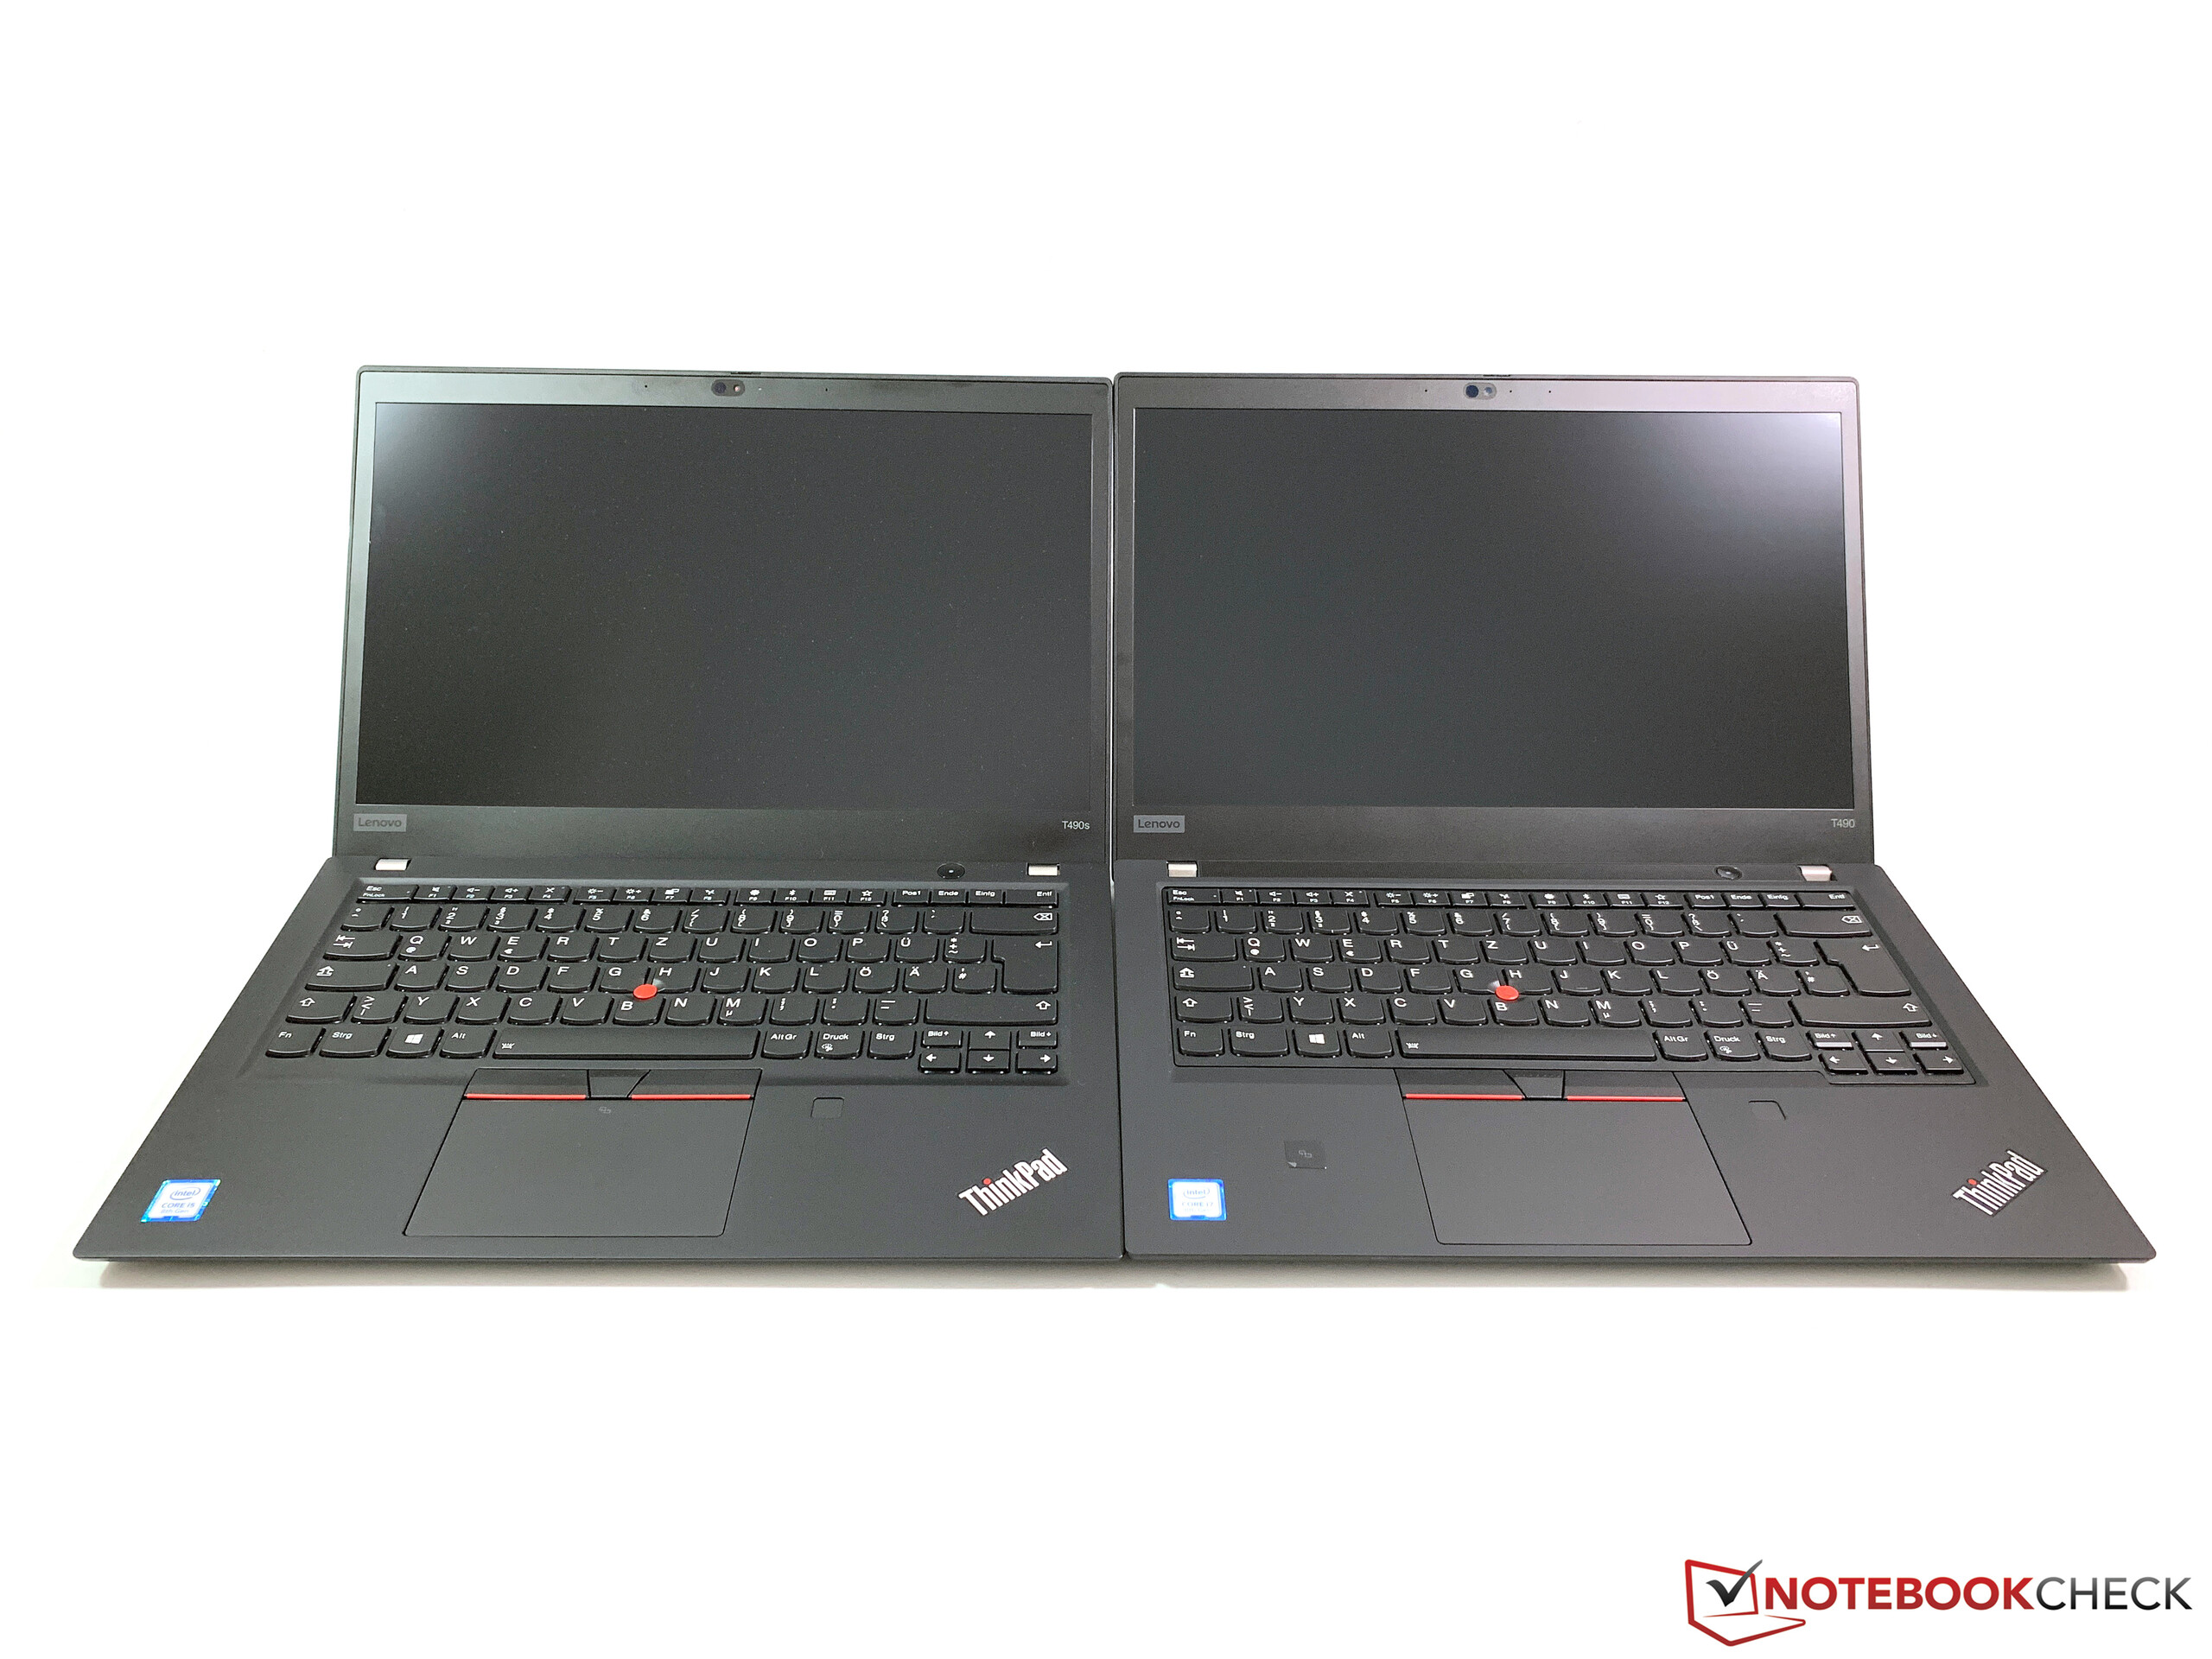
我们可以在此时结束我们的总结,但是当您将ThinkPad T490与其前身和联想的其他14英寸笔记本电脑进行比较时,情况会稍微复杂一些。对比当前的高质量商务本,可以看出所有系列都比以往更加相似。这包括T490,T490s,X1 Carbon以及新款X390,它们甚至与T490s共享主板。虽然存在一些差异,但是当您查看类似装备的SKU时,客户会得到几乎相同的四台笔记本,而我们甚至没有包括其他制造商的竞争对手。
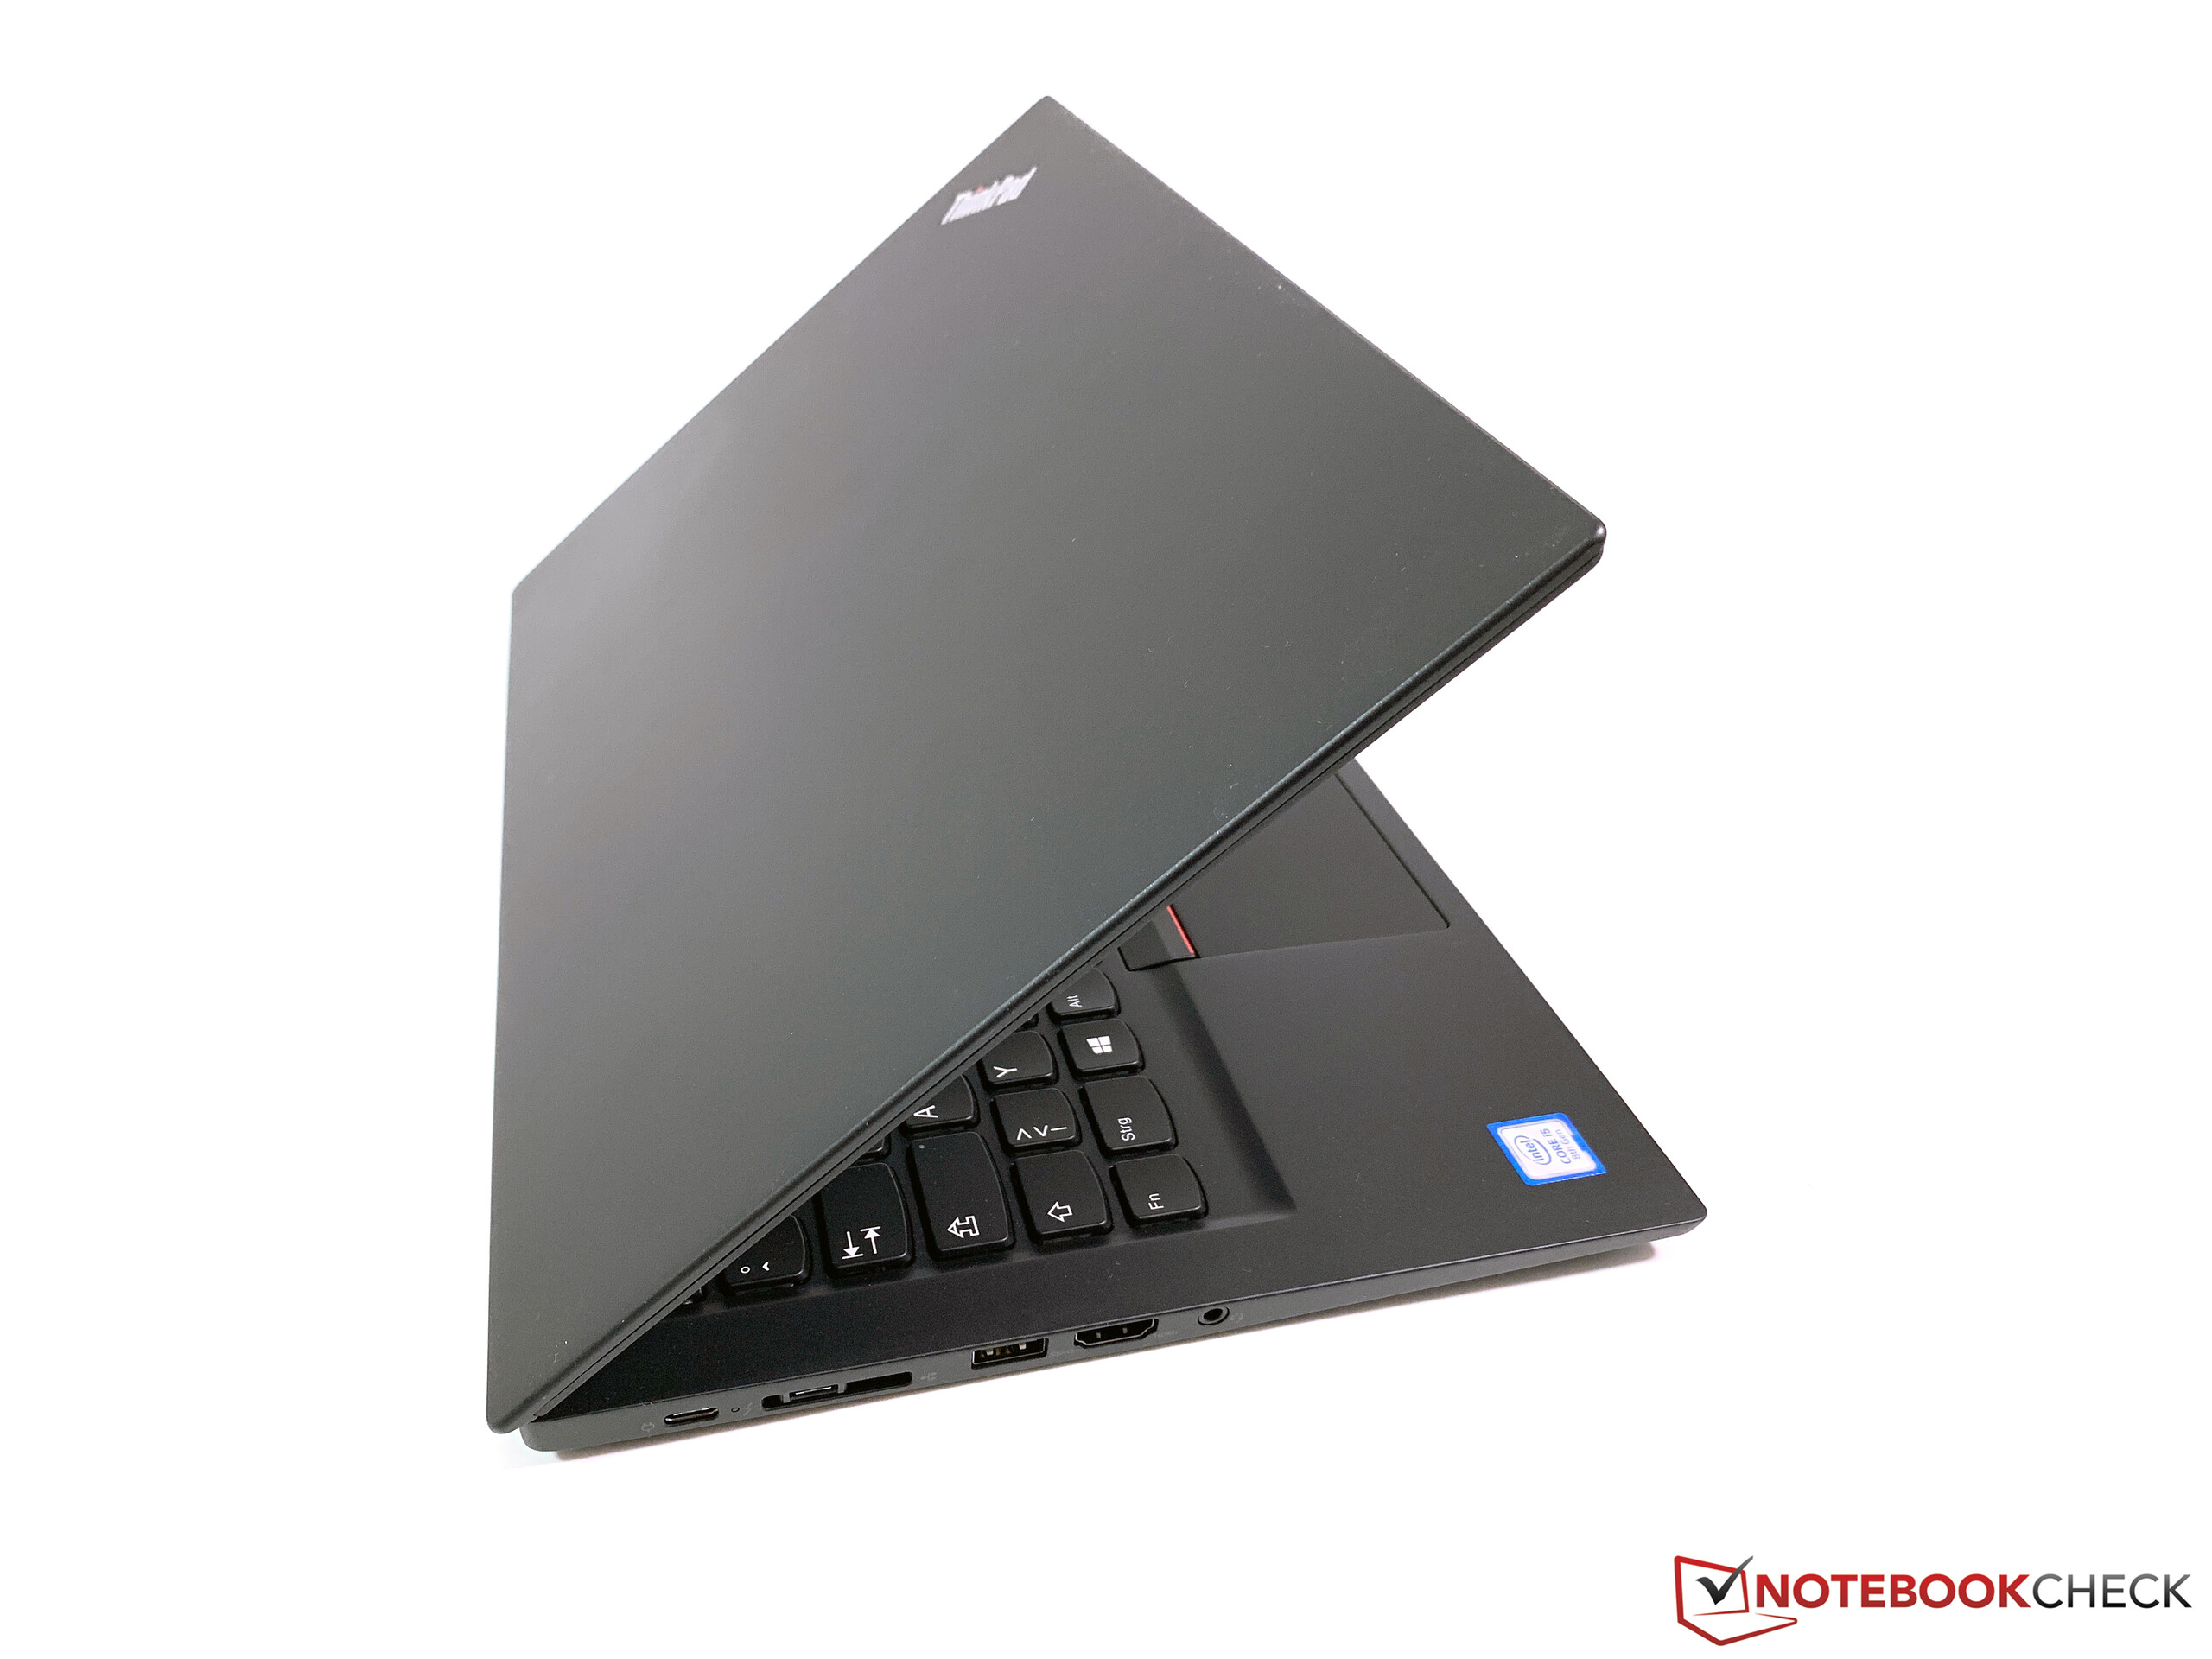
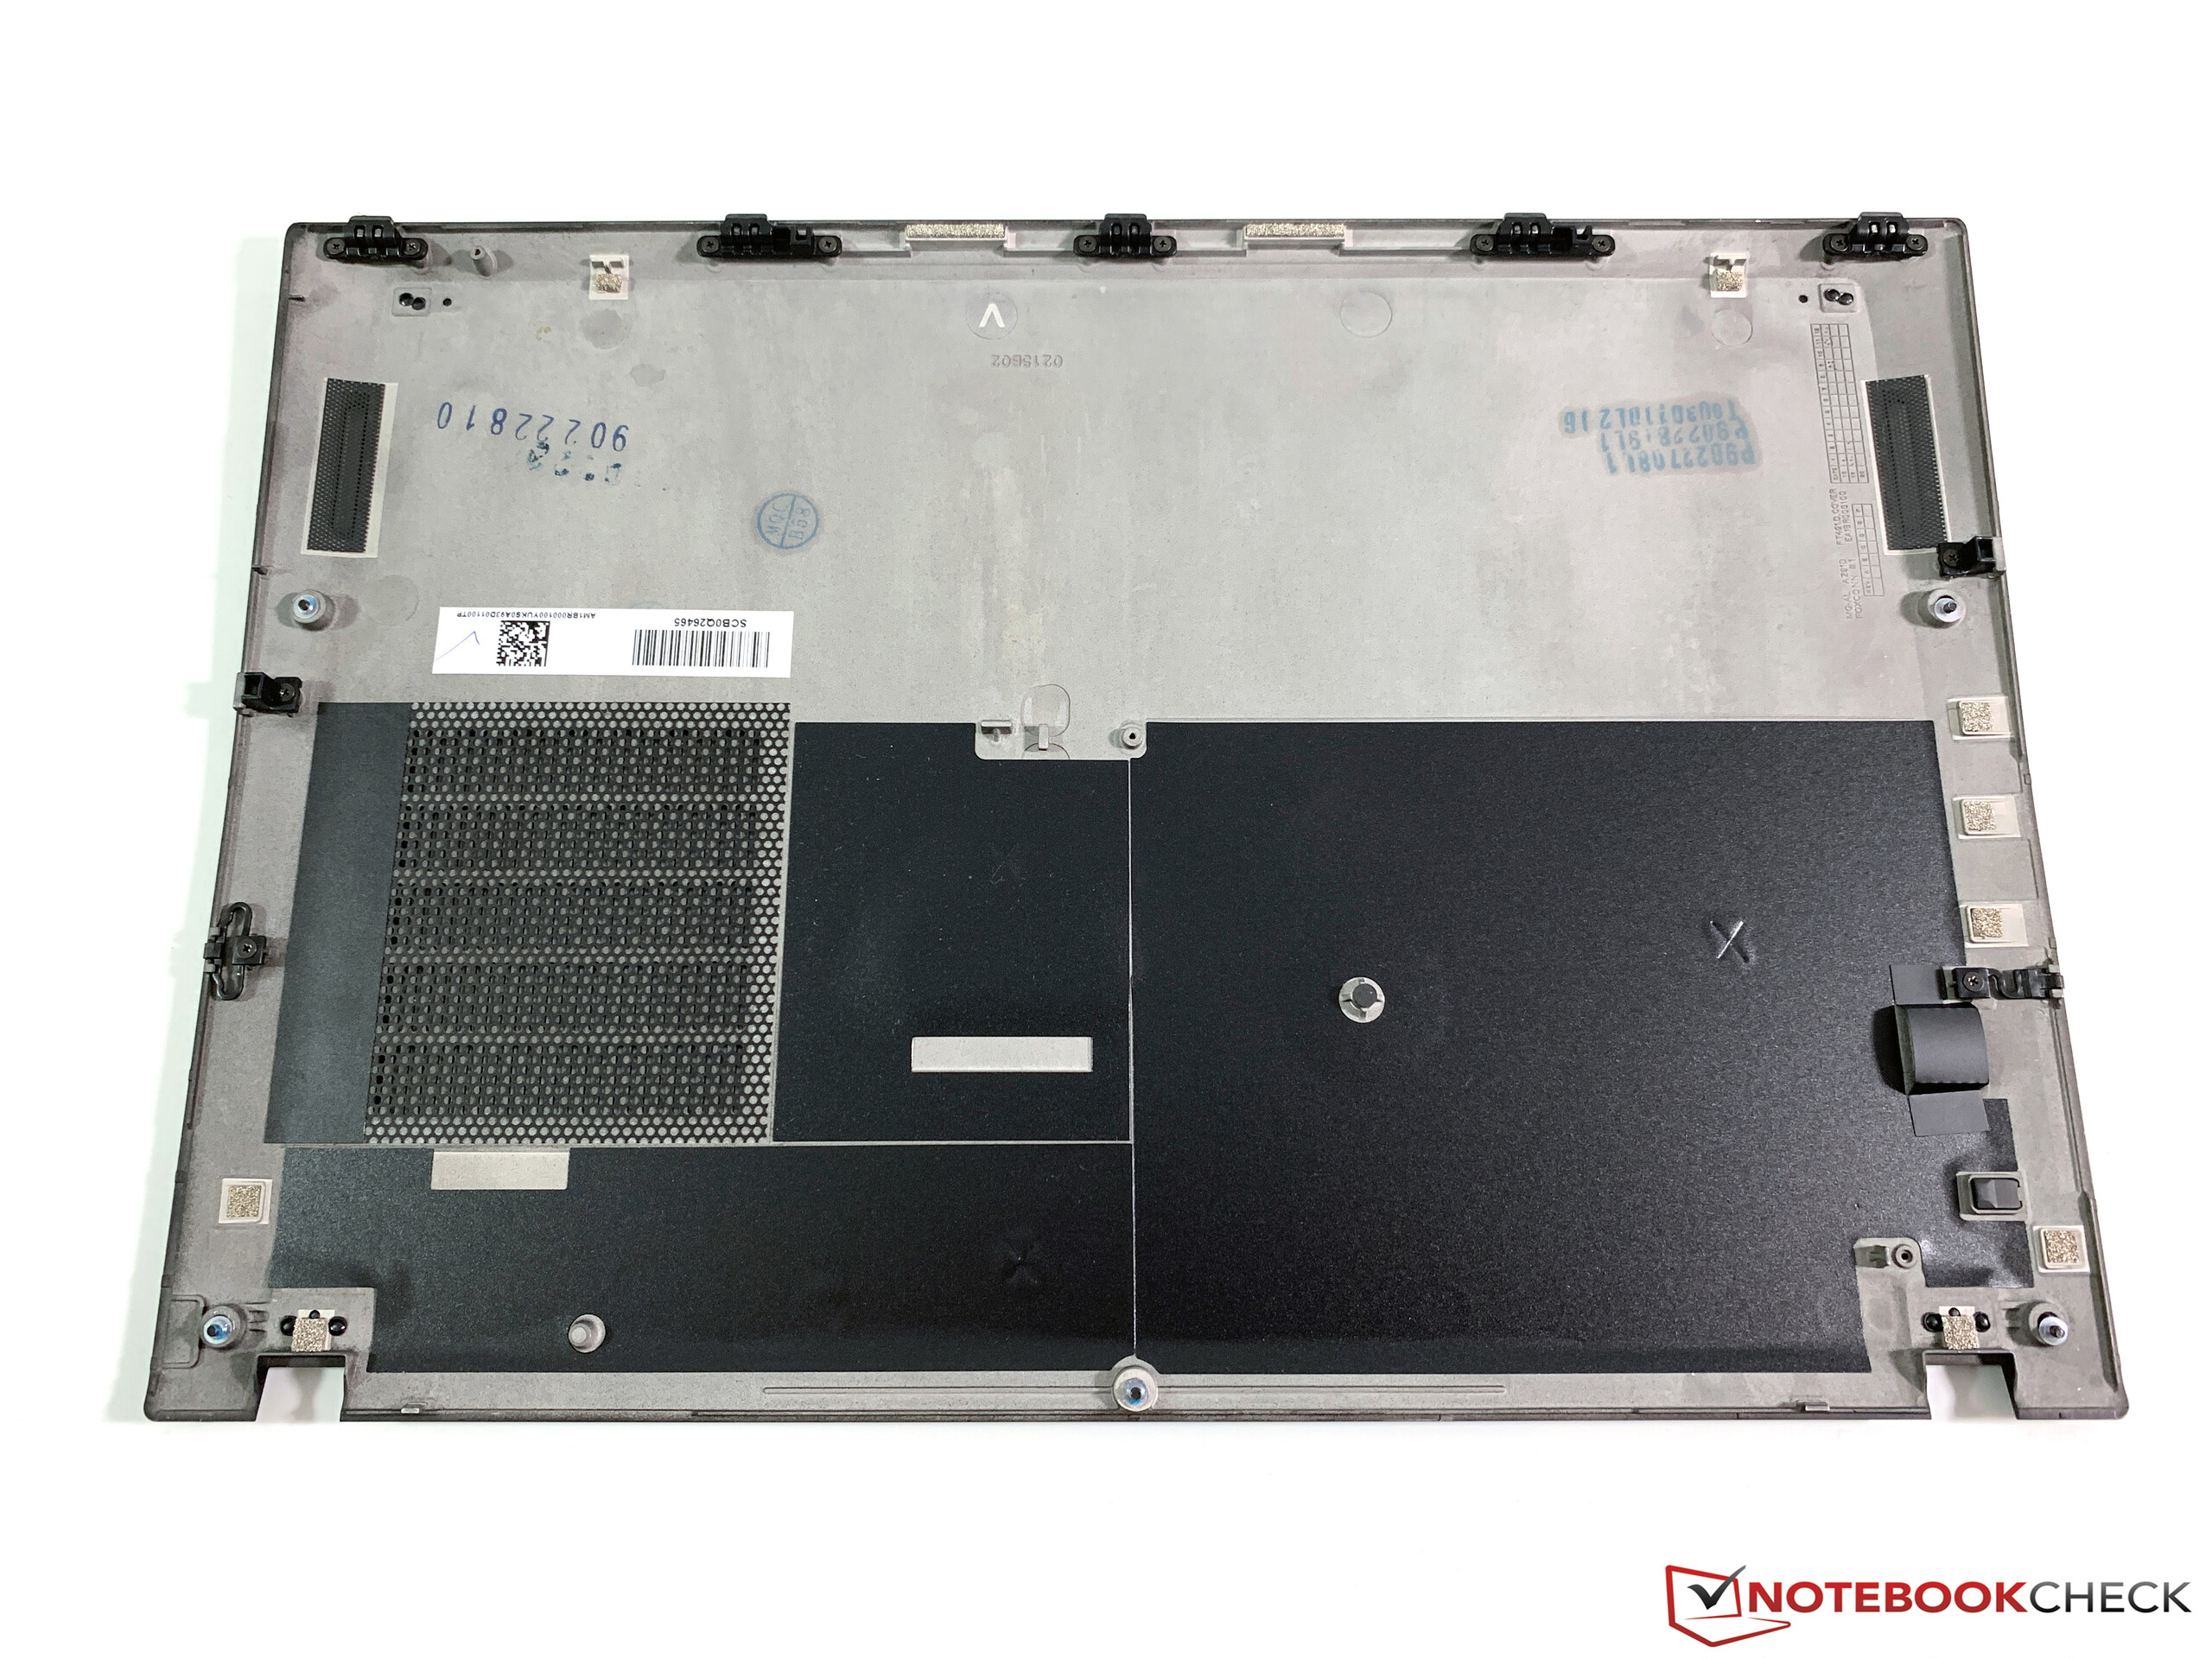
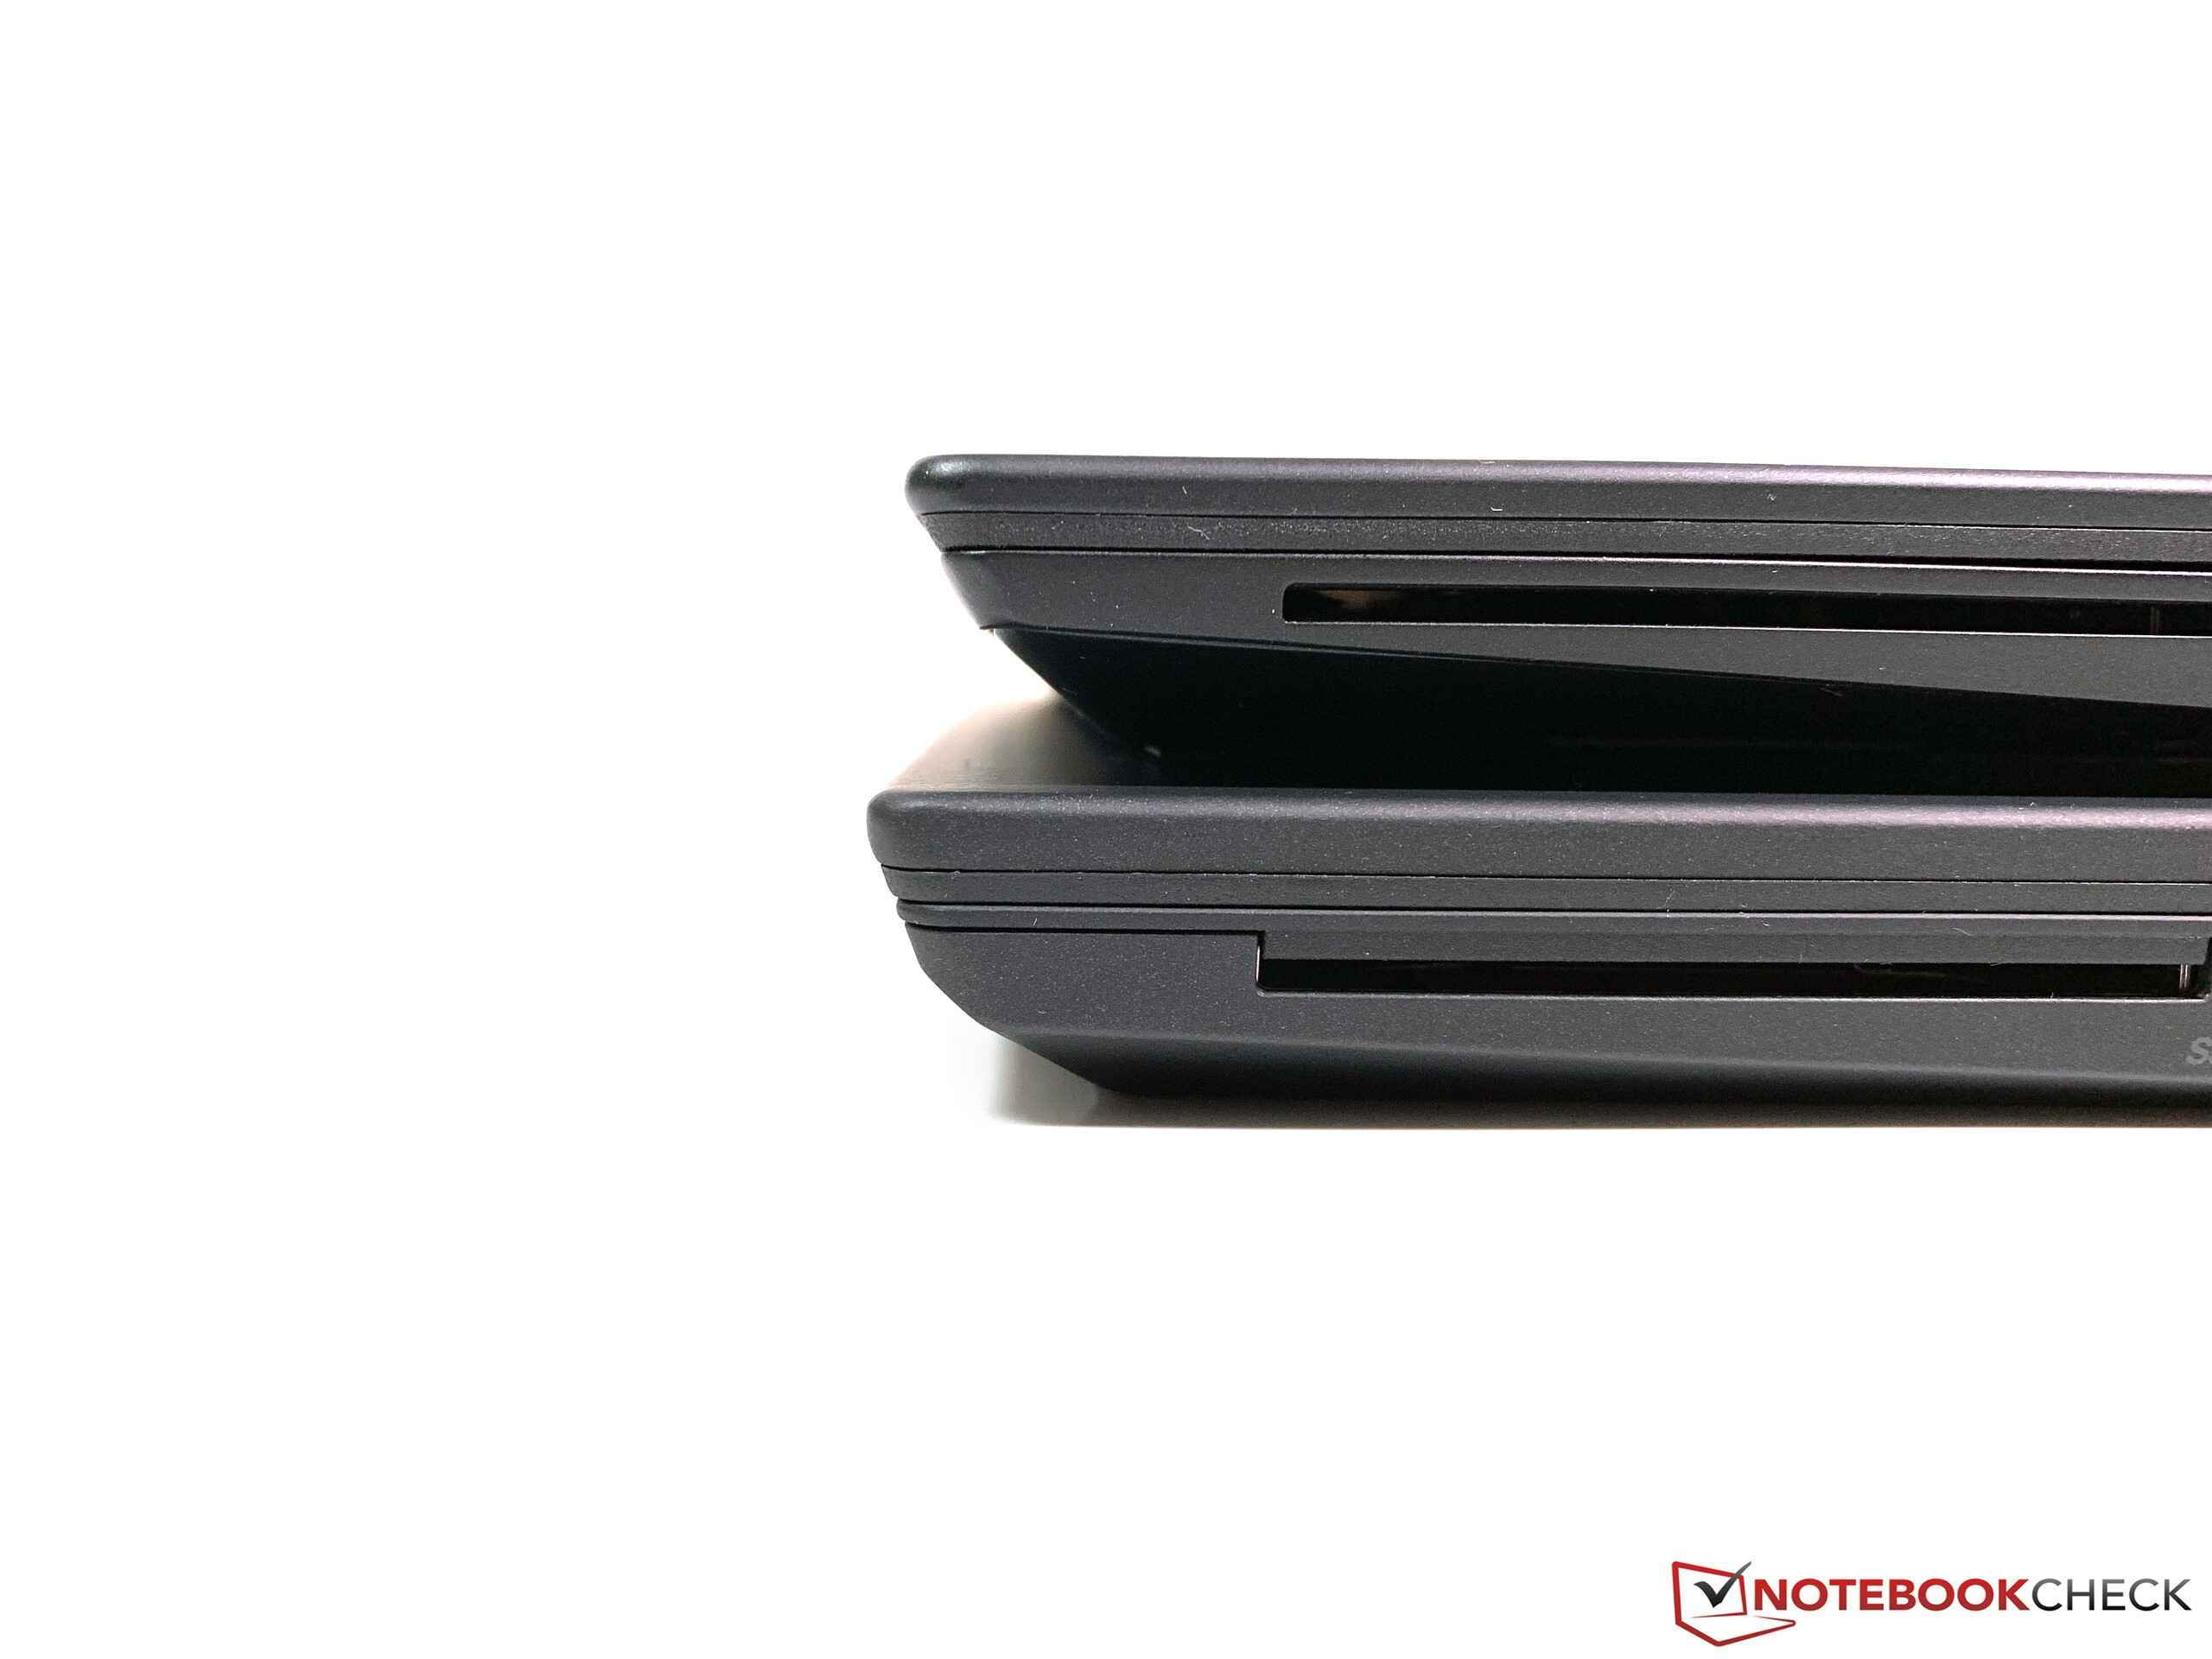
在过去,T4x0s型号通常是普通T4x0的更薄版本,它通常配备更好的组件,并且在性能方面没有落后。这与新款T490有所不同。是的,新机身是成功的,质量也比常规T490高出一截,但T490s在性能上落后。这显然包括图形适配器,因为不再有独立显卡,而且还有处理器性能。后者受制于功率较小的散热方案,甚至性能不如前一代产品。
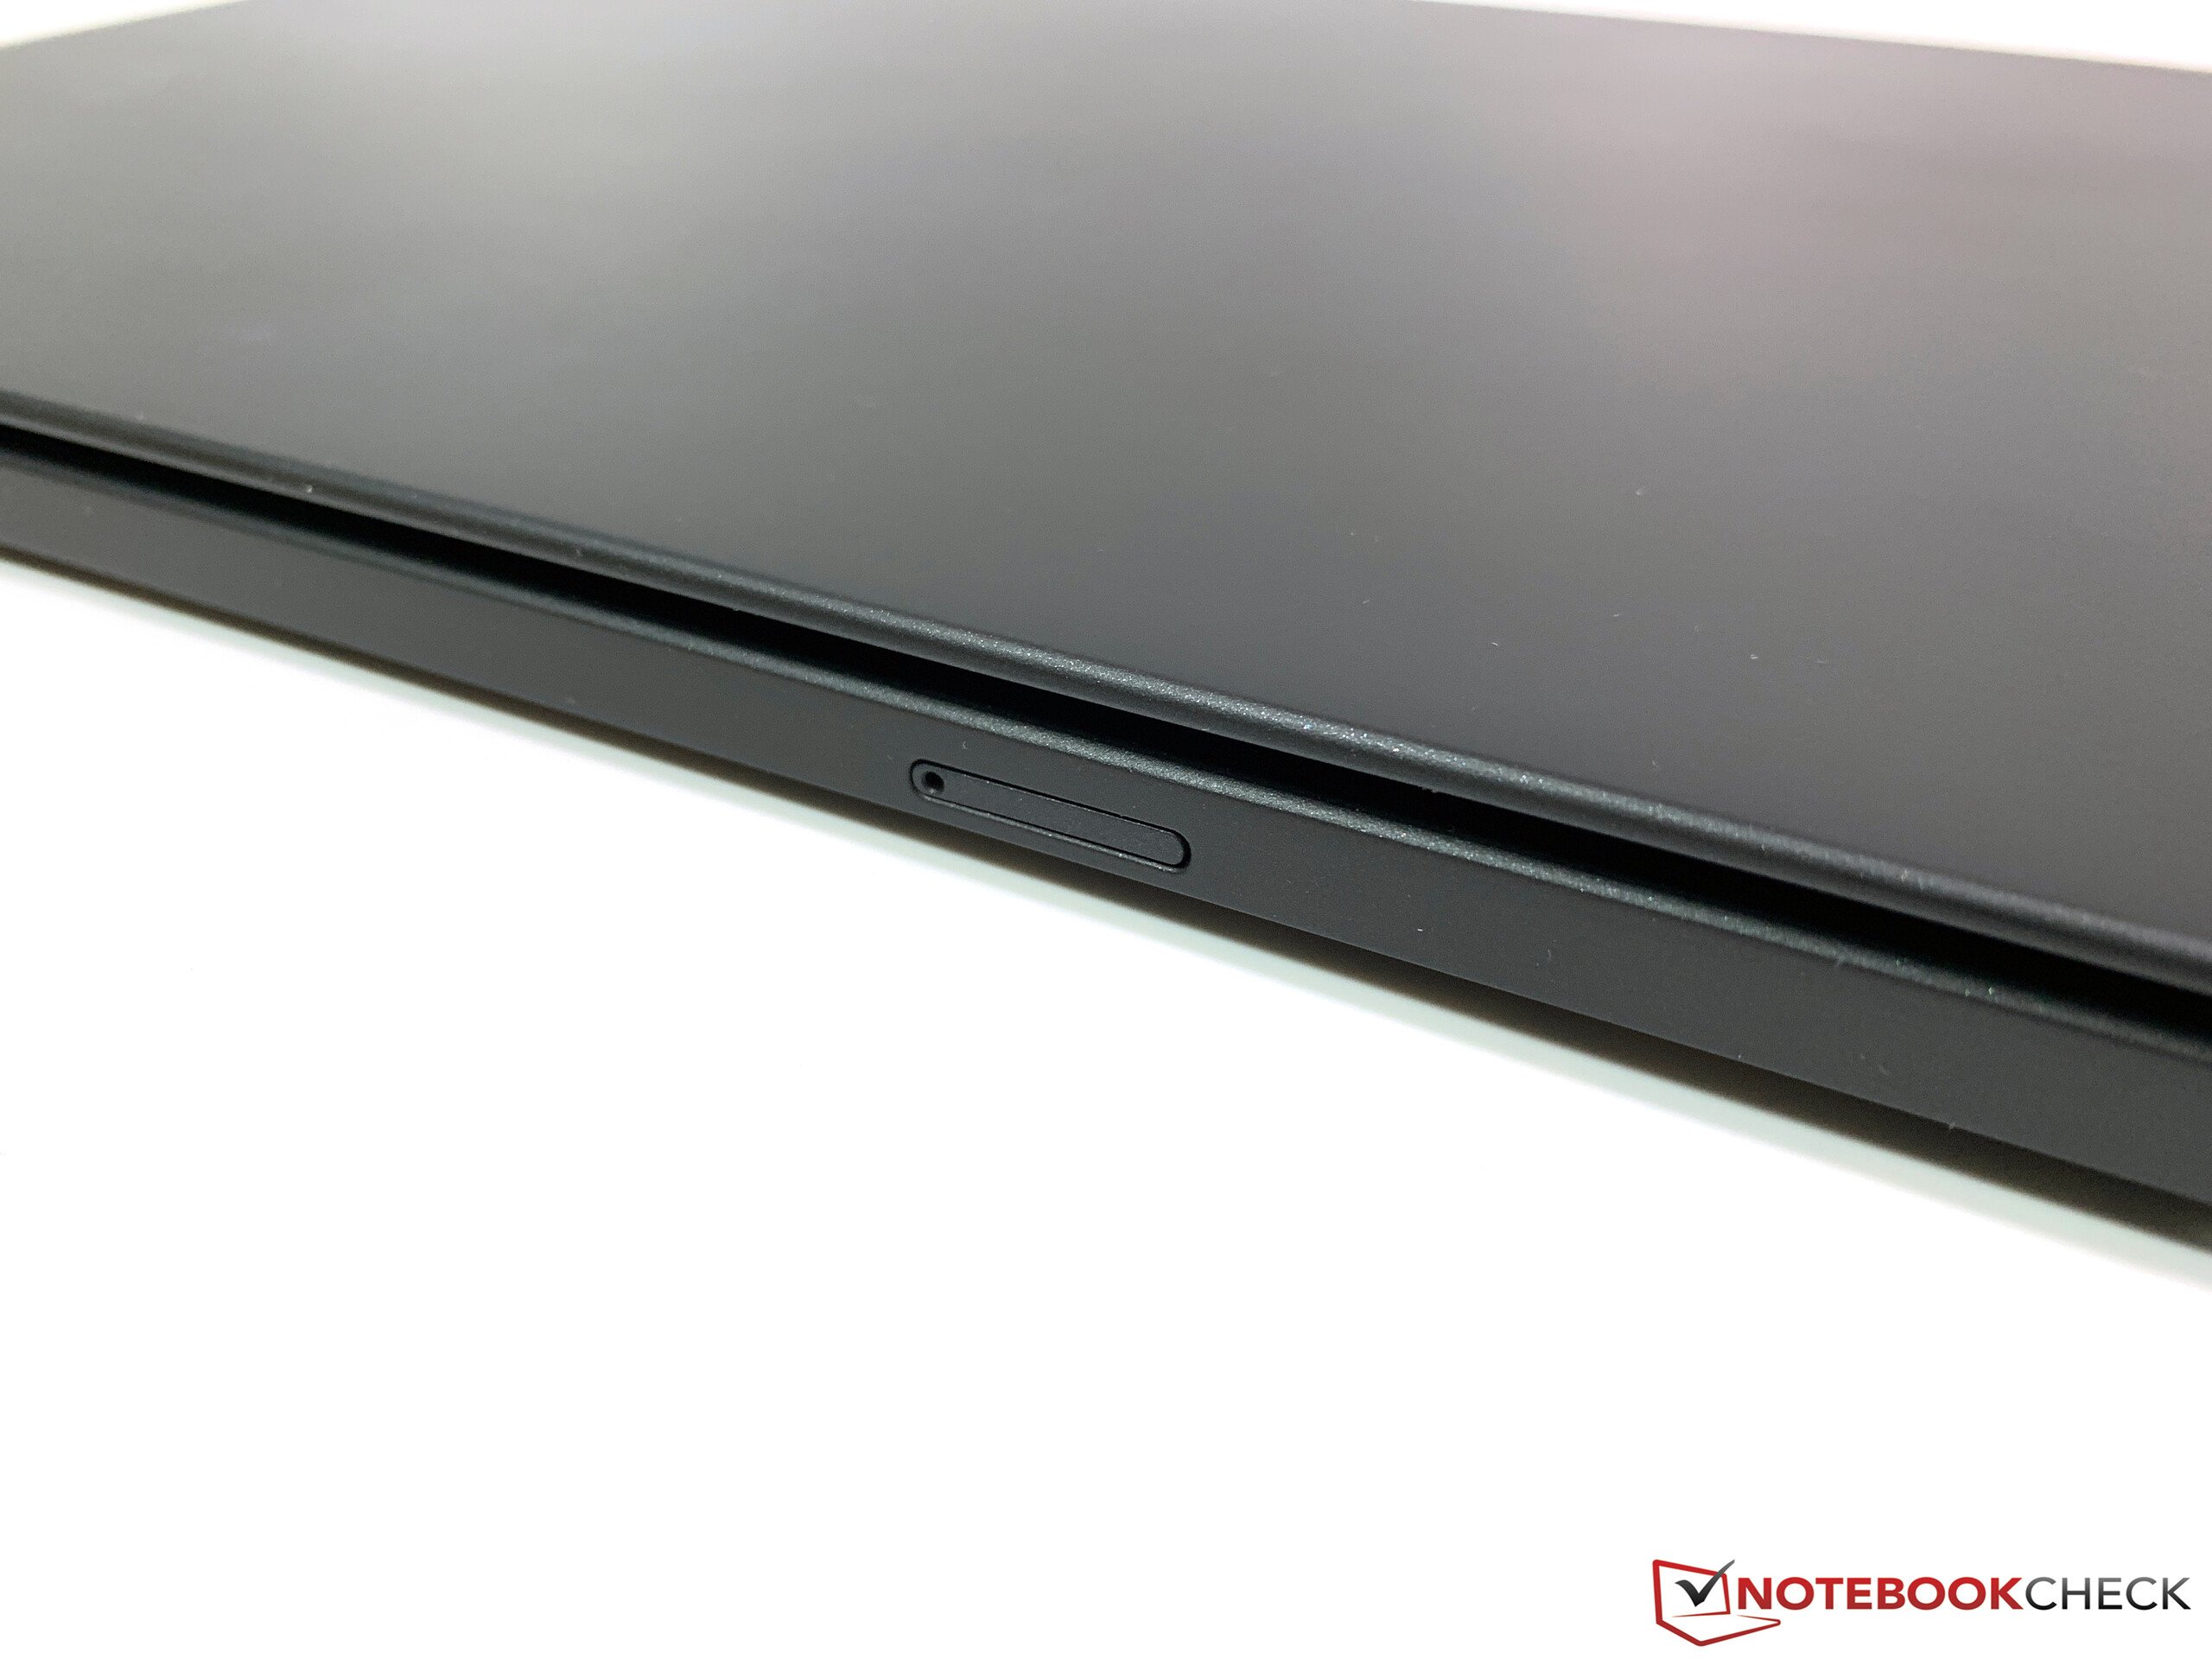
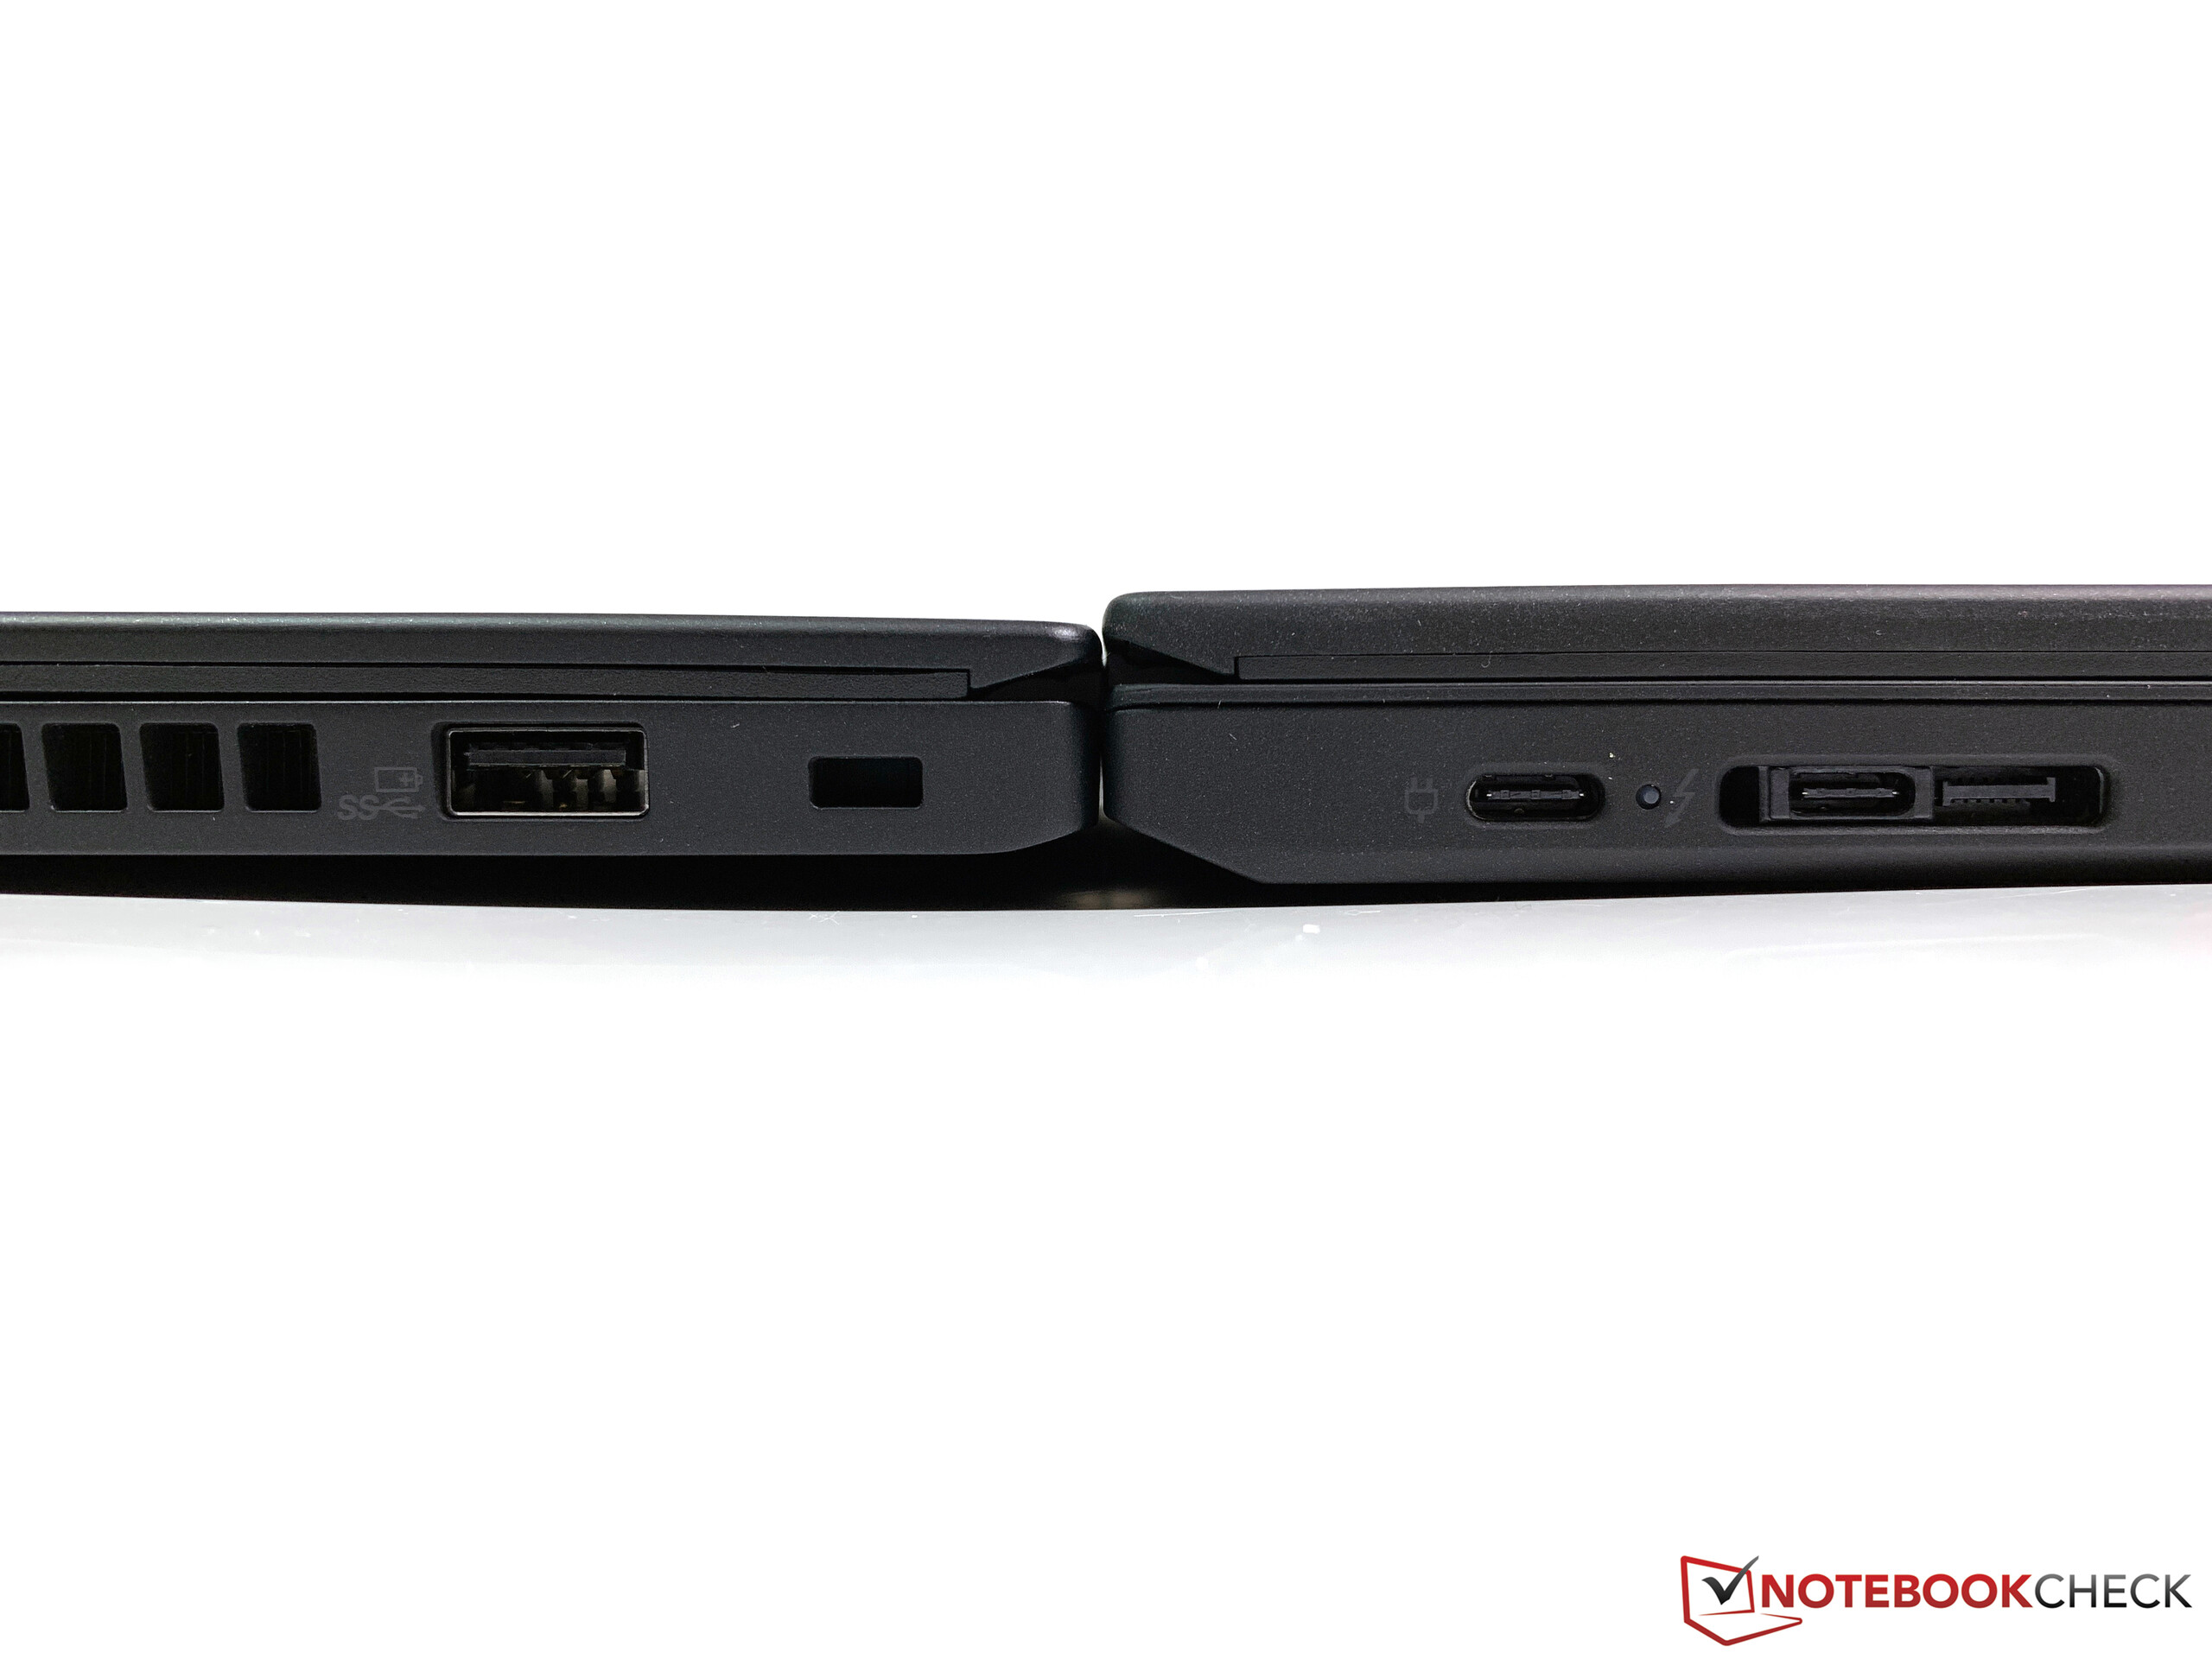
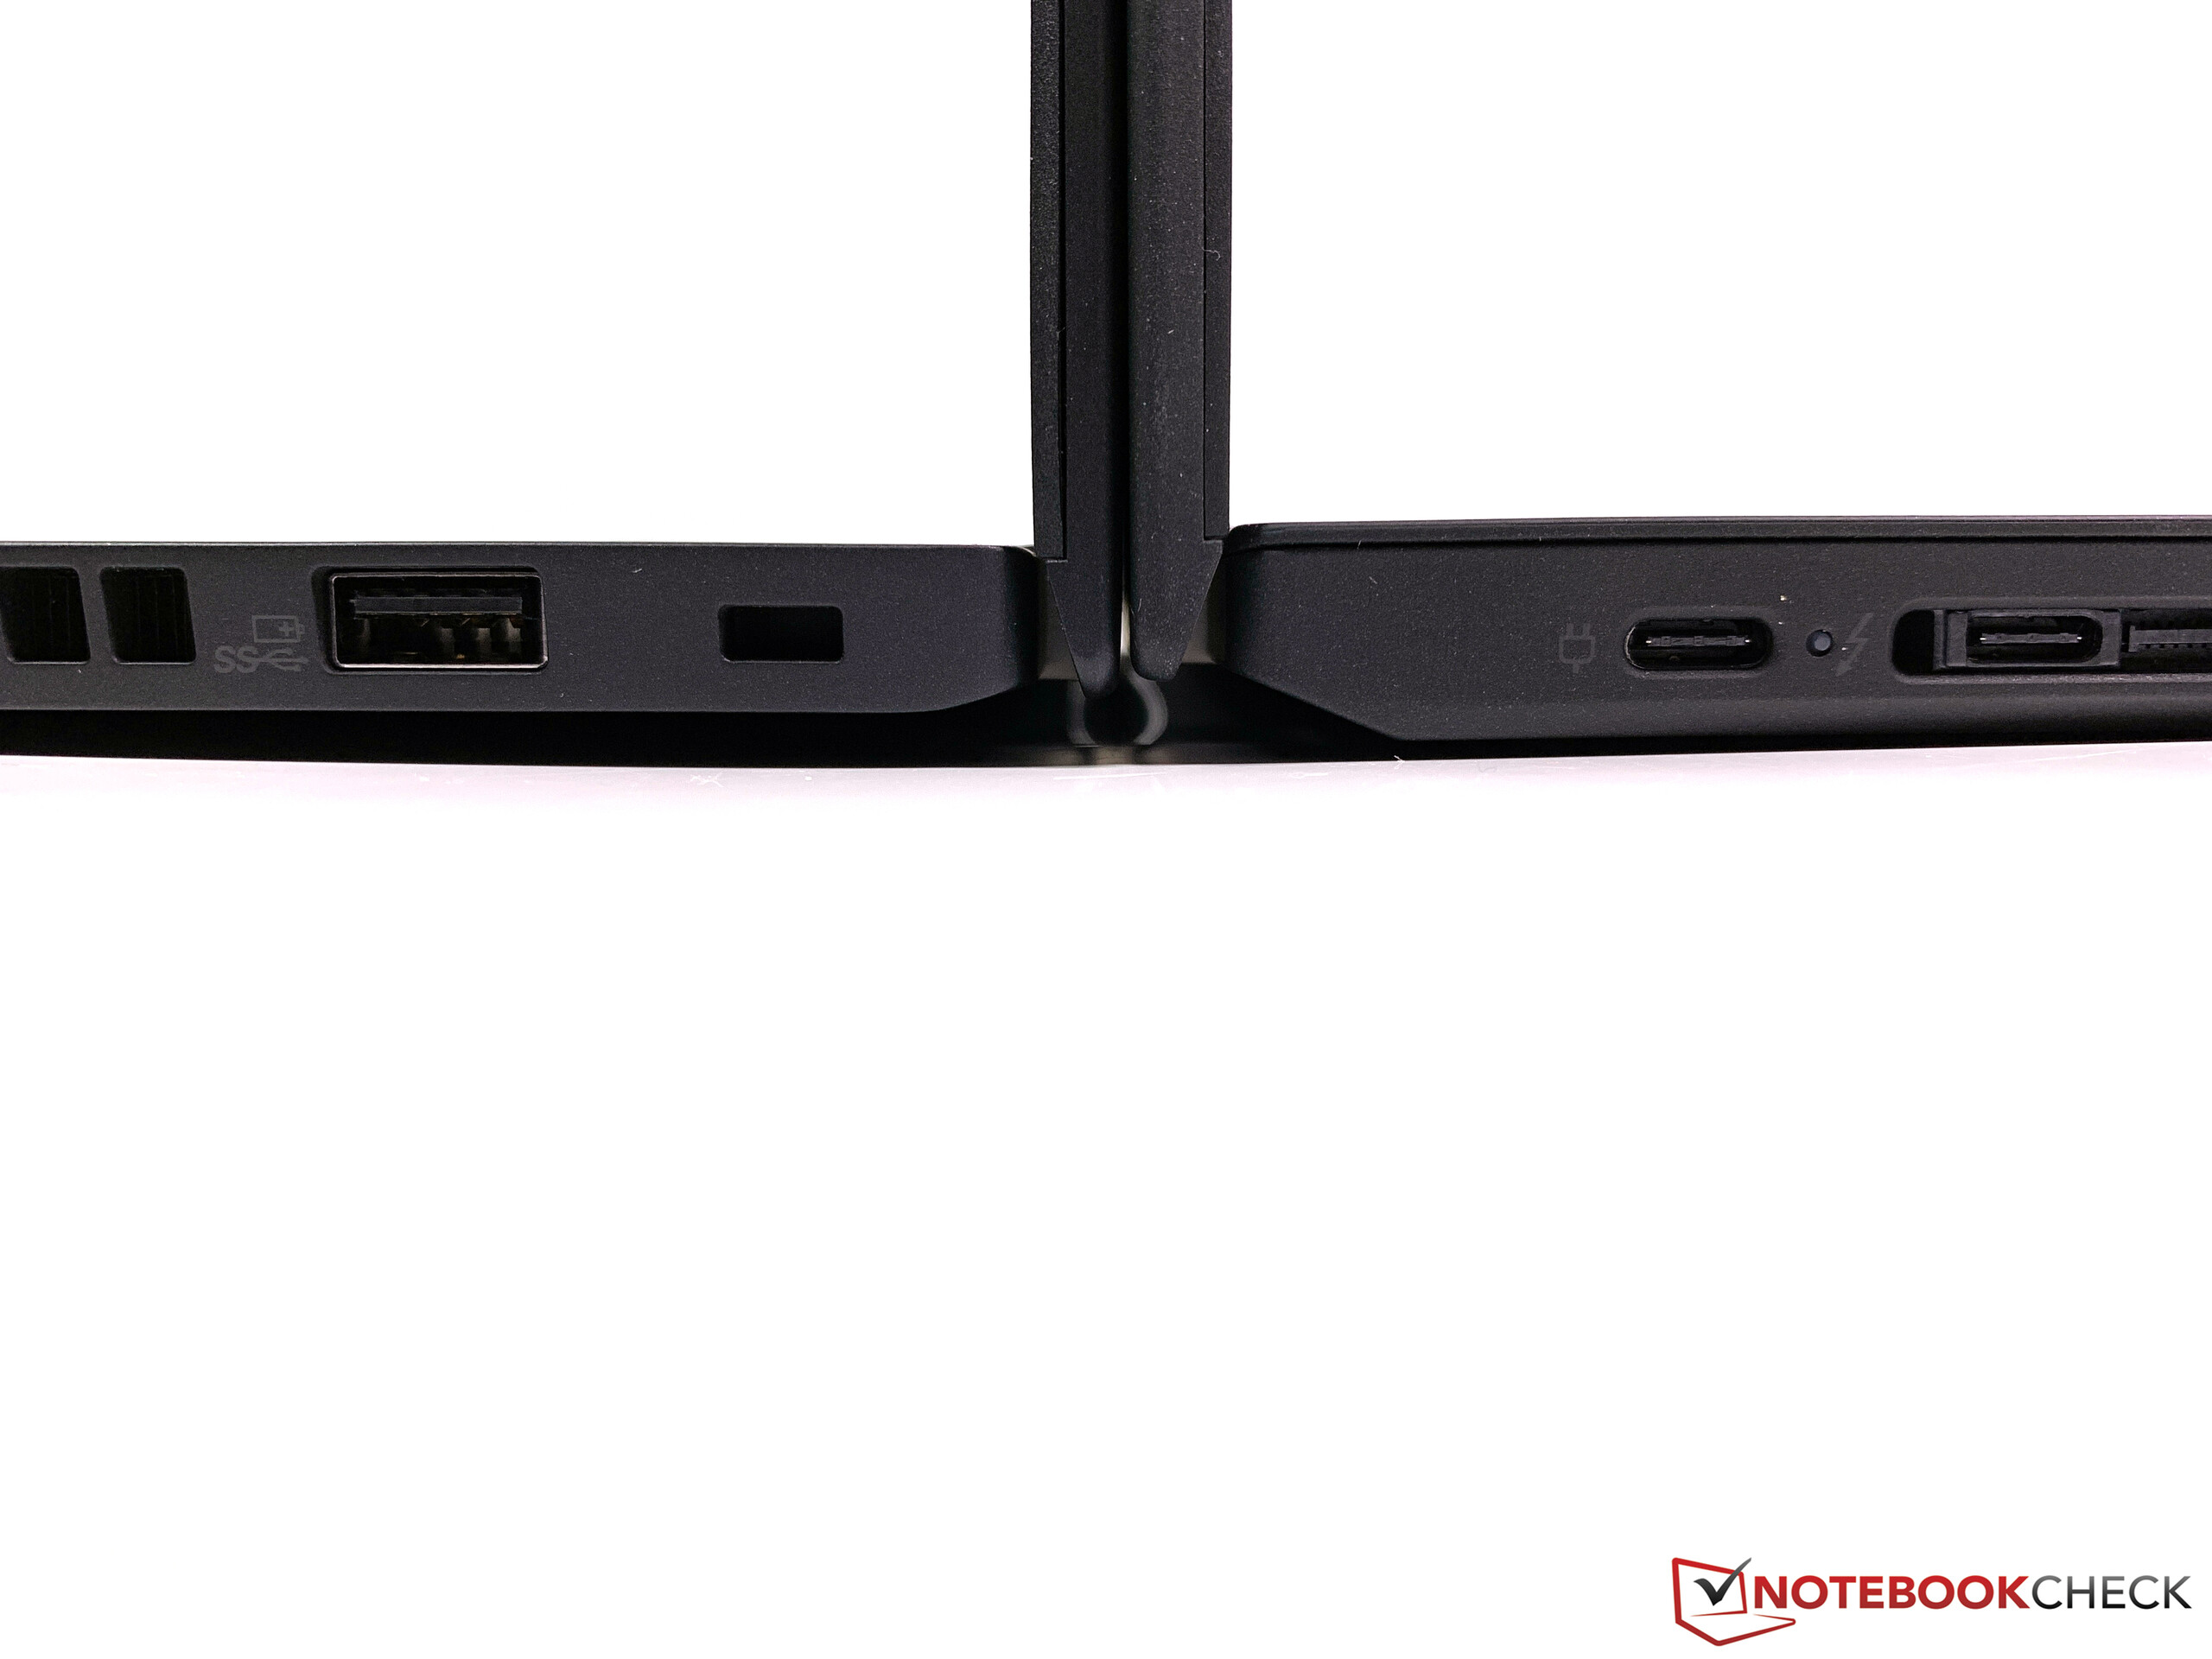
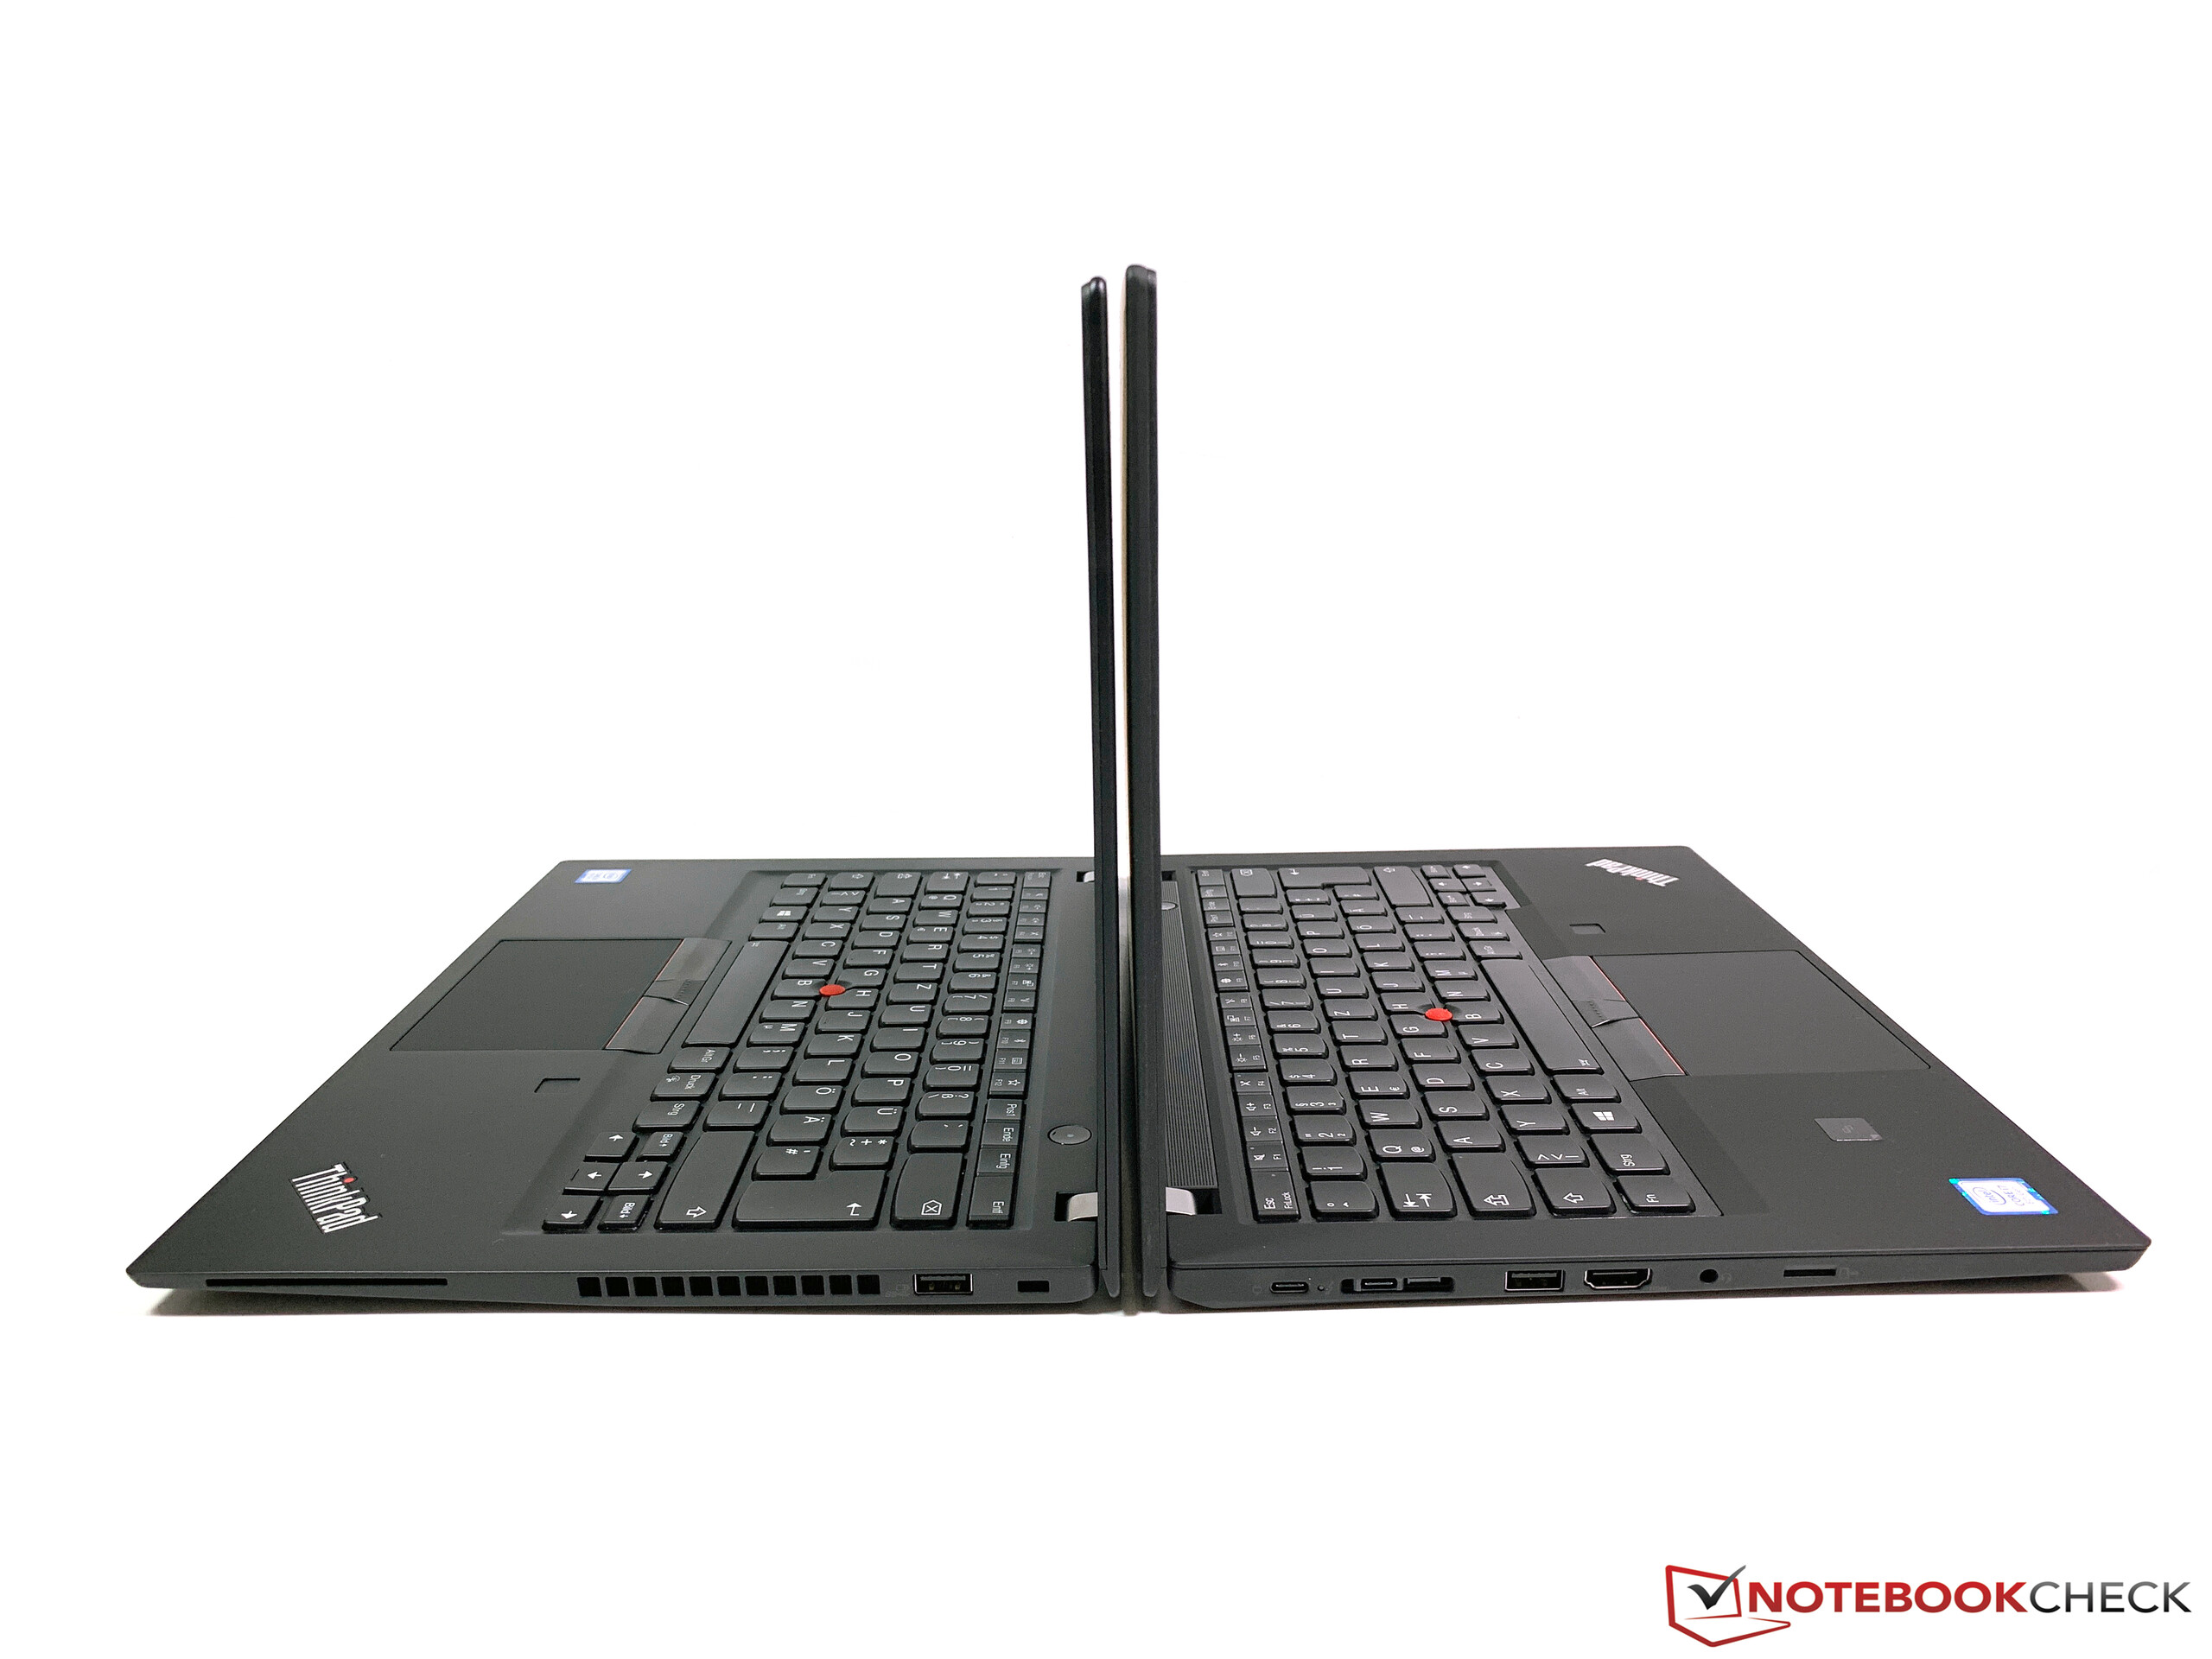
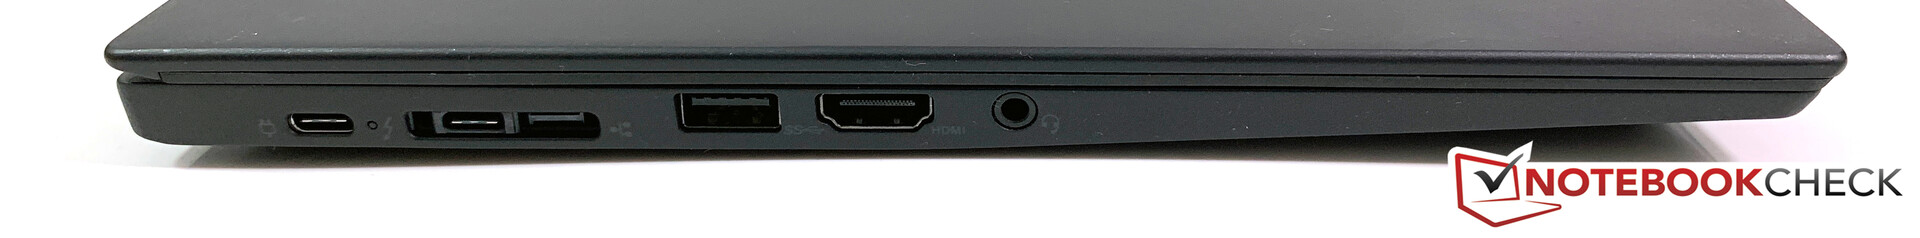
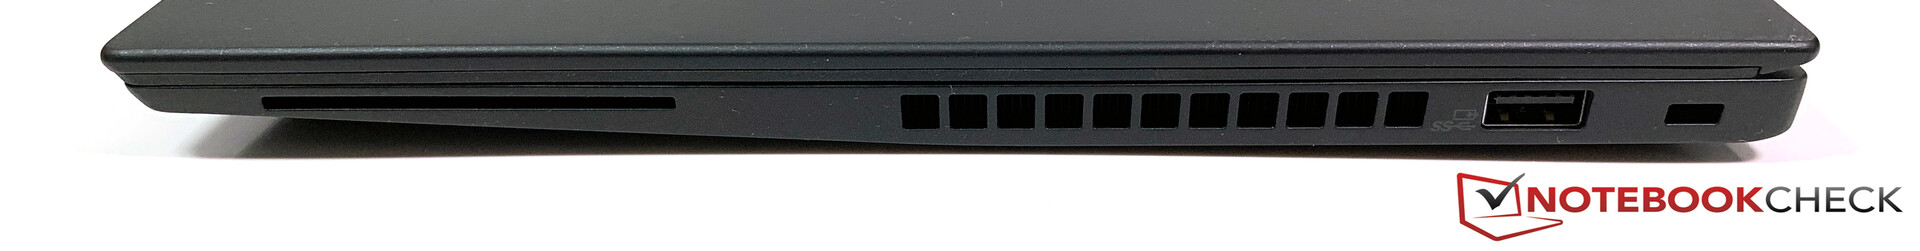
在我们看来,ThinkPad T490s就是一台更便宜的X1 Carbon(或者说是X1 Carbon Lite)。它更大更重,但提供类似的性能以及相同的键盘设计。顺便说一句,键盘的质量与更昂贵的X1 Carbon相当,主观上比T490和戴尔,富士通或惠普的竞争还高出一截。 T490s的接口情况也让我们想起了X1 Carbon,尤其是那microSD读卡器尴尬的位置摆放。
我们很欣赏这次更新的屏幕选项,经过评估的低功耗1080p雾面屏幕给人留下了极大的印象,除了响应时间较慢。我们预计它将成为T490s和普通T490最受欢迎的显示选项。亮度非常好,图像质量受益于高对比度,尽管是雾面屏,但并不存在大果粒现象。该面板还覆盖了较小的sRGB色域,色差非常低,尤其是在校准后。这意味着显示器还可以处理一些图片编辑——如果T490有一个全尺寸的SD读卡器,它甚至可能是摄影师的一个有趣的选择。
更薄的机身,更好的显示屏,更好的键盘,更长的续航时间——更差的CPU性能,没有独立显卡,接口的折衷以及更多有限的维护选项。根据您的期望,新款T490将会很棒或者令人失望。
T490s目前比竞争对手更好,因为它只是商务本领域的一个非常完美的机子。有一些缺点,但其中一些与之前的型号有关,竞争对手也不完美。因此,我们为T490s颁发了编辑选择奖。我们将在接下来的几周内更新竞争对手的阵容,因此排名可能会很快改变。联想可能会为即将到来的AMD同行提供竞争对手。
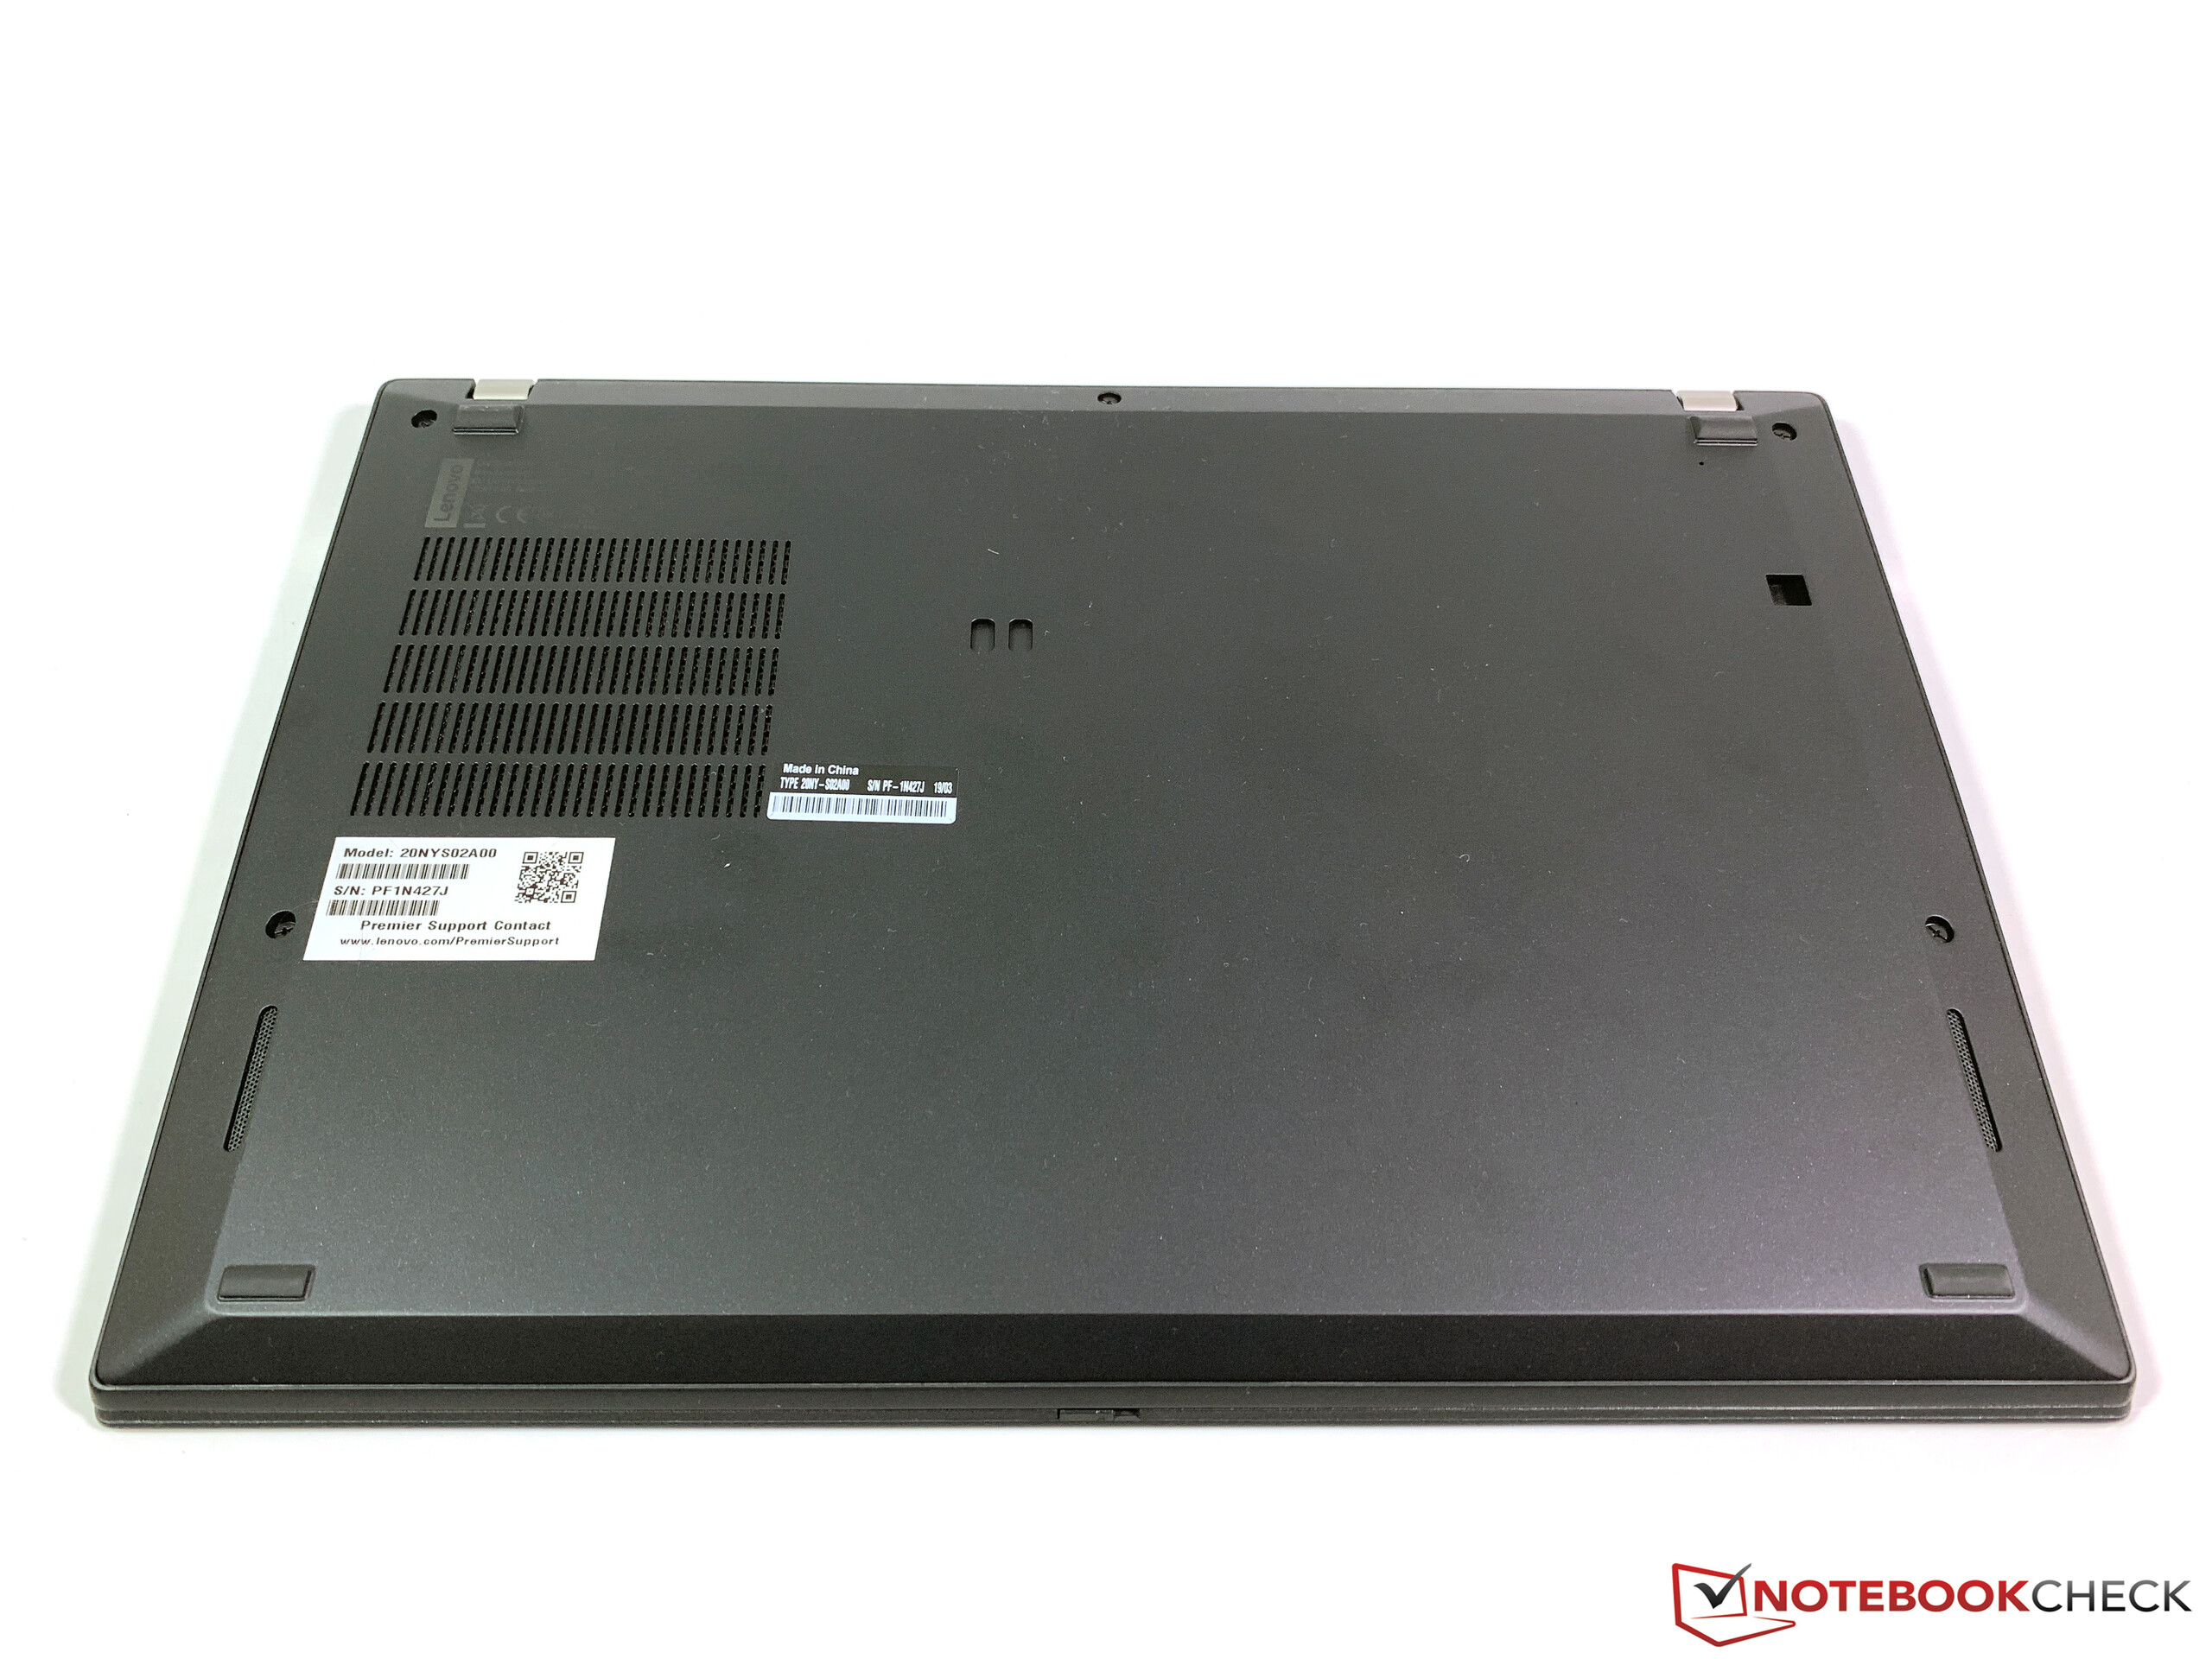
Lenovo ThinkPad T490s-20NYS02A00
- 09/24/2019 v7 (old)
Andreas Osthoff
Price comparison

