联想Tab M10平板电脑评测


| |||||||||||||||||||||||||
Brightness Distribution: 86 %
Center on Battery: 339 cd/m²
Contrast: 807:1 (Black: 0.42 cd/m²)
ΔE ColorChecker Calman: 5.8 | ∀{0.5-29.43 Ø4.71}
ΔE Greyscale Calman: 8.6 | ∀{0.09-98 Ø4.96}
97.8% sRGB (Calman 2D)
Gamma: 2.16
CCT: 8718 K
| Lenovo Tab M10 IPS, 1920x1200, 10.1" | Acer Iconia Tab 10 A3-A50 IPS, 1920x1200, 10.1" | Amazon Fire HD 10 2017 IPS, 1920x1200, 10.1" | Chuwi Hi9 Plus IPS, 2560x1600, 10.8" | Huawei MediaPad T5 10 IPS, 1920x1200, 10.1" | Lenovo Tab P10 IPS, 1920x1200, 10.1" | Samsung Galaxy Tab A 10.5 SM-T590N IPS, 1920x1200, 10.5" | |
|---|---|---|---|---|---|---|---|
| Screen | -4% | 25% | 10% | 22% | 17% | 50% | |
| Brightness middle (cd/m²) | 339 | 340 0% | 426 26% | 308 -9% | 356 5% | 522 54% | 556 64% |
| Brightness (cd/m²) | 327 | 320 -2% | 399 22% | 297 -9% | 340 4% | 495 51% | 514 57% |
| Brightness Distribution (%) | 86 | 84 -2% | 91 6% | 92 7% | 92 7% | 84 -2% | 87 1% |
| Black Level * (cd/m²) | 0.42 | 0.19 55% | 0.38 10% | 0.29 31% | 0.5 -19% | 0.41 2% | 0.42 -0% |
| Contrast (:1) | 807 | 1789 122% | 1121 39% | 1062 32% | 712 -12% | 1273 58% | 1324 64% |
| Colorchecker dE 2000 * | 5.8 | 15 -159% | 4.5 22% | 6.2 -7% | 2.3 60% | 6.7 -16% | 1.8 69% |
| Colorchecker dE 2000 max. * | 11.6 | 22.8 -97% | 7.9 32% | 10.5 9% | 6.5 44% | 12.2 -5% | 3.2 72% |
| Greyscale dE 2000 * | 8.6 | 4 53% | 5.2 40% | 6.6 23% | 1.4 84% | 9.1 -6% | 2.2 74% |
| Gamma | 2.16 102% | 2.09 105% | 2.23 99% | 2.19 100% | 2.16 102% | 2.14 103% | 2.26 97% |
| CCT | 8718 75% | 6940 94% | 6875 95% | 8216 79% | 6565 99% | 9417 69% | 6819 95% |
* ... smaller is better
Screen Flickering / PWM (Pulse-Width Modulation)
| Screen flickering / PWM not detected | 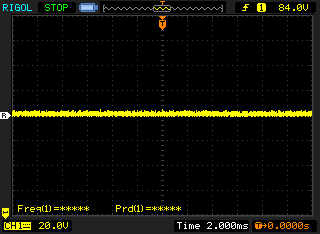 | ||
In comparison: 52 % of all tested devices do not use PWM to dim the display. If PWM was detected, an average of 7747 (minimum: 5 - maximum: 343500) Hz was measured. | |||
Display Response Times
| ↔ Response Time Black to White | ||
|---|---|---|
| 42.4 ms ... rise ↗ and fall ↘ combined | ↗ 21.6 ms rise | 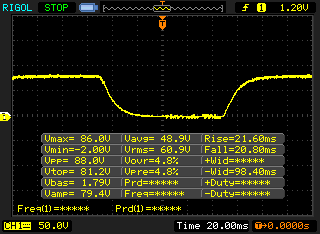 |
| ↘ 20.8 ms fall | ||
| The screen shows slow response rates in our tests and will be unsatisfactory for gamers. In comparison, all tested devices range from 0.1 (minimum) to 240 (maximum) ms. » 98 % of all devices are better. This means that the measured response time is worse than the average of all tested devices (19.8 ms). | ||
| ↔ Response Time 50% Grey to 80% Grey | ||
| 77.6 ms ... rise ↗ and fall ↘ combined | ↗ 39.6 ms rise | 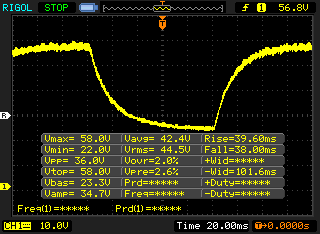 |
| ↘ 38 ms fall | ||
| The screen shows slow response rates in our tests and will be unsatisfactory for gamers. In comparison, all tested devices range from 0.165 (minimum) to 636 (maximum) ms. » 99 % of all devices are better. This means that the measured response time is worse than the average of all tested devices (31 ms). | ||
| AnTuTu v7 - Total Score | |
| Chuwi Hi9 Plus | |
| Huawei MediaPad T5 10 | |
| Amazon Fire HD 10 2017 | |
| Lenovo Tab P10 | |
| Lenovo Tab M10 | |
| Samsung Galaxy Tab A 10.5 SM-T590N | |
| Average Qualcomm Snapdragon 450 (56497 - 73468, n=11) | |
| JetStream 1.1 - 1.1 Total | |
| Acer Iconia Tab 10 A3-A50 (Browser: Chrome Version 63) | |
| Amazon Fire HD 10 2017 (Amazon Silk 61.2) | |
| Chuwi Hi9 Plus (Google Chrome 70) | |
| Huawei MediaPad T5 10 (Chrome 67) | |
| Average Qualcomm Snapdragon 450 (22 - 22.7, n=13) | |
| Lenovo Tab P10 (Chrome 71) | |
| Lenovo Tab M10 (Chrome 71.0.3578.99) | |
| Samsung Galaxy Tab A 10.5 SM-T590N (Chrome 69.0.3497.100) | |
| Octane V2 - Total Score | |
| Average of class Tablet (1633 - 138481, n=70, last 2 years) | |
| Acer Iconia Tab 10 A3-A50 (Browser: Chrome Version 63) | |
| Amazon Fire HD 10 2017 (Amazon Silk 61.2) | |
| Chuwi Hi9 Plus (Chrome 70) | |
| Huawei MediaPad T5 10 (Chrome 67) | |
| Samsung Galaxy Tab A 10.5 SM-T590N (Chrome 69.0.3497.100) | |
| Lenovo Tab P10 (Chrome 71) | |
| Lenovo Tab M10 (Chrome 71.0.3578.99) | |
| Average Qualcomm Snapdragon 450 (3470 - 4115, n=14) | |
| Mozilla Kraken 1.1 - Total | |
| Samsung Galaxy Tab A 10.5 SM-T590N (Chrome 69.0.3497.100) | |
| Average Qualcomm Snapdragon 450 (11012 - 11863, n=14) | |
| Lenovo Tab M10 (Chrome 71.0.3578.99) | |
| Lenovo Tab P10 (Chrome 71) | |
| Huawei MediaPad T5 10 (Chrome 67) | |
| Chuwi Hi9 Plus (Chrome 70) | |
| Amazon Fire HD 10 2017 (Amazon Silk 61.2) | |
| Acer Iconia Tab 10 A3-A50 (Browser: Chrome Version 63) | |
| Average of class Tablet (243 - 16233, n=64, last 2 years) | |
| WebXPRT 3 - Overall | |
| Average of class Tablet (168 - 520, n=10, last 2 years) | |
| Huawei MediaPad T5 10 (Chrome 67) | |
| Lenovo Tab M10 (Chrome 71.0.3578.99) | |
| Samsung Galaxy Tab A 10.5 SM-T590N (Chrome 69.0.3497.100) | |
| Average Qualcomm Snapdragon 450 (28 - 34, n=8) | |
| WebXPRT 2015 - Overall | |
| Amazon Fire HD 10 2017 (Amazon Silk 61.2) | |
| Huawei MediaPad T5 10 (Chrome 67) | |
| Lenovo Tab P10 (Chrome 71) | |
| Lenovo Tab M10 (Chrome 71.0.3578.99) | |
| Samsung Galaxy Tab A 10.5 SM-T590N (Chrome 69.0.3497.100) | |
| Average Qualcomm Snapdragon 450 (90 - 103, n=7) | |
* ... smaller is better
| Lenovo Tab M10 | Acer Iconia Tab 10 A3-A50 | Amazon Fire HD 10 2017 | Chuwi Hi9 Plus | Huawei MediaPad T5 10 | Lenovo Tab P10 | Samsung Galaxy Tab A 10.5 SM-T590N | Average 16 GB eMMC Flash | Average of class Tablet | |
|---|---|---|---|---|---|---|---|---|---|
| AndroBench 3-5 | -12% | 4% | -7% | 118% | 56% | 25% | -35% | 1724% | |
| Sequential Read 256KB (MB/s) | 279.9 | 173.7 -38% | 262.2 -6% | 145 -48% | 312.2 12% | 276.7 -1% | 285.6 2% | 164.5 ? -41% | 2073 ? 641% |
| Sequential Write 256KB (MB/s) | 52.6 | 92.4 76% | 147.7 181% | 132.5 152% | 83.8 59% | 205.7 291% | 103.3 96% | 43 ? -18% | 1667 ? 3069% |
| Random Read 4KB (MB/s) | 52.5 | 13.7 -74% | 27.72 -47% | 42.2 -20% | 76.7 46% | 53.9 3% | 71.1 35% | 21.7 ? -59% | 275 ? 424% |
| Random Write 4KB (MB/s) | 11.32 | 8.77 -23% | 9.37 -17% | 13.01 15% | 76.1 572% | 15.75 39% | 13.39 18% | 8.08 ? -29% | 324 ? 2762% |
| Sequential Read 256KB SDCard (MB/s) | 83.5 ? | 80.4 ? -4% | 55.5 ? -34% | 21.16 -75% | 83.9 ? 0% | 84.3 ? 1% | 80.6 ? -3% | 59.1 ? -29% | |
| Sequential Write 256KB SDCard (MB/s) | 61.2 ? | 56.8 ? -7% | 30.14 ? -51% | 20.44 -67% | 72.5 ? 18% | 61 ? 0% | 60.4 ? -1% | 39.8 ? -35% |
Dead Trigger 2
Asphalt 9: Legends (Graphics: High)
Asphalt 9: Legends (Graphics: Normal)
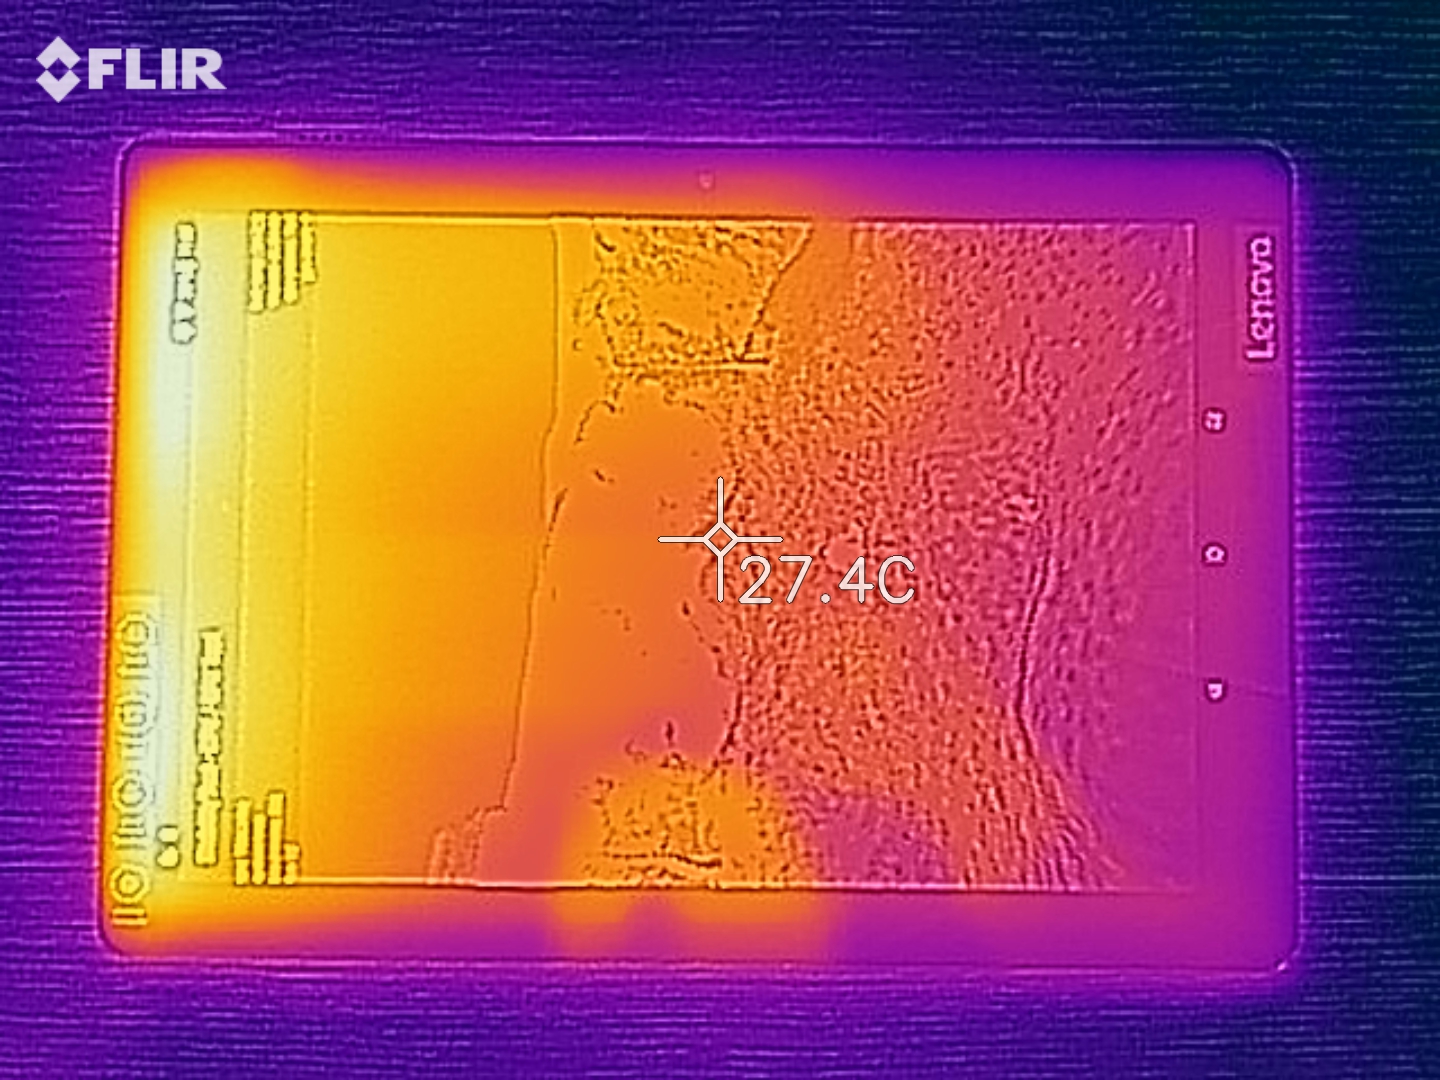
(+) The maximum temperature on the upper side is 31.8 °C / 89 F, compared to the average of 33.7 °C / 93 F, ranging from 20.7 to 53.2 °C for the class Tablet.
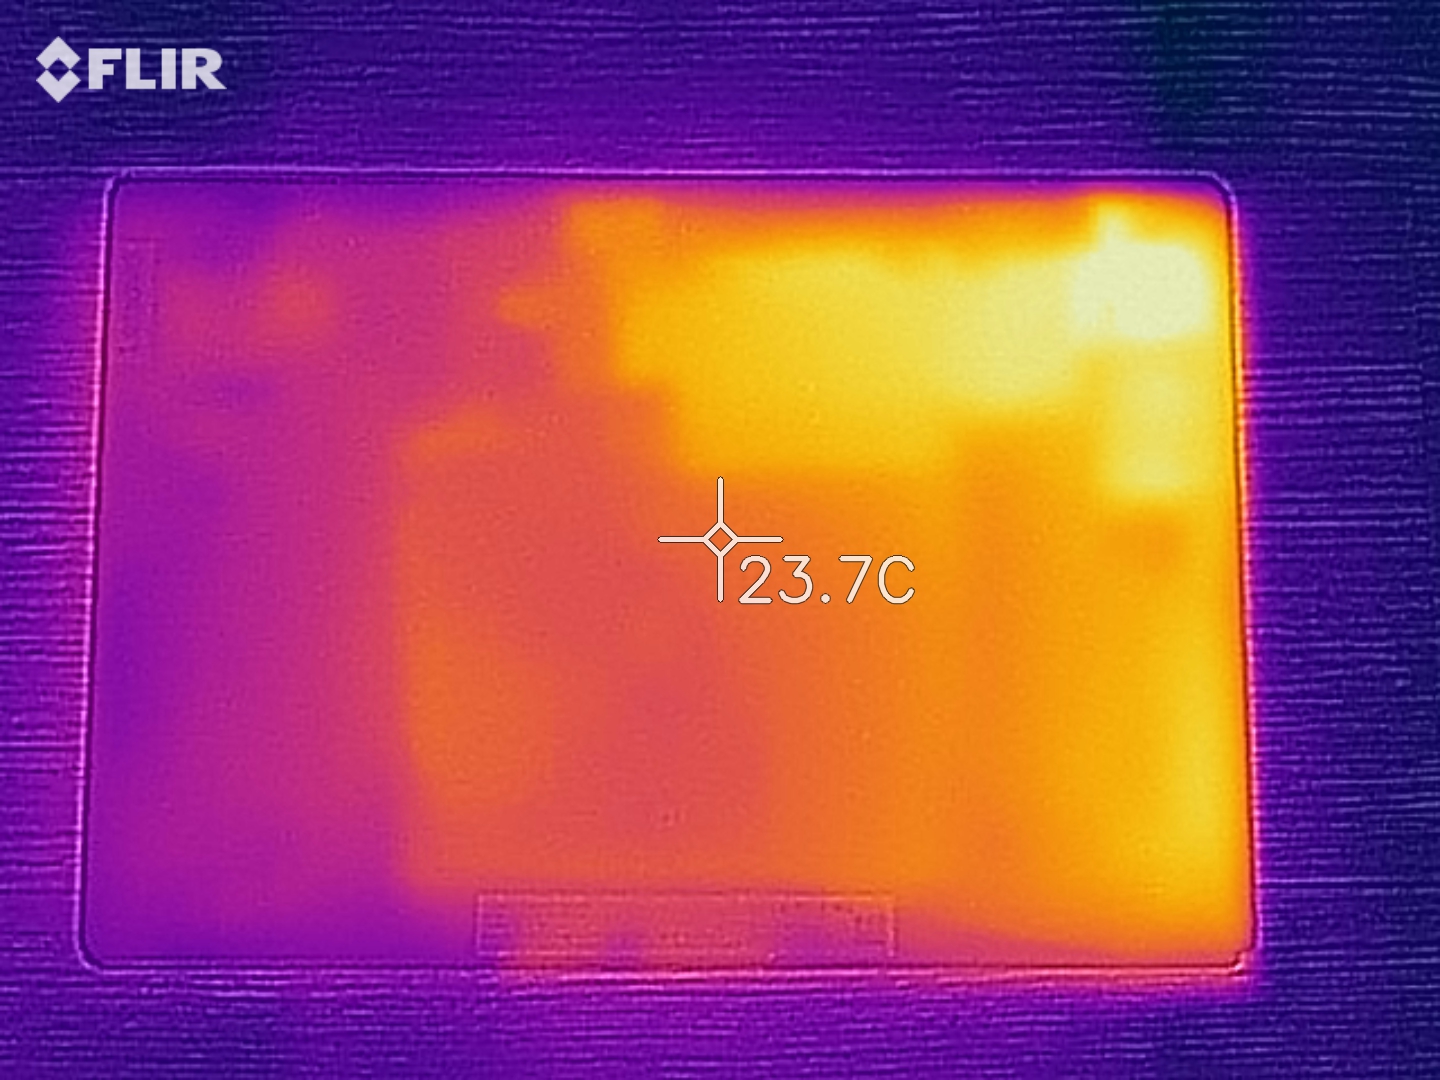
(+) The bottom heats up to a maximum of 29.4 °C / 85 F, compared to the average of 33.2 °C / 92 F
(+) In idle usage, the average temperature for the upper side is 27.3 °C / 81 F, compared to the device average of 30 °C / 86 F.
Lenovo Tab M10 audio analysis
(+) | speakers can play relatively loud (88 dB)
Bass 100 - 315 Hz
(-) | nearly no bass - on average 26.5% lower than median
(±) | linearity of bass is average (8.5% delta to prev. frequency)
Mids 400 - 2000 Hz
(+) | balanced mids - only 4.6% away from median
(+) | mids are linear (5.3% delta to prev. frequency)
Highs 2 - 16 kHz
(±) | higher highs - on average 7.5% higher than median
(+) | highs are linear (3.5% delta to prev. frequency)
Overall 100 - 16.000 Hz
(±) | linearity of overall sound is average (20.5% difference to median)
Compared to same class
» 59% of all tested devices in this class were better, 8% similar, 33% worse
» The best had a delta of 7%, average was 20%, worst was 129%
Compared to all devices tested
» 54% of all tested devices were better, 8% similar, 38% worse
» The best had a delta of 4%, average was 23%, worst was 134%
Lenovo Tab P10 audio analysis
(+) | speakers can play relatively loud (87.6 dB)
Bass 100 - 315 Hz
(-) | nearly no bass - on average 24.7% lower than median
(±) | linearity of bass is average (9.7% delta to prev. frequency)
Mids 400 - 2000 Hz
(+) | balanced mids - only 4.4% away from median
(+) | mids are linear (5.9% delta to prev. frequency)
Highs 2 - 16 kHz
(+) | balanced highs - only 3.3% away from median
(+) | highs are linear (5% delta to prev. frequency)
Overall 100 - 16.000 Hz
(±) | linearity of overall sound is average (17.3% difference to median)
Compared to same class
» 43% of all tested devices in this class were better, 5% similar, 52% worse
» The best had a delta of 7%, average was 20%, worst was 129%
Compared to all devices tested
» 32% of all tested devices were better, 8% similar, 59% worse
» The best had a delta of 4%, average was 23%, worst was 134%
| Off / Standby | |
| Idle | |
| Load |
|
Key:
min: | |
| Lenovo Tab M10 4850 mAh | Acer Iconia Tab 10 A3-A50 6100 mAh | Amazon Fire HD 10 2017 6300 mAh | Chuwi Hi9 Plus 7000 mAh | Huawei MediaPad T5 10 5100 mAh | Lenovo Tab P10 7000 mAh | Samsung Galaxy Tab A 10.5 SM-T590N 7300 mAh | |
|---|---|---|---|---|---|---|---|
| Power Consumption | -81% | -21% | -57% | -96% | 4% | -1% | |
| Idle Minimum * (Watt) | 0.98 | 3.21 -228% | 1.55 -58% | 2.18 -122% | 2.33 -138% | 1.01 -3% | 1.26 -29% |
| Idle Average * (Watt) | 4.45 | 5.97 -34% | 4.17 6% | 5.29 -19% | 8.46 -90% | 4.16 7% | 4.22 5% |
| Idle Maximum * (Watt) | 4.51 | 6.19 -37% | 4.25 6% | 5.37 -19% | 8.49 -88% | 4.17 8% | 4.29 5% |
| Load Average * (Watt) | 5.78 | 9.72 -68% | 7.13 -23% | 8.56 -48% | 11.14 -93% | 5.45 6% | 5.48 5% |
| Load Maximum * (Watt) | 7.18 | 9.97 -39% | 9.63 -34% | 12.86 -79% | 12.3 -71% | 6.9 4% | 6.57 8% |
* ... smaller is better
| Lenovo Tab M10 4850 mAh | Acer Iconia Tab 10 A3-A50 6100 mAh | Amazon Fire HD 10 2017 6300 mAh | Chuwi Hi9 Plus 7000 mAh | Huawei MediaPad T5 10 5100 mAh | Lenovo Tab P10 7000 mAh | Samsung Galaxy Tab A 10.5 SM-T590N 7300 mAh | |
|---|---|---|---|---|---|---|---|
| Battery runtime | -34% | -5% | -18% | 37% | 37% | 59% | |
| Reader / Idle (h) | 21.5 | 12.3 -43% | 16 -26% | 20.7 -4% | 55.5 158% | 21.9 2% | 32.7 52% |
| H.264 (h) | 9.9 | 9.8 -1% | 9.7 -2% | 15.2 54% | 16.1 63% | ||
| WiFi v1.3 (h) | 9.7 | 6.5 -33% | 9 -7% | 10.6 9% | 8.8 -9% | 16.5 70% | 15.6 61% |
| Load (h) | 4 | 2.9 -27% | 4.6 15% | 1.6 -60% | 4 0% | 4.8 20% | 6.4 60% |
Pros
Cons
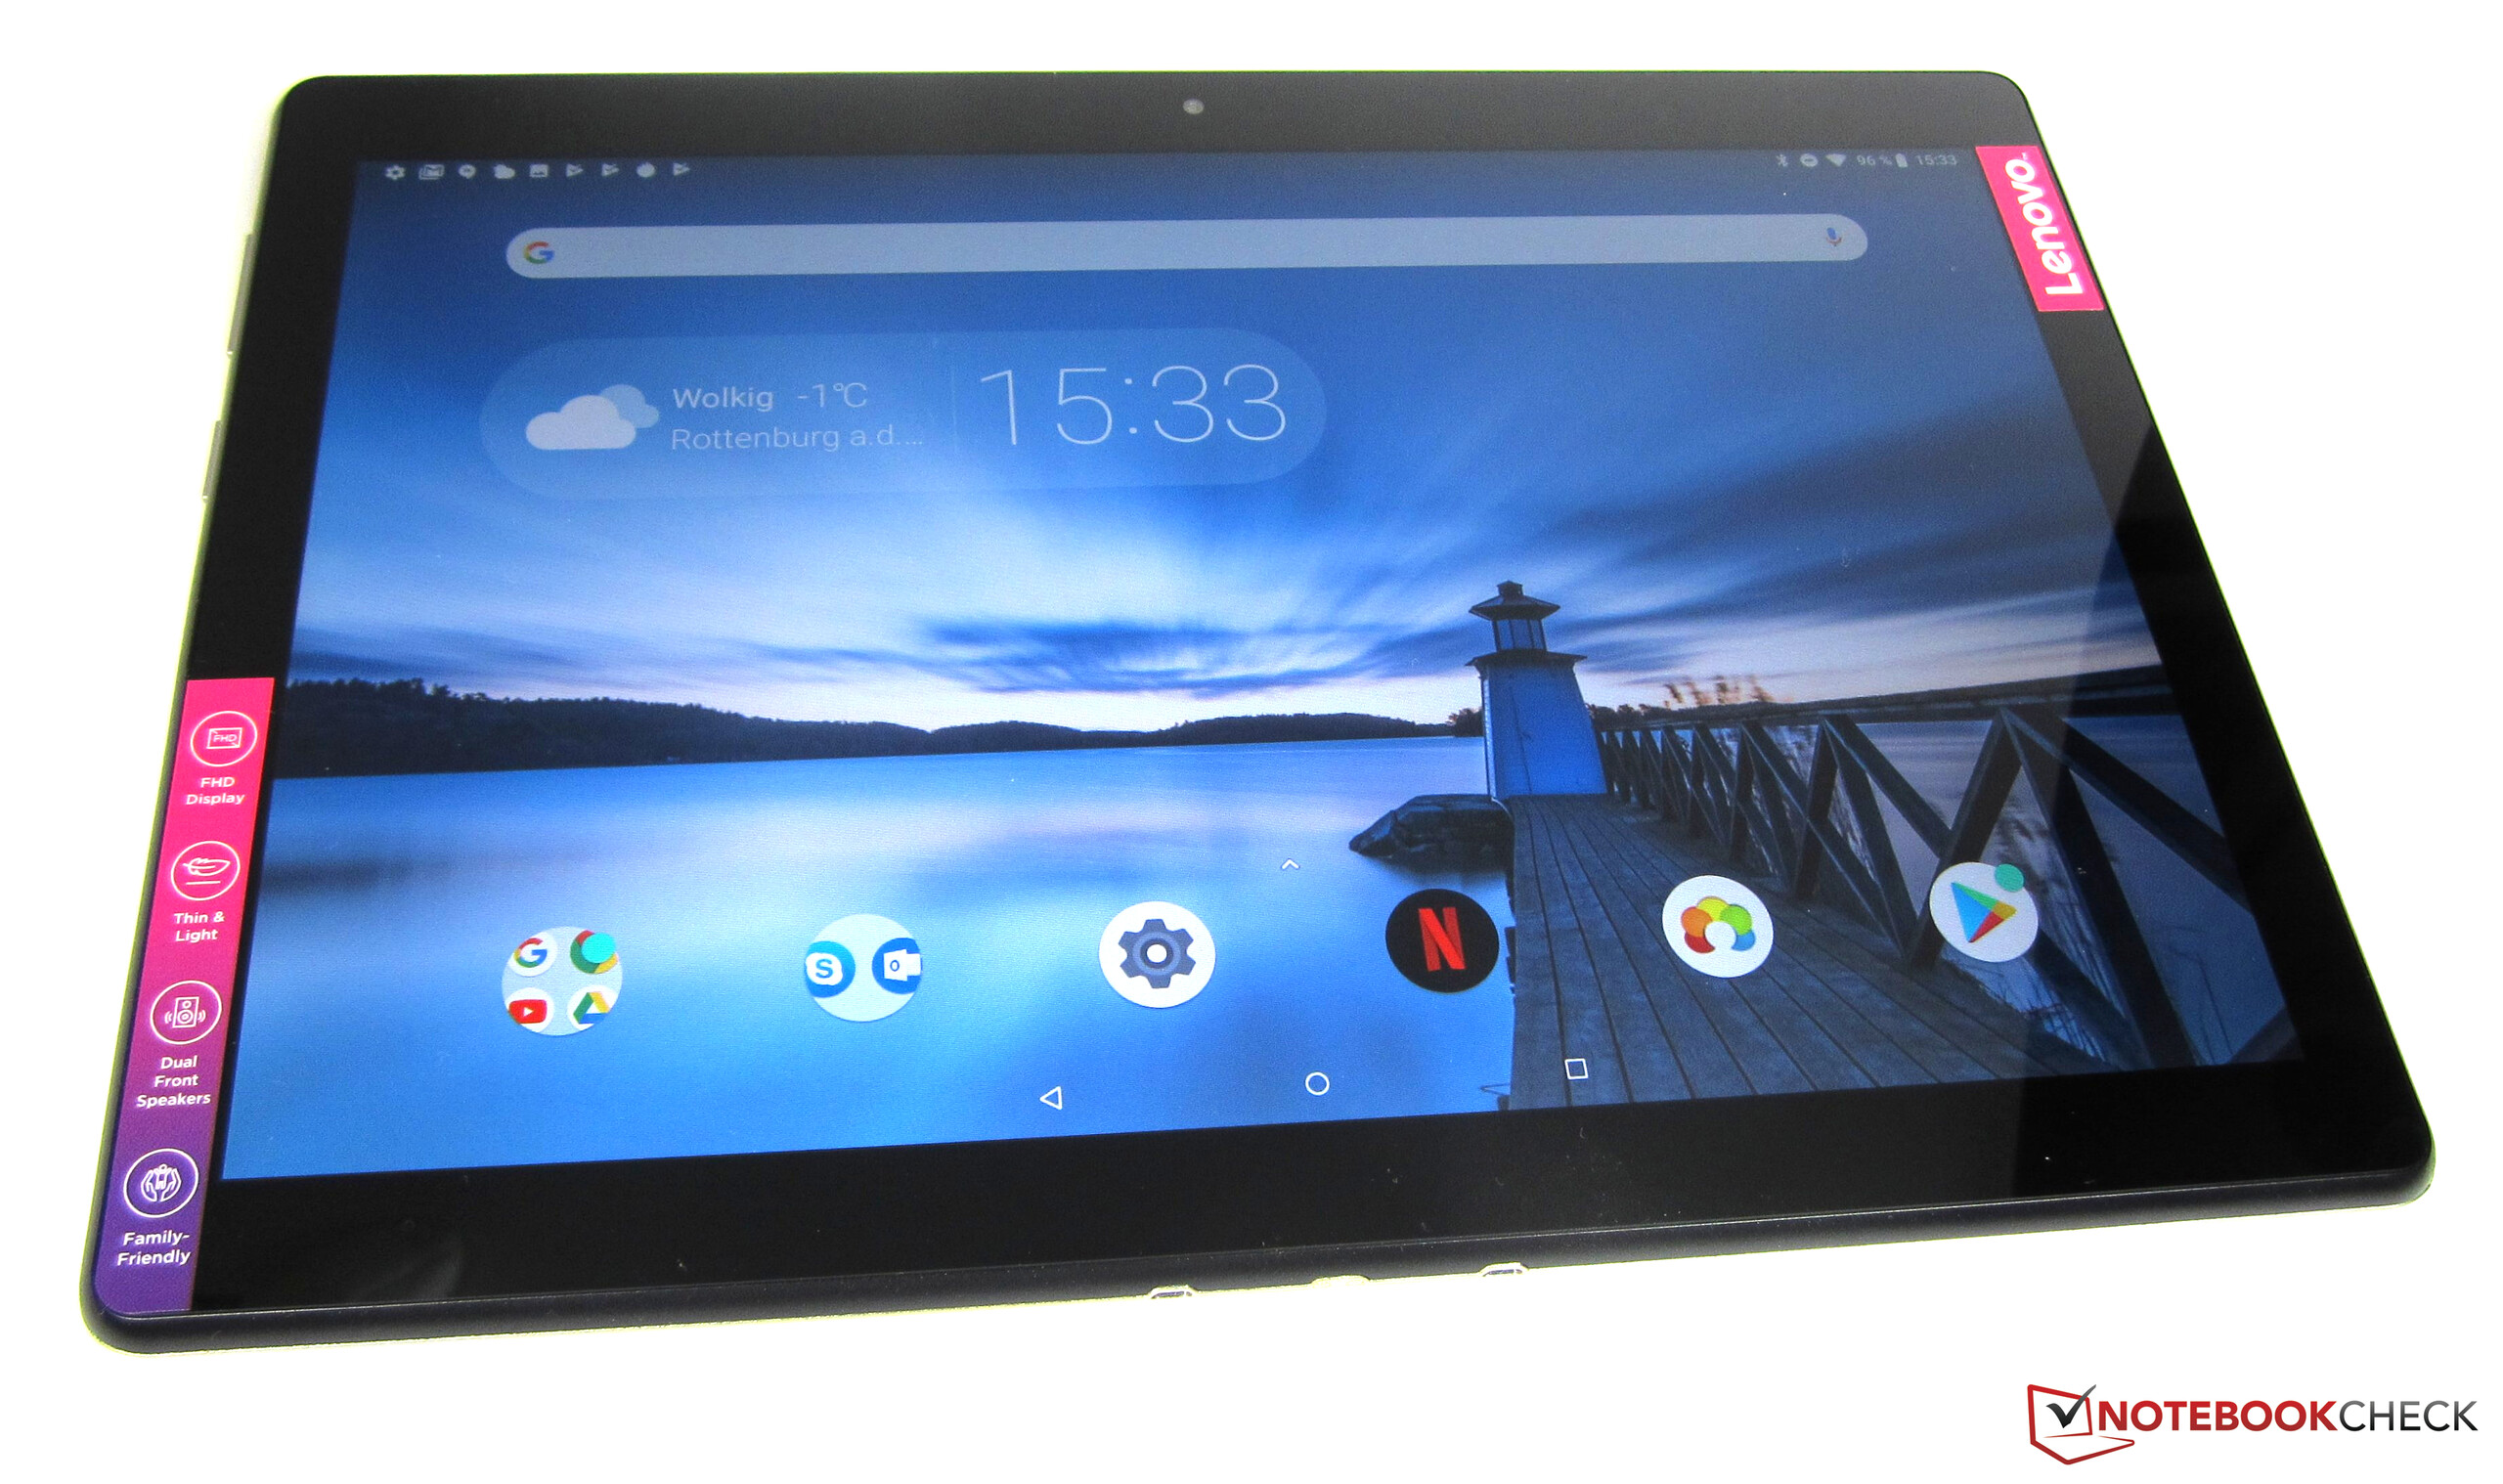
联想Tab M10是一款不错的中端平板电脑。价格实惠,且具有儿童友好功能,这应该会吸引一些人购买它。它的骁龙 450 SoC功能强大,适用于大多数任务,而其立体声扬声器比大多数竞品都要好。
Lenovo Smart Dock也是一个有用的附加功能,因为这是捆绑在Tab M10上的,无法单独购买。亚马逊Alexa功能允许平板电脑兼作一台智能扬声器,这为Tab M10添加了些许实用性。
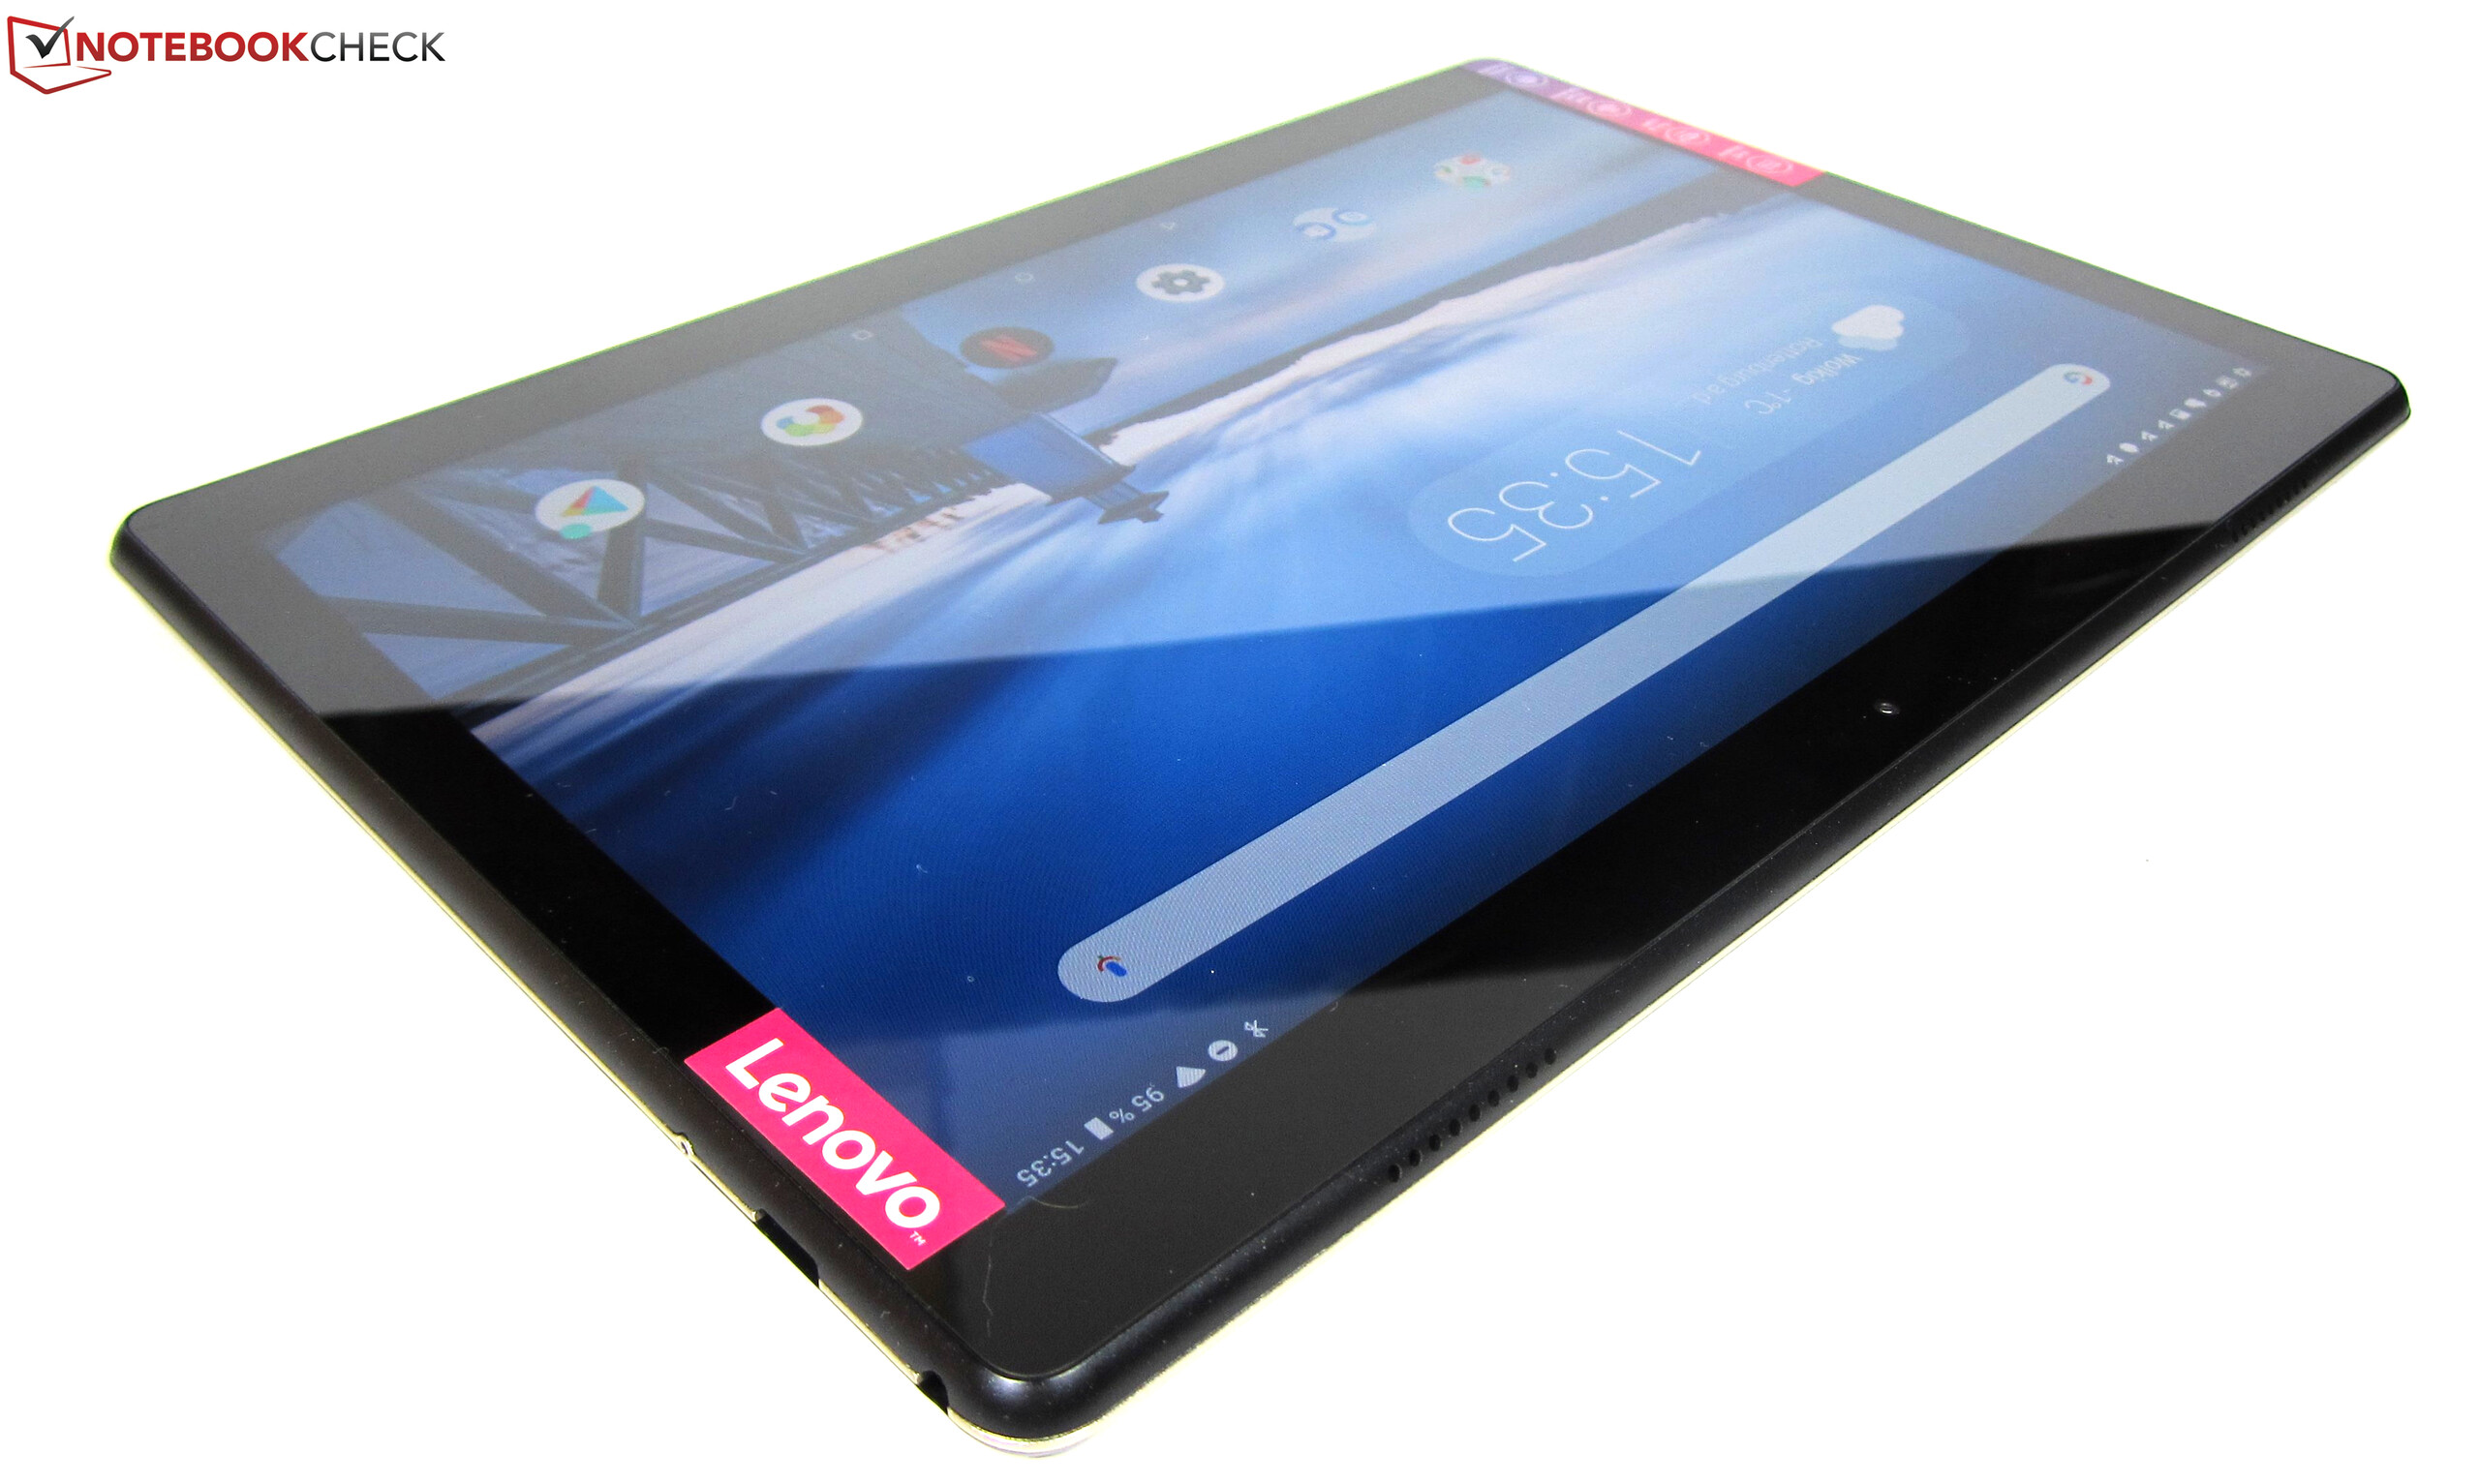
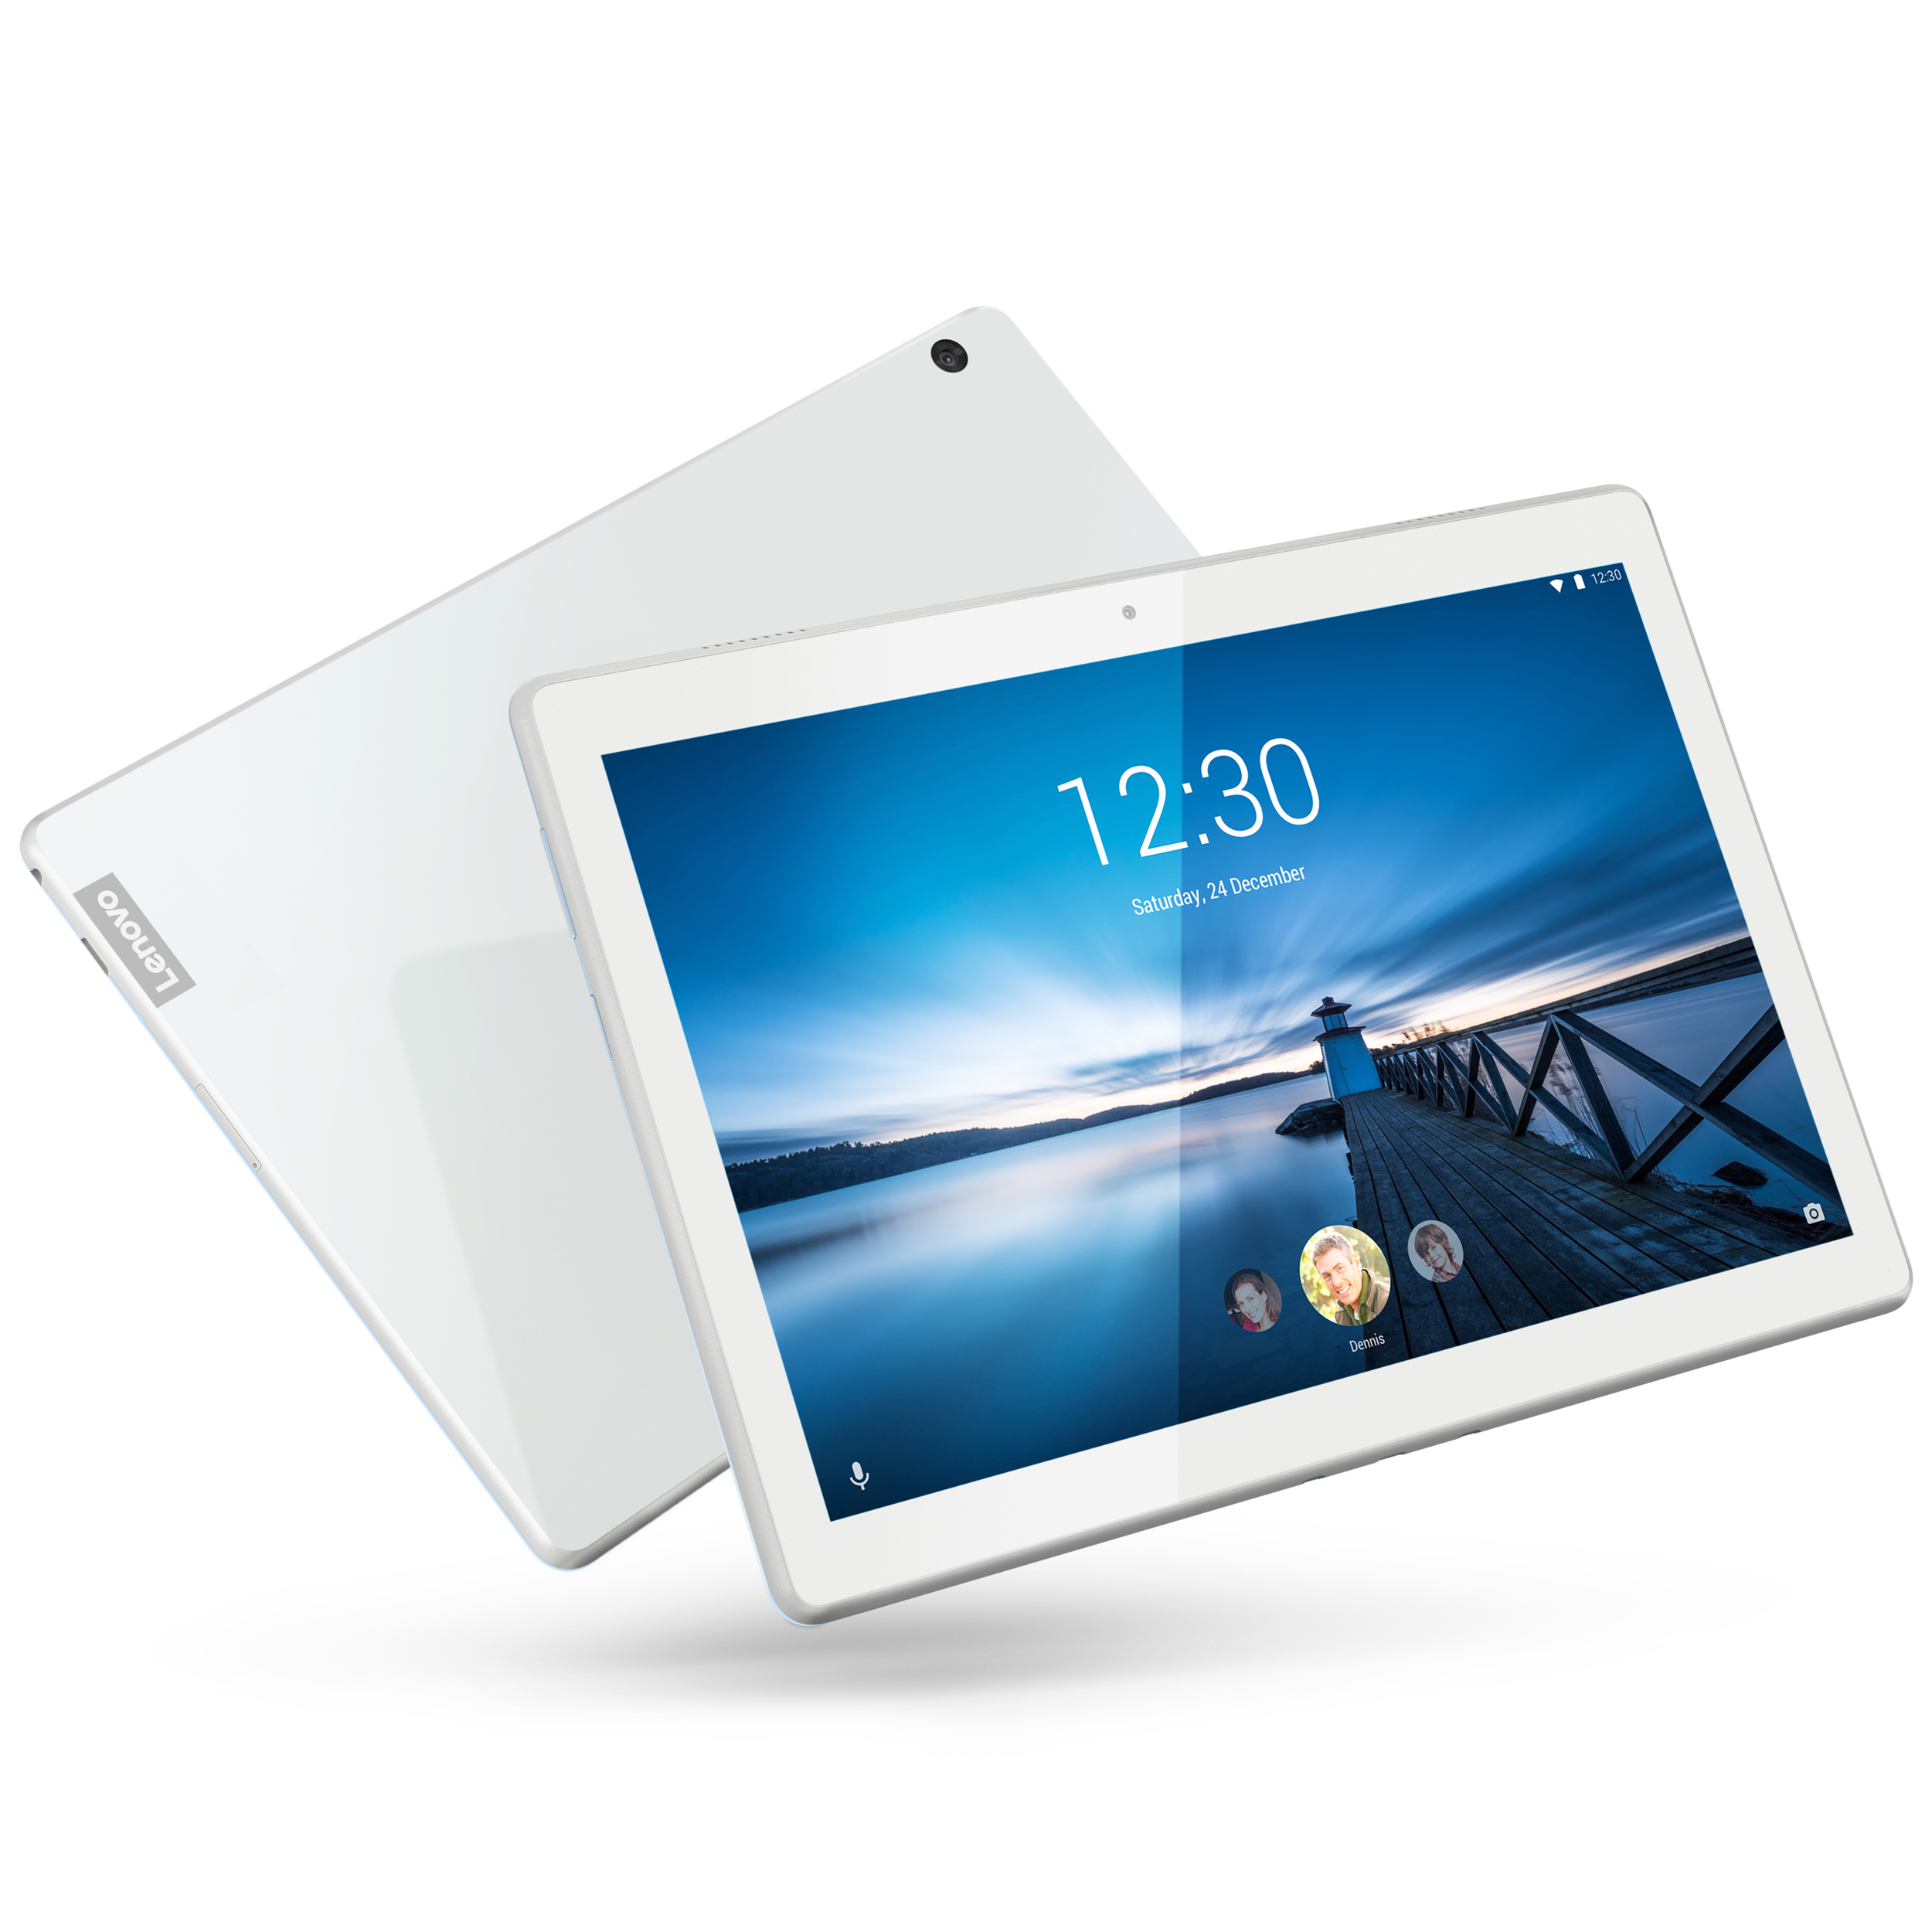
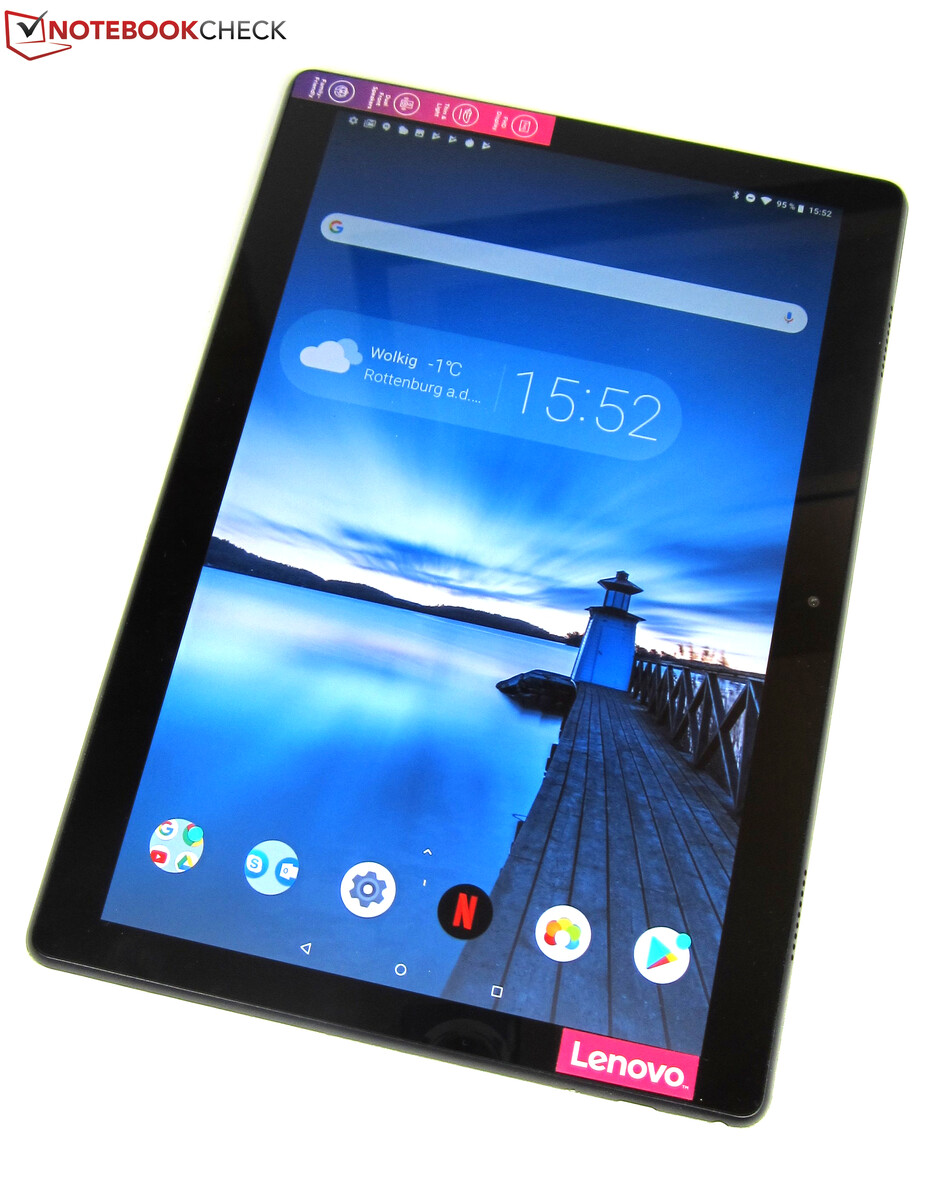
“联想Tab M10是一款适合家庭使用的平板电脑,起价1600元(参考,国内未上市)。然而,它低廉的售价还伴随着诸如低亮度的屏幕和令人失望的续航时间等妥协。”
Tab M10存在其他问题。基本型号只配备了2 GB RAM和16 GB存储空间。此外,它的相机非常糟糕,与Tab P10相比,它的续航令人失望。此外,它的屏幕在我们看来实在是太暗了,很遗憾联想没有包含任何可以纠正屏幕高色温的颜色配置文件或白平衡选项。
虽然Tab M10得到了我们的推荐,但我们认为Tab P10更加值得考虑。Tab P10的售价比Tab M10高出几百元,但你可以获得更多的RAM,额外的存储空间,双倍的扬声器以及更大的显示屏和更大的电池。此外,Tab P10拥有指纹传感器,更好的相机和比M10更时尚的设计。它还有一个环境光传感器,Tab M10却没有。简而言之,如果您的预算可以增加,Tab P10值得额外的花销。
Lenovo Tab M10
- 11/05/2019 v7 (old)
Manuel Masiero
Price comparison

