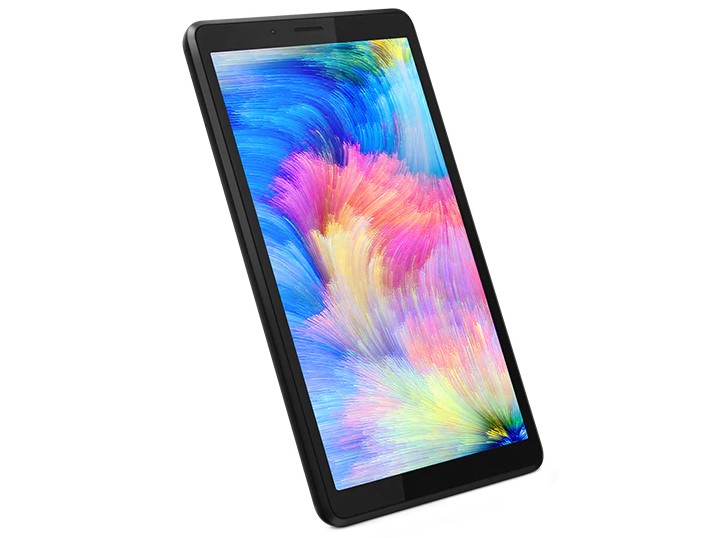
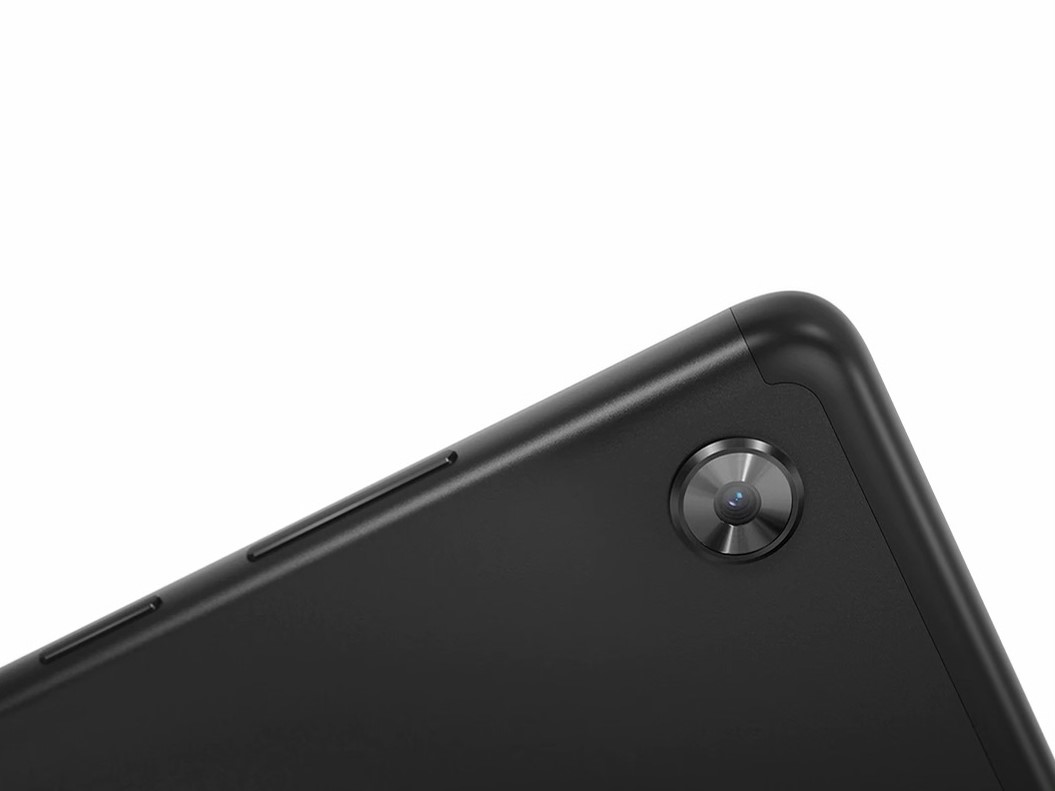
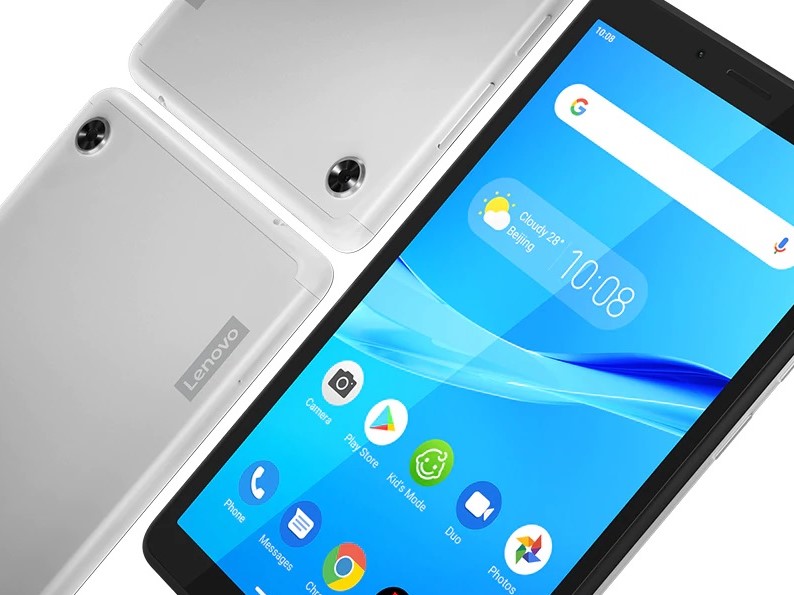
Lenovo Tab M7平板电脑评测:装了安卓Go的Kindle杀手
Rating | Date | Model | Weight | Height | Size | Resolution | Price |
|---|---|---|---|---|---|---|---|
| 75.4 % v7 (old) | 02 / 2020 | Lenovo Tab M7 MT8321, Mali-400 MP2 | 236 g | 8.2 mm | 7.00" | 1024x600 | |
| 77.7 % v6 (old) | 07 / 2019 | Amazon Fire 7 2019 MT8163 V/B 1.3 GHz, Mali-T720 MP2 | 286 g | 9.6 mm | 7.00" | 1024x600 | |
| 78.7 % v6 (old) | Alldocube M8 T801 MT6797X, Mali-T880 MP4 | 345 g | 8.48 mm | 8.00" | 1920x1200 | ||
| 83.3 % v7 (old) | 04 / 2018 | Huawei MediaPad M5 8.4 Kirin 960, Mali-G71 MP8 | 316 g | 7.3 mm | 8.40" | 2560x1600 | |
| 79.6 % v7 (old) | 09 / 2019 | Samsung Galaxy Tab A 8.0 2019 Wifi SM-T290 SD 429, Adreno 504 | 345 g | 8 mm | 8.00" | 1280x800 |
| Networking | |
| iperf3 transmit AX12 | |
| Huawei MediaPad M5 8.4 | |
| Alldocube M8 T801 | |
| Samsung Galaxy Tab A 8.0 2019 Wifi SM-T290 | |
| Amazon Fire 7 2019 | |
| Lenovo Tab M7 | |
| iperf3 receive AX12 | |
| Alldocube M8 T801 | |
| Huawei MediaPad M5 8.4 | |
| Samsung Galaxy Tab A 8.0 2019 Wifi SM-T290 | |
| Amazon Fire 7 2019 | |
| Lenovo Tab M7 | |


| |||||||||||||||||||||||||
Brightness Distribution: 86 %
Center on Battery: 447 cd/m²
Contrast: 1788:1 (Black: 0.25 cd/m²)
ΔE ColorChecker Calman: 7.1 | ∀{0.5-29.43 Ø4.73}
ΔE Greyscale Calman: 8.1 | ∀{0.09-98 Ø4.97}
68.1% sRGB (Calman 2D)
Gamma: 2.07
CCT: 8255 K
| Lenovo Tab M7 IPS, 1024x600, 7" | Amazon Fire 7 2019 IPS, 1024x600, 7" | Alldocube M8 T801 IPS, 1920x1200, 8" | Huawei MediaPad M5 8.4 IPS, 2560x1600, 8.4" | Samsung Galaxy Tab A 8.0 2019 Wifi SM-T290 TFT, 1280x800, 8" | |
|---|---|---|---|---|---|
| Screen | 11% | -17% | -21% | 1% | |
| Brightness middle (cd/m²) | 447 | 391 -13% | 317.5 -29% | 405 -9% | 377 -16% |
| Brightness (cd/m²) | 449 | 385 -14% | 320 -29% | 392 -13% | 372 -17% |
| Brightness Distribution (%) | 86 | 75 -13% | 94 9% | 92 7% | 87 1% |
| Black Level * (cd/m²) | 0.25 | 0.15 40% | 0.5 -100% | 0.67 -168% | 0.29 -16% |
| Contrast (:1) | 1788 | 2607 46% | 635 -64% | 604 -66% | 1300 -27% |
| Colorchecker dE 2000 * | 7.1 | 6.3 11% | 6.12 14% | 5.78 19% | 6.1 14% |
| Colorchecker dE 2000 max. * | 20.6 | 19.3 6% | 13.72 33% | 9.82 52% | 10.9 47% |
| Greyscale dE 2000 * | 8.1 | 6.1 25% | 5.8 28% | 7.2 11% | 6.6 19% |
| Gamma | 2.07 106% | 2.22 99% | 2.12 104% | 2.278 97% | 2.13 103% |
| CCT | 8255 79% | 8069 81% | 7633 85% | 8405 77% | 7861 83% |
* ... smaller is better
Screen Flickering / PWM (Pulse-Width Modulation)
| Screen flickering / PWM not detected | 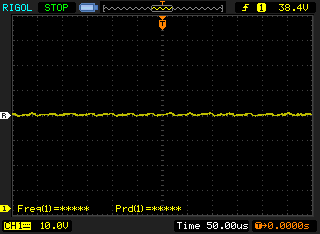 | ||
In comparison: 52 % of all tested devices do not use PWM to dim the display. If PWM was detected, an average of 7794 (minimum: 5 - maximum: 343500) Hz was measured. | |||
Display Response Times
| ↔ Response Time Black to White | ||
|---|---|---|
| 34.8 ms ... rise ↗ and fall ↘ combined | ↗ 17.6 ms rise |  |
| ↘ 17.2 ms fall | ||
| The screen shows slow response rates in our tests and will be unsatisfactory for gamers. In comparison, all tested devices range from 0.1 (minimum) to 240 (maximum) ms. » 92 % of all devices are better. This means that the measured response time is worse than the average of all tested devices (19.9 ms). | ||
| ↔ Response Time 50% Grey to 80% Grey | ||
| 50.4 ms ... rise ↗ and fall ↘ combined | ↗ 29.2 ms rise | 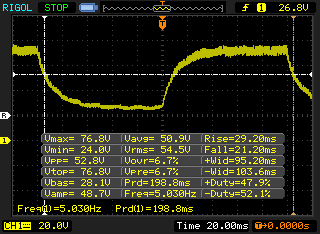 |
| ↘ 21.2 ms fall | ||
| The screen shows slow response rates in our tests and will be unsatisfactory for gamers. In comparison, all tested devices range from 0.165 (minimum) to 636 (maximum) ms. » 87 % of all devices are better. This means that the measured response time is worse than the average of all tested devices (31.1 ms). | ||
| Geekbench 4.4 | |
| 64 Bit Single-Core Score | |
| Average of class Tablet (4231 - 9867, n=9, last 2 years) | |
| Huawei MediaPad M5 8.4 | |
| Alldocube M8 T801 | |
| Amazon Fire 7 2019 | |
| Lenovo Tab M7 | |
| Average Mediatek MT8321 (429 - 431, n=2) | |
| 64 Bit Multi-Core Score | |
| Average of class Tablet (11144 - 28034, n=9, last 2 years) | |
| Huawei MediaPad M5 8.4 | |
| Alldocube M8 T801 | |
| Amazon Fire 7 2019 | |
| Lenovo Tab M7 | |
| Average Mediatek MT8321 (1106 - 1127, n=2) | |
| Compute RenderScript Score | |
| Average of class Tablet (8856 - 22243, n=5, last 2 years) | |
| Huawei MediaPad M5 8.4 | |
| Alldocube M8 T801 | |
| Amazon Fire 7 2019 | |
| Average Mediatek MT8321 (840 - 862, n=2) | |
| Lenovo Tab M7 | |
| PCMark for Android | |
| Work performance score | |
| Huawei MediaPad M5 8.4 | |
| Samsung Galaxy Tab A 8.0 2019 Wifi SM-T290 | |
| Alldocube M8 T801 | |
| Amazon Fire 7 2019 | |
| Lenovo Tab M7 | |
| Average Mediatek MT8321 (2529 - 2719, n=2) | |
| Work 2.0 performance score | |
| Huawei MediaPad M5 8.4 | |
| Alldocube M8 T801 | |
| Samsung Galaxy Tab A 8.0 2019 Wifi SM-T290 | |
| Amazon Fire 7 2019 | |
| Lenovo Tab M7 | |
| Average Mediatek MT8321 (n=1) | |
| 3DMark | |
| 1280x720 offscreen Ice Storm Unlimited Score | |
| Alldocube M8 T801 | |
| Samsung Galaxy Tab A 8.0 2019 Wifi SM-T290 | |
| Amazon Fire 7 2019 | |
| Average Mediatek MT8321 (2902 - 2913, n=2) | |
| Lenovo Tab M7 | |
| 1280x720 offscreen Ice Storm Unlimited Graphics Score | |
| Alldocube M8 T801 | |
| Samsung Galaxy Tab A 8.0 2019 Wifi SM-T290 | |
| Amazon Fire 7 2019 | |
| Lenovo Tab M7 | |
| Average Mediatek MT8321 (2468 - 2468, n=2) | |
| 1280x720 offscreen Ice Storm Unlimited Physics | |
| Samsung Galaxy Tab A 8.0 2019 Wifi SM-T290 | |
| Amazon Fire 7 2019 | |
| Alldocube M8 T801 | |
| Average Mediatek MT8321 (7561 - 7924, n=2) | |
| Lenovo Tab M7 | |
| GFXBench (DX / GLBenchmark) 2.7 | |
| T-Rex Onscreen | |
| Average of class Tablet (22 - 165, n=57, last 2 years) | |
| Huawei MediaPad M5 8.4 | |
| Alldocube M8 T801 | |
| Amazon Fire 7 2019 | |
| Samsung Galaxy Tab A 8.0 2019 Wifi SM-T290 | |
| Lenovo Tab M7 | |
| Average Mediatek MT8321 (4.4 - 9.8, n=2) | |
| 1920x1080 T-Rex Offscreen | |
| Average of class Tablet (24 - 886, n=57, last 2 years) | |
| Huawei MediaPad M5 8.4 | |
| Alldocube M8 T801 | |
| Samsung Galaxy Tab A 8.0 2019 Wifi SM-T290 | |
| Amazon Fire 7 2019 | |
| Average Mediatek MT8321 (4.4 - 7.8, n=2) | |
| Lenovo Tab M7 | |
| AnTuTu v7 - Total Score | |
| Huawei MediaPad M5 8.4 | |
| Alldocube M8 T801 | |
| Lenovo Tab M7 | |
| Average Mediatek MT8321 (20856 - 21974, n=2) | |
| Amazon Fire 7 2019 | |
| JetStream 1.1 - 1.1 Total | |
| Huawei MediaPad M5 8.4 (Chrome 66) | |
| Alldocube M8 T801 (Chrome 72.0.3626.105) | |
| Samsung Galaxy Tab A 8.0 2019 Wifi SM-T290 (Chrome 79) | |
| Amazon Fire 7 2019 (Silk Browser 70.3.1) | |
| Lenovo Tab M7 (Chrome 79) | |
| Average Mediatek MT8321 (10.9 - 11.2, n=2) | |
| WebXPRT 3 - Overall | |
| Average of class Tablet (108 - 480, n=10, last 2 years) | |
| Huawei MediaPad M5 8.4 (Chrome 66) | |
| Samsung Galaxy Tab A 8.0 2019 Wifi SM-T290 (Chrome 79) | |
| Amazon Fire 7 2019 | |
| Lenovo Tab M7 (Chrome 79) | |
| Average Mediatek MT8321 (n=1) | |
| Speedometer 2.0 - Result 2.0 | |
| Average of class Tablet (2.59 - 790, n=37, last 2 years) | |
| Samsung Galaxy Tab A 8.0 2019 Wifi SM-T290 (Chrome 79) | |
| Amazon Fire 7 2019 (Silk Browser 70.3.1) | |
| Lenovo Tab M7 (Chrome 79) | |
| Average Mediatek MT8321 (n=1) | |
| Octane V2 - Total Score | |
| Average of class Tablet (763 - 138481, n=73, last 2 years) | |
| Huawei MediaPad M5 8.4 (Chrome 66) | |
| Alldocube M8 T801 (Chrome 72.0.3626.105) | |
| Samsung Galaxy Tab A 8.0 2019 Wifi SM-T290 (Chrome 79) | |
| Amazon Fire 7 2019 (Silk Browser 70.3.1) | |
| Average Mediatek MT8321 (1712 - 1718, n=2) | |
| Lenovo Tab M7 (Chrome 79) | |
| Mozilla Kraken 1.1 - Total | |
| Lenovo Tab M7 (Chrome 79) | |
| Average Mediatek MT8321 (19085 - 19212, n=2) | |
| Amazon Fire 7 2019 (Silk Browser 70.3.1) | |
| Samsung Galaxy Tab A 8.0 2019 Wifi SM-T290 (Chrome 79) | |
| Alldocube M8 T801 (Chrome 72.0.3626.105) | |
| Huawei MediaPad M5 8.4 (Chrome 66) | |
| Average of class Tablet (243 - 27101, n=67, last 2 years) | |
* ... smaller is better
| Lenovo Tab M7 | Amazon Fire 7 2019 | Alldocube M8 T801 | Huawei MediaPad M5 8.4 | Samsung Galaxy Tab A 8.0 2019 Wifi SM-T290 | Average 16 GB eMMC Flash | Average of class Tablet | |
|---|---|---|---|---|---|---|---|
| AndroBench 3-5 | 4% | 8% | 164% | 90% | -2% | 1829% | |
| Sequential Read 256KB (MB/s) | 155.7 | 164.9 6% | 142.8 -8% | 268.6 73% | 291.9 87% | 164.5 ? 6% | 1987 ? 1176% |
| Sequential Write 256KB (MB/s) | 53.1 | 77.3 46% | 103 94% | 132.2 149% | 108.5 104% | 43 ? -19% | 1580 ? 2876% |
| Random Read 4KB (MB/s) | 31.39 | 24.98 -20% | 19.5 -38% | 62.8 100% | 57.8 84% | 21.7 ? -31% | 268 ? 754% |
| Random Write 4KB (MB/s) | 11.96 | 5.83 -51% | 10.01 -16% | 65.1 444% | 16.89 41% | 8.08 ? -32% | 312 ? 2509% |
| Sequential Read 256KB SDCard (MB/s) | 38.97 ? | 59.2 ? 52% | 84.9 ? 118% | 87.1 ? 124% | 59.1 ? 52% | ||
| Sequential Write 256KB SDCard (MB/s) | 35.21 ? | 32.05 ? -9% | 70.7 ? 101% | 69.9 ? 99% | 39.8 ? 13% |
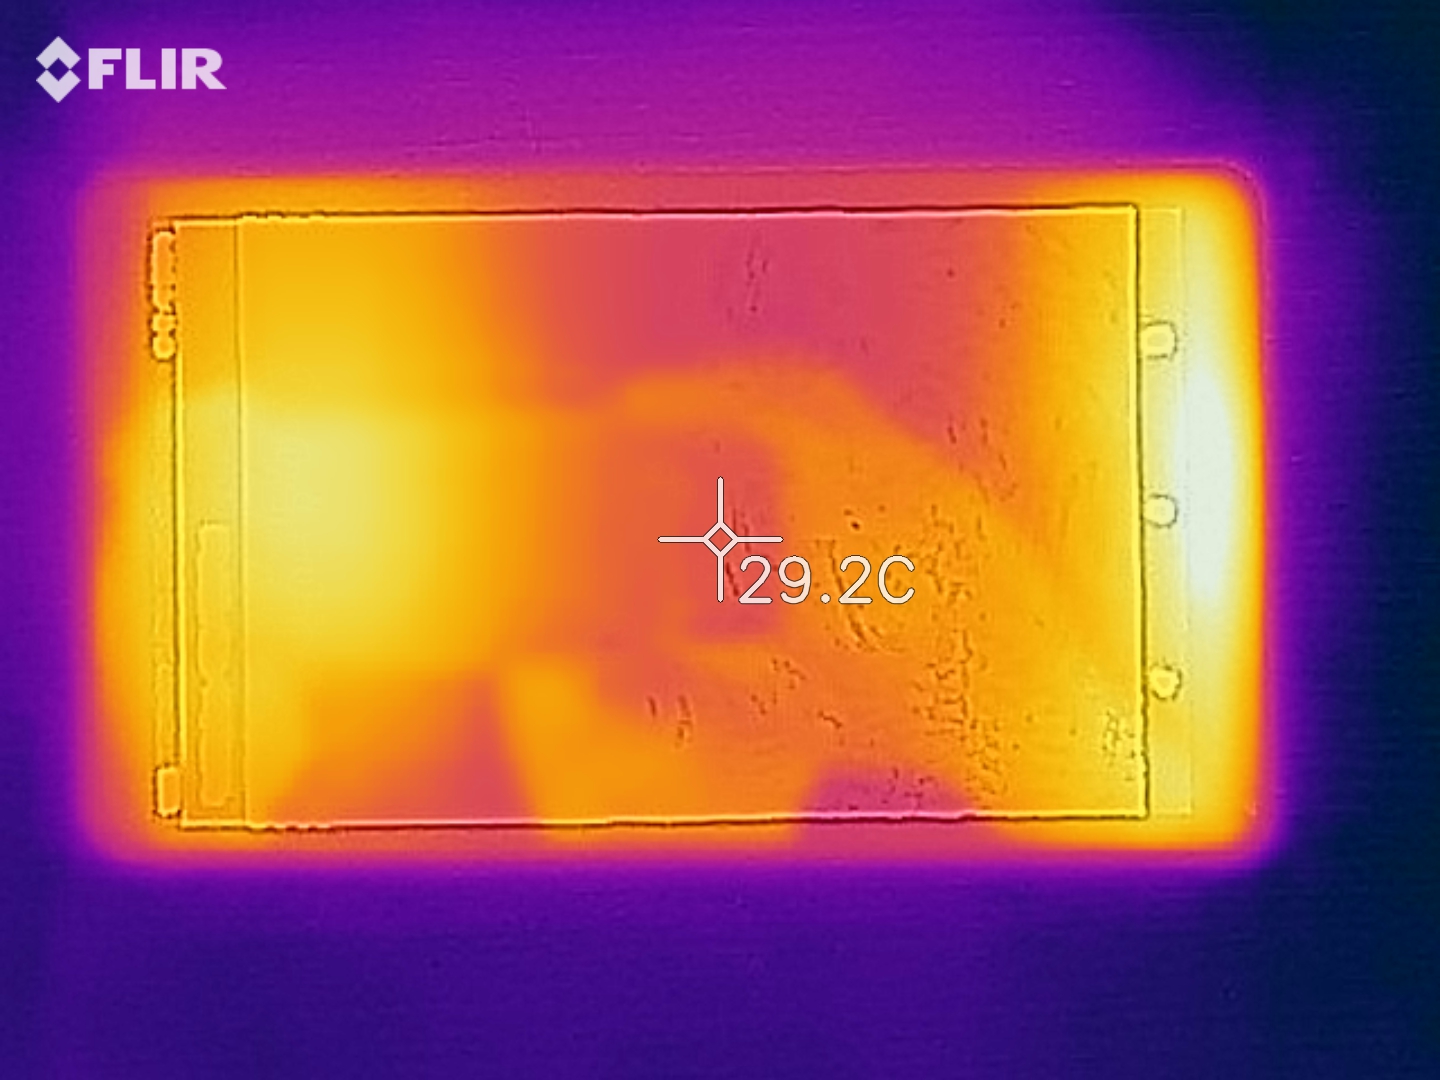
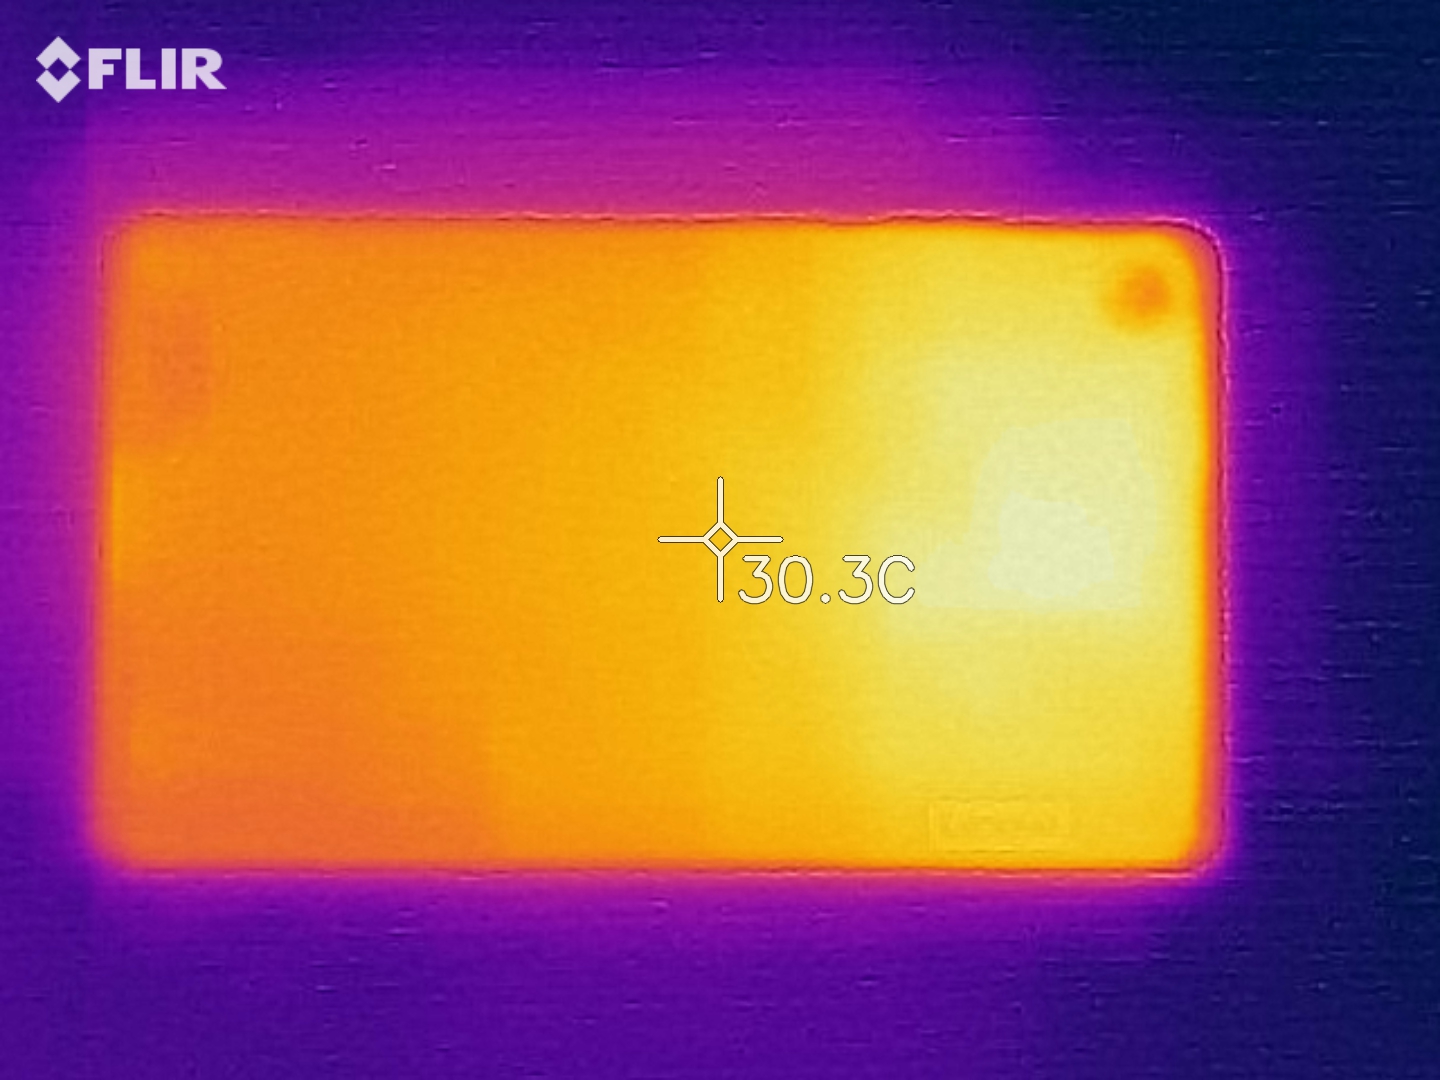
(+) The maximum temperature on the upper side is 31.2 °C / 88 F, compared to the average of 33.6 °C / 92 F, ranging from 20.7 to 53.2 °C for the class Tablet.
(+) The bottom heats up to a maximum of 27.5 °C / 82 F, compared to the average of 33.2 °C / 92 F
(+) In idle usage, the average temperature for the upper side is 26.4 °C / 80 F, compared to the device average of 30 °C / 86 F.
Lenovo Tab M7 audio analysis
(+) | speakers can play relatively loud (86.1 dB)
Bass 100 - 315 Hz
(-) | nearly no bass - on average 34.4% lower than median
(±) | linearity of bass is average (8.6% delta to prev. frequency)
Mids 400 - 2000 Hz
(±) | reduced mids - on average 8% lower than median
(±) | linearity of mids is average (8.9% delta to prev. frequency)
Highs 2 - 16 kHz
(±) | higher highs - on average 5.4% higher than median
(+) | highs are linear (3% delta to prev. frequency)
Overall 100 - 16.000 Hz
(±) | linearity of overall sound is average (25.8% difference to median)
Compared to same class
» 82% of all tested devices in this class were better, 2% similar, 16% worse
» The best had a delta of 7%, average was 20%, worst was 129%
Compared to all devices tested
» 79% of all tested devices were better, 4% similar, 17% worse
» The best had a delta of 4%, average was 24%, worst was 134%
Amazon Fire 7 2019 audio analysis
(±) | speaker loudness is average but good (81.9 dB)
Bass 100 - 315 Hz
(-) | nearly no bass - on average 35% lower than median
(±) | linearity of bass is average (8% delta to prev. frequency)
Mids 400 - 2000 Hz
(±) | reduced mids - on average 5.6% lower than median
(±) | linearity of mids is average (7.4% delta to prev. frequency)
Highs 2 - 16 kHz
(+) | balanced highs - only 1.8% away from median
(+) | highs are linear (2.5% delta to prev. frequency)
Overall 100 - 16.000 Hz
(±) | linearity of overall sound is average (23.9% difference to median)
Compared to same class
» 75% of all tested devices in this class were better, 6% similar, 19% worse
» The best had a delta of 7%, average was 20%, worst was 129%
Compared to all devices tested
» 72% of all tested devices were better, 6% similar, 22% worse
» The best had a delta of 4%, average was 24%, worst was 134%
| Off / Standby | |
| Idle | |
| Load |
|
Key:
min: | |
| Lenovo Tab M7 3500 mAh | Amazon Fire 7 2019 2980 mAh | Alldocube M8 T801 5500 mAh | Huawei MediaPad M5 8.4 5100 mAh | Samsung Galaxy Tab A 8.0 2019 Wifi SM-T290 5100 mAh | |
|---|---|---|---|---|---|
| Power Consumption | -31% | -167% | -106% | -4% | |
| Idle Minimum * (Watt) | 0.85 | 1.1 -29% | 3.4 -300% | 2.1 -147% | 0.62 27% |
| Idle Average * (Watt) | 2.4 | 2.77 -15% | 5.1 -113% | 3.74 -56% | 2.68 -12% |
| Idle Maximum * (Watt) | 2.42 | 2.79 -15% | 5.3 -119% | 4.33 -79% | 2.7 -12% |
| Load Average * (Watt) | 3.17 | 4.5 -42% | 6 -89% | 6.32 -99% | 3.61 -14% |
| Load Maximum * (Watt) | 3.69 | 5.61 -52% | 11.5 -212% | 9.13 -147% | 4 -8% |
* ... smaller is better
| Lenovo Tab M7 3500 mAh | Amazon Fire 7 2019 2980 mAh | Alldocube M8 T801 5500 mAh | Huawei MediaPad M5 8.4 5100 mAh | Samsung Galaxy Tab A 8.0 2019 Wifi SM-T290 5100 mAh | |
|---|---|---|---|---|---|
| Battery runtime | |||||
| WiFi v1.3 (h) | 6.7 | 7.7 15% | 7 4% | 10.5 57% | 13.9 107% |
Pros
Cons
Verdict - Good tablet for simple applications
Lenovo Tab M7没有强大的功能。 基准性能测试结果不是很好,而且Wi-Fi和存储空间差强人意。 说到续航时间,具有如此低功耗的设备可能会从其3500mAh电池中受益匪浅。
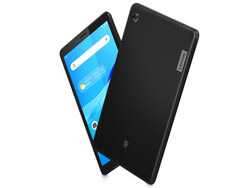
Lenovo Tab M7是正在寻找具有原生Android体验的简单平板电脑的人的选择。
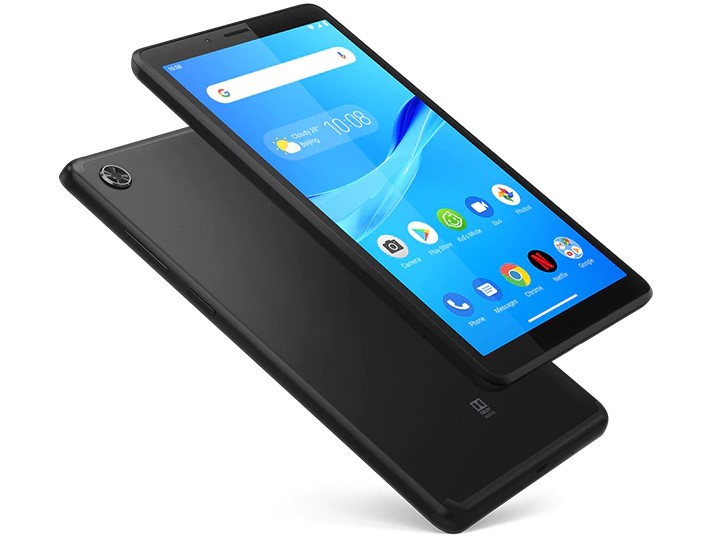
归根结底,我们非常喜欢Tab M7。 构建质量很稳定,与Amazon Fire 7不同,它没有厚厚的,令人讨厌的屏幕边框。基础版的Android Go仅售79欧元(约合88美元),是亚马逊Fire OS的很好替代品,后者具有许多专有的亚马逊应用程序。 那些正在寻找便宜小巧的平板电脑(主要用于上网和偶尔观看视频的人)的Lenovo Tab M7代表着价格相对合理的相对较高质量的设备。
Lenovo Tab M7
- 12/27/2019 v7 (old)
Mike Wobker
Price comparison
