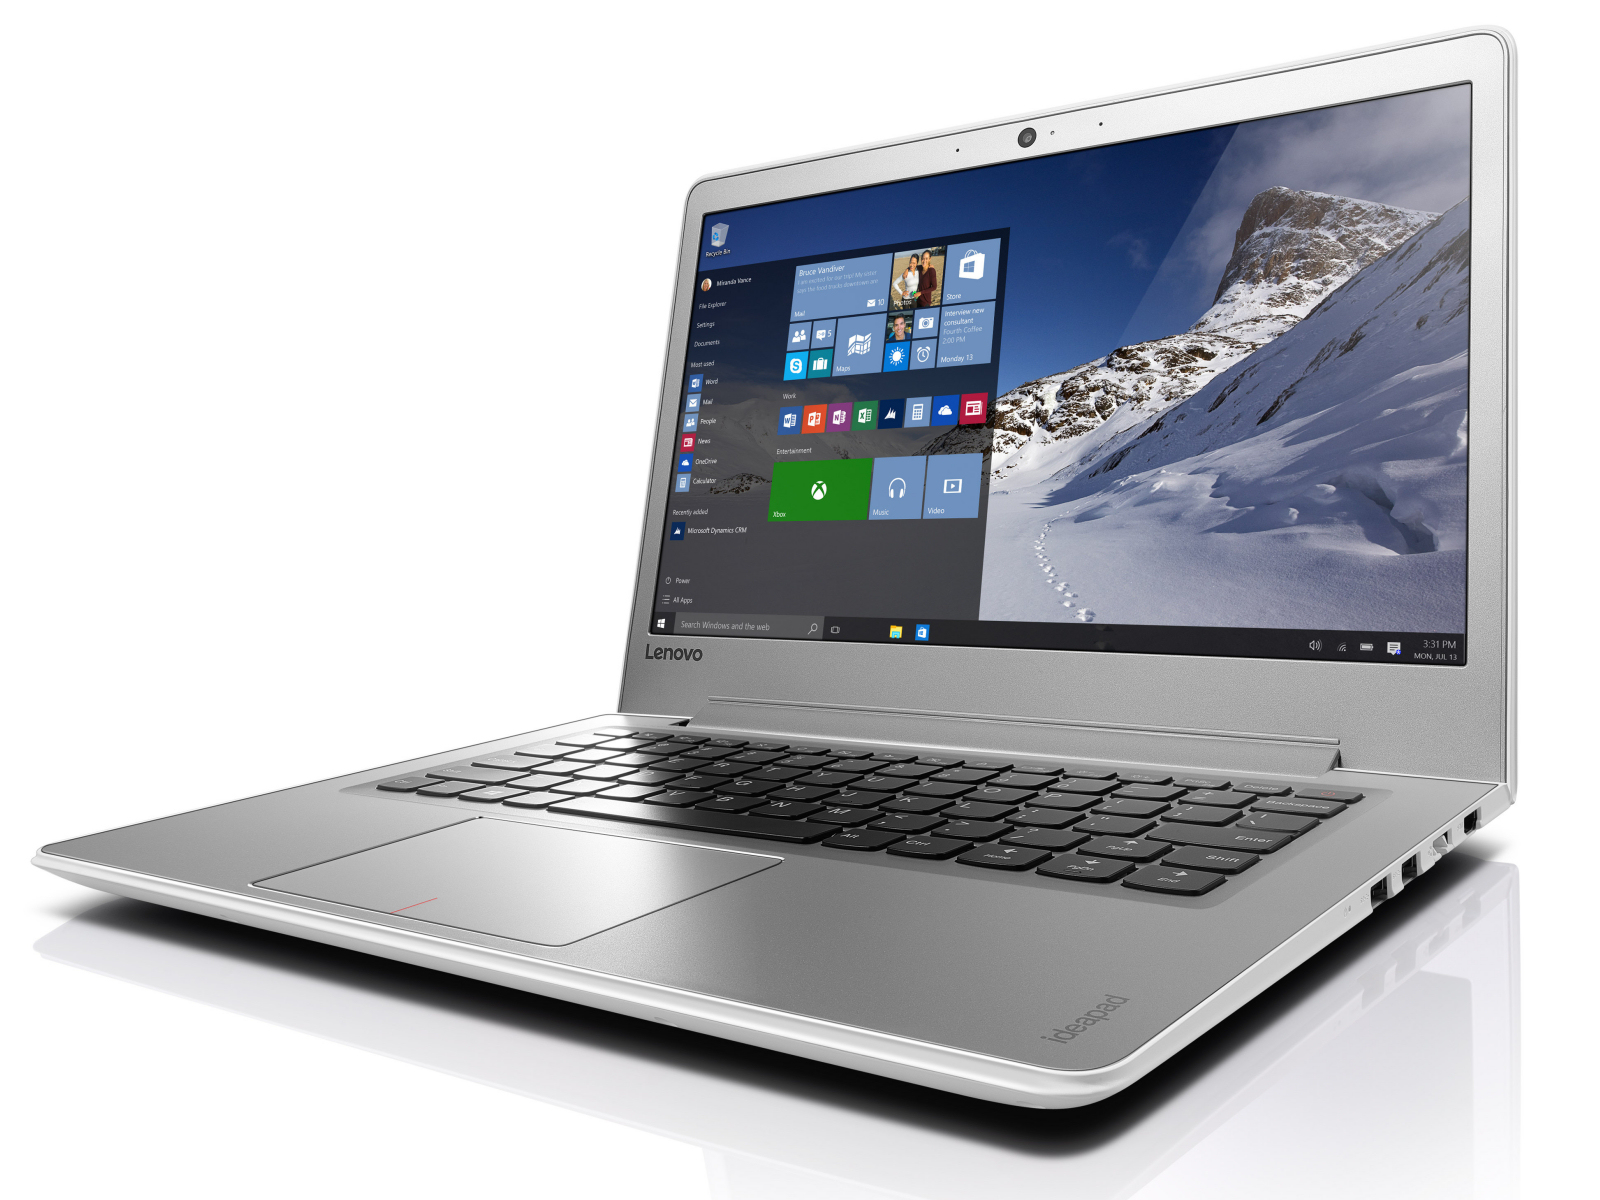
联想 IdeaPad 510S-13IKB 80V00026GE 亚笔记本电脑简短评测
| SD Card Reader | |
| average JPG Copy Test (av. of 3 runs) | |
| Asus Zenbook UX303UA-R4051T | |
| Lenovo IdeaPad 510S-13IKB 80V00026GE | |
| Asus Zenbook UX303UA-FN121T | |
| HP Envy 13-d020ng | |
| Lenovo Ideapad 510S-13ISK | |
| Asus X302UV-FN016T | |
| Acer Aspire V3-372-57CW | |
| Lenovo E31-70 80KX015RGE | |
| maximum AS SSD Seq Read Test (1GB) | |
| Asus Zenbook UX303UA-FN121T | |
| Asus Zenbook UX303UA-R4051T | |
| Lenovo IdeaPad 510S-13IKB 80V00026GE | |
| HP Envy 13-d020ng | |
| Lenovo Ideapad 510S-13ISK | |
| Asus X302UV-FN016T | |
| Lenovo E31-70 80KX015RGE | |
| Acer Aspire V3-372-57CW | |
| |||||||||||||||||||||||||
Brightness Distribution: 82 %
Center on Battery: 259 cd/m²
Contrast: 785:1 (Black: 0.33 cd/m²)
ΔE ColorChecker Calman: 5.12 | ∀{0.5-29.43 Ø4.71}
ΔE Greyscale Calman: 3.8 | ∀{0.09-98 Ø4.96}
58% sRGB (Argyll 1.6.3 3D)
37% AdobeRGB 1998 (Argyll 1.6.3 3D)
39.92% AdobeRGB 1998 (Argyll 3D)
57.9% sRGB (Argyll 3D)
38.61% Display P3 (Argyll 3D)
Gamma: 2.39
CCT: 7405 K
| Lenovo IdeaPad 510S-13IKB 80V00026GE IPS, 1920x1080, 13.3" | Lenovo Ideapad 510S-13ISK IPS, 1920x1080, 13.3" | Asus X302UV-FN016T TN LED, 1366x768, 13.3" | Acer Aspire V3-372-57CW IPS, 1920x1080, 13.3" | HP Envy 13-d020ng IPS, 1920x1080, 13.3" | Asus Zenbook UX303UA-R4051T IPS, 1920x1080, 13.3" | |
|---|---|---|---|---|---|---|
| Display | 2% | 25% | 1% | 63% | 68% | |
| Display P3 Coverage (%) | 38.61 | 39.48 2% | 48.37 25% | 39.18 1% | 63.7 65% | 67.5 75% |
| sRGB Coverage (%) | 57.9 | 59.2 2% | 72.6 25% | 58.6 1% | 93 61% | 92.5 60% |
| AdobeRGB 1998 Coverage (%) | 39.92 | 40.8 2% | 49.98 25% | 40.51 1% | 65.1 63% | 67.7 70% |
| Response Times | 10% | -2% | -24% | 7% | 15% | |
| Response Time Grey 50% / Grey 80% * (ms) | 39 ? | 33 ? 15% | 42 ? -8% | 41 ? -5% | 34 ? 13% | 31 ? 21% |
| Response Time Black / White * (ms) | 24 ? | 23 ? 4% | 23 ? 4% | 34.4 ? -43% | 24 ? -0% | 22 ? 8% |
| PWM Frequency (Hz) | 250 ? | 50 ? | 50 ? | 208 ? | 198 ? | |
| Screen | 3% | -5% | -14% | 27% | 22% | |
| Brightness middle (cd/m²) | 259 | 265 2% | 218 -16% | 247 -5% | 345 33% | 357 38% |
| Brightness (cd/m²) | 253 | 261 3% | 210 -17% | 239 -6% | 335 32% | 351 39% |
| Brightness Distribution (%) | 82 | 90 10% | 88 7% | 81 -1% | 95 16% | 90 10% |
| Black Level * (cd/m²) | 0.33 | 0.33 -0% | 0.5 -52% | 0.38 -15% | 0.25 24% | 0.58 -76% |
| Contrast (:1) | 785 | 803 2% | 436 -44% | 650 -17% | 1380 76% | 616 -22% |
| Colorchecker dE 2000 * | 5.12 | 4.98 3% | 3.89 24% | 5.95 -16% | 4.94 4% | 3.39 34% |
| Colorchecker dE 2000 max. * | 10.12 | 9.75 4% | 7.11 30% | 14.2 -40% | 8.85 13% | 6.76 33% |
| Greyscale dE 2000 * | 3.8 | 3.9 -3% | 4.9 -29% | 5.25 -38% | 5.85 -54% | 2.36 38% |
| Gamma | 2.39 92% | 2.55 86% | 2.41 91% | 2.42 91% | 2.25 98% | 2.2 100% |
| CCT | 7405 88% | 7318 89% | 7860 83% | 6736 96% | 7105 91% | 6653 98% |
| Color Space (Percent of AdobeRGB 1998) (%) | 37 | 38 3% | 46 24% | 37.28 1% | 60 62% | 60 62% |
| Color Space (Percent of sRGB) (%) | 58 | 59 2% | 73 26% | 58.37 1% | 93 60% | 93 60% |
| Total Average (Program / Settings) | 5% /
3% | 6% /
2% | -12% /
-12% | 32% /
31% | 35% /
30% |
* ... smaller is better
Screen Flickering / PWM (Pulse-Width Modulation)
| Screen flickering / PWM detected | 250 Hz | ≤ 80 % brightness setting | 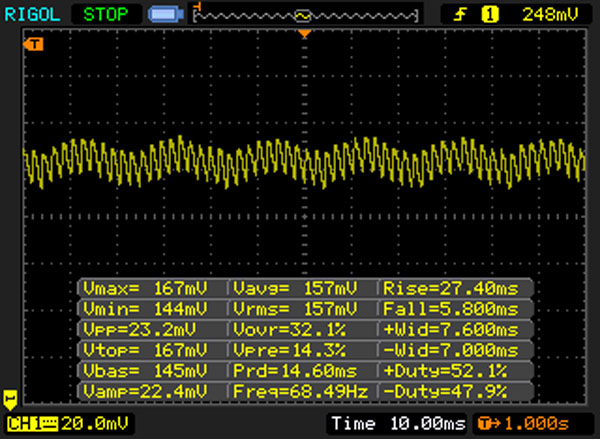 |
The display backlight flickers at 250 Hz (worst case, e.g., utilizing PWM) Flickering detected at a brightness setting of 80 % and below. There should be no flickering or PWM above this brightness setting. The frequency of 250 Hz is relatively low, so sensitive users will likely notice flickering and experience eyestrain at the stated brightness setting and below. In comparison: 52 % of all tested devices do not use PWM to dim the display. If PWM was detected, an average of 7748 (minimum: 5 - maximum: 343500) Hz was measured. | |||
Display Response Times
| ↔ Response Time Black to White | ||
|---|---|---|
| 24 ms ... rise ↗ and fall ↘ combined | ↗ 5 ms rise | 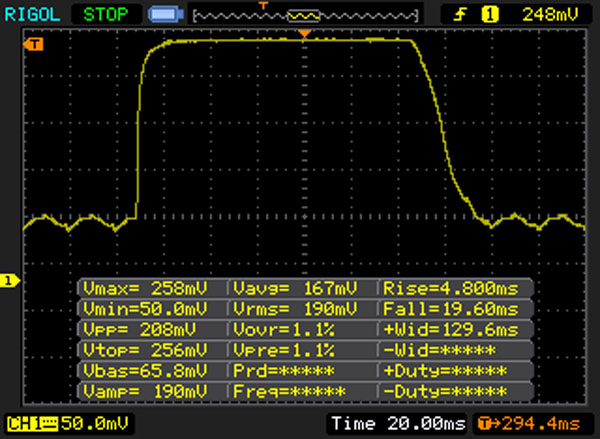 |
| ↘ 19 ms fall | ||
| The screen shows good response rates in our tests, but may be too slow for competitive gamers. In comparison, all tested devices range from 0.1 (minimum) to 240 (maximum) ms. » 54 % of all devices are better. This means that the measured response time is worse than the average of all tested devices (19.8 ms). | ||
| ↔ Response Time 50% Grey to 80% Grey | ||
| 39 ms ... rise ↗ and fall ↘ combined | ↗ 14 ms rise | 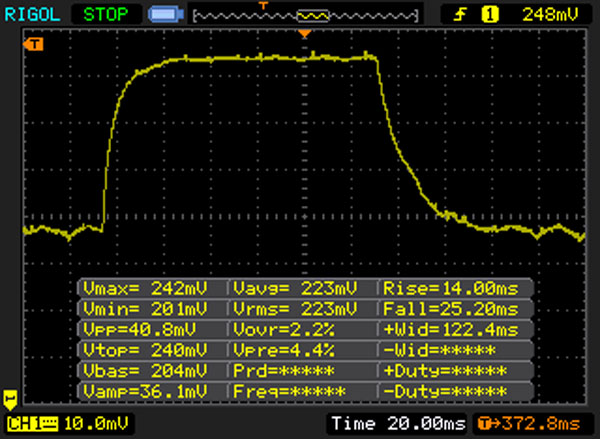 |
| ↘ 25 ms fall | ||
| The screen shows slow response rates in our tests and will be unsatisfactory for gamers. In comparison, all tested devices range from 0.165 (minimum) to 636 (maximum) ms. » 59 % of all devices are better. This means that the measured response time is worse than the average of all tested devices (30.9 ms). | ||
| Cinebench R15 | |
| CPU Single 64Bit | |
| Lenovo IdeaPad 510S-13IKB 80V00026GE | |
| Acer Aspire V3-372-57CW | |
| Asus Zenbook UX303UA-R4051T | |
| Asus X302UV-FN016T | |
| HP Envy 13-d020ng | |
| Asus Zenbook UX303UA-FN121T | |
| Lenovo Ideapad 510S-13ISK | |
| Lenovo E31-70 80KX015RGE | |
| CPU Multi 64Bit | |
| Acer Aspire V3-372-57CW | |
| Lenovo IdeaPad 510S-13IKB 80V00026GE | |
| Asus Zenbook UX303UA-R4051T | |
| Asus X302UV-FN016T | |
| Lenovo Ideapad 510S-13ISK | |
| Asus Zenbook UX303UA-FN121T | |
| HP Envy 13-d020ng | |
| Lenovo E31-70 80KX015RGE | |
| Cinebench R10 | |
| Rendering Multiple CPUs 32Bit | |
| Lenovo IdeaPad 510S-13IKB 80V00026GE | |
| Acer Aspire V3-372-57CW | |
| Asus Zenbook UX303UA-R4051T | |
| HP Envy 13-d020ng | |
| Asus X302UV-FN016T | |
| Asus Zenbook UX303UA-FN121T | |
| Lenovo Ideapad 510S-13ISK | |
| Lenovo E31-70 80KX015RGE | |
| Rendering Single 32Bit | |
| Lenovo IdeaPad 510S-13IKB 80V00026GE | |
| Acer Aspire V3-372-57CW | |
| Asus Zenbook UX303UA-R4051T | |
| Lenovo Ideapad 510S-13ISK | |
| Asus X302UV-FN016T | |
| HP Envy 13-d020ng | |
| Asus Zenbook UX303UA-FN121T | |
| Lenovo E31-70 80KX015RGE | |
| Geekbench 3 | |
| 32 Bit Single-Core Score | |
| Acer Aspire V3-372-57CW | |
| Lenovo IdeaPad 510S-13IKB 80V00026GE | |
| HP Envy 13-d020ng | |
| Asus Zenbook UX303UA-FN121T | |
| Asus X302UV-FN016T | |
| 32 Bit Multi-Core Score | |
| Lenovo IdeaPad 510S-13IKB 80V00026GE | |
| Acer Aspire V3-372-57CW | |
| HP Envy 13-d020ng | |
| Asus X302UV-FN016T | |
| Asus Zenbook UX303UA-FN121T | |
| Geekbench 4.0 | |
| 64 Bit Single-Core Score | |
| Lenovo IdeaPad 510S-13IKB 80V00026GE | |
| 64 Bit Multi-Core Score | |
| Lenovo IdeaPad 510S-13IKB 80V00026GE | |
| JetStream 1.1 - 1.1 Total | |
| Lenovo IdeaPad 510S-13IKB 80V00026GE | |
| Acer Aspire V3-372-57CW | |
| Asus X302UV-FN016T | |
| HP Envy 13-d020ng | |
| Lenovo Ideapad 510S-13ISK | |
| Asus Zenbook UX303UA-FN121T | |
| Lenovo E31-70 80KX015RGE | |
| PCMark 7 Score | 5427 points | |
| PCMark 8 Home Score Accelerated v2 | 3574 points | |
| PCMark 8 Creative Score Accelerated v2 | 4506 points | |
| PCMark 8 Work Score Accelerated v2 | 4712 points | |
Help | ||
| PCMark 8 | |
| Home Score Accelerated v2 | |
| Acer Aspire V3-372-57CW | |
| Lenovo IdeaPad 510S-13IKB 80V00026GE | |
| Asus X302UV-FN016T | |
| Asus Zenbook UX303UA-R4051T | |
| HP Envy 13-d020ng | |
| Asus Zenbook UX303UA-FN121T | |
| Lenovo Ideapad 510S-13ISK | |
| Lenovo E31-70 80KX015RGE | |
| Work Score Accelerated v2 | |
| Lenovo IdeaPad 510S-13IKB 80V00026GE | |
| Acer Aspire V3-372-57CW | |
| Asus X302UV-FN016T | |
| Asus Zenbook UX303UA-R4051T | |
| HP Envy 13-d020ng | |
| Asus Zenbook UX303UA-FN121T | |
| Lenovo Ideapad 510S-13ISK | |

| Lenovo IdeaPad 510S-13IKB 80V00026GE Samsung MZYTY256HDHP | Lenovo Ideapad 510S-13ISK WDC Slim WD10SPCX-24HWST1 | Asus X302UV-FN016T Hynix HFS128G3MND | Acer Aspire V3-372-57CW Kingston RBU-SNS8152S3256GG2 | HP Envy 13-d020ng Samsung MZRPC256HADR-000SO | Asus Zenbook UX303UA-R4051T SK hynix SSD Canvas SC300 HFS256G32MND | |
|---|---|---|---|---|---|---|
| CrystalDiskMark 3.0 | -89% | -29% | 12% | 3% | 2% | |
| Read Seq (MB/s) | 494.5 | 108.3 -78% | 428.2 -13% | 515 4% | 478.7 -3% | 465 -6% |
| Write Seq (MB/s) | 494.1 | 109 -78% | 178.6 -64% | 338 -32% | 268.5 -46% | 321 -35% |
| Read 512 (MB/s) | 383.9 | 35.24 -91% | 282.6 -26% | 368.1 -4% | 386.6 1% | 331.4 -14% |
| Write 512 (MB/s) | 155.5 | 53.3 -66% | 179.1 15% | 338.6 118% | 268.8 73% | 321.2 107% |
| Read 4k (MB/s) | 36.08 | 0.395 -99% | 6.559 -82% | 28.88 -20% | 26.88 -25% | 21.41 -41% |
| Write 4k (MB/s) | 96.4 | 1.19 -99% | 71.2 -26% | 74.2 -23% | 78.7 -18% | 74.6 -23% |
| Read 4k QD32 (MB/s) | 403.3 | 1.139 -100% | 253 -37% | 319.9 -21% | 369.4 -8% | 325.4 -19% |
| Write 4k QD32 (MB/s) | 176.4 | 1.212 -99% | 174 -1% | 309.4 75% | 259.7 47% | 263 49% |
| 3DMark 06 Standard Score | 8449 points | |
| 3DMark 11 Performance | 1603 points | |
| 3DMark Ice Storm Standard Score | 52169 points | |
| 3DMark Cloud Gate Standard Score | 5407 points | |
| 3DMark Fire Strike Score | 764 points | |
Help | ||
| 3DMark 11 - 1280x720 Performance GPU | |
| Acer Aspire V3-372-57CW | |
| Asus X302UV-FN016T | |
| Lenovo IdeaPad 510S-13IKB 80V00026GE | |
| Asus Zenbook UX303UA-R4051T | |
| Lenovo Ideapad 510S-13ISK | |
| HP Envy 13-d020ng | |
| Asus Zenbook UX303UA-FN121T | |
| Lenovo E31-70 80KX015RGE | |
| 3DMark | |
| 1280x720 Cloud Gate Standard Graphics | |
| Acer Aspire V3-372-57CW | |
| Asus Zenbook UX303UA-R4051T | |
| Asus X302UV-FN016T | |
| Lenovo IdeaPad 510S-13IKB 80V00026GE | |
| HP Envy 13-d020ng | |
| Lenovo Ideapad 510S-13ISK | |
| Asus Zenbook UX303UA-FN121T | |
| 1920x1080 Fire Strike Graphics | |
| Acer Aspire V3-372-57CW | |
| Asus X302UV-FN016T | |
| Asus Zenbook UX303UA-R4051T | |
| HP Envy 13-d020ng | |
| Lenovo IdeaPad 510S-13IKB 80V00026GE | |
| Asus Zenbook UX303UA-FN121T | |
| Lenovo Ideapad 510S-13ISK | |
| low | med. | high | ultra | |
|---|---|---|---|---|
| Tomb Raider (2013) | 68.5 | 34.4 | 19.7 | 9.6 |
| BioShock Infinite (2013) | 42.7 | 25.3 | 21.3 | 7.1 |
| Battlefield 4 (2013) | 33.8 | 26.1 | 16.9 | 6.3 |
Noise level
| Idle |
| 31.2 / 31.2 / 33.3 dB(A) |
| Load |
| 40 / 39.8 dB(A) |
 | ||
30 dB silent 40 dB(A) audible 50 dB(A) loud |
||
min: | ||
| Lenovo IdeaPad 510S-13IKB 80V00026GE i7-7500U, HD Graphics 620 | Lenovo Ideapad 510S-13ISK 6200U, HD Graphics 520 | Asus X302UV-FN016T 6200U, GeForce 920MX | Acer Aspire V3-372-57CW 6267U, Iris Graphics 550 | Lenovo E31-70 80KX015RGE 5005U, HD Graphics 5500 | HP Envy 13-d020ng 6200U, HD Graphics 520 | Asus Zenbook UX303UA-R4051T 6500U, HD Graphics 520 | |
|---|---|---|---|---|---|---|---|
| Noise | -1% | 4% | 3% | 6% | 3% | 6% | |
| off / environment * (dB) | 31.6 | 31.2 1% | 31.2 1% | 29.1 8% | 29.2 8% | 31.3 1% | |
| Idle Minimum * (dB) | 31.2 | 32.1 -3% | 32.9 -5% | 29.1 7% | 30.1 4% | 32.5 -4% | 31.3 -0% |
| Idle Average * (dB) | 31.2 | 32.1 -3% | 32.9 -5% | 29.1 7% | 30.1 4% | 32.5 -4% | 31.3 -0% |
| Idle Maximum * (dB) | 33.3 | 32.1 4% | 33 1% | 29.1 13% | 30.1 10% | 32.4 3% | 31.5 5% |
| Load Average * (dB) | 40 | 40 -0% | 33 17% | 41.1 -3% | 38.1 5% | 36 10% | 33.2 17% |
| Load Maximum * (dB) | 39.8 | 40.9 -3% | 34.6 13% | 46.4 -17% | 38.1 4% | 36.5 8% | 34.1 14% |
* ... smaller is better
(+) The maximum temperature on the upper side is 33 °C / 91 F, compared to the average of 35.9 °C / 97 F, ranging from 21.4 to 59 °C for the class Subnotebook.
(+) The bottom heats up to a maximum of 35.4 °C / 96 F, compared to the average of 39.2 °C / 103 F
(+) In idle usage, the average temperature for the upper side is 25.3 °C / 78 F, compared to the device average of 30.8 °C / 87 F.
(+) The palmrests and touchpad are cooler than skin temperature with a maximum of 26.4 °C / 79.5 F and are therefore cool to the touch.
(±) The average temperature of the palmrest area of similar devices was 28.2 °C / 82.8 F (+1.8 °C / 3.3 F).
| Lenovo IdeaPad 510S-13IKB 80V00026GE i7-7500U, HD Graphics 620 | Lenovo Ideapad 510S-13ISK 6200U, HD Graphics 520 | Asus X302UV-FN016T 6200U, GeForce 920MX | Acer Aspire V3-372-57CW 6267U, Iris Graphics 550 | Lenovo E31-70 80KX015RGE 5005U, HD Graphics 5500 | HP Envy 13-d020ng 6200U, HD Graphics 520 | Asus Zenbook UX303UA-R4051T 6500U, HD Graphics 520 | |
|---|---|---|---|---|---|---|---|
| Heat | -11% | 3% | -17% | -12% | -16% | -3% | |
| Maximum Upper Side * (°C) | 33 | 38 -15% | 29.6 10% | 37.1 -12% | 38.6 -17% | 51 -55% | 38.1 -15% |
| Maximum Bottom * (°C) | 35.4 | 39.1 -10% | 41 -16% | 43.2 -22% | 41.1 -16% | 46 -30% | 40.3 -14% |
| Idle Upper Side * (°C) | 27.2 | 30.7 -13% | 24.8 9% | 32.1 -18% | 29.5 -8% | 25.5 6% | 25.8 5% |
| Idle Bottom * (°C) | 29.3 | 31.1 -6% | 26.6 9% | 34.4 -17% | 30.8 -5% | 24.4 17% | 25.5 13% |
* ... smaller is better
Lenovo IdeaPad 510S-13IKB 80V00026GE audio analysis
(-) | not very loud speakers (66 dB)
Bass 100 - 315 Hz
(±) | reduced bass - on average 14.4% lower than median
(±) | linearity of bass is average (7.3% delta to prev. frequency)
Mids 400 - 2000 Hz
(+) | balanced mids - only 0.7% away from median
(+) | mids are linear (2.3% delta to prev. frequency)
Highs 2 - 16 kHz
(+) | balanced highs - only 1.5% away from median
(+) | highs are linear (2.1% delta to prev. frequency)
Overall 100 - 16.000 Hz
(+) | overall sound is linear (13.2% difference to median)
Compared to same class
» 22% of all tested devices in this class were better, 5% similar, 74% worse
» The best had a delta of 5%, average was 18%, worst was 53%
Compared to all devices tested
» 14% of all tested devices were better, 3% similar, 84% worse
» The best had a delta of 4%, average was 23%, worst was 134%
Apple MacBook 12 (Early 2016) 1.1 GHz audio analysis
(+) | speakers can play relatively loud (83.6 dB)
Bass 100 - 315 Hz
(±) | reduced bass - on average 11.3% lower than median
(±) | linearity of bass is average (14.2% delta to prev. frequency)
Mids 400 - 2000 Hz
(+) | balanced mids - only 2.4% away from median
(+) | mids are linear (5.5% delta to prev. frequency)
Highs 2 - 16 kHz
(+) | balanced highs - only 2% away from median
(+) | highs are linear (4.5% delta to prev. frequency)
Overall 100 - 16.000 Hz
(+) | overall sound is linear (10.2% difference to median)
Compared to same class
» 7% of all tested devices in this class were better, 2% similar, 90% worse
» The best had a delta of 5%, average was 18%, worst was 53%
Compared to all devices tested
» 5% of all tested devices were better, 1% similar, 94% worse
» The best had a delta of 4%, average was 23%, worst was 134%
| Off / Standby | |
| Idle | |
| Load |
|
Key:
min: | |
| Lenovo IdeaPad 510S-13IKB 80V00026GE i7-7500U, HD Graphics 620 | Lenovo Ideapad 510S-13ISK 6200U, HD Graphics 520 | Asus X302UV-FN016T 6200U, GeForce 920MX | Acer Aspire V3-372-57CW 6267U, Iris Graphics 550 | Lenovo E31-70 80KX015RGE 5005U, HD Graphics 5500 | HP Envy 13-d020ng 6200U, HD Graphics 520 | Asus Zenbook UX303UA-R4051T 6500U, HD Graphics 520 | |
|---|---|---|---|---|---|---|---|
| Power Consumption | -24% | -3% | -27% | -14% | -25% | -6% | |
| Idle Minimum * (Watt) | 3.3 | 5 -52% | 3.3 -0% | 3.4 -3% | 4.2 -27% | 4.2 -27% | 3.5 -6% |
| Idle Average * (Watt) | 5.8 | 7.2 -24% | 5.1 12% | 6.5 -12% | 6.1 -5% | 7.4 -28% | 7.3 -26% |
| Idle Maximum * (Watt) | 7.4 | 8.7 -18% | 5.2 30% | 7 5% | 7.4 -0% | 10.1 -36% | 7.9 -7% |
| Load Average * (Watt) | 29.2 | 32 -10% | 29.5 -1% | 44.5 -52% | 31.5 -8% | 33.4 -14% | 26.6 9% |
| Load Maximum * (Watt) | 28.6 | 33 -15% | 44 -54% | 49.5 -73% | 37.1 -30% | 34.7 -21% | 28 2% |
* ... smaller is better
| Lenovo IdeaPad 510S-13IKB 80V00026GE i7-7500U, HD Graphics 620, 35 Wh | Lenovo Ideapad 510S-13ISK 6200U, HD Graphics 520, 35 Wh | Asus X302UV-FN016T 6200U, GeForce 920MX, 38 Wh | Acer Aspire V3-372-57CW 6267U, Iris Graphics 550, 51 Wh | Lenovo E31-70 80KX015RGE 5005U, HD Graphics 5500, 35 Wh | HP Envy 13-d020ng 6200U, HD Graphics 520, 45 Wh | Asus Zenbook UX303UA-R4051T 6500U, HD Graphics 520, 50 Wh | |
|---|---|---|---|---|---|---|---|
| Battery runtime | -8% | 14% | 50% | -26% | 12% | 19% | |
| Reader / Idle (h) | 10.8 | 9.3 -14% | 17.3 60% | ||||
| H.264 (h) | 5.5 | 5.4 -2% | |||||
| WiFi v1.3 (h) | 5.7 | 5.9 4% | 6.5 14% | 6.9 21% | 4.2 -26% | 6.4 12% | 6.8 19% |
| Load (h) | 2 | 1.6 -20% | 3.4 70% |
Pros
Cons
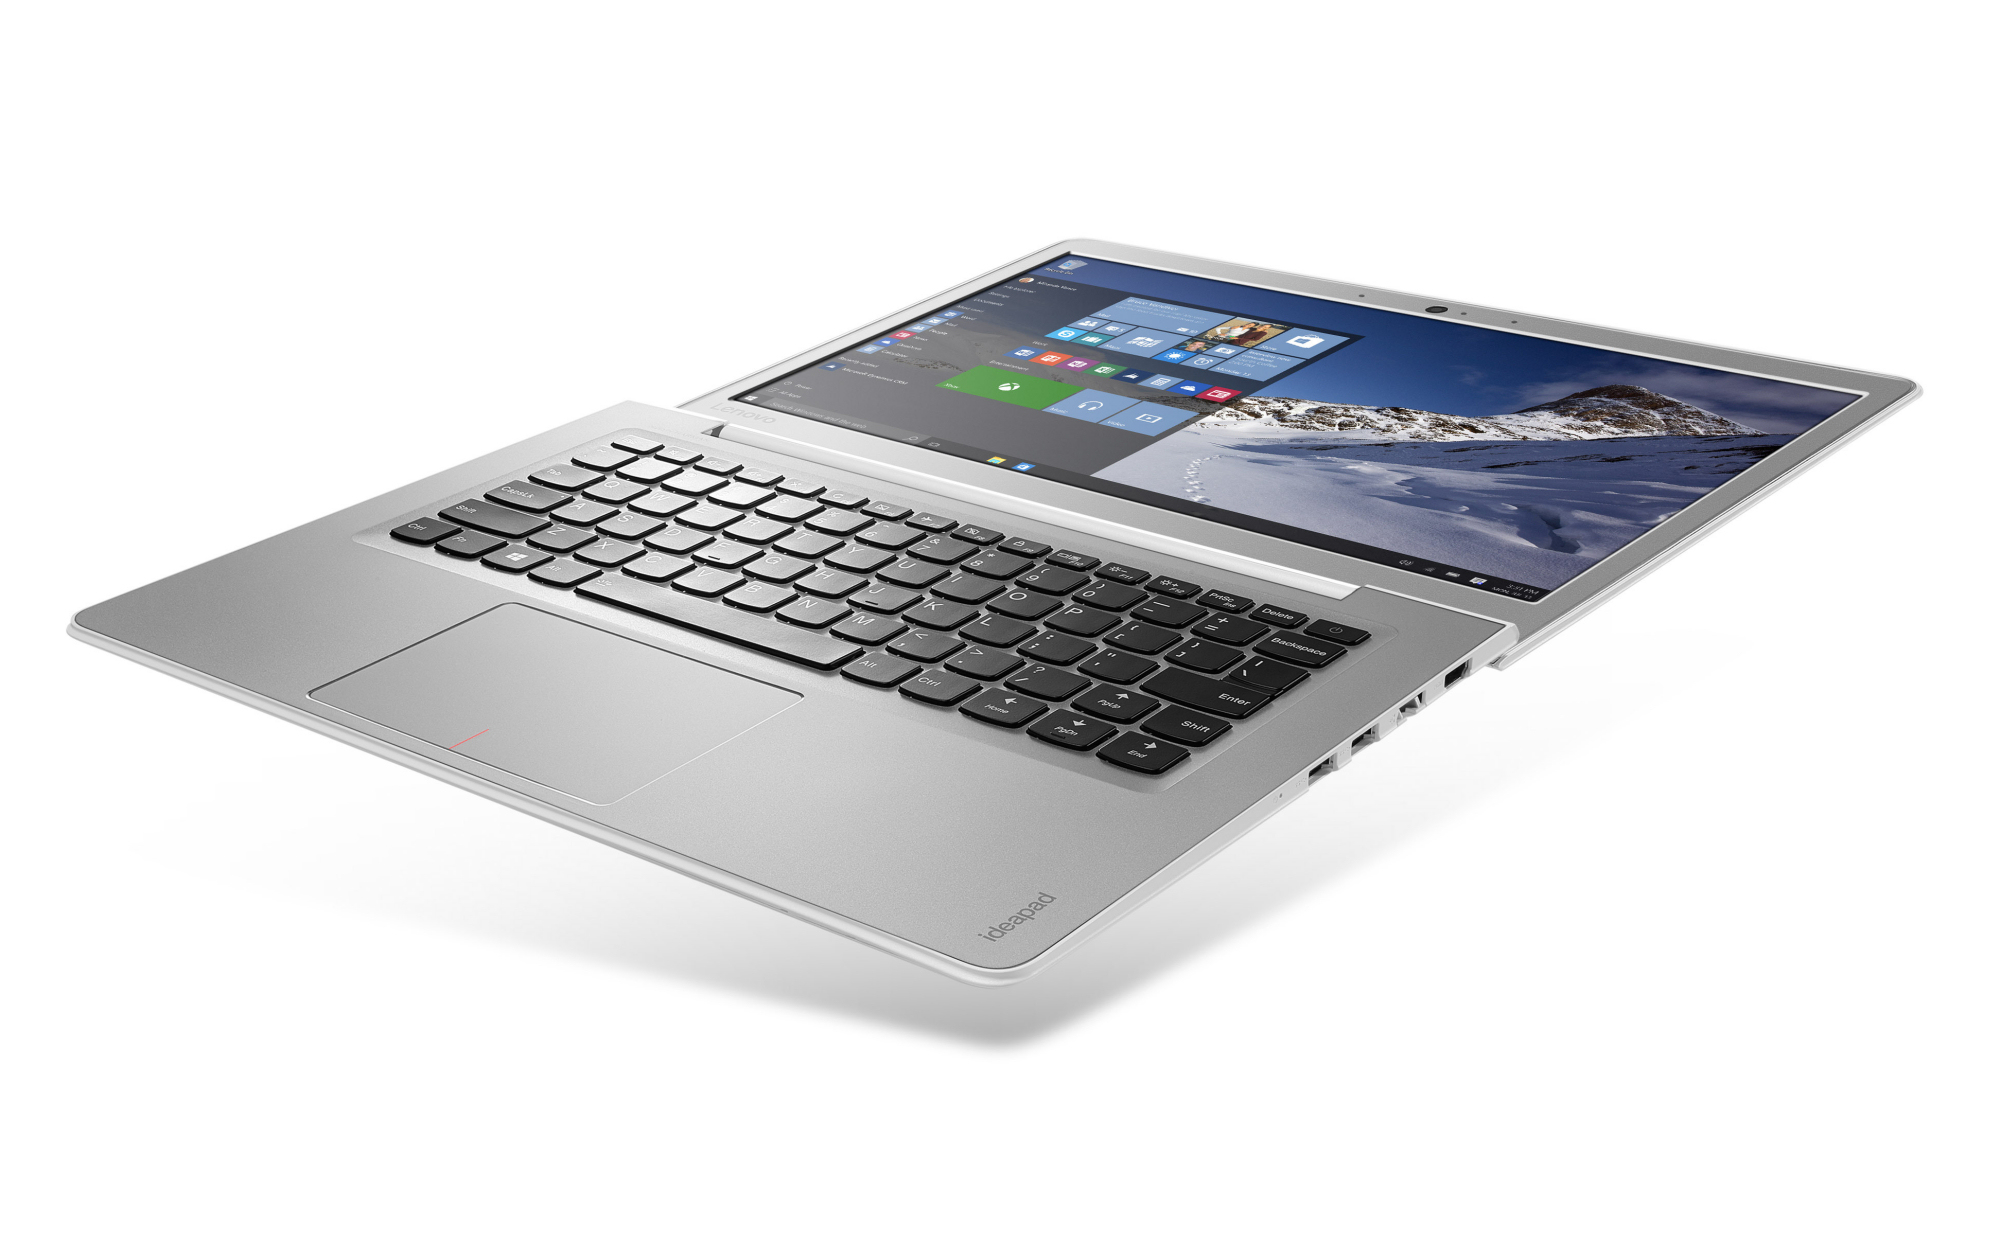
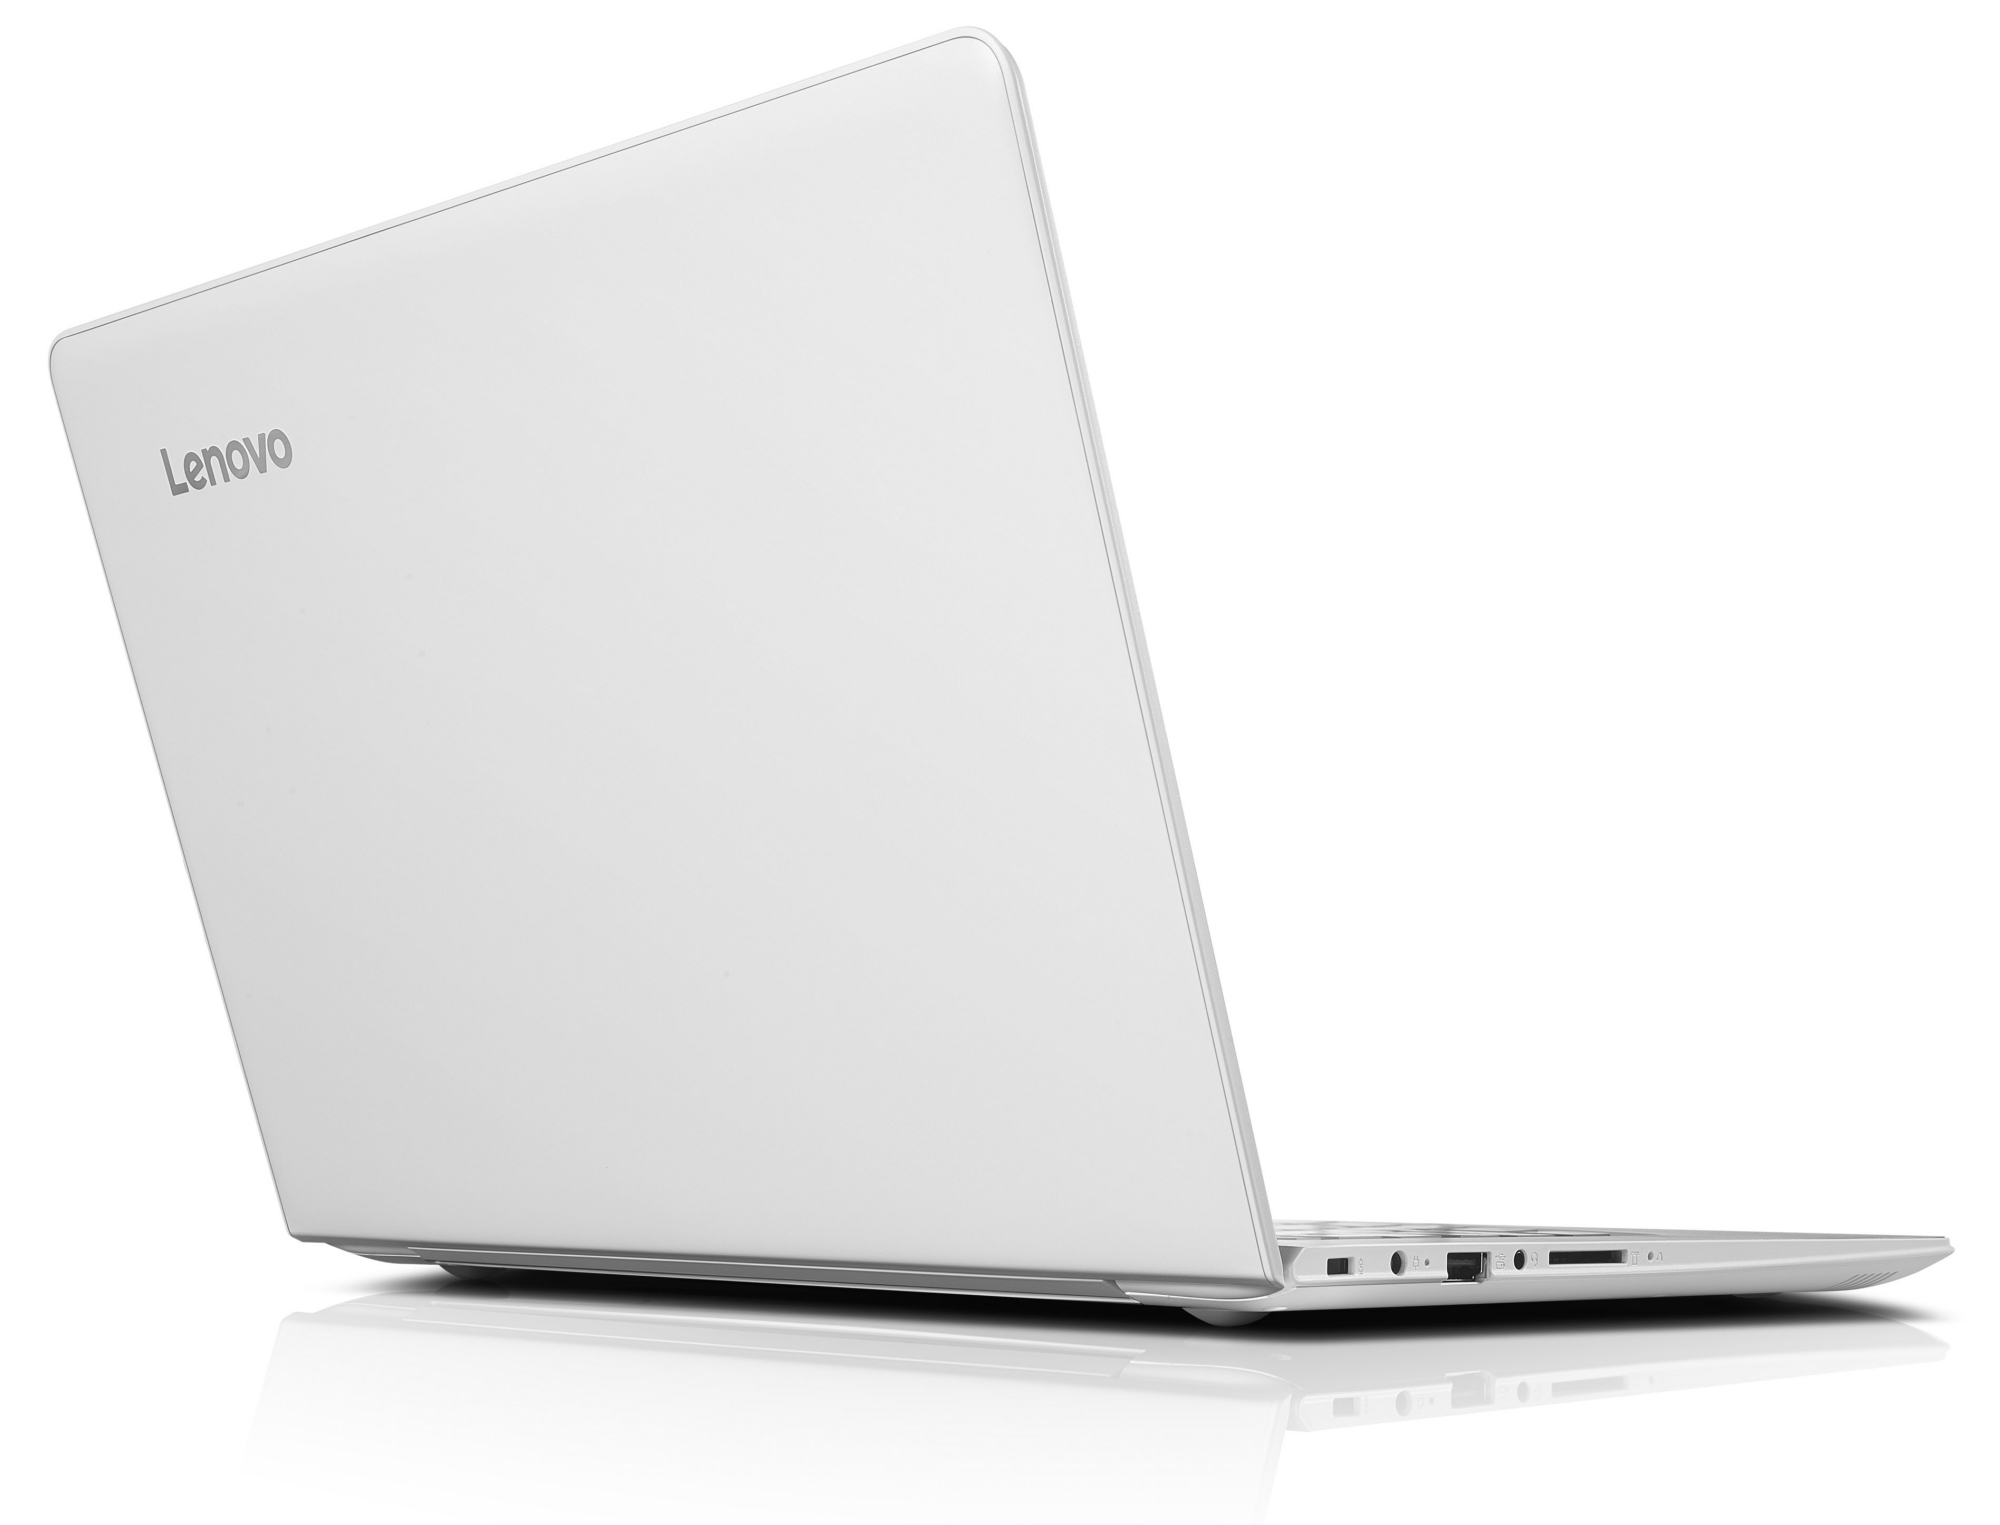
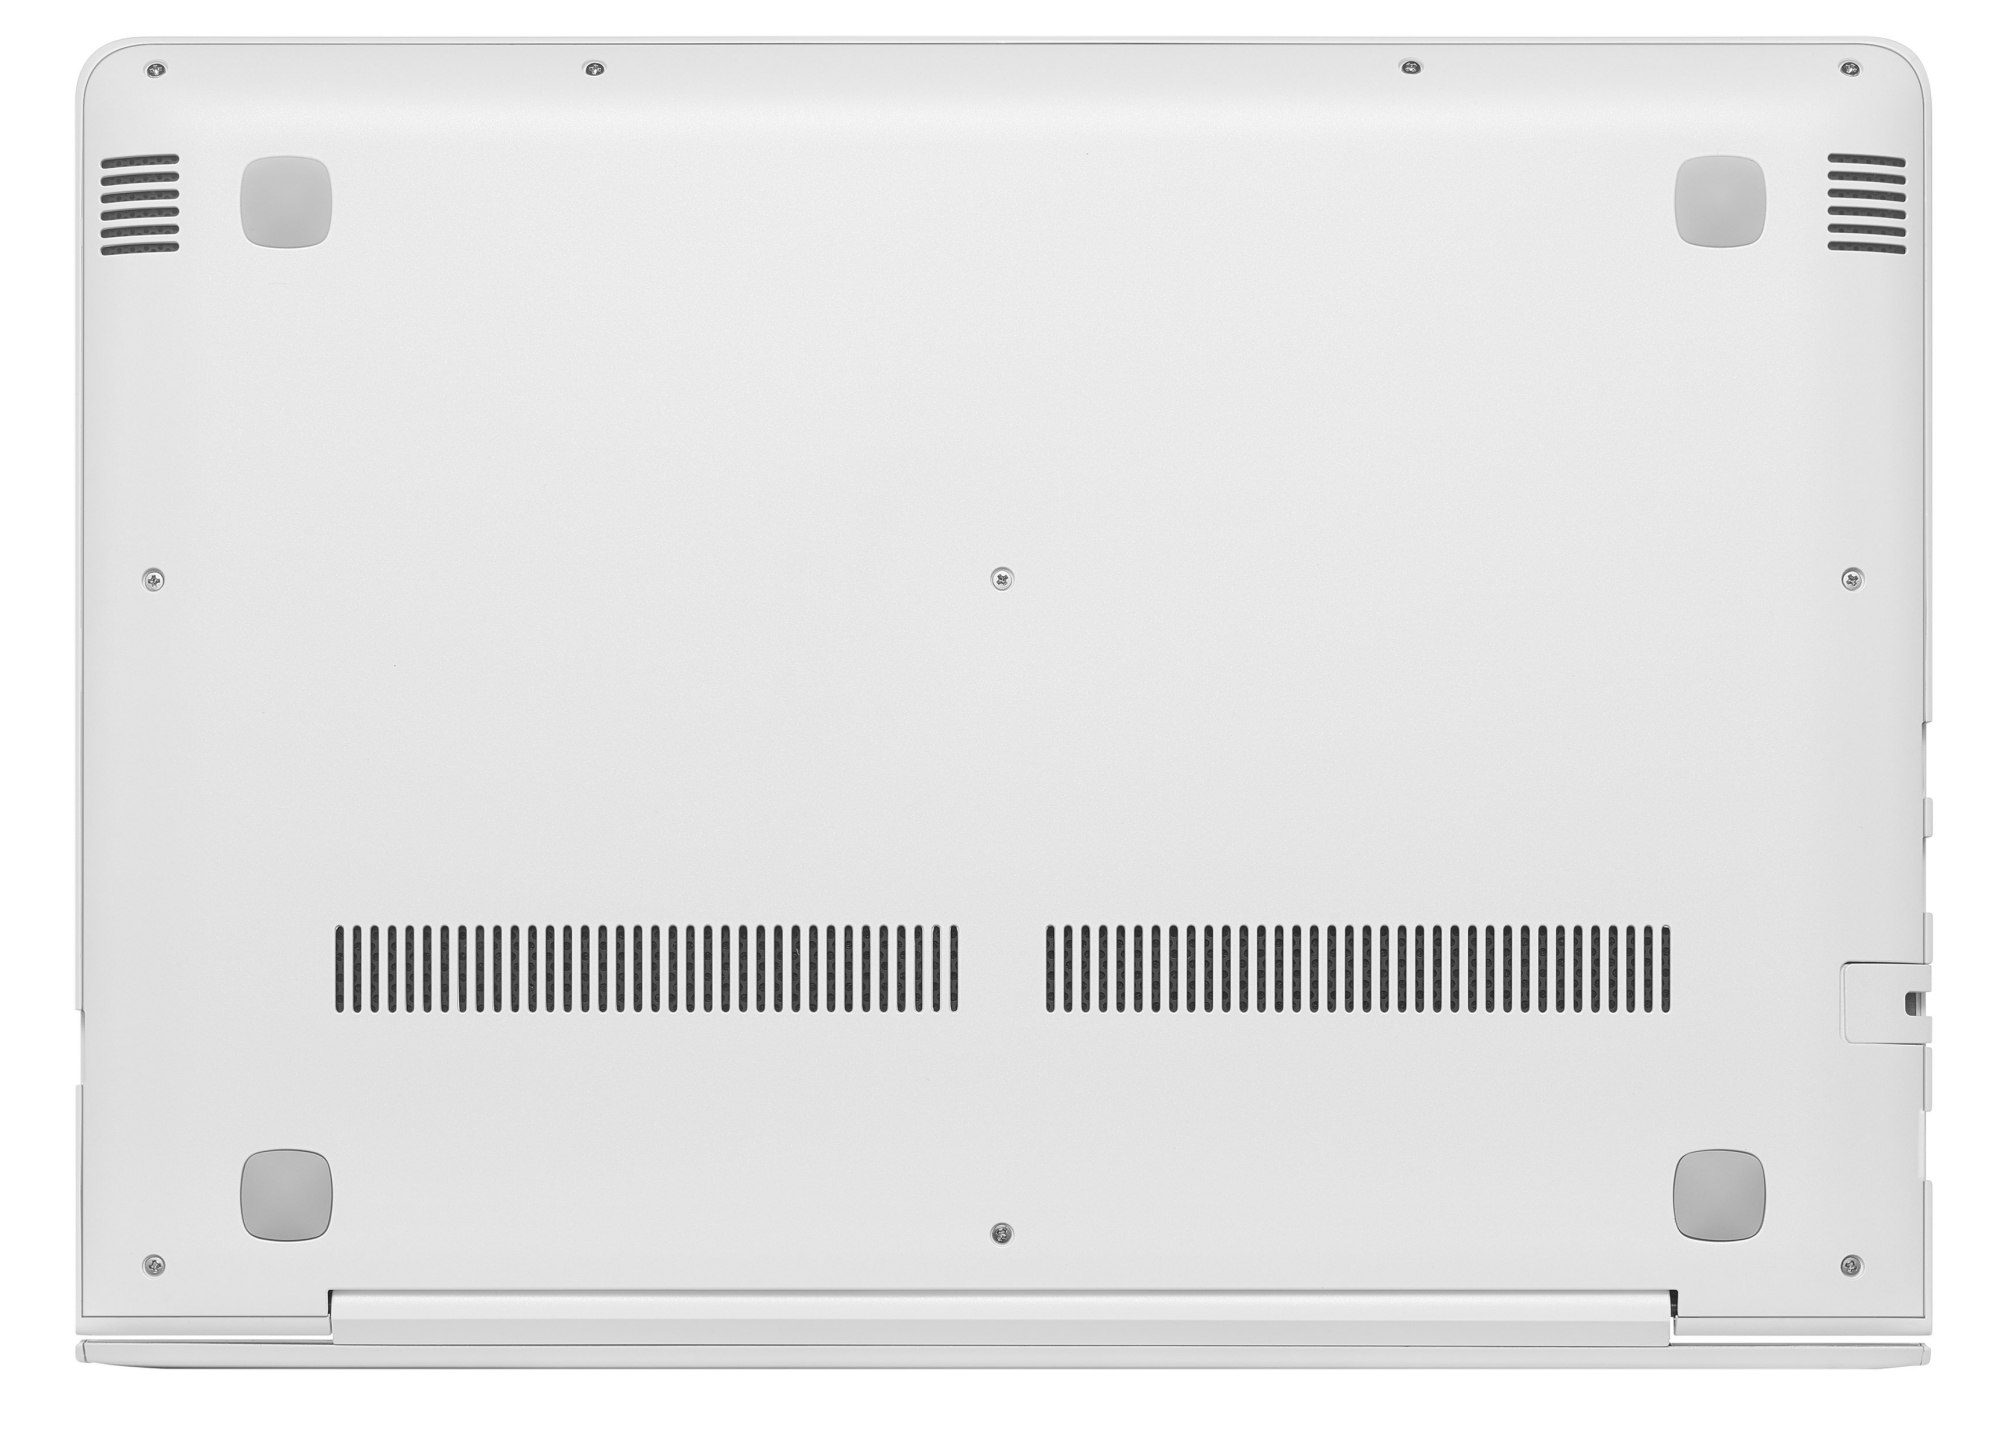
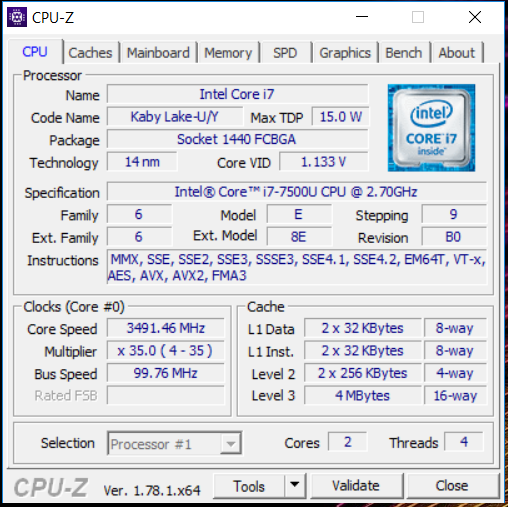
联想的13.3寸笔记本电脑现在升级到了Kaby Lake处理器。英特尔德最新处理器架构提供了可以满足未来几年需要的性能。Kaby Lake相比Skylake的性能提升并不会带来更高的系统噪音和发热量。一块固态硬盘可以带来高速的系统响应。同时用户也可以自行更换固态硬盘,不过这需要打开整个机身,因为它没有设计维护底盖。它的背光键盘整体上也十分优秀。
Kaby Lake处理器并没有带来实际优势。希望节省一些预算的用户,可以无需顾虑地选择搭配Skylake处理器的Ideapad。
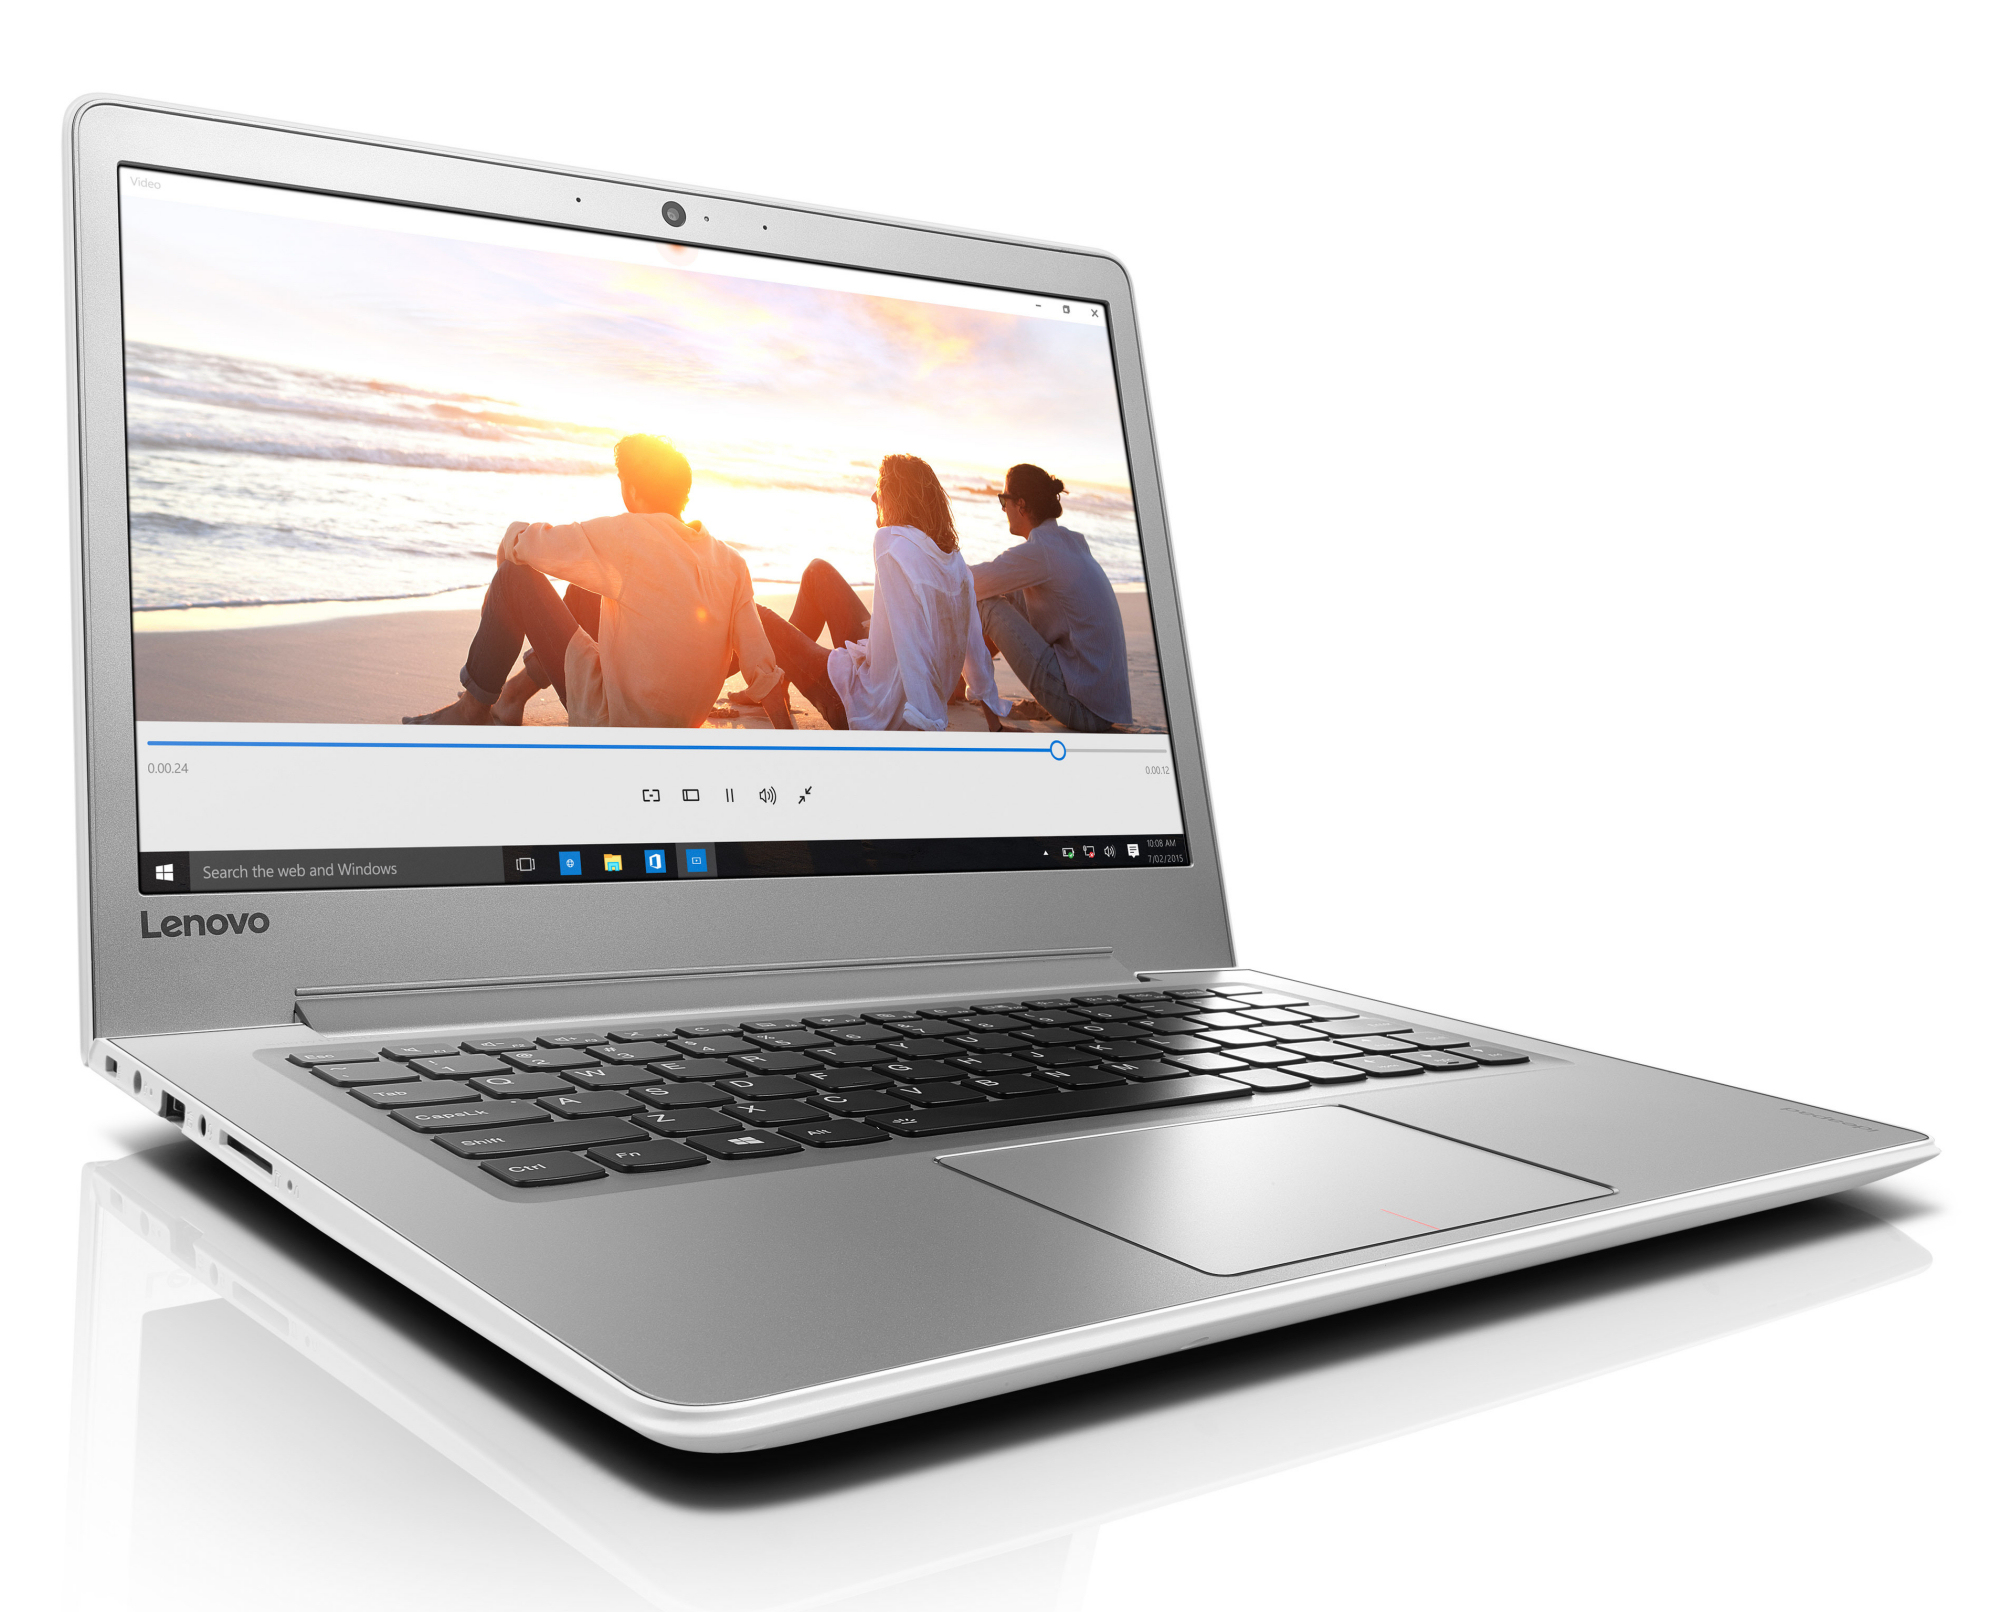
它的电池续航十分优秀。不过在这个价位上的一台13.3.寸笔记本应该可以做的更好。联想并不认为对13.3寸设备来说更长电池续航比更高性能重要。相比Kaby Lake处理器,这台Ideapad可能会从一块更大容量的电池中受益更多。它的全高清IPS屏幕提供了宽广的可视角度范围和不错的其他参数。不过,对于一台售价880欧元的笔记本电脑,我们期待它能更好一些。
注:本文是基于完整评测的缩减版本,阅读完整的英文评测,请点击这里。
Lenovo IdeaPad 510S-13IKB 80V00026GE
- 12/05/2016 v6 (old)
Sascha Mölck