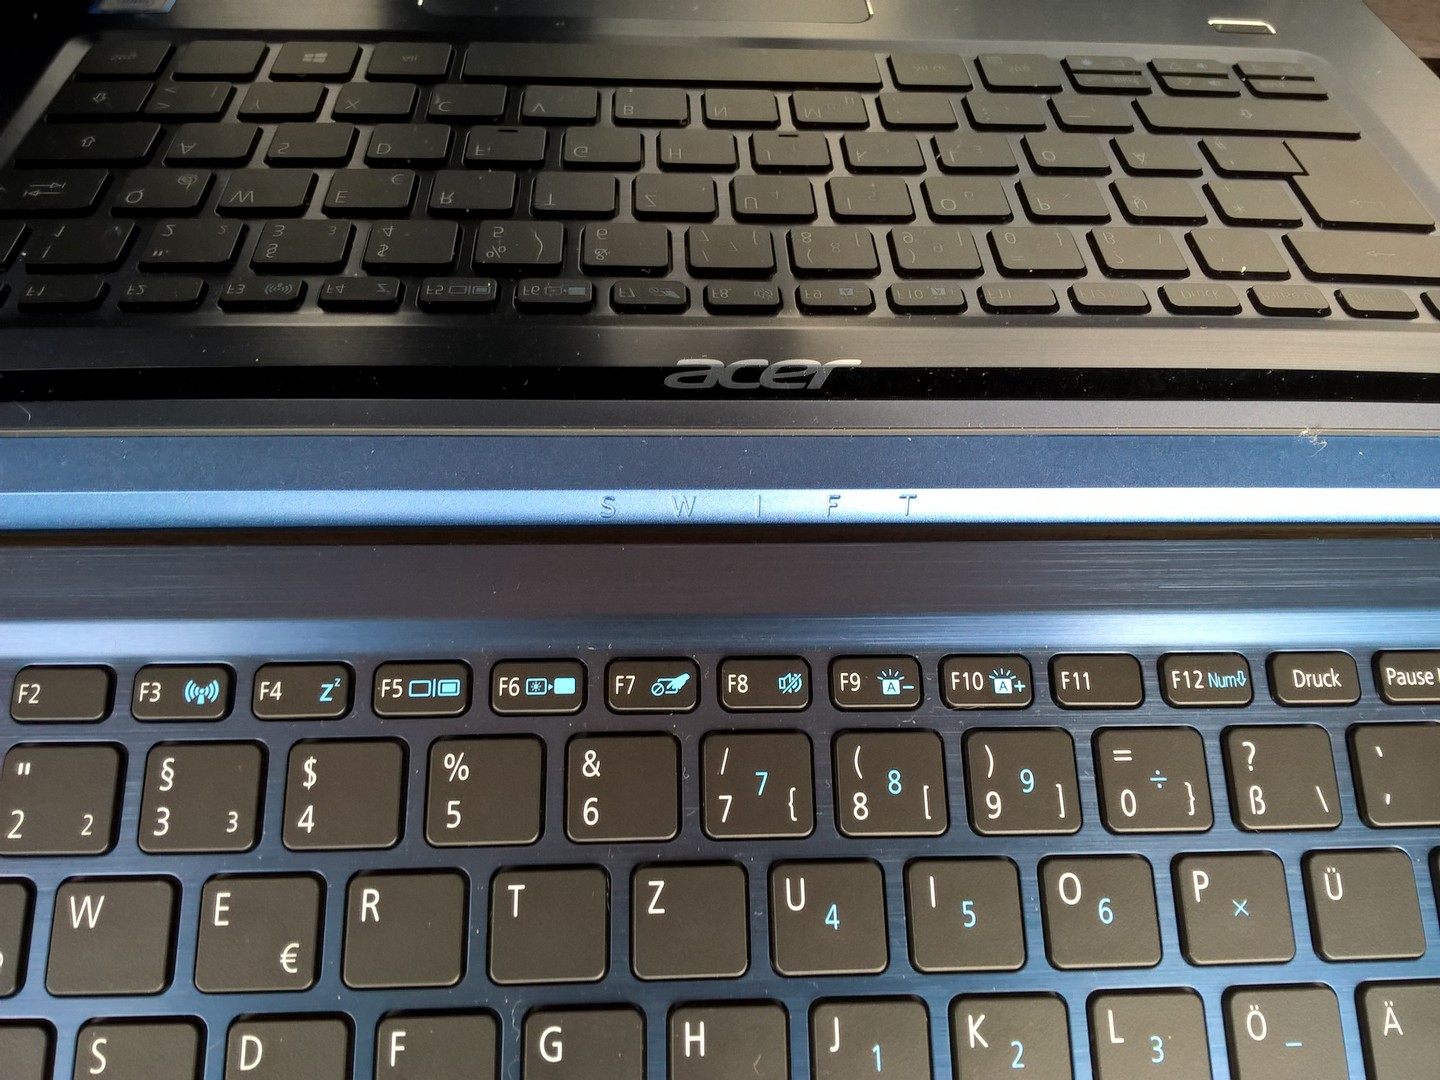
宏碁 Swift 3 (i5-7200U, HD 620) 笔记本电脑简短评测
| SD Card Reader | |
| average JPG Copy Test (av. of 3 runs) | |
| HP EliteBook 840 G4-Z2V49ET ABD | |
| Fujitsu LifeBook U747 | |
| Lenovo ThinkPad X1 Carbon 2017-20HR0021GE | |
| Acer TravelMate X349-G2 | |
| Acer Swift 3 (i5-7200U, HD 620) | |
| maximum AS SSD Seq Read Test (1GB) | |
| Lenovo ThinkPad X1 Carbon 2017-20HR0021GE | |
| HP EliteBook 840 G4-Z2V49ET ABD | |
| Fujitsu LifeBook U747 | |
| Acer Swift 3 (i5-7200U, HD 620) | |
| Acer TravelMate X349-G2 | |
| |||||||||||||||||||||||||
Brightness Distribution: 81 %
Center on Battery: 281 cd/m²
Contrast: 624:1 (Black: 0.45 cd/m²)
ΔE ColorChecker Calman: 4.19 | ∀{0.5-29.43 Ø4.71}
ΔE Greyscale Calman: 2.55 | ∀{0.09-98 Ø4.96}
61% sRGB (Argyll 1.6.3 3D)
39% AdobeRGB 1998 (Argyll 1.6.3 3D)
42.34% AdobeRGB 1998 (Argyll 3D)
61.4% sRGB (Argyll 3D)
40.96% Display P3 (Argyll 3D)
Gamma: 2.24
CCT: 6555 K
| Acer Swift 3 (i5-7200U, HD 620) Chi Mei CMN14C9, , 1920x1080, 14" | HP EliteBook 840 G4-Z2V49ET ABD AUO123D, , 1920x1080, 14" | Acer TravelMate X349-G2 ChiMei CN14C9, , 1920x1080, 14" | Fujitsu LifeBook U747 LG LP140WF3, , 1920x1080, 14" | Lenovo ThinkPad X1 Carbon 2017-20HR0021GE B140HAN03_1, , 1920x1080, 14" | |
|---|---|---|---|---|---|
| Display | 34% | 2% | 48% | 47% | |
| Display P3 Coverage (%) | 40.96 | 55.8 36% | 41.81 2% | 66.1 61% | 61.6 50% |
| sRGB Coverage (%) | 61.4 | 80.7 31% | 62.3 1% | 84.8 38% | 87.6 43% |
| AdobeRGB 1998 Coverage (%) | 42.34 | 57.7 36% | 43.26 2% | 62 46% | 62.6 48% |
| Response Times | 14% | -7% | 17% | -11% | |
| Response Time Grey 50% / Grey 80% * (ms) | 43 ? | 39 ? 9% | 43 ? -0% | 36 ? 16% | 48 ? -12% |
| Response Time Black / White * (ms) | 28 ? | 23 ? 18% | 32 ? -14% | 23.2 ? 17% | 30.4 ? -9% |
| PWM Frequency (Hz) | 200 ? | 25000 ? | |||
| Screen | -49% | -9% | 14% | 34% | |
| Brightness middle (cd/m²) | 281 | 346 23% | 271 -4% | 291 4% | 278 -1% |
| Brightness (cd/m²) | 259 | 317 22% | 253 -2% | 296 14% | 271 5% |
| Brightness Distribution (%) | 81 | 86 6% | 83 2% | 84 4% | 91 12% |
| Black Level * (cd/m²) | 0.45 | 0.86 -91% | 0.35 22% | 0.32 29% | 0.16 64% |
| Contrast (:1) | 624 | 402 -36% | 774 24% | 909 46% | 1738 179% |
| Colorchecker dE 2000 * | 4.19 | 8.64 -106% | 5.05 -21% | 4.3 -3% | 4.5 -7% |
| Colorchecker dE 2000 max. * | 10.64 | 13.58 -28% | 11.74 -10% | 7.5 30% | 8.4 21% |
| Greyscale dE 2000 * | 2.55 | 11.24 -341% | 4.3 -69% | 4.3 -69% | 3.2 -25% |
| Gamma | 2.24 98% | 2.62 84% | 2.44 90% | 2.31 95% | 2.02 109% |
| CCT | 6555 99% | 12530 52% | 6726 97% | 6529 100% | 7042 92% |
| Color Space (Percent of AdobeRGB 1998) (%) | 39 | 52 33% | 42 8% | 55.46 42% | 57 46% |
| Color Space (Percent of sRGB) (%) | 61 | 80 31% | 39 -36% | 84.77 39% | 87.5 43% |
| Total Average (Program / Settings) | -0% /
-24% | -5% /
-6% | 26% /
21% | 23% /
30% |
* ... smaller is better
Display Response Times
| ↔ Response Time Black to White | ||
|---|---|---|
| 28 ms ... rise ↗ and fall ↘ combined | ↗ 15 ms rise | 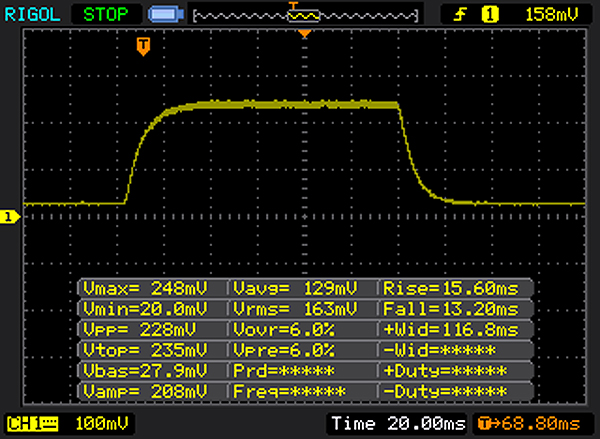 |
| ↘ 13 ms fall | ||
| The screen shows relatively slow response rates in our tests and may be too slow for gamers. In comparison, all tested devices range from 0.1 (minimum) to 240 (maximum) ms. » 71 % of all devices are better. This means that the measured response time is worse than the average of all tested devices (19.8 ms). | ||
| ↔ Response Time 50% Grey to 80% Grey | ||
| 43 ms ... rise ↗ and fall ↘ combined | ↗ 24 ms rise | 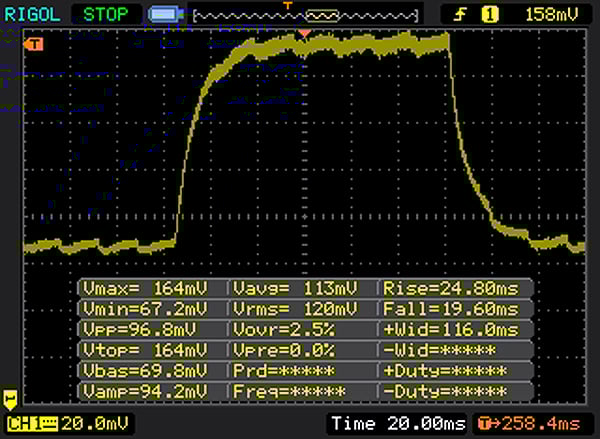 |
| ↘ 19 ms fall | ||
| The screen shows slow response rates in our tests and will be unsatisfactory for gamers. In comparison, all tested devices range from 0.165 (minimum) to 636 (maximum) ms. » 71 % of all devices are better. This means that the measured response time is worse than the average of all tested devices (31 ms). | ||
Screen Flickering / PWM (Pulse-Width Modulation)
| Screen flickering / PWM detected | 200 Hz | ≤ 20 % brightness setting | 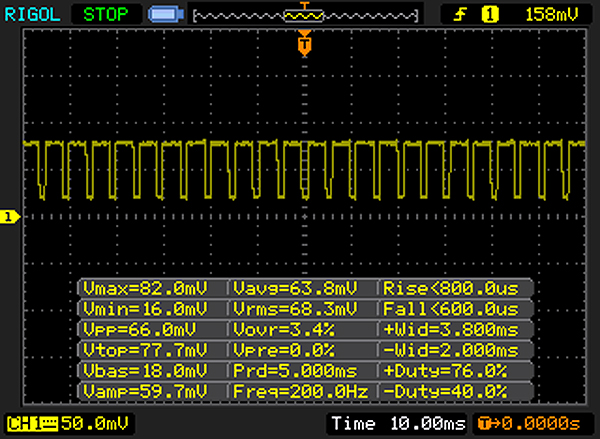 |
The display backlight flickers at 200 Hz (worst case, e.g., utilizing PWM) Flickering detected at a brightness setting of 20 % and below. There should be no flickering or PWM above this brightness setting. The frequency of 200 Hz is relatively low, so sensitive users will likely notice flickering and experience eyestrain at the stated brightness setting and below. In comparison: 52 % of all tested devices do not use PWM to dim the display. If PWM was detected, an average of 7754 (minimum: 5 - maximum: 343500) Hz was measured. | |||
| PCMark 8 - Home Score Accelerated v2 | |
| Lenovo ThinkPad X1 Carbon 2017-20HR0021GE | |
| Acer TravelMate X349-G2 | |
| Acer Swift 3 (i5-7200U, HD 620) | |
| Fujitsu LifeBook U747 | |
| HP EliteBook 840 G4-Z2V49ET ABD | |
| PCMark 8 Home Score Accelerated v2 | 3636 points | |
Help | ||
| Acer Swift 3 (i5-7200U, HD 620) Intel SSD 600p SSDPEKKW256G7 | HP EliteBook 840 G4-Z2V49ET ABD Samsung PM961 MZVLW256HEHP | Acer TravelMate X349-G2 Intel SSD 600p SSDPEKKW512G7 | Fujitsu LifeBook U747 Samsung MZYTY256HDHP | Lenovo ThinkPad X1 Carbon 2017-20HR0021GE Toshiba THNSF5256GPUK | |
|---|---|---|---|---|---|
| CrystalDiskMark 3.0 | 63% | 19% | -18% | 11% | |
| Write 4k QD32 (MB/s) | 251 | 410.2 63% | 210.8 -16% | 249.7 -1% | 241.2 -4% |
| Read 4k QD32 (MB/s) | 290.1 | 513 77% | 373.7 29% | 399.1 38% | 477.3 65% |
| Write 4k (MB/s) | 108.3 | 157.1 45% | 133.4 23% | 87.8 -19% | 128.5 19% |
| Read 4k (MB/s) | 31.6 | 61.4 94% | 34.93 11% | 35.73 13% | 34.63 10% |
| Write 512 (MB/s) | 564 | 804 43% | 586 4% | 283.4 -50% | 311 -45% |
| Read 512 (MB/s) | 800 | 922 15% | 1134 42% | 396.7 -50% | 972 22% |
| Write Seq (MB/s) | 606 | 1263 108% | 582 -4% | 497.8 -18% | 648 7% |
| Read Seq (MB/s) | 1137 | 1819 60% | 1818 60% | 504 -56% | 1277 12% |

| 3DMark 11 - 1280x720 Performance GPU | |
| Lenovo ThinkPad X1 Carbon 2017-20HR0021GE | |
| Acer Swift 3 (i5-7200U, HD 620) | |
| HP EliteBook 840 G4-Z2V49ET ABD | |
| Fujitsu LifeBook U747 | |
| 3DMark 11 Performance | 1662 points | |
Help | ||
| low | med. | high | ultra | |
|---|---|---|---|---|
| BioShock Infinite (2013) | 48.61 | 30.87 | 25.2 | 7.83 |
Noise level
| Idle |
| 30.6 / 30.6 / 31.1 dB(A) |
| Load |
| 34 / 31.45 dB(A) |
 | ||
30 dB silent 40 dB(A) audible 50 dB(A) loud |
||
min: | ||
(+) The maximum temperature on the upper side is 39.6 °C / 103 F, compared to the average of 35.9 °C / 97 F, ranging from 21.4 to 59 °C for the class Subnotebook.
(±) The bottom heats up to a maximum of 40.4 °C / 105 F, compared to the average of 39.2 °C / 103 F
(+) In idle usage, the average temperature for the upper side is 22.7 °C / 73 F, compared to the device average of 30.8 °C / 87 F.
(+) The palmrests and touchpad are cooler than skin temperature with a maximum of 29.5 °C / 85.1 F and are therefore cool to the touch.
(±) The average temperature of the palmrest area of similar devices was 28.2 °C / 82.8 F (-1.3 °C / -2.3 F).
Acer Swift 3 (i5-7200U, HD 620) audio analysis
(-) | not very loud speakers (70.3 dB)
Bass 100 - 315 Hz
(-) | nearly no bass - on average 19.5% lower than median
(±) | linearity of bass is average (12.7% delta to prev. frequency)
Mids 400 - 2000 Hz
(+) | balanced mids - only 3.2% away from median
(±) | linearity of mids is average (9% delta to prev. frequency)
Highs 2 - 16 kHz
(+) | balanced highs - only 2.8% away from median
(+) | highs are linear (6.1% delta to prev. frequency)
Overall 100 - 16.000 Hz
(±) | linearity of overall sound is average (20.7% difference to median)
Compared to same class
» 68% of all tested devices in this class were better, 7% similar, 25% worse
» The best had a delta of 5%, average was 18%, worst was 53%
Compared to all devices tested
» 56% of all tested devices were better, 8% similar, 36% worse
» The best had a delta of 4%, average was 23%, worst was 134%
Apple MacBook 12 (Early 2016) 1.1 GHz audio analysis
(+) | speakers can play relatively loud (83.6 dB)
Bass 100 - 315 Hz
(±) | reduced bass - on average 11.3% lower than median
(±) | linearity of bass is average (14.2% delta to prev. frequency)
Mids 400 - 2000 Hz
(+) | balanced mids - only 2.4% away from median
(+) | mids are linear (5.5% delta to prev. frequency)
Highs 2 - 16 kHz
(+) | balanced highs - only 2% away from median
(+) | highs are linear (4.5% delta to prev. frequency)
Overall 100 - 16.000 Hz
(+) | overall sound is linear (10.2% difference to median)
Compared to same class
» 7% of all tested devices in this class were better, 2% similar, 90% worse
» The best had a delta of 5%, average was 18%, worst was 53%
Compared to all devices tested
» 5% of all tested devices were better, 1% similar, 94% worse
» The best had a delta of 4%, average was 23%, worst was 134%
| Off / Standby | |
| Idle | |
| Load |
|
Key:
min: | |
Pros
Cons
Verdict
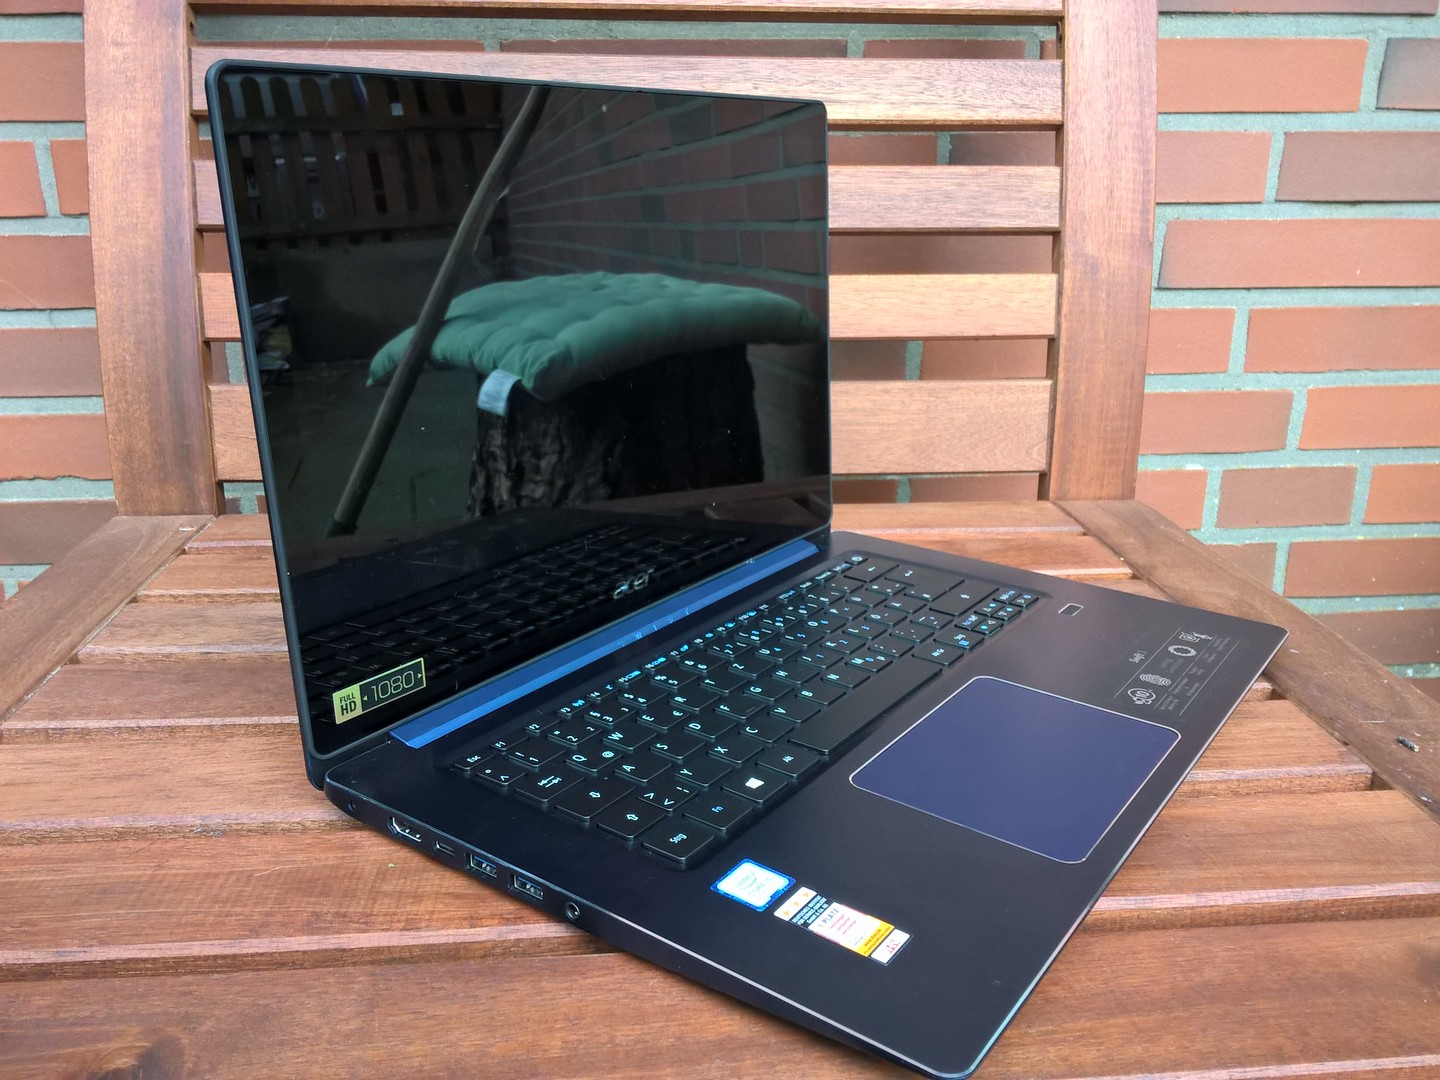
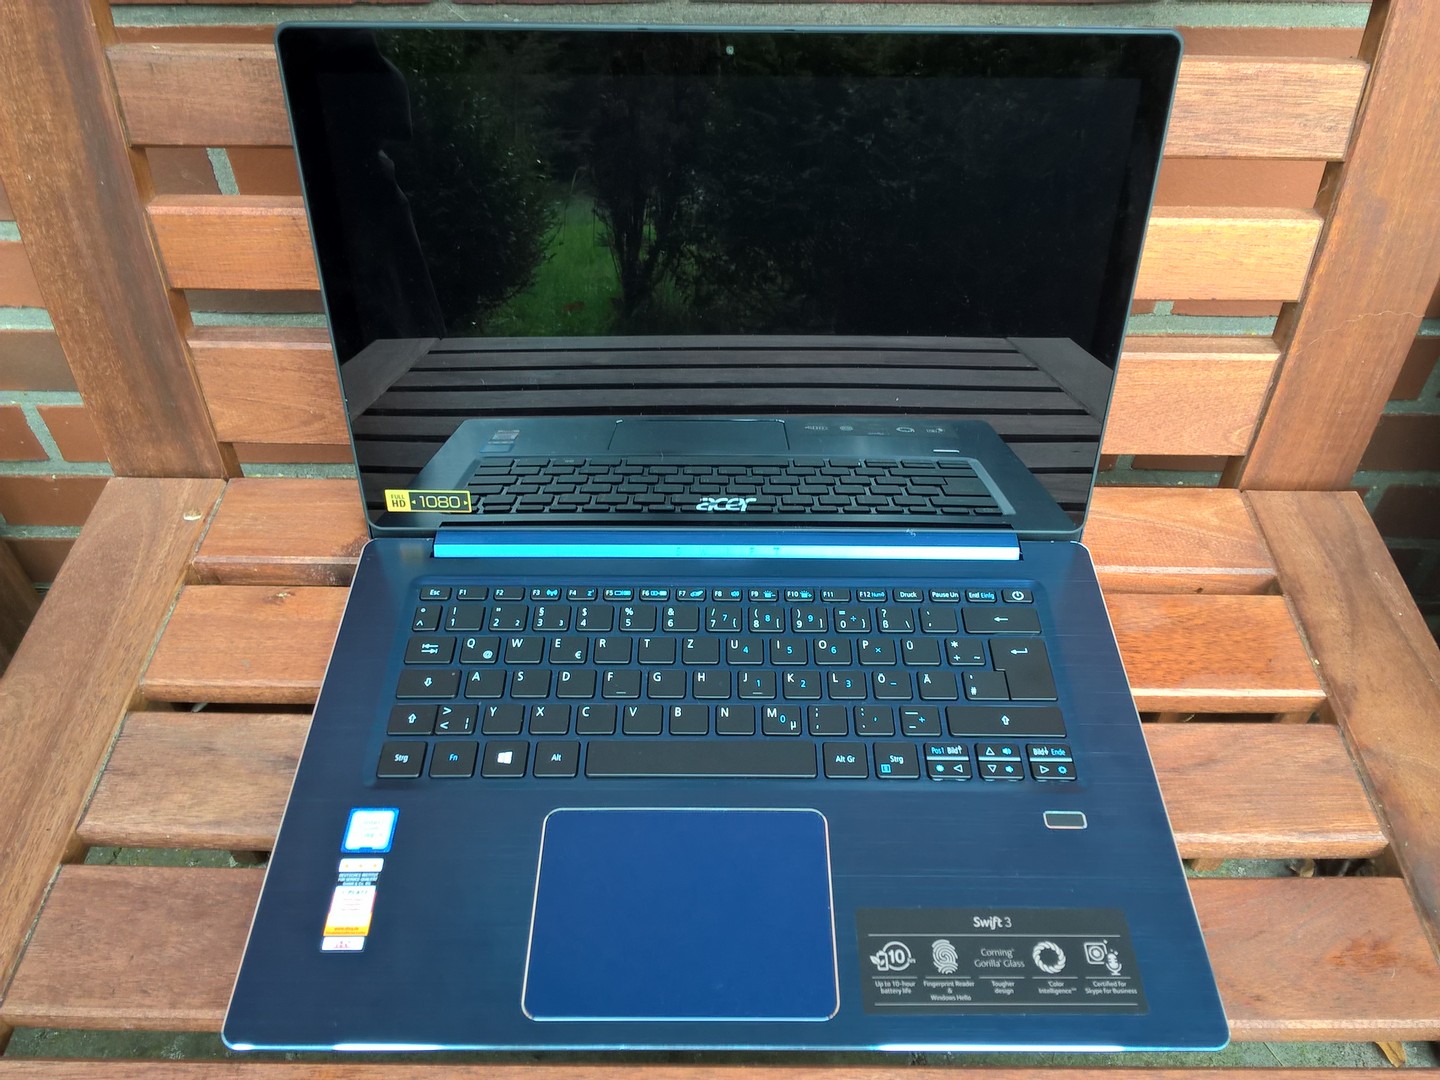
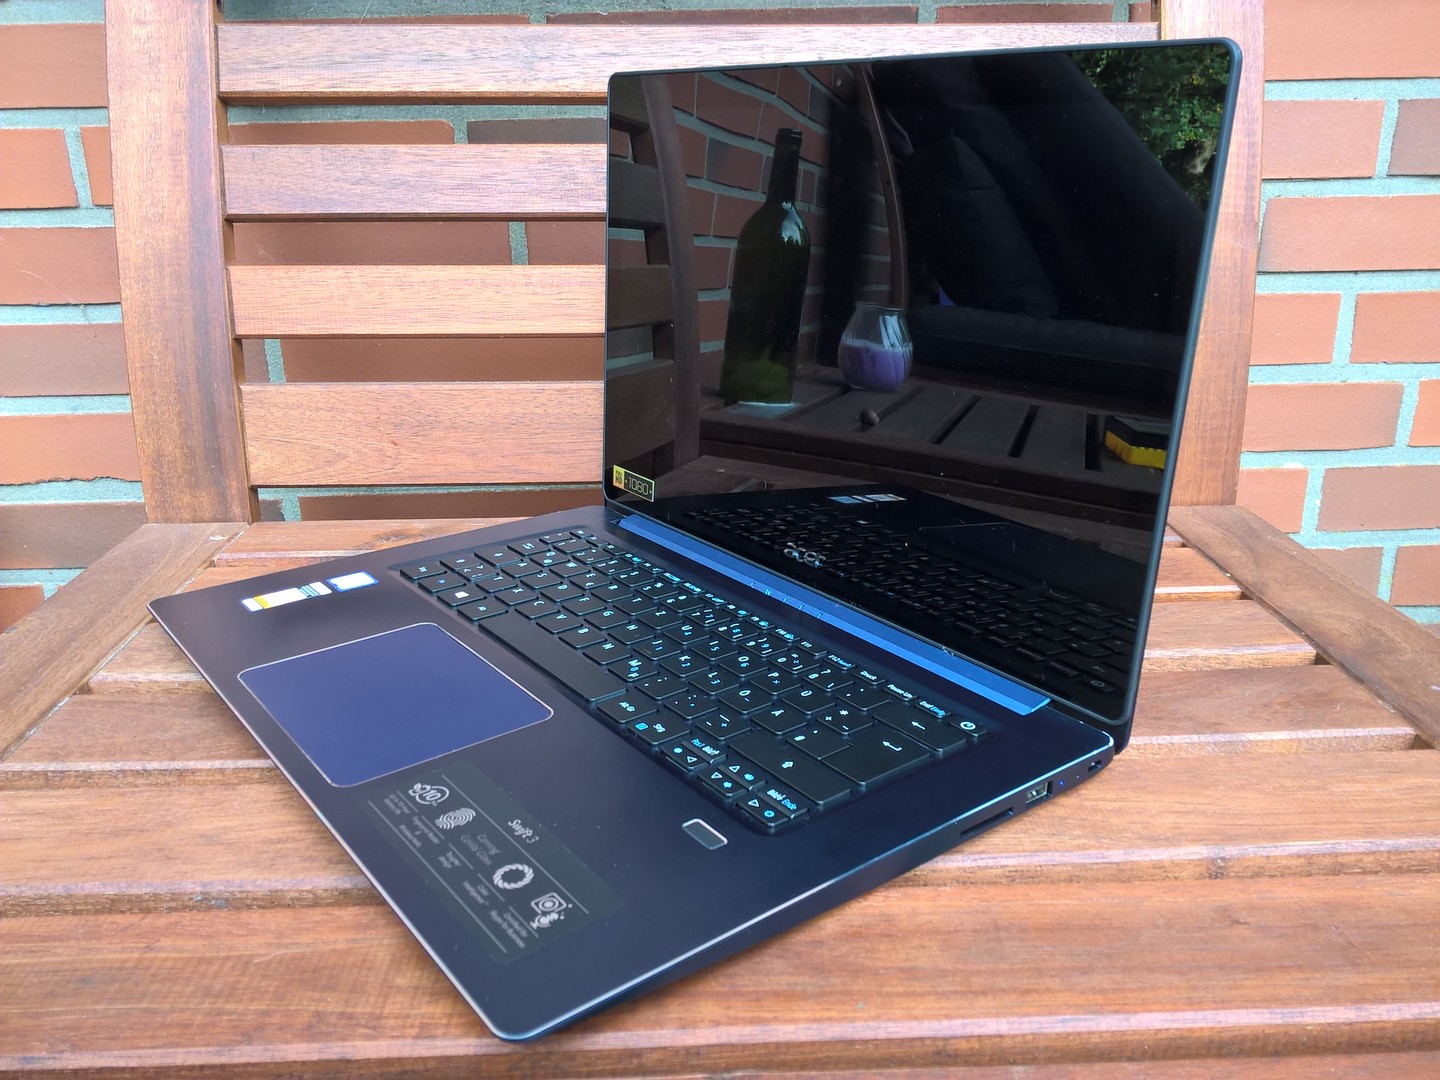
Swift 3是一台适合日常使用的笔记本电脑。设计富有吸引力,内部配置也物有所值。由我们的测试结果可以得知,我们的测试机甚至可以和价格更高的竞品抗衡。实际性能也和同配置的机型相当。可以说宏碁的这台机子,性价比很高。
Swift3适合那些需要便携设备的设计行业的用户使用。然而,它那块很容易反光的屏幕还是不适合户外使用。
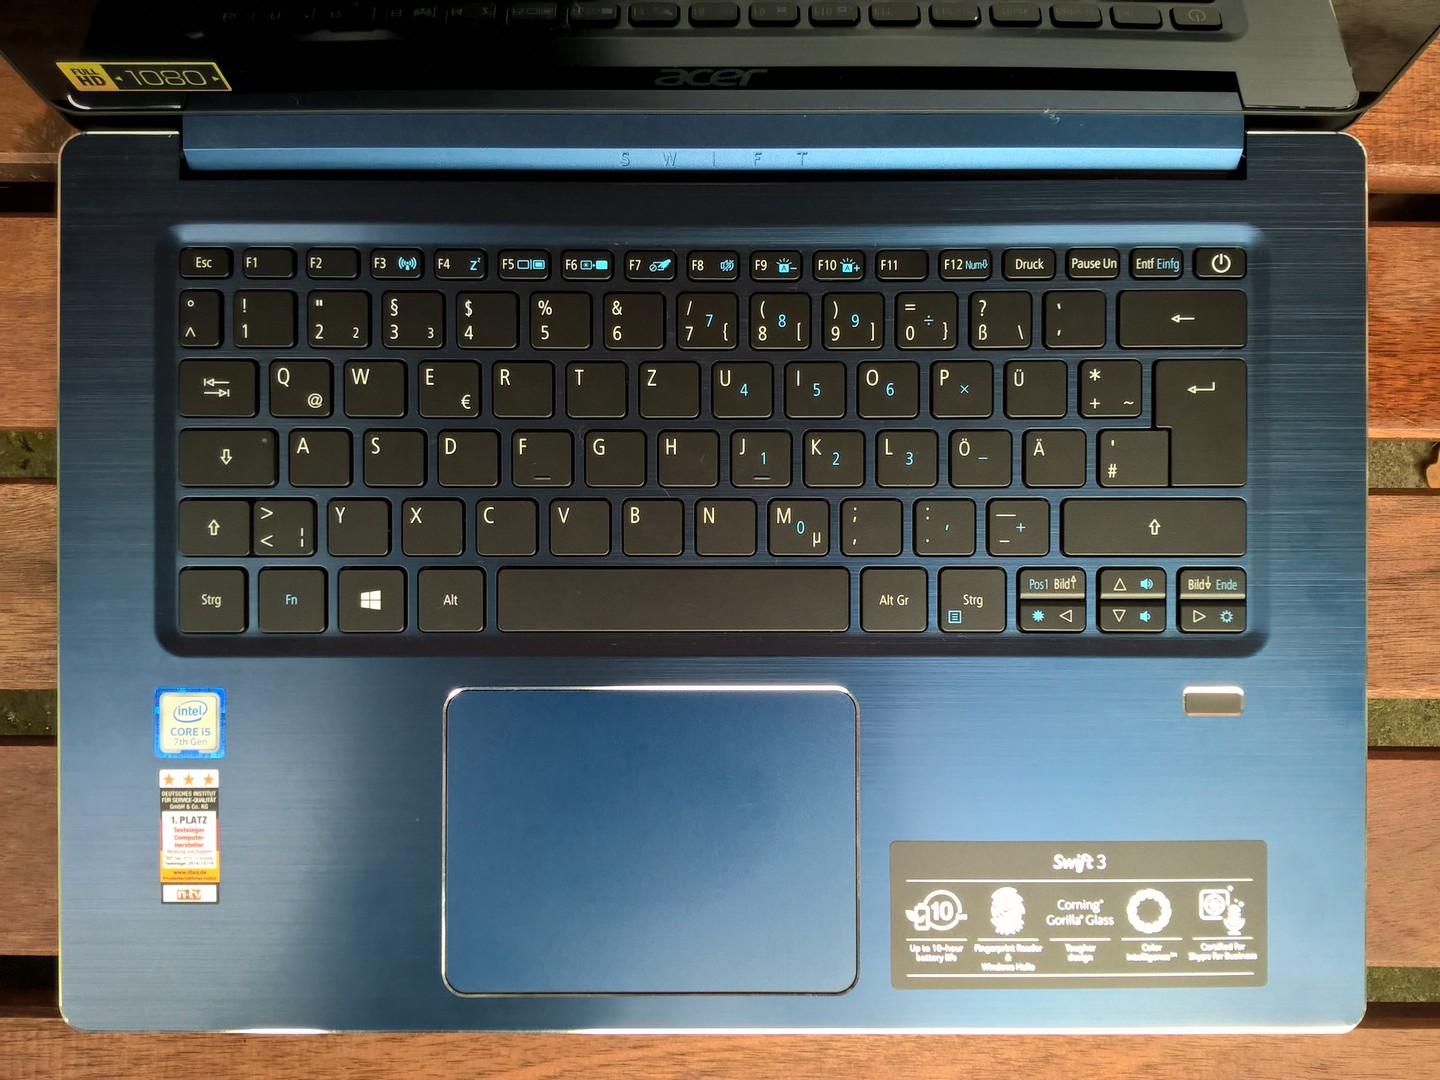
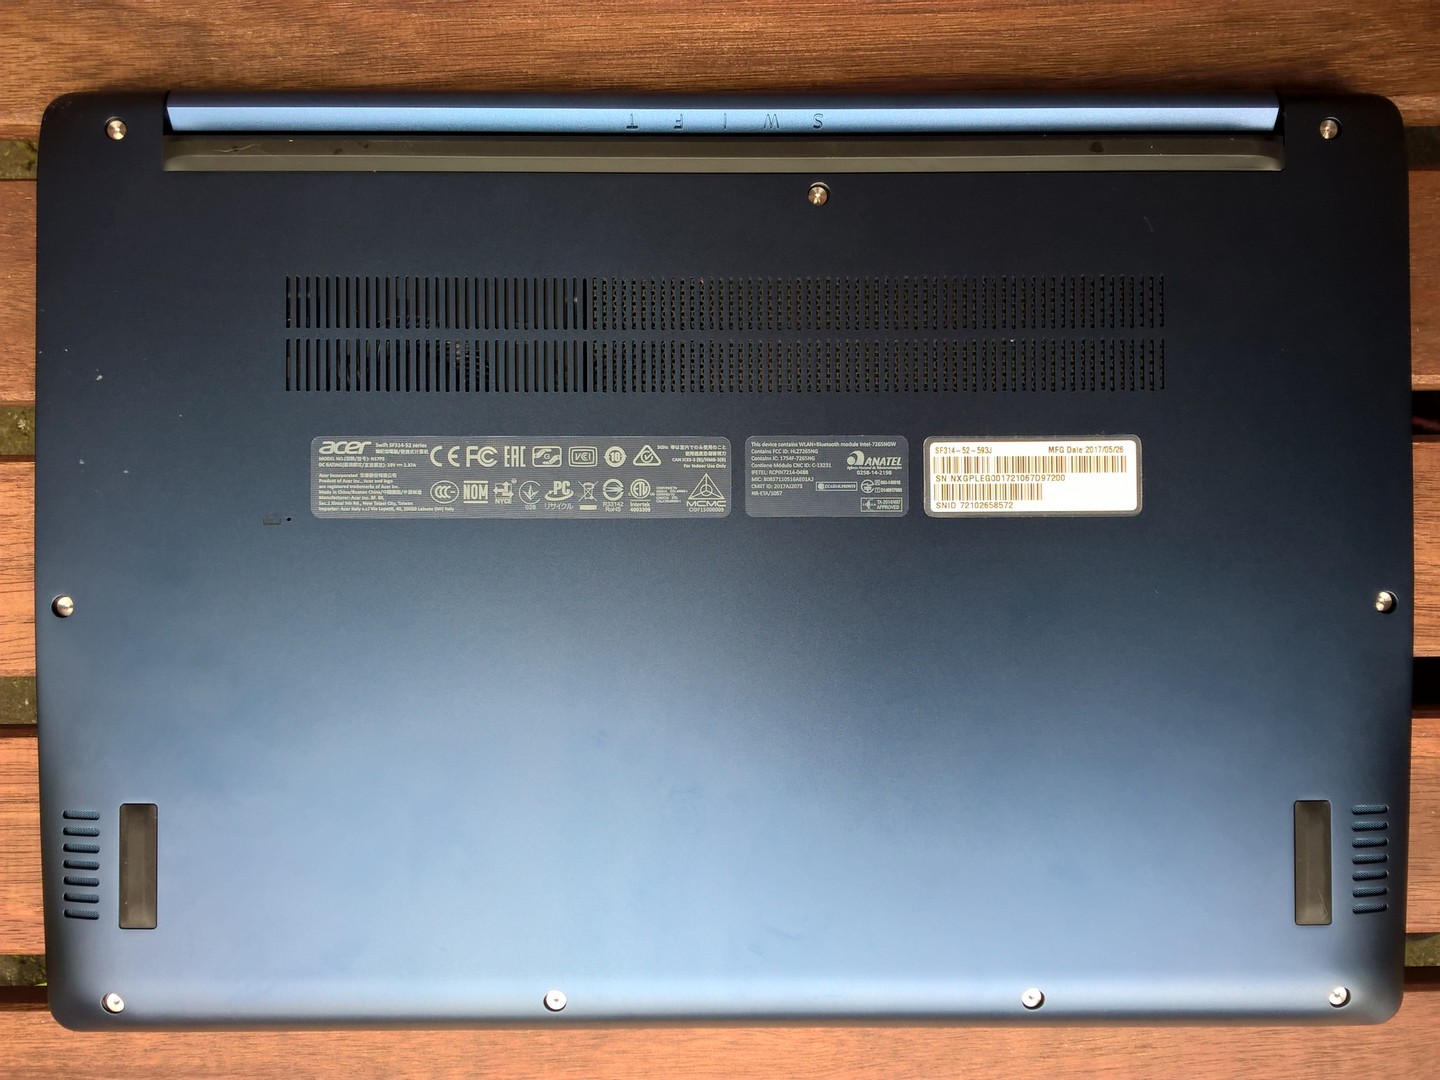
维护性的缺失,使得Swift 3略显失色。非专业的用户难以在不破坏它的情况下打开机身。因此,风扇不能自己清灰,内存条也难以更换。用户必须在移动性和反光屏幕之间做出权衡。
注:本文是基于完整评测的缩减版本,阅读完整的英文评测,请点击这里。
Acer Swift 3 (i5-7200U, HD 620)
- 10/07/2017 v6 (old)
Mike Wobker