微软 Surface Laptop Go 3 评测 - 没有键盘照明的高价次笔记本电脑
与新款 Surface Laptop Studio 2 (在这里回顾),微软还推出了新版 Surface Laptop Go。在第三代产品中,来自雷德蒙德的制造商将旧版的Tiger Lake 处理器换成了去年的 Alder Lake 芯片,并提供 16 GB 的可选内存。虽然 Surface Laptop Studio 至少有一些其他方面的改变(如更多的端口),但 Surface Laptop Go 3 在所有其他方面都与前代产品完全相同,包括缺少键盘背光。不过,作为回报,便宜的机型已被淘汰,配备 酷睿 i5-1235U8 GB 内存和 256 GB 固态硬盘的基本型号售价为 899 欧元。如果你想要 16GB 内存,则需要支付 1,149 欧元(约合 5,000 美元)的相同配置。
最后,这款 Apple MacBook Air M1的最大竞争对手。在 Windows 阵营中,有 戴尔 XPS 13和 13.3 英寸可折叠电脑 联想 Yoga 6也在这个价格范围内。
潜在的竞争对手比较
Rating | Date | Model | Weight | Height | Size | Resolution | Price |
|---|---|---|---|---|---|---|---|
| 83.3 % v7 (old) | 10 / 2023 | Microsoft Surface Laptop Go 3 i5-1235U, Iris Xe G7 80EUs | 1.1 kg | 15.7 mm | 12.40" | 1536x1024 | |
| 91.1 % v7 (old) | 12 / 2020 | Apple MacBook Air 2020 M1 Entry M1, M1 7-Core GPU | 1.3 kg | 16.1 mm | 13.30" | 2560x1600 | |
| 88.2 % v7 (old) | 08 / 2022 | Dell XPS 13 9315, i5-1230U i5-1230U, Iris Xe G7 80EUs | 1.2 kg | 14 mm | 13.40" | 1920x1200 | |
| 88 % v7 (old) | 03 / 2023 | Lenovo Yoga 6 13 83B2001SGE R7 7730U, Vega 8 | 1.4 kg | 18.6 mm | 13.30" | 1920x1200 |
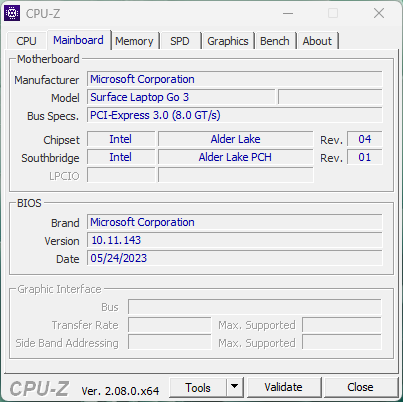
案例与设备
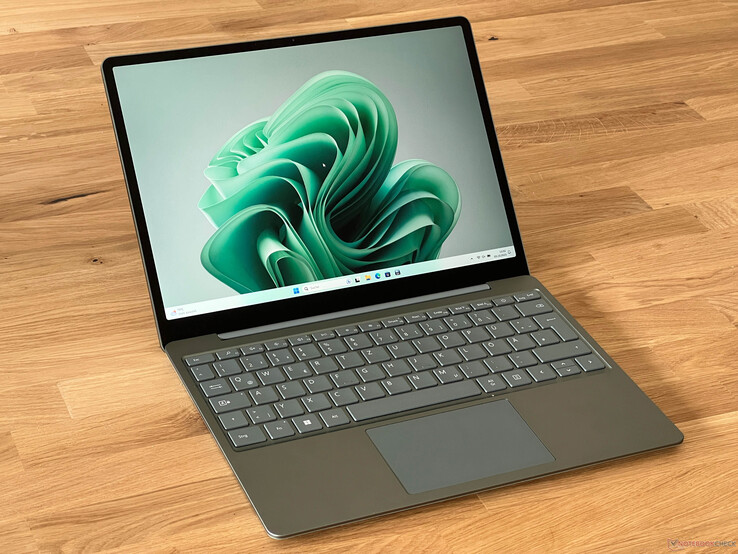
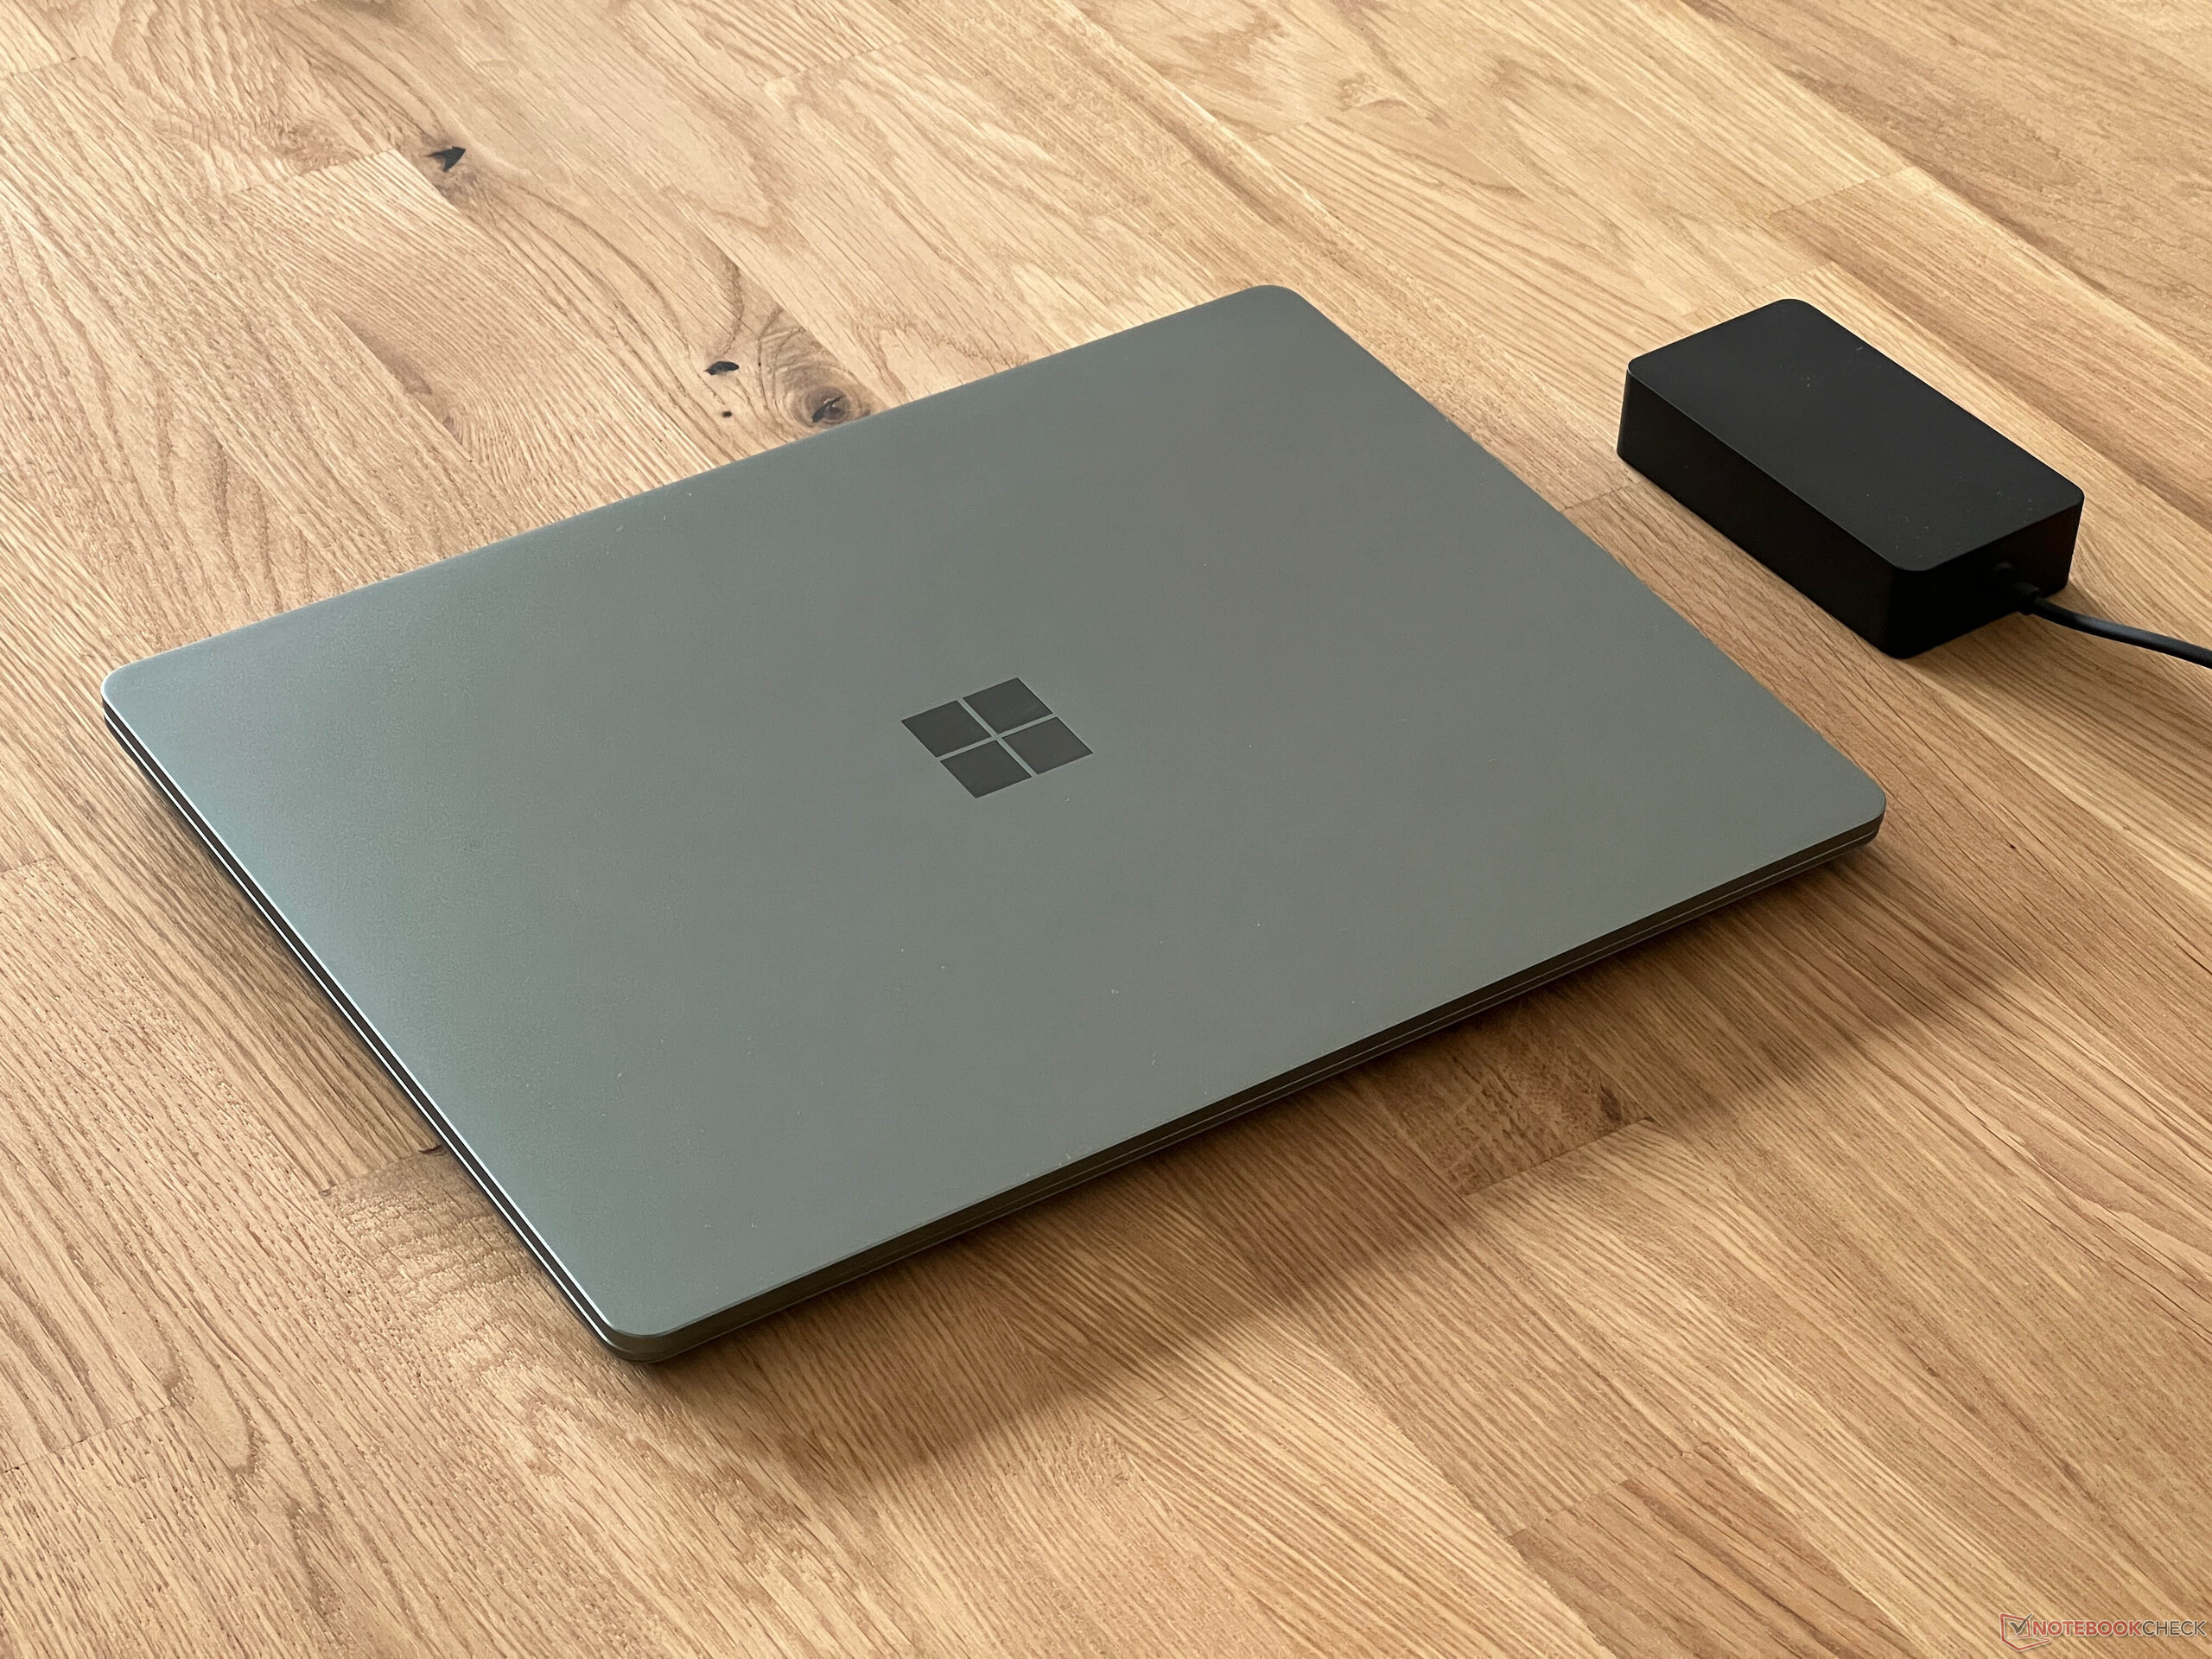
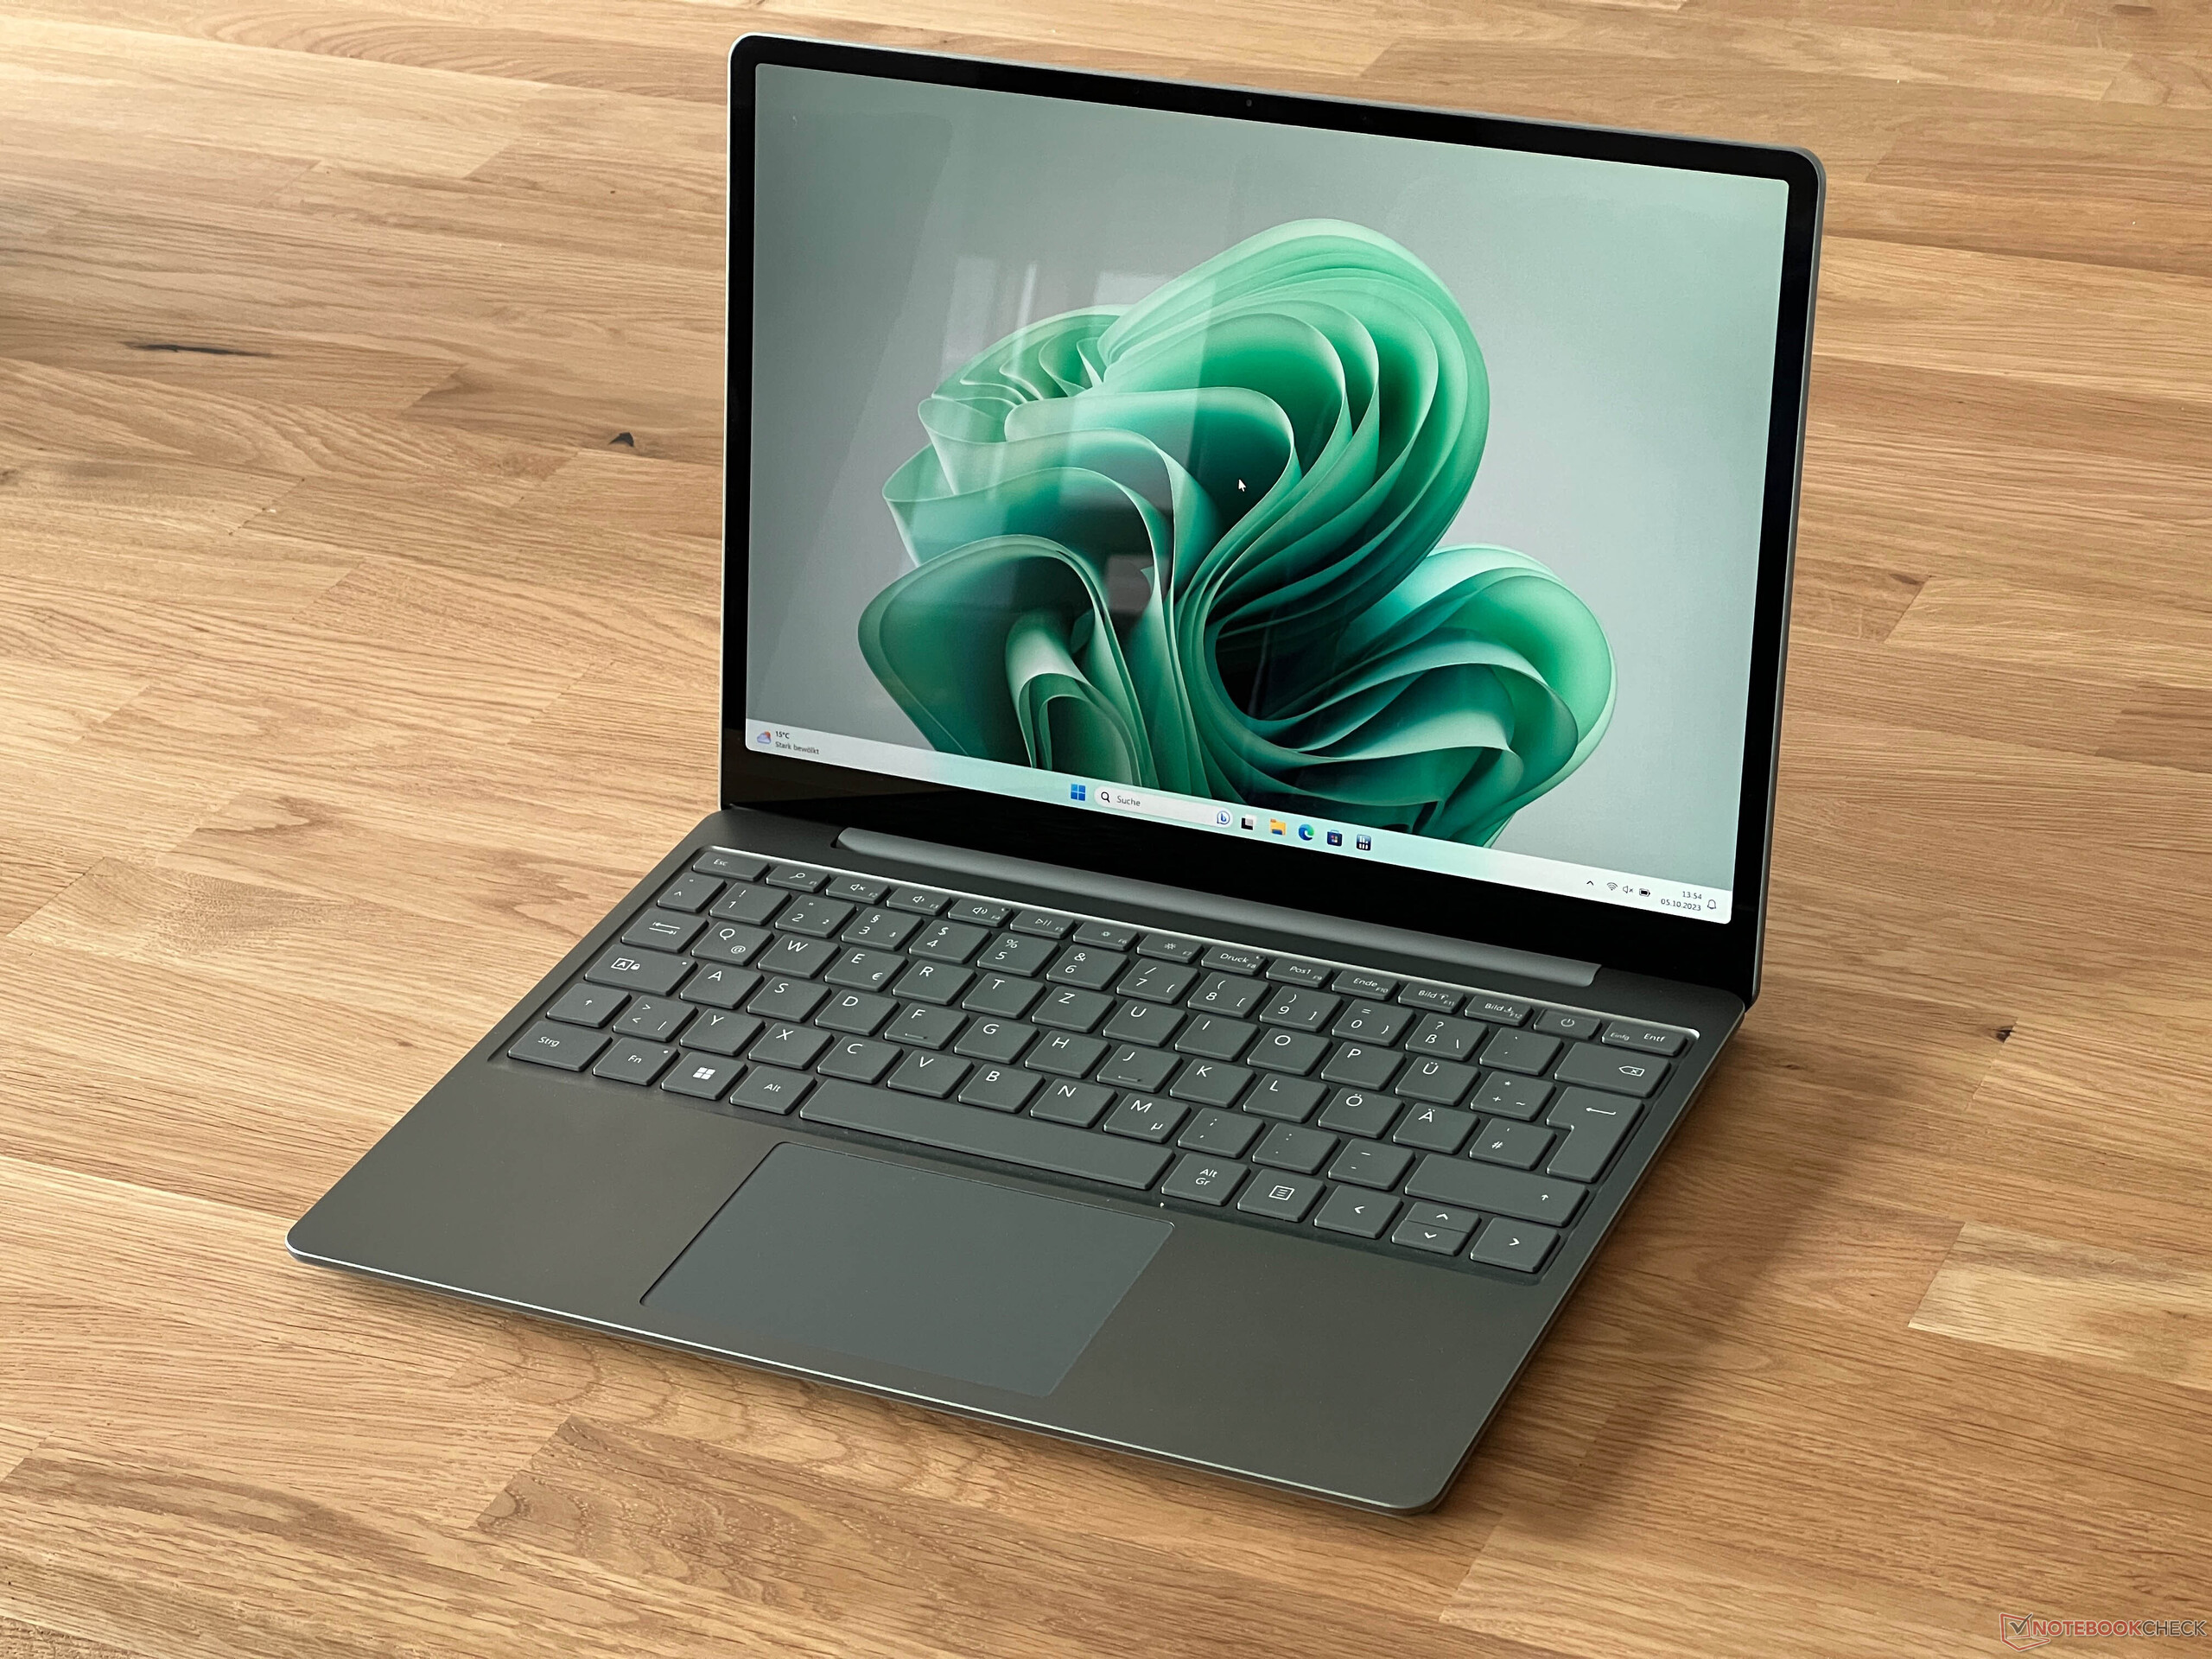
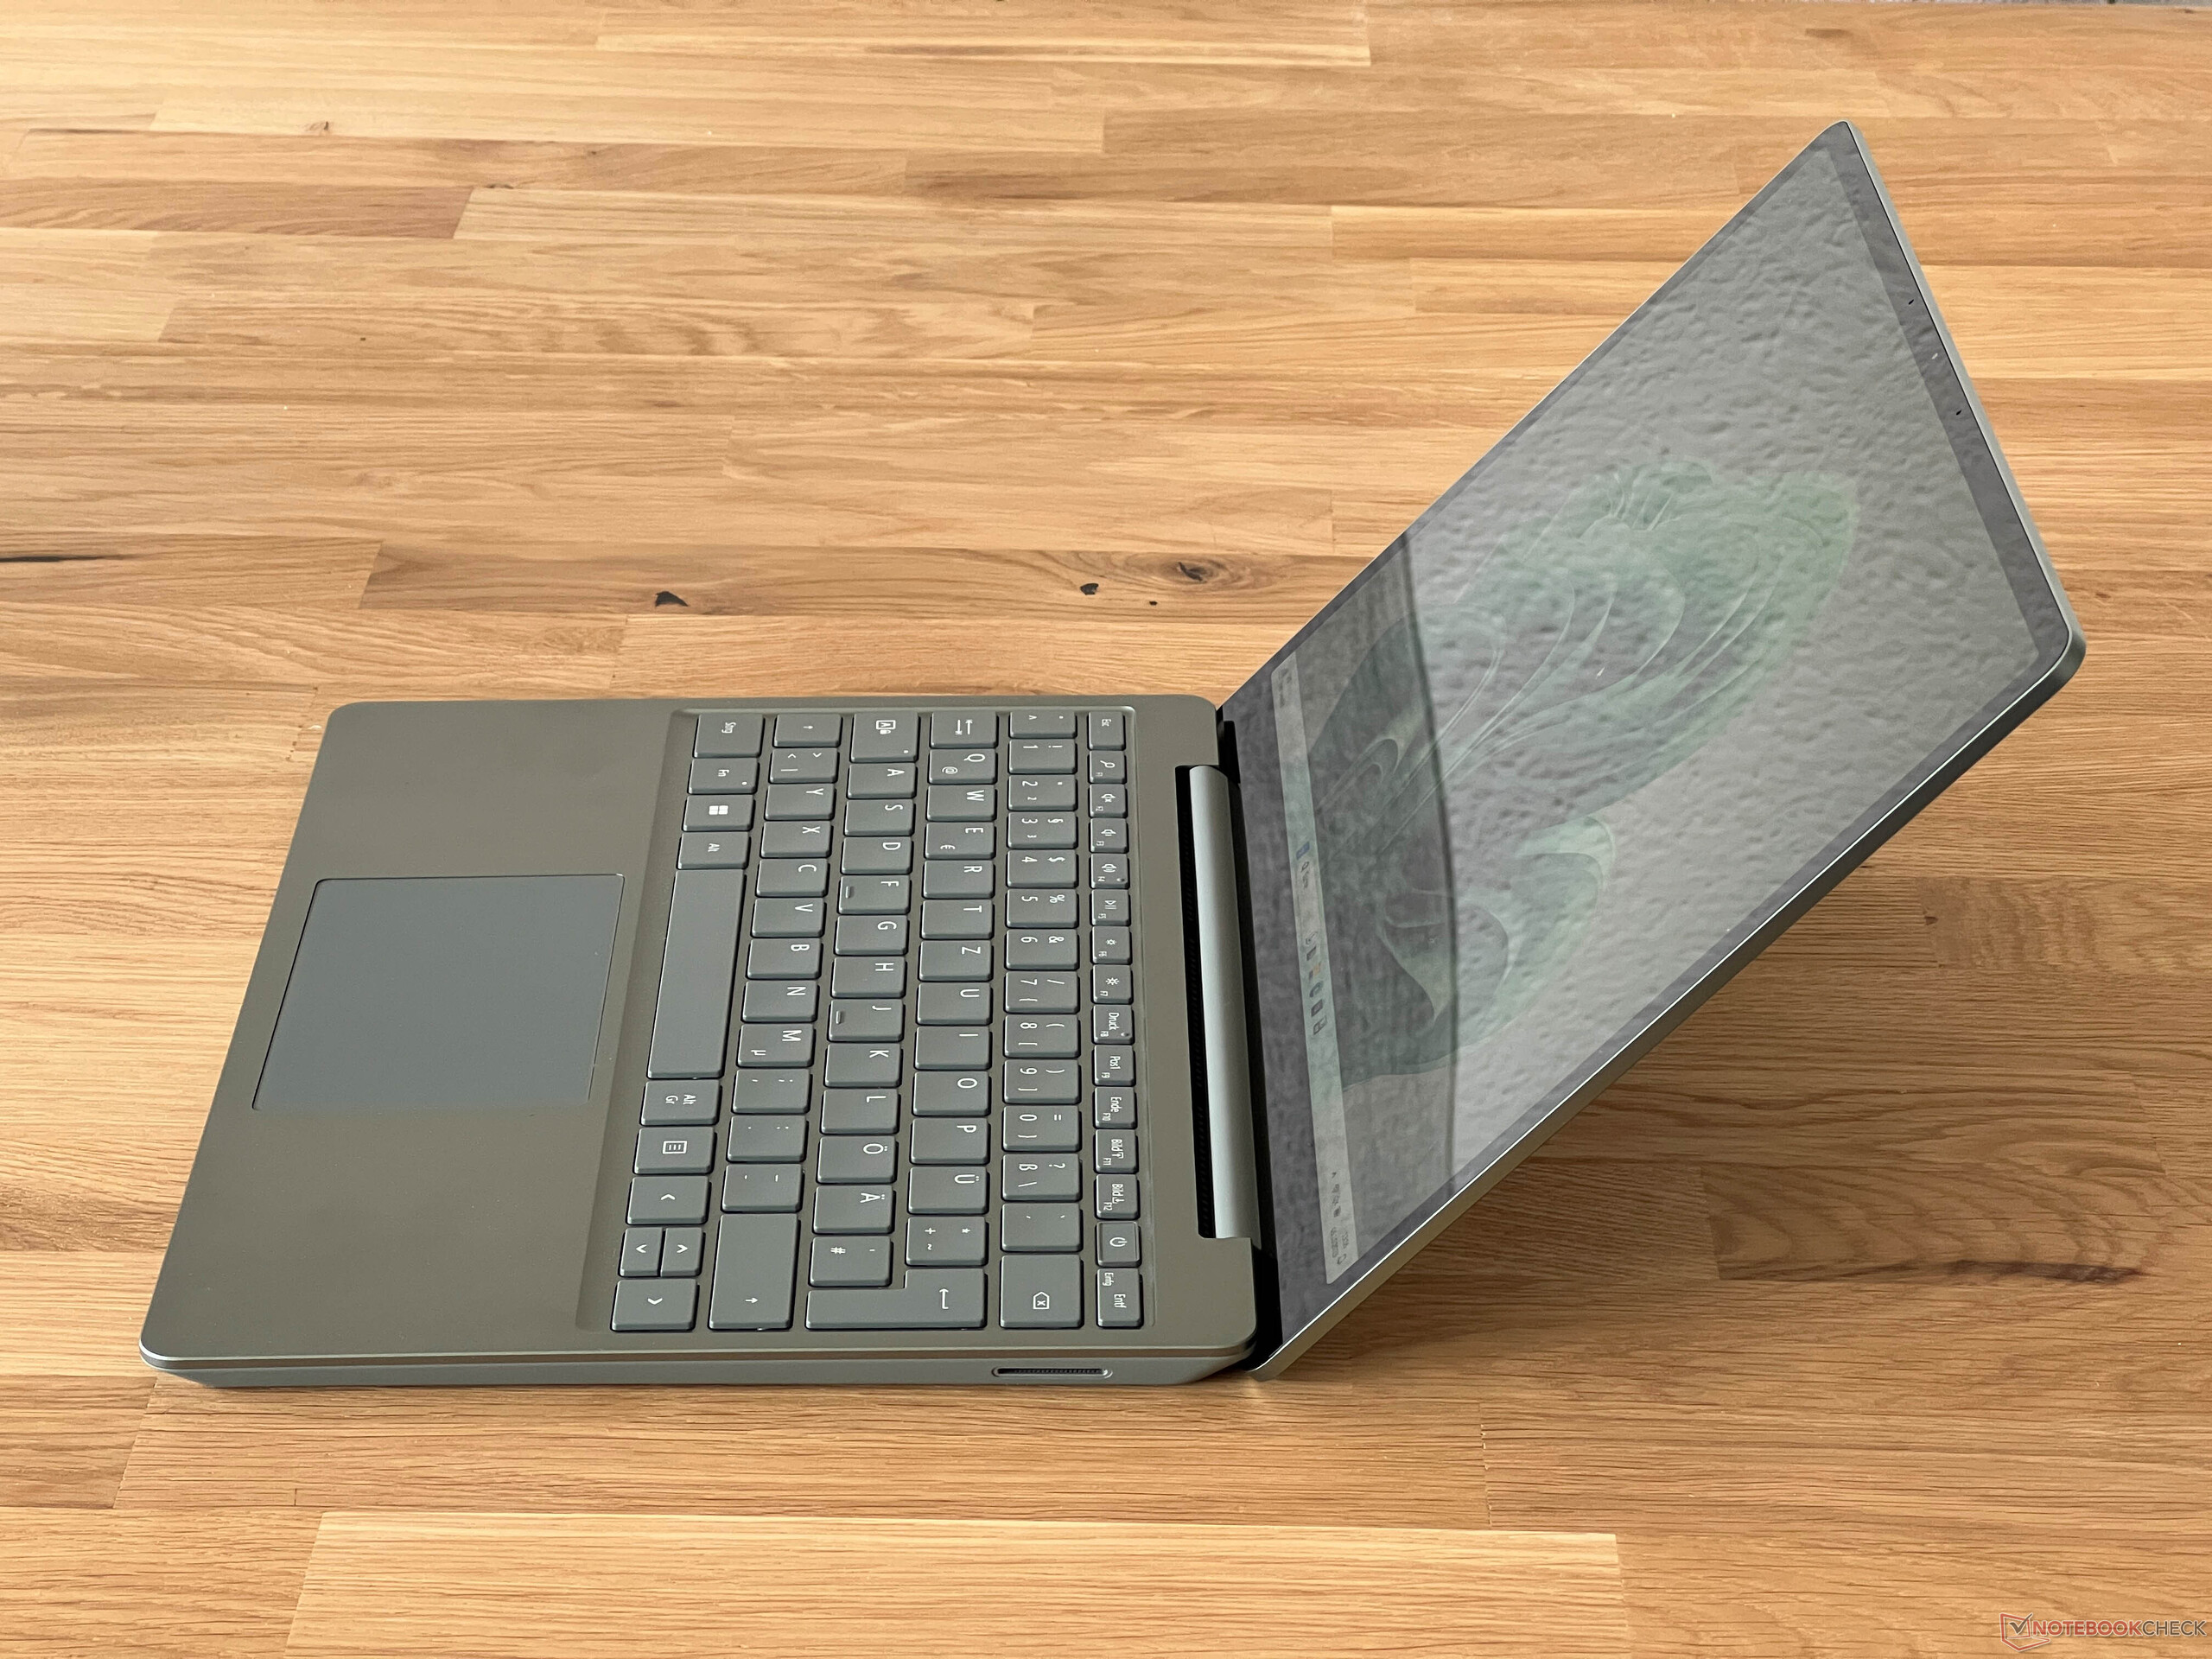
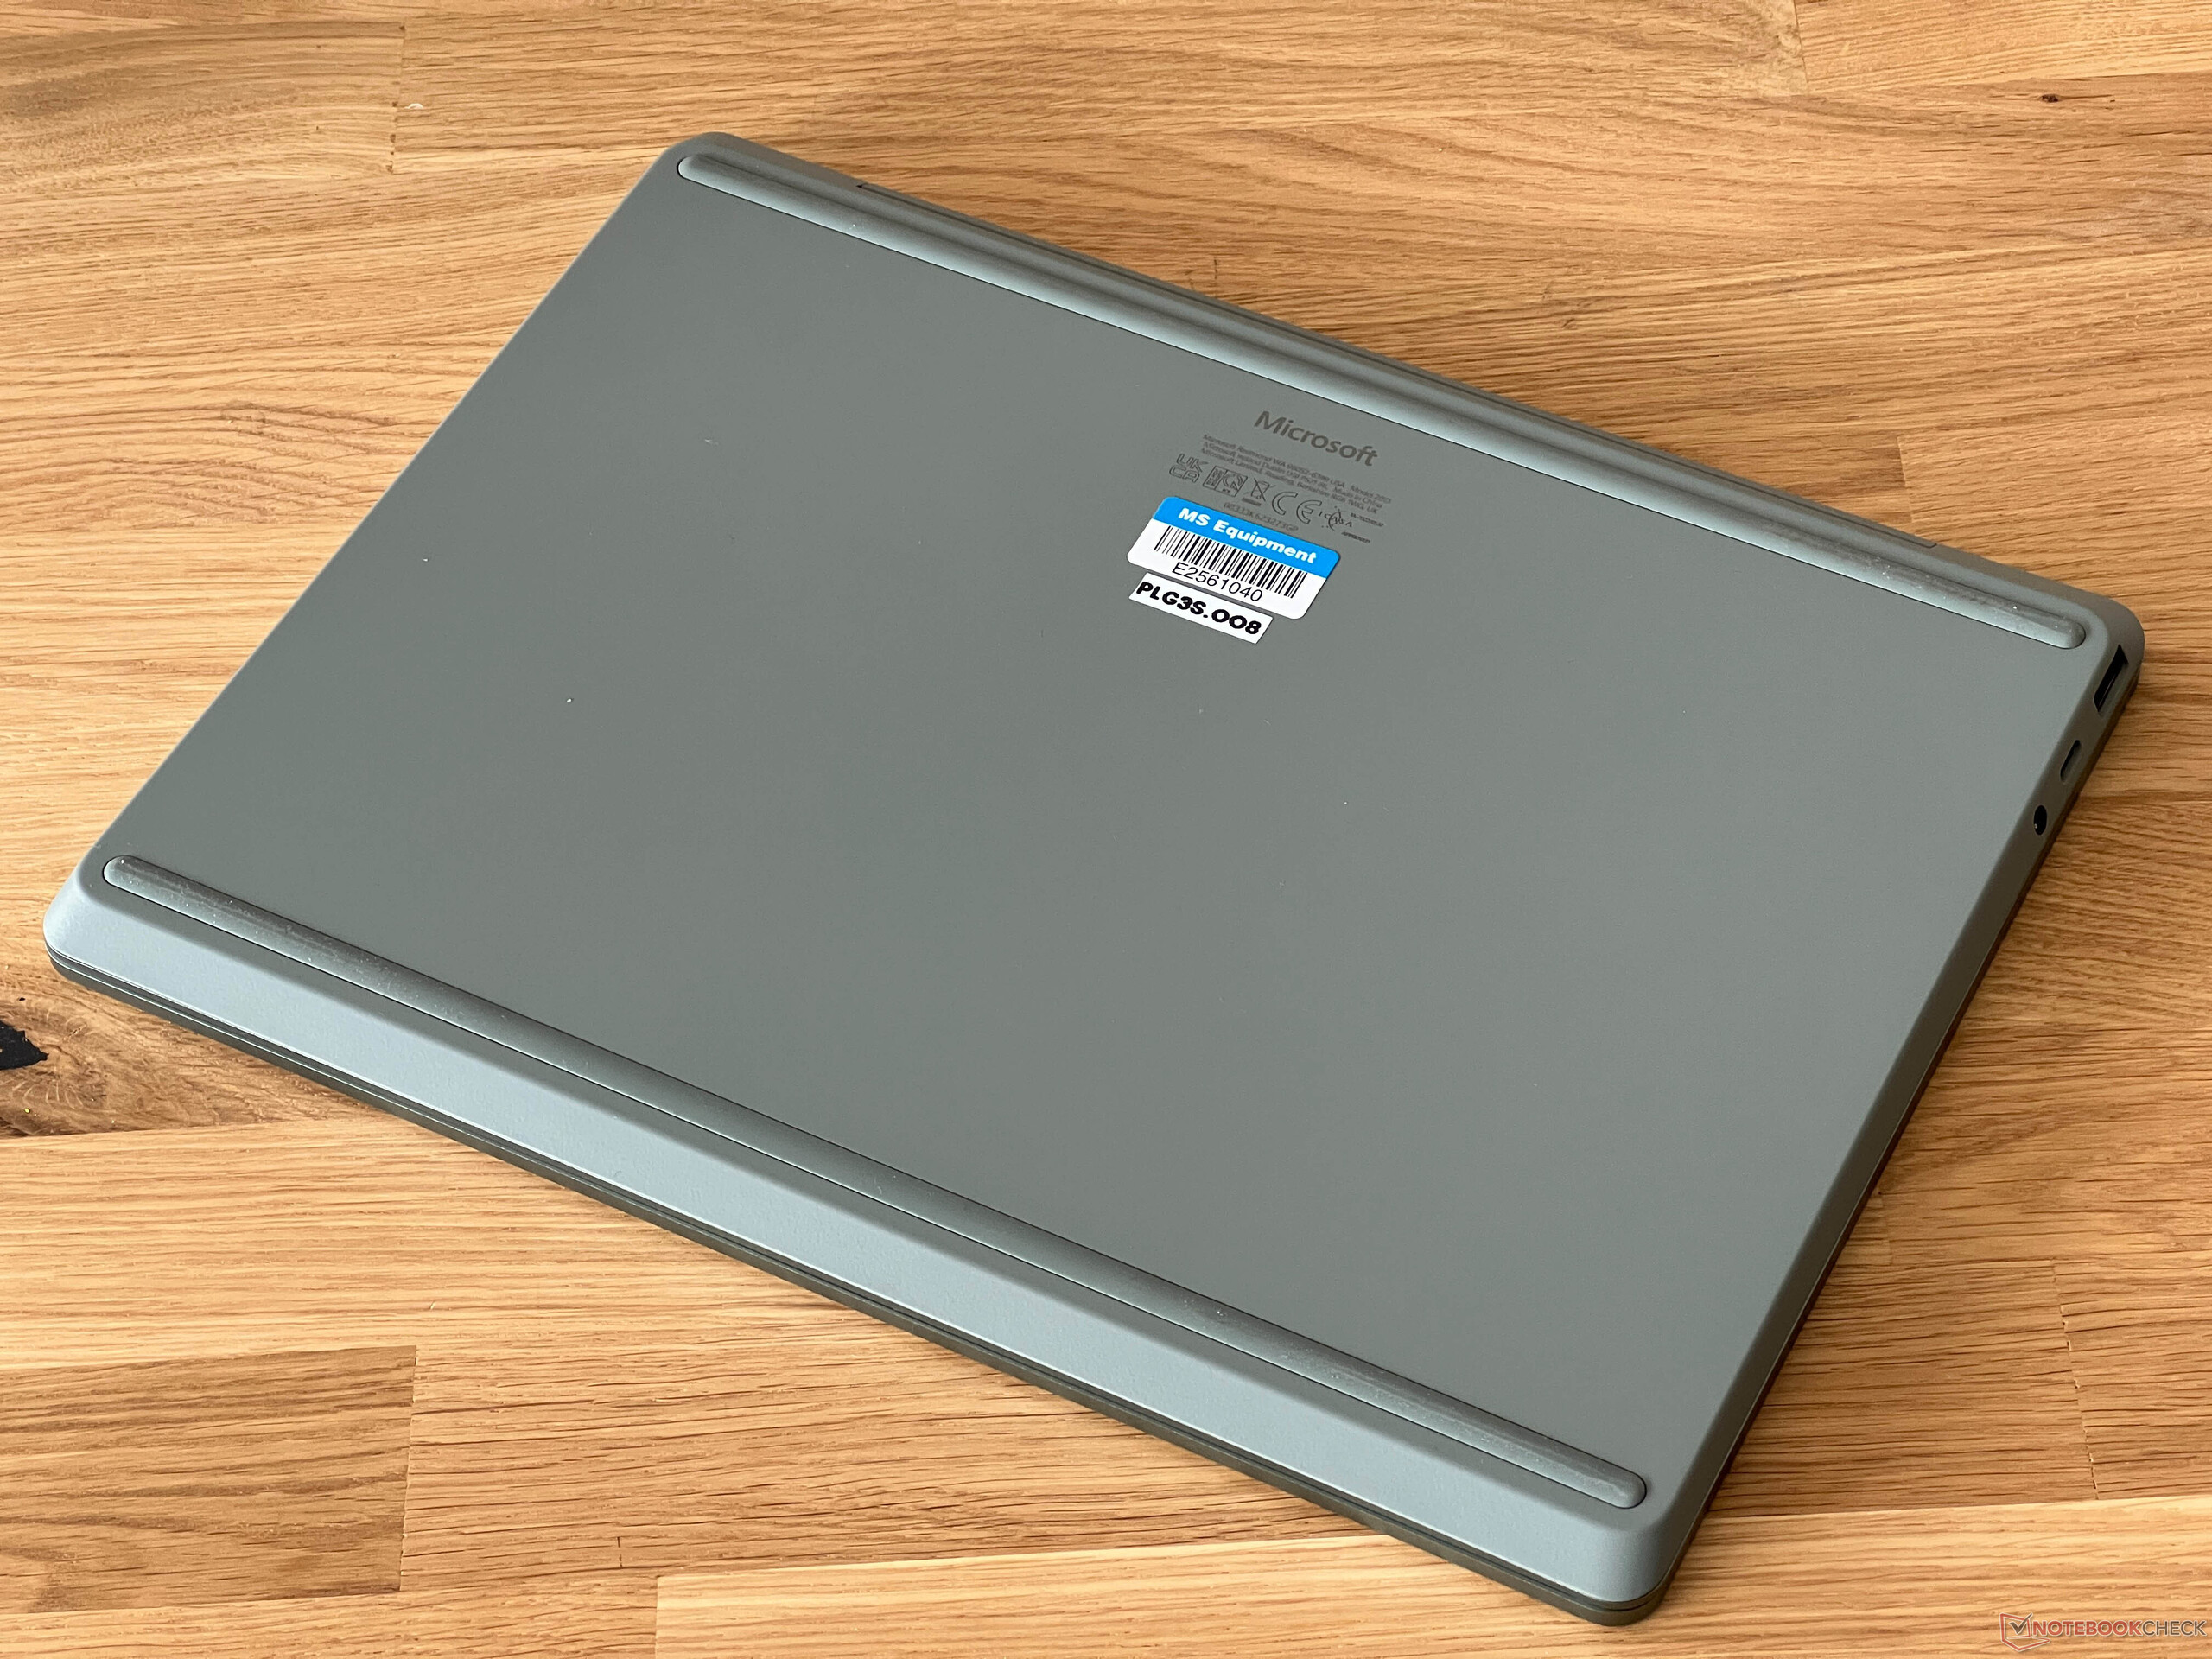
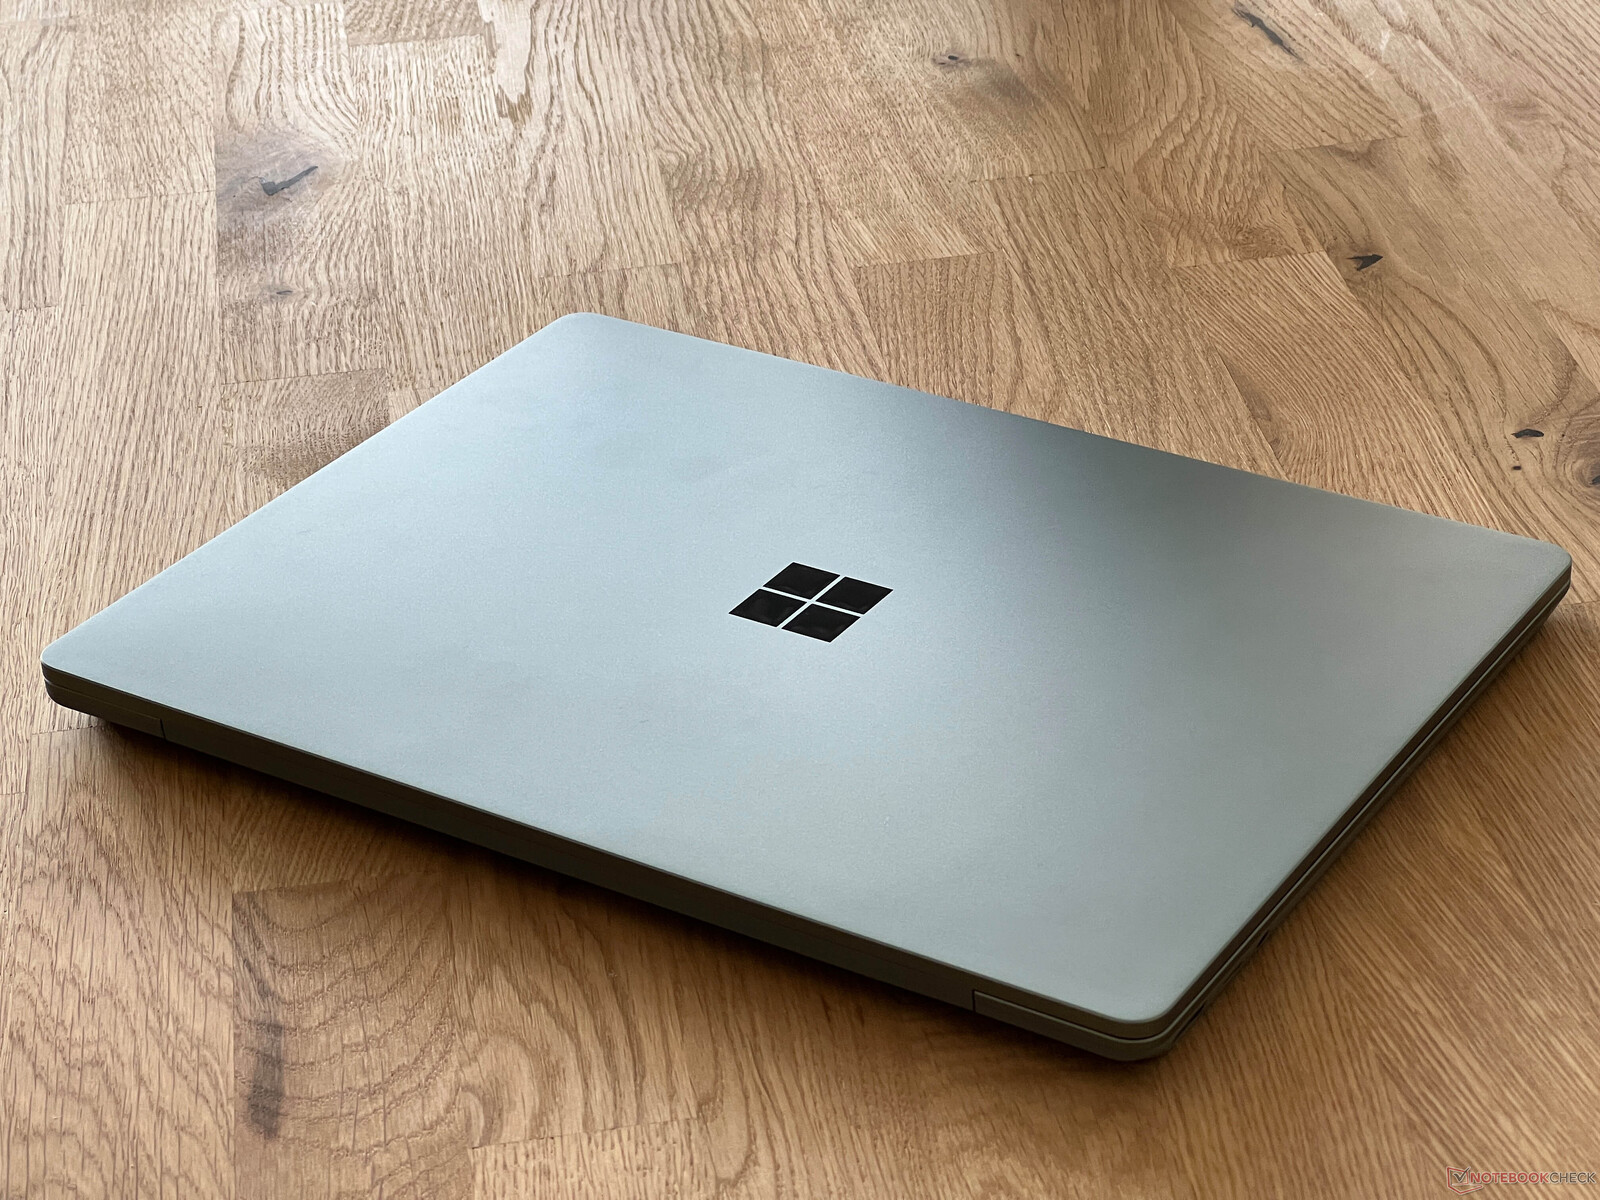
外壳没有任何变化,因此用户仍然可以选择四种不同的颜色:铂金色、鼠尾草色、冰蓝色和砂岩色。外壳的质量仍然是这款小巧设备的一大亮点,因为铝塑结合的外壳看起来非常高质量和稳定。显示屏的最大开启角度为 135 度,最后,这里只有两点值得批评:屏幕边缘相当宽,而且没有维护选项,这意味着无法打开风扇。
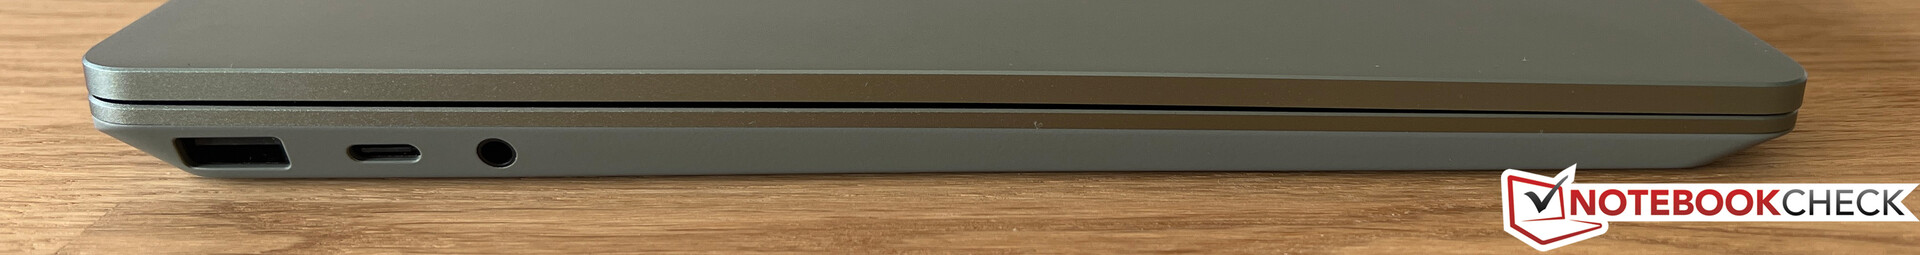
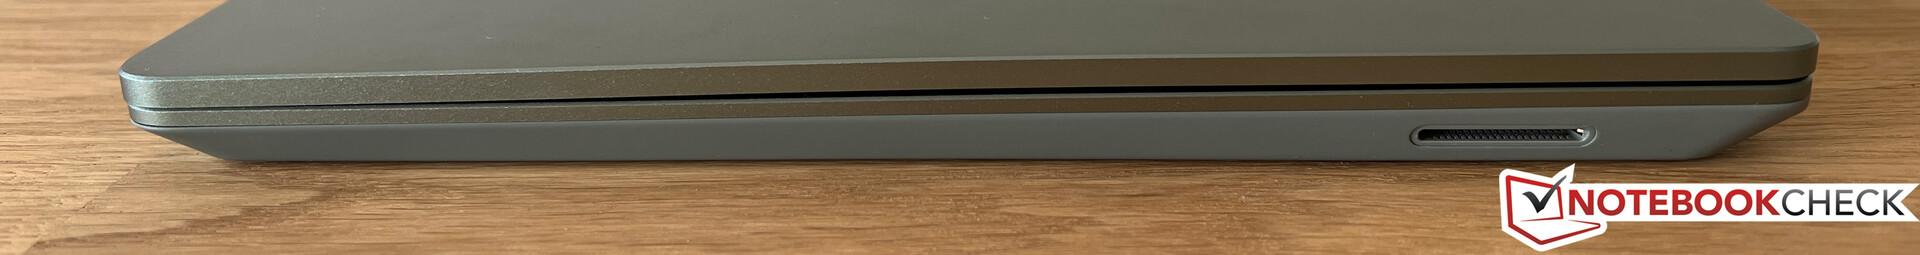
其他设备与往常一样,因此你可以获得日常使用最重要的端口和连接选项,但鉴于 1149 欧元的建议零售价,旧标准和 720p 网络摄像头值得商榷。
| Networking | |
| Microsoft Surface Laptop Go 3 | |
| iperf3 transmit AXE11000 | |
| iperf3 receive AXE11000 | |
| Apple MacBook Air 2020 M1 Entry | |
| iperf3 transmit AX12 | |
| iperf3 receive AX12 | |
| Dell XPS 13 9315, i5-1230U | |
| iperf3 transmit AXE11000 6GHz | |
| iperf3 receive AXE11000 6GHz | |
| Lenovo Yoga 6 13 83B2001SGE | |
| iperf3 transmit AXE11000 | |
| iperf3 receive AXE11000 | |
| Microsoft Surface Laptop Go 2 Core i5 | |
| iperf3 transmit AXE11000 | |
| iperf3 receive AXE11000 | |


输入设备 - 依然没有键盘照明
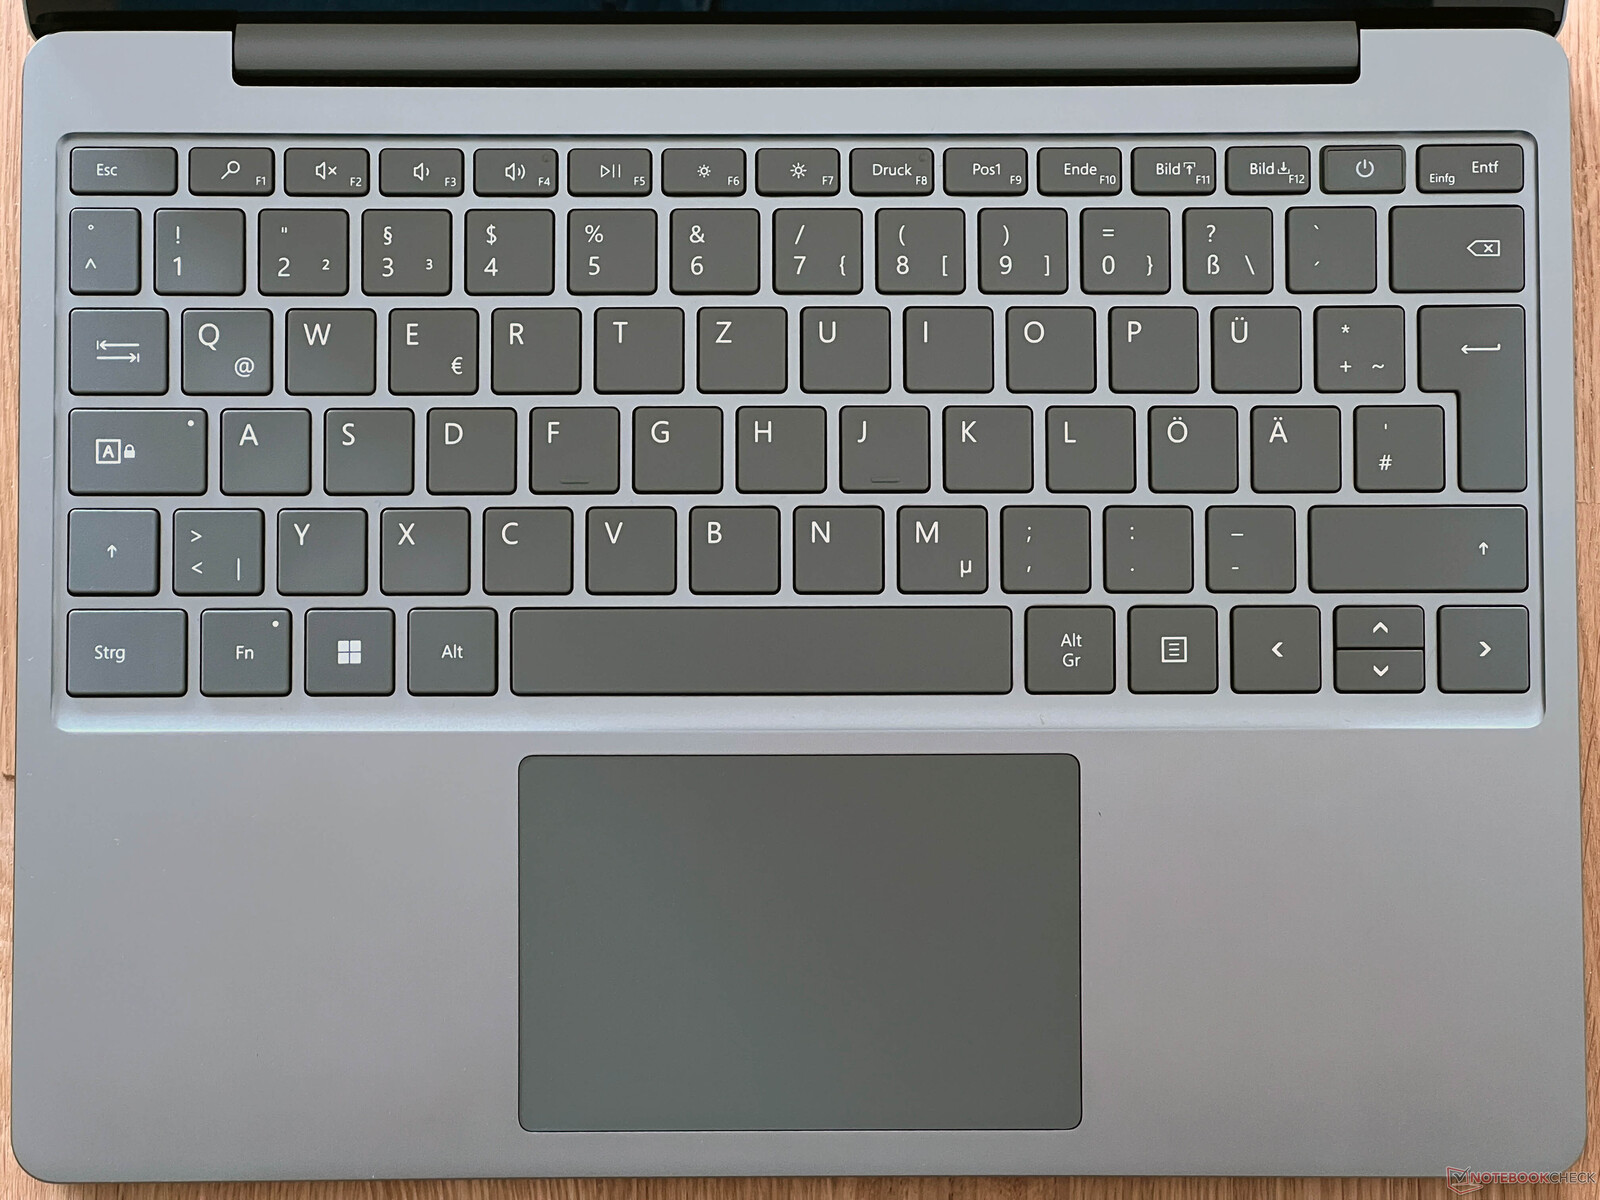
基本上,Surface Laptop Go 3 的输入设备都非常出色。键盘提供了精确、清晰的键入感,而 ClickPad 除了在日常使用中会发出有些响亮的咔哒声外,也完全令人信服。此外,电源按钮还内置了指纹扫描仪。不过,我们仍然不明白,为什么微软最终没有为这款小巧的笔记本电脑配备键盘照明功能。
显示屏 - 12.4 英寸触摸屏

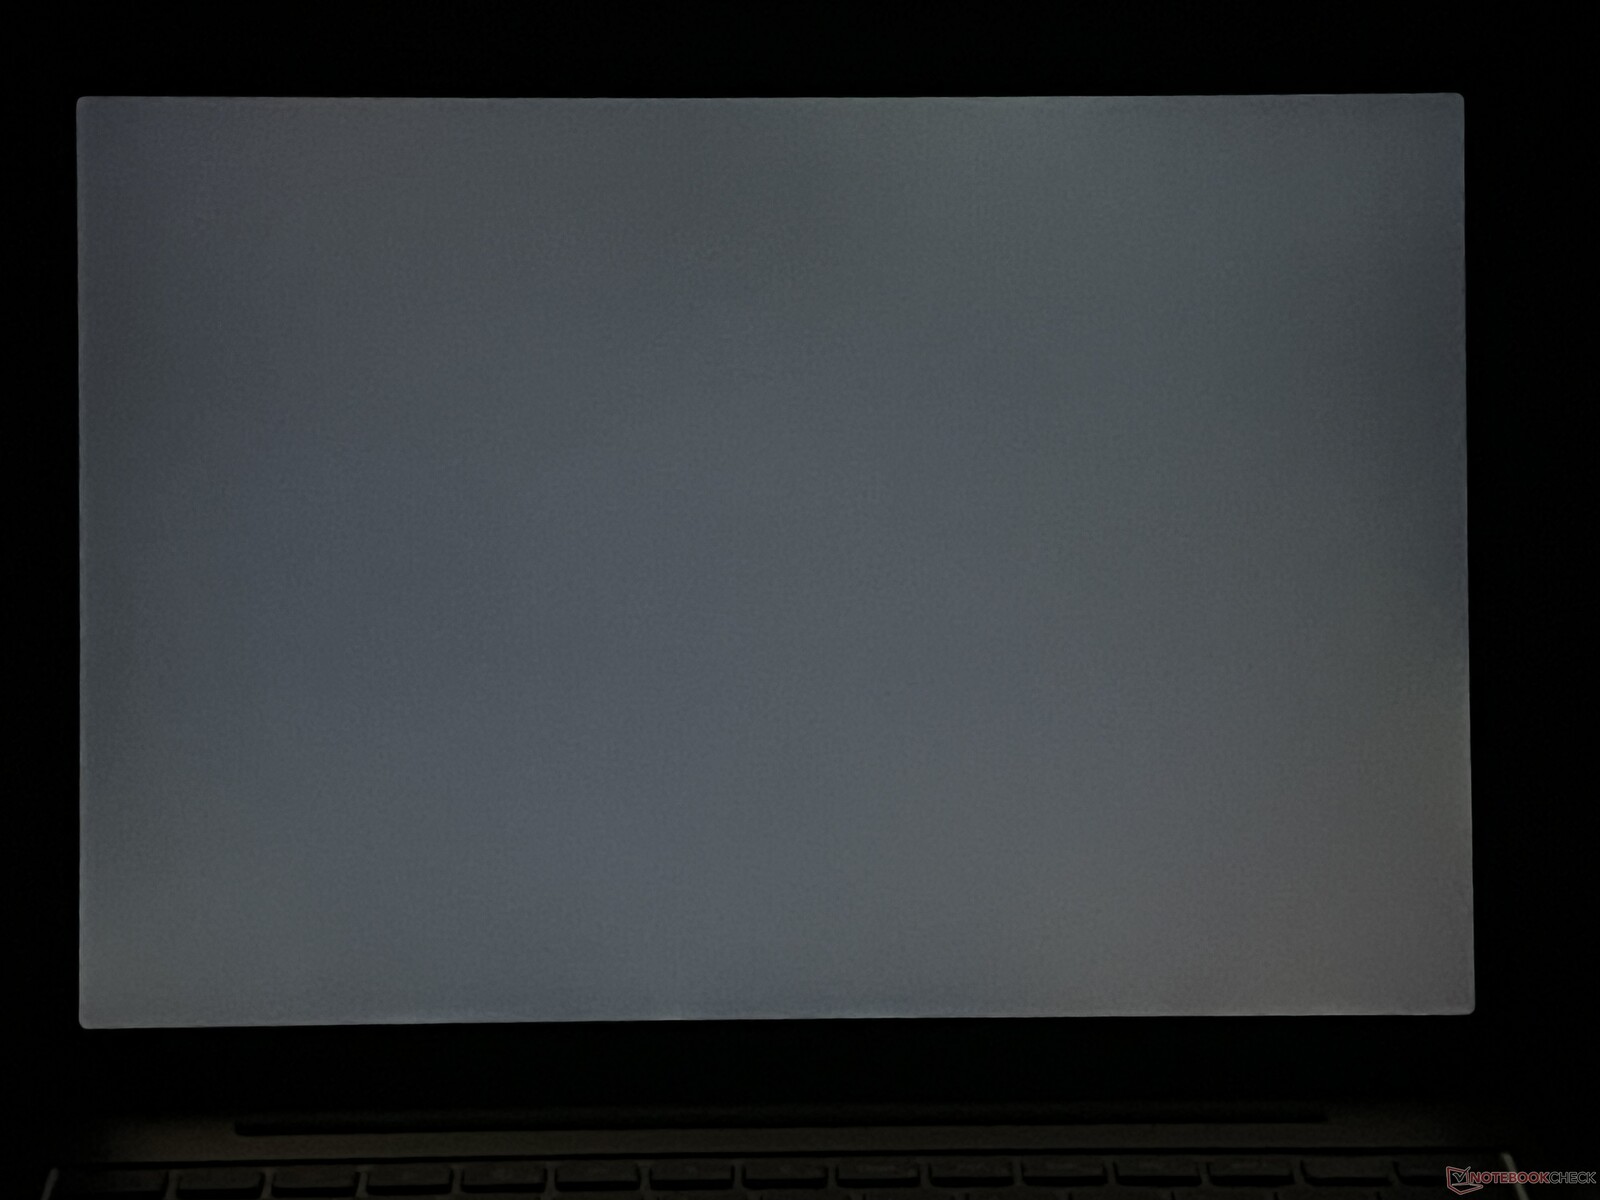
12.4 英寸 IPS 触摸屏基本保持不变,尽管分辨率较低(1,536 x 1,024 像素,3:2 格式),但仍能提供不错的画质。在对角线较小的屏幕上,内容仍然足够清晰,色彩也很鲜艳。没有光晕的问题,但我们测量到的闪烁频率为 60 kHz。不过,这并不是典型的 PWM,高频率应该不会给大多数用户带来任何问题。
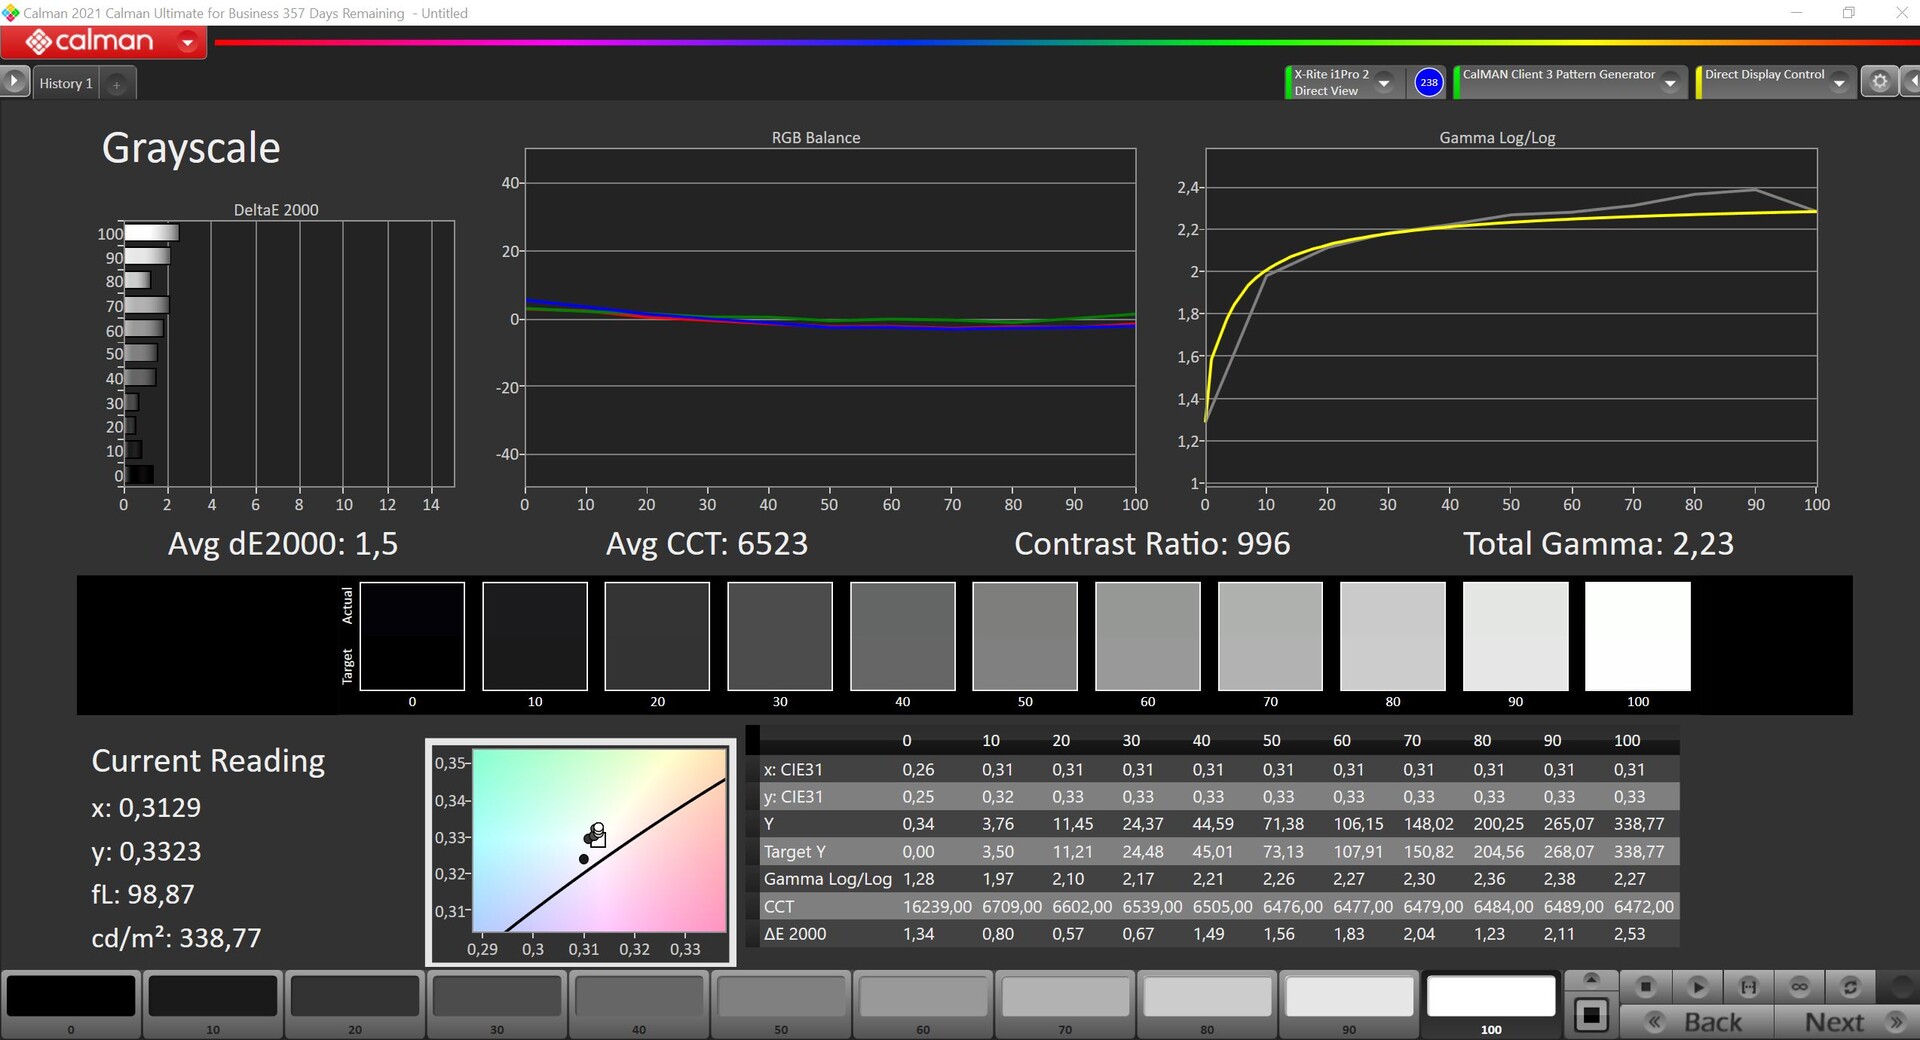
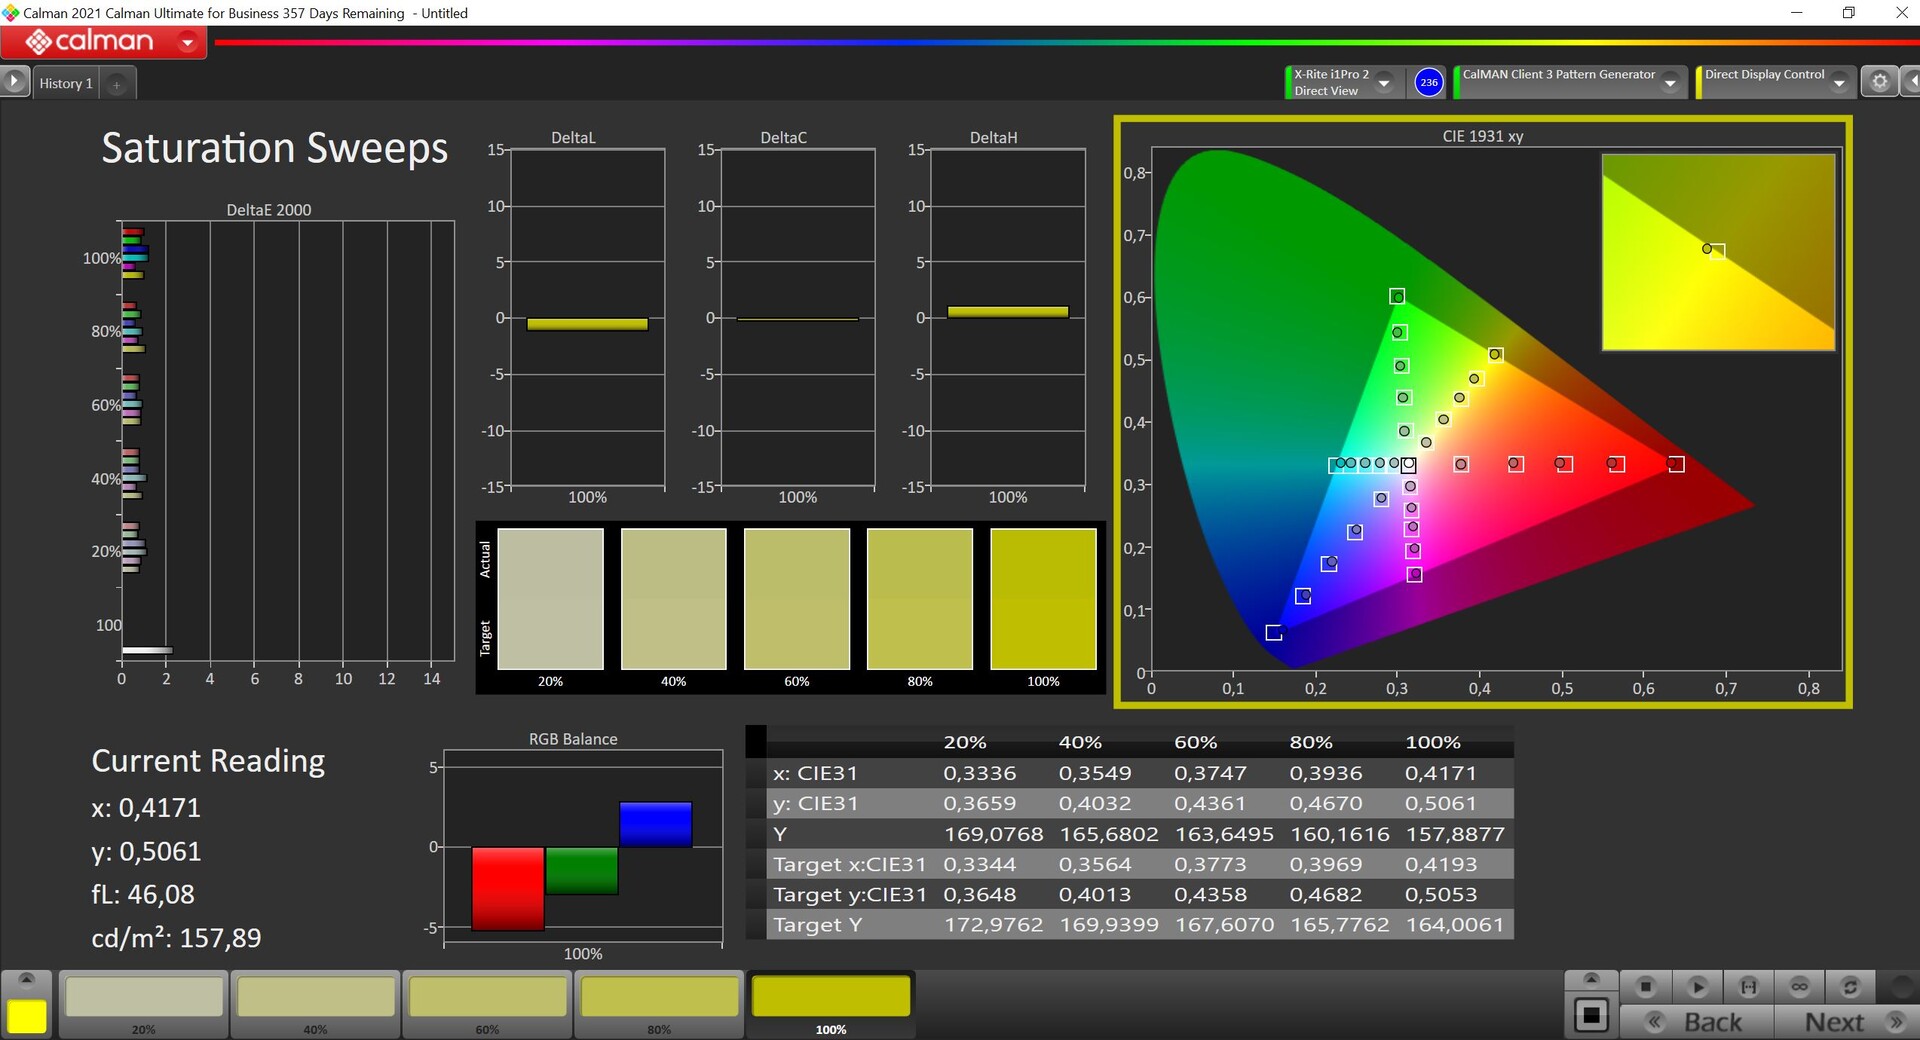
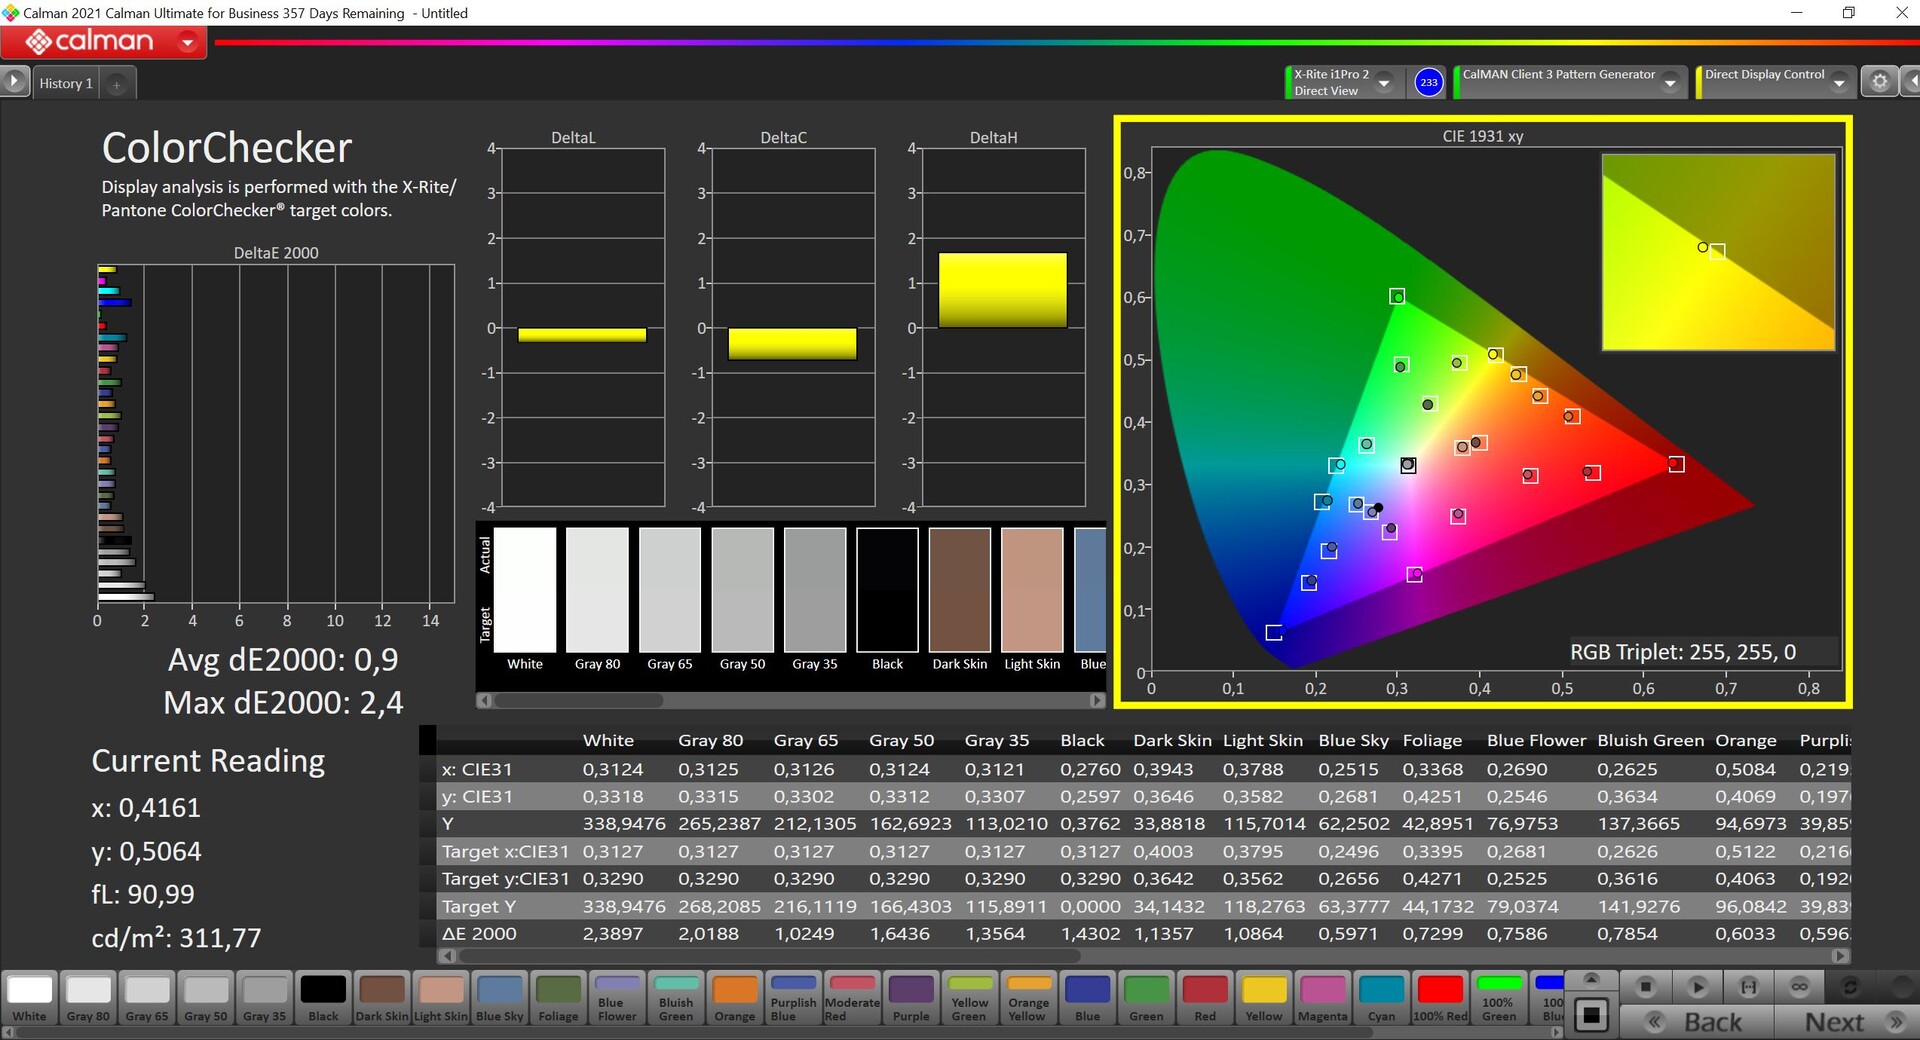
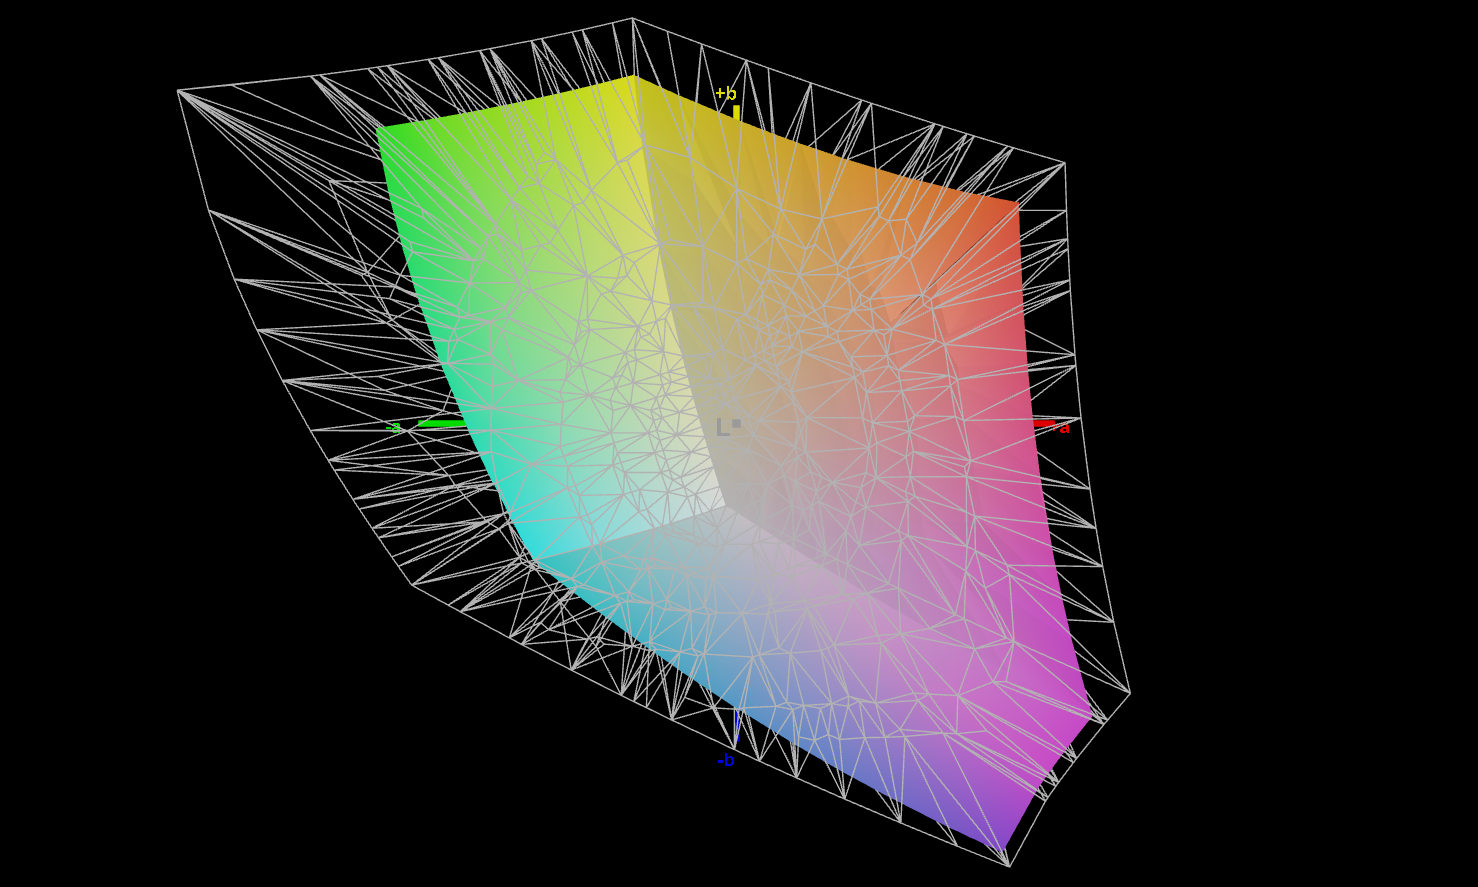
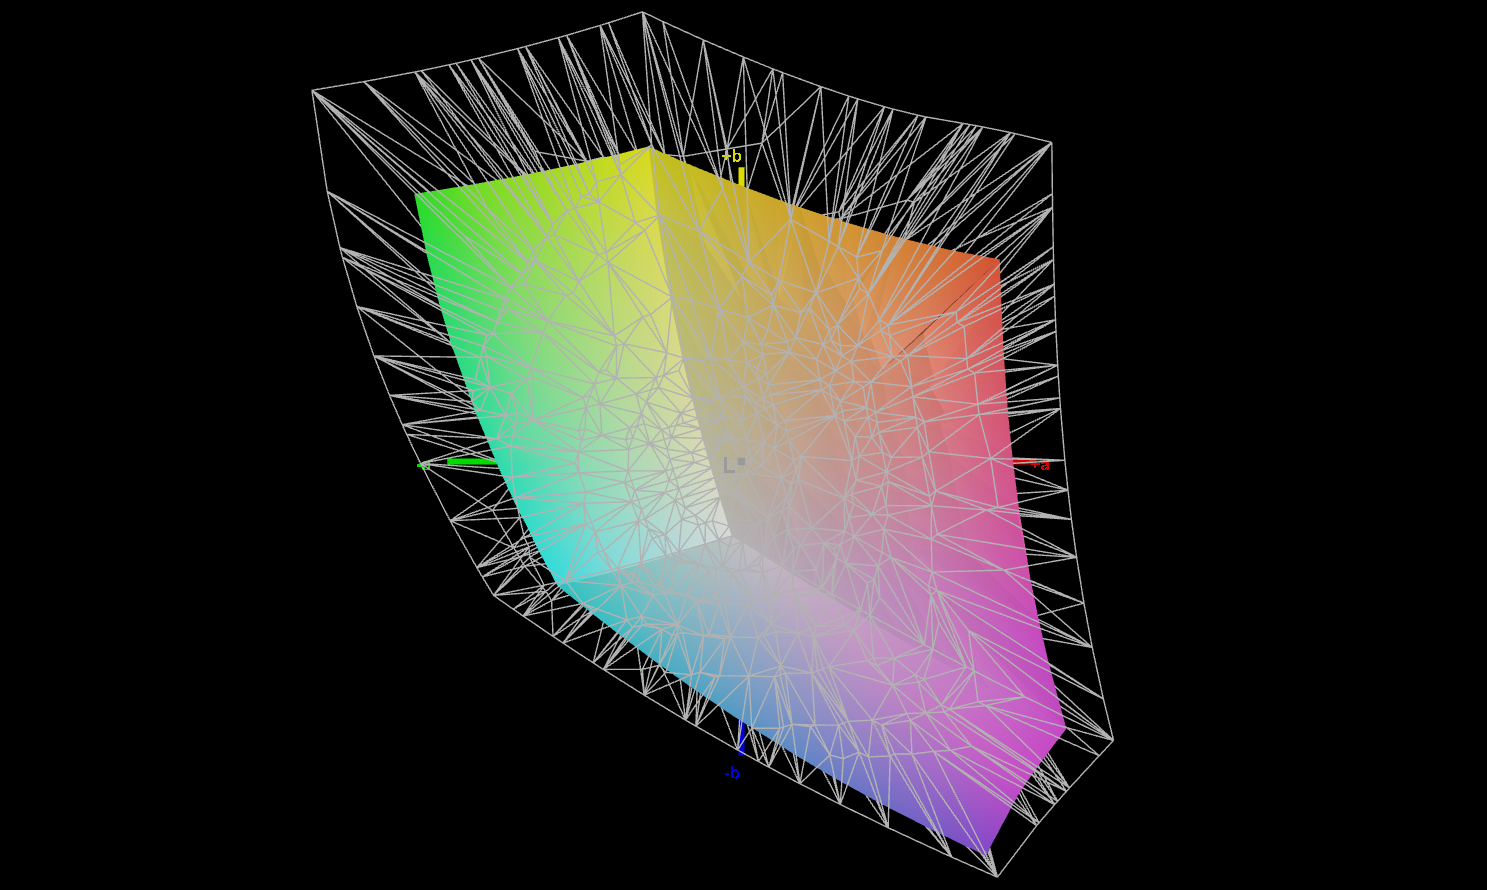
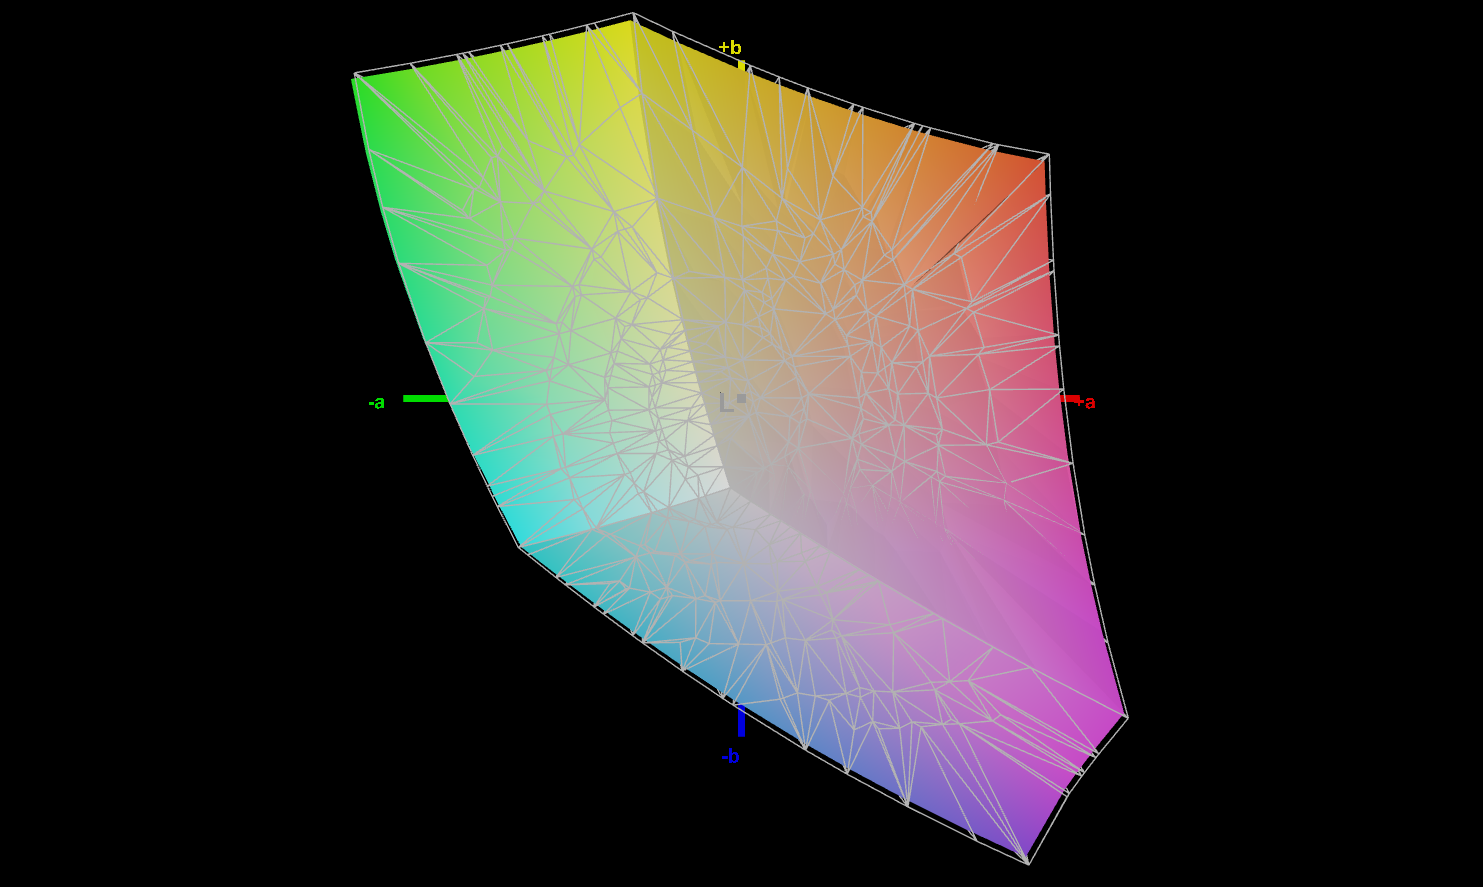
微软规定的亮度为 320 cd/m²,该屏幕也超过了这一标准,平均亮度接近 340 cd/m²。不过,旧机型的亮度要高一些,约为 400 cd/m²,除了联想的 Yoga 6 外,其他竞争对手的亮度也要高一些。黑色值略高,为 0.34 cd/m²,对比度 "仅 "略低于 1,000:1。有两种色彩配置文件,默认为 "增强"模式。在此模式下,色彩略微过饱和,在日常使用中会导致画面略显艳丽。我们使用专业的 CalMAN 软件,使用sRGB配置文件进行了测量,色彩准确度已经非常不错。因此,有了几乎完整的 sRGB 配置文件,您完全可以编辑一些图片。我们自己进行的校准并没有改善色彩表现,因此我们没有提供相应的配置文件供下载。
| |||||||||||||||||||||||||
Brightness Distribution: 96 %
Center on Battery: 339 cd/m²
Contrast: 997:1 (Black: 0.34 cd/m²)
ΔE ColorChecker Calman: 0.9 | ∀{0.5-29.43 Ø4.71}
ΔE Greyscale Calman: 1.5 | ∀{0.09-98 Ø4.96}
66.6% AdobeRGB 1998 (Argyll 3D)
96.9% sRGB (Argyll 3D)
64.5% Display P3 (Argyll 3D)
Gamma: 2.23
CCT: 6523 K
| Microsoft Surface Laptop Go 3 LP125WX172403, IPS, 1536x1024, 12.4" | Apple MacBook Air 2020 M1 Entry IPS, 2560x1600, 13.3" | Dell XPS 13 9315, i5-1230U Sharp SHP1548 LQ134N1, IPS, 1920x1200, 13.4" | Lenovo Yoga 6 13 83B2001SGE LEN133WUXGA, IPS, 1920x1200, 13.3" | Microsoft Surface Laptop Go 2 Core i5 LP125WX112403, IPS, 1536x1024, 12.4" | |
|---|---|---|---|---|---|
| Display | 28% | 6% | 5% | -2% | |
| Display P3 Coverage (%) | 64.5 | 98.6 53% | 69 7% | 69.9 8% | 63.6 -1% |
| sRGB Coverage (%) | 96.9 | 100 3% | 100 3% | 99.5 3% | 93.8 -3% |
| AdobeRGB 1998 Coverage (%) | 66.6 | 85.9 29% | 71 7% | 70 5% | 65 -2% |
| Response Times | 10% | 5% | 66% | -3% | |
| Response Time Grey 50% / Grey 80% * (ms) | 36.7 ? | 31 ? 16% | 40 ? -9% | 14 ? 62% | 39 ? -6% |
| Response Time Black / White * (ms) | 27.1 ? | 26.1 ? 4% | 22 ? 19% | 8 ? 70% | 26.9 ? 1% |
| PWM Frequency (Hz) | 60000 ? | 118000 ? | 9700 ? | ||
| Screen | -3% | -58% | -87% | -13% | |
| Brightness middle (cd/m²) | 339 | 417 23% | 466 37% | 278 -18% | 406 20% |
| Brightness (cd/m²) | 337 | 395 17% | 442 31% | 271 -20% | 401 19% |
| Brightness Distribution (%) | 96 | 91 -5% | 89 -7% | 94 -2% | 95 -1% |
| Black Level * (cd/m²) | 0.34 | 0.39 -15% | 0.4 -18% | 0.25 26% | 0.41 -21% |
| Contrast (:1) | 997 | 1069 7% | 1165 17% | 1112 12% | 990 -1% |
| Colorchecker dE 2000 * | 0.9 | 1.12 -24% | 3.03 -237% | 3 -233% | 1.8 -100% |
| Colorchecker dE 2000 max. * | 2.4 | 2.71 -13% | 6.68 -178% | 7.86 -228% | 3.3 -38% |
| Greyscale dE 2000 * | 1.5 | 1.7 -13% | 3.12 -108% | 5.04 -236% | 1.2 20% |
| Gamma | 2.23 99% | 2207 0% | 2.41 91% | 2.46 89% | 2.29 96% |
| CCT | 6523 100% | 6870 95% | 6418 101% | 6068 107% | 6662 98% |
| Colorchecker dE 2000 calibrated * | 0.77 | 2.34 | 0.62 | 1.3 | |
| Total Average (Program / Settings) | 12% /
6% | -16% /
-34% | -5% /
-42% | -6% /
-9% |
* ... smaller is better
Display Response Times
| ↔ Response Time Black to White | ||
|---|---|---|
| 27.1 ms ... rise ↗ and fall ↘ combined | ↗ 16.2 ms rise | 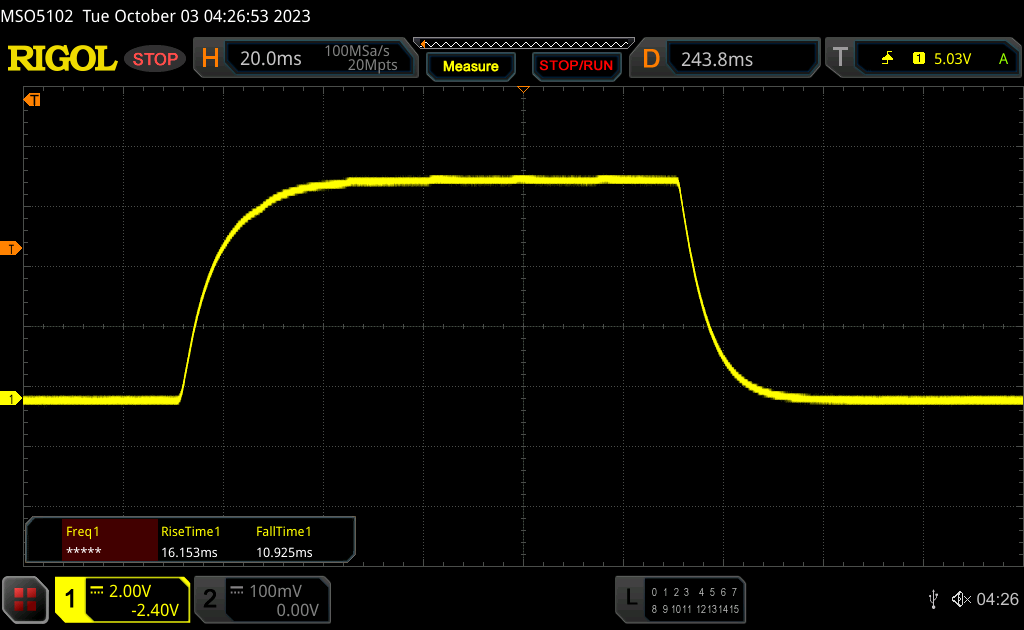 |
| ↘ 10.9 ms fall | ||
| The screen shows relatively slow response rates in our tests and may be too slow for gamers. In comparison, all tested devices range from 0.1 (minimum) to 240 (maximum) ms. » 69 % of all devices are better. This means that the measured response time is worse than the average of all tested devices (19.8 ms). | ||
| ↔ Response Time 50% Grey to 80% Grey | ||
| 36.7 ms ... rise ↗ and fall ↘ combined | ↗ 18.1 ms rise | 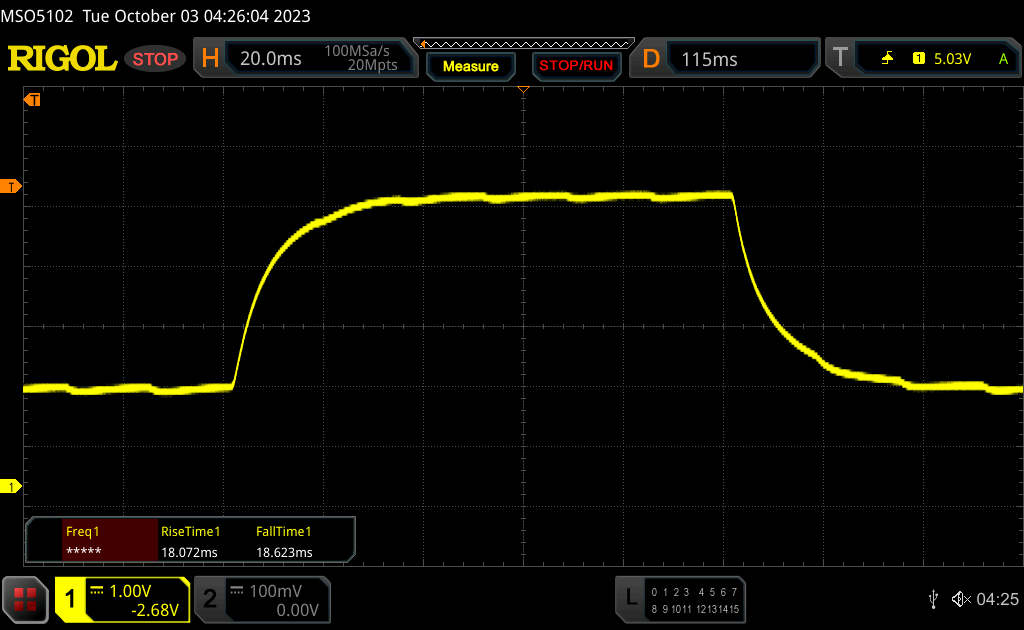 |
| ↘ 18.6 ms fall | ||
| The screen shows slow response rates in our tests and will be unsatisfactory for gamers. In comparison, all tested devices range from 0.165 (minimum) to 636 (maximum) ms. » 53 % of all devices are better. This means that the measured response time is worse than the average of all tested devices (31 ms). | ||
Screen Flickering / PWM (Pulse-Width Modulation)
| Screen flickering / PWM detected | 60000 Hz | ≤ 100 % brightness setting | 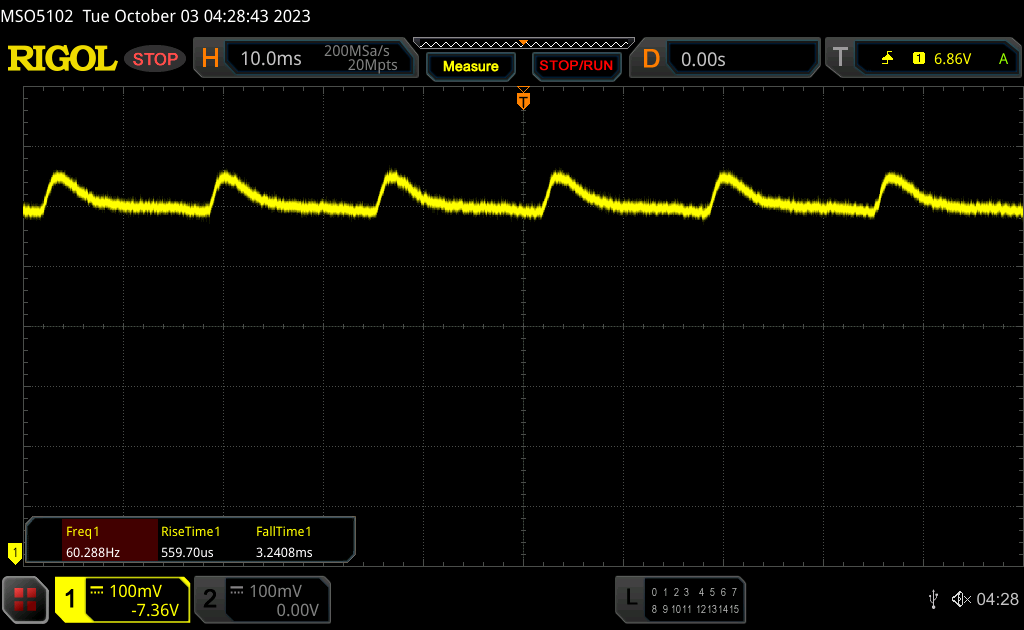 |
The display backlight flickers at 60000 Hz (worst case, e.g., utilizing PWM) Flickering detected at a brightness setting of 100 % and below. There should be no flickering or PWM above this brightness setting. The frequency of 60000 Hz is quite high, so most users sensitive to PWM should not notice any flickering. In comparison: 52 % of all tested devices do not use PWM to dim the display. If PWM was detected, an average of 7757 (minimum: 5 - maximum: 343500) Hz was measured. | |||

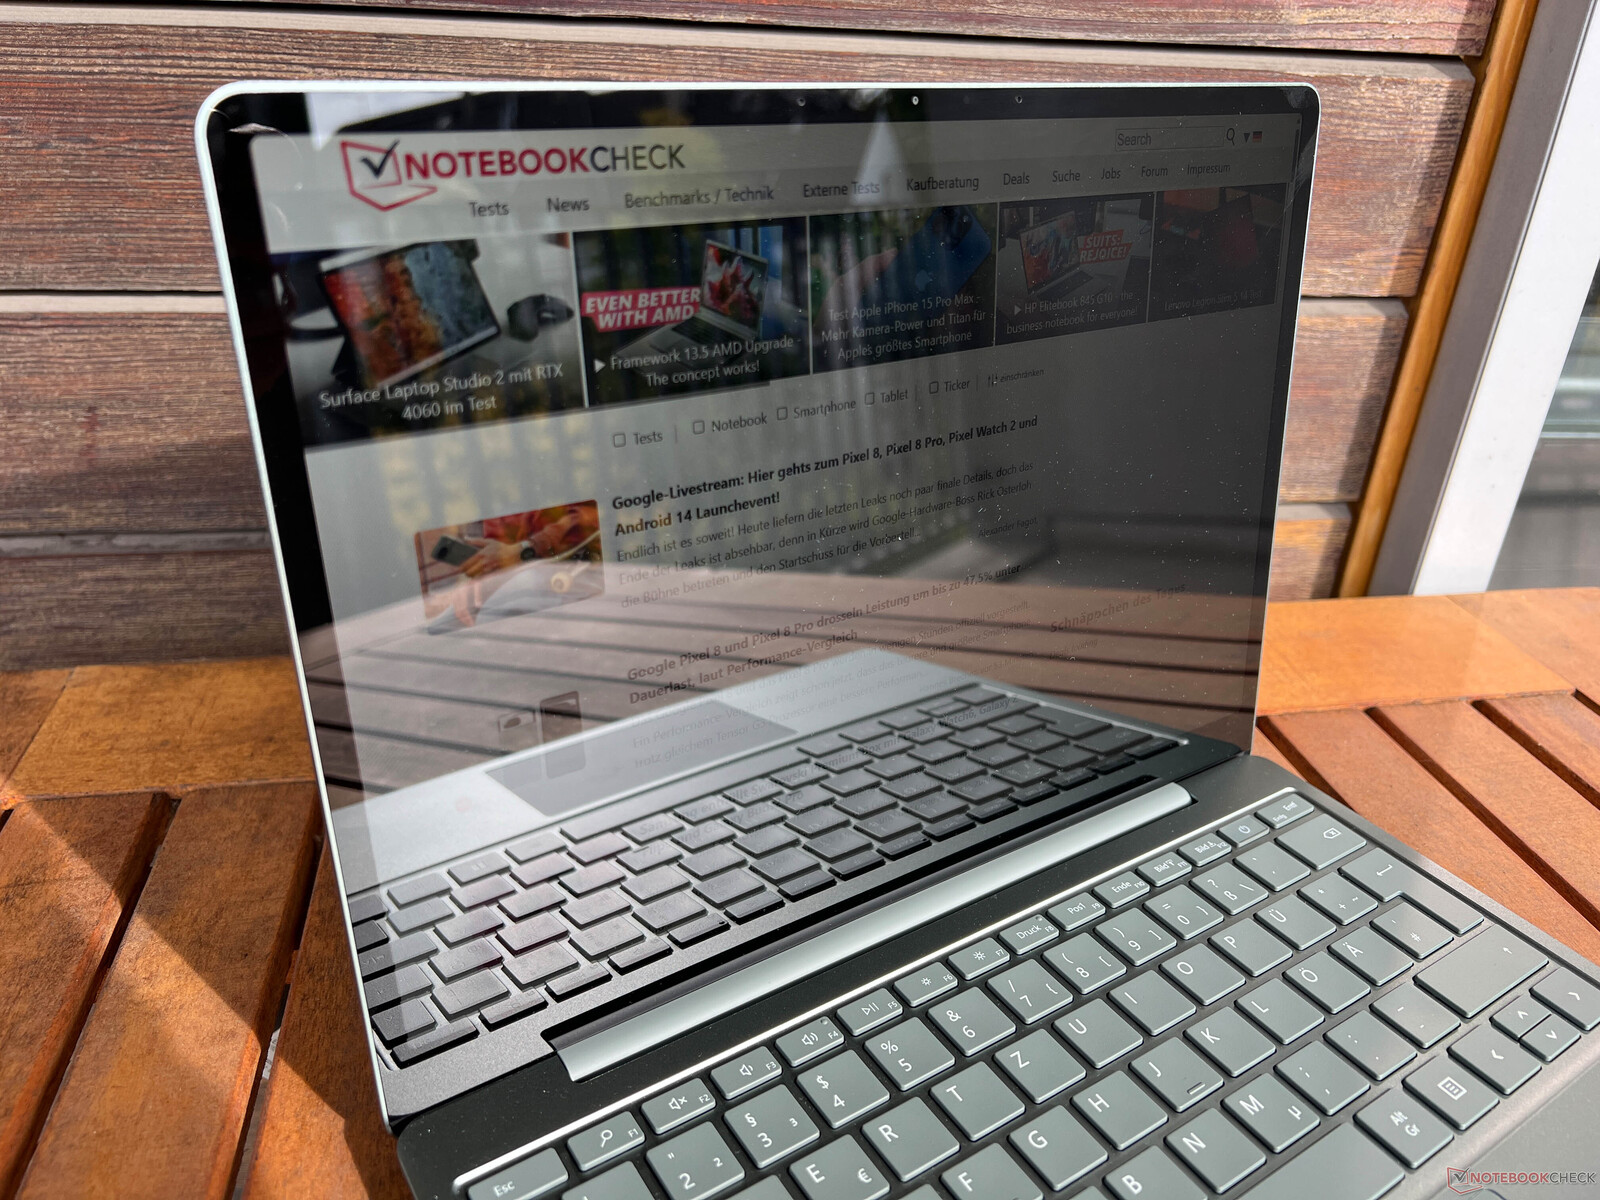
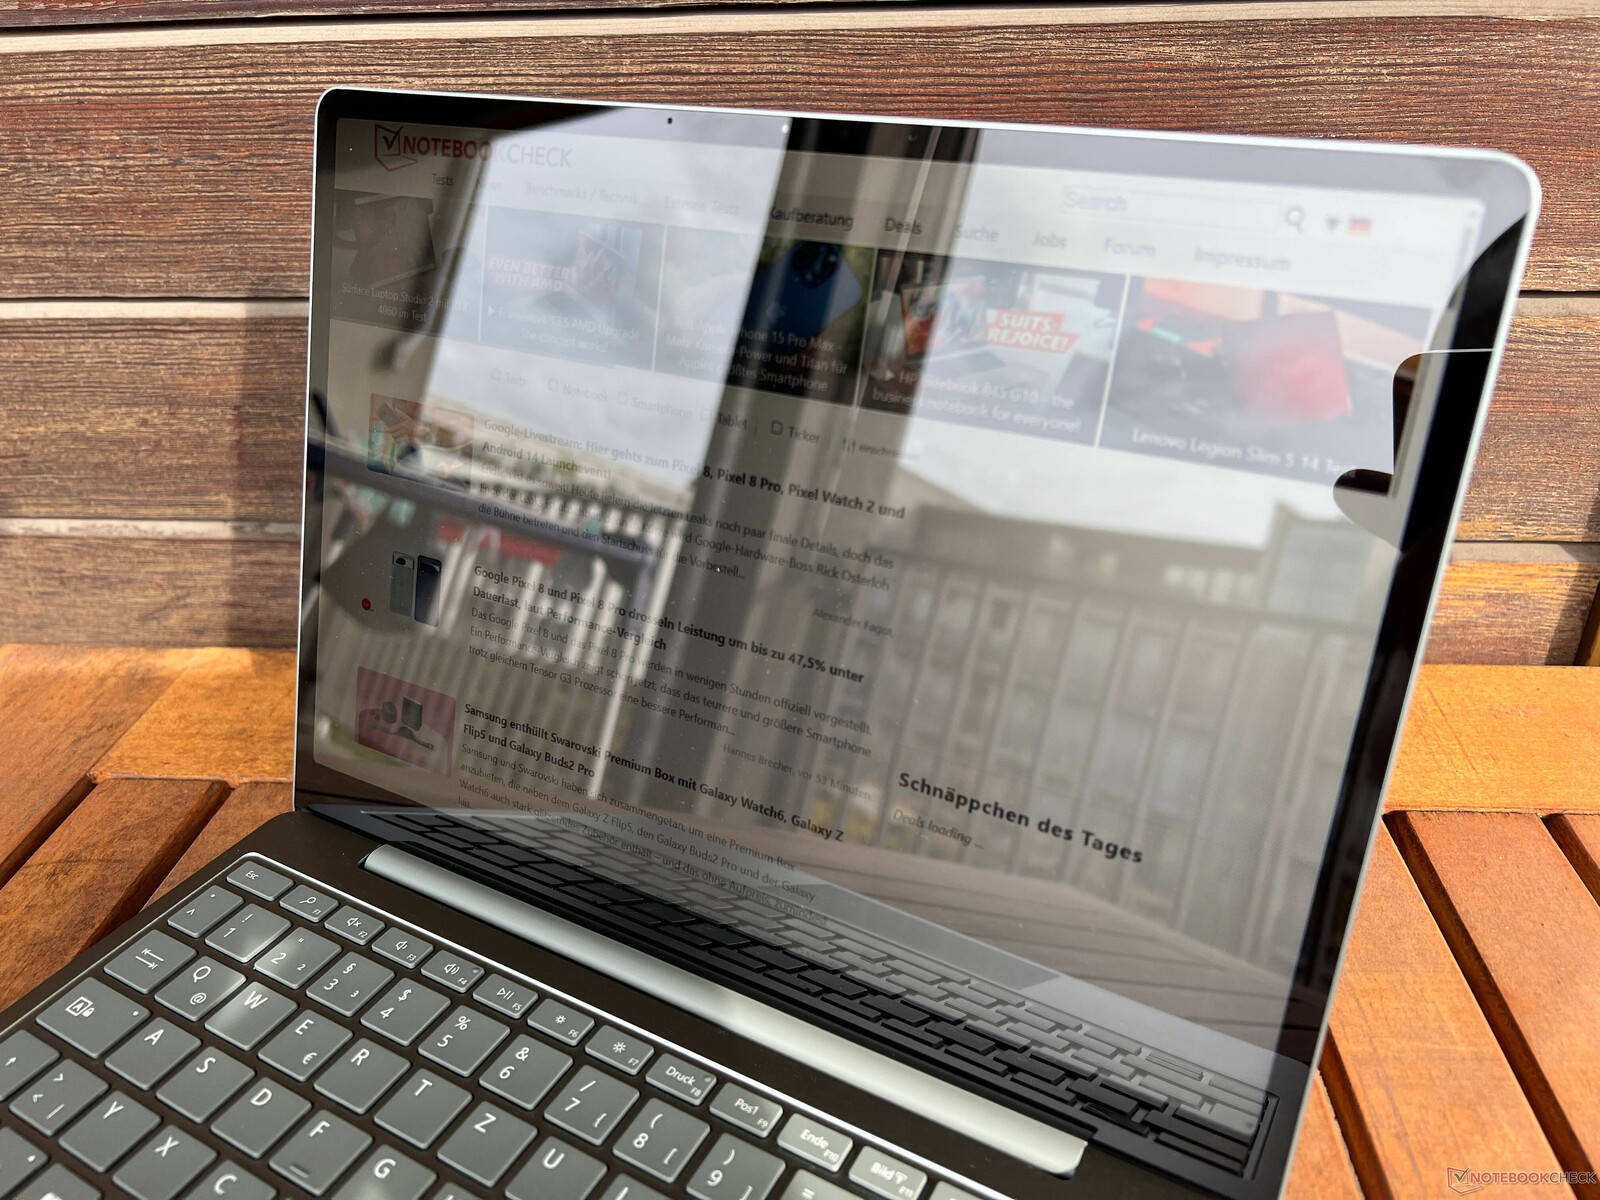
在户外,由于触摸屏反光较强,可用性受到限制。不过,可视角度的稳定性还是不错的。

性能 - Alder Lake Core i5
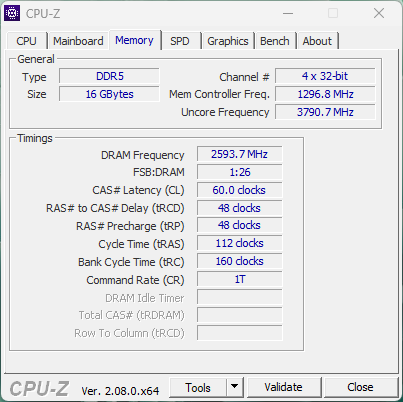
微软现在使用的是去年的第 12 代 Alder Lake Core i5-1235U。后继的 Raptor Lake 已经上市,但实际上并没有提供更高的性能。标准配置为 8 GB 内存,但升级到 16 GB 内存需要 250 欧元(约合 250 美元)。
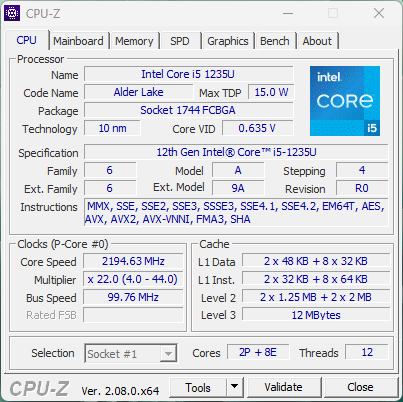
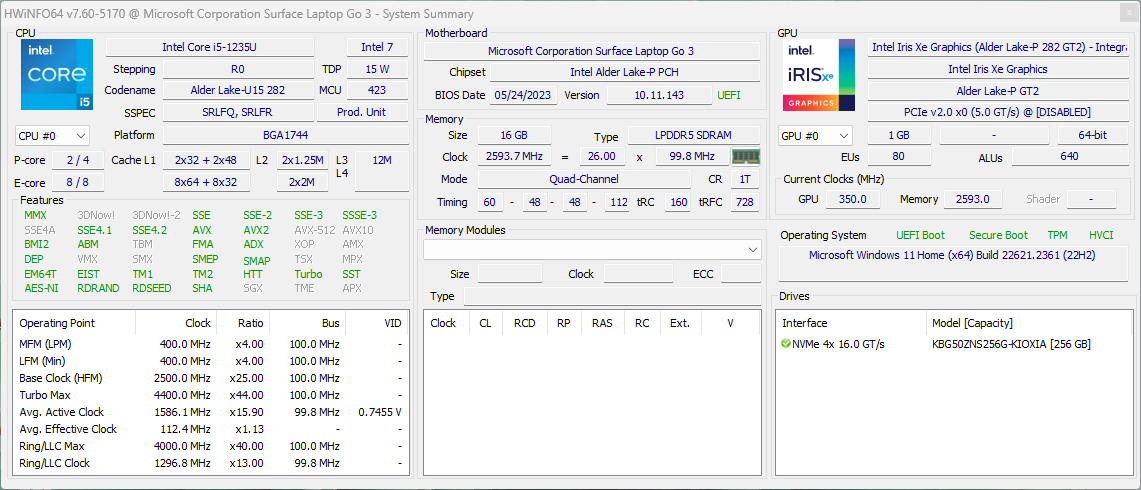
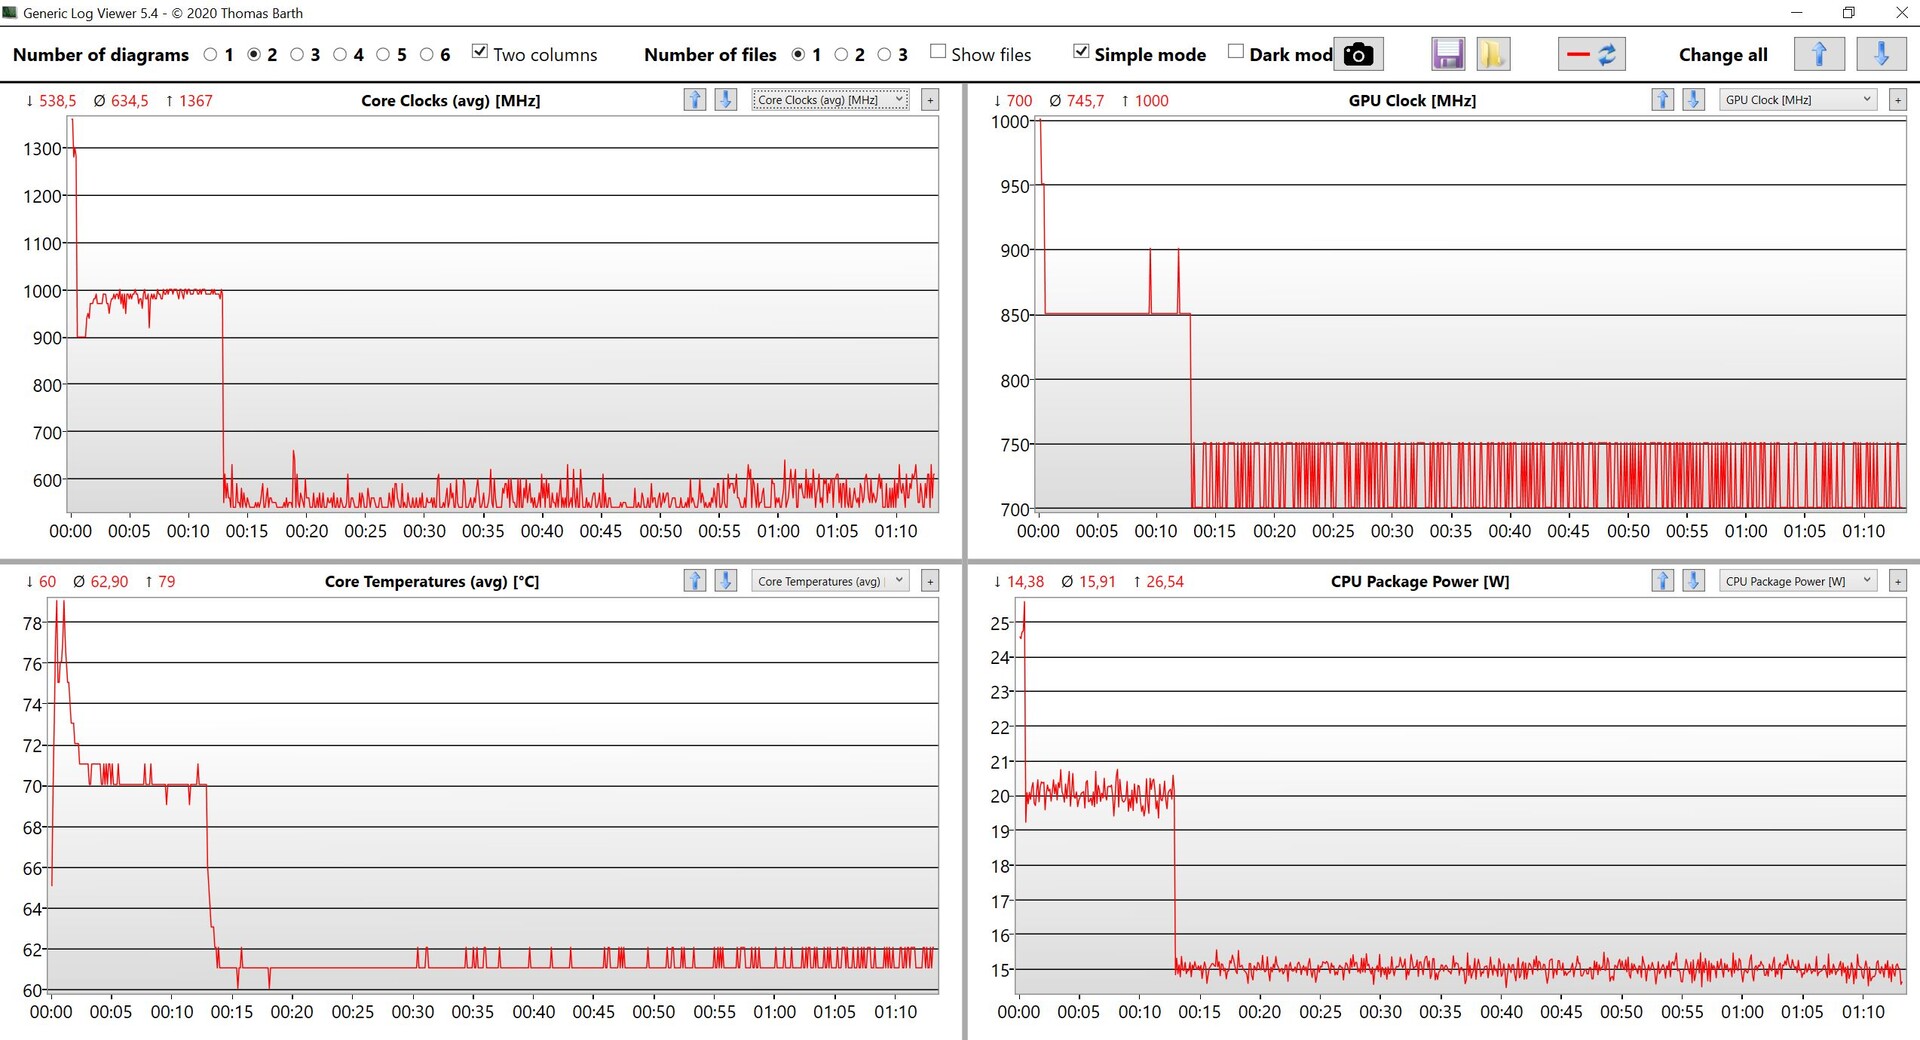
酷睿 i5-1235U 酷睿 i5-1235U采用混合架构,拥有两个快速性能核心和八个高效核心。在 Surface Laptop Go 3 中,处理器的功耗允许在短时间内达到 25 瓦,但很快降至 20 瓦,随后又降至 15 瓦。因此,其性能比前代产品 前代产品.然而,在长期负载情况下,这两款处理器(以及 XPS 13 9315)非常接近。性能绝对足以应付简单的事情。不过,在电池模式下,处理器的功耗被限制在 12 瓦,这也是多核性能下降 50%以上的原因。
Cinebench R15 Multi loop
Cinebench R20: CPU (Multi Core) | CPU (Single Core)
Cinebench R15: CPU Multi 64Bit | CPU Single 64Bit
Blender: v2.79 BMW27 CPU
7-Zip 18.03: 7z b 4 | 7z b 4 -mmt1
Geekbench 5.5: Multi-Core | Single-Core
HWBOT x265 Benchmark v2.2: 4k Preset
LibreOffice : 20 Documents To PDF
R Benchmark 2.5: Overall mean
| Cinebench R23 / Multi Core | |
| Average of class Subnotebook (1555 - 21812, n=59, last 2 years) | |
| Apple MacBook Air 2020 M1 Entry | |
| Lenovo Yoga 6 13 83B2001SGE | |
| Average Intel Core i5-1235U (2485 - 9208, n=8) | |
| Microsoft Surface Laptop Go 3 | |
| Dell XPS 13 9315, i5-1230U | |
| Microsoft Surface Laptop Go 2 Core i5 | |
| Cinebench R23 / Single Core | |
| Average of class Subnotebook (358 - 2213, n=60, last 2 years) | |
| Average Intel Core i5-1235U (1444 - 1698, n=8) | |
| Microsoft Surface Laptop Go 3 | |
| Apple MacBook Air 2020 M1 Entry | |
| Lenovo Yoga 6 13 83B2001SGE | |
| Microsoft Surface Laptop Go 2 Core i5 | |
| Dell XPS 13 9315, i5-1230U | |
| Cinebench R20 / CPU (Multi Core) | |
| Average of class Subnotebook (579 - 8541, n=56, last 2 years) | |
| Lenovo Yoga 6 13 83B2001SGE | |
| Average Intel Core i5-1235U (1783 - 3537, n=8) | |
| Microsoft Surface Laptop Go 3 | |
| Apple MacBook Air 2020 M1 Entry | |
| Dell XPS 13 9315, i5-1230U | |
| Microsoft Surface Laptop Go 2 Core i5 | |
| Cinebench R20 / CPU (Single Core) | |
| Average of class Subnotebook (128 - 832, n=56, last 2 years) | |
| Average Intel Core i5-1235U (566 - 651, n=8) | |
| Microsoft Surface Laptop Go 3 | |
| Lenovo Yoga 6 13 83B2001SGE | |
| Microsoft Surface Laptop Go 2 Core i5 | |
| Dell XPS 13 9315, i5-1230U | |
| Apple MacBook Air 2020 M1 Entry | |
| Cinebench R15 / CPU Multi 64Bit | |
| Average of class Subnotebook (327 - 3345, n=56, last 2 years) | |
| Lenovo Yoga 6 13 83B2001SGE | |
| Average Intel Core i5-1235U (785 - 1587, n=8) | |
| Apple MacBook Air 2020 M1 Entry | |
| Microsoft Surface Laptop Go 3 | |
| Microsoft Surface Laptop Go 2 Core i5 | |
| Dell XPS 13 9315, i5-1230U | |
| Cinebench R15 / CPU Single 64Bit | |
| Average of class Subnotebook (72.4 - 322, n=56, last 2 years) | |
| Lenovo Yoga 6 13 83B2001SGE | |
| Microsoft Surface Laptop Go 3 | |
| Average Intel Core i5-1235U (151.5 - 242, n=8) | |
| Apple MacBook Air 2020 M1 Entry | |
| Microsoft Surface Laptop Go 2 Core i5 | |
| Dell XPS 13 9315, i5-1230U | |
| Blender / v2.79 BMW27 CPU | |
| Microsoft Surface Laptop Go 2 Core i5 | |
| Apple MacBook Air 2020 M1 Entry | |
| Microsoft Surface Laptop Go 3 | |
| Average Intel Core i5-1235U (366 - 662, n=8) | |
| Average of class Subnotebook (159 - 2271, n=57, last 2 years) | |
| Lenovo Yoga 6 13 83B2001SGE | |
| 7-Zip 18.03 / 7z b 4 | |
| Average of class Subnotebook (11668 - 77867, n=56, last 2 years) | |
| Lenovo Yoga 6 13 83B2001SGE | |
| Apple MacBook Air 2020 M1 Entry | |
| Average Intel Core i5-1235U (20166 - 38643, n=8) | |
| Microsoft Surface Laptop Go 3 | |
| Dell XPS 13 9315, i5-1230U | |
| Microsoft Surface Laptop Go 2 Core i5 | |
| 7-Zip 18.03 / 7z b 4 -mmt1 | |
| Average of class Subnotebook (2643 - 6699, n=58, last 2 years) | |
| Apple MacBook Air 2020 M1 Entry | |
| Lenovo Yoga 6 13 83B2001SGE | |
| Average Intel Core i5-1235U (4371 - 5233, n=8) | |
| Microsoft Surface Laptop Go 3 | |
| Microsoft Surface Laptop Go 2 Core i5 | |
| Dell XPS 13 9315, i5-1230U | |
| Geekbench 5.5 / Multi-Core | |
| Average of class Subnotebook (2557 - 17218, n=48, last 2 years) | |
| Apple MacBook Air 2020 M1 Entry | |
| Lenovo Yoga 6 13 83B2001SGE | |
| Average Intel Core i5-1235U (5528 - 8571, n=10) | |
| Dell XPS 13 9315, i5-1230U | |
| Microsoft Surface Laptop Go 3 | |
| Microsoft Surface Laptop Go 2 Core i5 | |
| Geekbench 5.5 / Single-Core | |
| Average of class Subnotebook (726 - 2224, n=48, last 2 years) | |
| Apple MacBook Air 2020 M1 Entry | |
| Dell XPS 13 9315, i5-1230U | |
| Microsoft Surface Laptop Go 3 | |
| Average Intel Core i5-1235U (1426 - 1643, n=10) | |
| Lenovo Yoga 6 13 83B2001SGE | |
| Microsoft Surface Laptop Go 2 Core i5 | |
| HWBOT x265 Benchmark v2.2 / 4k Preset | |
| Average of class Subnotebook (0.97 - 25.1, n=56, last 2 years) | |
| Lenovo Yoga 6 13 83B2001SGE | |
| Average Intel Core i5-1235U (4.99 - 9.43, n=8) | |
| Microsoft Surface Laptop Go 3 | |
| Microsoft Surface Laptop Go 2 Core i5 | |
| LibreOffice / 20 Documents To PDF | |
| Microsoft Surface Laptop Go 2 Core i5 | |
| Average of class Subnotebook (39.9 - 220, n=55, last 2 years) | |
| Microsoft Surface Laptop Go 3 | |
| Average Intel Core i5-1235U (42.4 - 65.5, n=8) | |
| Lenovo Yoga 6 13 83B2001SGE | |
| Apple MacBook Air 2020 M1 Entry | |
| R Benchmark 2.5 / Overall mean | |
| Apple MacBook Air 2020 M1 Entry | |
| Microsoft Surface Laptop Go 2 Core i5 | |
| Lenovo Yoga 6 13 83B2001SGE | |
| Microsoft Surface Laptop Go 3 | |
| Average Intel Core i5-1235U (0.4986 - 0.603, n=8) | |
| Average of class Subnotebook (0.4024 - 1.456, n=57, last 2 years) | |
* ... smaller is better
AIDA64: FP32 Ray-Trace | FPU Julia | CPU SHA3 | CPU Queen | FPU SinJulia | FPU Mandel | CPU AES | CPU ZLib | FP64 Ray-Trace | CPU PhotoWorxx
| Performance rating | |
| Average of class Subnotebook | |
| Lenovo Yoga 6 13 83B2001SGE | |
| Average Intel Core i5-1235U | |
| Microsoft Surface Laptop Go 3 | |
| Microsoft Surface Laptop Go 2 Core i5 | |
| Dell XPS 13 9315, i5-1230U | |
| AIDA64 / FP32 Ray-Trace | |
| Average of class Subnotebook (1135 - 32888, n=57, last 2 years) | |
| Lenovo Yoga 6 13 83B2001SGE | |
| Average Intel Core i5-1235U (3078 - 7457, n=8) | |
| Microsoft Surface Laptop Go 2 Core i5 | |
| Microsoft Surface Laptop Go 3 | |
| Dell XPS 13 9315, i5-1230U | |
| AIDA64 / FPU Julia | |
| Lenovo Yoga 6 13 83B2001SGE | |
| Average of class Subnotebook (5218 - 123315, n=57, last 2 years) | |
| Average Intel Core i5-1235U (15838 - 37760, n=8) | |
| Microsoft Surface Laptop Go 3 | |
| Microsoft Surface Laptop Go 2 Core i5 | |
| Dell XPS 13 9315, i5-1230U | |
| AIDA64 / CPU SHA3 | |
| Average of class Subnotebook (444 - 5287, n=57, last 2 years) | |
| Lenovo Yoga 6 13 83B2001SGE | |
| Average Intel Core i5-1235U (978 - 2072, n=8) | |
| Microsoft Surface Laptop Go 2 Core i5 | |
| Microsoft Surface Laptop Go 3 | |
| Dell XPS 13 9315, i5-1230U | |
| AIDA64 / CPU Queen | |
| Lenovo Yoga 6 13 83B2001SGE | |
| Average of class Subnotebook (10579 - 95002, n=48, last 2 years) | |
| Average Intel Core i5-1235U (45680 - 62404, n=8) | |
| Microsoft Surface Laptop Go 3 | |
| Dell XPS 13 9315, i5-1230U | |
| Microsoft Surface Laptop Go 2 Core i5 | |
| AIDA64 / FPU SinJulia | |
| Lenovo Yoga 6 13 83B2001SGE | |
| Average of class Subnotebook (744 - 18418, n=57, last 2 years) | |
| Average Intel Core i5-1235U (3099 - 4644, n=8) | |
| Microsoft Surface Laptop Go 2 Core i5 | |
| Microsoft Surface Laptop Go 3 | |
| Dell XPS 13 9315, i5-1230U | |
| AIDA64 / FPU Mandel | |
| Lenovo Yoga 6 13 83B2001SGE | |
| Average of class Subnotebook (3341 - 65433, n=57, last 2 years) | |
| Average Intel Core i5-1235U (8046 - 18819, n=8) | |
| Microsoft Surface Laptop Go 2 Core i5 | |
| Microsoft Surface Laptop Go 3 | |
| Dell XPS 13 9315, i5-1230U | |
| AIDA64 / CPU AES | |
| Average of class Subnotebook (638 - 96917, n=57, last 2 years) | |
| Lenovo Yoga 6 13 83B2001SGE | |
| Average Intel Core i5-1235U (23386 - 67140, n=8) | |
| Microsoft Surface Laptop Go 2 Core i5 | |
| Microsoft Surface Laptop Go 3 | |
| Dell XPS 13 9315, i5-1230U | |
| AIDA64 / CPU ZLib | |
| Average of class Subnotebook (164.9 - 1379, n=57, last 2 years) | |
| Lenovo Yoga 6 13 83B2001SGE | |
| Average Intel Core i5-1235U (329 - 633, n=8) | |
| Microsoft Surface Laptop Go 3 | |
| Microsoft Surface Laptop Go 2 Core i5 | |
| Dell XPS 13 9315, i5-1230U | |
| AIDA64 / FP64 Ray-Trace | |
| Average of class Subnotebook (610 - 17495, n=57, last 2 years) | |
| Lenovo Yoga 6 13 83B2001SGE | |
| Average Intel Core i5-1235U (1670 - 3928, n=8) | |
| Microsoft Surface Laptop Go 2 Core i5 | |
| Microsoft Surface Laptop Go 3 | |
| Dell XPS 13 9315, i5-1230U | |
| AIDA64 / CPU PhotoWorxx | |
| Average of class Subnotebook (6569 - 85600, n=57, last 2 years) | |
| Microsoft Surface Laptop Go 3 | |
| Microsoft Surface Laptop Go 2 Core i5 | |
| Average Intel Core i5-1235U (15933 - 41909, n=8) | |
| Dell XPS 13 9315, i5-1230U | |
| Lenovo Yoga 6 13 83B2001SGE | |
系统性能
总的来说,主观性能不错,这也要归功于 NVMe 固态硬盘。虽然不是最快的,但也足以满足日常使用。不过,在我们的延迟测试中,使用当前 BIOS 版本的评测样本在使用实时音频应用程序时受到了限制。
CrossMark: Overall | Productivity | Creativity | Responsiveness
| PCMark 10 / Score | |
| Average of class Subnotebook (4920 - 9939, n=45, last 2 years) | |
| Lenovo Yoga 6 13 83B2001SGE | |
| Average Intel Core i5-1235U, Intel Iris Xe Graphics G7 80EUs (4528 - 5543, n=8) | |
| Microsoft Surface Laptop Go 3 | |
| Dell XPS 13 9315, i5-1230U | |
| Microsoft Surface Laptop Go 2 Core i5 | |
| PCMark 10 / Essentials | |
| Average of class Subnotebook (8552 - 11646, n=45, last 2 years) | |
| Lenovo Yoga 6 13 83B2001SGE | |
| Average Intel Core i5-1235U, Intel Iris Xe Graphics G7 80EUs (9143 - 11273, n=8) | |
| Microsoft Surface Laptop Go 3 | |
| Dell XPS 13 9315, i5-1230U | |
| Microsoft Surface Laptop Go 2 Core i5 | |
| PCMark 10 / Productivity | |
| Average of class Subnotebook (5435 - 16606, n=45, last 2 years) | |
| Lenovo Yoga 6 13 83B2001SGE | |
| Average Intel Core i5-1235U, Intel Iris Xe Graphics G7 80EUs (6440 - 7354, n=8) | |
| Dell XPS 13 9315, i5-1230U | |
| Microsoft Surface Laptop Go 3 | |
| Microsoft Surface Laptop Go 2 Core i5 | |
| PCMark 10 / Digital Content Creation | |
| Average of class Subnotebook (5722 - 13779, n=45, last 2 years) | |
| Microsoft Surface Laptop Go 3 | |
| Average Intel Core i5-1235U, Intel Iris Xe Graphics G7 80EUs (4220 - 5839, n=8) | |
| Lenovo Yoga 6 13 83B2001SGE | |
| Dell XPS 13 9315, i5-1230U | |
| Microsoft Surface Laptop Go 2 Core i5 | |
| CrossMark / Overall | |
| Average of class Subnotebook (365 - 2356, n=59, last 2 years) | |
| Average Intel Core i5-1235U, Intel Iris Xe Graphics G7 80EUs (983 - 1644, n=8) | |
| Apple MacBook Air 2020 M1 Entry | |
| Lenovo Yoga 6 13 83B2001SGE | |
| Dell XPS 13 9315, i5-1230U | |
| Microsoft Surface Laptop Go 3 | |
| Microsoft Surface Laptop Go 2 Core i5 | |
| CrossMark / Productivity | |
| Average of class Subnotebook (364 - 2277, n=59, last 2 years) | |
| Average Intel Core i5-1235U, Intel Iris Xe Graphics G7 80EUs (1026 - 1676, n=8) | |
| Lenovo Yoga 6 13 83B2001SGE | |
| Dell XPS 13 9315, i5-1230U | |
| Microsoft Surface Laptop Go 3 | |
| Apple MacBook Air 2020 M1 Entry | |
| Microsoft Surface Laptop Go 2 Core i5 | |
| CrossMark / Creativity | |
| Average of class Subnotebook (372 - 2743, n=59, last 2 years) | |
| Apple MacBook Air 2020 M1 Entry | |
| Average Intel Core i5-1235U, Intel Iris Xe Graphics G7 80EUs (1032 - 1618, n=8) | |
| Lenovo Yoga 6 13 83B2001SGE | |
| Microsoft Surface Laptop Go 3 | |
| Dell XPS 13 9315, i5-1230U | |
| Microsoft Surface Laptop Go 2 Core i5 | |
| CrossMark / Responsiveness | |
| Average of class Subnotebook (312 - 1854, n=59, last 2 years) | |
| Average Intel Core i5-1235U, Intel Iris Xe Graphics G7 80EUs (746 - 1867, n=8) | |
| Dell XPS 13 9315, i5-1230U | |
| Lenovo Yoga 6 13 83B2001SGE | |
| Microsoft Surface Laptop Go 3 | |
| Microsoft Surface Laptop Go 2 Core i5 | |
| Apple MacBook Air 2020 M1 Entry | |
| PCMark 10 Score | 4993 points | |
Help | ||
| AIDA64 / Memory Copy | |
| Average of class Subnotebook (14554 - 131023, n=57, last 2 years) | |
| Microsoft Surface Laptop Go 3 | |
| Dell XPS 13 9315, i5-1230U | |
| Microsoft Surface Laptop Go 2 Core i5 | |
| Average Intel Core i5-1235U (24653 - 61921, n=8) | |
| Lenovo Yoga 6 13 83B2001SGE | |
| AIDA64 / Memory Read | |
| Average of class Subnotebook (15948 - 127174, n=57, last 2 years) | |
| Microsoft Surface Laptop Go 3 | |
| Dell XPS 13 9315, i5-1230U | |
| Microsoft Surface Laptop Go 2 Core i5 | |
| Average Intel Core i5-1235U (24441 - 66108, n=8) | |
| Lenovo Yoga 6 13 83B2001SGE | |
| AIDA64 / Memory Write | |
| Average of class Subnotebook (15709 - 135141, n=57, last 2 years) | |
| Microsoft Surface Laptop Go 3 | |
| Dell XPS 13 9315, i5-1230U | |
| Microsoft Surface Laptop Go 2 Core i5 | |
| Average Intel Core i5-1235U (25156 - 75808, n=8) | |
| Lenovo Yoga 6 13 83B2001SGE | |
| AIDA64 / Memory Latency | |
| Lenovo Yoga 6 13 83B2001SGE | |
| Microsoft Surface Laptop Go 3 | |
| Microsoft Surface Laptop Go 2 Core i5 | |
| Average of class Subnotebook (6.1 - 159.9, n=55, last 2 years) | |
| Average Intel Core i5-1235U (76.3 - 119, n=8) | |
| Dell XPS 13 9315, i5-1230U | |
* ... smaller is better
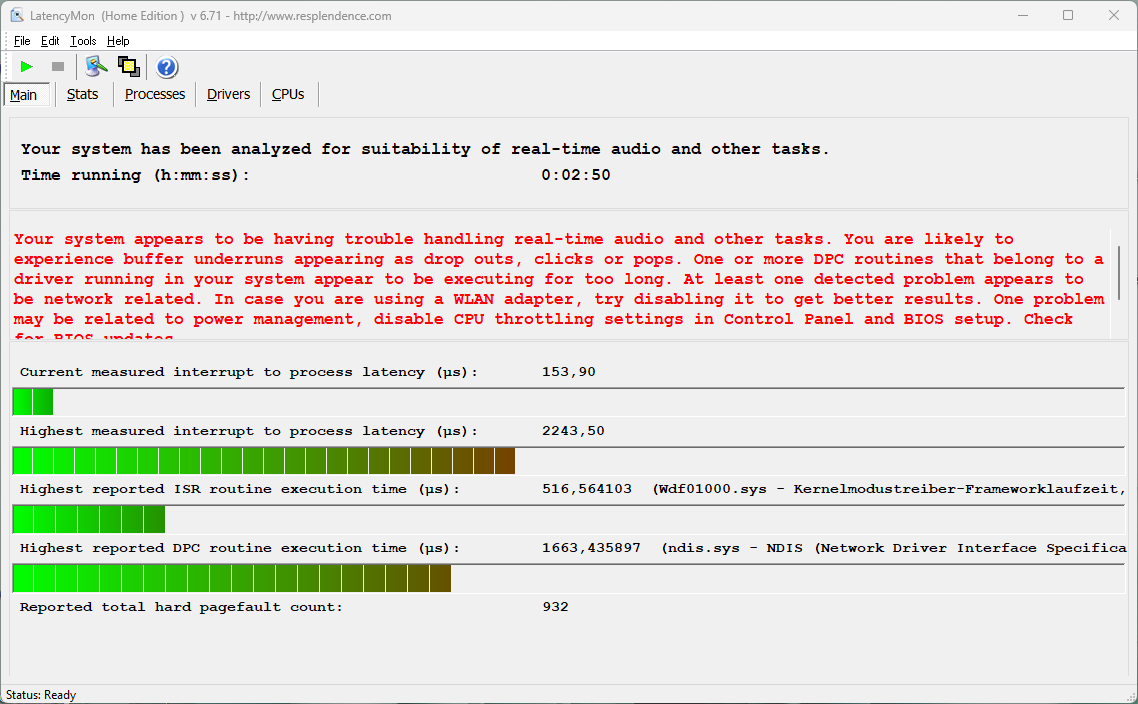
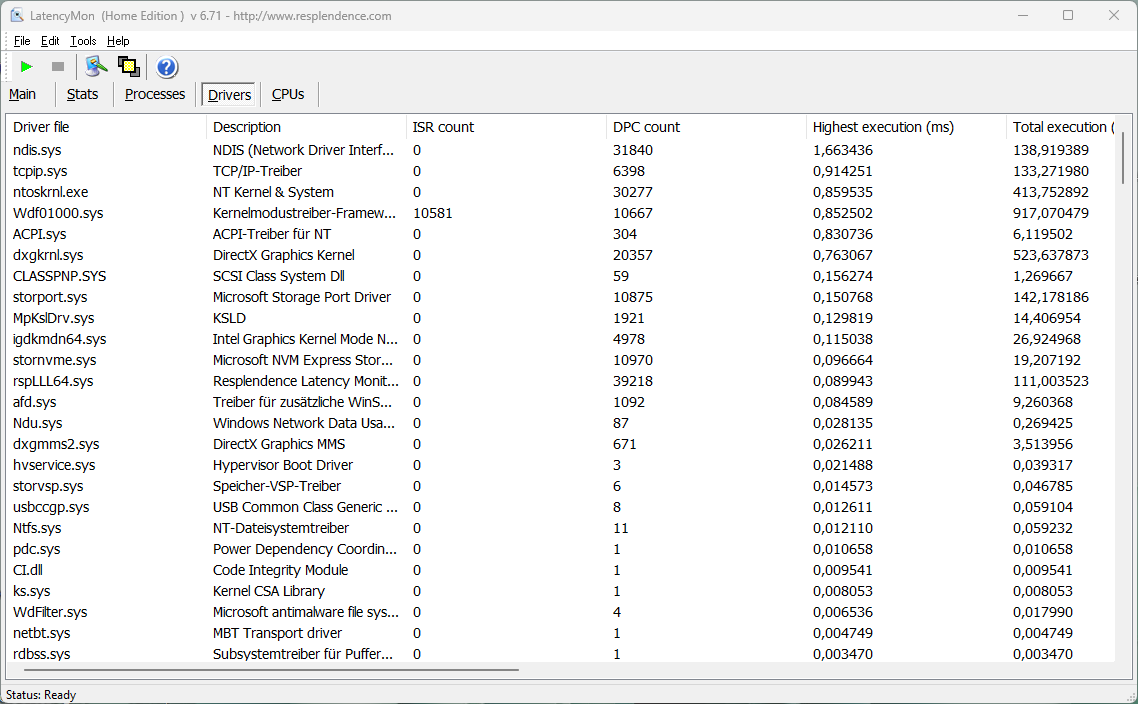
| DPC Latencies / LatencyMon - interrupt to process latency (max), Web, Youtube, Prime95 | |
| Dell XPS 13 9315, i5-1230U | |
| Microsoft Surface Laptop Go 3 | |
| Lenovo Yoga 6 13 83B2001SGE | |
| Microsoft Surface Laptop Go 2 Core i5 | |
* ... smaller is better

* ... smaller is better
Dauerleistung Lesen: DiskSpd Read Loop, Queue Depth 8
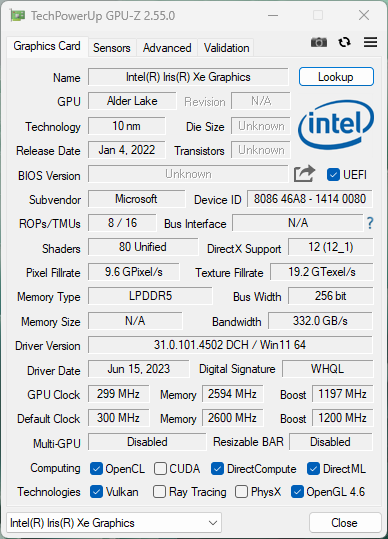
在图形性能方面没有任何变化,因为集成的 Iris Xe Graphics G7负责图形计算。因此,整体性能仍然处于很低的水平。得益于视频解码器,播放高分辨率视频非常流畅,但在玩游戏时,这款小巧的子笔记本很快就达到了极限。即使在低分辨率下,通常也只能获得最低限度的细节。在电池电量不足的情况下,性能会降低约 30%。
| 3DMark 11 Performance | 5282 points | |
| 3DMark Fire Strike Score | 3938 points | |
| 3DMark Time Spy Score | 1371 points | |
Help | ||
| Blender / v3.3 Classroom METAL | |
| Apple MacBook Air 2020 M1 Entry | |
| Average of class Subnotebook (76.3 - 227, n=5, last 2 years) | |
| Blender / v3.3 Classroom HIP/AMD | |
| Lenovo Yoga 6 13 83B2001SGE | |
| Blender / v3.3 Classroom CPU | |
| Microsoft Surface Laptop Go 2 Core i5 | |
| Microsoft Surface Laptop Go 3 | |
| Apple MacBook Air 2020 M1 Entry | |
| Average Intel Iris Xe Graphics G7 80EUs (463 - 3047, n=53) | |
| Lenovo Yoga 6 13 83B2001SGE | |
| Average of class Subnotebook (241 - 861, n=59, last 2 years) | |
* ... smaller is better
| Performance rating - Percent | |
| Average of class Subnotebook | |
| Lenovo Yoga 6 13 83B2001SGE | |
| Microsoft Surface Laptop Go 2 Core i5 -3! | |
| Microsoft Surface Laptop Go 3 | |
| Dell XPS 13 9315, i5-1230U -4! | |
| The Witcher 3 - 1920x1080 Ultra Graphics & Postprocessing (HBAO+) | |
| Average of class Subnotebook (13.9 - 34.6, n=12, last 2 years) | |
| Lenovo Yoga 6 13 83B2001SGE | |
| Microsoft Surface Laptop Go 3 | |
| Dell XPS 13 9315, i5-1230U | |
| GTA V - 1920x1080 Highest AA:4xMSAA + FX AF:16x | |
| Average of class Subnotebook (10.7 - 43.7, n=55, last 2 years) | |
| Lenovo Yoga 6 13 83B2001SGE | |
| Microsoft Surface Laptop Go 3 | |
| Final Fantasy XV Benchmark - 1920x1080 High Quality | |
| Average of class Subnotebook (11.6 - 54.5, n=53, last 2 years) | |
| Lenovo Yoga 6 13 83B2001SGE | |
| Microsoft Surface Laptop Go 3 | |
| Microsoft Surface Laptop Go 2 Core i5 | |
| Dell XPS 13 9315, i5-1230U | |
| Strange Brigade - 1920x1080 ultra AA:ultra AF:16 | |
| Average of class Subnotebook (19 - 101.3, n=49, last 2 years) | |
| Lenovo Yoga 6 13 83B2001SGE | |
| Microsoft Surface Laptop Go 3 | |
| Dota 2 Reborn - 1920x1080 ultra (3/3) best looking | |
| Average of class Subnotebook (13 - 97, n=60, last 2 years) | |
| Lenovo Yoga 6 13 83B2001SGE | |
| Microsoft Surface Laptop Go 3 | |
| Microsoft Surface Laptop Go 2 Core i5 | |
| X-Plane 11.11 - 1920x1080 high (fps_test=3) | |
| Average of class Subnotebook (20.7 - 50.5, n=53, last 2 years) | |
| Lenovo Yoga 6 13 83B2001SGE | |
| Microsoft Surface Laptop Go 2 Core i5 | |
| Microsoft Surface Laptop Go 3 | |
| low | med. | high | ultra | |
|---|---|---|---|---|
| GTA V (2015) | 63.8 | 64.4 | 17.7 | 8.38 |
| The Witcher 3 (2015) | 74 | 48 | 17 | 9.83 |
| Dota 2 Reborn (2015) | 93.1 | 59.5 | 45.9 | 40.2 |
| Final Fantasy XV Benchmark (2018) | 29.9 | 16.3 | 11.9 | |
| X-Plane 11.11 (2018) | 38.6 | 28.8 | 26.4 | |
| Strange Brigade (2018) | 69.6 | 32.8 | 25.5 | 19.8 |
| F1 2021 (2021) | 77 | 34.3 | 26.5 | 18.8 |
排放与能源
噪音排放
Surface Laptop Go 3 仍有一个小风扇,但在日常使用中通常是关闭的。不过,一旦系统负载增加,它就会变得明显,而且频率也相当高。在长期负载情况下,其噪音接近 40 dB(A),考虑到性能较低,这款小巧设备的噪音实在太大了。这里的 MacBook Air的被动散热无疑具有很大的优势。我们听不到任何其他电子噪音。
Noise level
| Idle |
| 22.5 / 22.5 / 22.5 dB(A) |
| Load |
| 31.3 / 39.1 dB(A) |
 | ||
30 dB silent 40 dB(A) audible 50 dB(A) loud |
||
min: | ||
| Microsoft Surface Laptop Go 3 Iris Xe G7 80EUs, i5-1235U, Kioxia BG5 KBG50ZNS256G | Dell XPS 13 9315, i5-1230U Iris Xe G7 80EUs, i5-1230U, Micron 3460 256 GB Soldered | Lenovo Yoga 6 13 83B2001SGE Vega 8, R7 7730U, WD PC SN740 512GB SDDPMQD-512G-1101 | Microsoft Surface Laptop Go 2 Core i5 Iris Xe G7 80EUs, i5-1135G7, Toshiba KBG40ZNS256G NVMe | |
|---|---|---|---|---|
| Noise | -15% | -16% | -6% | |
| off / environment * (dB) | 22.5 | 26 -16% | 27 -20% | 24.3 -8% |
| Idle Minimum * (dB) | 22.5 | 26 -16% | 27 -20% | 24.3 -8% |
| Idle Average * (dB) | 22.5 | 26 -16% | 27 -20% | 24.3 -8% |
| Idle Maximum * (dB) | 22.5 | 27.5 -22% | 27 -20% | 24.3 -8% |
| Load Average * (dB) | 31.3 | 39.5 -26% | 37.6 -20% | 33.1 -6% |
| Witcher 3 ultra * (dB) | 37.8 | 39.6 -5% | 36.7 3% | |
| Load Maximum * (dB) | 39.1 | 39.6 -1% | 37.6 4% | 41.8 -7% |
* ... smaller is better
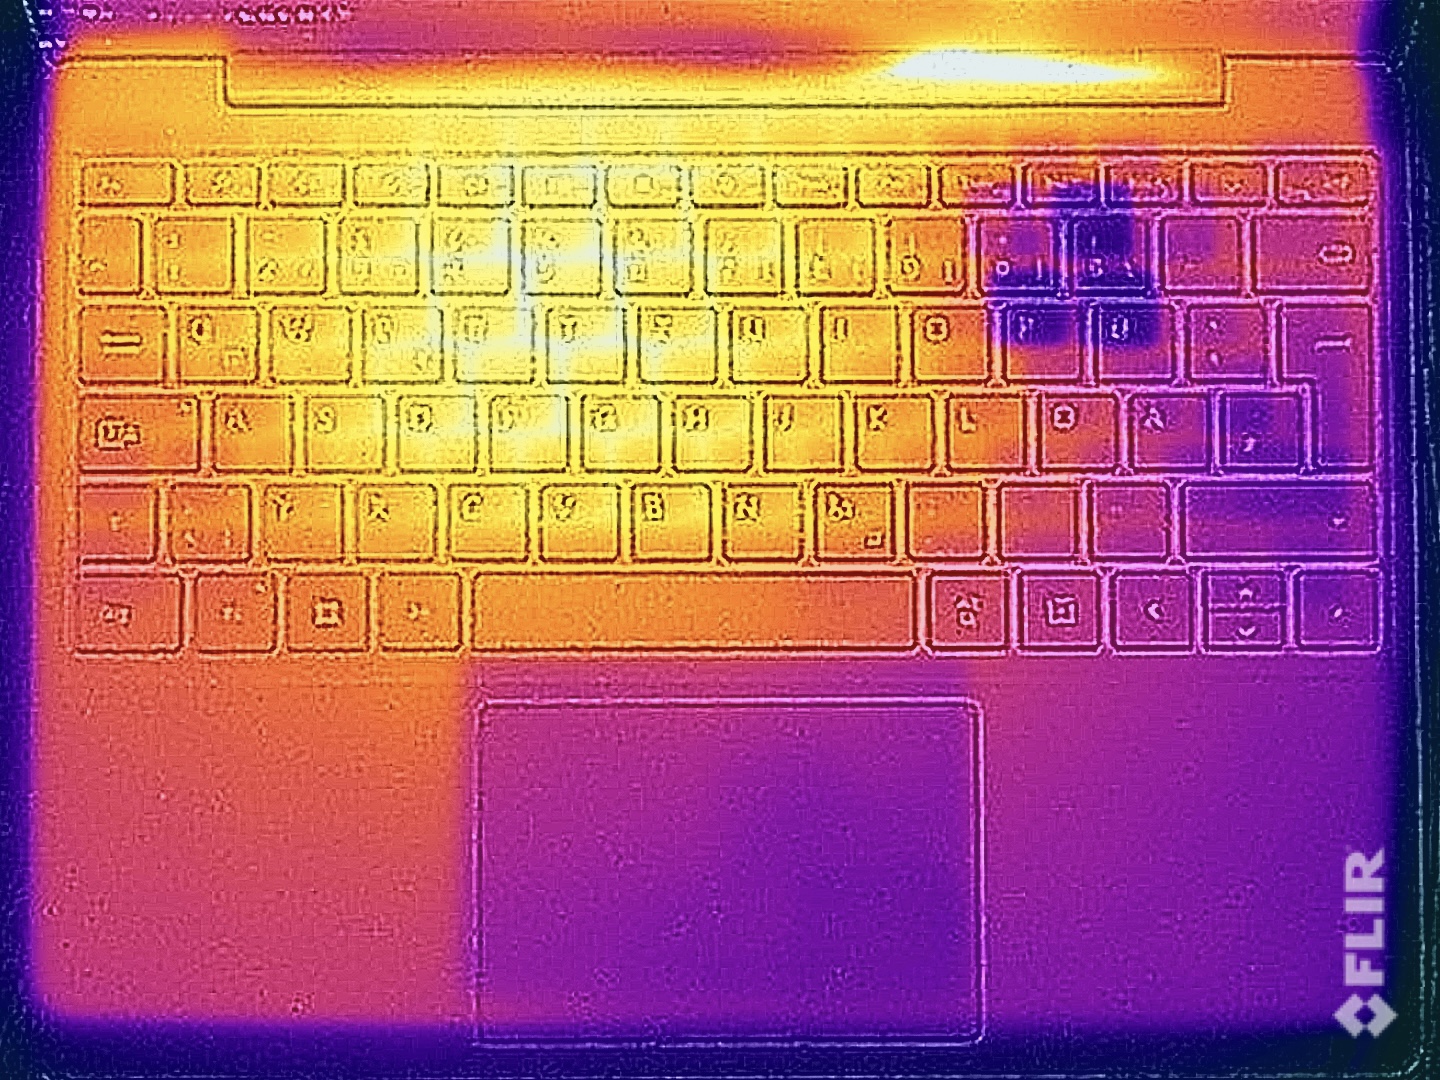
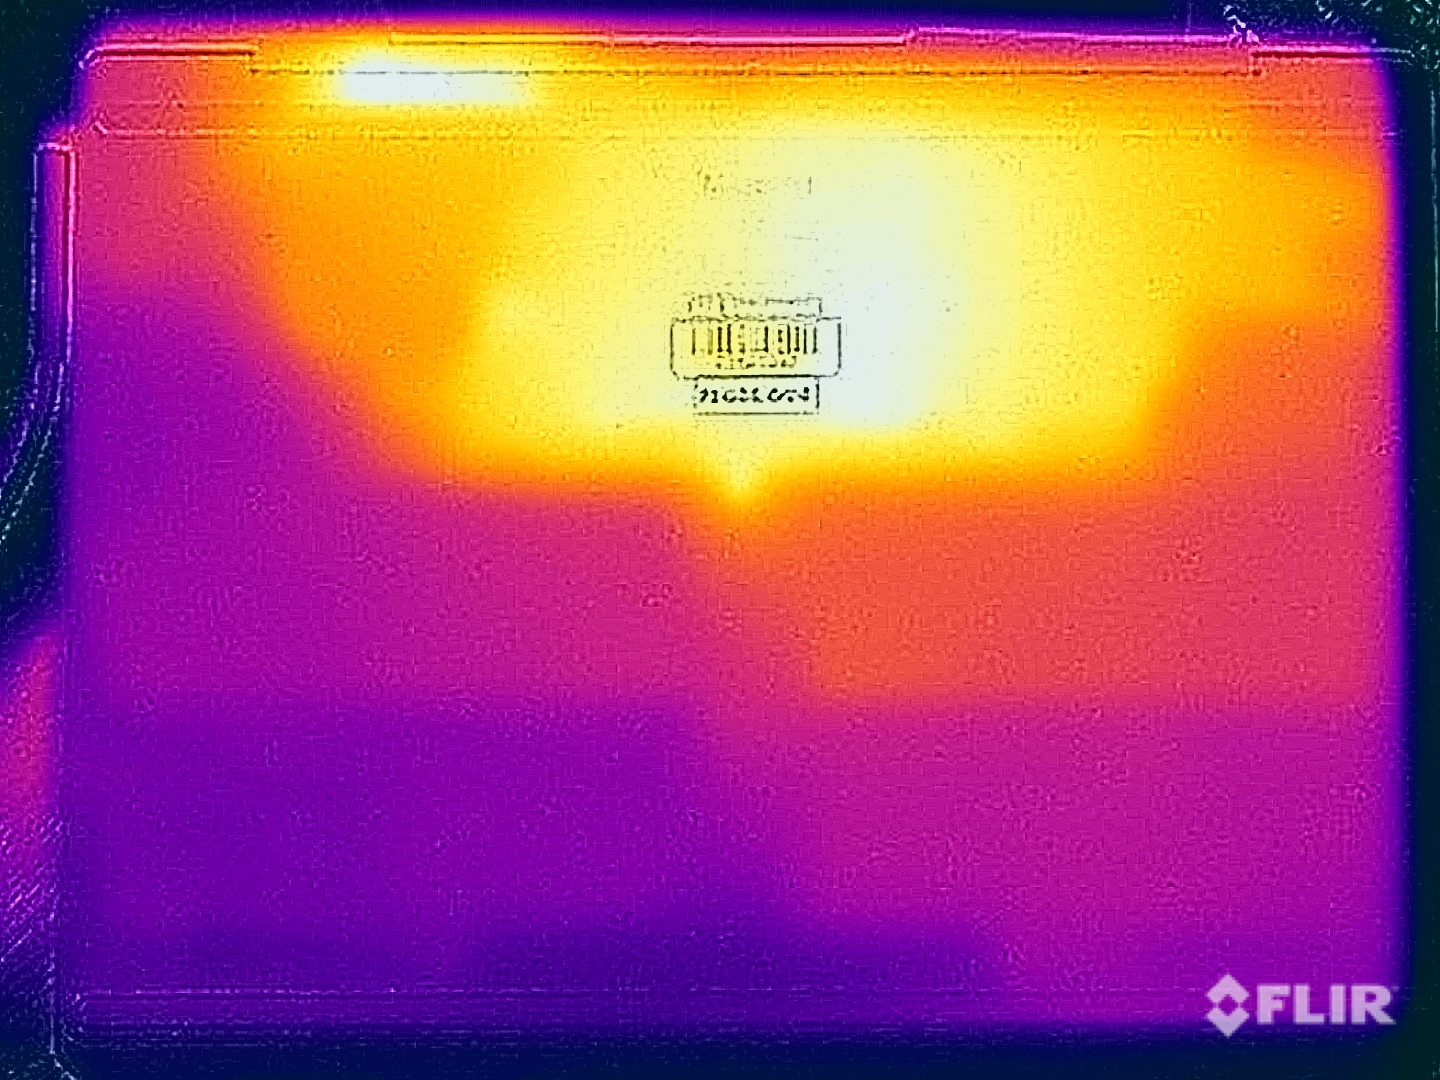
在日常使用中,这款小巧的设备能保持凉爽,但在负载情况下,我们在底部后部测得的温度高达 47 °C。在压力测试中,处理器的 TDP 首先稳定在 20 瓦,几分钟后又稳定在 15 瓦。
(±) The maximum temperature on the upper side is 40.9 °C / 106 F, compared to the average of 35.9 °C / 97 F, ranging from 21.4 to 59 °C for the class Subnotebook.
(-) The bottom heats up to a maximum of 47.2 °C / 117 F, compared to the average of 39.2 °C / 103 F
(+) In idle usage, the average temperature for the upper side is 24.1 °C / 75 F, compared to the device average of 30.8 °C / 87 F.
(+) The palmrests and touchpad are cooler than skin temperature with a maximum of 31.8 °C / 89.2 F and are therefore cool to the touch.
(-) The average temperature of the palmrest area of similar devices was 28.2 °C / 82.8 F (-3.6 °C / -6.4 F).
| Microsoft Surface Laptop Go 3 Intel Core i5-1235U, Intel Iris Xe Graphics G7 80EUs | Apple MacBook Air 2020 M1 Entry Apple M1, Apple M1 7-Core GPU | Dell XPS 13 9315, i5-1230U Intel Core i5-1230U, Intel Iris Xe Graphics G7 80EUs | Lenovo Yoga 6 13 83B2001SGE AMD Ryzen 7 7730U, AMD Radeon RX Vega 8 (Ryzen 4000/5000) | Microsoft Surface Laptop Go 2 Core i5 Intel Core i5-1135G7, Intel Iris Xe Graphics G7 80EUs | |
|---|---|---|---|---|---|
| Heat | -3% | -19% | -18% | -9% | |
| Maximum Upper Side * (°C) | 40.9 | 44 -8% | 42.3 -3% | 43.8 -7% | 41.4 -1% |
| Maximum Bottom * (°C) | 47.2 | 44 7% | 44.9 5% | 48.2 -2% | 46.7 1% |
| Idle Upper Side * (°C) | 24.9 | 27 -8% | 32.5 -31% | 32.9 -32% | 28.5 -14% |
| Idle Bottom * (°C) | 25.9 | 27 -4% | 38.2 -47% | 34.1 -32% | 31.5 -22% |
* ... smaller is better
发言人
扬声器的性能仍然不错,但比不上 MacBook Air M1.
Microsoft Surface Laptop Go 3 audio analysis
(±) | speaker loudness is average but good (79 dB)
Bass 100 - 315 Hz
(-) | nearly no bass - on average 18.7% lower than median
(±) | linearity of bass is average (9.8% delta to prev. frequency)
Mids 400 - 2000 Hz
(+) | balanced mids - only 4.8% away from median
(+) | mids are linear (5.2% delta to prev. frequency)
Highs 2 - 16 kHz
(+) | balanced highs - only 1.1% away from median
(+) | highs are linear (2.7% delta to prev. frequency)
Overall 100 - 16.000 Hz
(±) | linearity of overall sound is average (15.4% difference to median)
Compared to same class
» 35% of all tested devices in this class were better, 6% similar, 59% worse
» The best had a delta of 5%, average was 18%, worst was 53%
Compared to all devices tested
» 23% of all tested devices were better, 4% similar, 73% worse
» The best had a delta of 4%, average was 23%, worst was 134%
Apple MacBook Air 2020 M1 Entry audio analysis
(±) | speaker loudness is average but good (79.6 dB)
Bass 100 - 315 Hz
(±) | reduced bass - on average 7.1% lower than median
(±) | linearity of bass is average (9.5% delta to prev. frequency)
Mids 400 - 2000 Hz
(+) | balanced mids - only 2.2% away from median
(+) | mids are linear (5.3% delta to prev. frequency)
Highs 2 - 16 kHz
(+) | balanced highs - only 2.3% away from median
(+) | highs are linear (4% delta to prev. frequency)
Overall 100 - 16.000 Hz
(+) | overall sound is linear (8.7% difference to median)
Compared to same class
» 3% of all tested devices in this class were better, 1% similar, 96% worse
» The best had a delta of 5%, average was 18%, worst was 53%
Compared to all devices tested
» 3% of all tested devices were better, 1% similar, 97% worse
» The best had a delta of 4%, average was 23%, worst was 134%
| Off / Standby | |
| Idle | |
| Load |
|
Key:
min: | |
Power consumption Witcher 3 / Stresstest
Power consumption with external monitor
电池寿命
41 Wh 的电池容量没有变化,但我们可以看到与旧款相比有了改进。在 150 cd/m²(相当于测试设备最大亮度的 70%)的 WLAN 测试中,现在的续航时间略低于 8 小时,而在全亮度下则略高于 5.5 小时。这些结果本身并不差,但鉴于屏幕亮度较低,它们并不是最佳的续航时间。此外,所有竞争对手都能提供更长的续航时间。
| Battery Runtime | |
| WiFi Websurfing | |
| Apple MacBook Air 2020 M1 Entry | |
| Apple MacBook Air 2020 M1 Entry (Fullscreen) | |
| Dell XPS 13 9315, i5-1230U | |
| Average of class Subnotebook (7.25 - 26.4, n=59, last 2 years) | |
| Lenovo Yoga 6 13 83B2001SGE | |
| Microsoft Surface Laptop Go 3 (Edge 117) | |
| Microsoft Surface Laptop Go 2 Core i5 (Edge 101) | |
| WiFi Websurfing max. Brightness | |
| Dell XPS 13 9315, i5-1230U | |
| Average of class Subnotebook (4.82 - 15.8, n=33, last 2 years) | |
| Apple MacBook Air 2020 M1 Entry | |
| Lenovo Yoga 6 13 83B2001SGE | |
| Microsoft Surface Laptop Go 3 (Edge 117) | |
| Microsoft Surface Laptop Go 2 Core i5 (Edge 101) | |
Pros
Cons
评语:Surface Laptop Go 3 已经过时,而且过于昂贵
原则上,我们可以确认我们对 Surface Laptop Go 2因为第三代产品并没有真正的进步。新的 Alder Lake 处理器能在短时间内提供更强的性能,电池续航时间也更好一些,但竞争对手只是在续航方面提供了更多。
与此同时,这款小巧的设备显然也具有积极的特点:首先是高质量的金属外壳和良好的键盘。键入手感非常好,但微软仍然没有提供键盘背光。3:2 英寸的触摸屏也提供了不错的画质,出厂时已经进行了非常精确的校准。 前代产品这给户外使用带来了困难。散热也是个问题,因为尽管性能不高,但小风扇的工作量却很大,稍微用力,设备表面就会发热。
新款微软 Surface Laptop Go 3 的速度更快了一些,现在还可以选配 16GB 内存,但价格也同时提高了。这款小巧的笔记本电脑 1149 欧元的价格实在太贵了,而竞争对手提供的整体套餐要好得多。
不过,我们现在要谈的是真正的问题--价格。我们在上一款机型中就已经批评过这个问题,而现在它的价格更高。此外,微软已经完全取消了更便宜(因此对许多客户来说更有趣)的配置。500-600 欧元的价格当然可以忽略一些不足,但市场上已经有超过 1000 欧元的真正好设备了,不过它们的体积也更大一些。如果您不一定需要 Windows 系统,而只是想找一款适合日常工作的设备,那么您应该看看 Apple MacBook Air M1除了触摸屏(如果使用)和缺少 USB-A 端口外,它几乎在所有方面都更胜一筹。
价格和供应情况
截至发稿时,微软 Surface Laptop Go 3 已在多家零售商处有售。在美国,用户可以通过亚马逊订购该机型。
Microsoft Surface Laptop Go 3
- 10/09/2023 v7 (old)
Andreas Osthoff
Transparency
The selection of devices to be reviewed is made by our editorial team. The test sample was provided to the author as a loan by the manufacturer or retailer for the purpose of this review. The lender had no influence on this review, nor did the manufacturer receive a copy of this review before publication. There was no obligation to publish this review. As an independent media company, Notebookcheck is not subjected to the authority of manufacturers, retailers or publishers.
This is how Notebookcheck is testing
Every year, Notebookcheck independently reviews hundreds of laptops and smartphones using standardized procedures to ensure that all results are comparable. We have continuously developed our test methods for around 20 years and set industry standards in the process. In our test labs, high-quality measuring equipment is utilized by experienced technicians and editors. These tests involve a multi-stage validation process. Our complex rating system is based on hundreds of well-founded measurements and benchmarks, which maintains objectivity. Further information on our test methods can be found here.
Price comparison
