惠普 ProBook 650 G2 笔记本电脑简短评测
| SD Card Reader | |
| average JPG Copy Test (av. of 3 runs) | |
| Dell Latitude 15 E5570 | |
| Lenovo ThinkPad L560-20F10026GE | |
| Acer TravelMate P658-M-537B | |
| HP ProBook 650 G2-T9X61ET | |
| Toshiba Tecra Z50-C-10P | |
| maximum AS SSD Seq Read Test (1GB) | |
| HP ProBook 650 G2-T9X61ET | |
| Lenovo ThinkPad L560-20F10026GE | |
| Toshiba Tecra Z50-C-10P | |
| Networking | |
| Wi-Fi Client 1m | |
| Wi-Fi Server 1m |
| |||||||||||||||||||||||||
Brightness Distribution: 85 %
Center on Battery: 247 cd/m²
Contrast: 405:1 (Black: 0.61 cd/m²)
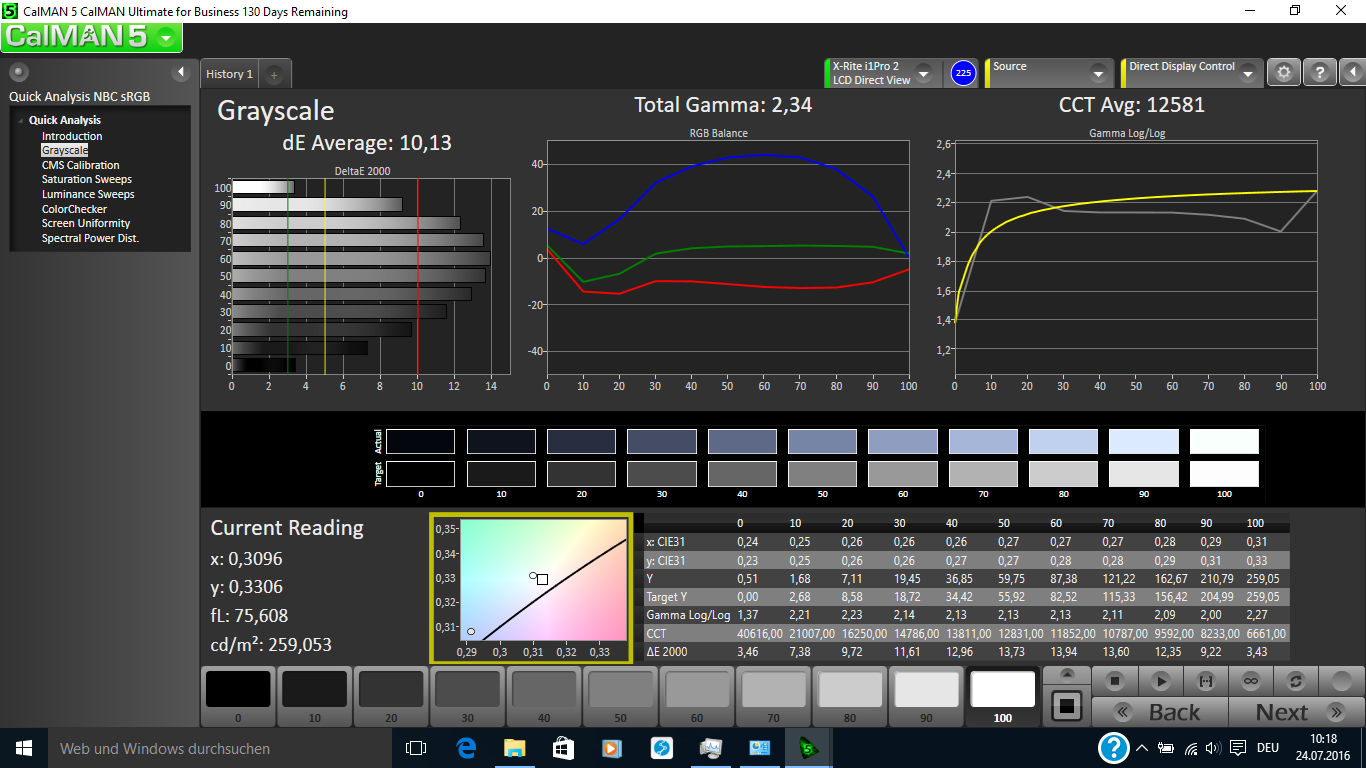
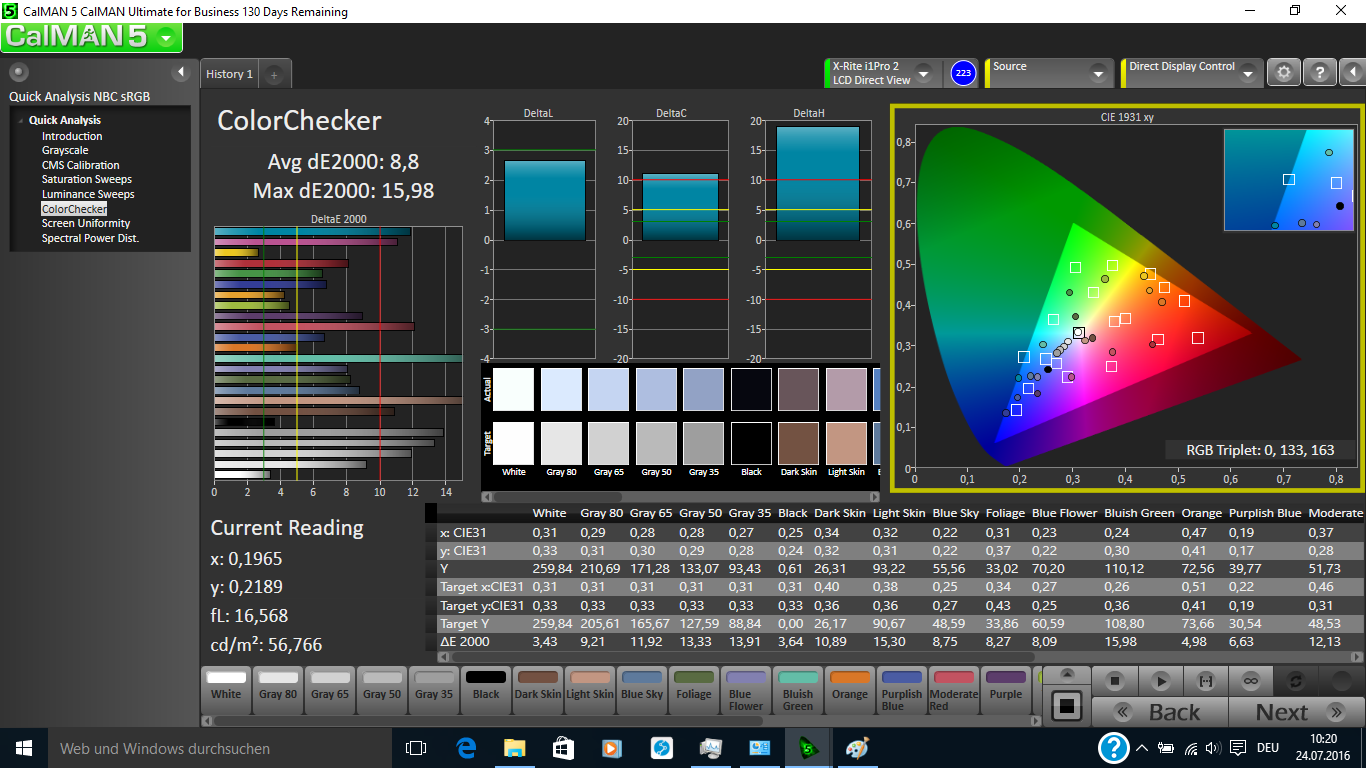
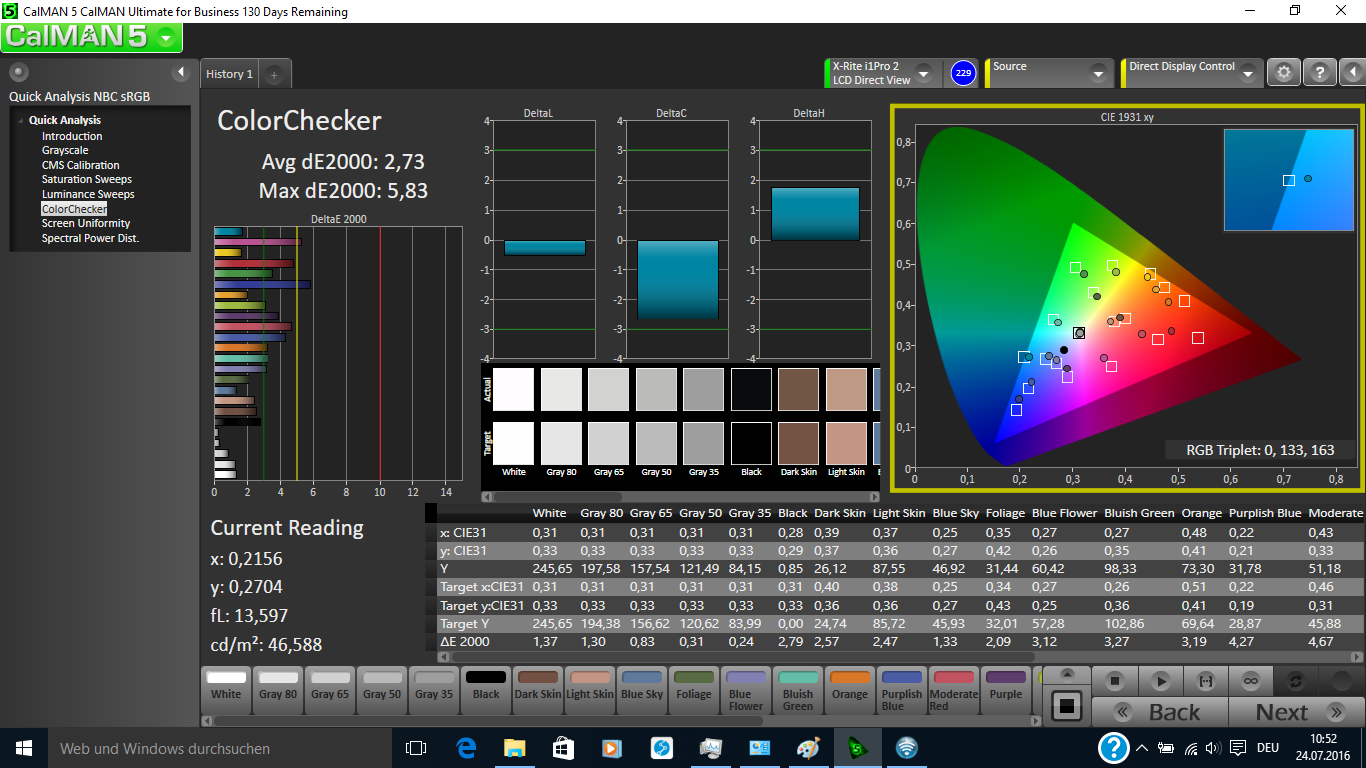
ΔE ColorChecker Calman: 8.8 | ∀{0.5-29.43 Ø4.71}
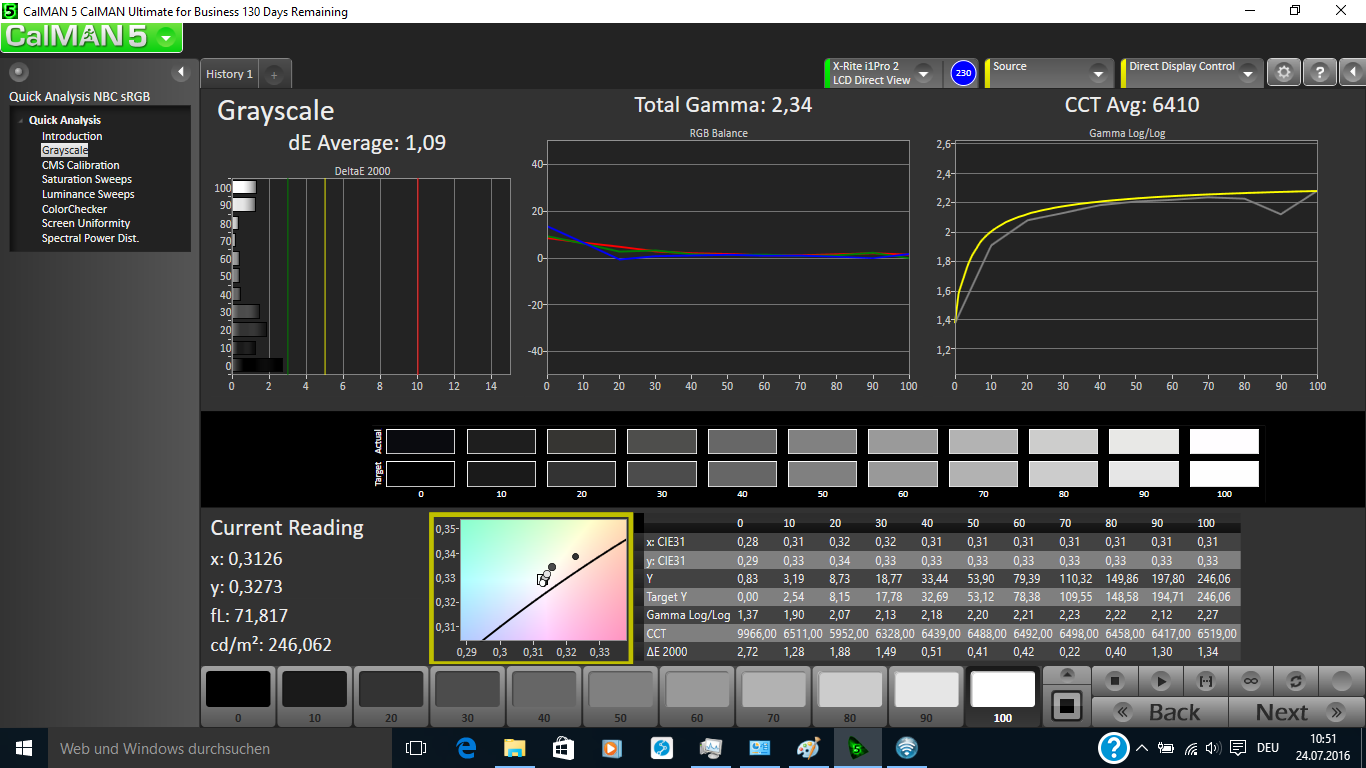
ΔE Greyscale Calman: 10.13 | ∀{0.09-98 Ø4.96}
62.2% sRGB (Argyll 1.6.3 3D)
39.6% AdobeRGB 1998 (Argyll 1.6.3 3D)
43% AdobeRGB 1998 (Argyll 3D)
62.3% sRGB (Argyll 3D)
41.59% Display P3 (Argyll 3D)
Gamma: 2.34
CCT: 12581 K
| HP ProBook 650 G2-T9X61ET TN LED, 1366x768, 15.6" | Lenovo ThinkPad L560-20F10026GE AH-IPS, 1920x1080, 15.6" | Dell Latitude 15 E5570 TN LED, 1366x768, 15.6" | Toshiba Tecra Z50-C-10P IPS-Panel, 1920x1080, 15.6" | Acer TravelMate P658-M-537B IPS, 1920x1080, 15.6" | HP ProBook 650 G1 H5G74E TN LED, 1366x768, 15.6" | |
|---|---|---|---|---|---|---|
| Display | -6% | -3% | 46% | 48% | ||
| Display P3 Coverage (%) | 41.59 | 39 -6% | 40.48 -3% | 65.4 57% | 66.6 60% | |
| sRGB Coverage (%) | 62.3 | 58.3 -6% | 60.9 -2% | 84.6 36% | 85.7 38% | |
| AdobeRGB 1998 Coverage (%) | 43 | 40.33 -6% | 41.82 -3% | 61.8 44% | 62.8 46% | |
| Response Times | 8% | 0% | 35% | 14% | ||
| Response Time Grey 50% / Grey 80% * (ms) | 40.4 ? | 39.2 ? 3% | 47 ? -16% | 20 ? 50% | 38 ? 6% | |
| Response Time Black / White * (ms) | 32 ? | 28 ? 12% | 27 ? 16% | 26 ? 19% | 25 ? 22% | |
| PWM Frequency (Hz) | 200 ? | 50 ? | ||||
| Screen | 20% | -1% | 50% | 31% | -13% | |
| Brightness middle (cd/m²) | 247 | 262 6% | 228 -8% | 288 17% | 308 25% | 197 -20% |
| Brightness (cd/m²) | 223 | 250 12% | 236 6% | 277 24% | 319 43% | 186 -17% |
| Brightness Distribution (%) | 85 | 92 8% | 90 6% | 83 -2% | 71 -16% | 82 -4% |
| Black Level * (cd/m²) | 0.61 | 0.29 52% | 0.56 8% | 0.27 56% | 0.61 -0% | 0.63 -3% |
| Contrast (:1) | 405 | 903 123% | 407 0% | 1067 163% | 505 25% | 313 -23% |
| Colorchecker dE 2000 * | 8.8 | 8.49 4% | 10.02 -14% | 4.7 47% | 4.51 49% | 10.48 -19% |
| Colorchecker dE 2000 max. * | 15.98 | 17.99 -13% | 15.93 -0% | 11.7 27% | 10.19 36% | |
| Greyscale dE 2000 * | 10.13 | 8.11 20% | 10.66 -5% | 3.1 69% | 2.91 71% | 10.68 -5% |
| Gamma | 2.34 94% | 2.37 93% | 2.48 89% | 2.7 81% | 2.4 92% | 2.31 95% |
| CCT | 12581 52% | 6300 103% | 11800 55% | 6603 98% | 6740 96% | 12387 52% |
| Color Space (Percent of AdobeRGB 1998) (%) | 39.6 | 37.07 -6% | 39 -2% | 61.9 56% | 56 41% | 35.2 -11% |
| Color Space (Percent of sRGB) (%) | 62.2 | 57.94 -7% | 61 -2% | 90.3 45% | 86 38% | |
| Total Average (Program / Settings) | 7% /
13% | -1% /
-1% | 44% /
47% | 31% /
32% | -13% /
-13% |
* ... smaller is better
Display Response Times
| ↔ Response Time Black to White | ||
|---|---|---|
| 32 ms ... rise ↗ and fall ↘ combined | ↗ 18.8 ms rise | 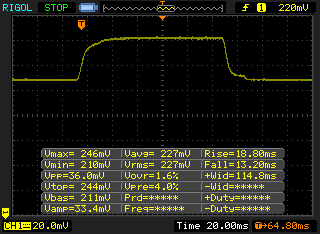 |
| ↘ 13.2 ms fall | ||
| The screen shows slow response rates in our tests and will be unsatisfactory for gamers. In comparison, all tested devices range from 0.1 (minimum) to 240 (maximum) ms. » 86 % of all devices are better. This means that the measured response time is worse than the average of all tested devices (19.8 ms). | ||
| ↔ Response Time 50% Grey to 80% Grey | ||
| 40.4 ms ... rise ↗ and fall ↘ combined | ↗ 19.6 ms rise | 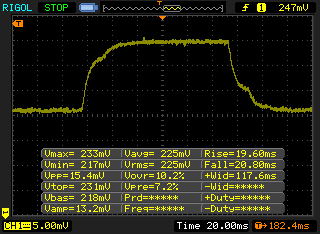 |
| ↘ 20.8 ms fall | ||
| The screen shows slow response rates in our tests and will be unsatisfactory for gamers. In comparison, all tested devices range from 0.165 (minimum) to 636 (maximum) ms. » 64 % of all devices are better. This means that the measured response time is worse than the average of all tested devices (31 ms). | ||
Screen Flickering / PWM (Pulse-Width Modulation)
| Screen flickering / PWM detected | 200 Hz | ≤ 90 % brightness setting | 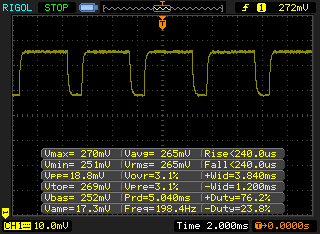 |
The display backlight flickers at 200 Hz (worst case, e.g., utilizing PWM) Flickering detected at a brightness setting of 90 % and below. There should be no flickering or PWM above this brightness setting. The frequency of 200 Hz is relatively low, so sensitive users will likely notice flickering and experience eyestrain at the stated brightness setting and below. In comparison: 52 % of all tested devices do not use PWM to dim the display. If PWM was detected, an average of 7757 (minimum: 5 - maximum: 343500) Hz was measured. | |||
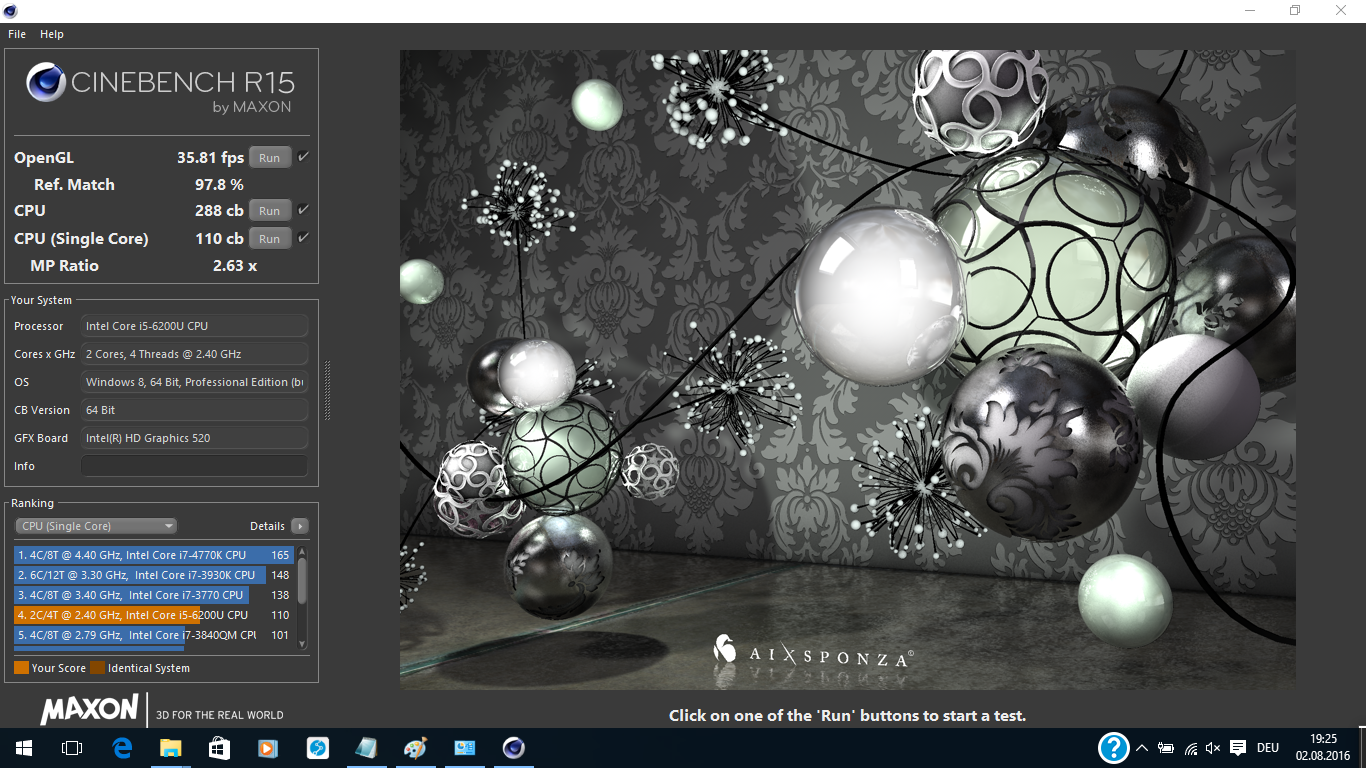
| Cinebench R15 | |
| CPU Single 64Bit | |
| Dell Latitude 15 E5570 | |
| Lenovo ThinkPad L560-20F10026GE | |
| HP ProBook 650 G2-T9X61ET | |
| Toshiba Tecra Z50-C-10P | |
| HP ProBook 650 G1 H5G74E | |
| Acer TravelMate P658-M-537B | |
| CPU Multi 64Bit | |
| Dell Latitude 15 E5570 | |
| Lenovo ThinkPad L560-20F10026GE | |
| HP ProBook 650 G2-T9X61ET | |
| Toshiba Tecra Z50-C-10P | |
| HP ProBook 650 G1 H5G74E | |
| Acer TravelMate P658-M-537B | |
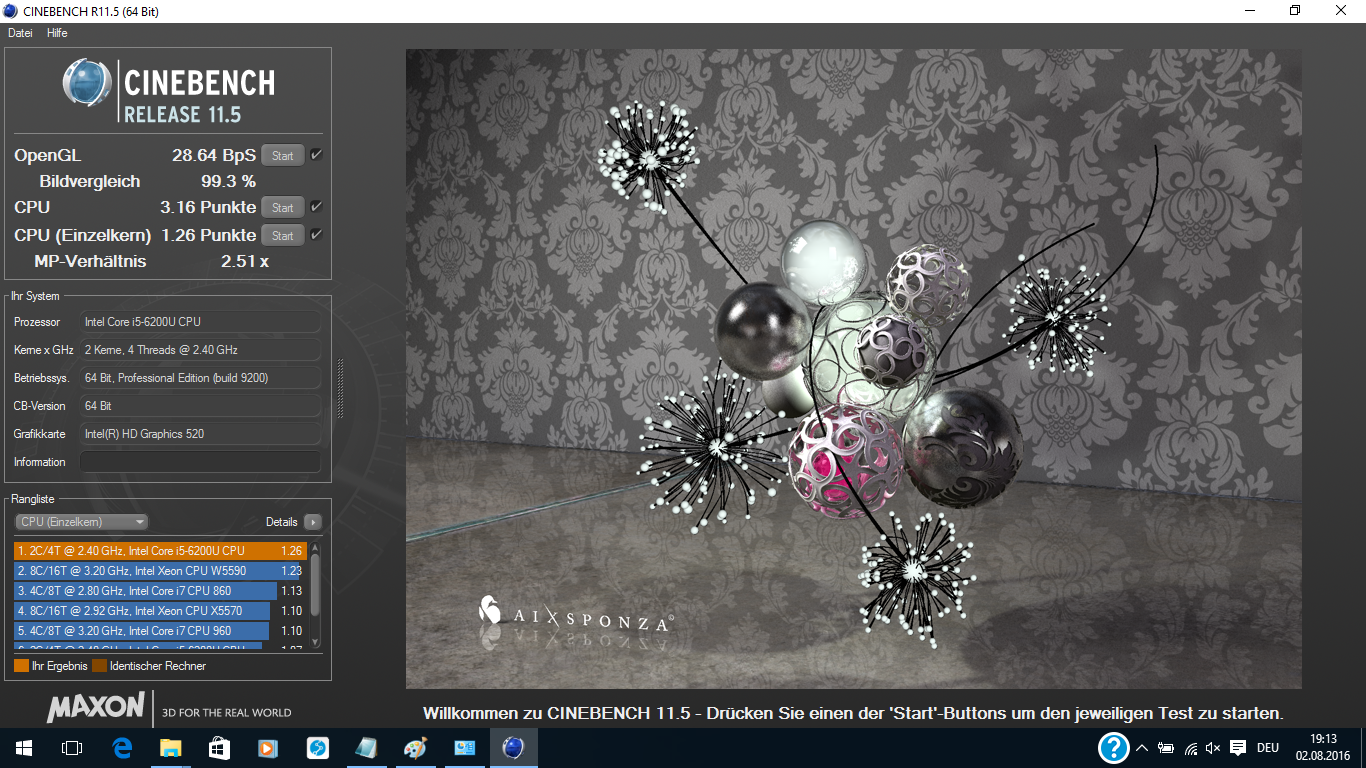
| Cinebench R11.5 | |
| CPU Single 64Bit | |
| Dell Latitude 15 E5570 | |
| Lenovo ThinkPad L560-20F10026GE | |
| HP ProBook 650 G2-T9X61ET | |
| HP ProBook 650 G1 H5G74E | |
| CPU Multi 64Bit | |
| Dell Latitude 15 E5570 | |
| Lenovo ThinkPad L560-20F10026GE | |
| HP ProBook 650 G2-T9X61ET | |
| HP ProBook 650 G1 H5G74E | |
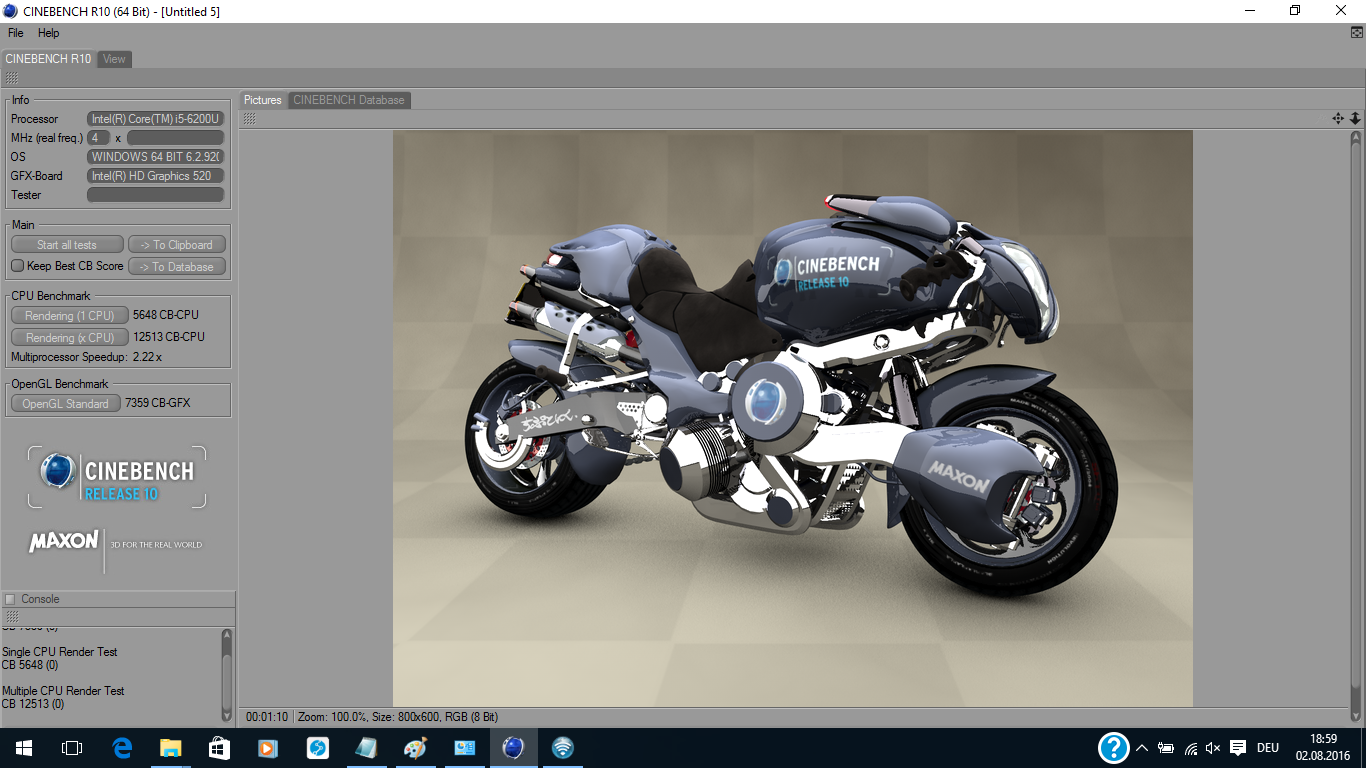
| Cinebench R10 | |
| Rendering Single CPUs 64Bit | |
| HP ProBook 650 G2-T9X61ET | |
| Lenovo ThinkPad L560-20F10026GE | |
| HP ProBook 650 G1 H5G74E | |
| Rendering Multiple CPUs 64Bit | |
| Lenovo ThinkPad L560-20F10026GE | |
| HP ProBook 650 G2-T9X61ET | |
| HP ProBook 650 G1 H5G74E | |
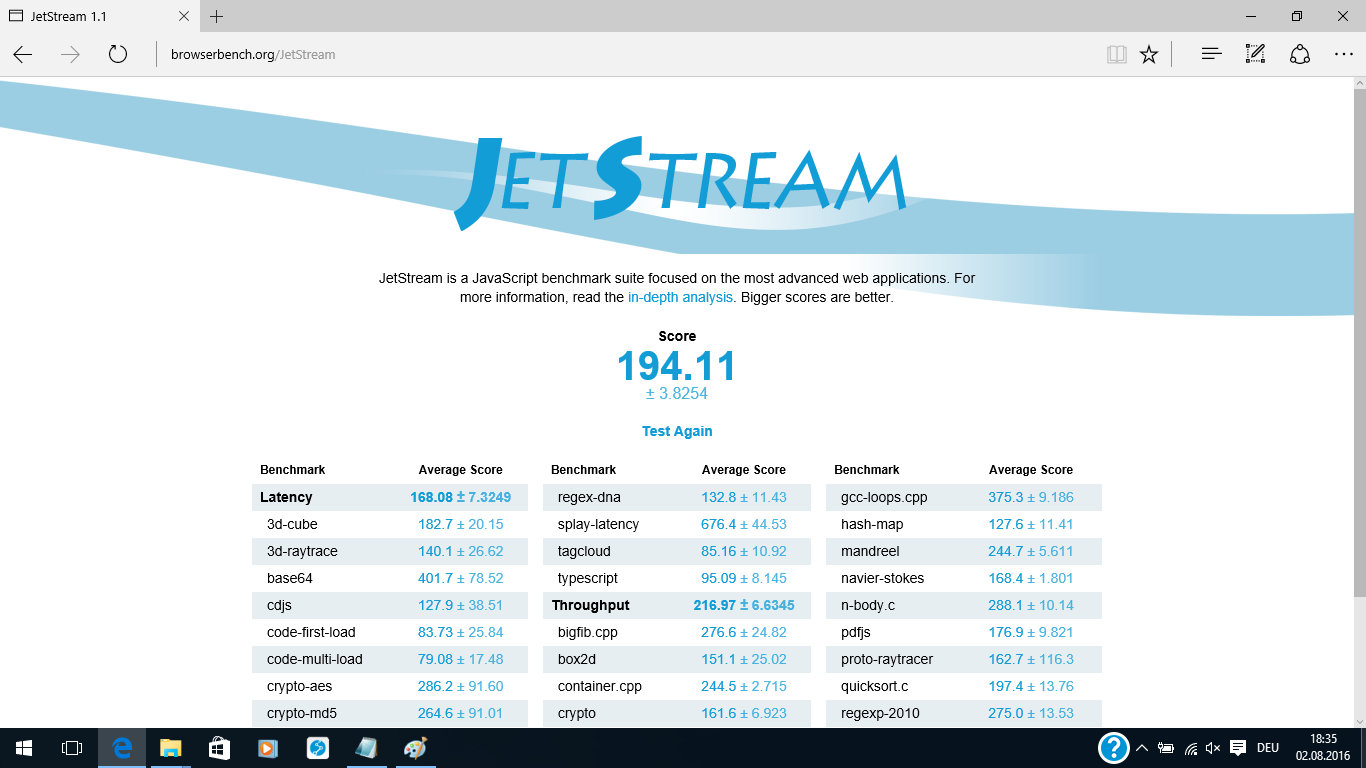
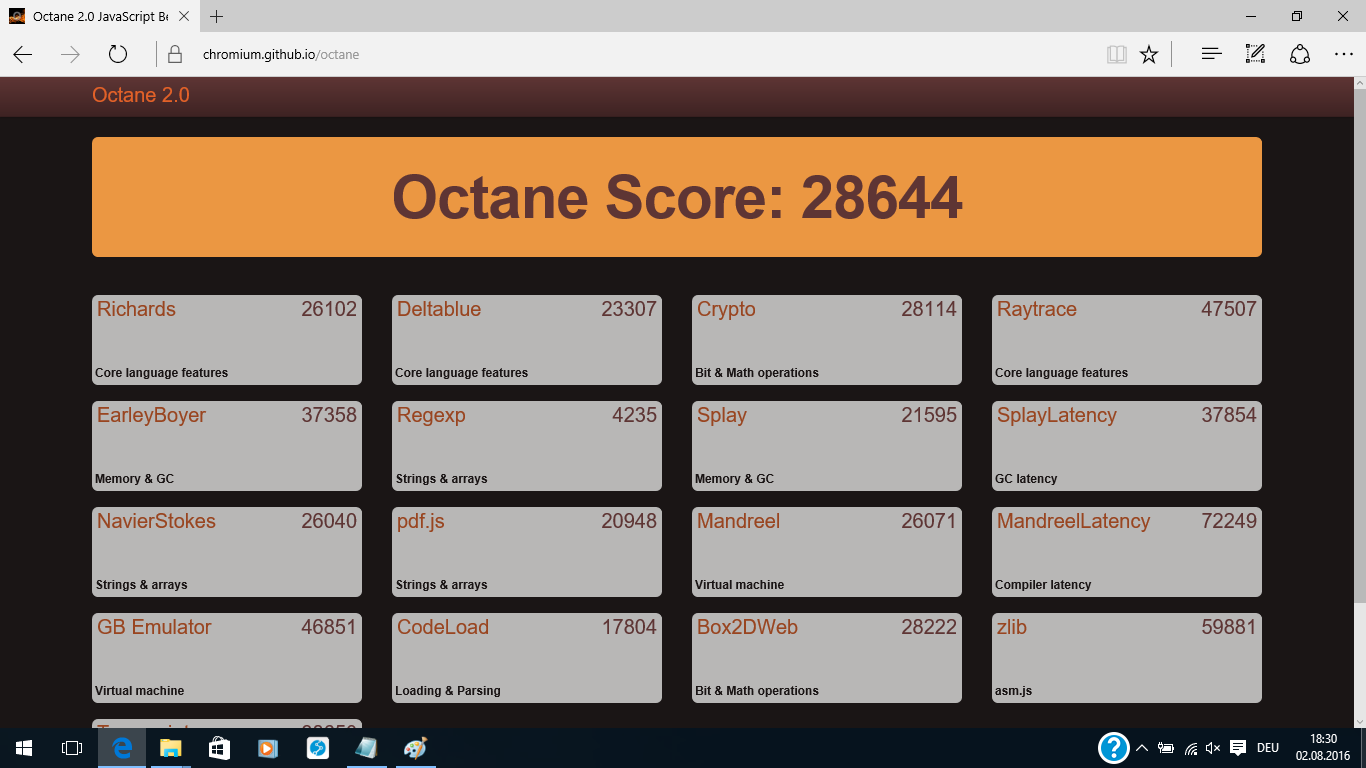
| JetStream 1.1 - 1.1 Total | |
| HP ProBook 650 G2-T9X61ET | |
| Dell Latitude 15 E5570 | |
| Lenovo ThinkPad L560-20F10026GE | |
| Toshiba Tecra Z50-C-10P | |
| Octane V2 - Total Score | |
| HP ProBook 650 G2-T9X61ET | |
| Dell Latitude 15 E5570 | |
| Lenovo ThinkPad L560-20F10026GE | |
| Acer TravelMate P658-M-537B | |
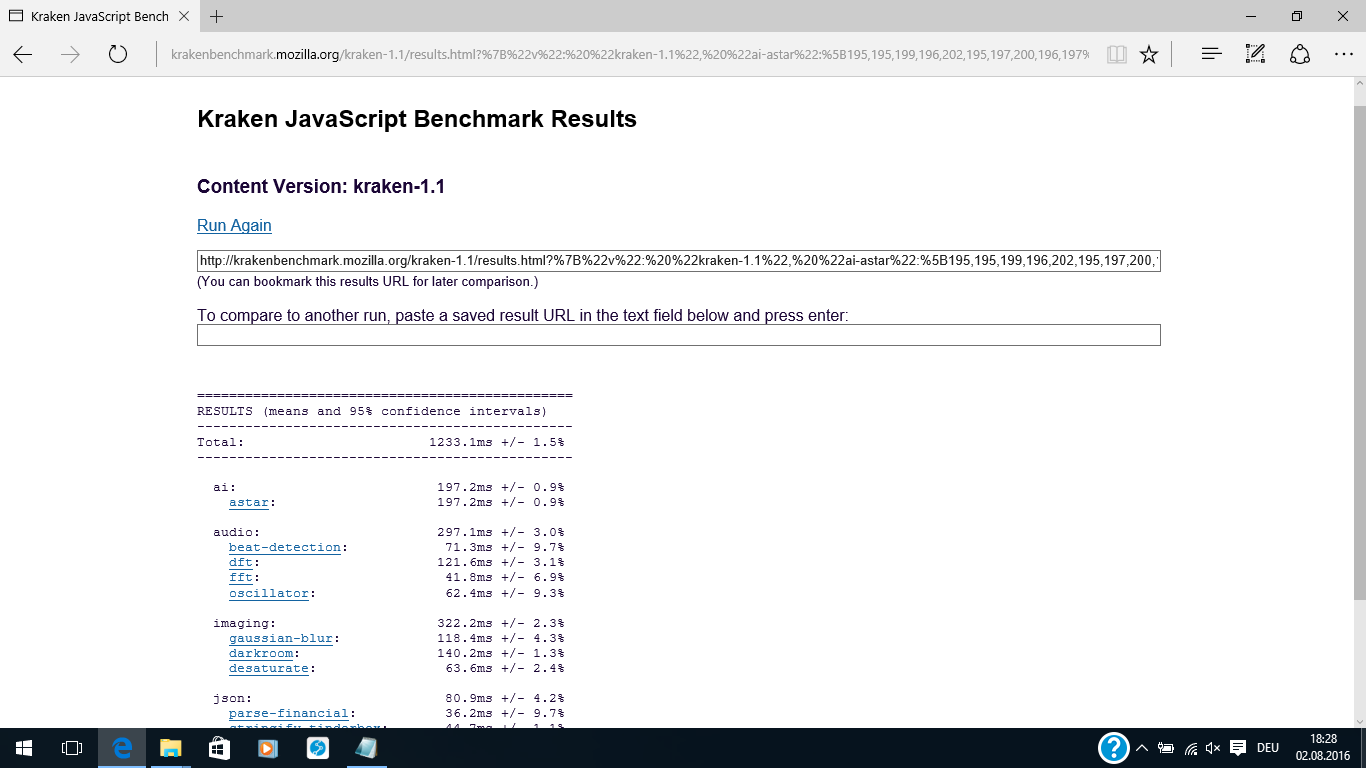
| Mozilla Kraken 1.1 - Total | |
| Acer TravelMate P658-M-537B | |
| Lenovo ThinkPad L560-20F10026GE | |
| Dell Latitude 15 E5570 | |
| HP ProBook 650 G2-T9X61ET | |
* ... smaller is better
| PCMark 8 | |
| Home Score Accelerated v2 | |
| Acer TravelMate P658-M-537B | |
| Dell Latitude 15 E5570 | |
| HP ProBook 650 G2-T9X61ET | |
| Toshiba Tecra Z50-C-10P | |
| Lenovo ThinkPad L560-20F10026GE | |
| Work Score Accelerated v2 | |
| Acer TravelMate P658-M-537B | |
| Dell Latitude 15 E5570 | |
| HP ProBook 650 G2-T9X61ET | |
| Lenovo ThinkPad L560-20F10026GE | |
| Toshiba Tecra Z50-C-10P | |
| Creative Score Accelerated v2 | |
| HP ProBook 650 G2-T9X61ET | |
| Dell Latitude 15 E5570 | |
| Lenovo ThinkPad L560-20F10026GE | |
| PCMark 7 | |
| Score | |
| Dell Latitude 15 E5570 | |
| HP ProBook 650 G2-T9X61ET | |
| HP ProBook 650 G1 H5G74E | |
| Lenovo ThinkPad L560-20F10026GE | |
| Productivity | |
| Dell Latitude 15 E5570 | |
| HP ProBook 650 G2-T9X61ET | |
| HP ProBook 650 G1 H5G74E | |
| Lenovo ThinkPad L560-20F10026GE | |
| PCMark Vantage Result | 8328 points | |
| PCMark 7 Score | 2988 points | |
| PCMark 8 Home Score Accelerated v2 | 3229 points | |
| PCMark 8 Creative Score Accelerated v2 | 3649 points | |
| PCMark 8 Work Score Accelerated v2 | 4191 points | |
Help | ||
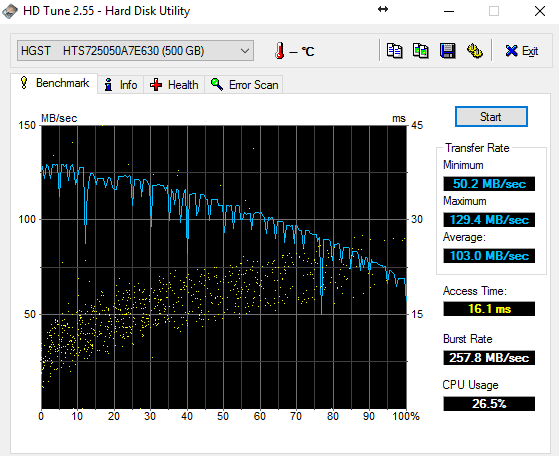
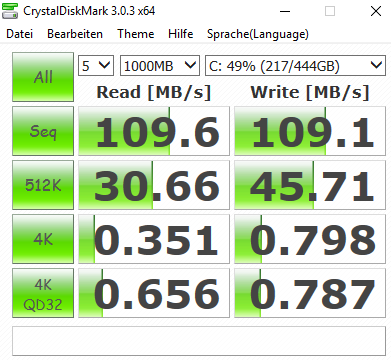
| HP ProBook 650 G2-T9X61ET Hitachi Travelstar Z7K500 HTS725050A7E630 | Lenovo ThinkPad L560-20F10026GE WDC Slim WD10SPCX-21KHST0 | Dell Latitude 15 E5570 Samsung SSD PM871 MZ7LN128HCHP | Toshiba Tecra Z50-C-10P Toshiba HG6 THNSNJ256G8NU | Acer TravelMate P658-M-537B Kingston RBU-SNS8152S3256GG2 | |
|---|---|---|---|---|---|
| CrystalDiskMark 3.0 | 33% | 11784% | 3372% | 9846% | |
| Read Seq (MB/s) | 109.6 | 113.6 4% | 474.7 333% | 512 367% | 479.1 337% |
| Write Seq (MB/s) | 109.1 | 111.7 2% | 155 42% | 415.8 281% | 333.1 205% |
| Read 512 (MB/s) | 30.66 | 39.65 29% | 393.6 1184% | 404.4 1219% | 418 1263% |
| Write 512 (MB/s) | 45.71 | 55.3 21% | 119.7 162% | 382.2 736% | 320.5 601% |
| Read 4k (MB/s) | 0.351 | 0.488 39% | 34 9587% | 24.05 6752% | 25.66 7211% |
| Write 4k (MB/s) | 0.798 | 1.022 28% | 96.6 12005% | 87.6 10877% | 64.7 8008% |
| Read 4k QD32 (MB/s) | 0.656 | 1.367 108% | 383.3 58330% | 226.2 34382% | |
| Write 4k QD32 (MB/s) | 0.787 | 1.036 32% | 100.2 12632% | 211.4 26761% |

| 3DMark | |
| 1280x720 Cloud Gate Standard Graphics | |
| Acer TravelMate P658-M-537B | |
| Dell Latitude 15 E5570 | |
| HP ProBook 650 G2-T9X61ET | |
| Lenovo ThinkPad L560-20F10026GE | |
| Toshiba Tecra Z50-C-10P | |
| HP ProBook 650 G1 H5G74E | |
| 1920x1080 Fire Strike Graphics | |
| Dell Latitude 15 E5570 | |
| HP ProBook 650 G2-T9X61ET | |
| Lenovo ThinkPad L560-20F10026GE | |
| Toshiba Tecra Z50-C-10P | |
| HP ProBook 650 G1 H5G74E | |
| 1280x720 Ice Storm Standard Score | |
| Acer TravelMate P658-M-537B | |
| Dell Latitude 15 E5570 | |
| HP ProBook 650 G2-T9X61ET | |
| Lenovo ThinkPad L560-20F10026GE | |
| HP ProBook 650 G1 H5G74E | |
| Toshiba Tecra Z50-C-10P | |
| 3DMark 11 | |
| 1280x720 Performance GPU | |
| Acer TravelMate P658-M-537B | |
| HP ProBook 650 G2-T9X61ET | |
| Dell Latitude 15 E5570 | |
| Lenovo ThinkPad L560-20F10026GE | |
| Toshiba Tecra Z50-C-10P | |
| HP ProBook 650 G1 H5G74E | |
| 1280x720 Performance | |
| Acer TravelMate P658-M-537B | |
| Dell Latitude 15 E5570 | |
| HP ProBook 650 G2-T9X61ET | |
| Lenovo ThinkPad L560-20F10026GE | |
| Toshiba Tecra Z50-C-10P | |
| HP ProBook 650 G1 H5G74E | |
| 3DMark 06 - 1280x1024 Standard Score AA:0x AF:0x | |
| HP ProBook 650 G2-T9X61ET | |
| HP ProBook 650 G1 H5G74E | |
| 3DMark 2001SE Standard | 20229 points | |
| 3DMark 03 Standard | 15594 points | |
| 3DMark 05 Standard | 11700 points | |
| 3DMark 06 Standard Score | 8423 points | |
| 3DMark 11 Performance | 1414 points | |
| 3DMark Ice Storm Standard Score | 47002 points | |
| 3DMark Cloud Gate Standard Score | 5045 points | |
| 3DMark Fire Strike Score | 677 points | |
| 3DMark Fire Strike Extreme Score | 317 points | |
Help | ||
| low | med. | high | ultra | |
|---|---|---|---|---|
| BioShock Infinite (2013) | 36.4 | 22.3 | 18.5 | |
| Battlefield 4 (2013) | 35.1 | 27.6 | 16.7 | |
| Rise of the Tomb Raider (2016) | 13.5 | 10.1 |
Noise level
| Idle |
| 30.9 / 30.9 / 31.3 dB(A) |
| HDD |
| 30.9 dB(A) |
| Load |
| 33.8 / 36.7 dB(A) |
 | ||
30 dB silent 40 dB(A) audible 50 dB(A) loud |
||
min: | ||
| HP ProBook 650 G2-T9X61ET 6200U, HD Graphics 520, Hitachi Travelstar Z7K500 HTS725050A7E630 | Lenovo ThinkPad L560-20F10026GE 6200U, HD Graphics 520, WDC Slim WD10SPCX-21KHST0 | Dell Latitude 15 E5570 6300U, HD Graphics 520, Samsung SSD PM871 MZ7LN128HCHP | Toshiba Tecra Z50-C-10P 6200U, HD Graphics 520, Toshiba HG6 THNSNJ256G8NU | Acer TravelMate P658-M-537B 6200U, HD Graphics 520, Kingston RBU-SNS8152S3256GG2 | HP ProBook 650 G1 H5G74E 4000M, HD Graphics 4600, Hitachi Travelstar Z7K500 HTS725050A7E630 | |
|---|---|---|---|---|---|---|
| Noise | 3% | -5% | -2% | -9% | -2% | |
| off / environment * (dB) | 29 | 29.4 -1% | 31.2 -8% | 31.2 -8% | 31.2 -8% | |
| Idle Minimum * (dB) | 30.9 | 30.1 3% | 31.2 -1% | 32.4 -5% | 32.5 -5% | 31.6 -2% |
| Idle Average * (dB) | 30.9 | 30.1 3% | 33.2 -7% | 32.4 -5% | 32.5 -5% | 31.6 -2% |
| Idle Maximum * (dB) | 31.3 | 30.1 4% | 34.3 -10% | 32.4 -4% | 35 -12% | 31.6 -1% |
| Load Average * (dB) | 33.8 | 33.4 1% | 36.6 -8% | 33.5 1% | 42 -24% | 35.6 -5% |
| Load Maximum * (dB) | 36.7 | 34.7 5% | 34.7 5% | 33.5 9% | 37.5 -2% | 36.7 -0% |
* ... smaller is better
(+) The maximum temperature on the upper side is 37.4 °C / 99 F, compared to the average of 34.3 °C / 94 F, ranging from 21.2 to 62.5 °C for the class Office.
(+) The bottom heats up to a maximum of 38.3 °C / 101 F, compared to the average of 36.8 °C / 98 F
(+) In idle usage, the average temperature for the upper side is 28.3 °C / 83 F, compared to the device average of 29.5 °C / 85 F.
(+) The palmrests and touchpad are cooler than skin temperature with a maximum of 29 °C / 84.2 F and are therefore cool to the touch.
(±) The average temperature of the palmrest area of similar devices was 27.5 °C / 81.5 F (-1.5 °C / -2.7 F).
| HP ProBook 650 G2-T9X61ET | Lenovo ThinkPad L560-20F10026GE | Dell Latitude 15 E5570 | Toshiba Tecra Z50-C-10P | Acer TravelMate P658-M-537B | HP ProBook 650 G1 H5G74E | |
|---|---|---|---|---|---|---|
| Heat | ||||||
| Maximum Upper Side * (°C) | 37.4 | 37.2 1% | 37.3 -0% | 36 4% | 35.2 6% | 32.7 13% |
| Maximum Bottom * (°C) | 38.3 | 36 6% | 41.5 -8% | 50 -31% | 38 1% | 46.1 -20% |
| Idle Upper Side * (°C) | 30.1 | 30.7 -2% | 34.2 -14% | 23.9 21% | 29.5 2% | 27.7 8% |
| Idle Bottom * (°C) | 31.1 | 32.8 -5% | 38.8 -25% | 23.8 23% | 29 7% | 30.5 2% |
* ... smaller is better
| Off / Standby | |
| Idle | |
| Load |
|
Key:
min: | |
| HP ProBook 650 G2-T9X61ET 6200U, HD Graphics 520, Hitachi Travelstar Z7K500 HTS725050A7E630, TN LED, 1366x768, 15.6" | Lenovo ThinkPad L560-20F10026GE 6200U, HD Graphics 520, WDC Slim WD10SPCX-21KHST0, AH-IPS, 1920x1080, 15.6" | Dell Latitude 15 E5570 6300U, HD Graphics 520, Samsung SSD PM871 MZ7LN128HCHP, TN LED, 1366x768, 15.6" | Toshiba Tecra Z50-C-10P 6200U, HD Graphics 520, Toshiba HG6 THNSNJ256G8NU, IPS-Panel, 1920x1080, 15.6" | Acer TravelMate P658-M-537B 6200U, HD Graphics 520, Kingston RBU-SNS8152S3256GG2, IPS, 1920x1080, 15.6" | HP ProBook 650 G1 H5G74E 4000M, HD Graphics 4600, Hitachi Travelstar Z7K500 HTS725050A7E630, TN LED, 1366x768, 15.6" | |
|---|---|---|---|---|---|---|
| Power Consumption | -8% | -3% | -11% | -40% | -21% | |
| Idle Minimum * (Watt) | 4.6 | 5 -9% | 4.5 2% | 4.7 -2% | 6.6 -43% | 4.6 -0% |
| Idle Average * (Watt) | 6.8 | 7.9 -16% | 7.6 -12% | 8 -18% | 10.4 -53% | 8.2 -21% |
| Idle Maximum * (Watt) | 7.5 | 8.6 -15% | 8.7 -16% | 9.8 -31% | 12.7 -69% | 9.4 -25% |
| Load Average * (Watt) | 26.3 | 27.5 -5% | 28.5 -8% | 29.7 -13% | 36 -37% | 37.1 -41% |
| Load Maximum * (Watt) | 35.1 | 33.7 4% | 29.2 17% | 32.6 7% | 35 -0% | 41.5 -18% |
* ... smaller is better
| HP ProBook 650 G2-T9X61ET 6200U, HD Graphics 520, 48 Wh | Lenovo ThinkPad L560-20F10026GE 6200U, HD Graphics 520, 48 Wh | Dell Latitude 15 E5570 6300U, HD Graphics 520, 62 Wh | Toshiba Tecra Z50-C-10P 6200U, HD Graphics 520, 44 Wh | Acer TravelMate P658-M-537B 6200U, HD Graphics 520, 55 Wh | HP ProBook 650 G1 H5G74E 4000M, HD Graphics 4600, 55 Wh | |
|---|---|---|---|---|---|---|
| Battery runtime | -15% | 43% | -13% | 8% | -35% | |
| Reader / Idle (h) | 11.5 | 11.6 1% | 20.5 78% | 14 22% | 7.7 -33% | |
| H.264 (h) | 6.4 | 4.6 -28% | 9.5 48% | |||
| WiFi v1.3 (h) | 6.8 | 6.8 0% | 10.5 54% | 5.9 -13% | 8.5 25% | |
| Load (h) | 2.7 | 1.8 -33% | 2.5 -7% | 2.1 -22% | 1.7 -37% | |
| WiFi (h) | 5.3 |
Pros
Cons
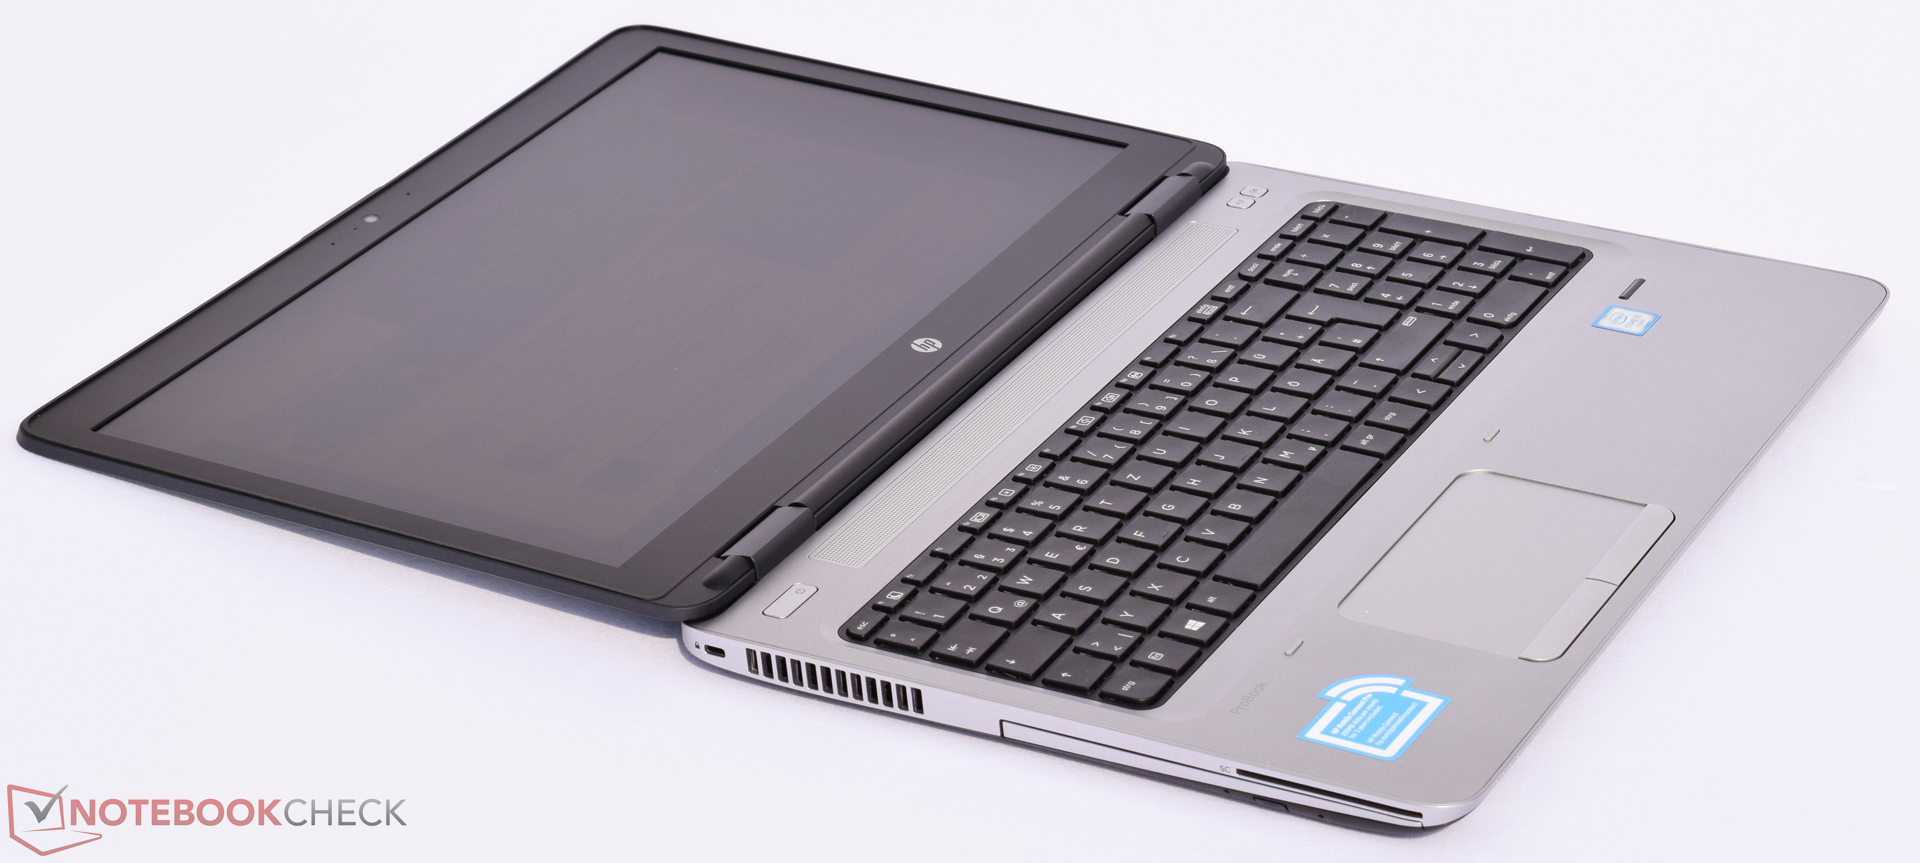
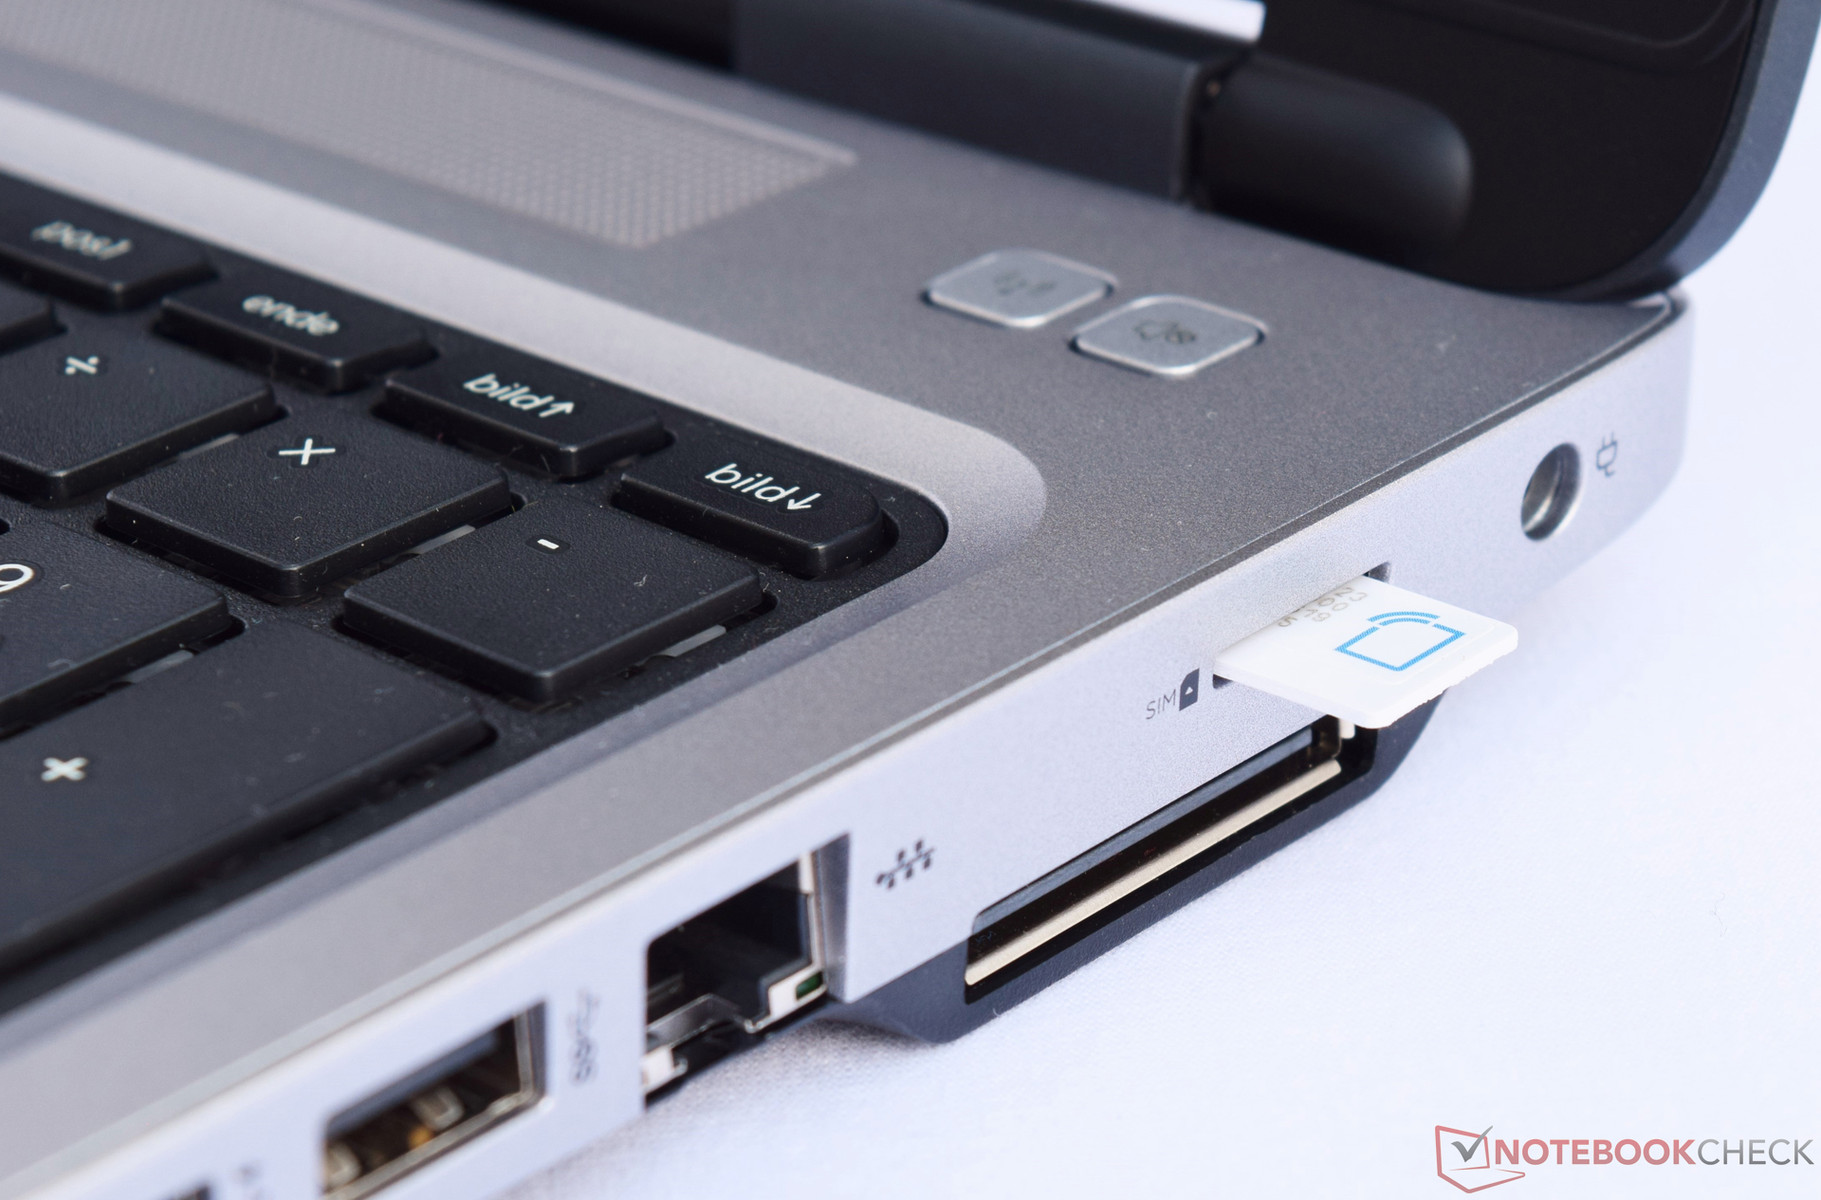
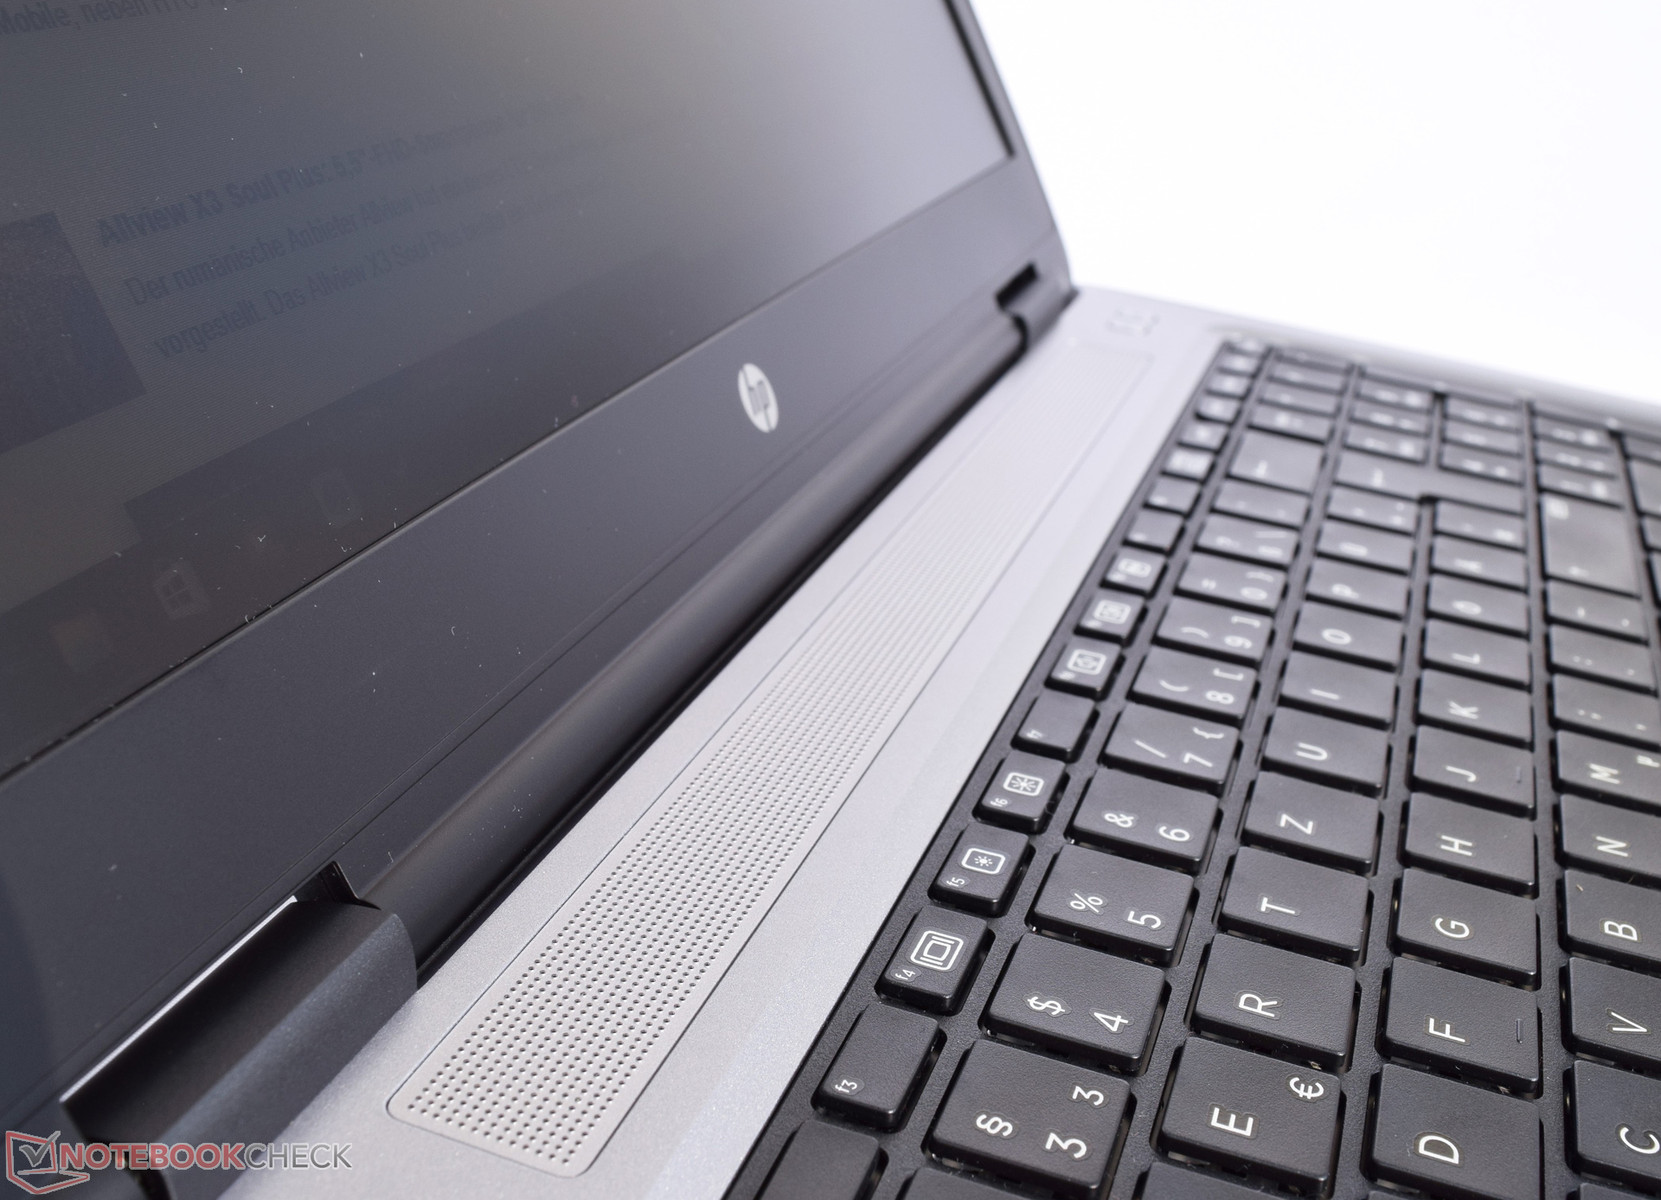
在近两年之后,惠普为我们带来了ProBook 650 G1的后续机型——ProBook 650 G2。我们所测试的这台坚固的15寸商务笔记本电脑售价1150欧元(约8601人民币)。它是一台可以帮助用户轻松应对日常办公需求的高效设备。惠普为它搭配了常见的安全功能,以及LTE模组。从Haswell架构处理器到最新Skylake架构处理器的飞跃明显向我们展示了最近几年科技的进步。它的功耗更低,因此续航表现也更加优秀。
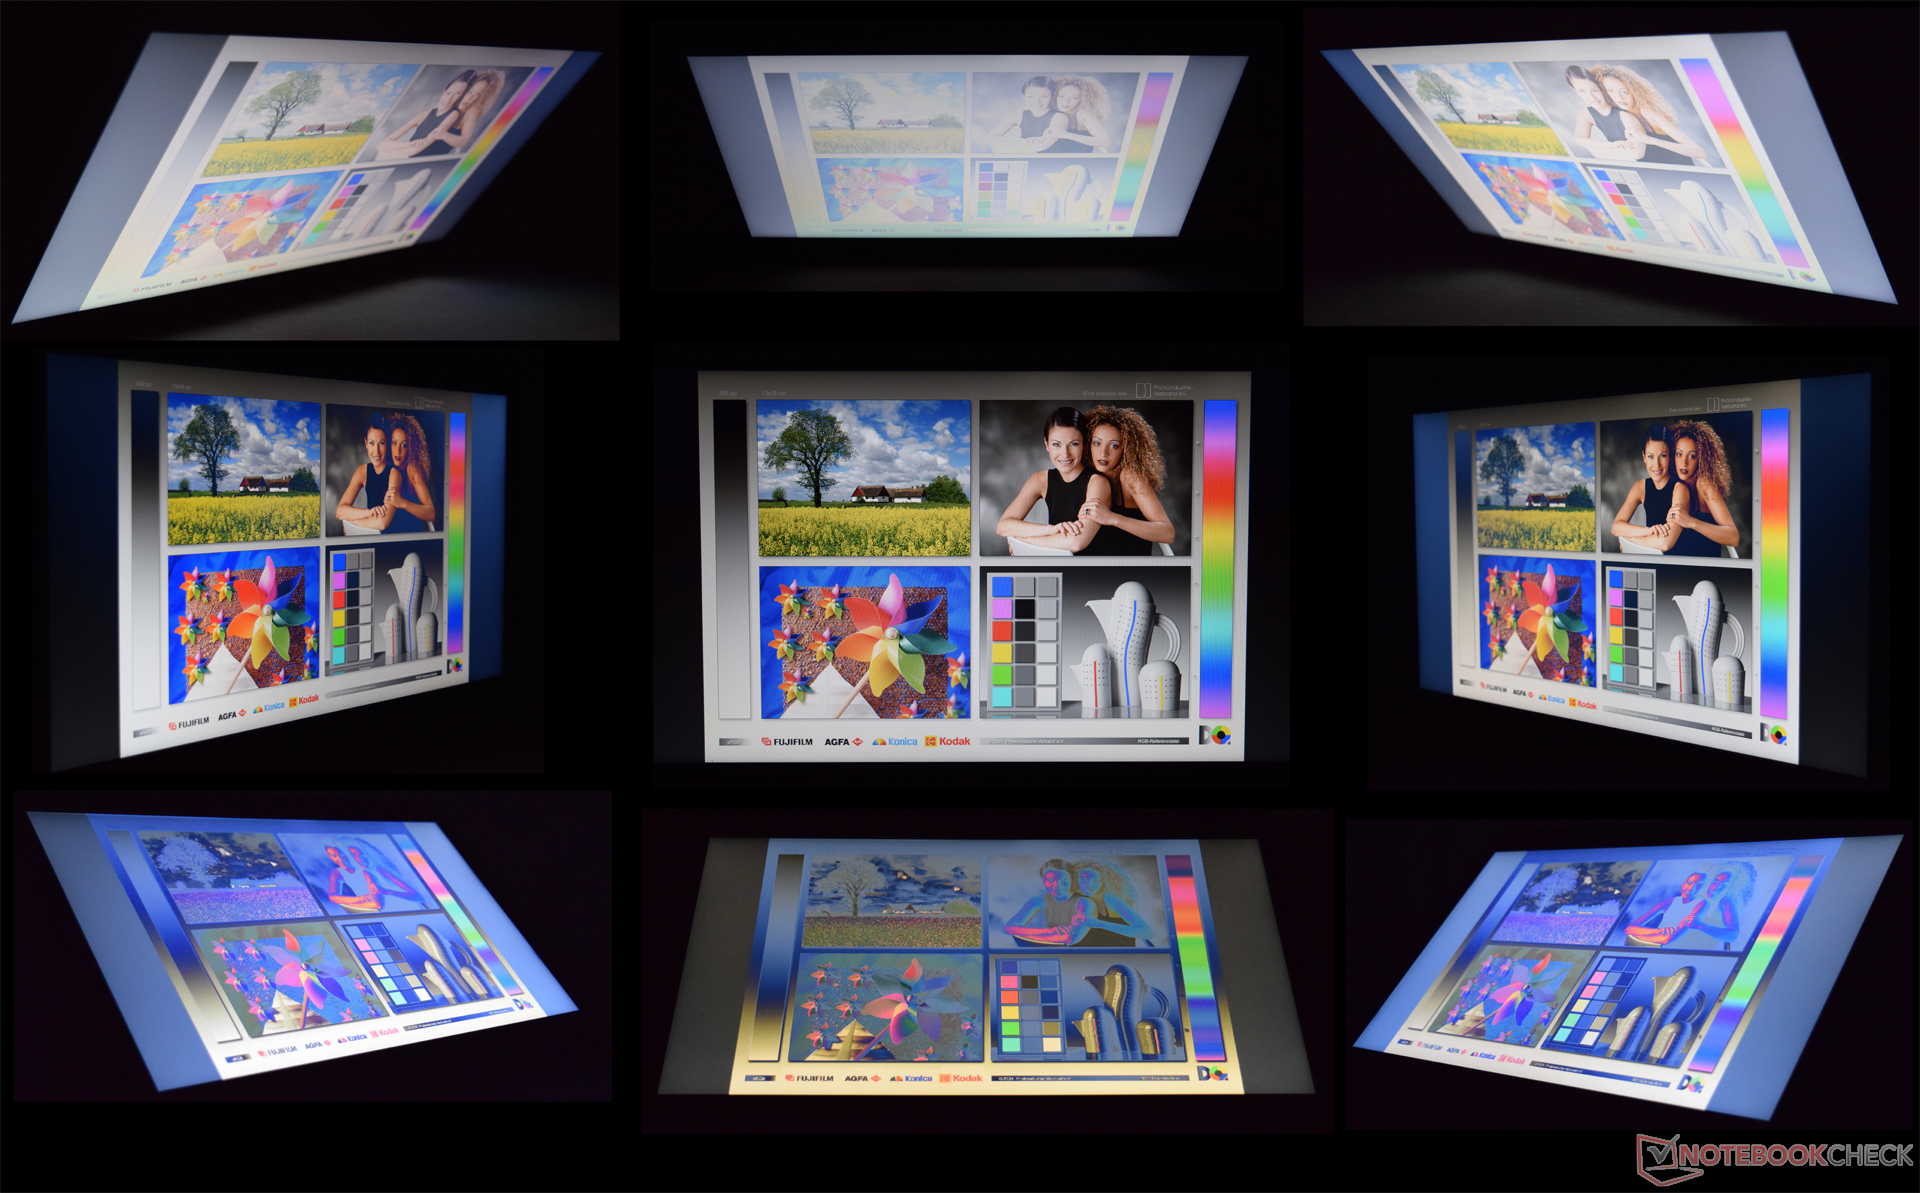
惠普的ProBook 650 G2以坚实的系统性能征服了我们。不过它的良好印象则被完全不应出现在这个价位设备上的低品质屏幕破坏了。
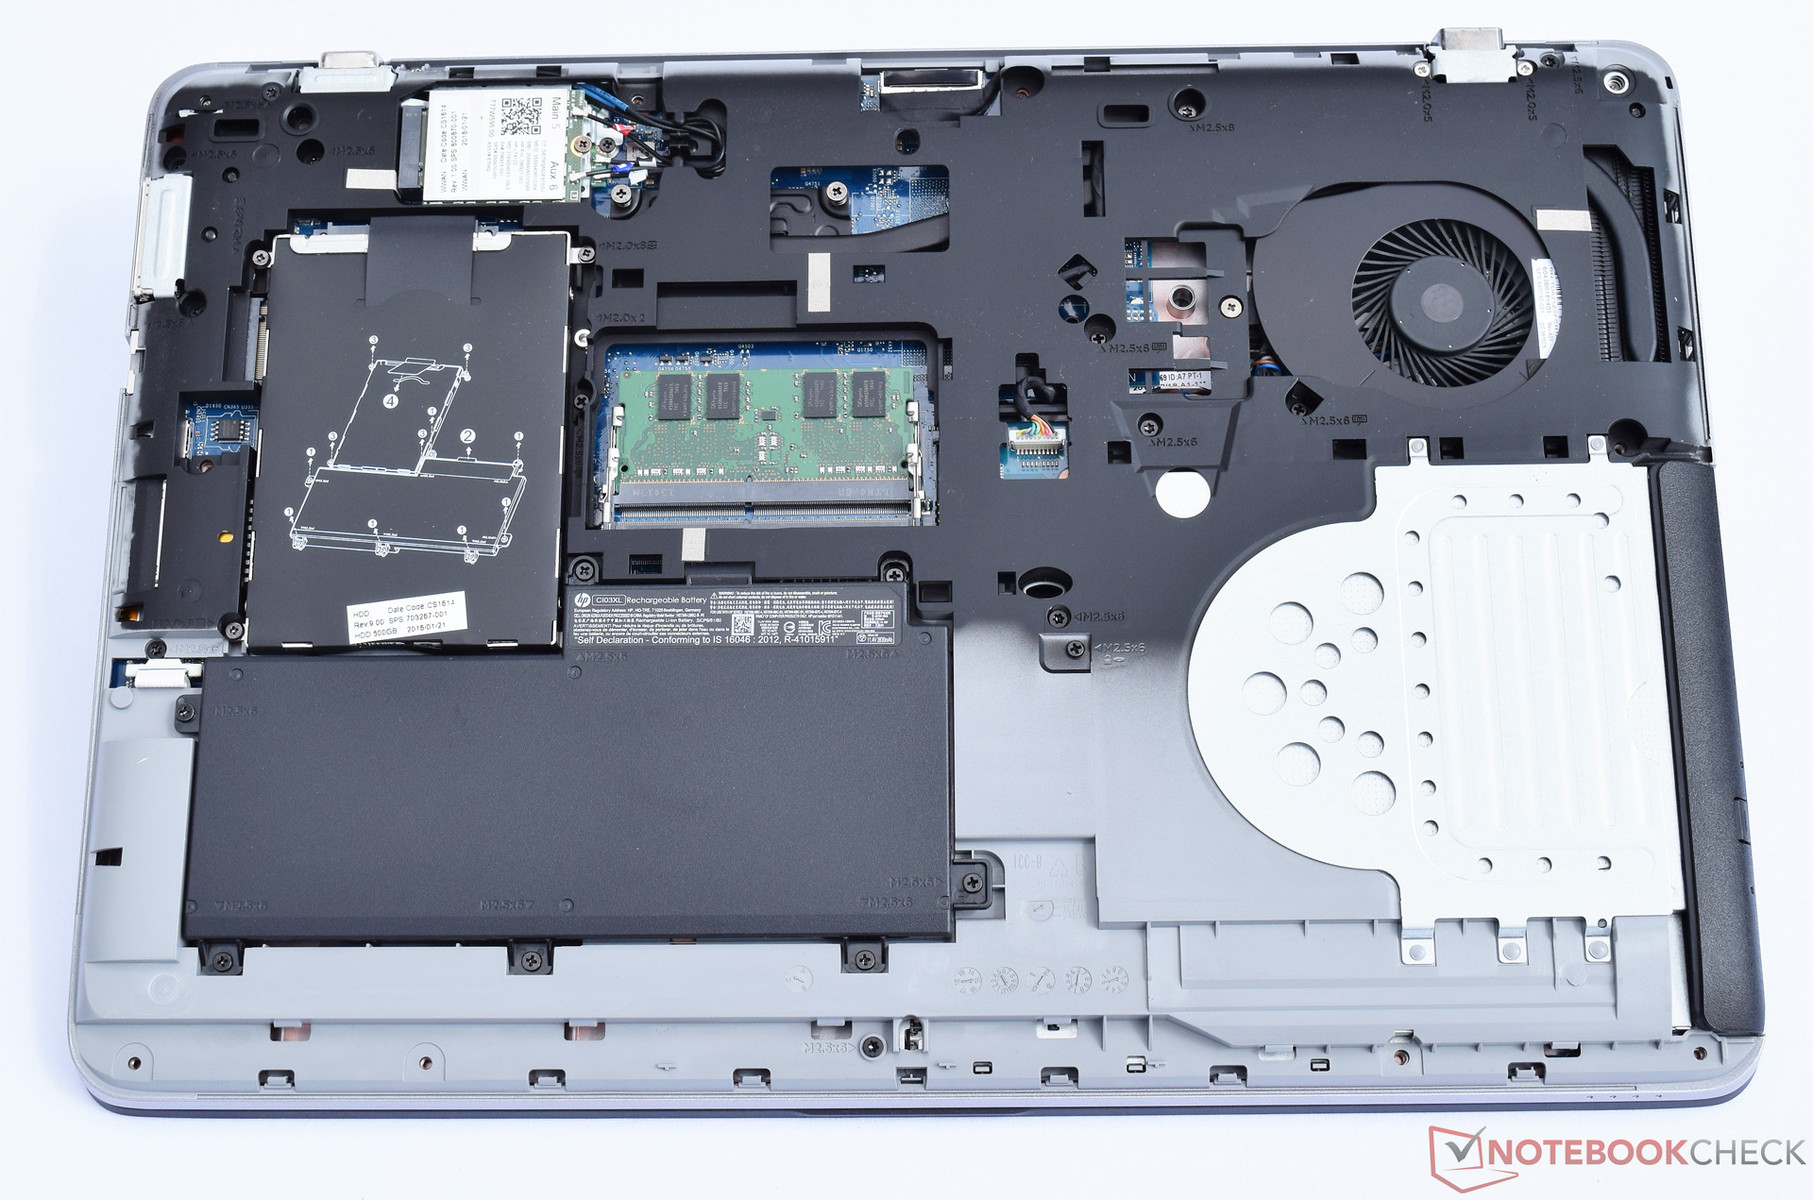
ProBook 650 G2是个不错的日常办公设备。我们建议用户在购买前考虑升级全高清屏幕。扩展内存以及更换固态硬盘也能够帮助它更好地发挥性能潜力。
注:本文是基于完整评测的缩减版本,阅读完整的英文评测,请点击这里。
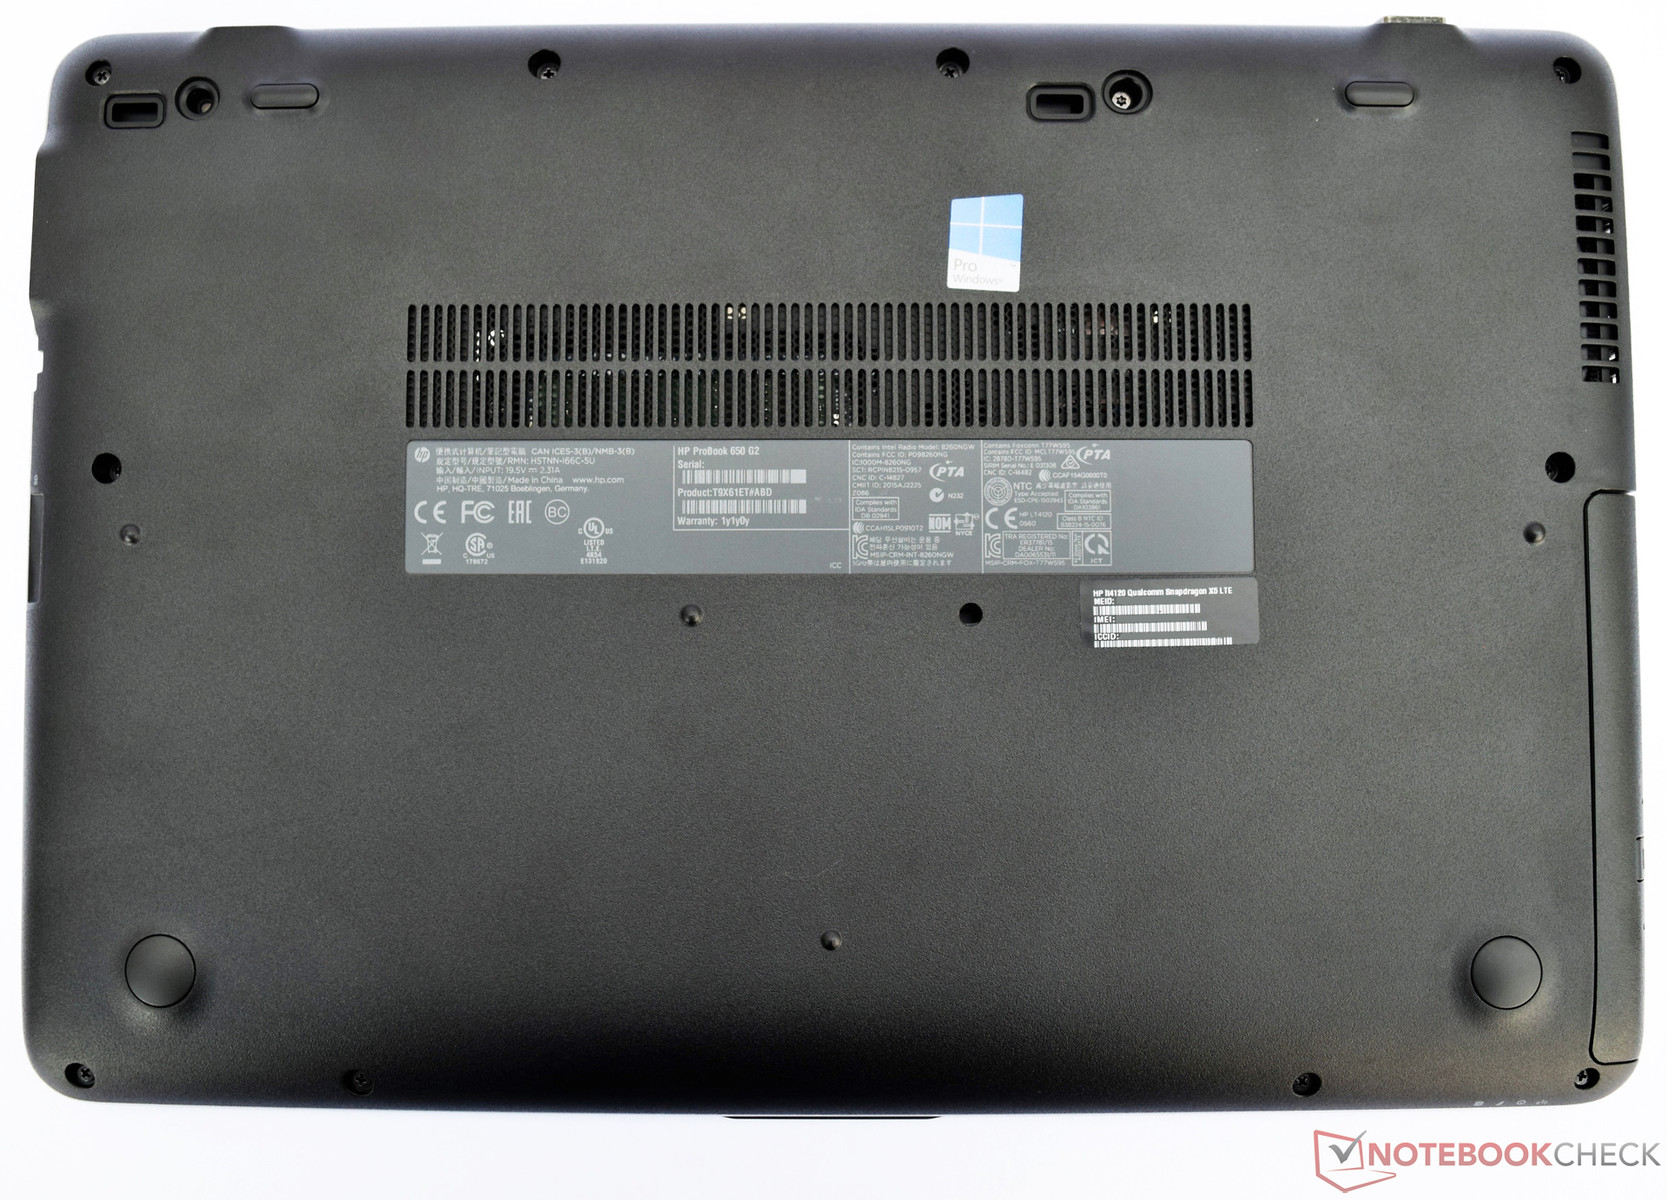
HP ProBook 650 G2-T9X61ET
- 08/11/2016 v5.1 (old)
Sebastian Bade