联想 Phab 2 Pro 智能手机简短评测
| Networking | |
| iperf3 receive AX12 | |
| Google Pixel XL 2016 | |
| Lenovo Phab 2 Pro | |
| Huawei Mate 9 | |
| Asus Zenfone 3 ZE552KL | |
| iperf3 transmit AX12 | |
| Google Pixel XL 2016 | |
| Lenovo Phab 2 Pro | |
| Huawei Mate 9 | |
| Asus Zenfone 3 ZE552KL | |
| SD Card Reader | |
| maximum SDCardreader Maximum Transfer Rate | |
| average SDCardreader Average Transfer Rate |
| |||||||||||||||||||||||||
Brightness Distribution: 93 %
Center on Battery: 472.4 cd/m²
Contrast: 980:1 (Black: 0.482 cd/m²)
ΔE ColorChecker Calman: 7 | ∀{0.5-29.43 Ø4.71}
ΔE Greyscale Calman: 7.9 | ∀{0.09-98 Ø4.96}
83.1% sRGB (Calman 2D)
Gamma: 2.34
CCT: 7826 K
| Lenovo Phab 2 Pro IPS, 6.4", 2560x1440 | Apple iPhone 7 Plus Retina HD, IPS, 5.5", 1920x1080 | Huawei Mate 9 IPS, 5.9", 1920x1080 | Asus Zenfone 3 ZE552KL IPS, 5.5", 1920x1080 | Google Pixel XL 2016 AMOLED, 5.5", 2560x1440 | |
|---|---|---|---|---|---|
| Display | |||||
| Display P3 Coverage (%) | 67.2 | ||||
| sRGB Coverage (%) | 99.8 | ||||
| AdobeRGB 1998 Coverage (%) | 69 | ||||
| Response Times | 44% | 13% | 6% | 92% | |
| Response Time Grey 50% / Grey 80% * (ms) | 58.4 ? | 29 ? 50% | 57 ? 2% | 56 ? 4% | 4 ? 93% |
| Response Time Black / White * (ms) | 38.8 ? | 24 ? 38% | 30 ? 23% | 36 ? 7% | 4 ? 90% |
| PWM Frequency (Hz) | 59.5 ? | 238.1 | |||
| Screen | 45% | 33% | 14% | 12% | |
| Brightness middle (cd/m²) | 472.4 | 557 18% | 696 47% | 658 39% | 402 -15% |
| Brightness (cd/m²) | 478 | 553 16% | 680 42% | 633 32% | 408 -15% |
| Brightness Distribution (%) | 93 | 97 4% | 93 0% | 93 0% | 85 -9% |
| Black Level * (cd/m²) | 0.482 | 0.35 27% | 0.42 13% | 0.66 -37% | |
| Contrast (:1) | 980 | 1591 62% | 1657 69% | 997 2% | |
| Colorchecker dE 2000 * | 7 | 1.4 80% | 4.3 39% | 4.9 30% | 4 43% |
| Colorchecker dE 2000 max. * | 11 | 3.1 72% | 9.4 15% | 9.1 17% | 10.1 8% |
| Greyscale dE 2000 * | 7.9 | 1.3 84% | 4.8 39% | 5.8 27% | 3.2 59% |
| Gamma | 2.34 94% | 2.21 100% | 2.33 94% | 2.26 97% | 2.19 100% |
| CCT | 7826 83% | 6667 97% | 7255 90% | 7840 83% | 7037 92% |
| Color Space (Percent of AdobeRGB 1998) (%) | 63.1 | ||||
| Color Space (Percent of sRGB) (%) | 99.83 | ||||
| Total Average (Program / Settings) | 45% /
45% | 23% /
29% | 10% /
12% | 52% /
32% |
* ... smaller is better
Display Response Times
| ↔ Response Time Black to White | ||
|---|---|---|
| 38.8 ms ... rise ↗ and fall ↘ combined | ↗ 7.2 ms rise | 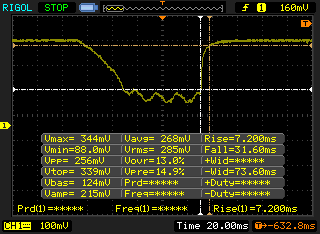 |
| ↘ 31.6 ms fall | ||
| The screen shows slow response rates in our tests and will be unsatisfactory for gamers. In comparison, all tested devices range from 0.1 (minimum) to 240 (maximum) ms. » 96 % of all devices are better. This means that the measured response time is worse than the average of all tested devices (19.8 ms). | ||
| ↔ Response Time 50% Grey to 80% Grey | ||
| 58.4 ms ... rise ↗ and fall ↘ combined | ↗ 23.2 ms rise | 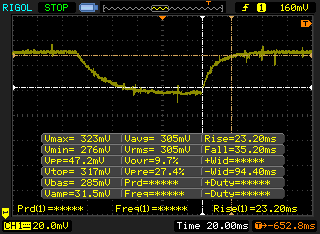 |
| ↘ 35.2 ms fall | ||
| The screen shows slow response rates in our tests and will be unsatisfactory for gamers. In comparison, all tested devices range from 0.165 (minimum) to 636 (maximum) ms. » 95 % of all devices are better. This means that the measured response time is worse than the average of all tested devices (31 ms). | ||
Screen Flickering / PWM (Pulse-Width Modulation)
| Screen flickering / PWM detected | 59.5 Hz | ≤ 30 % brightness setting | 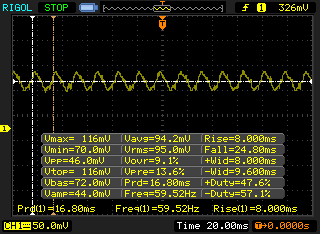 |
The display backlight flickers at 59.5 Hz (worst case, e.g., utilizing PWM) Flickering detected at a brightness setting of 30 % and below. There should be no flickering or PWM above this brightness setting. The frequency of 59.5 Hz is very low, so the flickering may cause eyestrain and headaches after extended use. In comparison: 52 % of all tested devices do not use PWM to dim the display. If PWM was detected, an average of 7751 (minimum: 5 - maximum: 343500) Hz was measured. | |||
| AnTuTu v6 - Total Score | |
| Google Pixel XL 2016 | |
| Samsung Galaxy S7 | |
| Huawei Mate 9 | |
| Lenovo Phab 2 Pro | |
| Sony Xperia XA | |
| Fairphone 2 | |
| Geekbench 4.0 | |
| Compute RenderScript Score | |
| Google Pixel XL 2016 | |
| Lenovo Phab 2 Pro | |
| Huawei Mate 9 | |
| Fairphone 2 | |
| 64 Bit Multi-Core Score | |
| Huawei Mate 9 | |
| Google Pixel XL 2016 | |
| Lenovo Phab 2 Pro | |
| Fairphone 2 | |
| 64 Bit Single-Core Score | |
| Huawei Mate 9 | |
| Google Pixel XL 2016 | |
| Lenovo Phab 2 Pro | |
| Fairphone 2 | |
| Octane V2 - Total Score | |
| Samsung Galaxy S7 | |
| Huawei Mate 9 | |
| Lenovo Phab 2 Pro | |
| Google Pixel XL 2016 | |
| Fairphone 2 | |
| Sony Xperia XA | |
| Mozilla Kraken 1.1 - Total | |
| Sony Xperia XA | |
| Fairphone 2 | |
| Lenovo Phab 2 Pro | |
| Huawei Mate 9 | |
| Google Pixel XL 2016 | |
| Samsung Galaxy S7 | |
| WebXPRT 2015 - Overall | |
| Samsung Galaxy S7 | |
| Huawei Mate 9 | |
| Google Pixel XL 2016 | |
| Lenovo Phab 2 Pro | |
| Sony Xperia XA | |
| Fairphone 2 | |
| JetStream 1.1 - 1.1 Total | |
| Samsung Galaxy S7 | |
| Huawei Mate 9 | |
| Google Pixel XL 2016 | |
| Lenovo Phab 2 Pro | |
| Sony Xperia XA | |
| Fairphone 2 | |
* ... smaller is better
| Lenovo Phab 2 Pro 64 GB eMMC Flash | Huawei Mate 9 64 GB UFS 2.1 Flash | Google Pixel XL 2016 32 GB eMMC Flash | Sony Xperia XA 16 GB eMMC Flash | Samsung Galaxy S7 32 GB UFS 2.0 Flash | |
|---|---|---|---|---|---|
| AndroBench 3-5 | 30% | 26% | -21% | 40% | |
| Sequential Write 256KB SDCard (MB/s) | 54.8 | 29.53 -46% | 50.7 -7% | 53.6 -2% | |
| Sequential Read 256KB SDCard (MB/s) | 71.9 | 54 -25% | 72.9 1% | 72.3 1% | |
| Random Write 4KB (MB/s) | 12.92 | 8.77 -32% | 14.56 13% | 10.6 -18% | 16.01 24% |
| Random Read 4KB (MB/s) | 38.53 | 94.7 146% | 87.7 128% | 22.05 -43% | 85.9 123% |
| Sequential Write 256KB (MB/s) | 138 | 142.9 4% | 83.4 -40% | 68.6 -50% | 145.7 6% |
| Sequential Read 256KB (MB/s) | 255 | 594 133% | 258.2 1% | 240.4 -6% | 483.8 90% |
| Lightmark - 1920x1080 1080p | |
| LG G5 | |
| Huawei Mate 9 | |
| Samsung Galaxy S7 | |
| Lenovo Phab 2 Pro | |
| Huawei Mate 8 | |
(±) The maximum temperature on the upper side is 41.6 °C / 107 F, compared to the average of 35.3 °C / 96 F, ranging from 21.9 to 247 °C for the class Smartphone.
(+) The bottom heats up to a maximum of 34.2 °C / 94 F, compared to the average of 34 °C / 93 F
(+) In idle usage, the average temperature for the upper side is 25.4 °C / 78 F, compared to the device average of 33 °C / 91 F.
Lenovo Phab 2 Pro audio analysis
(+) | speakers can play relatively loud (84.5 dB)
Bass 100 - 315 Hz
(-) | nearly no bass - on average 22.8% lower than median
(±) | linearity of bass is average (11.4% delta to prev. frequency)
Mids 400 - 2000 Hz
(+) | balanced mids - only 2.2% away from median
(+) | mids are linear (4.7% delta to prev. frequency)
Highs 2 - 16 kHz
(±) | higher highs - on average 6.3% higher than median
(±) | linearity of highs is average (7.3% delta to prev. frequency)
Overall 100 - 16.000 Hz
(±) | linearity of overall sound is average (21.1% difference to median)
Compared to same class
» 40% of all tested devices in this class were better, 8% similar, 52% worse
» The best had a delta of 11%, average was 34%, worst was 134%
Compared to all devices tested
» 58% of all tested devices were better, 7% similar, 34% worse
» The best had a delta of 4%, average was 23%, worst was 134%
Apple MacBook 12 (Early 2016) 1.1 GHz audio analysis
(+) | speakers can play relatively loud (83.6 dB)
Bass 100 - 315 Hz
(±) | reduced bass - on average 11.3% lower than median
(±) | linearity of bass is average (14.2% delta to prev. frequency)
Mids 400 - 2000 Hz
(+) | balanced mids - only 2.4% away from median
(+) | mids are linear (5.5% delta to prev. frequency)
Highs 2 - 16 kHz
(+) | balanced highs - only 2% away from median
(+) | highs are linear (4.5% delta to prev. frequency)
Overall 100 - 16.000 Hz
(+) | overall sound is linear (10.2% difference to median)
Compared to same class
» 7% of all tested devices in this class were better, 2% similar, 90% worse
» The best had a delta of 5%, average was 18%, worst was 53%
Compared to all devices tested
» 5% of all tested devices were better, 1% similar, 94% worse
» The best had a delta of 4%, average was 23%, worst was 134%
| Off / Standby | |
| Idle | |
| Load |
|
Key:
min: | |
| Lenovo Phab 2 Pro 652 MSM8976, Adreno 510, 64 GB eMMC Flash, IPS, 2560x1440, 6.4" | Apple iPhone 7 Plus A10 Fusion, A10 Fusion GPU, 128 GB NVMe, IPS, 1920x1080, 5.5" | Huawei Mate 9 Kirin 960, Mali-G71 MP8, 64 GB UFS 2.1 Flash, IPS, 1920x1080, 5.9" | Asus Zenfone 3 ZE552KL 625, Adreno 506, 64 GB eMMC Flash, IPS, 1920x1080, 5.5" | Google Pixel XL 2016 SD 821, Adreno 530, 32 GB eMMC Flash, AMOLED, 2560x1440, 5.5" | |
|---|---|---|---|---|---|
| Power Consumption | 44% | 46% | 54% | 60% | |
| Idle Minimum * (Watt) | 3 | 0.77 74% | 0.78 74% | 0.83 72% | 0.53 82% |
| Idle Average * (Watt) | 4.1 | 2.04 50% | 2.13 48% | 2.11 49% | 1.07 74% |
| Idle Maximum * (Watt) | 4.2 | 2.24 47% | 2.17 48% | 2.12 50% | 1.12 73% |
| Load Average * (Watt) | 10.4 | 4.69 55% | 6.32 39% | 3.41 67% | 5.53 47% |
| Load Maximum * (Watt) | 8.1 | 8.66 -7% | 6.49 20% | 5.46 33% | 6.26 23% |
* ... smaller is better
| Lenovo Phab 2 Pro 652 MSM8976, Adreno 510, Wh | Apple iPhone 7 Plus A10 Fusion, A10 Fusion GPU, 11.02 Wh | Huawei Mate 9 Kirin 960, Mali-G71 MP8, Wh | Asus Zenfone 3 ZE552KL 625, Adreno 506, Wh | Google Pixel XL 2016 SD 821, Adreno 530, Wh | |
|---|---|---|---|---|---|
| Battery runtime | 33% | 34% | 58% | 12% | |
| Reader / Idle (h) | 18.7 | 30.6 64% | 25.6 37% | 25 34% | 22.2 19% |
| WiFi v1.3 (h) | 8.5 | 9.8 15% | 12.6 48% | 13.3 56% | 8.4 -1% |
| Load (h) | 3.2 | 3.8 19% | 3.7 16% | 5.9 84% | 3.8 19% |
Pros
Cons
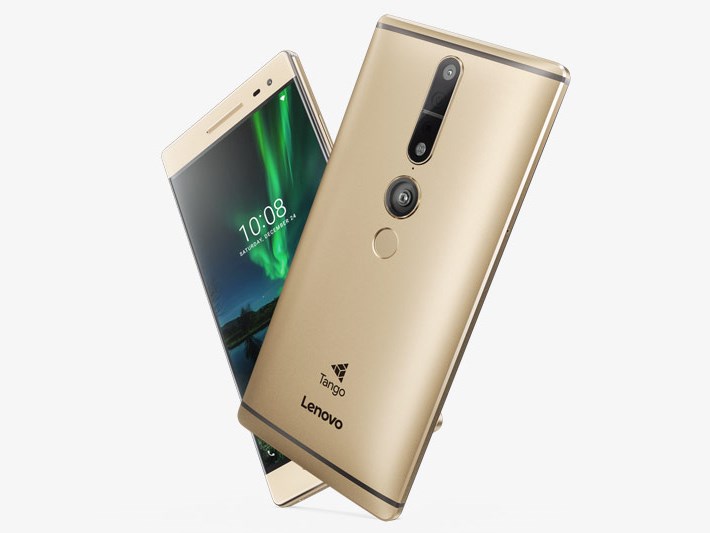
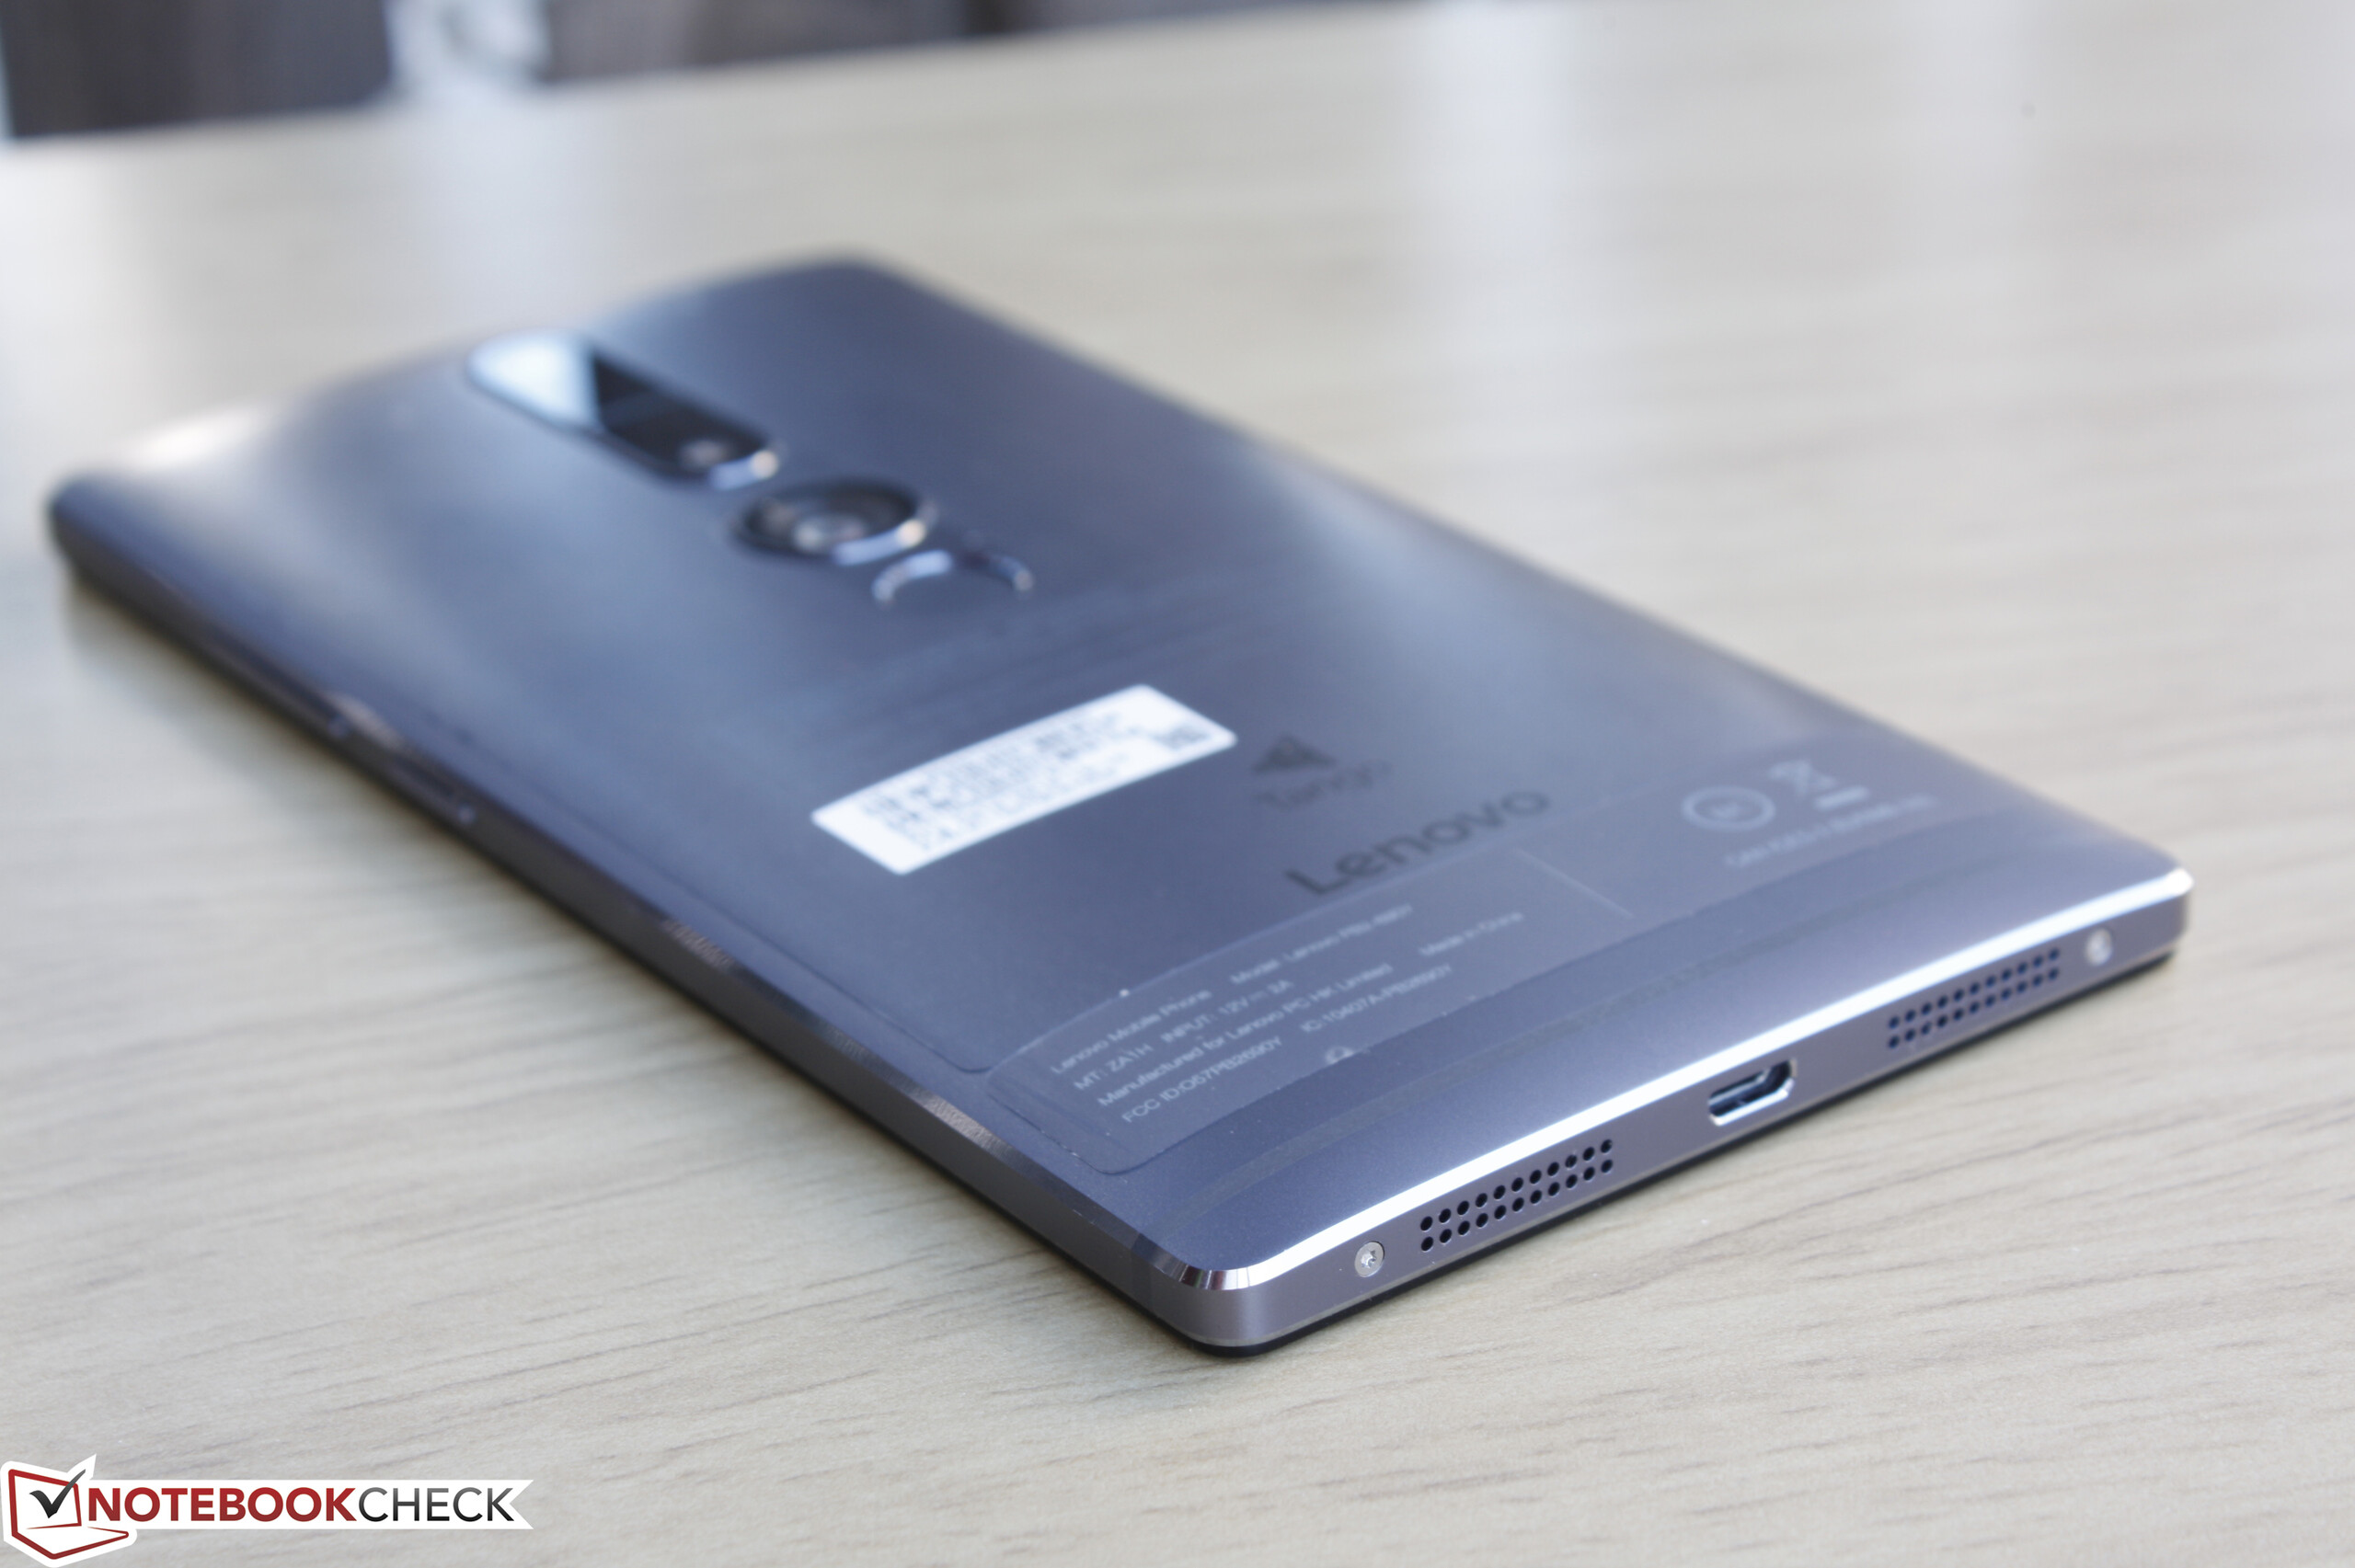
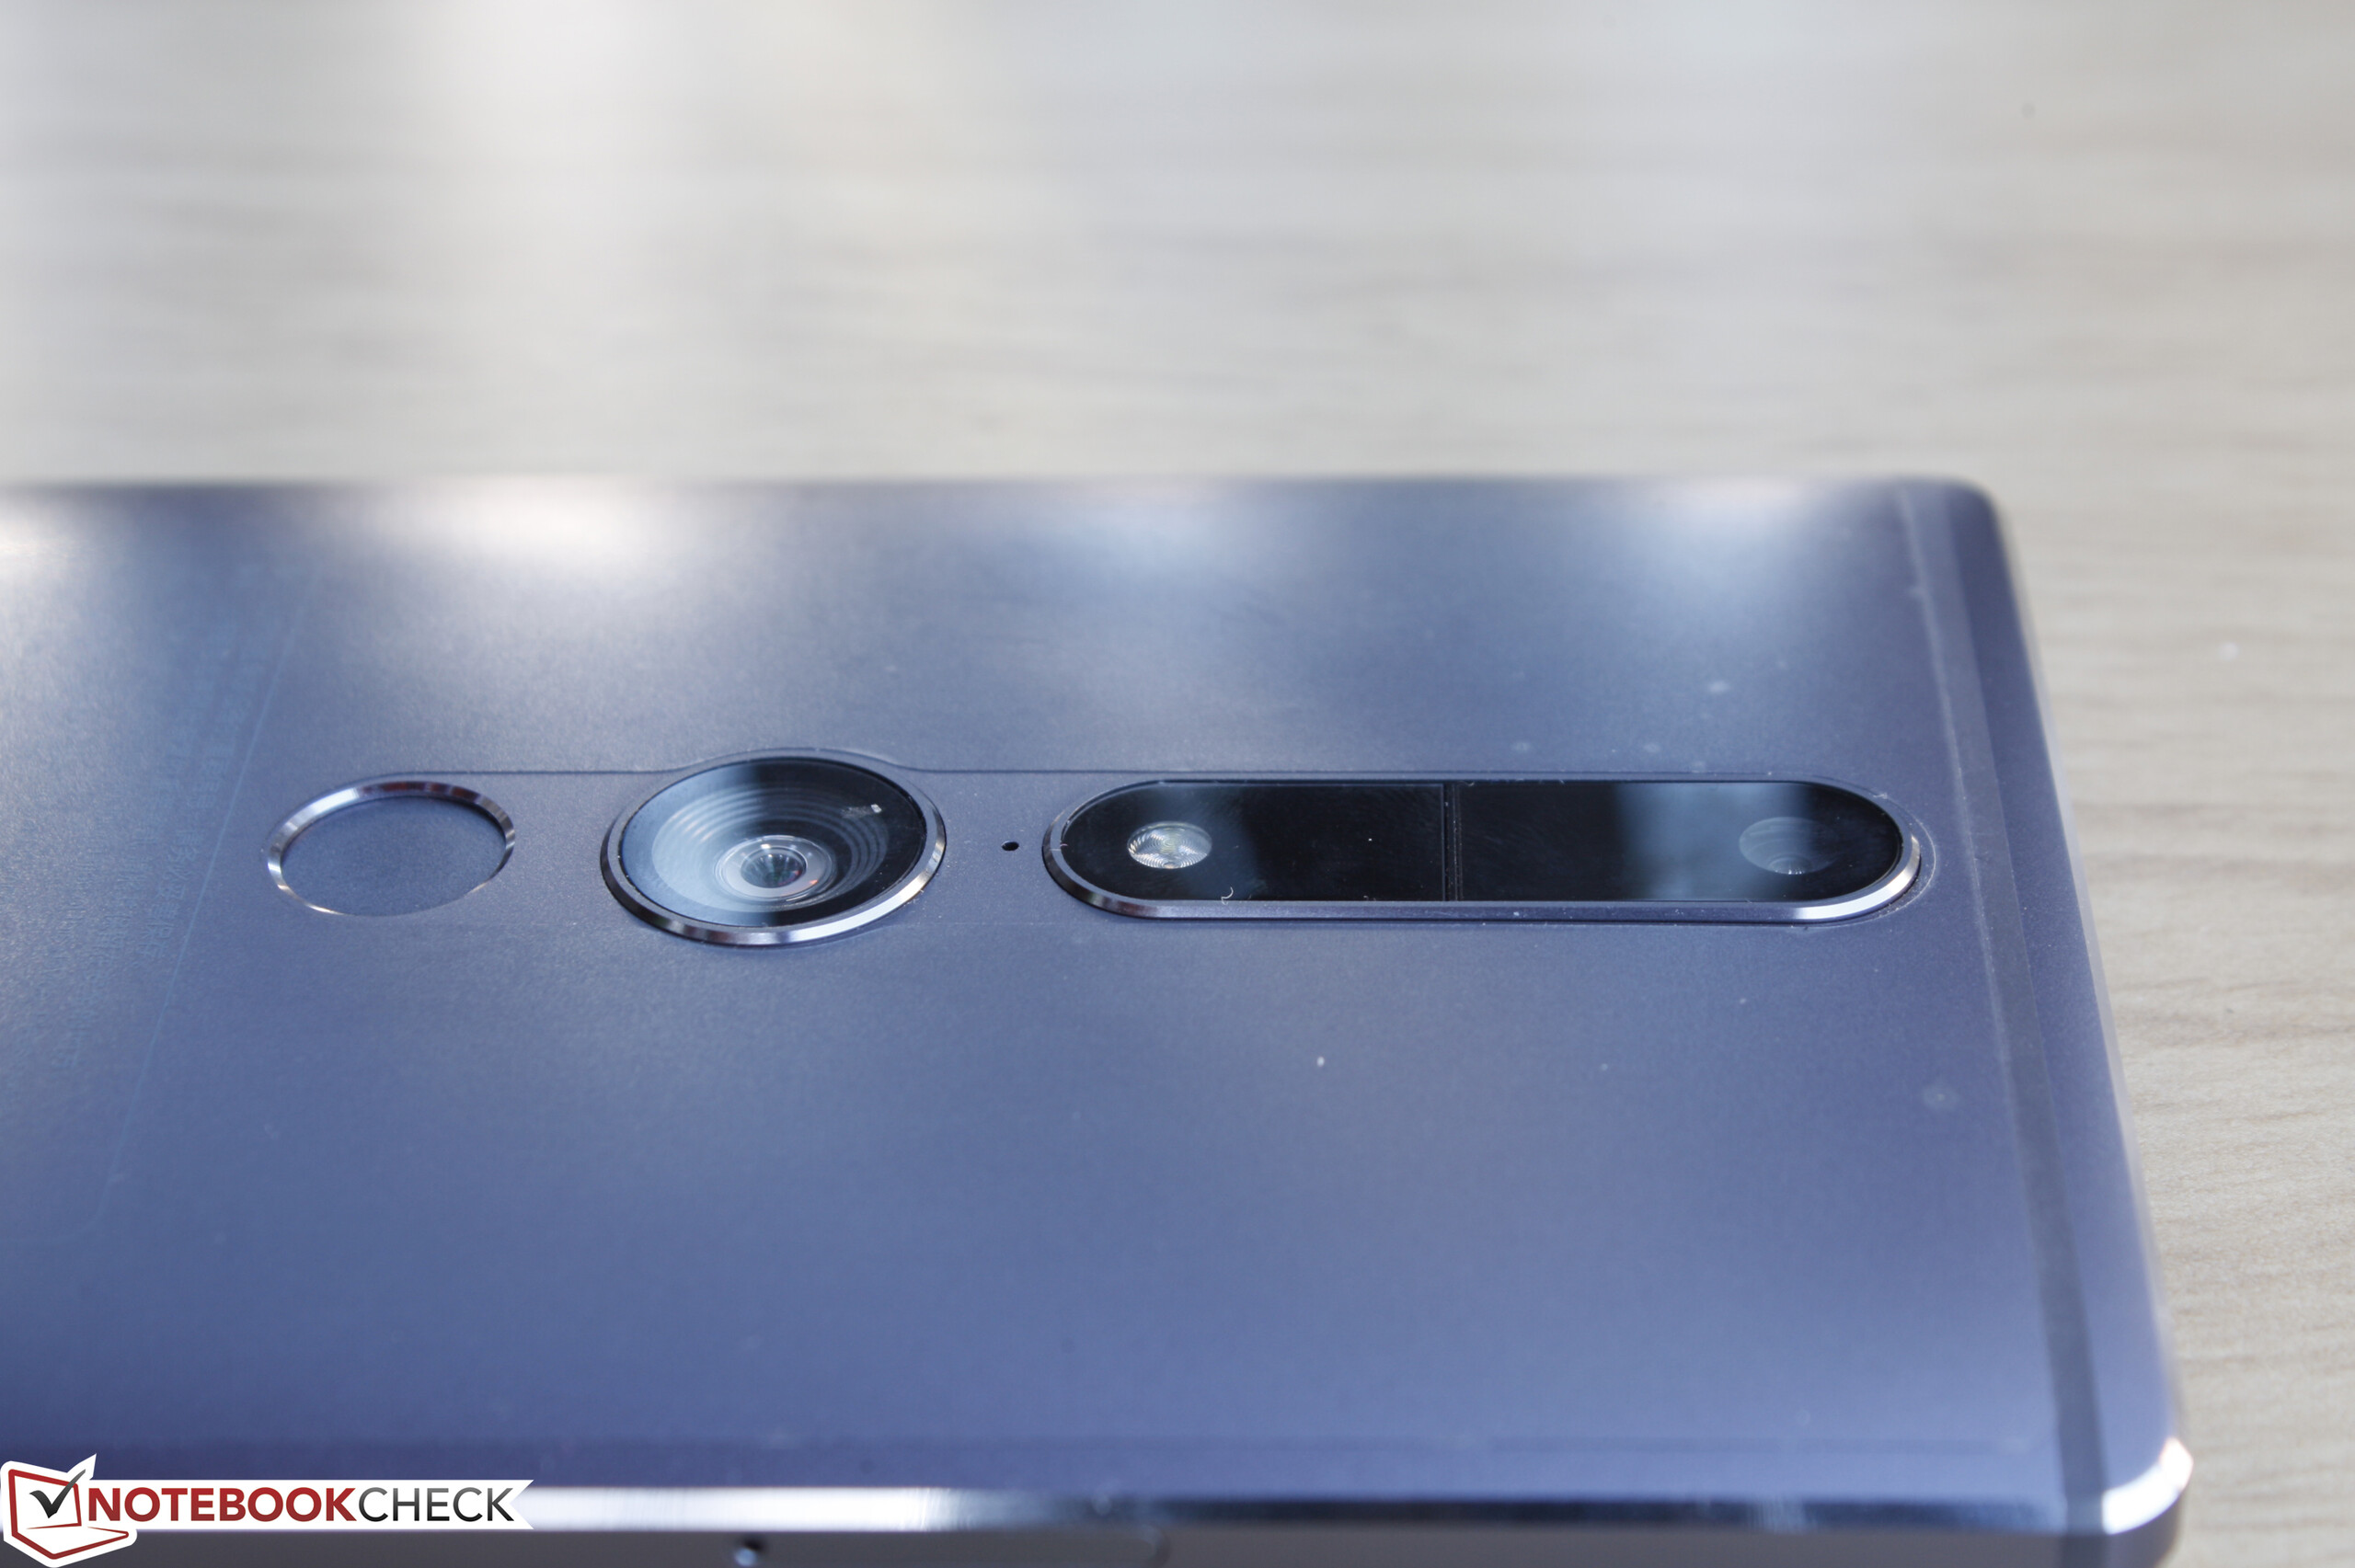
Phab 2 Pro的一大卖点是它独特的Tango组件。不过目前它只能算是一种创新,在实用性上还有待改进。除了它的游戏潜能外,联想还承诺它会提供在室内导航的功能,在这种环境下GPS信号通常较弱。例如,在博物馆或者国际机场中提供导航目前仍未实现,这也将很大程度上取决于软件开发商的支持度。目前把Tango称作“噱头”仍然过早,不过它的软件支持仍然不够完善,这个空间认知设备也还有很多未被开发的潜力。
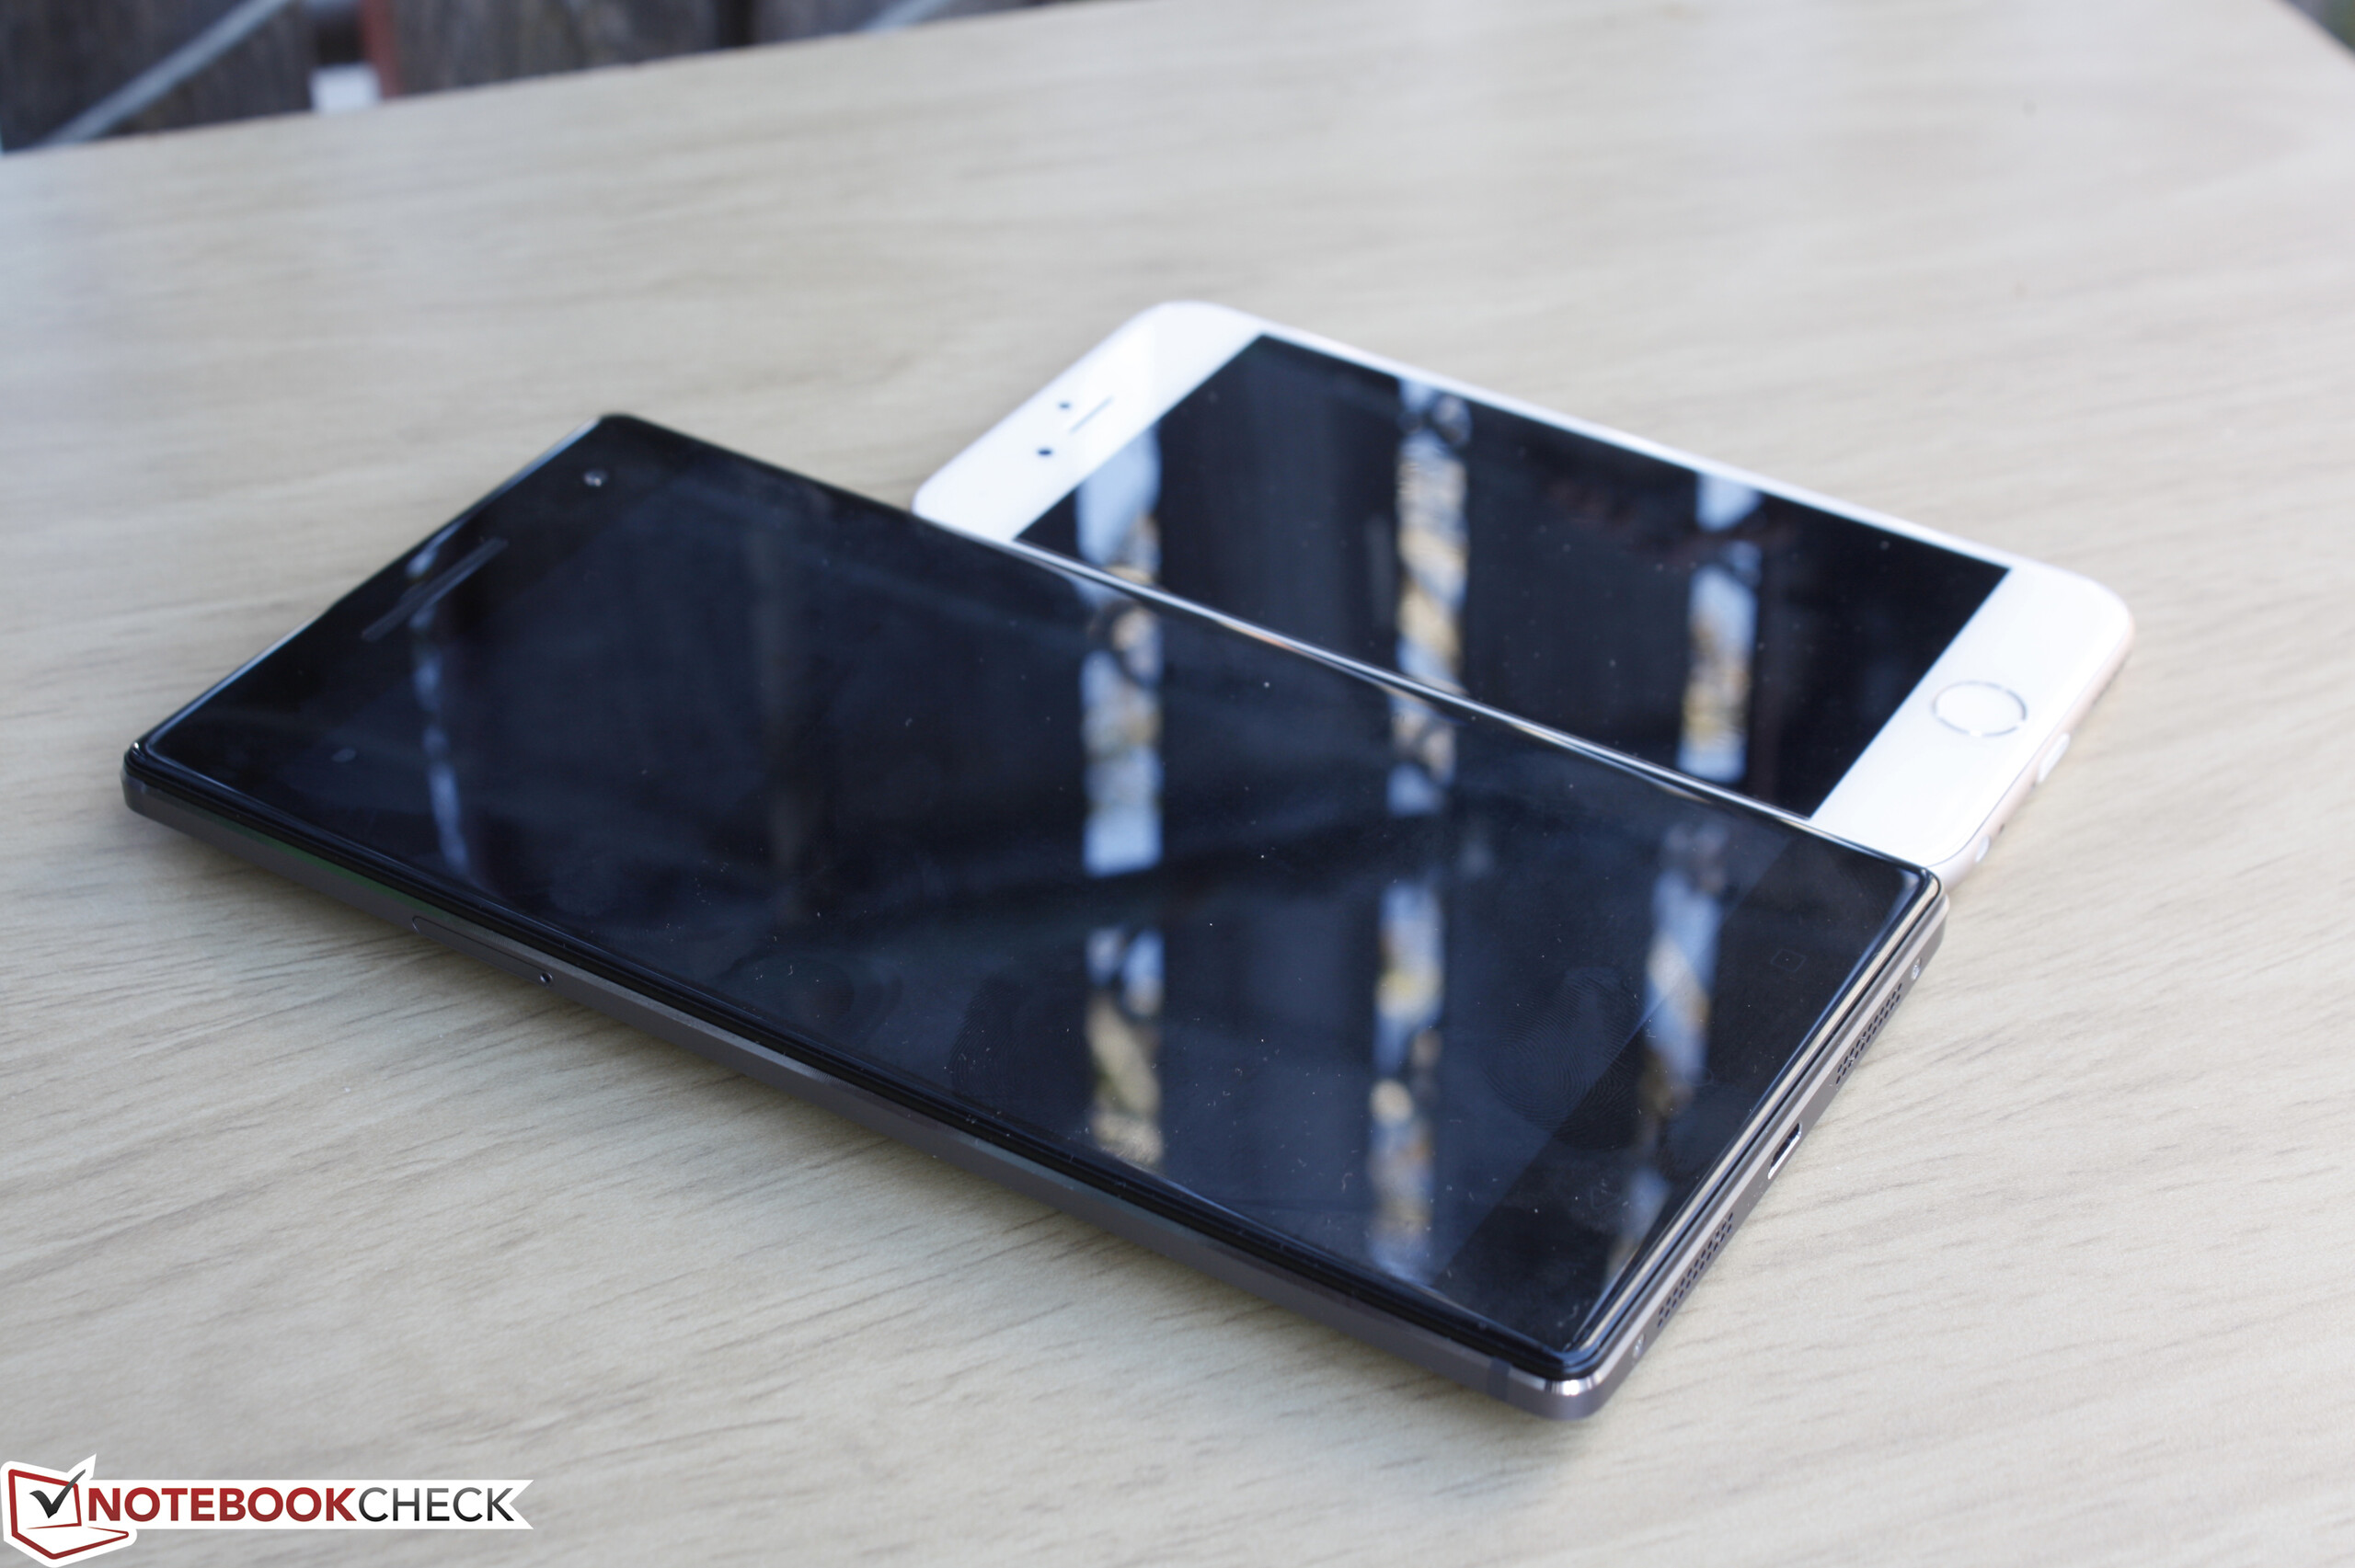
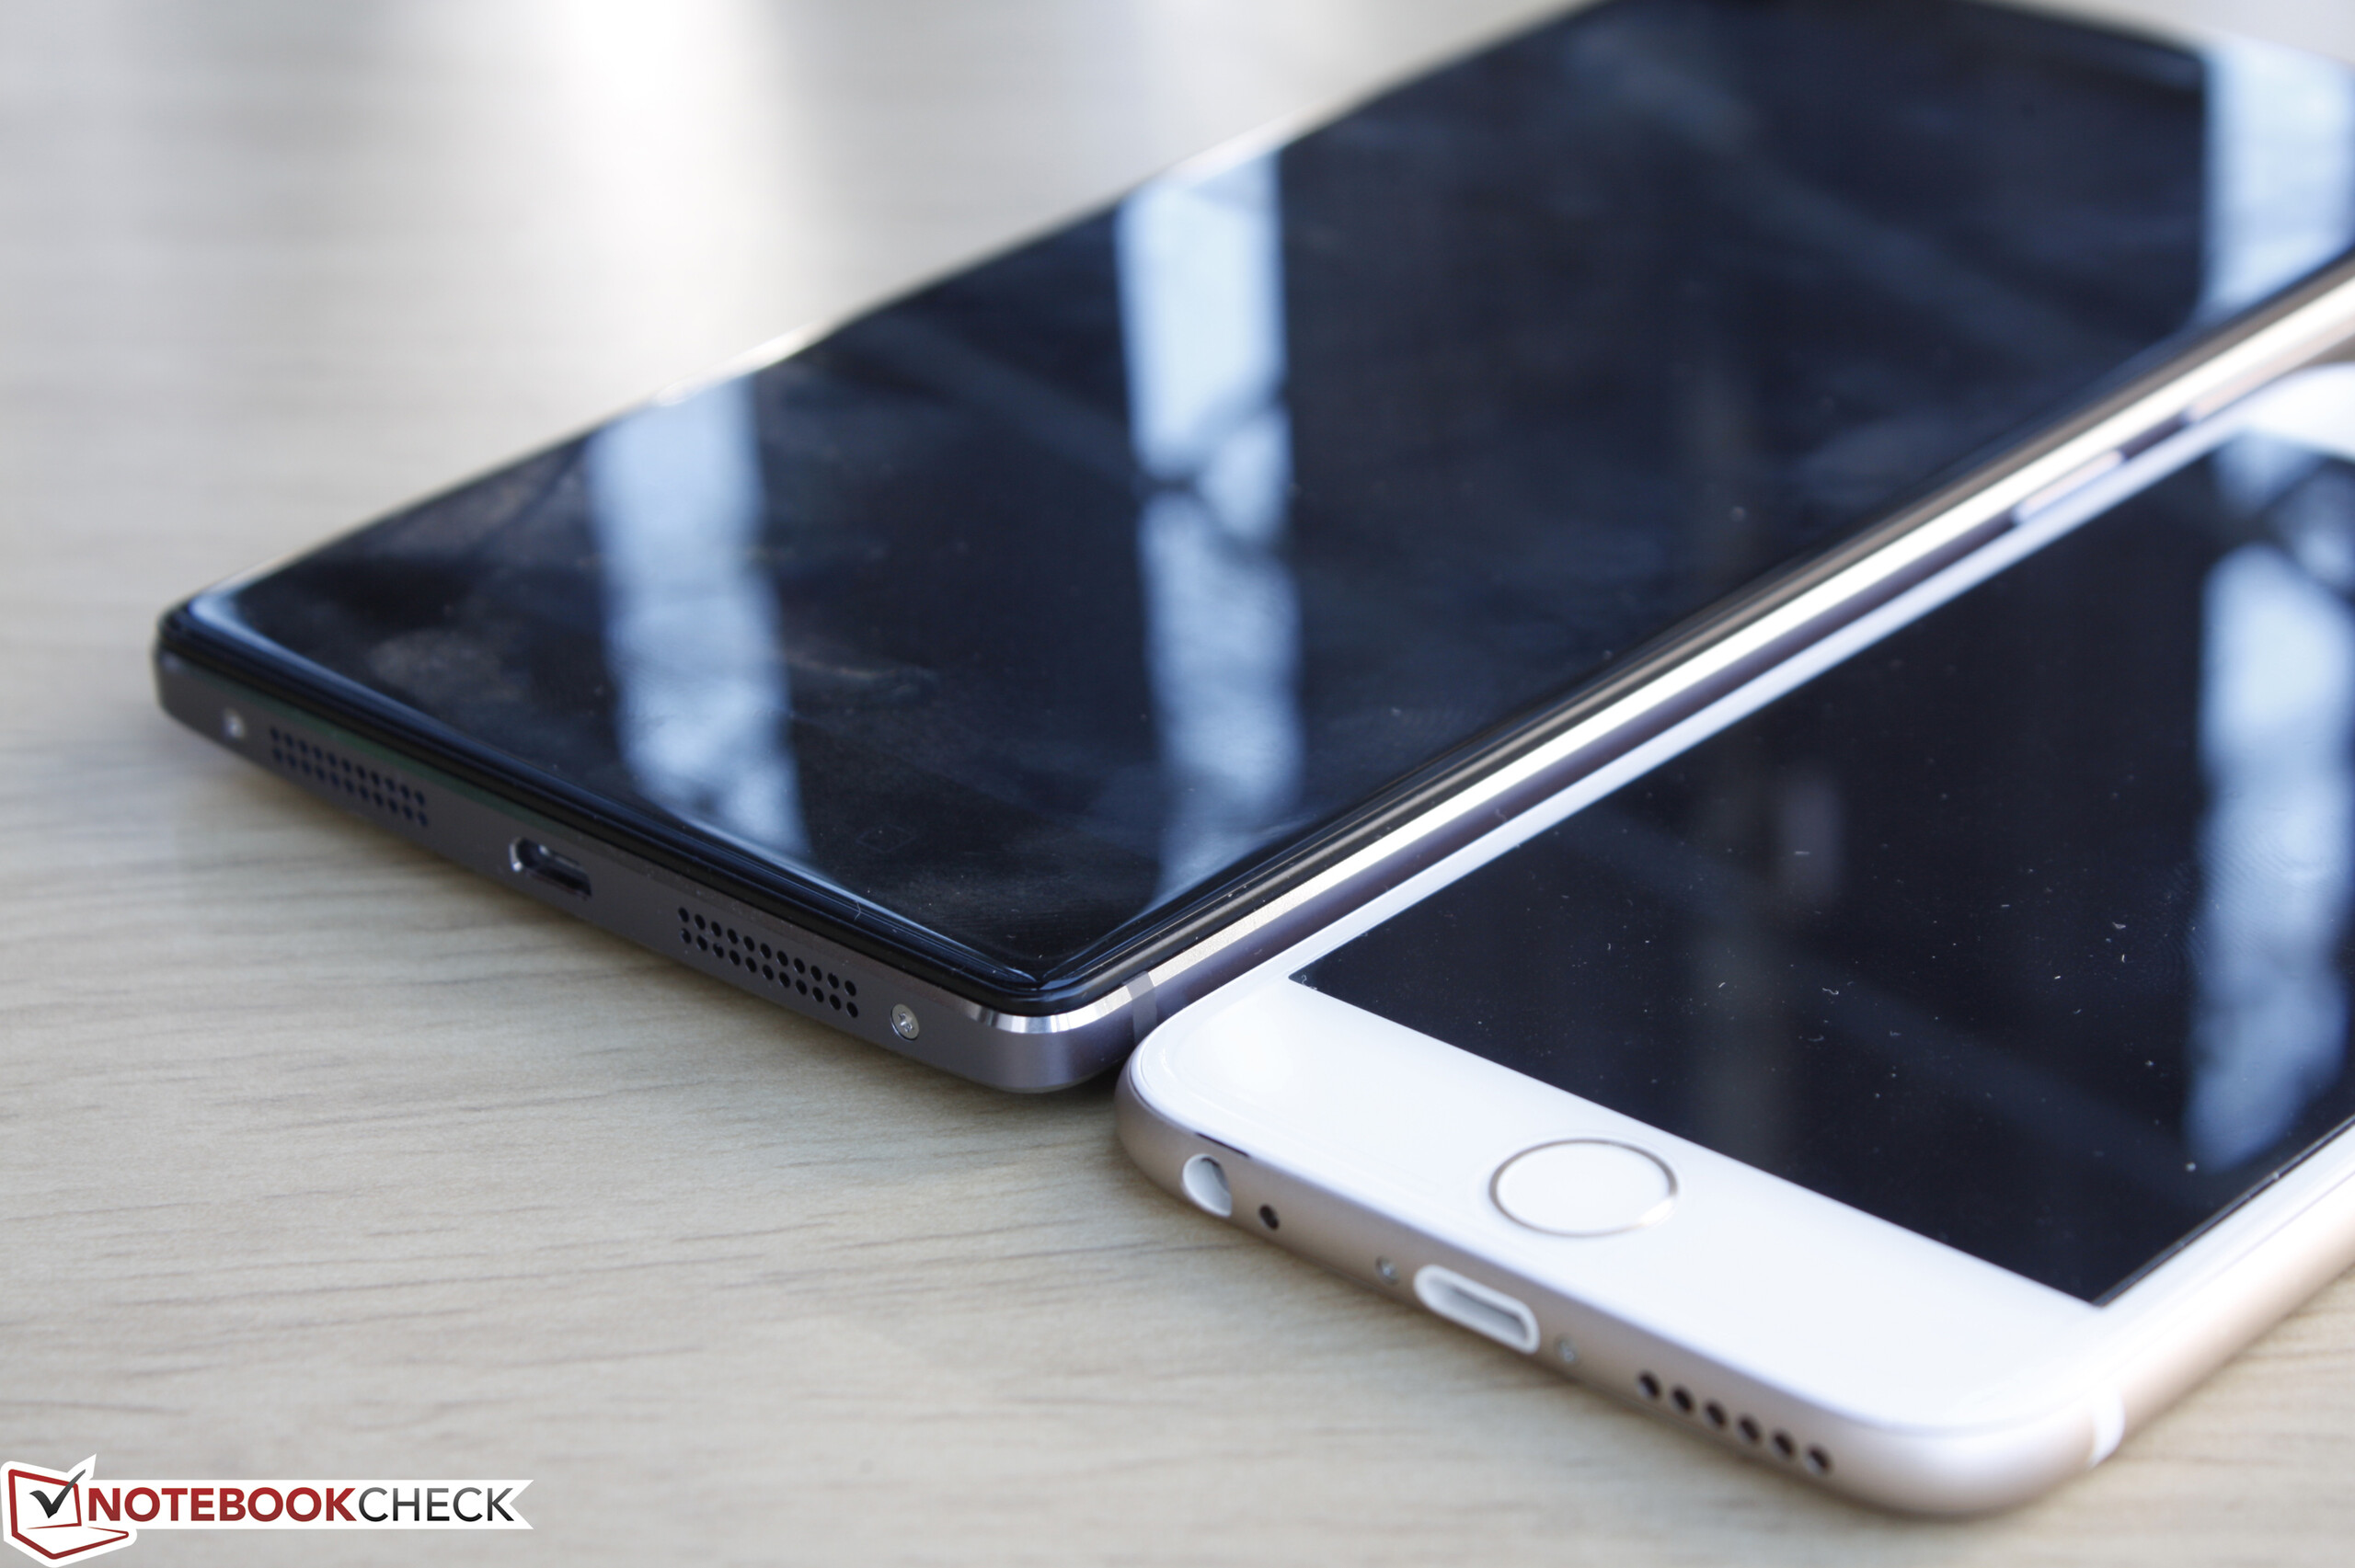
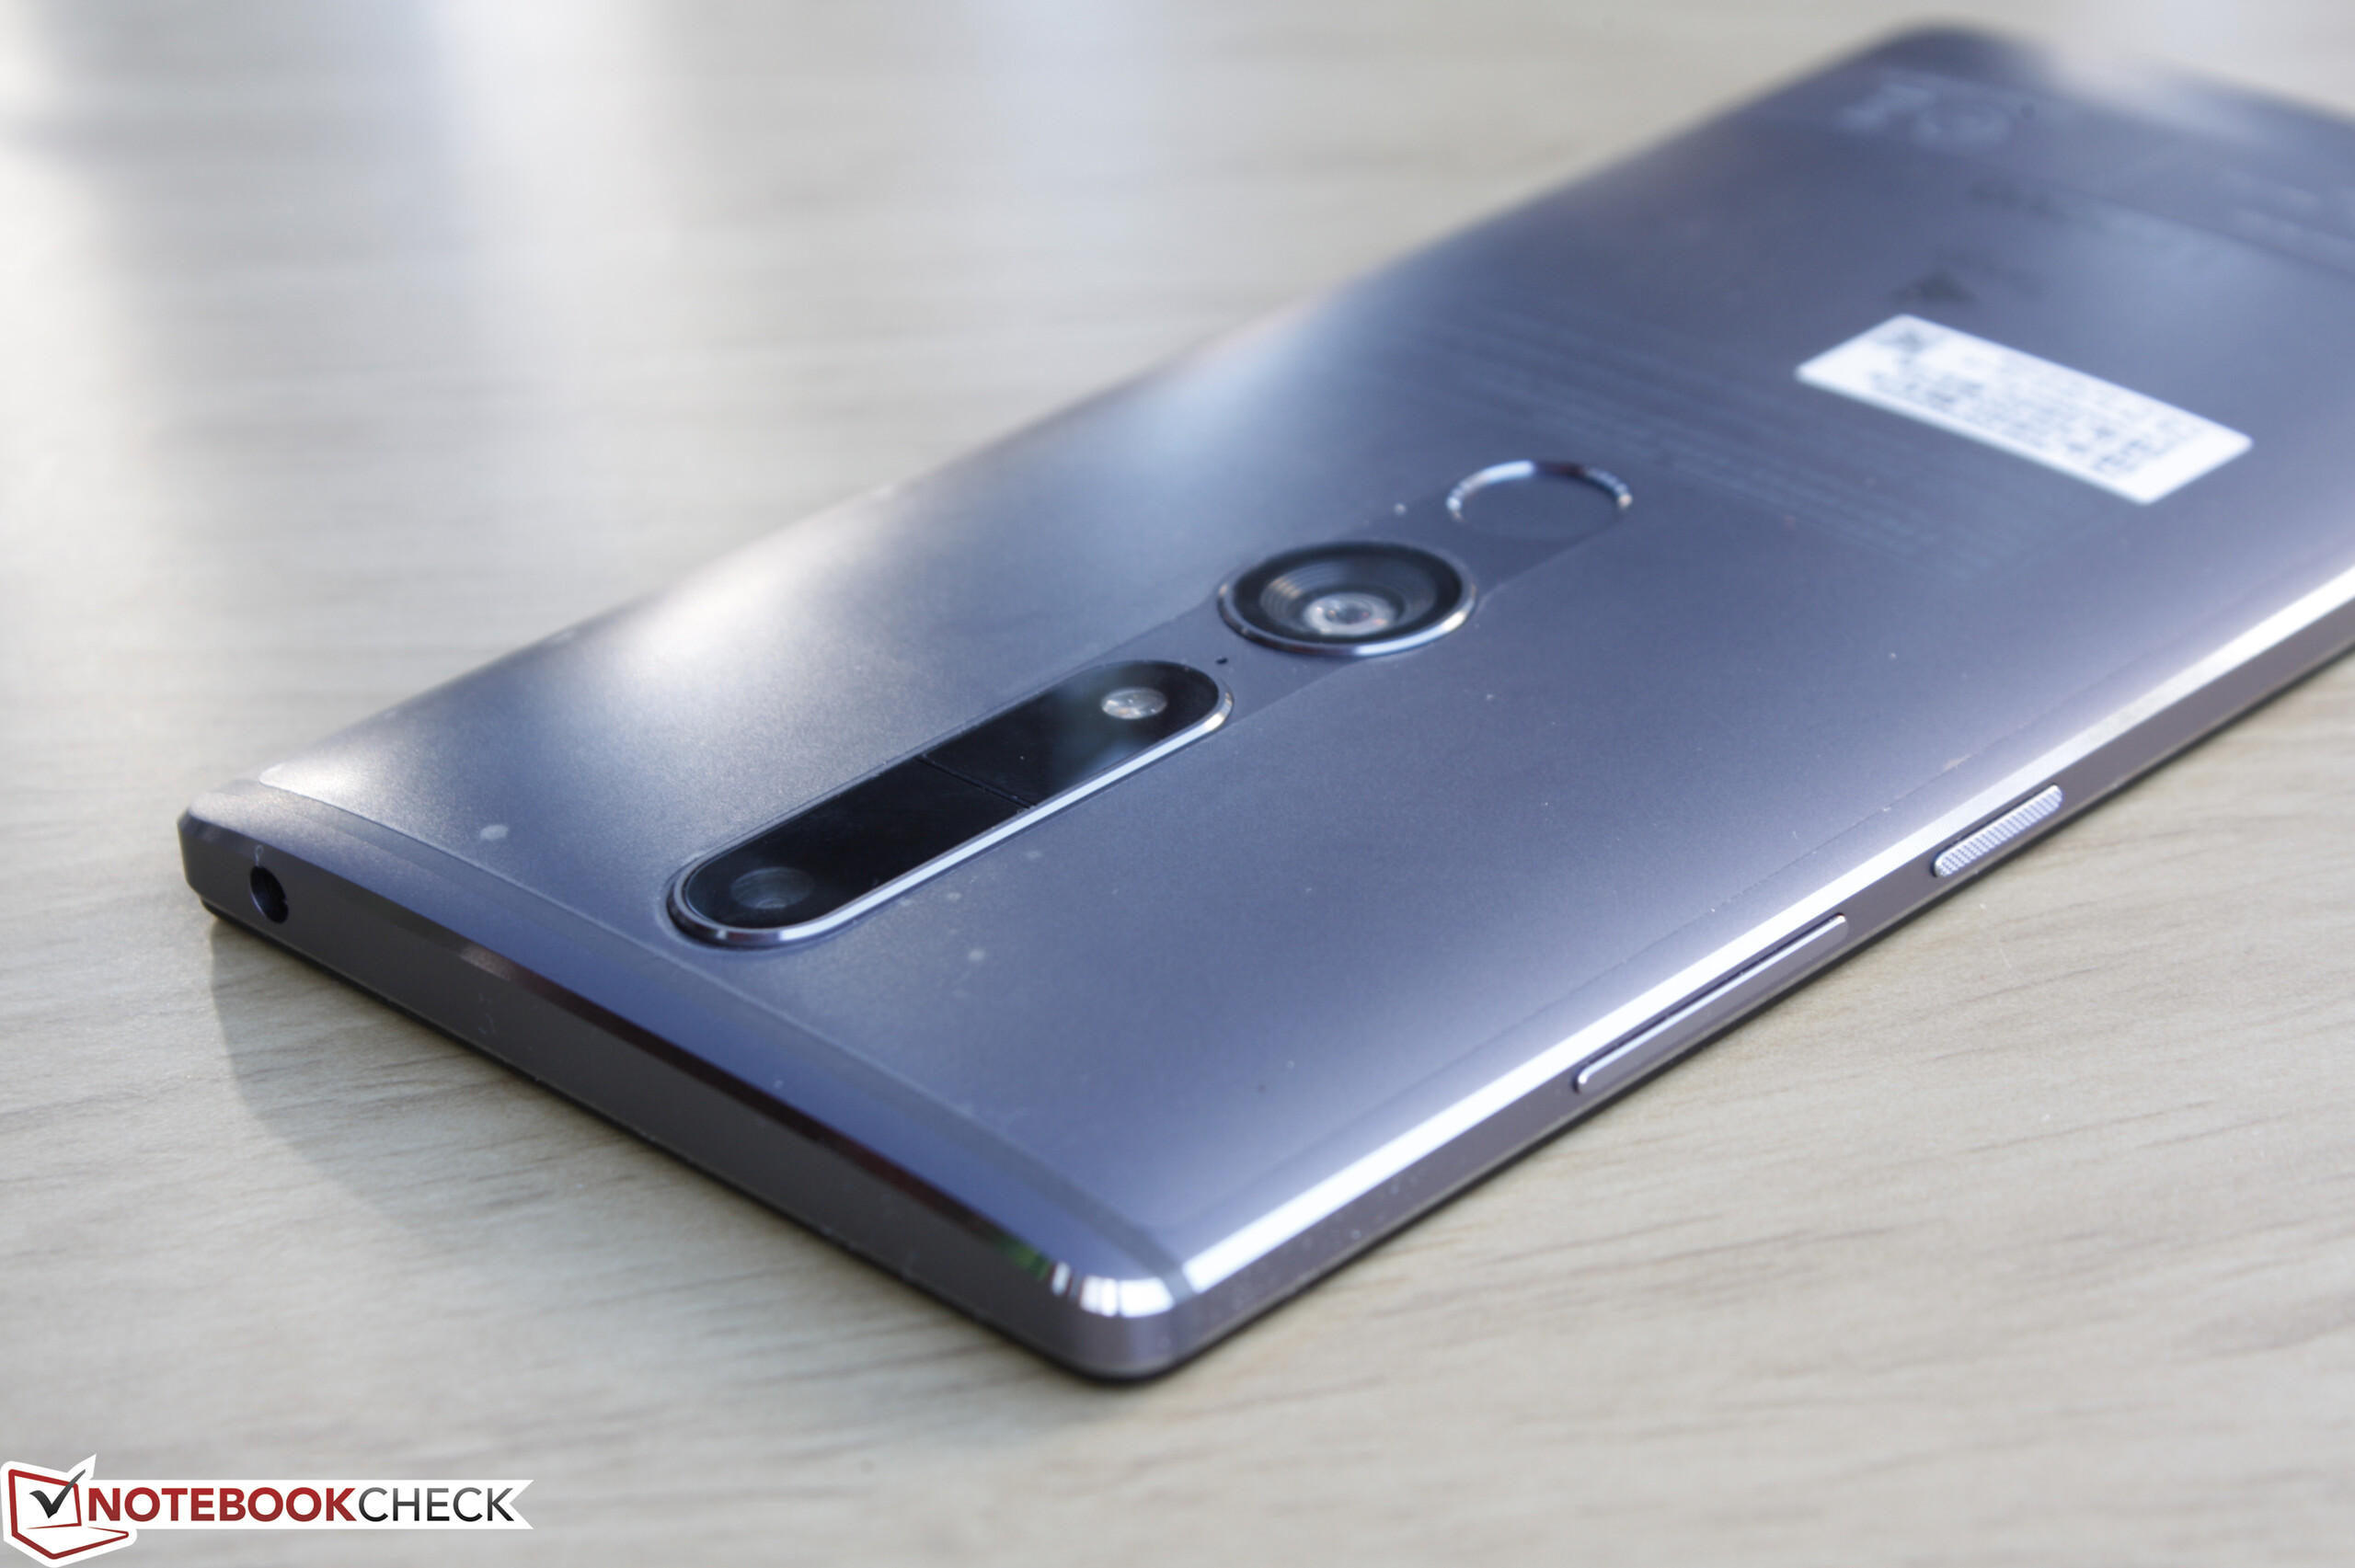
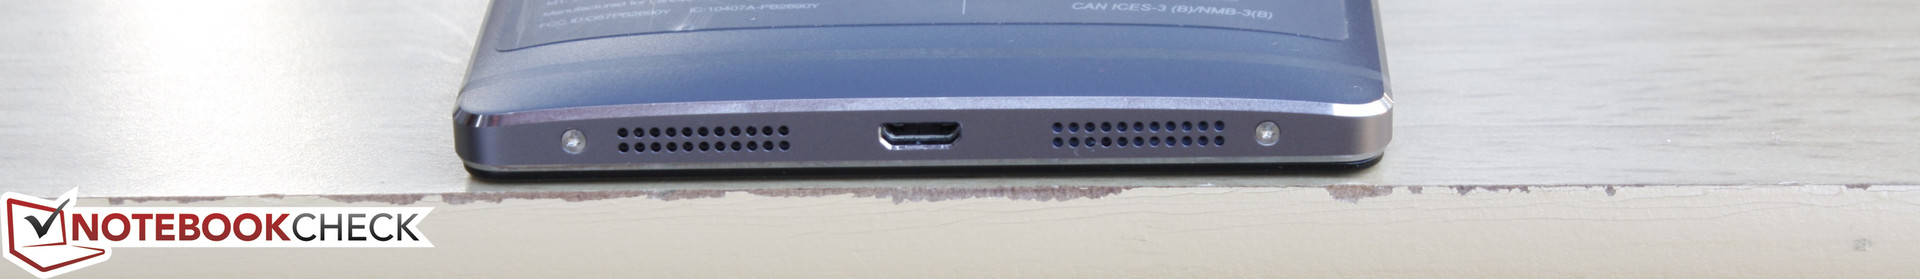
而对Tango没有特别的兴趣的用户,Phab 2 Pro作为智能手机的核心功能仍然十分优秀。它的大尺寸屏幕锐利清晰,它提供了对4G和microSD的支持,同时扬声器相比大部分5寸设备也更佳清晰。它的处理器性能很高,机身质感也很厚重。而在其他方面它的表现只能算中规中矩,这包括了中段Adreno 510显卡,电池续航时间,屏幕色彩和响应速度。它的较大尺寸需要用户双手操作,可能会让用户更期待生产商能够带来一台尺寸较小的Tango手机。
作为联想在美国市场正式推出的第一台智能手机,Phab 2 Pro可以凭借大尺寸屏幕和对Tango科技的支持脱颖而出。如果用户对这两点都兴趣不大的话,那么它只能算是一台中等偏上的安卓智能手机。
注:本文是基于完整评测的缩减版本,阅读完整的英文评测,请点击这里。
Lenovo Phab 2 Pro
- 12/06/2016 v6 (old)
Allen Ngo
Price comparison
