华硕 ZenFone 3 ZE552KL 智能手机简短评测

| Networking | |
| iperf3 transmit AX12 | |
| OnePlus 3 | |
| ZTE Axon 7 | |
| Asus Zenfone 3 ZE552KL | |
| iperf3 receive AX12 | |
| ZTE Axon 7 | |
| OnePlus 3 | |
| Asus Zenfone 3 ZE552KL | |


| |||||||||||||||||||||||||
Brightness Distribution: 93 %
Center on Battery: 658 cd/m²
Contrast: 997:1 (Black: 0.66 cd/m²)
ΔE ColorChecker Calman: 4.9 | ∀{0.5-29.43 Ø4.72}
ΔE Greyscale Calman: 5.8 | ∀{0.09-98 Ø4.97}
Gamma: 2.26
CCT: 7840 K
| Asus Zenfone 3 ZE552KL IPS, 1920x1080, 5.5" | OnePlus 3 Optic-AMOLED, 1920x1080, 5.5" | Samsung Galaxy A5 2016 Super AMOLED, 1920x1080, 5.2" | Honor 8 IPS, 1920x1080, 5.2" | ZTE Axon 7 AMOLED, 2560x1440, 5.5" | |
|---|---|---|---|---|---|
| Screen | -9% | 18% | -6% | -18% | |
| Brightness middle (cd/m²) | 658 | 419 -36% | 378 -43% | 451 -31% | 328 -50% |
| Brightness (cd/m²) | 633 | 431 -32% | 380 -40% | 443 -30% | 334 -47% |
| Brightness Distribution (%) | 93 | 84 -10% | 91 -2% | 93 0% | 88 -5% |
| Black Level * (cd/m²) | 0.66 | 0.4 39% | |||
| Contrast (:1) | 997 | 1128 13% | |||
| Colorchecker dE 2000 * | 4.9 | 4.1 16% | 1.95 60% | 5.4 -10% | 4.6 6% |
| Colorchecker dE 2000 max. * | 9.1 | 12 -32% | 3.09 66% | 9.9 -9% | 14.7 -62% |
| Greyscale dE 2000 * | 5.8 | 3.3 43% | 1.86 68% | 6.7 -16% | 2.8 52% |
| Gamma | 2.26 97% | 2.1 105% | 2.13 103% | 2.33 94% | 2.29 96% |
| CCT | 7840 83% | 6550 99% | 6376 102% | 8262 79% | 6612 98% |
| Color Space (Percent of AdobeRGB 1998) (%) | 89.38 | ||||
| Color Space (Percent of sRGB) (%) | 100 |
* ... smaller is better
Display Response Times
| ↔ Response Time Black to White | ||
|---|---|---|
| 36 ms ... rise ↗ and fall ↘ combined | ↗ 15 ms rise | 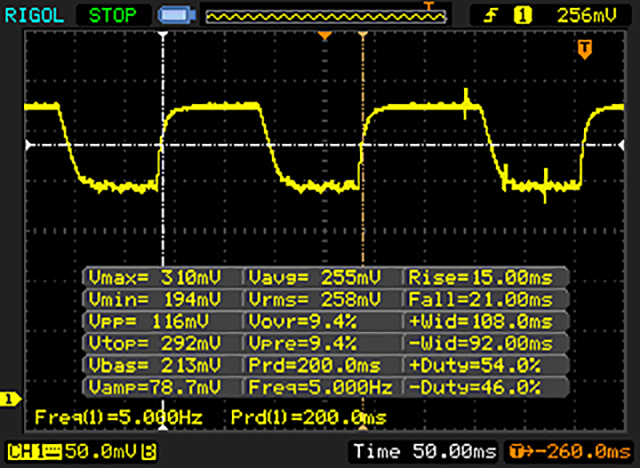 |
| ↘ 21 ms fall | ||
| The screen shows slow response rates in our tests and will be unsatisfactory for gamers. In comparison, all tested devices range from 0.1 (minimum) to 240 (maximum) ms. » 94 % of all devices are better. This means that the measured response time is worse than the average of all tested devices (19.8 ms). | ||
| ↔ Response Time 50% Grey to 80% Grey | ||
| 56 ms ... rise ↗ and fall ↘ combined | ↗ 17 ms rise | 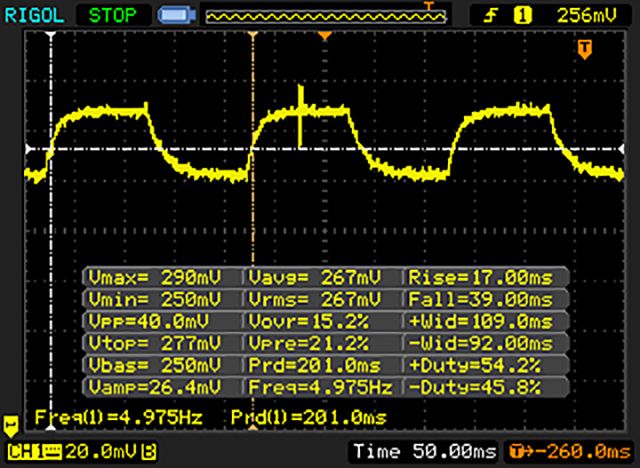 |
| ↘ 39 ms fall | ||
| The screen shows slow response rates in our tests and will be unsatisfactory for gamers. In comparison, all tested devices range from 0.165 (minimum) to 636 (maximum) ms. » 93 % of all devices are better. This means that the measured response time is worse than the average of all tested devices (31 ms). | ||
Screen Flickering / PWM (Pulse-Width Modulation)
| Screen flickering / PWM not detected | 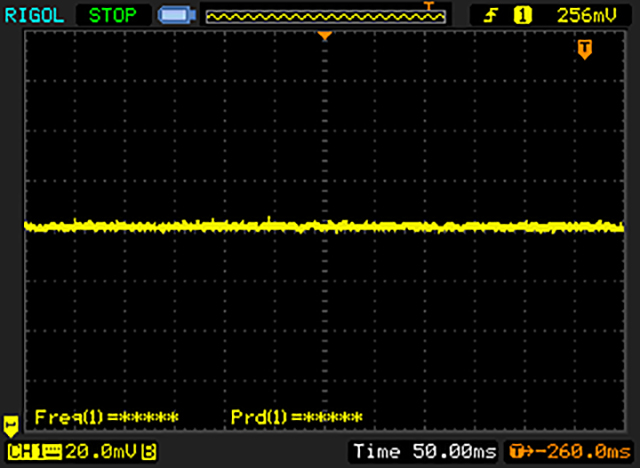 | ||
In comparison: 52 % of all tested devices do not use PWM to dim the display. If PWM was detected, an average of 7763 (minimum: 5 - maximum: 343500) Hz was measured. | |||
| AnTuTu v6 - Total Score (sort by value) | |
| Asus Zenfone 3 ZE552KL | |
| ZTE Axon 7 | |
| Honor 8 | |
| Samsung Galaxy A5 2016 | |
| OnePlus 3 | |
| Geekbench 4.0 | |
| 64 Bit Multi-Core Score (sort by value) | |
| Asus Zenfone 3 ZE552KL | |
| ZTE Axon 7 | |
| Honor 8 | |
| OnePlus 3 | |
| 64 Bit Single-Core Score (sort by value) | |
| Asus Zenfone 3 ZE552KL | |
| ZTE Axon 7 | |
| Honor 8 | |
| OnePlus 3 | |
| 3DMark | |
| 1280x720 offscreen Ice Storm Unlimited Score (sort by value) | |
| Asus Zenfone 3 ZE552KL | |
| ZTE Axon 7 | |
| Honor 8 | |
| Samsung Galaxy A5 2016 | |
| OnePlus 3 | |
| 1280x720 offscreen Ice Storm Unlimited Graphics Score (sort by value) | |
| Asus Zenfone 3 ZE552KL | |
| ZTE Axon 7 | |
| Honor 8 | |
| Samsung Galaxy A5 2016 | |
| OnePlus 3 | |
| 1280x720 offscreen Ice Storm Unlimited Physics (sort by value) | |
| Asus Zenfone 3 ZE552KL | |
| ZTE Axon 7 | |
| Honor 8 | |
| Samsung Galaxy A5 2016 | |
| OnePlus 3 | |
| 2560x1440 Sling Shot OpenGL ES 3.0 (sort by value) | |
| Asus Zenfone 3 ZE552KL | |
| ZTE Axon 7 | |
| Honor 8 | |
| Samsung Galaxy A5 2016 | |
| OnePlus 3 | |
| 2560x1440 Sling Shot OpenGL ES 3.0 Graphics (sort by value) | |
| Asus Zenfone 3 ZE552KL | |
| ZTE Axon 7 | |
| Honor 8 | |
| Samsung Galaxy A5 2016 | |
| OnePlus 3 | |
| 2560x1440 Sling Shot OpenGL ES 3.0 Physics (sort by value) | |
| Asus Zenfone 3 ZE552KL | |
| ZTE Axon 7 | |
| Honor 8 | |
| Samsung Galaxy A5 2016 | |
| OnePlus 3 | |
| GFXBench (DX / GLBenchmark) 2.7 | |
| T-Rex Onscreen (sort by value) | |
| Asus Zenfone 3 ZE552KL | |
| ZTE Axon 7 | |
| Honor 8 | |
| Samsung Galaxy A5 2016 | |
| OnePlus 3 | |
| 1920x1080 T-Rex Offscreen (sort by value) | |
| Asus Zenfone 3 ZE552KL | |
| ZTE Axon 7 | |
| Honor 8 | |
| Samsung Galaxy A5 2016 | |
| OnePlus 3 | |
| GFXBench 3.0 | |
| on screen Manhattan Onscreen OGL (sort by value) | |
| Asus Zenfone 3 ZE552KL | |
| ZTE Axon 7 | |
| Honor 8 | |
| Samsung Galaxy A5 2016 | |
| OnePlus 3 | |
| 1920x1080 1080p Manhattan Offscreen (sort by value) | |
| Asus Zenfone 3 ZE552KL | |
| ZTE Axon 7 | |
| Honor 8 | |
| Samsung Galaxy A5 2016 | |
| OnePlus 3 | |
| GFXBench 3.1 | |
| on screen Manhattan ES 3.1 Onscreen (sort by value) | |
| Asus Zenfone 3 ZE552KL | |
| ZTE Axon 7 | |
| Honor 8 | |
| OnePlus 3 | |
| 1920x1080 Manhattan ES 3.1 Offscreen (sort by value) | |
| Asus Zenfone 3 ZE552KL | |
| ZTE Axon 7 | |
| Honor 8 | |
| OnePlus 3 | |
| PCMark for Android - Work performance score (sort by value) | |
| Asus Zenfone 3 ZE552KL | |
| ZTE Axon 7 | |
| Honor 8 | |
| Samsung Galaxy A5 2016 | |
| OnePlus 3 | |
| Octane V2 - Total Score (sort by value) | |
| Asus Zenfone 3 ZE552KL | |
| OnePlus 3 | |
| Samsung Galaxy A5 2016 | |
| Honor 8 | |
| ZTE Axon 7 | |
| Mozilla Kraken 1.1 - Total (sort by value) | |
| Asus Zenfone 3 ZE552KL | |
| OnePlus 3 | |
| Samsung Galaxy A5 2016 | |
| Honor 8 | |
| ZTE Axon 7 | |
| WebXPRT 2015 - Overall (sort by value) | |
| Asus Zenfone 3 ZE552KL | |
| OnePlus 3 | |
| Samsung Galaxy A5 2016 | |
| Honor 8 | |
| ZTE Axon 7 | |
| JetStream 1.1 - 1.1 Total (sort by value) | |
| Asus Zenfone 3 ZE552KL | |
| OnePlus 3 | |
| Samsung Galaxy A5 2016 | |
| Honor 8 | |
| ZTE Axon 7 | |
* ... smaller is better
| AndroBench 3-5 | |
| Sequential Read 256KB (sort by value) | |
| Asus Zenfone 3 ZE552KL | |
| OnePlus 3 | |
| Samsung Galaxy A5 2016 | |
| Honor 8 | |
| ZTE Axon 7 | |
| Sequential Write 256KB (sort by value) | |
| Asus Zenfone 3 ZE552KL | |
| OnePlus 3 | |
| Samsung Galaxy A5 2016 | |
| Honor 8 | |
| ZTE Axon 7 | |
| Random Read 4KB (sort by value) | |
| Asus Zenfone 3 ZE552KL | |
| OnePlus 3 | |
| Samsung Galaxy A5 2016 | |
| Honor 8 | |
| ZTE Axon 7 | |
| Random Write 4KB (sort by value) | |
| Asus Zenfone 3 ZE552KL | |
| OnePlus 3 | |
| Samsung Galaxy A5 2016 | |
| Honor 8 | |
| ZTE Axon 7 | |
| Sequential Read 256KB SDCard (sort by value) | |
| Asus Zenfone 3 ZE552KL | |
| Honor 8 | |
| ZTE Axon 7 | |
| Sequential Write 256KB SDCard (sort by value) | |
| Asus Zenfone 3 ZE552KL | |
| Honor 8 | |
| ZTE Axon 7 | |
| Asphalt 8: Airborne | |||
| Settings | Value | ||
| high | 29 fps | ||
| very low | 29 fps | ||
(+) The maximum temperature on the upper side is 38.6 °C / 101 F, compared to the average of 35.3 °C / 96 F, ranging from 21.9 to 247 °C for the class Smartphone.
(+) The bottom heats up to a maximum of 39.1 °C / 102 F, compared to the average of 34 °C / 93 F
(±) In idle usage, the average temperature for the upper side is 33 °C / 91 F, compared to the device average of 33 °C / 91 F.
Asus Zenfone 3 ZE552KL audio analysis
(+) | speakers can play relatively loud (83.7 dB)
Bass 100 - 315 Hz
(-) | nearly no bass - on average 33% lower than median
(±) | linearity of bass is average (9.9% delta to prev. frequency)
Mids 400 - 2000 Hz
(+) | balanced mids - only 4% away from median
(+) | mids are linear (5.7% delta to prev. frequency)
Highs 2 - 16 kHz
(+) | balanced highs - only 2.8% away from median
(+) | highs are linear (6.1% delta to prev. frequency)
Overall 100 - 16.000 Hz
(±) | linearity of overall sound is average (21.7% difference to median)
Compared to same class
» 44% of all tested devices in this class were better, 8% similar, 48% worse
» The best had a delta of 11%, average was 34%, worst was 134%
Compared to all devices tested
» 62% of all tested devices were better, 7% similar, 31% worse
» The best had a delta of 4%, average was 23%, worst was 134%
ZTE Axon 7 audio analysis
(+) | speakers can play relatively loud (87.1 dB)
Bass 100 - 315 Hz
(-) | nearly no bass - on average 25.8% lower than median
(±) | linearity of bass is average (12.3% delta to prev. frequency)
Mids 400 - 2000 Hz
(±) | higher mids - on average 6% higher than median
(+) | mids are linear (4.6% delta to prev. frequency)
Highs 2 - 16 kHz
(±) | higher highs - on average 7.7% higher than median
(±) | linearity of highs is average (7% delta to prev. frequency)
Overall 100 - 16.000 Hz
(±) | linearity of overall sound is average (24.4% difference to median)
Compared to same class
» 59% of all tested devices in this class were better, 7% similar, 34% worse
» The best had a delta of 11%, average was 34%, worst was 134%
Compared to all devices tested
» 74% of all tested devices were better, 6% similar, 20% worse
» The best had a delta of 4%, average was 23%, worst was 134%
Honor 8 audio analysis
(+) | speakers can play relatively loud (84.7 dB)
Bass 100 - 315 Hz
(-) | nearly no bass - on average 24% lower than median
(±) | linearity of bass is average (12.1% delta to prev. frequency)
Mids 400 - 2000 Hz
(+) | balanced mids - only 4.1% away from median
(+) | mids are linear (5.3% delta to prev. frequency)
Highs 2 - 16 kHz
(±) | higher highs - on average 11.8% higher than median
(±) | linearity of highs is average (7.2% delta to prev. frequency)
Overall 100 - 16.000 Hz
(±) | linearity of overall sound is average (28% difference to median)
Compared to same class
» 73% of all tested devices in this class were better, 5% similar, 22% worse
» The best had a delta of 11%, average was 34%, worst was 134%
Compared to all devices tested
» 85% of all tested devices were better, 3% similar, 12% worse
» The best had a delta of 4%, average was 23%, worst was 134%
Samsung Galaxy A5 2016 audio analysis
(+) | speakers can play relatively loud (87.7 dB)
Bass 100 - 315 Hz
(-) | nearly no bass - on average 33.7% lower than median
(±) | linearity of bass is average (11.1% delta to prev. frequency)
Mids 400 - 2000 Hz
(+) | balanced mids - only 4.2% away from median
(+) | mids are linear (5.4% delta to prev. frequency)
Highs 2 - 16 kHz
(+) | balanced highs - only 4.7% away from median
(±) | linearity of highs is average (8.4% delta to prev. frequency)
Overall 100 - 16.000 Hz
(±) | linearity of overall sound is average (22.1% difference to median)
Compared to same class
» 47% of all tested devices in this class were better, 7% similar, 46% worse
» The best had a delta of 11%, average was 34%, worst was 134%
Compared to all devices tested
» 64% of all tested devices were better, 6% similar, 30% worse
» The best had a delta of 4%, average was 23%, worst was 134%
OnePlus 3 audio analysis
(+) | speakers can play relatively loud (88.6 dB)
Bass 100 - 315 Hz
(-) | nearly no bass - on average 30.9% lower than median
(±) | linearity of bass is average (11.3% delta to prev. frequency)
Mids 400 - 2000 Hz
(+) | balanced mids - only 4.2% away from median
(+) | mids are linear (4.9% delta to prev. frequency)
Highs 2 - 16 kHz
(±) | higher highs - on average 5.6% higher than median
(+) | highs are linear (3.2% delta to prev. frequency)
Overall 100 - 16.000 Hz
(±) | linearity of overall sound is average (21.8% difference to median)
Compared to same class
» 45% of all tested devices in this class were better, 8% similar, 47% worse
» The best had a delta of 11%, average was 34%, worst was 134%
Compared to all devices tested
» 62% of all tested devices were better, 7% similar, 31% worse
» The best had a delta of 4%, average was 23%, worst was 134%
| Off / Standby | |
| Idle | |
| Load |
|
Key:
min: | |
| Asus Zenfone 3 ZE552KL 3000 mAh | OnePlus 3 3000 mAh | Samsung Galaxy A5 2016 2900 mAh | Honor 8 3000 mAh | ZTE Axon 7 3250 mAh | |
|---|---|---|---|---|---|
| Power Consumption | -12% | 9% | -7% | -5% | |
| Idle Minimum * (Watt) | 0.83 | 0.57 31% | 0.96 -16% | 0.78 6% | 0.64 23% |
| Idle Average * (Watt) | 2.11 | 1.24 41% | 1.64 22% | 1.89 10% | 0.84 60% |
| Idle Maximum * (Watt) | 2.12 | 1.36 36% | 1.71 19% | 2.02 5% | 0.87 59% |
| Load Average * (Watt) | 3.41 | 5.92 -74% | 2.98 13% | 5.28 -55% | 6.02 -77% |
| Load Maximum * (Watt) | 5.46 | 10.53 -93% | 5.08 7% | 5.44 -0% | 10.45 -91% |
* ... smaller is better
| Asus Zenfone 3 ZE552KL 3000 mAh | OnePlus 3 3000 mAh | Samsung Galaxy A5 2016 2900 mAh | Honor 8 3000 mAh | ZTE Axon 7 3250 mAh | |
|---|---|---|---|---|---|
| Battery runtime | -9% | 11% | -27% | -22% | |
| Reader / Idle (h) | 25 | 22.3 -11% | 38.7 55% | 24.8 -1% | 28.9 16% |
| H.264 (h) | 15.1 | 14.1 -7% | 11.2 -26% | 8.8 -42% | 11.7 -23% |
| WiFi v1.3 (h) | 13.3 | 14 5% | 10.4 -22% | 8.3 -38% | 6.9 -48% |
| Load (h) | 5.9 | 4.5 -24% | 8.1 37% | 4.3 -27% | 4.1 -31% |
Pros
Cons

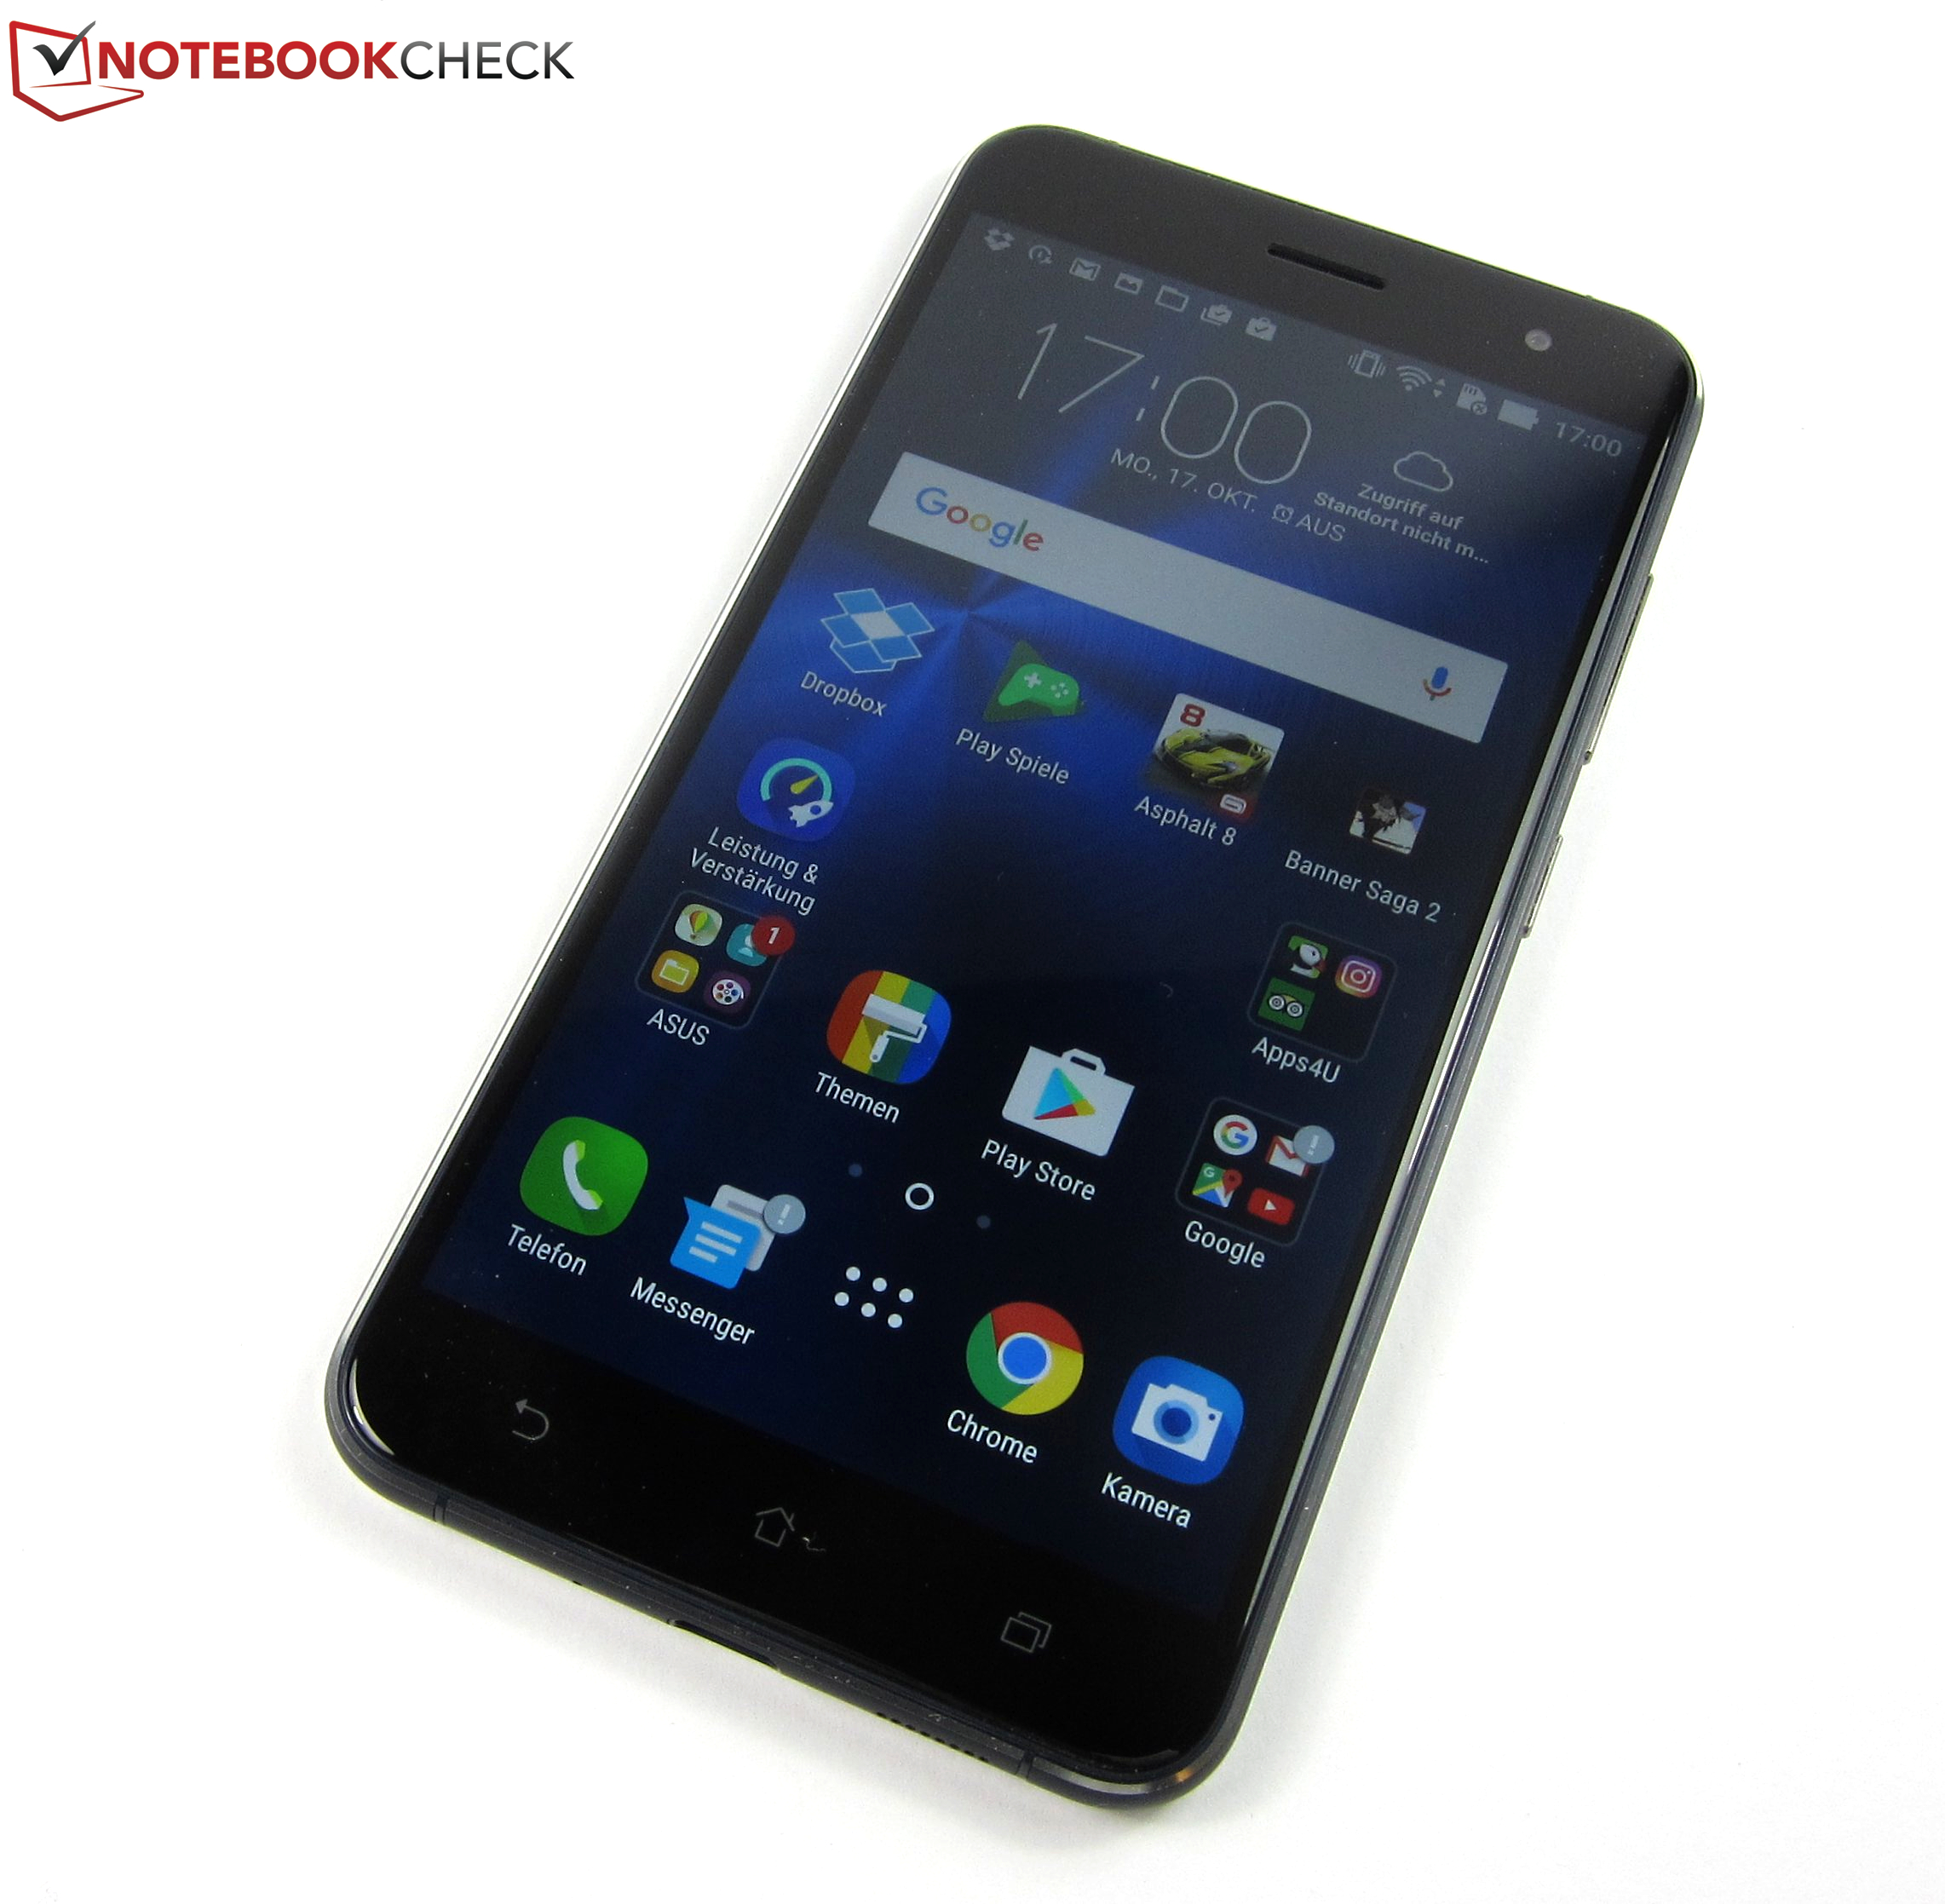
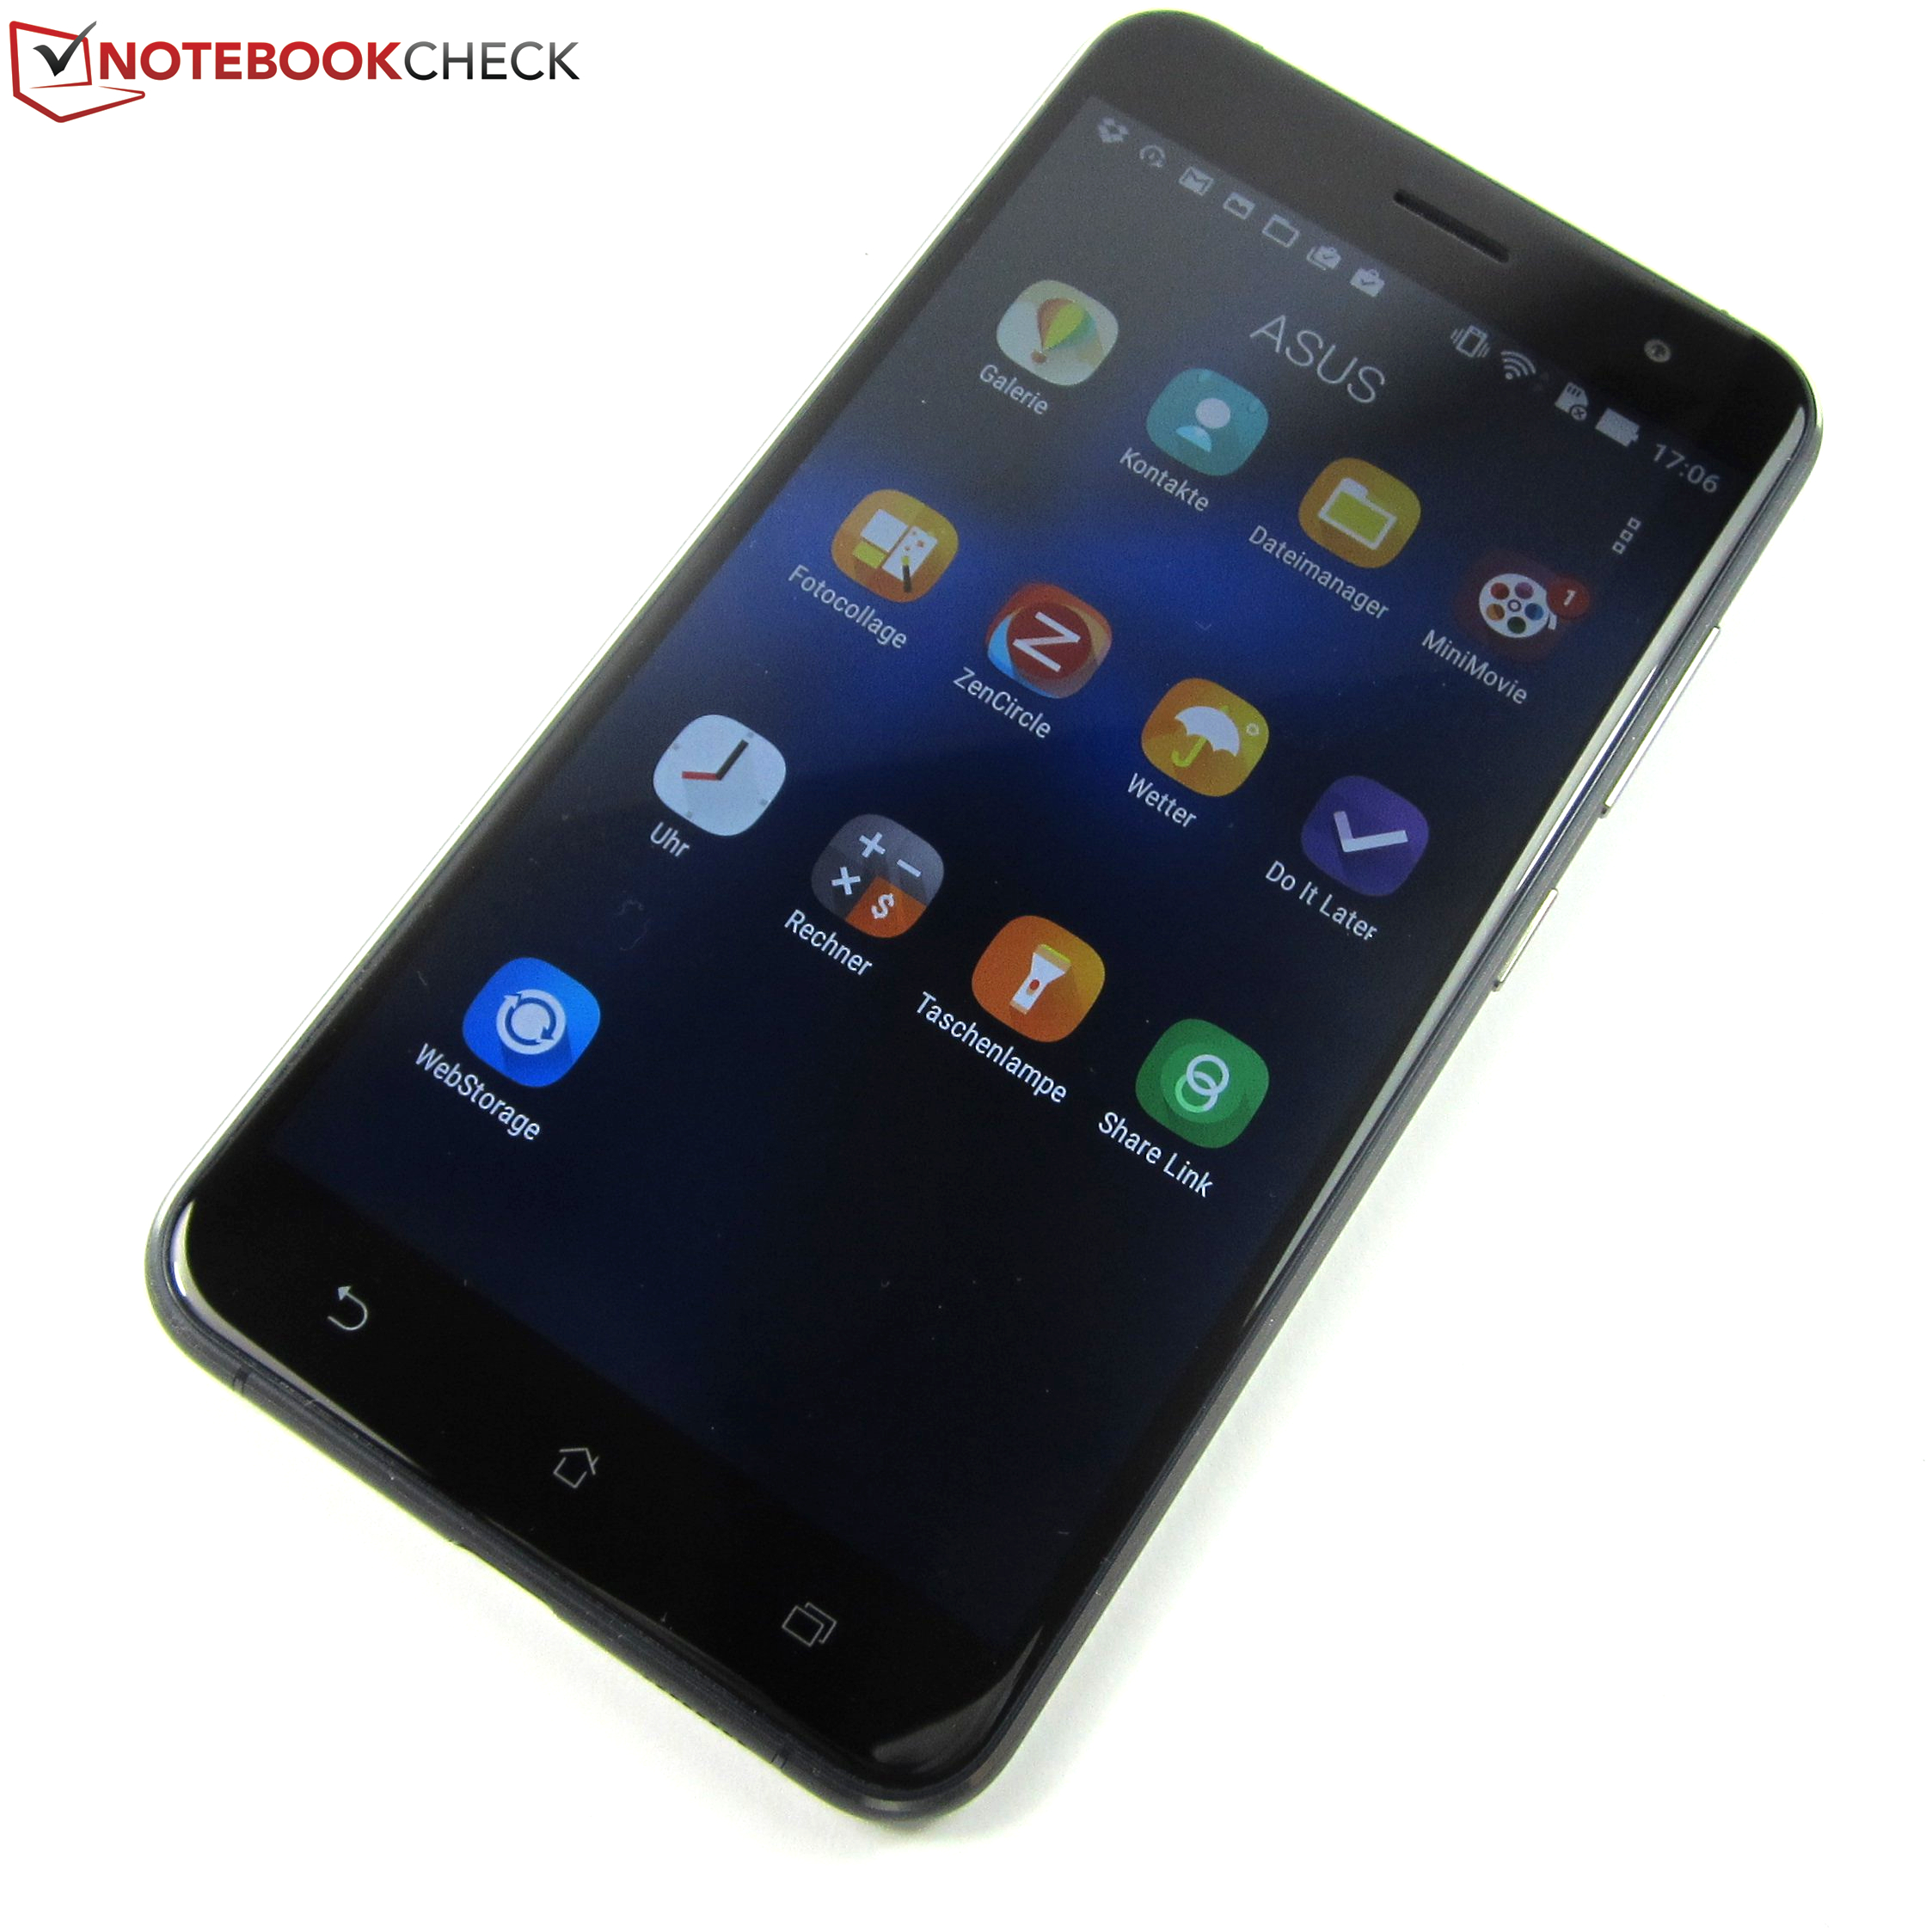
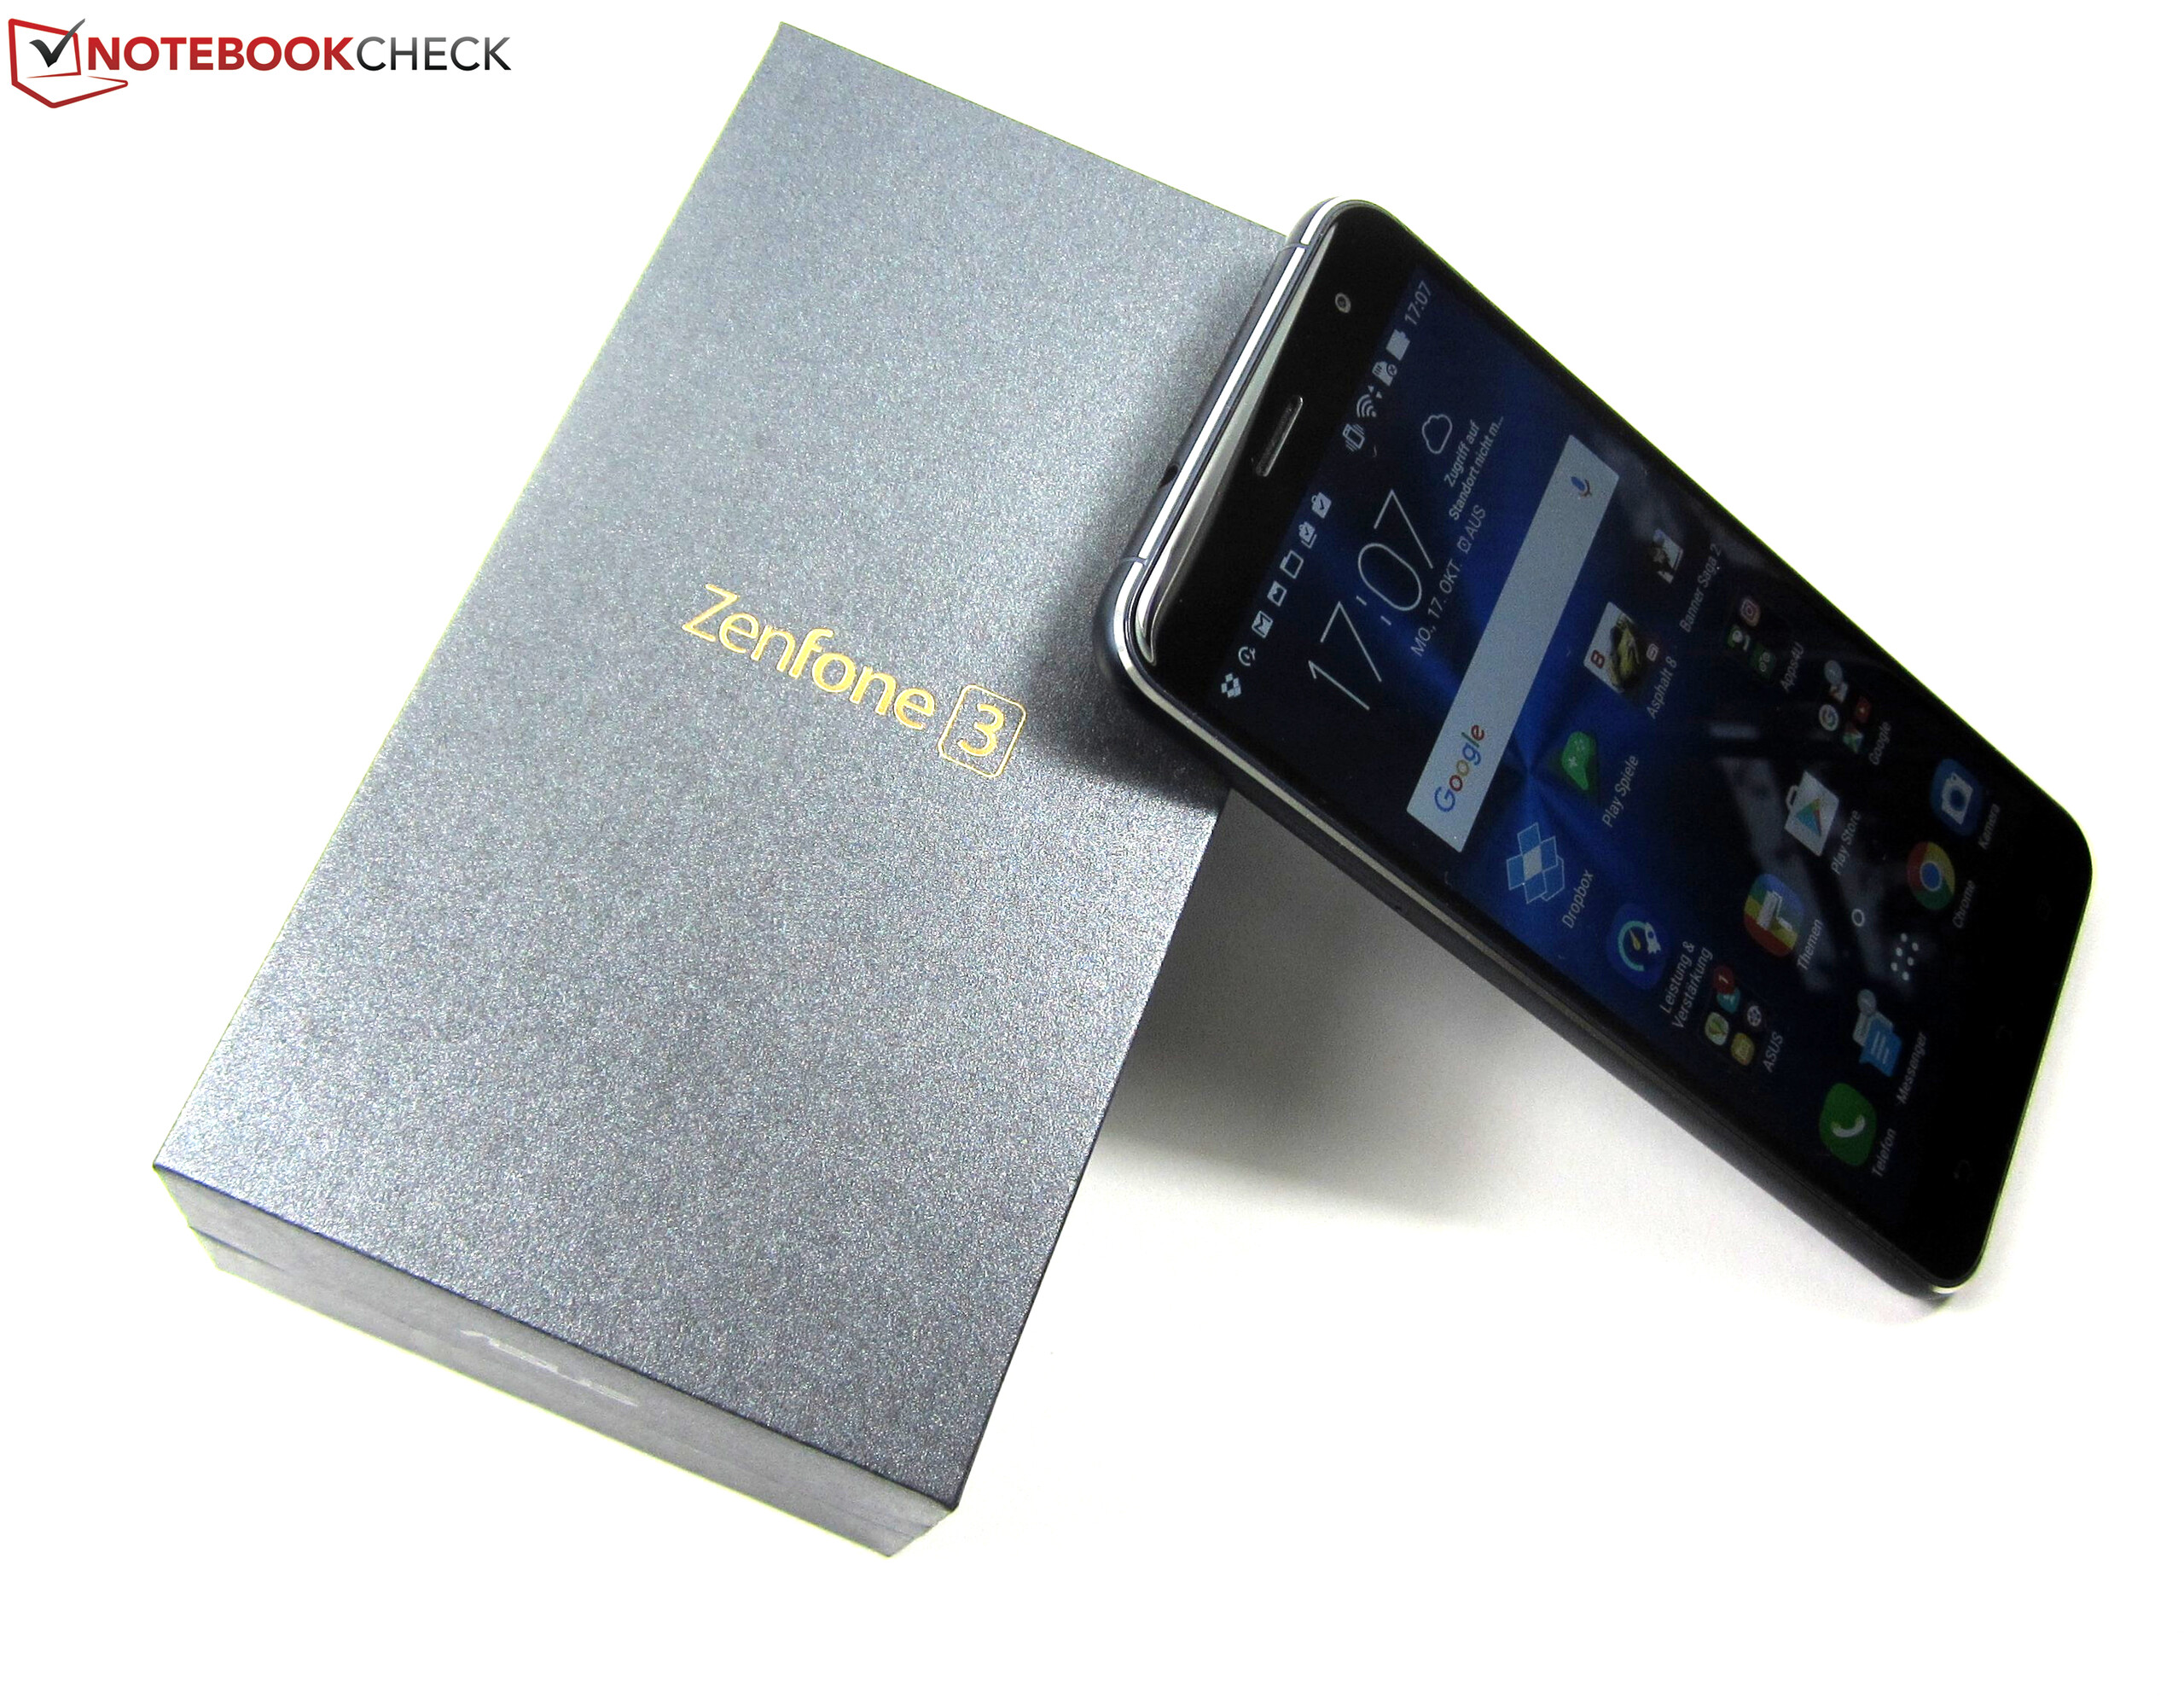
华硕在入门级产品线上提供了一台非常时尚的5.5寸手机,而且它的内在也是令人满意的。凭借着高通骁龙625八核处理器以及4GB运行内存,它拥有充足的性能来运行最新的应用和游戏。而且,它的全高清屏有着高亮度和广视角的特性,1600W像素的相机能够拍出令人满意的相片。它优秀的配置同样也包括了LTE,双SIM卡槽,带有QC技术的Type-C可反插USB接口,指纹识别。最新的安卓6.0.1 Marshmallow 操作系统,带有华硕新版ZenUI界面,使得这台成功的设备更加完美。不能不提的是它很好的电池续航能力以及较低的日常使用升温。
华硕的ZenFone 3是设计师的理想,这台中端手机看上去远远要比它的实际售价贵。
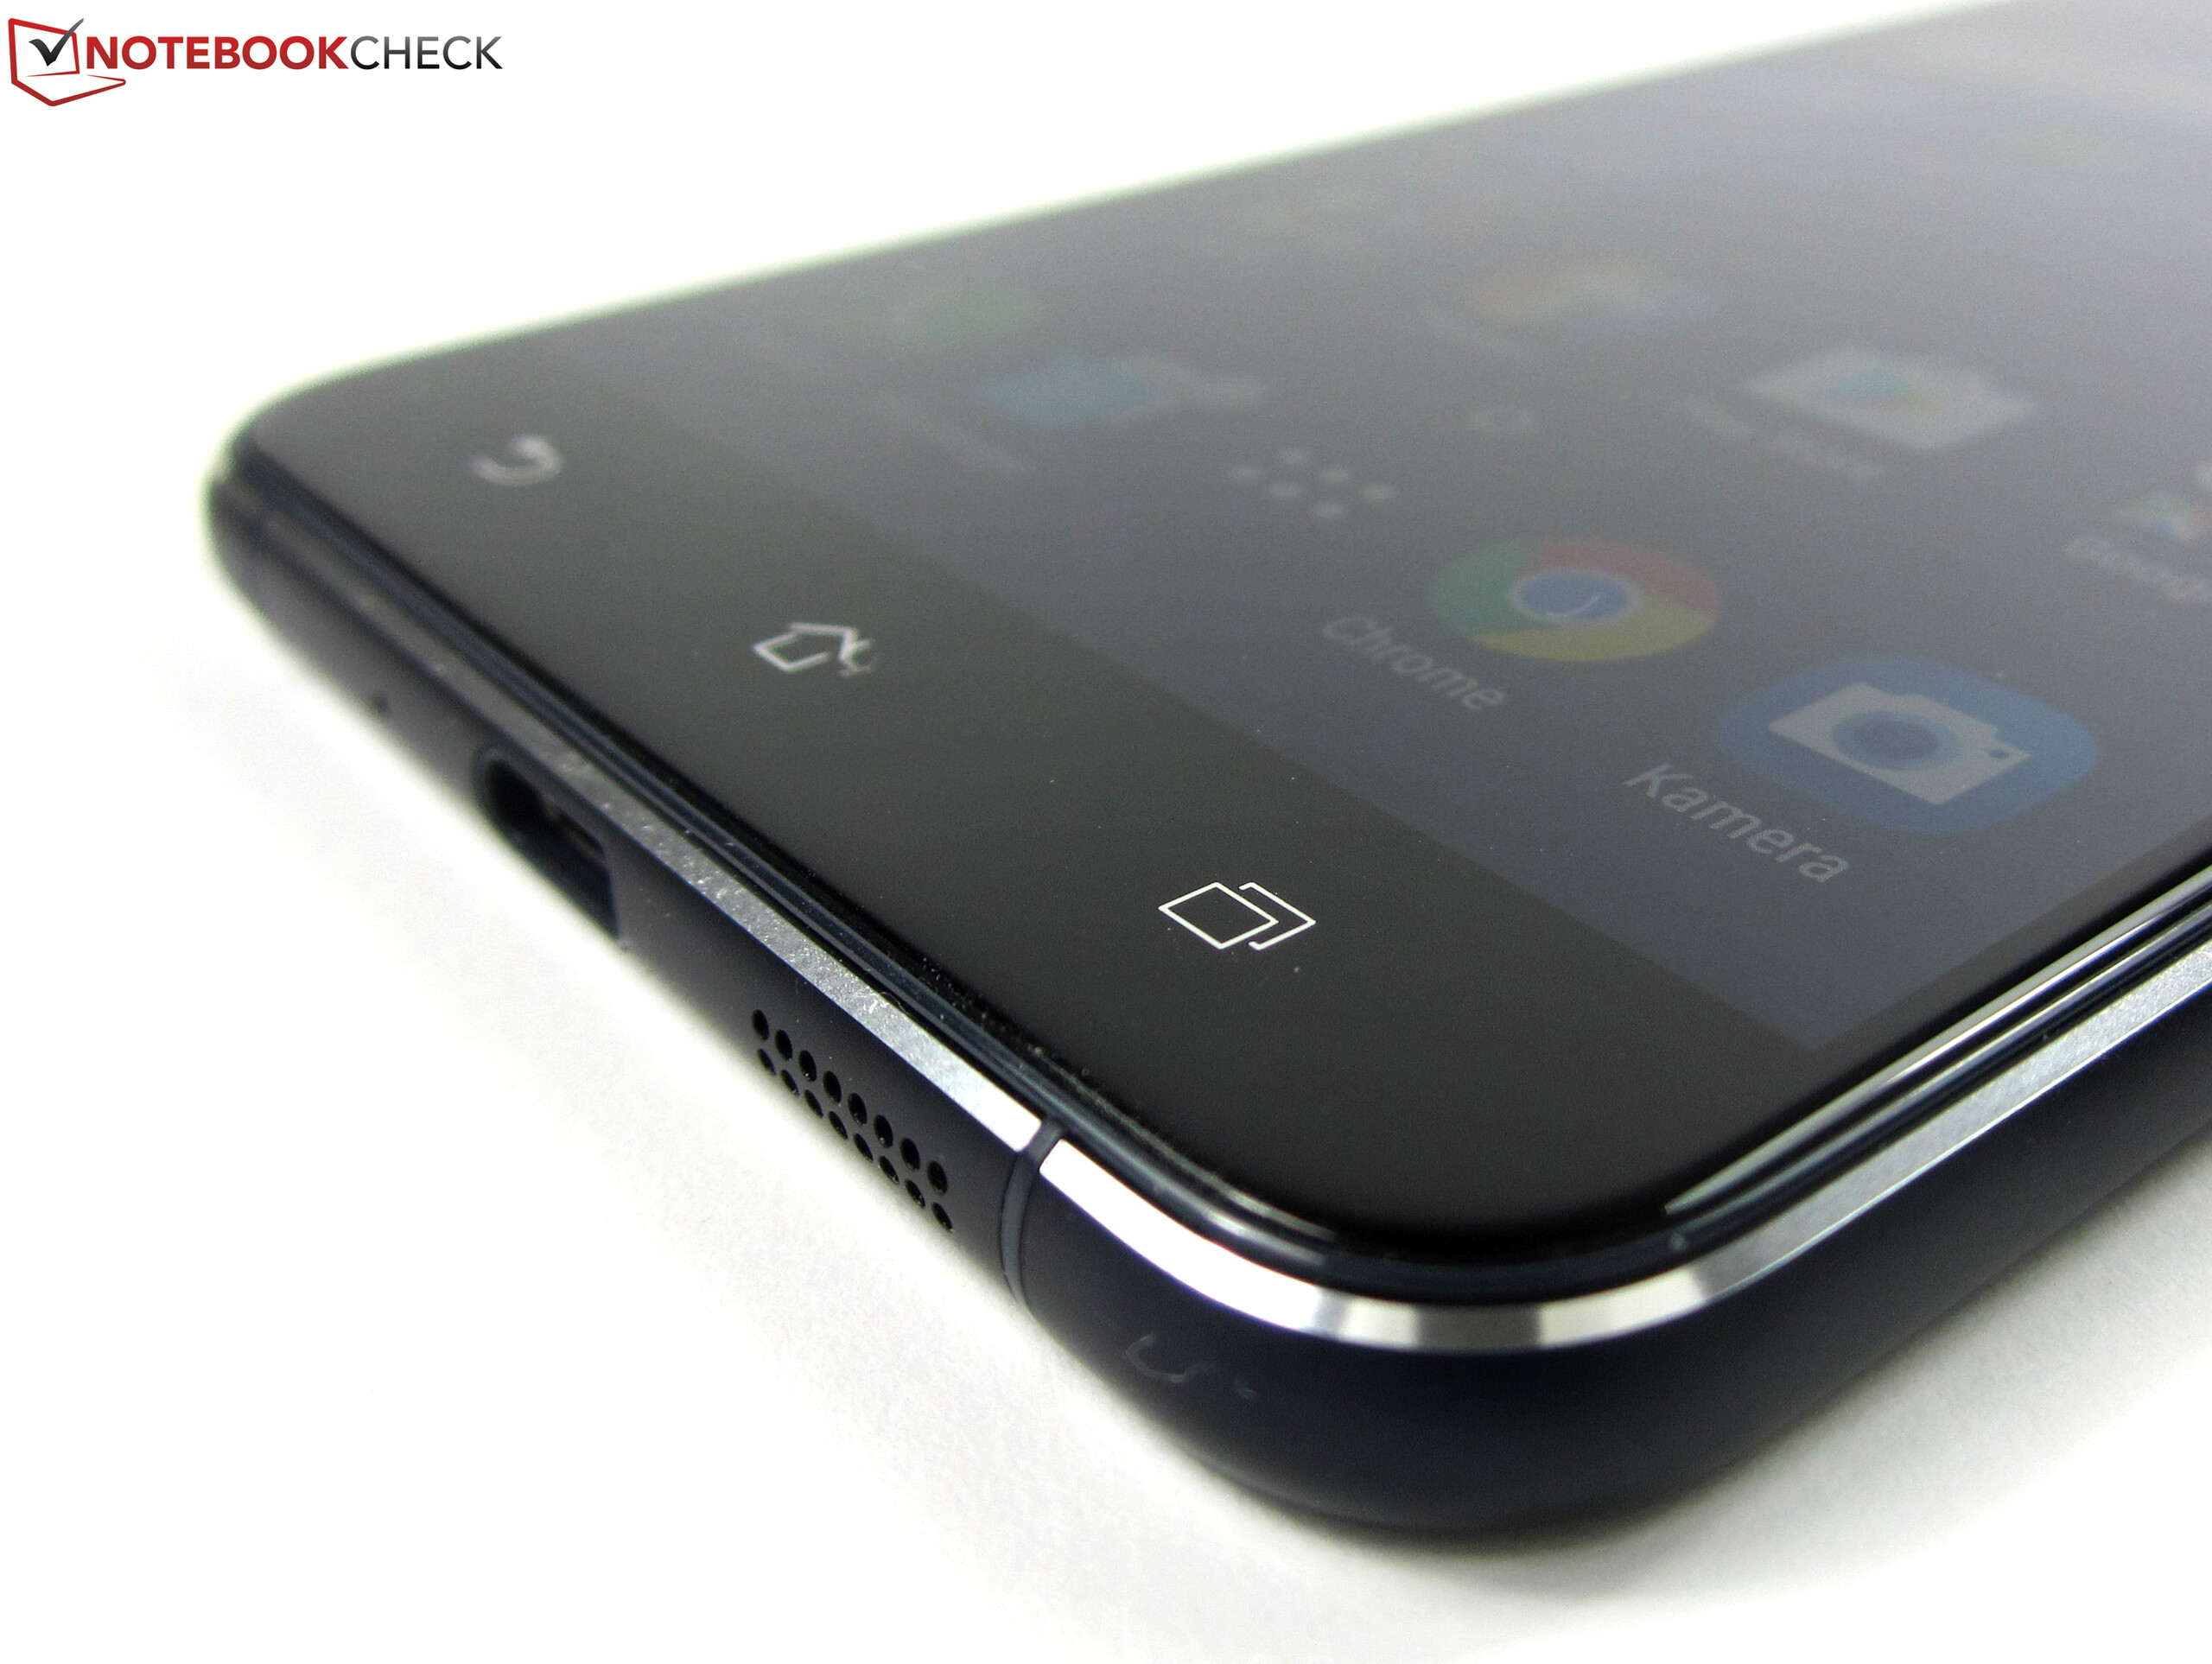
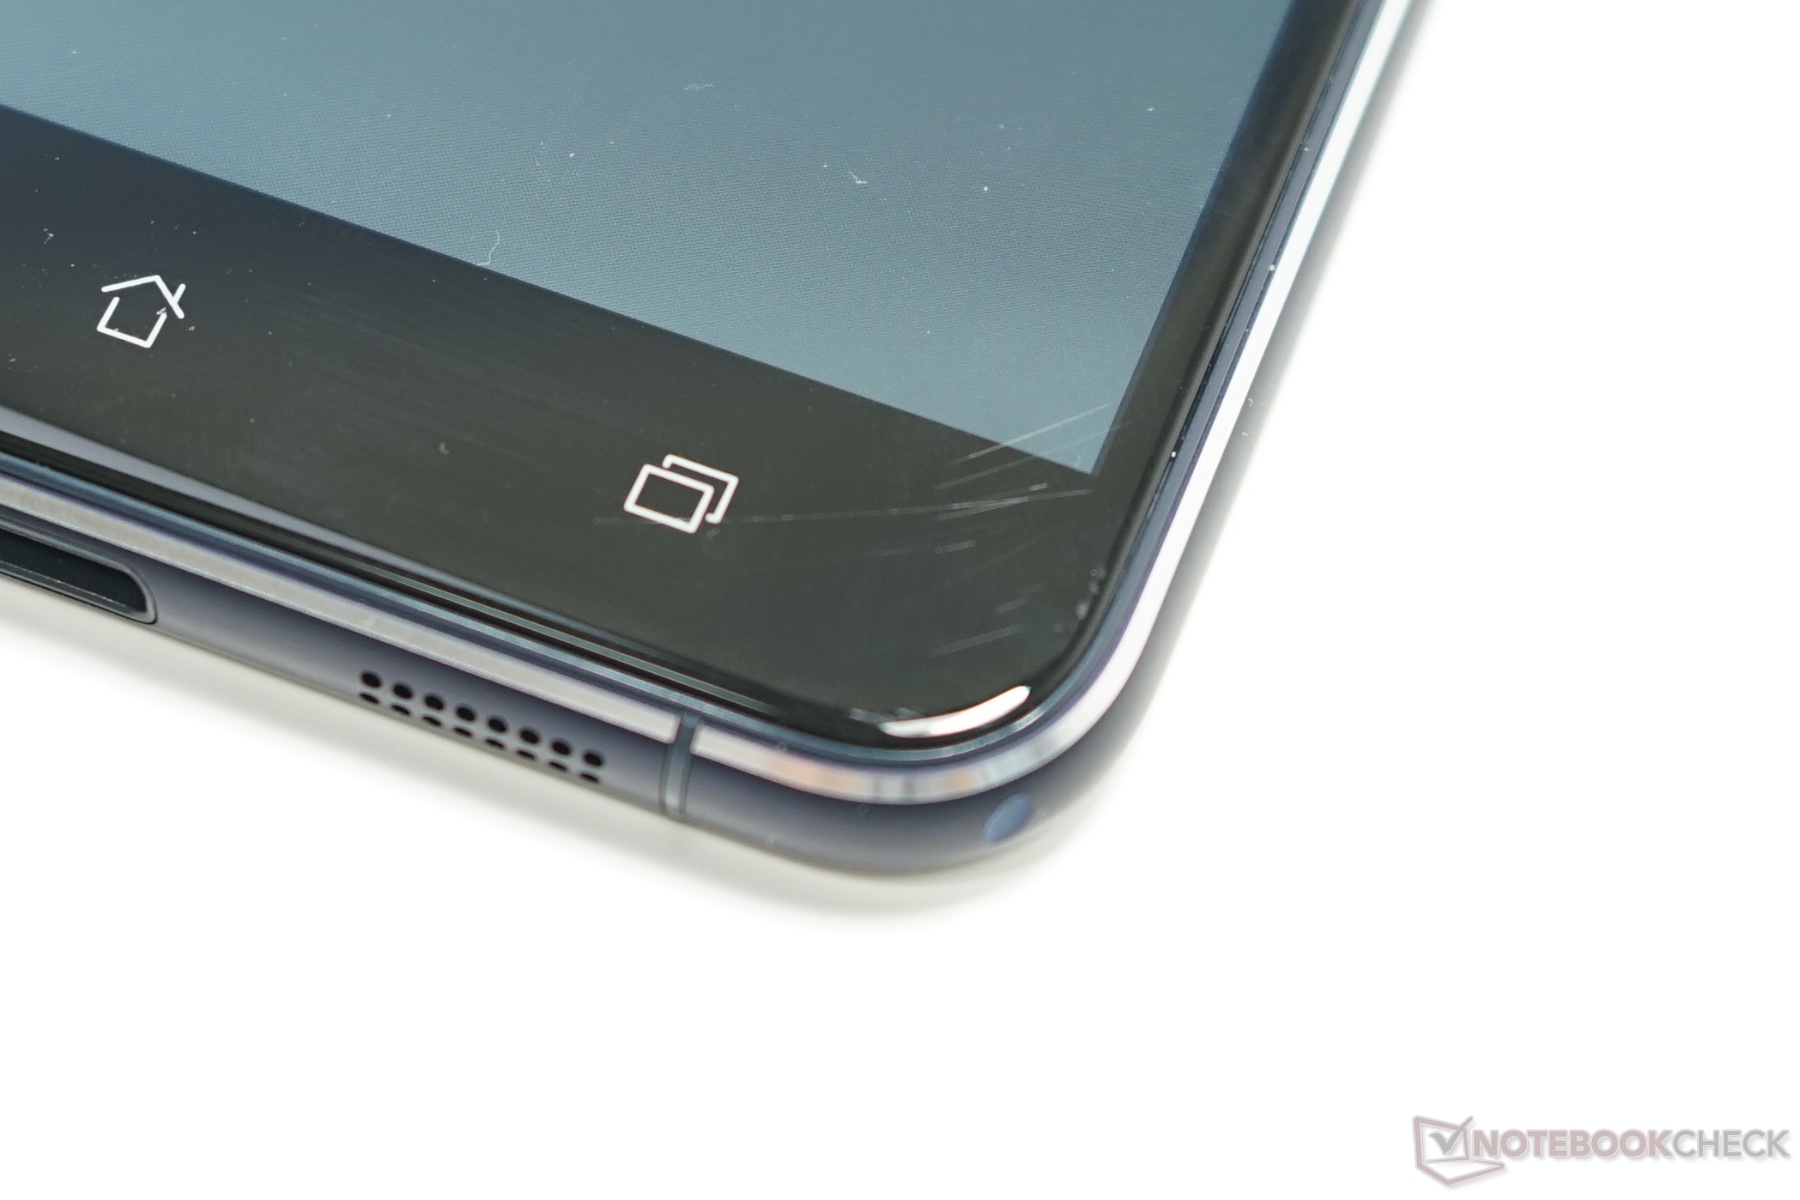
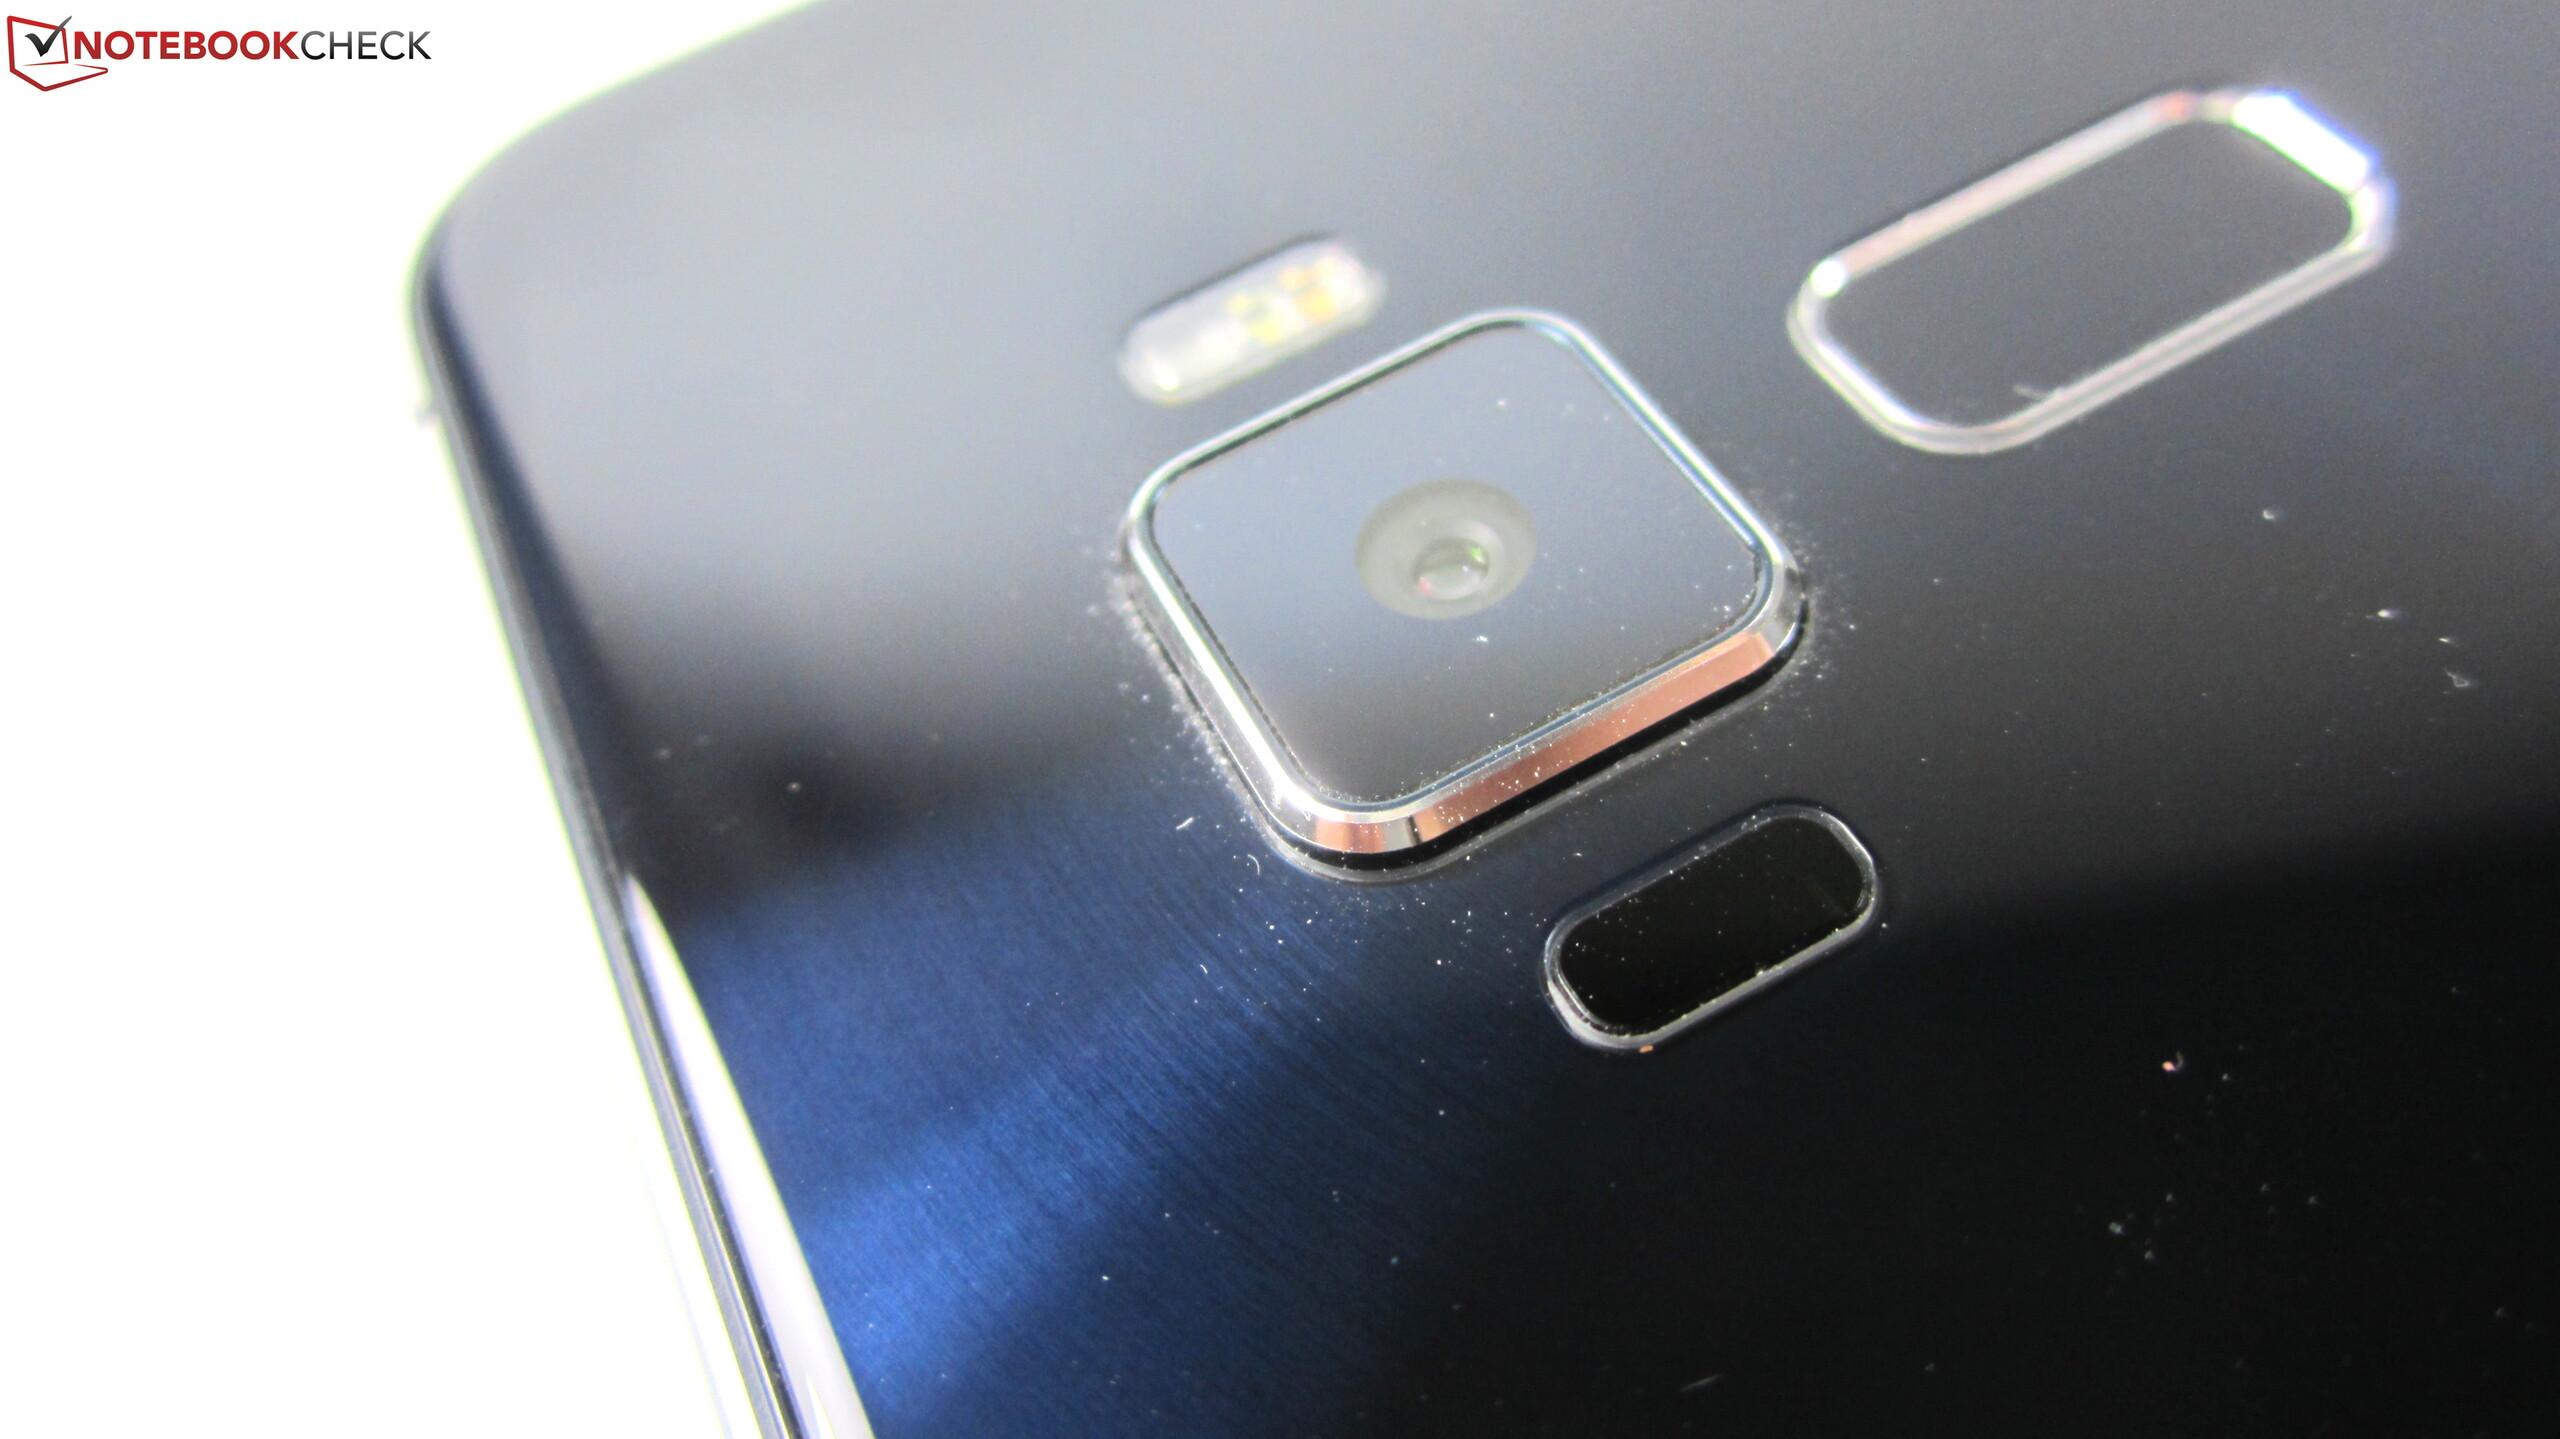
对于这台手机我们没有很多好去批评的。在屏幕的下方按键没有背光,Wi-Fi的速度偏慢。华硕对于软件的配置有些过多了,在手机中预装了很多没有必要的应用。在我们的测试中,我们无法将应用移动到micro-SD 卡中因为它们没法被格式化为内置存储。
注:本文是基于完整评测的缩减版本,阅读完整的英文评测,请点击这里。
Asus Zenfone 3 ZE552KL
- 10/21/2016 v5.1 (old)
Manuel Masiero