惠普 Pavilion x360 15-bk102ng 变形本简短评测

| SD Card Reader | |
| average JPG Copy Test (av. of 3 runs) | |
| HP Pavilion 15-bk001ng x360 | |
| Lenovo Yoga 510-15ISK | |
| HP Pavilion x360 15-bk102ng | |
| Lenovo Yoga 510-14IKB | |
| Dell Inspiron 15 5568 | |
| maximum AS SSD Seq Read Test (1GB) | |
| HP Pavilion x360 15-bk102ng | |
| HP Pavilion 15-bk001ng x360 | |
| Lenovo Yoga 510-14IKB | |
| Lenovo Yoga 510-15ISK | |
| Dell Inspiron 15 5568 | |
| Networking | |
| iperf Server (receive) TCP 1 m | |
| Dell Inspiron 15 5568 | |
| Lenovo Yoga 510-14IKB | |
| iperf Client (transmit) TCP 1 m | |
| Dell Inspiron 15 5568 | |
| Lenovo Yoga 510-14IKB | |
| iperf3 transmit AX12 | |
| HP Pavilion x360 15-bk102ng | |
| iperf3 receive AX12 | |
| HP Pavilion x360 15-bk102ng | |
| |||||||||||||||||||||||||
Brightness Distribution: 74 %
Center on Battery: 205 cd/m²
Contrast: 683:1 (Black: 0.3 cd/m²)
ΔE ColorChecker Calman: 7.2 | ∀{0.5-29.43 Ø4.72}
ΔE Greyscale Calman: 6.86 | ∀{0.09-98 Ø4.97}
59% sRGB (Argyll 1.6.3 3D)
38% AdobeRGB 1998 (Argyll 1.6.3 3D)
40.76% AdobeRGB 1998 (Argyll 3D)
59.2% sRGB (Argyll 3D)
39.45% Display P3 (Argyll 3D)
Gamma: 2.27
CCT: 6983 K
| HP Pavilion x360 15-bk102ng IPS, 1920x1080, 15.6" | HP Pavilion 15-bk001ng x360 IPS, 1920x1080, 15.6" | Lenovo Yoga 510-14IKB IPS, 1920x1080, 14" | Dell Inspiron 15 5568 IPS, 1920x1080, 15.6" | Lenovo Yoga 510-15ISK IPS, 1920x1080, 15.6" | |
|---|---|---|---|---|---|
| Display | 6% | 6% | -4% | 8% | |
| Display P3 Coverage (%) | 39.45 | 41.84 6% | 41.78 6% | 38.04 -4% | 42.58 8% |
| sRGB Coverage (%) | 59.2 | 62.7 6% | 62.9 6% | 57.1 -4% | 63.9 8% |
| AdobeRGB 1998 Coverage (%) | 40.76 | 43.25 6% | 43.17 6% | 39.3 -4% | 43.99 8% |
| Response Times | 30% | -23% | 20% | 2% | |
| Response Time Grey 50% / Grey 80% * (ms) | 55 ? | 30.8 ? 44% | 53 ? 4% | 42 ? 24% | 43.2 ? 21% |
| Response Time Black / White * (ms) | 26 ? | 22 ? 15% | 39 ? -50% | 22 ? 15% | 30.8 ? -18% |
| PWM Frequency (Hz) | 50 ? | 200 ? | 350 ? | ||
| Screen | 26% | 16% | 23% | 25% | |
| Brightness middle (cd/m²) | 205 | 225 10% | 243 19% | 266 30% | 254 24% |
| Brightness (cd/m²) | 191 | 210 10% | 248 30% | 249 30% | 230 20% |
| Brightness Distribution (%) | 74 | 85 15% | 91 23% | 85 15% | 86 16% |
| Black Level * (cd/m²) | 0.3 | 0.22 27% | 0.32 -7% | 0.26 13% | 0.26 13% |
| Contrast (:1) | 683 | 1023 50% | 759 11% | 1023 50% | 977 43% |
| Colorchecker dE 2000 * | 7.2 | 4.13 43% | 5.44 24% | 4.98 31% | 4.23 41% |
| Colorchecker dE 2000 max. * | 12.7 | 9.36 26% | 9.73 23% | 11.82 7% | 9.5 25% |
| Greyscale dE 2000 * | 6.86 | 2.53 63% | 4.74 31% | 2.68 61% | 2.87 58% |
| Gamma | 2.27 97% | 2.6 85% | 2.38 92% | 2.27 97% | 2.35 94% |
| CCT | 6983 93% | 6360 102% | 7799 83% | 6583 99% | 5965 109% |
| Color Space (Percent of AdobeRGB 1998) (%) | 38 | 39.8 5% | 39.6 4% | 36 -5% | 40.35 6% |
| Color Space (Percent of sRGB) (%) | 59 | 62.5 6% | 62.5 6% | 57 -3% | 63.48 8% |
| Total Average (Program / Settings) | 21% /
22% | -0% /
9% | 13% /
17% | 12% /
19% |
* ... smaller is better
Screen Flickering / PWM (Pulse-Width Modulation)
| Screen flickering / PWM detected | 50 Hz | ≤ 20 % brightness setting | 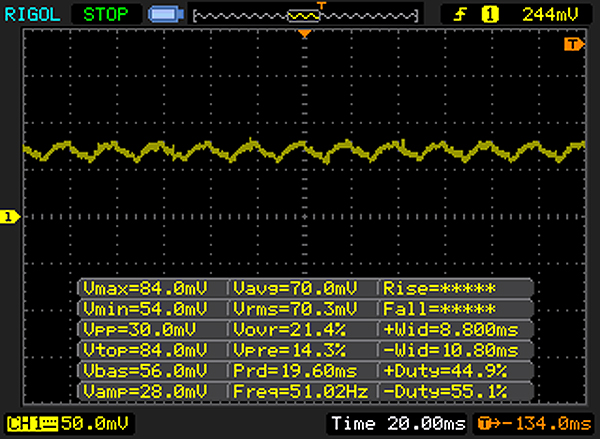 |
The display backlight flickers at 50 Hz (worst case, e.g., utilizing PWM) Flickering detected at a brightness setting of 20 % and below. There should be no flickering or PWM above this brightness setting. The frequency of 50 Hz is very low, so the flickering may cause eyestrain and headaches after extended use. In comparison: 52 % of all tested devices do not use PWM to dim the display. If PWM was detected, an average of 7781 (minimum: 5 - maximum: 343500) Hz was measured. | |||
Display Response Times
| ↔ Response Time Black to White | ||
|---|---|---|
| 26 ms ... rise ↗ and fall ↘ combined | ↗ 10 ms rise | 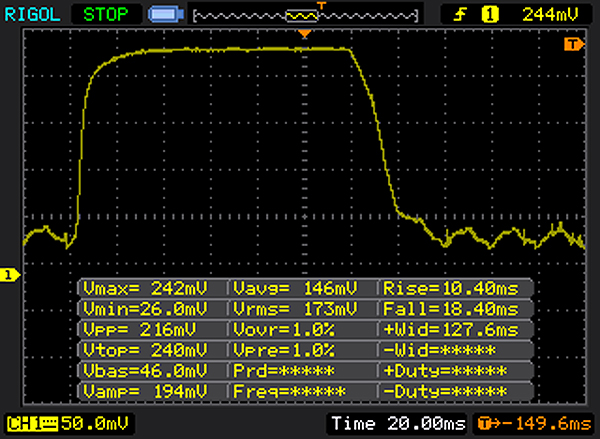 |
| ↘ 16 ms fall | ||
| The screen shows relatively slow response rates in our tests and may be too slow for gamers. In comparison, all tested devices range from 0.1 (minimum) to 240 (maximum) ms. » 62 % of all devices are better. This means that the measured response time is worse than the average of all tested devices (19.8 ms). | ||
| ↔ Response Time 50% Grey to 80% Grey | ||
| 55 ms ... rise ↗ and fall ↘ combined | ↗ 23 ms rise | 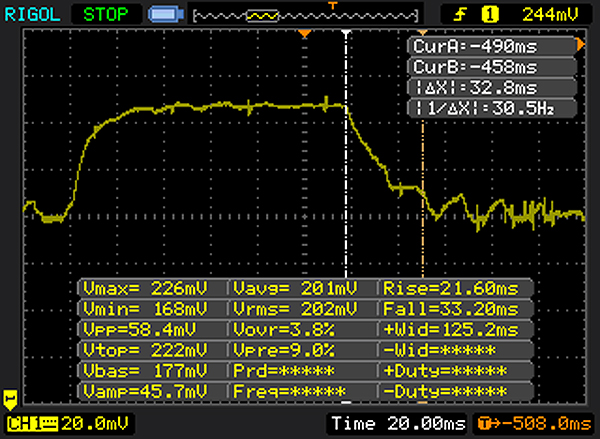 |
| ↘ 32 ms fall | ||
| The screen shows slow response rates in our tests and will be unsatisfactory for gamers. In comparison, all tested devices range from 0.165 (minimum) to 636 (maximum) ms. » 92 % of all devices are better. This means that the measured response time is worse than the average of all tested devices (31 ms). | ||
| Cinebench R10 | |
| Rendering Multiple CPUs 32Bit | |
| HP Pavilion x360 15-bk102ng | |
| Lenovo Yoga 510-15ISK | |
| HP Pavilion 15-bk001ng x360 | |
| Rendering Single 32Bit | |
| HP Pavilion x360 15-bk102ng | |
| Lenovo Yoga 510-15ISK | |
| HP Pavilion 15-bk001ng x360 | |
| Geekbench 3 | |
| 32 Bit Single-Core Score | |
| HP Pavilion x360 15-bk102ng | |
| Lenovo Yoga 510-15ISK | |
| 32 Bit Multi-Core Score | |
| HP Pavilion x360 15-bk102ng | |
| Lenovo Yoga 510-15ISK | |
| Geekbench 4.0 | |
| 64 Bit Single-Core Score | |
| HP Pavilion x360 15-bk102ng | |
| 64 Bit Multi-Core Score | |
| HP Pavilion x360 15-bk102ng | |
| JetStream 1.1 - 1.1 Total | |
| HP Pavilion x360 15-bk102ng | |
| Dell Inspiron 15 5568 | |
| Lenovo Yoga 510-15ISK | |
| PCMark 8 Home Score Accelerated v2 | 3173 points | |
Help | ||
| PCMark 8 - Home Score Accelerated v2 | |
| Lenovo Yoga 510-15ISK | |
| Dell Inspiron 15 5568 | |
| Lenovo Yoga 510-14IKB | |
| HP Pavilion x360 15-bk102ng | |
| HP Pavilion 15-bk001ng x360 | |

| HP Pavilion x360 15-bk102ng WDC Slim WD10SPCX-21KHST0 | HP Pavilion 15-bk001ng x360 WDC Slim WD10SPCX-21KHST0 | Lenovo Yoga 510-14IKB Samsung MZYTY256HDHP | Dell Inspiron 15 5568 Toshiba THNSNK256GCS8 | Lenovo Yoga 510-15ISK Liteonit CV3-DE256 | |
|---|---|---|---|---|---|
| CrystalDiskMark 3.0 | 6% | 11043% | 8268% | 8778% | |
| Read Seq (MB/s) | 102.4 | 106.9 4% | 518 406% | 458.6 348% | 487 376% |
| Write Seq (MB/s) | 102 | 106 4% | 476.5 367% | 270 165% | 450.7 342% |
| Read 512 (MB/s) | 31.37 | 33.01 5% | 408 1201% | 397.4 1167% | 384.5 1126% |
| Write 512 (MB/s) | 48.12 | 51.2 6% | 274.5 470% | 242 403% | 356.3 640% |
| Read 4k (MB/s) | 0.357 | 0.373 4% | 35.66 9889% | 19.88 5469% | 27.05 7477% |
| Write 4k (MB/s) | 1.047 | 1.097 5% | 106.7 10091% | 86.7 8181% | 63.7 5984% |
| Read 4k QD32 (MB/s) | 0.844 | 1.029 22% | 368.7 43585% | 275.3 32518% | 281.5 33253% |
| Write 4k QD32 (MB/s) | 1.098 | 1.055 -4% | 246.3 22332% | 197.6 17896% | 232 21029% |
| 3DMark 11 Performance | 1445 points | |
Help | ||
| 3DMark 11 - 1280x720 Performance GPU | |
| Lenovo Yoga 510-15ISK | |
| Lenovo Yoga 510-14IKB | |
| Dell Inspiron 15 5568 | |
| HP Pavilion x360 15-bk102ng | |
| HP Pavilion 15-bk001ng x360 | |
| low | med. | high | ultra | |
|---|---|---|---|---|
| BioShock Infinite (2013) | 39 | 22.6 | 18.2 | 5.8 |
Noise level
| Idle |
| 31.7 / 31.7 / 31.7 dB(A) |
| Load |
| 38.8 / 36.8 dB(A) |
 | ||
30 dB silent 40 dB(A) audible 50 dB(A) loud |
||
min: | ||
(+) The maximum temperature on the upper side is 29 °C / 84 F, compared to the average of 35.4 °C / 96 F, ranging from 19.6 to 60 °C for the class Convertible.
(+) The bottom heats up to a maximum of 32 °C / 90 F, compared to the average of 36.9 °C / 98 F
(+) In idle usage, the average temperature for the upper side is 22.3 °C / 72 F, compared to the device average of 30.3 °C / 87 F.
(+) The palmrests and touchpad are cooler than skin temperature with a maximum of 28 °C / 82.4 F and are therefore cool to the touch.
(±) The average temperature of the palmrest area of similar devices was 28 °C / 82.4 F (0 °C / 0 F).
HP Pavilion x360 15-bk102ng audio analysis
(-) | not very loud speakers (65 dB)
Bass 100 - 315 Hz
(-) | nearly no bass - on average 19.9% lower than median
(±) | linearity of bass is average (12.4% delta to prev. frequency)
Mids 400 - 2000 Hz
(+) | balanced mids - only 4.2% away from median
(±) | linearity of mids is average (7% delta to prev. frequency)
Highs 2 - 16 kHz
(+) | balanced highs - only 2.3% away from median
(+) | highs are linear (6.2% delta to prev. frequency)
Overall 100 - 16.000 Hz
(±) | linearity of overall sound is average (21.2% difference to median)
Compared to same class
» 57% of all tested devices in this class were better, 11% similar, 32% worse
» The best had a delta of 6%, average was 20%, worst was 57%
Compared to all devices tested
» 59% of all tested devices were better, 7% similar, 34% worse
» The best had a delta of 4%, average was 24%, worst was 134%
Apple MacBook 12 (Early 2016) 1.1 GHz audio analysis
(+) | speakers can play relatively loud (83.6 dB)
Bass 100 - 315 Hz
(±) | reduced bass - on average 11.3% lower than median
(±) | linearity of bass is average (14.2% delta to prev. frequency)
Mids 400 - 2000 Hz
(+) | balanced mids - only 2.4% away from median
(+) | mids are linear (5.5% delta to prev. frequency)
Highs 2 - 16 kHz
(+) | balanced highs - only 2% away from median
(+) | highs are linear (4.5% delta to prev. frequency)
Overall 100 - 16.000 Hz
(+) | overall sound is linear (10.2% difference to median)
Compared to same class
» 7% of all tested devices in this class were better, 2% similar, 91% worse
» The best had a delta of 5%, average was 18%, worst was 53%
Compared to all devices tested
» 5% of all tested devices were better, 1% similar, 94% worse
» The best had a delta of 4%, average was 24%, worst was 134%
| Off / Standby | |
| Idle | |
| Load |
|
Key:
min: | |
| Battery Runtime - WiFi Websurfing | |
| HP Pavilion 15-bk001ng x360 | |
| Lenovo Yoga 510-14IKB | |
| HP Pavilion x360 15-bk102ng | |
| Lenovo Yoga 510-15ISK | |
| Dell Inspiron 15 5568 | |
Pros
Cons
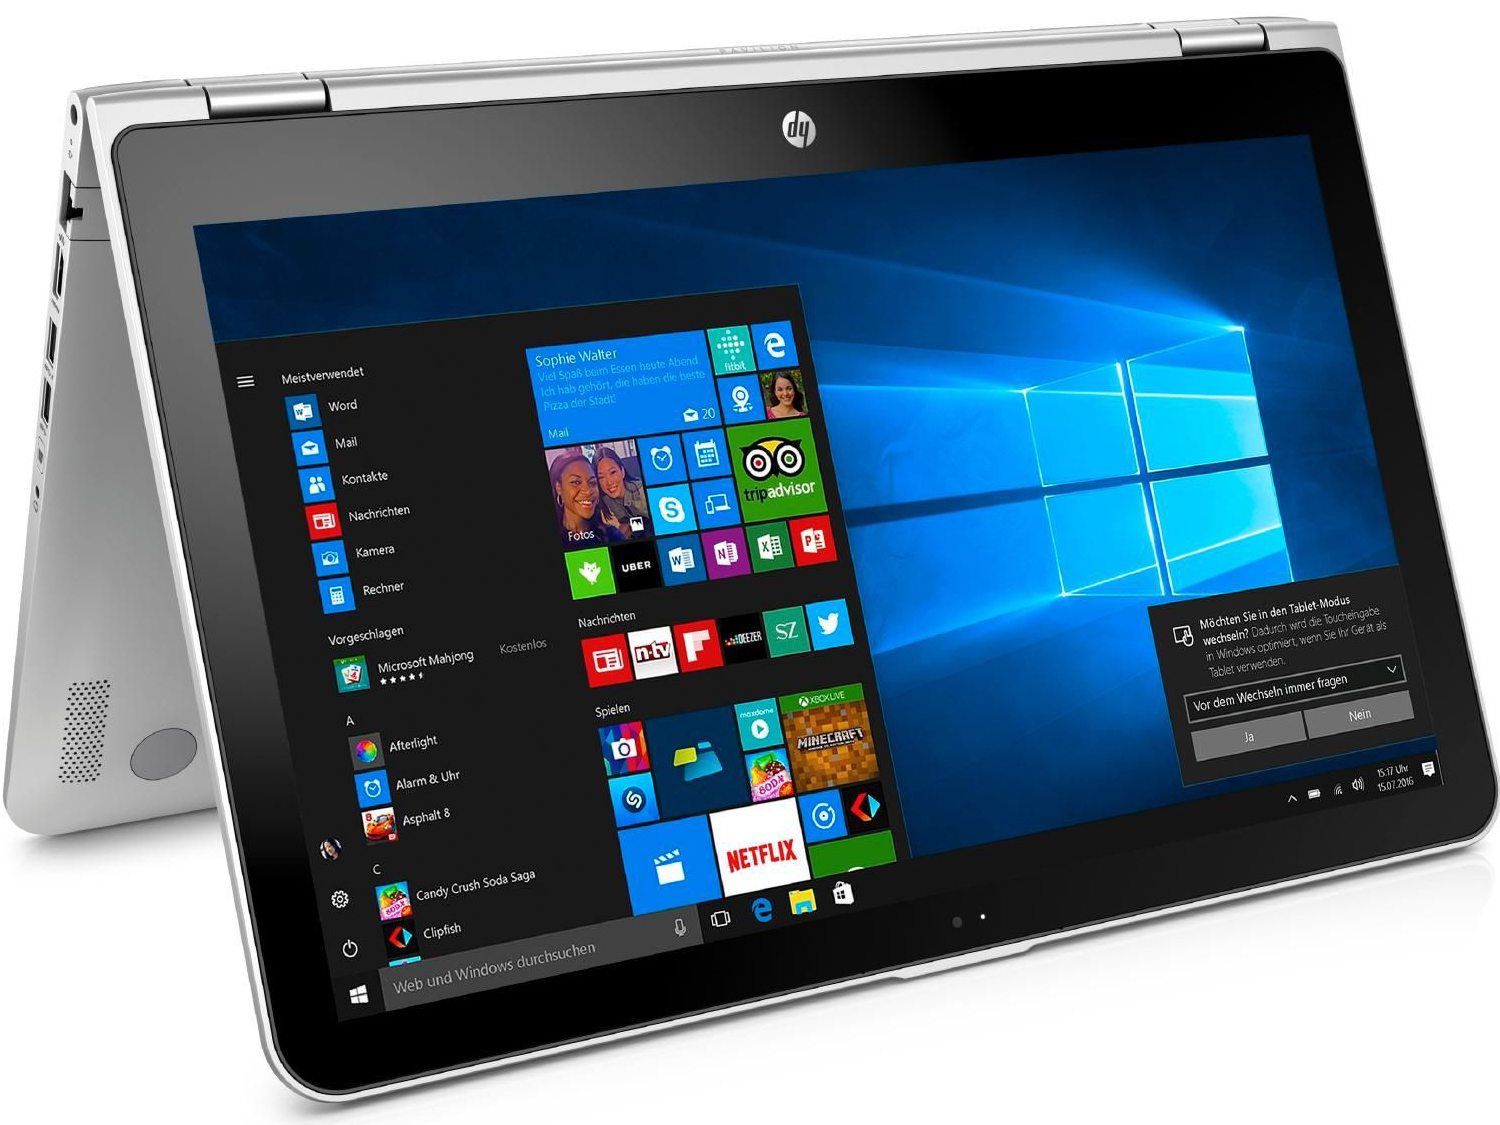
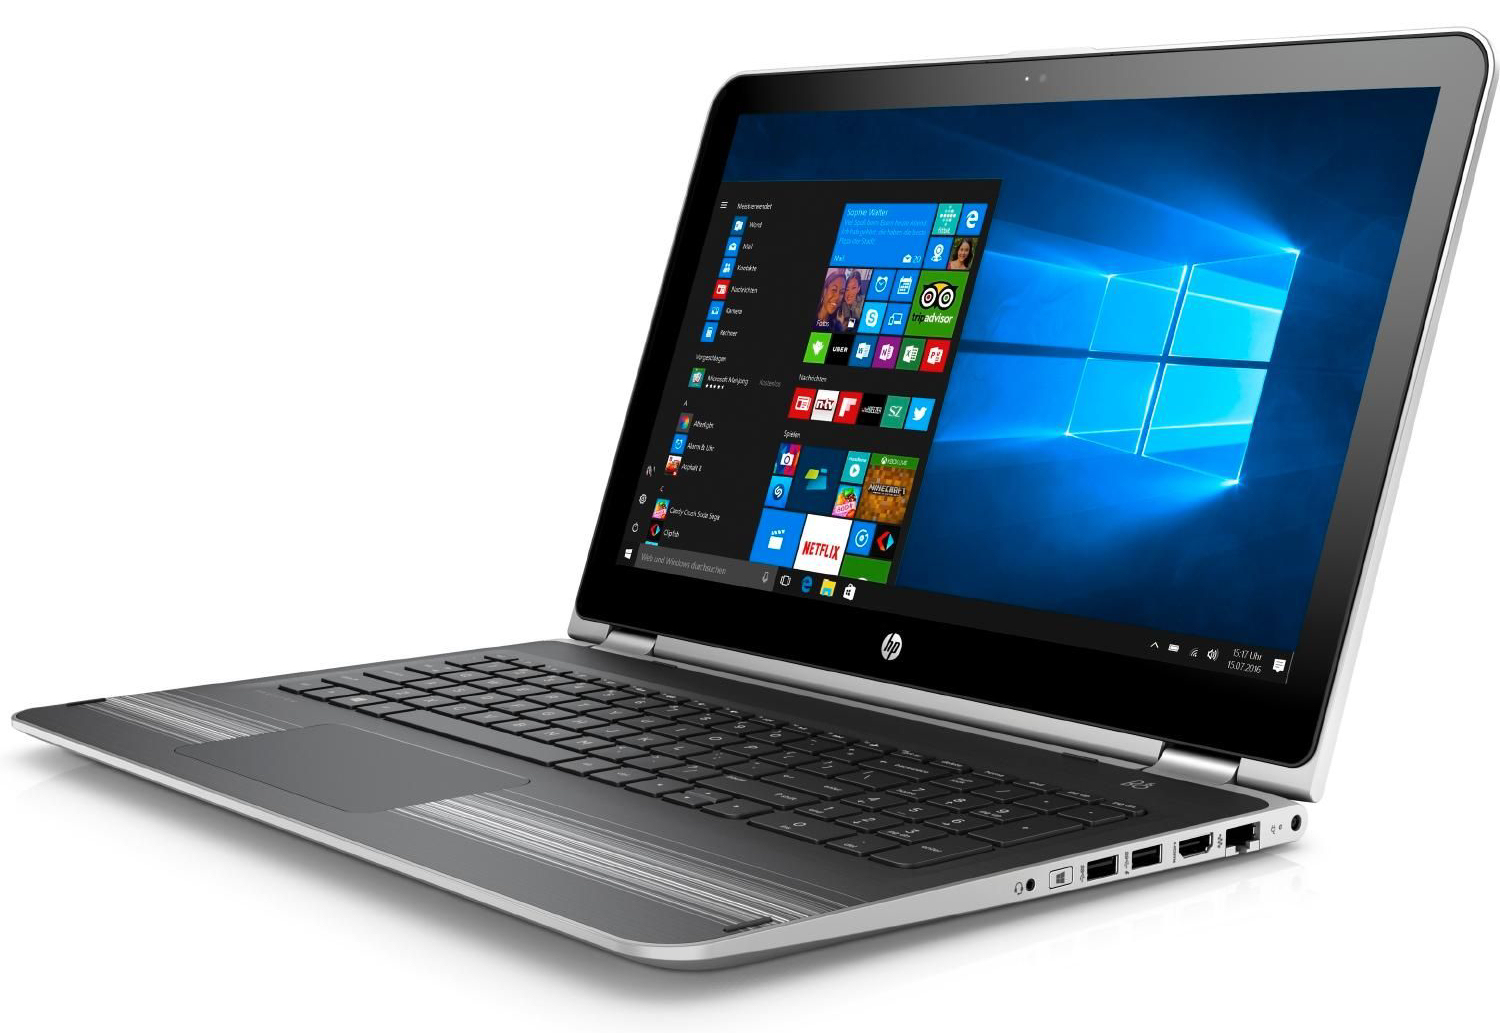
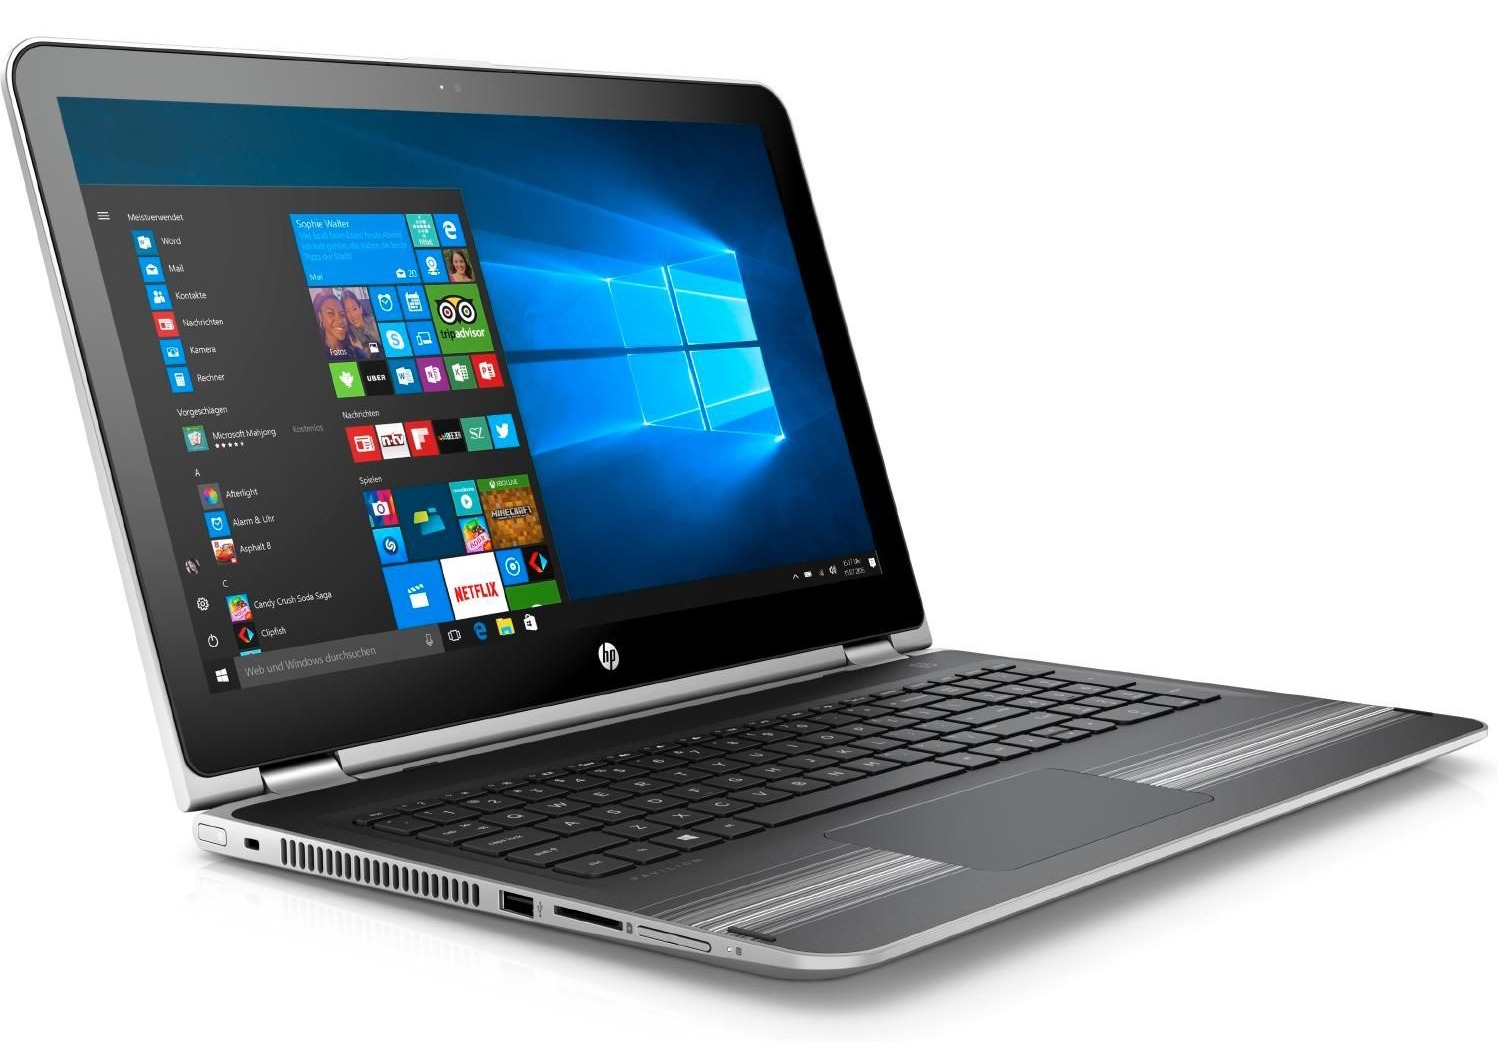
惠普提供了一个15.6英寸变形本,它有足够的性能应对大多数的任务。 低负载下,笔记本电脑运行安静,几乎不发烫。1TB机械硬盘提供了大量的存储空间,用户同样可以将其更换为SSD(打开外壳后)。 不存在维护底盖。 键盘很适合家庭使用。 在我们的无线局域网测试中,Pavilion的电池续航能力一般,这意味着它不是移动办公的理想选择。
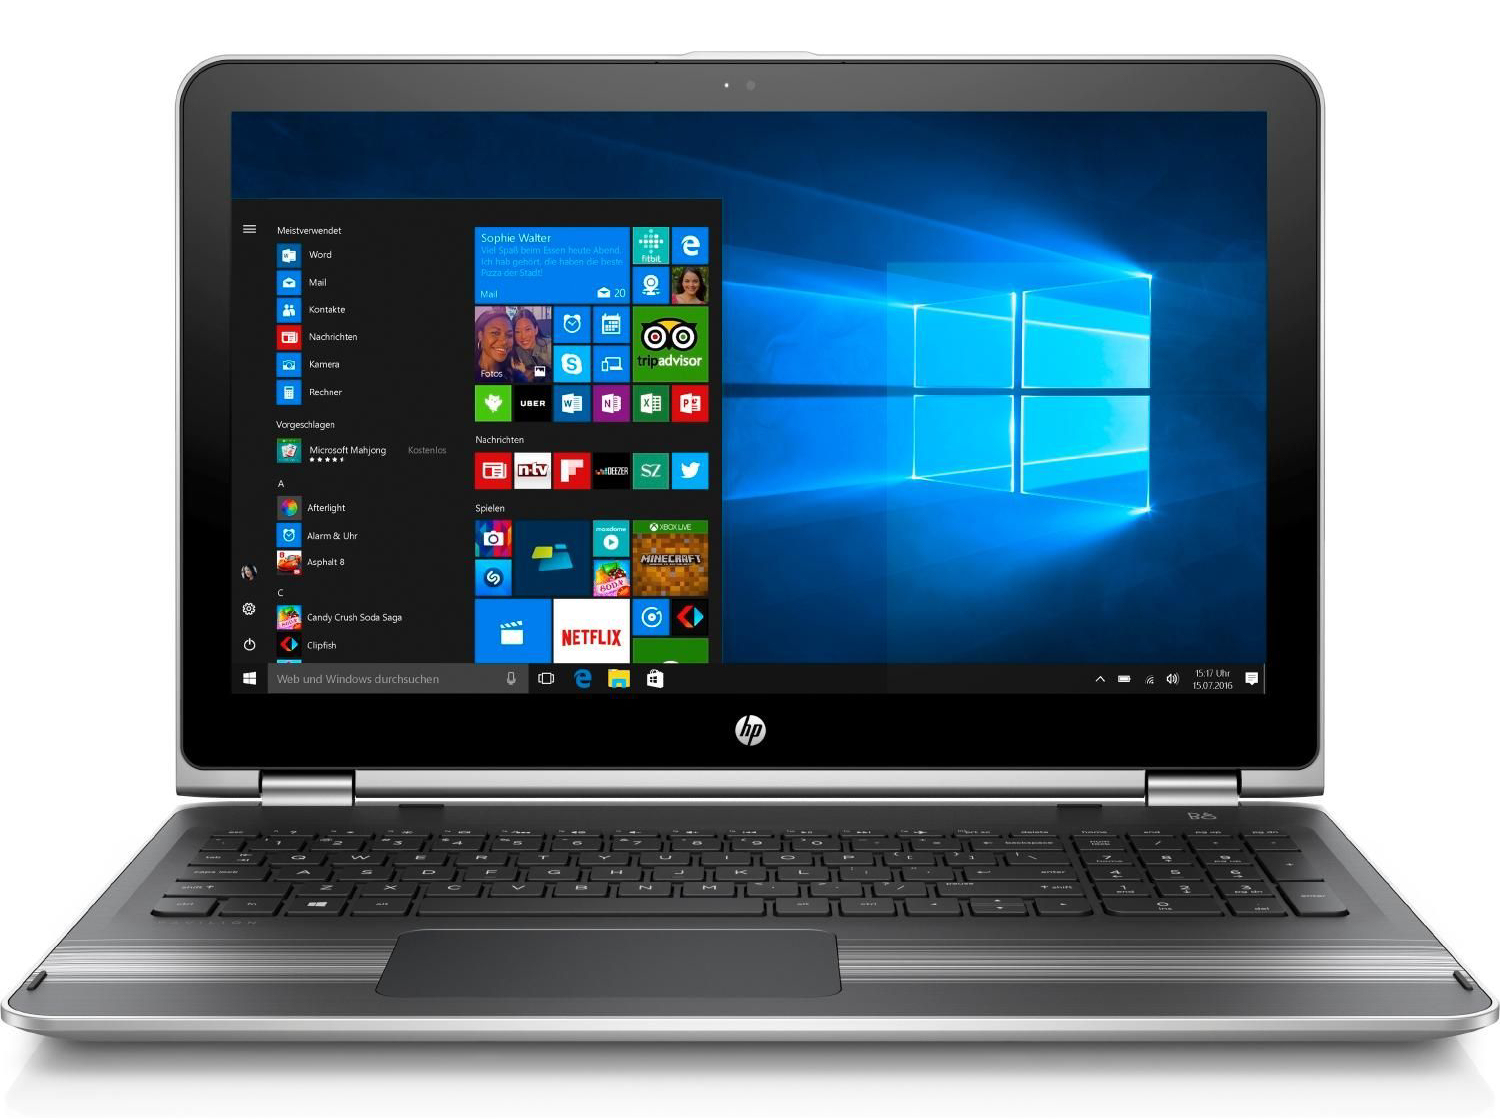
屏幕不错,但不算优秀。亮度低是该测试机型的致命弱点。
由于处于600欧元(约632美元)的价位,惠普必须展现更多。IPS屏幕具有良好的视角和优秀的对比度。键盘,触摸板和触摸屏运作良好。屏幕反应迅速,输入快捷,并可以用手指或触控笔操作。 尽管该机型有很多优点,但它的缺点仍会将把许多潜在的买家拒之门外。
注:本文是基于完整评测的缩减版本,阅读完整的英文评测,请点击这里。
HP Pavilion x360 15-bk102ng
- 12/22/2016 v6 (old)
Sascha Mölck