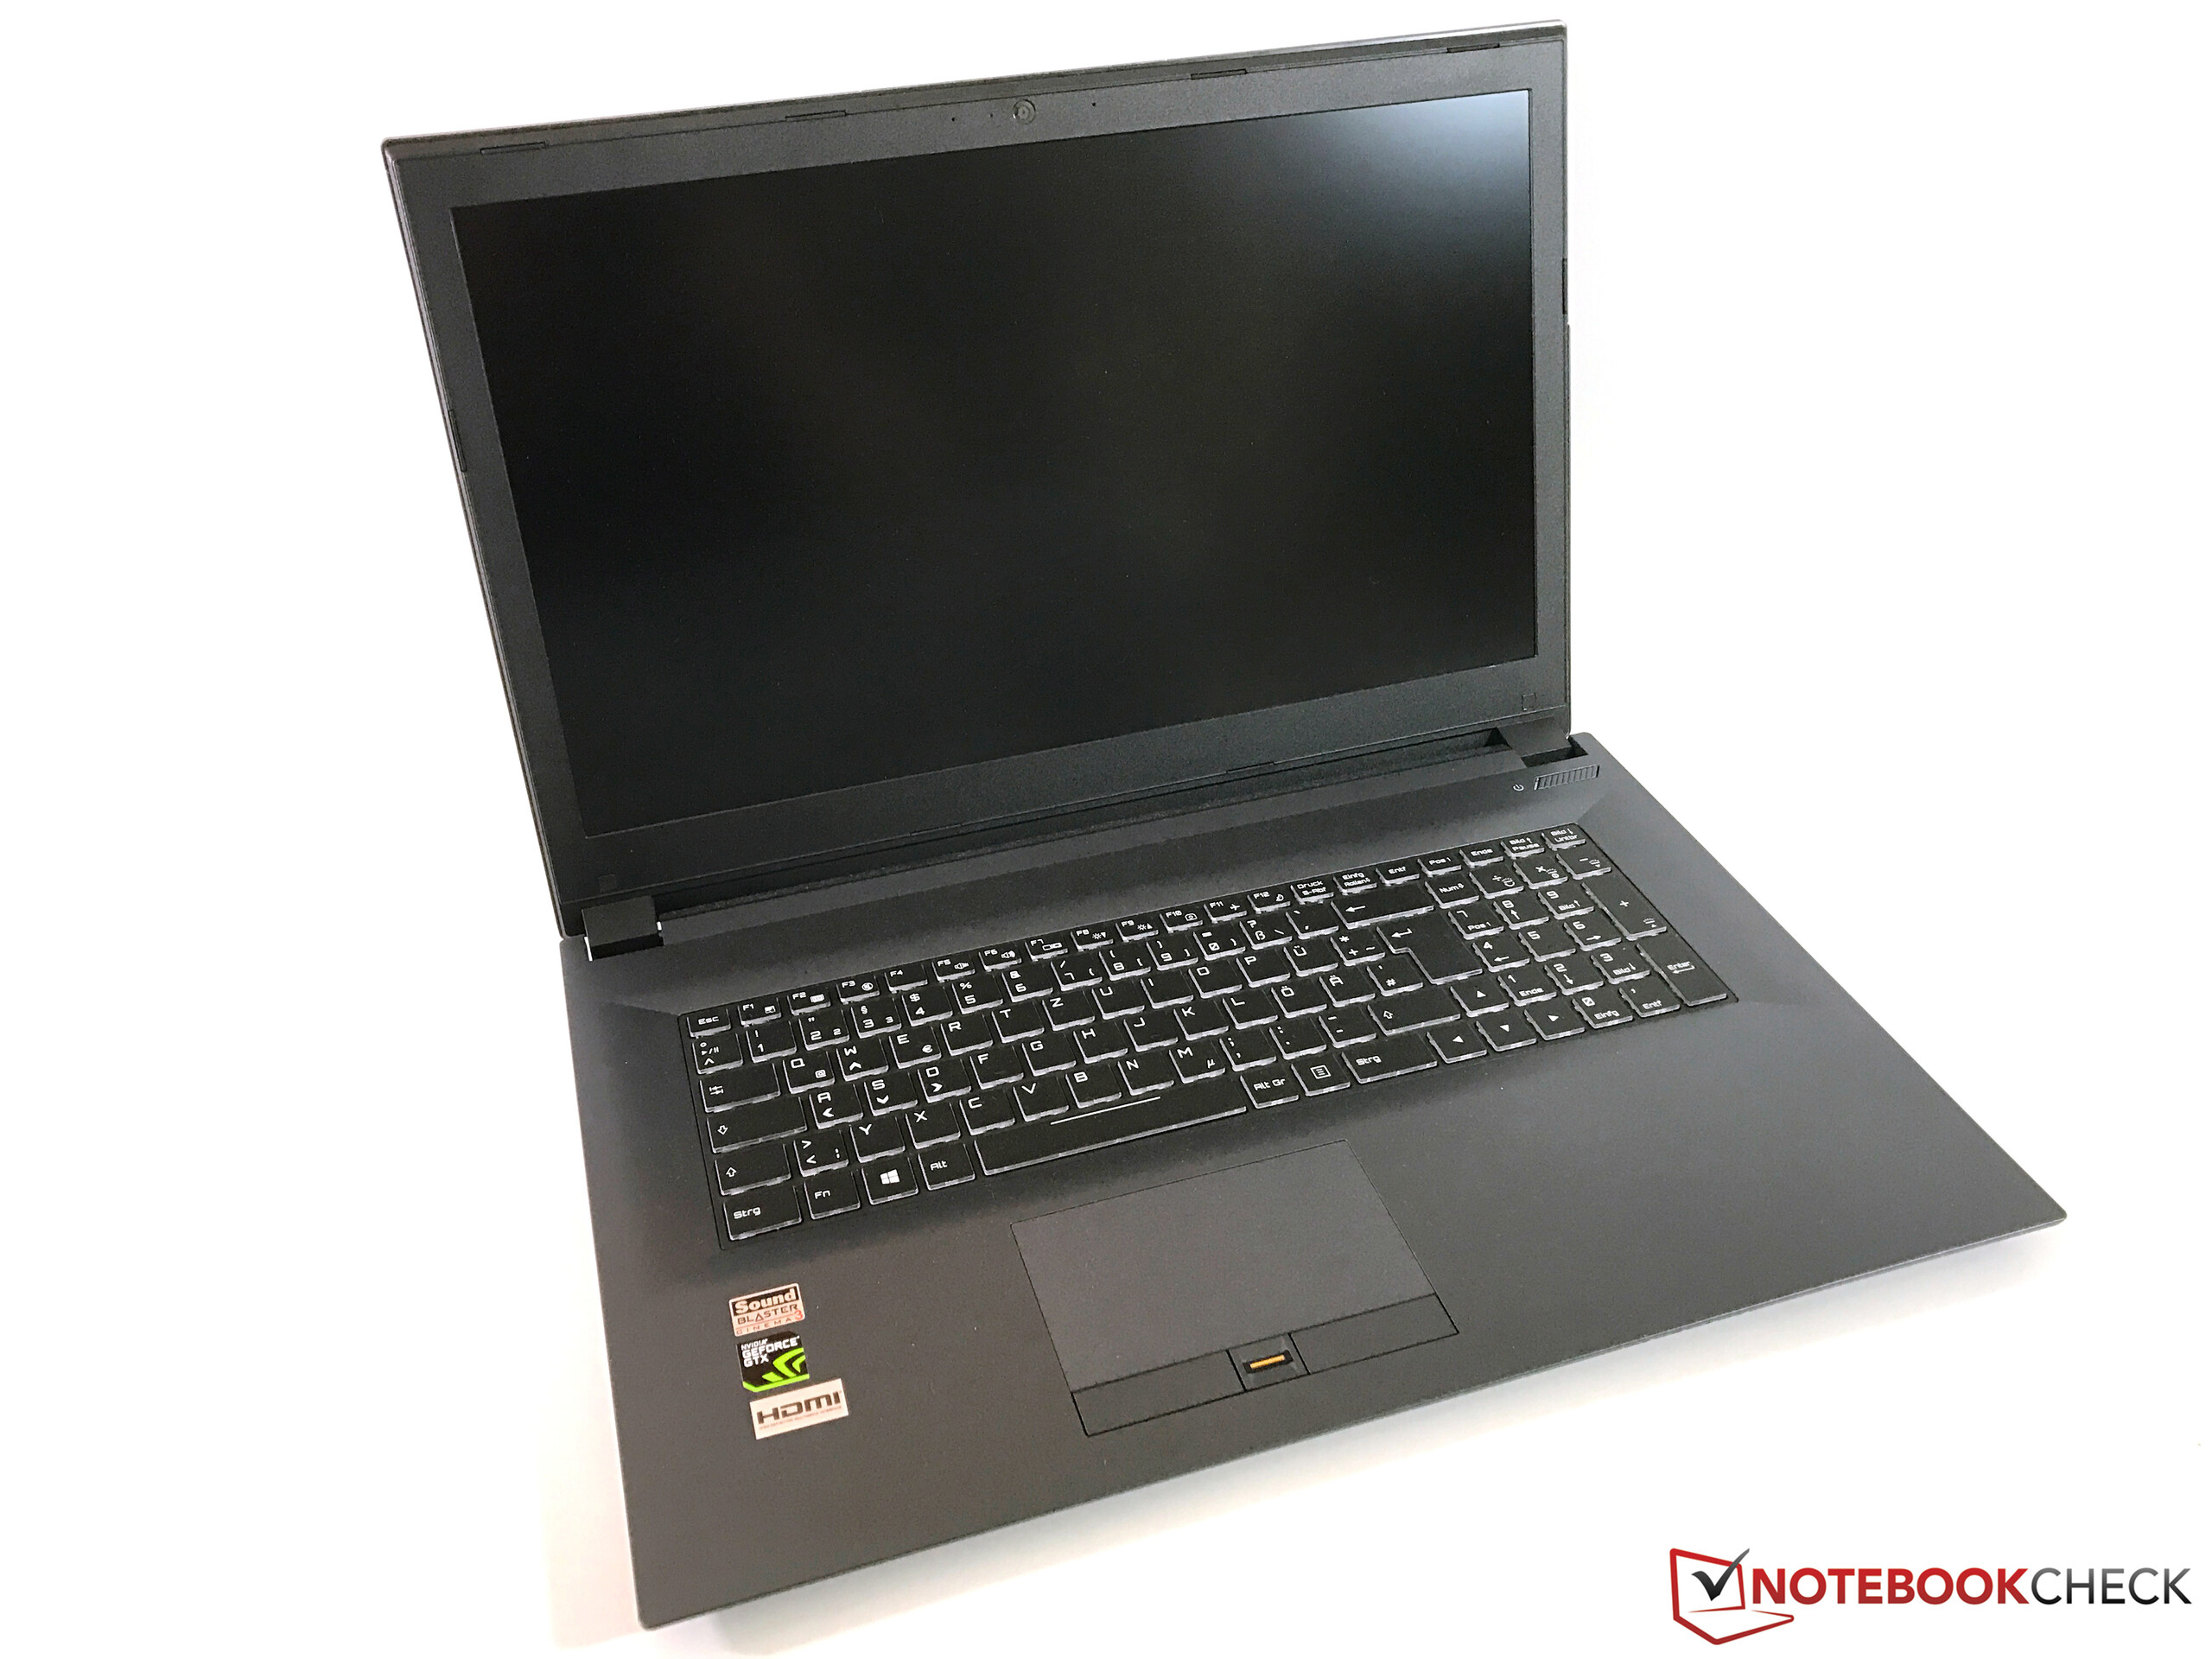
Nexoc G739 (Clevo N870HK1) 笔记本电脑简短评测

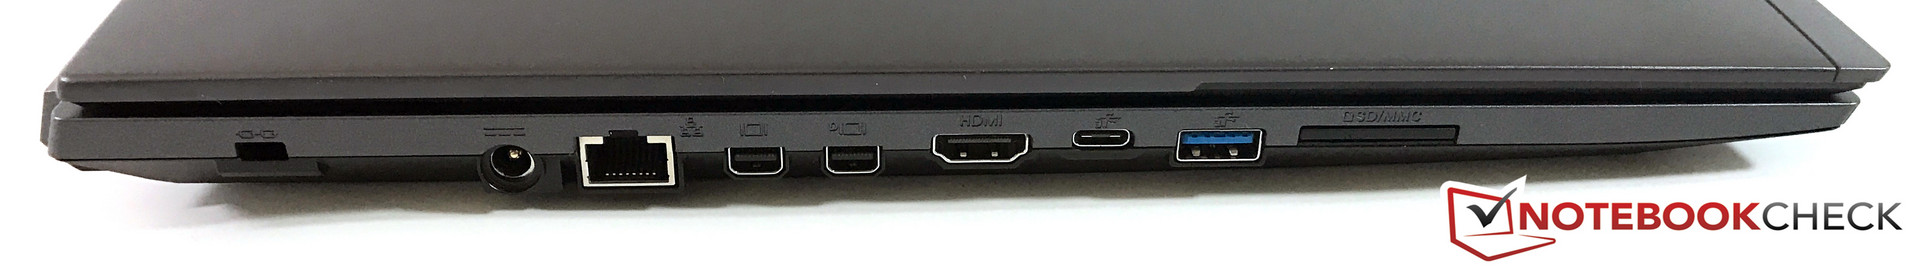
| SD Card Reader | |
| average JPG Copy Test (av. of 3 runs) | |
| Nexoc G739 | |
| Asus Strix GL753VD-GC045T | |
| HP Omen 17-w100ng | |
| Asus GL702VM-GC102D | |
| MSI GE72 7RE-046 | |
| maximum AS SSD Seq Read Test (1GB) | |
| HP Omen 17-w100ng | |
| Nexoc G739 | |
| Asus Strix GL753VD-GC045T | |
| Asus GL702VM-GC102D | |
| MSI GE72 7RE-046 | |
| Networking | |
| iperf3 transmit AX12 | |
| Asus Strix GL753VD-GC045T | |
| HP Omen 17-w100ng | |
| Nexoc G739 | |
| MSI GE72 7RE-046 | |
| iperf3 receive AX12 | |
| HP Omen 17-w100ng | |
| Asus Strix GL753VD-GC045T | |
| Nexoc G739 | |
| MSI GE72 7RE-046 | |
| |||||||||||||||||||||||||
Brightness Distribution: 85 %
Center on Battery: 312 cd/m²
Contrast: 1357:1 (Black: 0.23 cd/m²)
ΔE ColorChecker Calman: 4.19 | ∀{0.5-29.43 Ø4.73}
ΔE Greyscale Calman: 3.72 | ∀{0.09-98 Ø4.97}
91% sRGB (Argyll 1.6.3 3D)
59% AdobeRGB 1998 (Argyll 1.6.3 3D)
66.4% AdobeRGB 1998 (Argyll 3D)
91% sRGB (Argyll 3D)
66.7% Display P3 (Argyll 3D)
Gamma: 2.29
CCT: 7104 K
| Nexoc G739 CMN1738, 1920x1080, 17.3" | Asus Strix GL753VD-GC045T LP173WF4-SPF3, 1920x1080, 17.3" | HP Omen 17-w100ng LG Philips LGD046E, 1920x1080, 17.3" | MSI GE72 7RE-046 N173HHE-G32 (CMN1747), 1920x1080, 17.3" | Asus GL702VM-GC102D LG Philips LP173WF4-SPF3, 1920x1080, 17.3" | |
|---|---|---|---|---|---|
| Display | -4% | -3% | 25% | -6% | |
| Display P3 Coverage (%) | 66.7 | 67.1 1% | 67.2 1% | 90.7 36% | 65.1 -2% |
| sRGB Coverage (%) | 91 | 84.8 -7% | 86.6 -5% | 99.9 10% | 83.5 -8% |
| AdobeRGB 1998 Coverage (%) | 66.4 | 62 -7% | 63.3 -5% | 85.2 28% | 61.1 -8% |
| Response Times | 12% | 17% | 54% | 17% | |
| Response Time Grey 50% / Grey 80% * (ms) | 45 ? | 33.2 ? 26% | 35 ? 22% | 27 ? 40% | 38 ? 16% |
| Response Time Black / White * (ms) | 28 ? | 28.8 ? -3% | 25 ? 11% | 9 ? 68% | 23 ? 18% |
| PWM Frequency (Hz) | 450 ? | ||||
| Screen | -21% | -6% | -16% | -35% | |
| Brightness middle (cd/m²) | 312 | 349 12% | 342 10% | 253 -19% | 326 4% |
| Brightness (cd/m²) | 304 | 337 11% | 331 9% | 230 -24% | 312 3% |
| Brightness Distribution (%) | 85 | 91 7% | 84 -1% | 86 1% | 91 7% |
| Black Level * (cd/m²) | 0.23 | 0.58 -152% | 0.32 -39% | 0.24 -4% | 0.5 -117% |
| Contrast (:1) | 1357 | 602 -56% | 1069 -21% | 1054 -22% | 652 -52% |
| Colorchecker dE 2000 * | 4.19 | 4.5 -7% | 4.35 -4% | 5.01 -20% | 6.3 -50% |
| Colorchecker dE 2000 max. * | 8.7 | 10.2 -17% | 9.24 -6% | 10.4 -20% | 11.69 -34% |
| Greyscale dE 2000 * | 3.72 | 3.3 11% | 3.73 -0% | 7.26 -95% | 7.37 -98% |
| Gamma | 2.29 96% | 2.15 102% | 2.23 99% | 2.09 105% | 2.37 93% |
| CCT | 7104 91% | 6103 107% | 6801 96% | 6329 103% | 7116 91% |
| Color Space (Percent of AdobeRGB 1998) (%) | 59 | 55.7 -6% | 57 -3% | 76 29% | 55 -7% |
| Color Space (Percent of sRGB) (%) | 91 | 75.7 -17% | 86 -5% | 100 10% | 83 -9% |
| Total Average (Program / Settings) | -4% /
-14% | 3% /
-2% | 21% /
1% | -8% /
-22% |
* ... smaller is better
Display Response Times
| ↔ Response Time Black to White | ||
|---|---|---|
| 28 ms ... rise ↗ and fall ↘ combined | ↗ 7 ms rise | 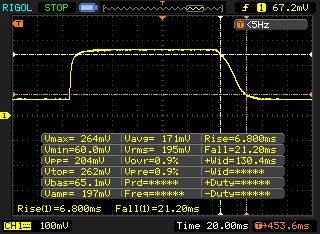 |
| ↘ 21 ms fall | ||
| The screen shows relatively slow response rates in our tests and may be too slow for gamers. In comparison, all tested devices range from 0.1 (minimum) to 240 (maximum) ms. » 71 % of all devices are better. This means that the measured response time is worse than the average of all tested devices (19.9 ms). | ||
| ↔ Response Time 50% Grey to 80% Grey | ||
| 45 ms ... rise ↗ and fall ↘ combined | ↗ 20 ms rise | 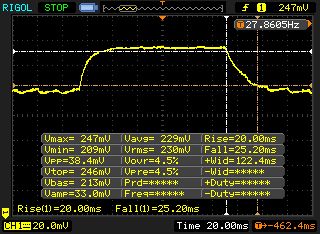 |
| ↘ 25 ms fall | ||
| The screen shows slow response rates in our tests and will be unsatisfactory for gamers. In comparison, all tested devices range from 0.165 (minimum) to 636 (maximum) ms. » 77 % of all devices are better. This means that the measured response time is worse than the average of all tested devices (31.1 ms). | ||
Screen Flickering / PWM (Pulse-Width Modulation)
| Screen flickering / PWM detected | 450 Hz | ≤ 90 % brightness setting | 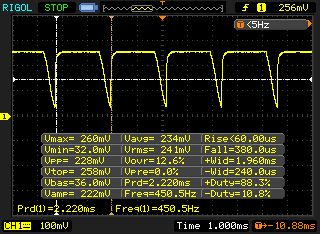 |
The display backlight flickers at 450 Hz (worst case, e.g., utilizing PWM) Flickering detected at a brightness setting of 90 % and below. There should be no flickering or PWM above this brightness setting. The frequency of 450 Hz is relatively high, so most users sensitive to PWM should not notice any flickering. However, there are reports that some users are still sensitive to PWM at 500 Hz and above, so be aware. In comparison: 52 % of all tested devices do not use PWM to dim the display. If PWM was detected, an average of 7798 (minimum: 5 - maximum: 343500) Hz was measured. | |||
| Cinebench R15 | |
| CPU Single 64Bit | |
| Nexoc G739 | |
| Asus Strix GL753VD-GC045T | |
| MSI GE72 7RE-046 | |
| Asus GL702VM-GC102D | |
| HP Omen 17-w100ng | |
| CPU Multi 64Bit | |
| Nexoc G739 | |
| Asus Strix GL753VD-GC045T | |
| MSI GE72 7RE-046 | |
| Asus GL702VM-GC102D | |
| HP Omen 17-w100ng | |
| Cinebench R11.5 | |
| CPU Single 64Bit | |
| Nexoc G739 | |
| Asus Strix GL753VD-GC045T | |
| MSI GE72 7RE-046 | |
| Asus GL702VM-GC102D | |
| HP Omen 17-w100ng | |
| CPU Multi 64Bit | |
| Nexoc G739 | |
| Asus Strix GL753VD-GC045T | |
| MSI GE72 7RE-046 | |
| Asus GL702VM-GC102D | |
| HP Omen 17-w100ng | |
| PCMark 8 | |
| Home Score Accelerated v2 | |
| HP Omen 17-w100ng | |
| Asus GL702VM-GC102D | |
| Nexoc G739 | |
| Asus Strix GL753VD-GC045T | |
| Work Score Accelerated v2 | |
| HP Omen 17-w100ng | |
| Nexoc G739 | |
| Asus GL702VM-GC102D | |
| PCMark 7 - Score | |
| Nexoc G739 | |
| HP Omen 17-w100ng | |
| MSI GE72 7RE-046 | |
| Asus GL702VM-GC102D | |
| PCMark 7 Score | 6331 points | |
| PCMark 8 Home Score Accelerated v2 | 4270 points | |
| PCMark 8 Creative Score Accelerated v2 | 5420 points | |
| PCMark 8 Work Score Accelerated v2 | 5243 points | |
Help | ||
| Nexoc G739 Samsung PM961 MZVLW256HEHP | Asus Strix GL753VD-GC045T Micron SSD 1100 (MTFDDAV256TBN) | HP Omen 17-w100ng SanDisk Z400s SD8SNAT-128G | MSI GE72 7RE-046 Toshiba HG6 THNSNJ256G8NY | Asus GL702VM-GC102D HGST Travelstar 7K1000 HTS721010A9E630 | |
|---|---|---|---|---|---|
| CrystalDiskMark 3.0 | -60% | -70% | -51% | -96% | |
| Read Seq (MB/s) | 1666 | 475.7 -71% | 495 -70% | 540 -68% | 134.6 -92% |
| Write Seq (MB/s) | 1192 | 419.1 -65% | 180.2 -85% | 495.7 -58% | 130.6 -89% |
| Read 512 (MB/s) | 857 | 336.1 -61% | 315.5 -63% | 455.1 -47% | 44.85 -95% |
| Write 512 (MB/s) | 827 | 346.6 -58% | 172.4 -79% | 481.4 -42% | 63.3 -92% |
| Read 4k (MB/s) | 60.7 | 24.7 -59% | 20.25 -67% | 22.7 -63% | 0.602 -99% |
| Write 4k (MB/s) | 154.5 | 76.8 -50% | 76.1 -51% | 112.9 -27% | 1.146 -99% |
| Read 4k QD32 (MB/s) | 636 | 247.6 -61% | 141.6 -78% | 372.5 -41% | 1.106 -100% |
| Write 4k QD32 (MB/s) | 544 | 234.9 -57% | 170.8 -69% | 212.9 -61% | 1.186 -100% |

| 3DMark 11 - 1280x720 Performance GPU | |
| HP Omen 17-w100ng | |
| Asus GL702VM-GC102D | |
| MSI GE72 7RE-046 | |
| Nexoc G739 | |
| Asus Strix GL753VD-GC045T | |
| 3DMark | |
| 1280x720 Cloud Gate Standard Graphics | |
| Asus GL702VM-GC102D | |
| HP Omen 17-w100ng | |
| Nexoc G739 | |
| MSI GE72 7RE-046 | |
| Asus Strix GL753VD-GC045T | |
| 1920x1080 Fire Strike Graphics | |
| HP Omen 17-w100ng | |
| Asus GL702VM-GC102D | |
| MSI GE72 7RE-046 | |
| Nexoc G739 | |
| Asus Strix GL753VD-GC045T | |
| Asus Strix GL753VD-GC045T | |
| 3DMark 11 Performance | 9687 points | |
| 3DMark Cloud Gate Standard Score | 22876 points | |
| 3DMark Fire Strike Score | 6950 points | |
| 3DMark Time Spy Score | 2519 points | |
Help | ||
| Battlefield 1 | |
| 1920x1080 Ultra Preset AA:T | |
| Asus GL702VM-GC102D | |
| HP Omen 17-w100ng | |
| MSI GE72 7RE-046 | |
| Nexoc G739 | |
| Asus Strix GL753VD-GC045T | |
| 1920x1080 High Preset AA:T | |
| Asus GL702VM-GC102D | |
| HP Omen 17-w100ng | |
| MSI GE72 7RE-046 | |
| Nexoc G739 | |
| Asus Strix GL753VD-GC045T | |
| The Witcher 3 | |
| 1920x1080 Ultra Graphics & Postprocessing (HBAO+) | |
| Nexoc G739 | |
| MSI GE72 7RE-046 | |
| Asus Strix GL753VD-GC045T | |
| 1920x1080 High Graphics & Postprocessing (Nvidia HairWorks Off) | |
| Nexoc G739 | |
| MSI GE72 7RE-046 | |
| Asus Strix GL753VD-GC045T | |
| Rise of the Tomb Raider | |
| 1920x1080 Very High Preset AA:FX AF:16x | |
| Nexoc G739 | |
| MSI GE72 7RE-046 | |
| Asus Strix GL753VD-GC045T | |
| 1920x1080 High Preset AA:FX AF:4x | |
| Nexoc G739 | |
| MSI GE72 7RE-046 | |
| Asus Strix GL753VD-GC045T | |
| For Honor | |
| 1920x1080 Extreme Preset AA:T AF:16x | |
| Nexoc G739 | |
| MSI GE72 7RE-046 | |
| 1920x1080 High Preset AA:T AF:8x | |
| MSI GE72 7RE-046 | |
| Nexoc G739 | |
| BioShock Infinite - 1920x1080 Ultra Preset, DX11 (DDOF) | |
| HP Omen 17-w100ng | |
| Asus GL702VM-GC102D | |
| Nexoc G739 | |
| low | med. | high | ultra | |
|---|---|---|---|---|
| BioShock Infinite (2013) | 72.5 | |||
| The Witcher 3 (2015) | 89.8 | 50.4 | 27.6 | |
| Rise of the Tomb Raider (2016) | 84.2 | 47.6 | 40.7 | |
| Battlefield 1 (2016) | 79.2 | 55.7 | 50.8 | |
| For Honor (2017) | 65.8 | 62.1 | 46.1 |
Noise level
| Idle |
| 31 / 32 / 38 dB(A) |
| HDD |
| 31 dB(A) |
| Load |
| 44 / 50 dB(A) |
 | ||
30 dB silent 40 dB(A) audible 50 dB(A) loud |
||
min: | ||
| Nexoc G739 GeForce GTX 1050 Ti Mobile, i7-7700HQ | Asus Strix GL753VD-GC045T GeForce GTX 1050 Mobile, i7-7700HQ | HP Omen 17-w100ng GeForce GTX 1060 Mobile, 6300HQ | MSI GE72 7RE-046 GeForce GTX 1050 Ti Mobile, i7-7700HQ | Asus GL702VM-GC102D GeForce GTX 1060 Mobile, 6700HQ | |
|---|---|---|---|---|---|
| Noise | -0% | -6% | -1% | 5% | |
| off / environment * (dB) | 30 | 28.8 4% | 31 -3% | 30 -0% | 30.5 -2% |
| Idle Minimum * (dB) | 31 | 33.9 -9% | 35 -13% | 34 -10% | 31.4 -1% |
| Idle Average * (dB) | 32 | 33.9 -6% | 36 -13% | 35 -9% | 31.4 2% |
| Idle Maximum * (dB) | 38 | 37.8 1% | 37 3% | 36 5% | 31.5 17% |
| Load Average * (dB) | 44 | 42.7 3% | 44 -0% | 41 7% | 40.9 7% |
| Load Maximum * (dB) | 50 | 47.4 5% | 54 -8% | 49 2% | 46.2 8% |
* ... smaller is better
(-) The maximum temperature on the upper side is 50.6 °C / 123 F, compared to the average of 40.4 °C / 105 F, ranging from 21.2 to 68.8 °C for the class Gaming.
(-) The bottom heats up to a maximum of 50.8 °C / 123 F, compared to the average of 43.2 °C / 110 F
(+) In idle usage, the average temperature for the upper side is 25.6 °C / 78 F, compared to the device average of 33.9 °C / 93 F.
(-) The palmrests and touchpad can get very hot to the touch with a maximum of 42.8 °C / 109 F.
(-) The average temperature of the palmrest area of similar devices was 28.8 °C / 83.8 F (-14 °C / -25.2 F).
| Nexoc G739 GeForce GTX 1050 Ti Mobile, i7-7700HQ | Asus Strix GL753VD-GC045T GeForce GTX 1050 Mobile, i7-7700HQ | HP Omen 17-w100ng GeForce GTX 1060 Mobile, 6300HQ | MSI GE72 7RE-046 GeForce GTX 1050 Ti Mobile, i7-7700HQ | Asus GL702VM-GC102D GeForce GTX 1060 Mobile, 6700HQ | |
|---|---|---|---|---|---|
| Heat | 19% | 2% | 0% | -8% | |
| Maximum Upper Side * (°C) | 50.6 | 37.7 25% | 41.5 18% | 45.8 9% | 53.1 -5% |
| Maximum Bottom * (°C) | 50.8 | 36.3 29% | 45.5 10% | 45.2 11% | 44.9 12% |
| Idle Upper Side * (°C) | 28.7 | 25.7 10% | 31.8 -11% | 31.7 -10% | 32.9 -15% |
| Idle Bottom * (°C) | 27.1 | 24.4 10% | 29.6 -9% | 29.9 -10% | 33.4 -23% |
* ... smaller is better
Nexoc G739 audio analysis
(±) | speaker loudness is average but good (76 dB)
Bass 100 - 315 Hz
(-) | nearly no bass - on average 23.2% lower than median
(±) | linearity of bass is average (13.3% delta to prev. frequency)
Mids 400 - 2000 Hz
(±) | higher mids - on average 7.8% higher than median
(±) | linearity of mids is average (8% delta to prev. frequency)
Highs 2 - 16 kHz
(±) | higher highs - on average 6.4% higher than median
(±) | linearity of highs is average (12.4% delta to prev. frequency)
Overall 100 - 16.000 Hz
(-) | overall sound is not linear (31.5% difference to median)
Compared to same class
» 97% of all tested devices in this class were better, 1% similar, 2% worse
» The best had a delta of 6%, average was 18%, worst was 132%
Compared to all devices tested
» 90% of all tested devices were better, 2% similar, 8% worse
» The best had a delta of 4%, average was 24%, worst was 134%
Asus Strix GL753VD-GC045T audio analysis
(±) | speaker loudness is average but good (81.5 dB)
Bass 100 - 315 Hz
(-) | nearly no bass - on average 15.8% lower than median
(±) | linearity of bass is average (12.2% delta to prev. frequency)
Mids 400 - 2000 Hz
(+) | balanced mids - only 3.1% away from median
(±) | linearity of mids is average (7% delta to prev. frequency)
Highs 2 - 16 kHz
(±) | higher highs - on average 6.3% higher than median
(+) | highs are linear (5.4% delta to prev. frequency)
Overall 100 - 16.000 Hz
(±) | linearity of overall sound is average (17.2% difference to median)
Compared to same class
» 46% of all tested devices in this class were better, 11% similar, 42% worse
» The best had a delta of 6%, average was 18%, worst was 132%
Compared to all devices tested
» 32% of all tested devices were better, 8% similar, 60% worse
» The best had a delta of 4%, average was 24%, worst was 134%
| Off / Standby | |
| Idle | |
| Load |
|
Key:
min: | |
| Nexoc G739 GeForce GTX 1050 Ti Mobile, i7-7700HQ | Asus Strix GL753VD-GC045T GeForce GTX 1050 Mobile, i7-7700HQ | HP Omen 17-w100ng GeForce GTX 1060 Mobile, 6300HQ | MSI GE72 7RE-046 GeForce GTX 1050 Ti Mobile, i7-7700HQ | Asus GL702VM-GC102D GeForce GTX 1060 Mobile, 6700HQ | |
|---|---|---|---|---|---|
| Power Consumption | 16% | -40% | -27% | -32% | |
| Idle Minimum * (Watt) | 7 | 6.2 11% | 17 -143% | 14 -100% | 15.6 -123% |
| Idle Average * (Watt) | 14 | 12.2 13% | 22 -57% | 20 -43% | 20.2 -44% |
| Idle Maximum * (Watt) | 23 | 14.8 36% | 29 -26% | 25 -9% | 21.4 7% |
| Load Average * (Watt) | 82 | 84.9 -4% | 72 12% | 82 -0% | 90 -10% |
| Load Maximum * (Watt) | 163 | 120.7 26% | 141 13% | 135 17% | 147 10% |
* ... smaller is better
| Nexoc G739 GeForce GTX 1050 Ti Mobile, i7-7700HQ, 62 Wh | Asus Strix GL753VD-GC045T GeForce GTX 1050 Mobile, i7-7700HQ, 48 Wh | HP Omen 17-w100ng GeForce GTX 1060 Mobile, 6300HQ, 95.8 Wh | MSI GE72 7RE-046 GeForce GTX 1050 Ti Mobile, i7-7700HQ, 51.4 Wh | Asus GL702VM-GC102D GeForce GTX 1060 Mobile, 6700HQ, 76 Wh | |
|---|---|---|---|---|---|
| Battery runtime | -29% | 7% | -37% | -26% | |
| Reader / Idle (h) | 10.2 | 8.6 -16% | 9.1 -11% | 5.9 -42% | |
| H.264 (h) | 5.4 | 5.2 -4% | 3.3 -39% | 4.4 -19% | |
| WiFi v1.3 (h) | 4.8 | 4.4 -8% | 6.1 27% | 3.1 -35% | 4.2 -12% |
| Load (h) | 2.1 | 0.8 -62% | 2.4 14% | 1.5 -29% |
Pros
Cons
由于搭配了强劲的硬件,Nexoc G739是一台性能不俗的入门级游戏本。它的显卡和全高清屏幕可以完美协作,同时这块屏幕在亮度和其他方面表现都十分不错。但是这款设备在如连接性,机身和输入设备等一些方面的表现只是一般般。
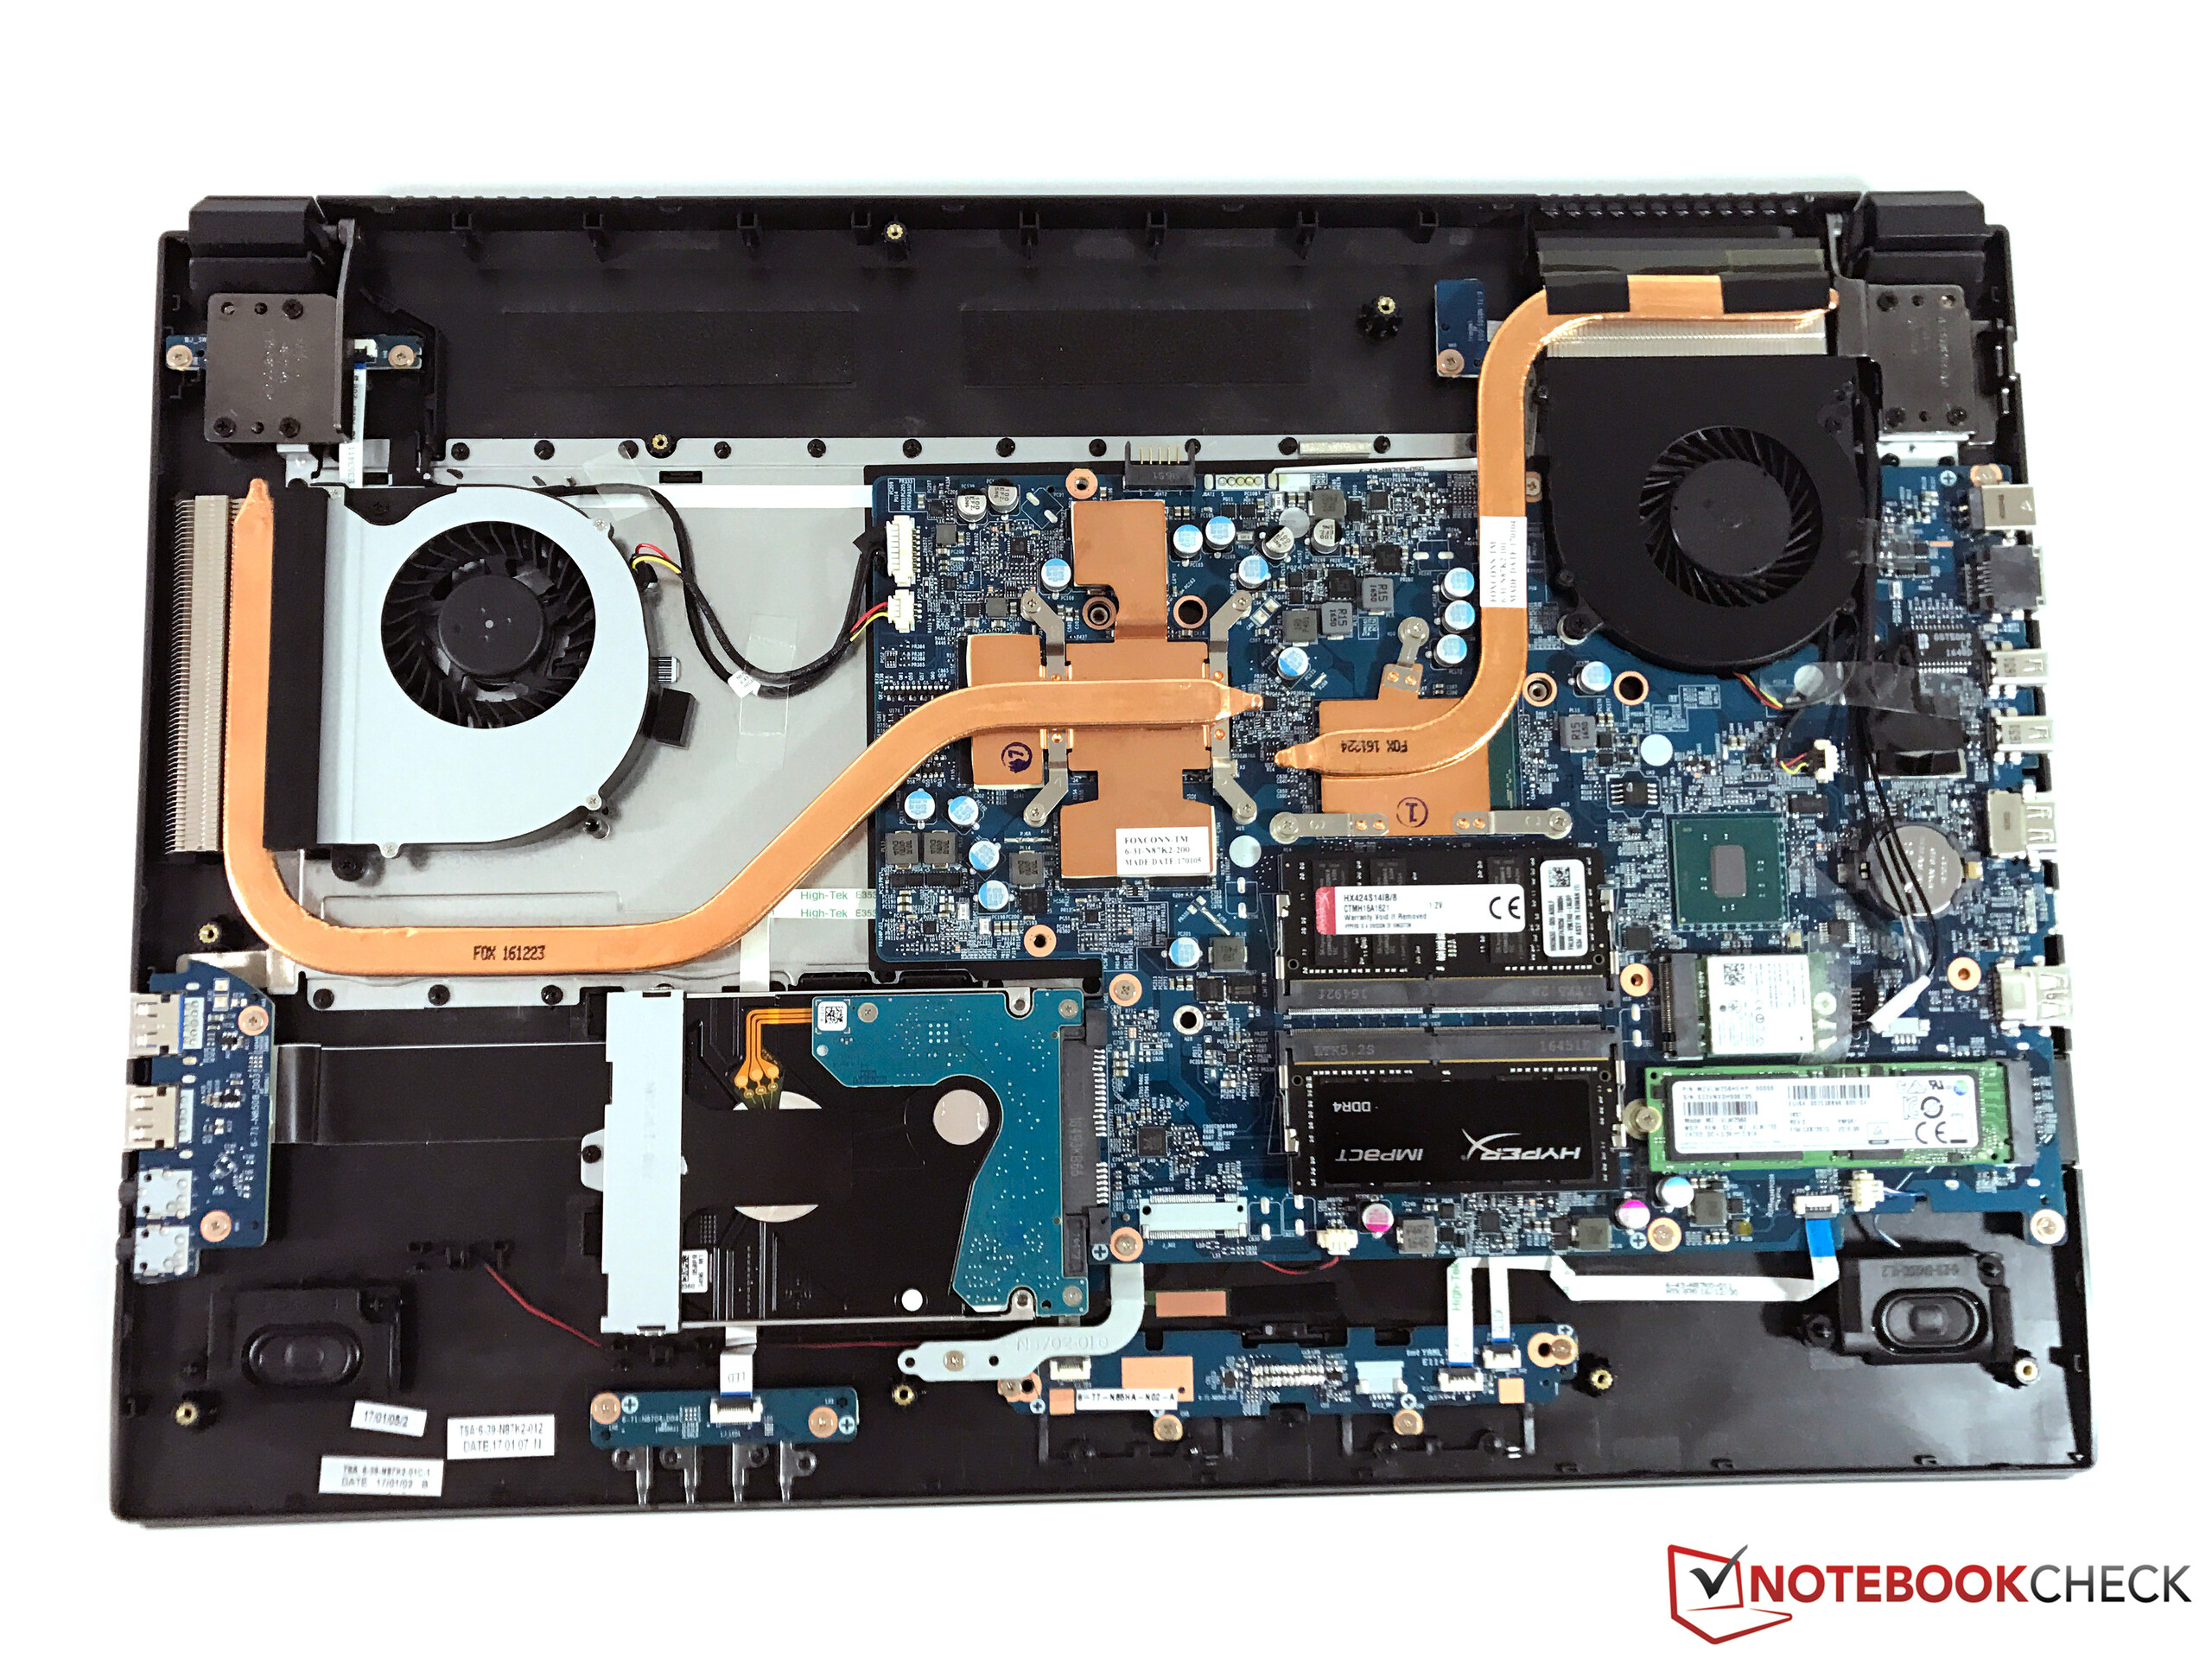
在性能上,Nexoc G739没有任何弱点,可以满足甚至是要求较高的游戏的需求,不过基于Clevo-N870HK1准系统的散热设计还有待改进。
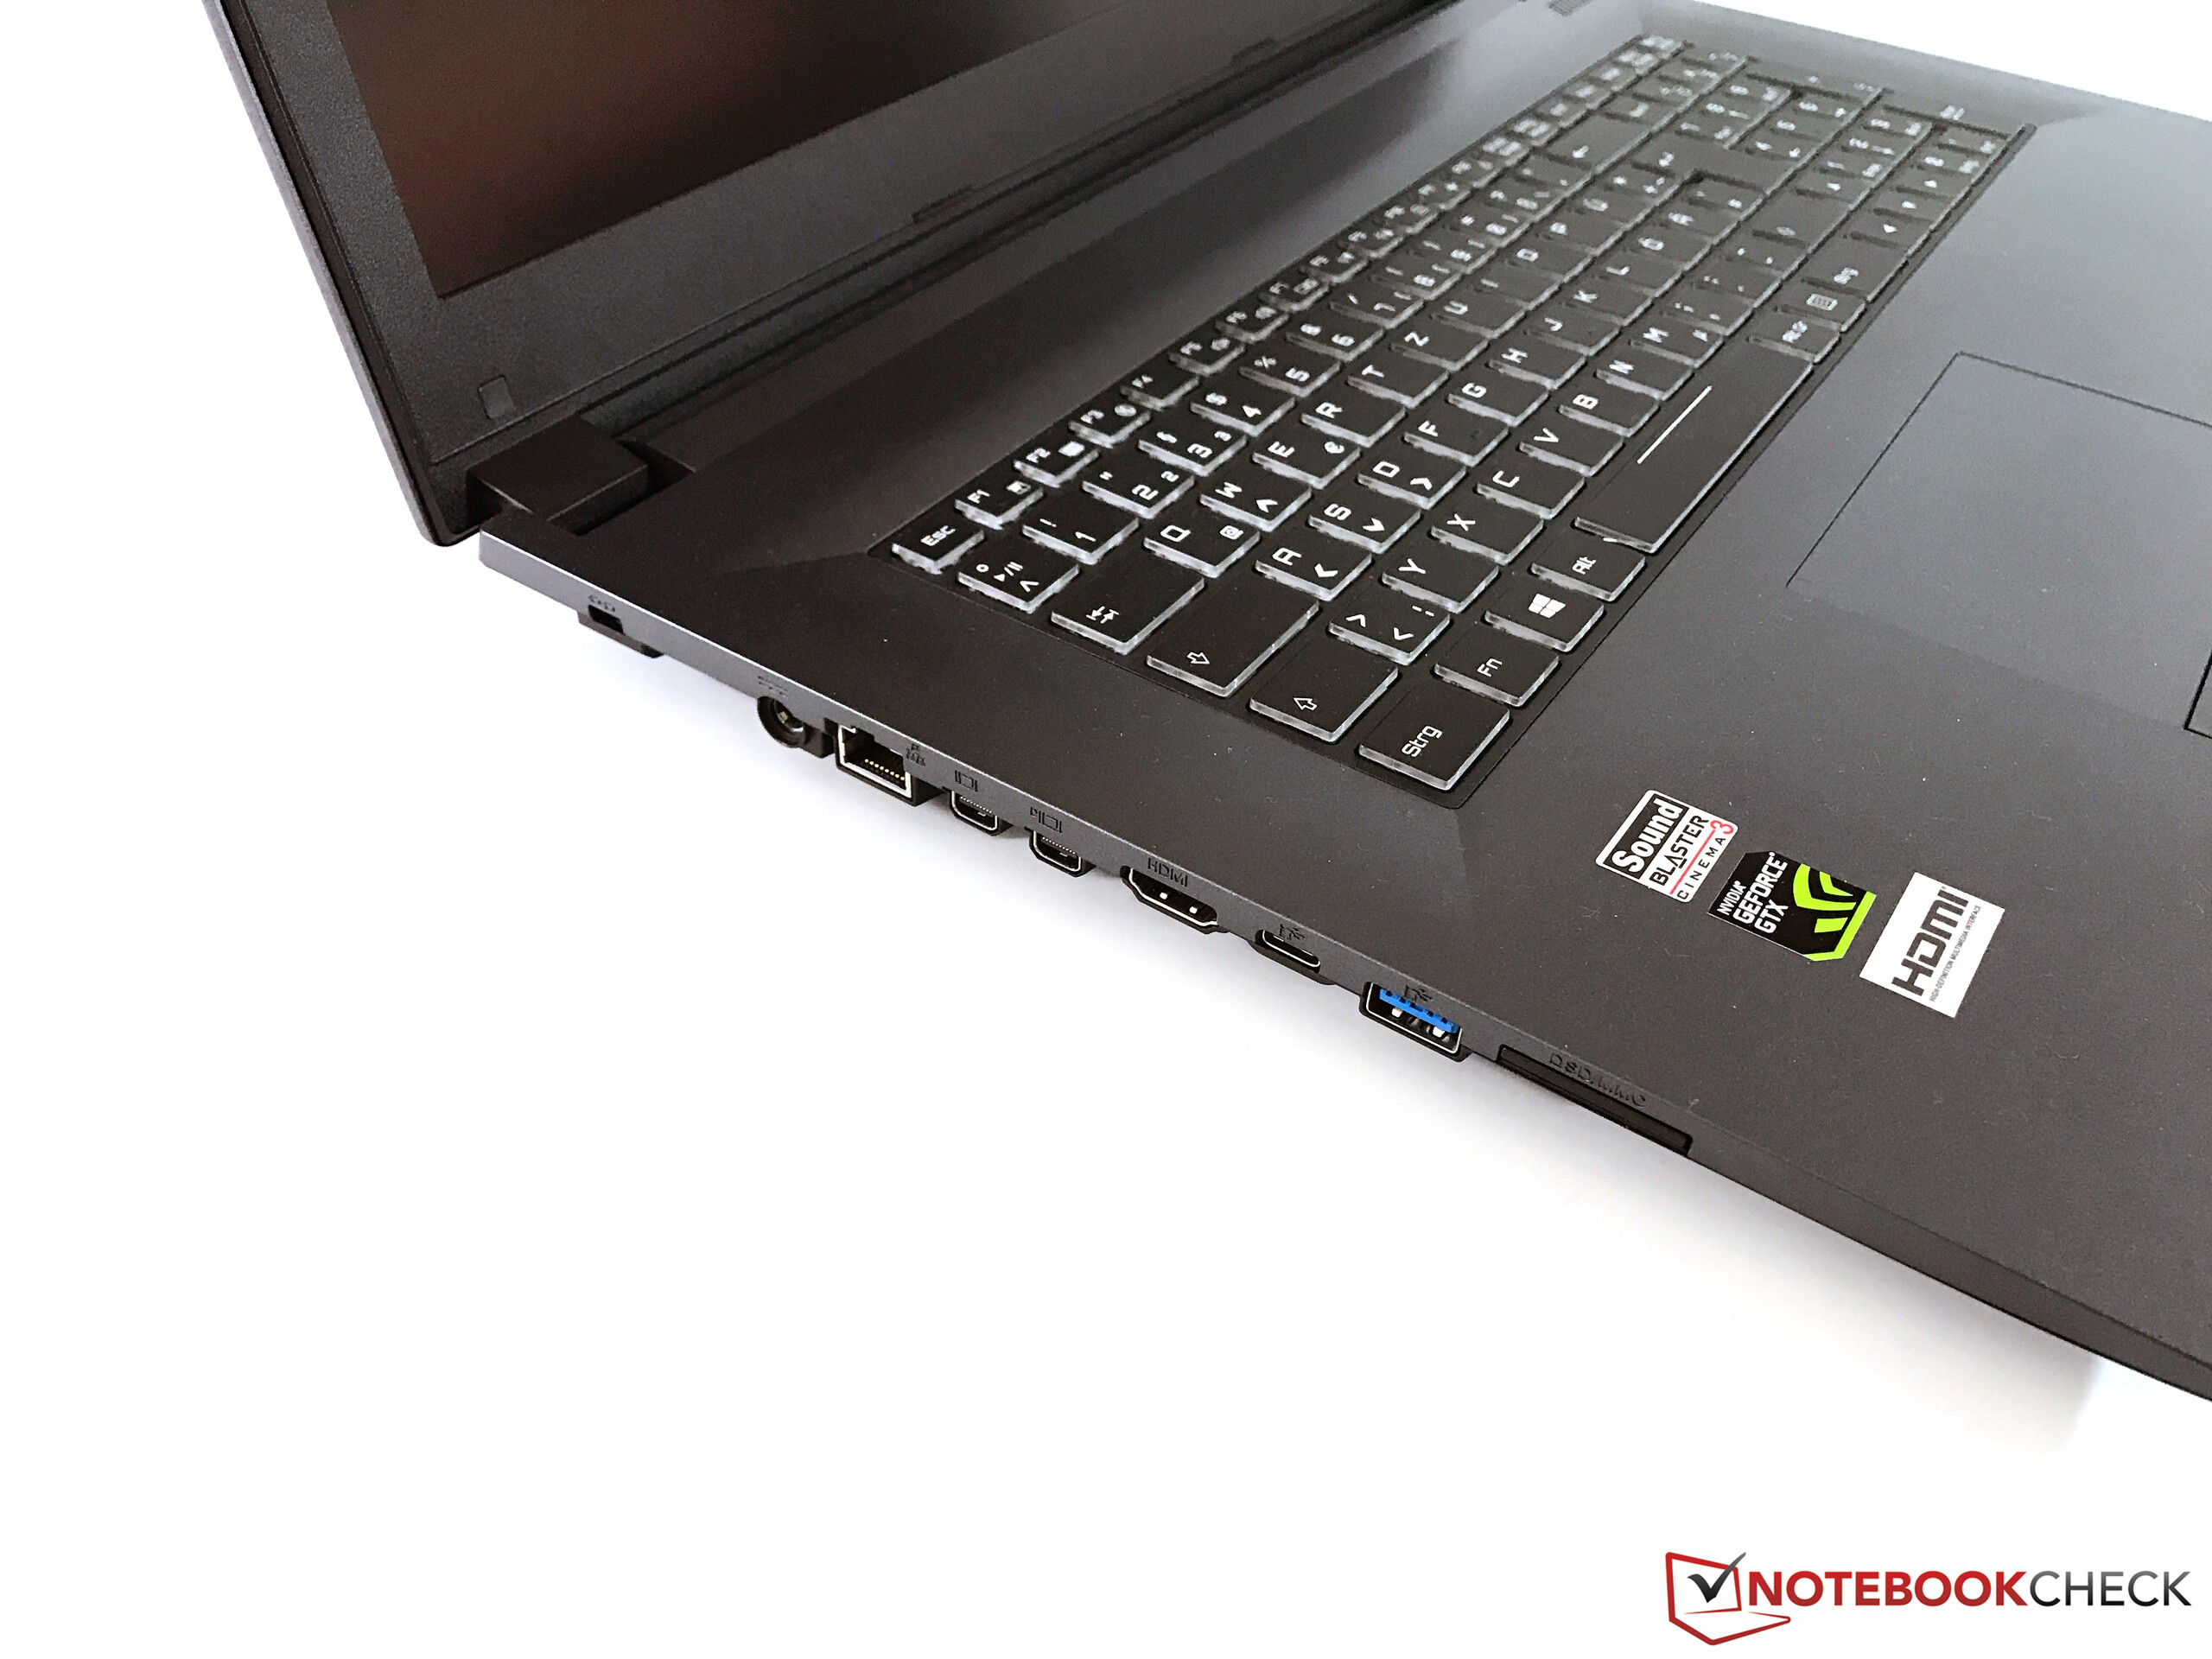
它的最大弱点在于发热量和噪音控制。这个机身为更强大的散热系统也提供了足够的空间,不过它搭配的两个小尺寸风扇不仅会制造很高的噪音,还无法有效控制硬件温度。在接口配备方面它也需要改进(无Thunderbolt接口),我们也十分期待一些特别的游戏功能如G-Sync。
整体上,Nexoc G739显然不是一款糟糕的游戏本,不过同时考虑一下竞争机型大概是个好主意。
注:本文是基于完整评测的缩减版本,阅读完整的英文评测,请点击这里。
Nexoc G739
- 06/23/2018 v6 (old)
Andreas Osthoff