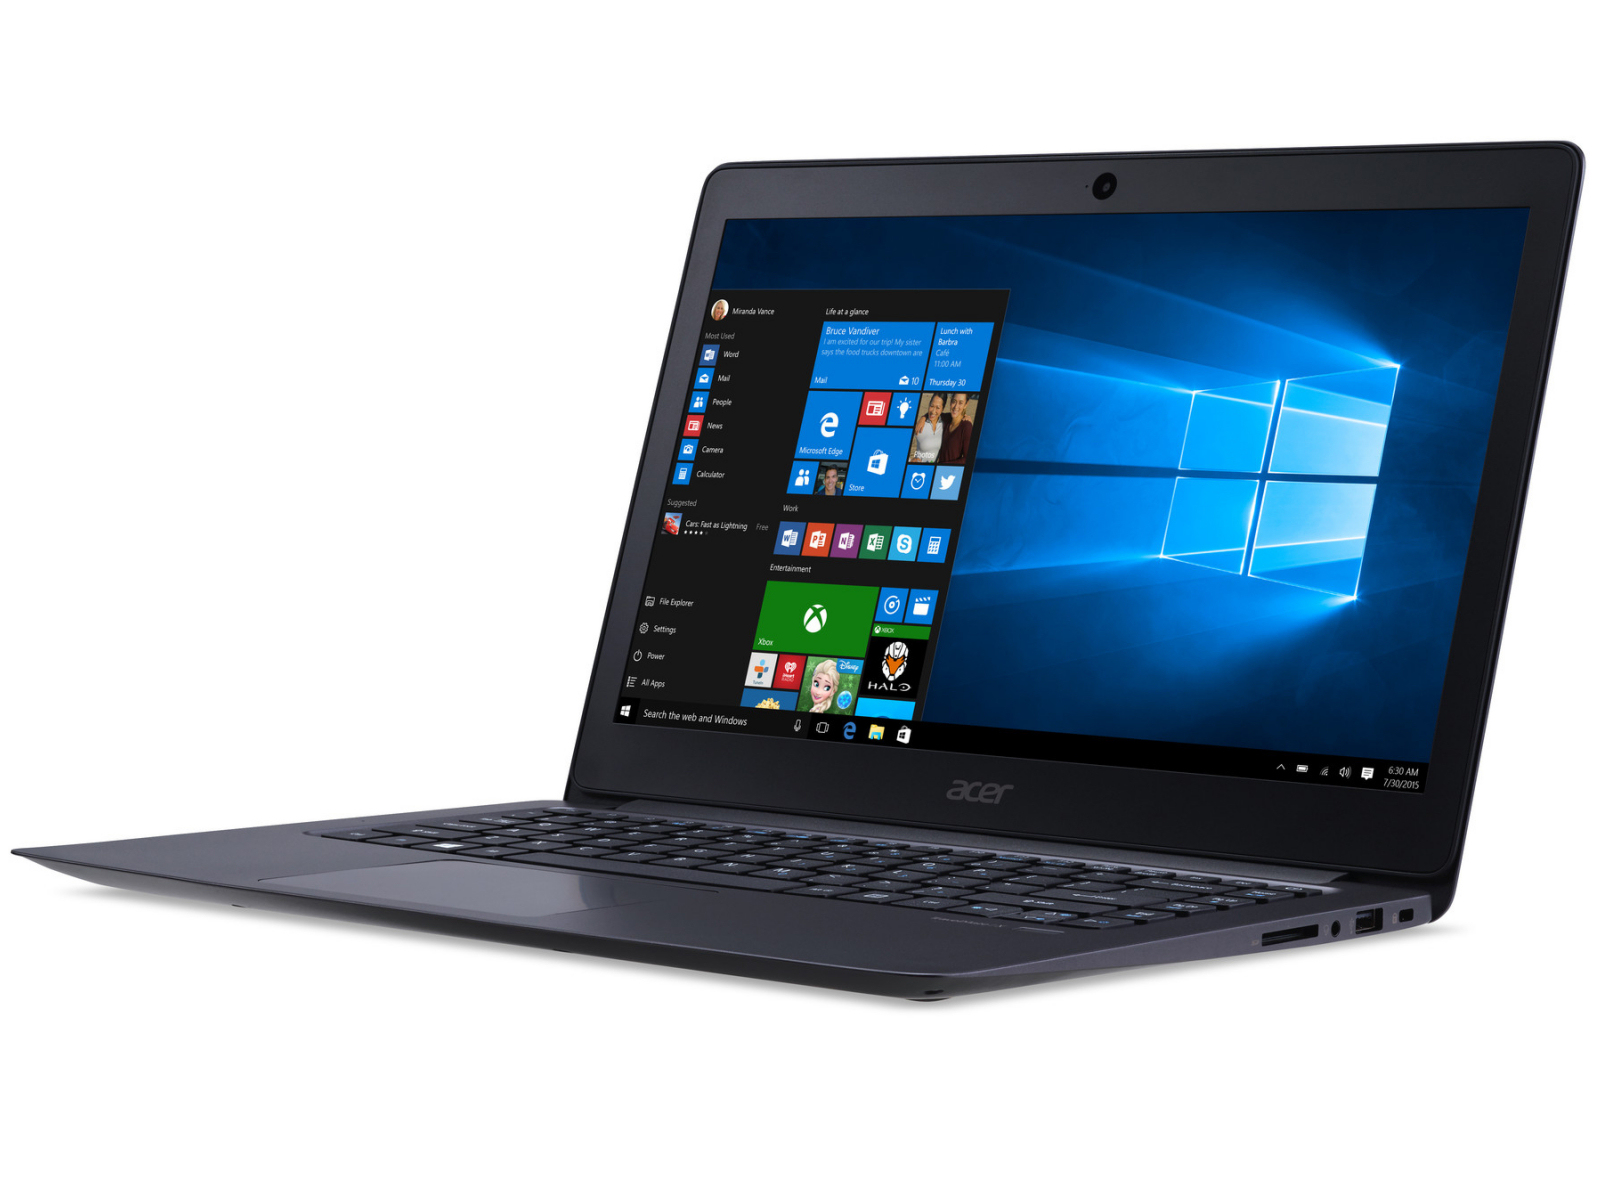
宏碁 TravelMate X3 X349-M-7261 笔记本电脑简短评测

| SD Card Reader | |
| average JPG Copy Test (av. of 3 runs) | |
| Asus Zenbook UX303UB-R4100T | |
| Asus Zenbook UX305UA-FC040T | |
| Lenovo ThinkPad 13-20GKS01100 | |
| Acer TravelMate P238-M-5575 | |
| Acer TravelMate X3 X349-M-7261 | |
| maximum AS SSD Seq Read Test (1GB) | |
| Asus Zenbook UX303UB-R4100T | |
| Asus Zenbook UX305UA-FC040T | |
| Lenovo ThinkPad 13-20GKS01100 | |
| Acer TravelMate P238-M-5575 | |
| Acer TravelMate X3 X349-M-7261 | |
| Networking | |
| iperf Server (receive) TCP 1 m | |
| Acer TravelMate X3 X349-M-7261 (jseb) | |
| iperf Client (transmit) TCP 1 m | |
| Acer TravelMate X3 X349-M-7261 (jseb) | |
| |||||||||||||||||||||||||
Brightness Distribution: 86 %
Center on Battery: 230 cd/m²
Contrast: 1150:1 (Black: 0.2 cd/m²)
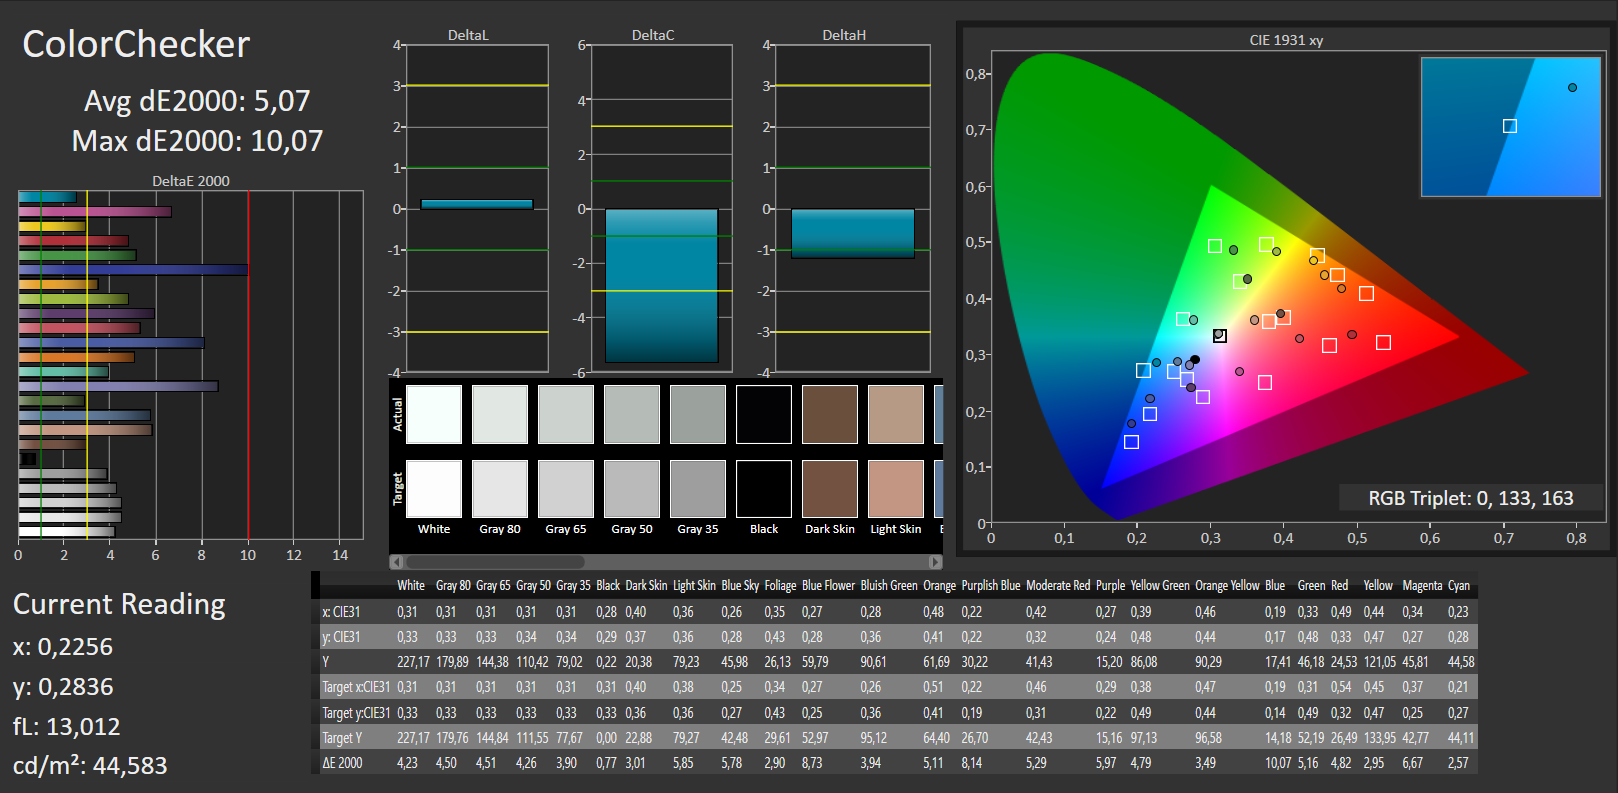
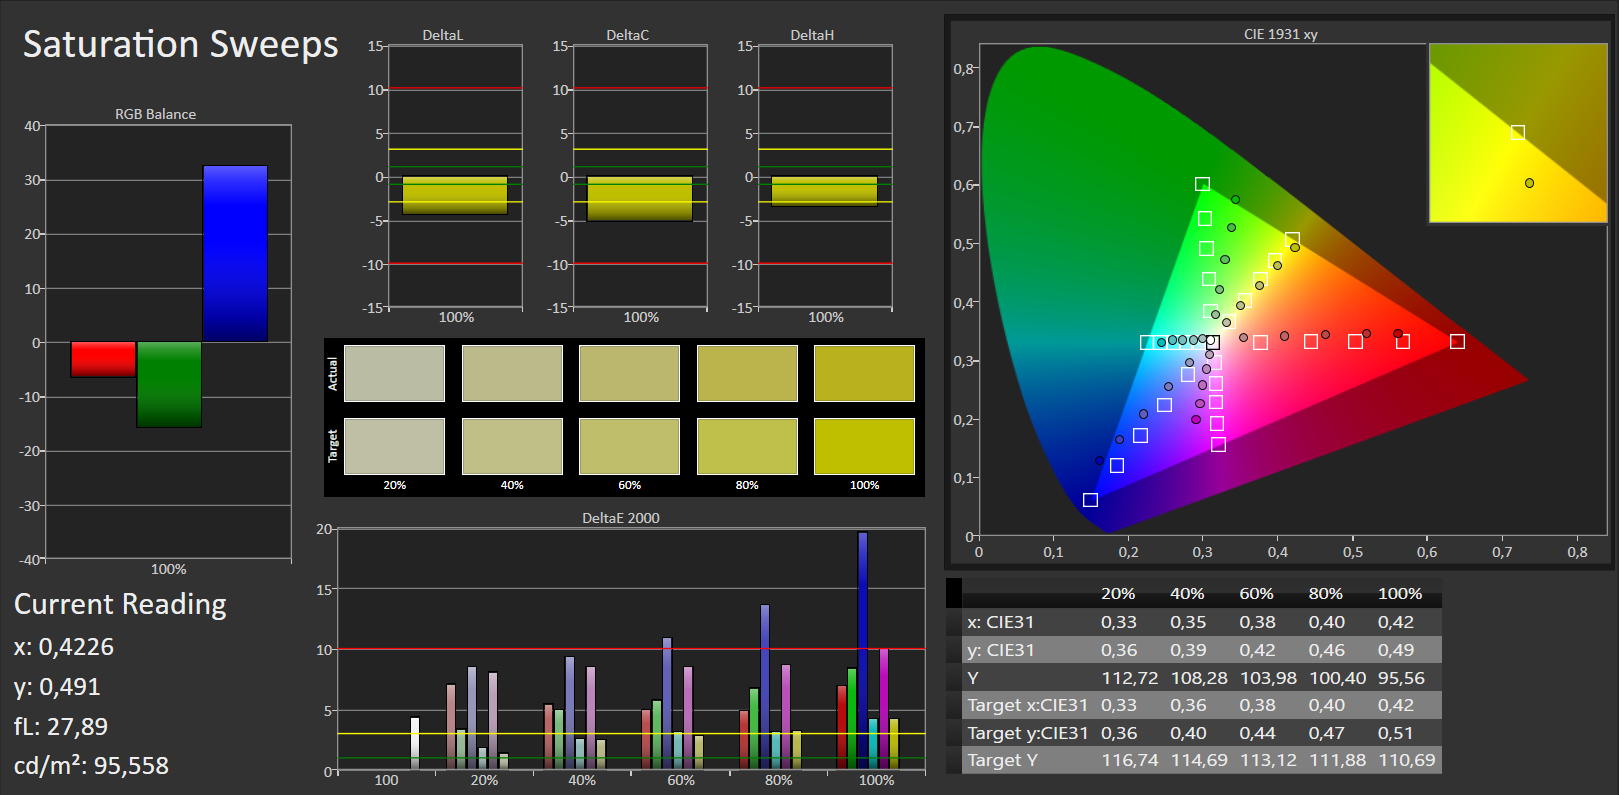
ΔE ColorChecker Calman: 5.07 | ∀{0.5-29.43 Ø4.72}
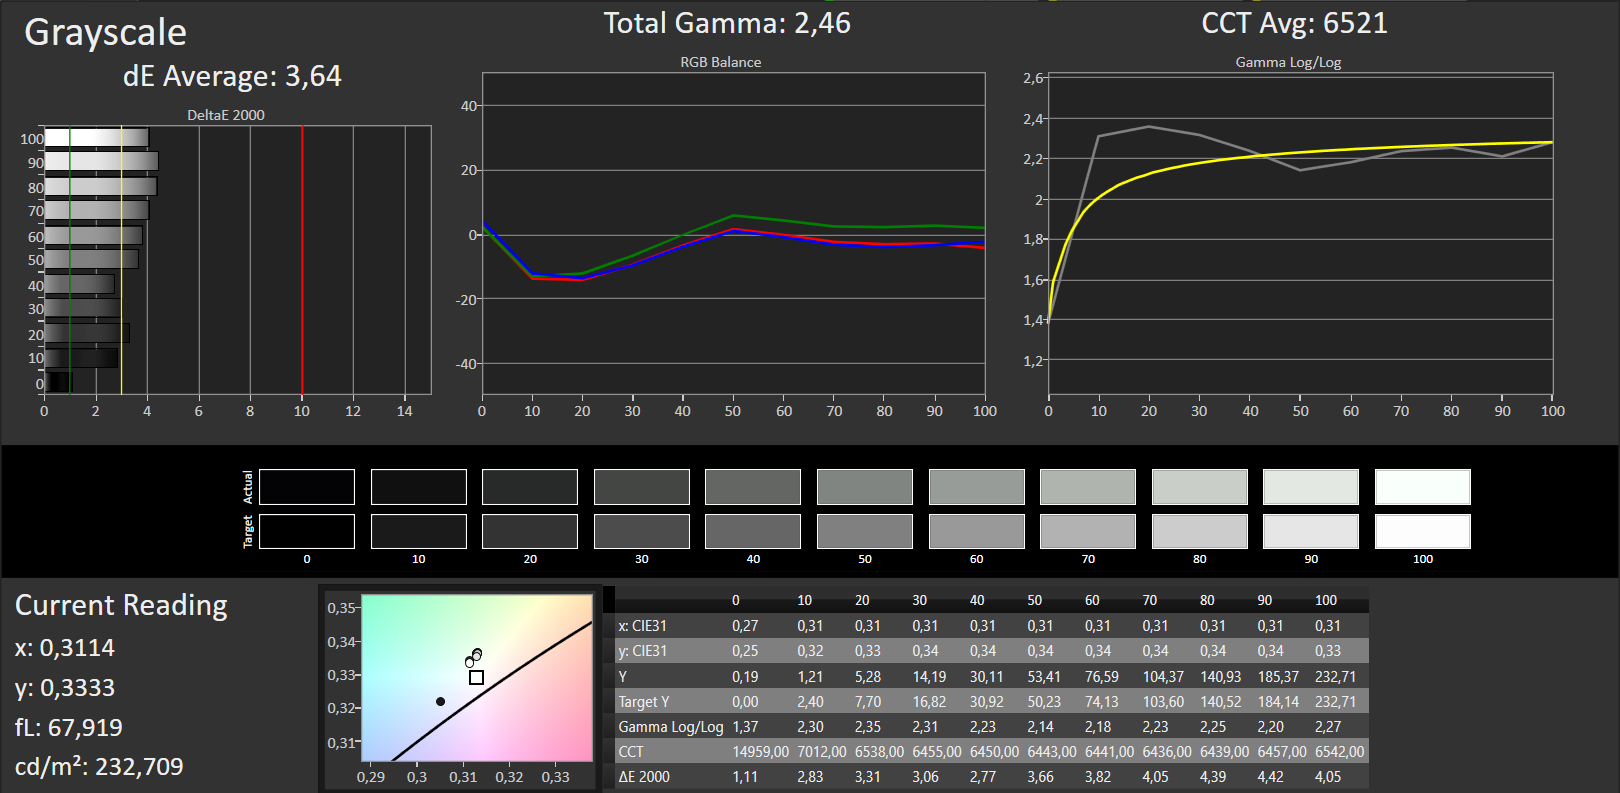
ΔE Greyscale Calman: 3.64 | ∀{0.09-98 Ø4.97}
55% sRGB (Argyll 1.6.3 3D)
35% AdobeRGB 1998 (Argyll 1.6.3 3D)
38.2% AdobeRGB 1998 (Argyll 3D)
55.6% sRGB (Argyll 3D)
36.97% Display P3 (Argyll 3D)
Gamma: 2.46
CCT: 6521 K
| Acer TravelMate X3 X349-M-7261 IPS, 1920x1080, 14" | Apple MacBook Air 13 inch 2015-03 TN LED, 1440x900, 13.3" | Lenovo ThinkPad 13-20GKS01100 1920x1080, 13.3" | Acer TravelMate P238-M-5575 TN LED, 1366x768, 13.3" | Asus Zenbook UX305UA-FC040T IPS, 1920x1080, 13.3" | Asus Zenbook UX303UB-R4100T IPS, 1920x1080, 13.3" | |
|---|---|---|---|---|---|---|
| Display | 8% | 4% | 1% | 72% | 75% | |
| Display P3 Coverage (%) | 36.97 | 40.1 8% | 38.35 4% | 37.25 1% | 65.1 76% | 66.9 81% |
| sRGB Coverage (%) | 55.6 | 59.8 8% | 57.4 3% | 56.1 1% | 92.8 67% | 92.3 66% |
| AdobeRGB 1998 Coverage (%) | 38.2 | 41.51 9% | 39.66 4% | 38.49 1% | 66.3 74% | 67.6 77% |
| Response Times | 1% | 0% | 20% | -44% | ||
| Response Time Grey 50% / Grey 80% * (ms) | 42 ? | 43.2 ? -3% | 42 ? -0% | 25 ? 40% | 68 ? -62% | |
| Response Time Black / White * (ms) | 28 ? | 26.8 ? 4% | 28 ? -0% | 28 ? -0% | 35 ? -25% | |
| PWM Frequency (Hz) | 50 ? | 178 ? | ||||
| Screen | 1% | -7% | -78% | -4% | 20% | |
| Brightness middle (cd/m²) | 230 | 329 43% | 233 1% | 226 -2% | 358 56% | 385 67% |
| Brightness (cd/m²) | 226 | 310 37% | 227 0% | 216 -4% | 351 55% | 394 74% |
| Brightness Distribution (%) | 86 | 82 -5% | 86 0% | 91 6% | 86 0% | 89 3% |
| Black Level * (cd/m²) | 0.2 | 0.405 -103% | 0.22 -10% | 0.49 -145% | 0.4 -100% | 0.41 -105% |
| Contrast (:1) | 1150 | 812 -29% | 1059 -8% | 461 -60% | 895 -22% | 939 -18% |
| Colorchecker dE 2000 * | 5.07 | 3.96 22% | 5.41 -7% | 13.15 -159% | 5.96 -18% | 3.84 24% |
| Colorchecker dE 2000 max. * | 10.07 | 7.51 25% | 13.61 -35% | 21.96 -118% | 10.99 -9% | |
| Greyscale dE 2000 * | 3.64 | 3.51 4% | 4.15 -14% | 14.47 -298% | 8.93 -145% | 3.79 -4% |
| Gamma | 2.46 89% | 3.83 57% | 2.45 90% | 2.73 81% | 2.28 96% | 2.23 99% |
| CCT | 6521 100% | 6711 97% | 6773 96% | 19989 33% | 6548 99% | 6499 100% |
| Color Space (Percent of AdobeRGB 1998) (%) | 35 | 38.4 10% | 36.52 4% | 36 3% | 60 71% | 60 71% |
| Color Space (Percent of sRGB) (%) | 55 | 59.8 9% | 57.16 4% | 56 2% | 93 69% | 92 67% |
| Total Average (Program / Settings) | 5% /
3% | -1% /
-4% | -26% /
-51% | 29% /
14% | 17% /
23% |
* ... smaller is better
Screen Flickering / PWM (Pulse-Width Modulation)
| Screen flickering / PWM not detected | ||
In comparison: 52 % of all tested devices do not use PWM to dim the display. If PWM was detected, an average of 7769 (minimum: 5 - maximum: 343500) Hz was measured. | ||
Display Response Times
| ↔ Response Time Black to White | ||
|---|---|---|
| 28 ms ... rise ↗ and fall ↘ combined | ↗ 8 ms rise | 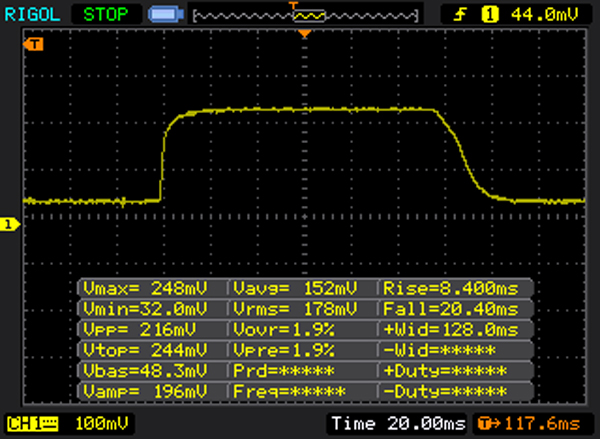 |
| ↘ 20 ms fall | ||
| The screen shows relatively slow response rates in our tests and may be too slow for gamers. In comparison, all tested devices range from 0.1 (minimum) to 240 (maximum) ms. » 71 % of all devices are better. This means that the measured response time is worse than the average of all tested devices (19.8 ms). | ||
| ↔ Response Time 50% Grey to 80% Grey | ||
| 42 ms ... rise ↗ and fall ↘ combined | ↗ 15 ms rise | 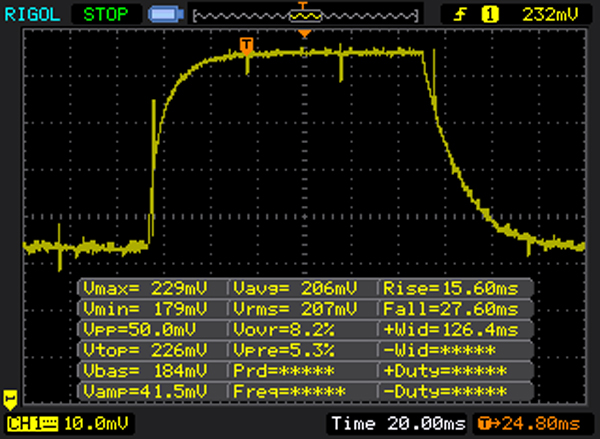 |
| ↘ 27 ms fall | ||
| The screen shows slow response rates in our tests and will be unsatisfactory for gamers. In comparison, all tested devices range from 0.165 (minimum) to 636 (maximum) ms. » 67 % of all devices are better. This means that the measured response time is worse than the average of all tested devices (31 ms). | ||
| Cinebench R15 | |
| CPU Single 64Bit | |
| Acer TravelMate X3 X349-M-7261 | |
| Asus Zenbook UX303UB-R4100T | |
| Asus Zenbook UX305UA-FC040T | |
| Acer TravelMate P238-M-5575 | |
| Lenovo ThinkPad 13-20GKS01100 | |
| Apple MacBook Air 13 inch 2015-03 | |
| CPU Multi 64Bit | |
| Acer TravelMate X3 X349-M-7261 | |
| Asus Zenbook UX305UA-FC040T | |
| Apple MacBook Air 13 inch 2015-03 | |
| Acer TravelMate P238-M-5575 | |
| Lenovo ThinkPad 13-20GKS01100 | |
| Asus Zenbook UX303UB-R4100T | |
| Cinebench R10 | |
| Rendering Multiple CPUs 32Bit | |
| Acer TravelMate X3 X349-M-7261 | |
| Acer TravelMate P238-M-5575 | |
| Apple MacBook Air 13 inch 2015-03 | |
| Asus Zenbook UX303UB-R4100T | |
| Asus Zenbook UX305UA-FC040T | |
| Rendering Single 32Bit | |
| Apple MacBook Air 13 inch 2015-03 | |
| Acer TravelMate X3 X349-M-7261 | |
| Asus Zenbook UX303UB-R4100T | |
| Asus Zenbook UX305UA-FC040T | |
| Acer TravelMate P238-M-5575 | |
| Geekbench 3 | |
| 32 Bit Single-Core Score | |
| Acer TravelMate X3 X349-M-7261 | |
| Asus Zenbook UX305UA-FC040T | |
| Apple MacBook Air 13 inch 2015-03 | |
| Asus Zenbook UX303UB-R4100T | |
| Acer TravelMate P238-M-5575 | |
| 32 Bit Multi-Core Score | |
| Acer TravelMate X3 X349-M-7261 | |
| Asus Zenbook UX305UA-FC040T | |
| Asus Zenbook UX303UB-R4100T | |
| Apple MacBook Air 13 inch 2015-03 | |
| Acer TravelMate P238-M-5575 | |
| Geekbench 4.0 | |
| 64 Bit Single-Core Score | |
| Acer TravelMate X3 X349-M-7261 | |
| 64 Bit Multi-Core Score | |
| Acer TravelMate X3 X349-M-7261 | |
| JetStream 1.1 - 1.1 Total | |
| Asus Zenbook UX303UB-R4100T | |
| Acer TravelMate X3 X349-M-7261 | |
| Asus Zenbook UX305UA-FC040T | |
| Lenovo ThinkPad 13-20GKS01100 | |
| Acer TravelMate P238-M-5575 | |
| PCMark 7 Score | 5281 points | |
| PCMark 8 Home Score Accelerated v2 | 3545 points | |
| PCMark 8 Creative Score Accelerated v2 | 4166 points | |
| PCMark 8 Work Score Accelerated v2 | 4361 points | |
Help | ||
| PCMark 8 | |
| Home Score Accelerated v2 | |
| Acer TravelMate P238-M-5575 | |
| Apple MacBook Air 13 inch 2015-03 | |
| Acer TravelMate X3 X349-M-7261 | |
| Asus Zenbook UX305UA-FC040T | |
| Asus Zenbook UX303UB-R4100T | |
| Lenovo ThinkPad 13-20GKS01100 | |
| Work Score Accelerated v2 | |
| Acer TravelMate P238-M-5575 | |
| Apple MacBook Air 13 inch 2015-03 | |
| Acer TravelMate X3 X349-M-7261 | |
| Asus Zenbook UX303UB-R4100T | |
| Asus Zenbook UX305UA-FC040T | |
| Lenovo ThinkPad 13-20GKS01100 | |

| Acer TravelMate X3 X349-M-7261 Liteonit CV3-8D512 | Apple MacBook Air 13 inch 2015-03 Apple SSD SD0256F | Lenovo ThinkPad 13-20GKS01100 Samsung SSD PM871 MZNLN256HCHP | Acer TravelMate P238-M-5575 Samsung SSD PM871 MZNLN256HCHP | Asus Zenbook UX305UA-FC040T SK Hynix Canvas SC300 512GB M.2 (HFS512G39MND) | Asus Zenbook UX303UB-R4100T Micron M600 MTFDDAK512MBF | |
|---|---|---|---|---|---|---|
| CrystalDiskMark 3.0 | 70% | -9% | -6% | -10% | -1% | |
| Read Seq (MB/s) | 484.1 | 1352 179% | 461.7 -5% | 517 7% | 469.1 -3% | 484.2 0% |
| Write Seq (MB/s) | 449.8 | 1111 147% | 297.8 -34% | 307.6 -32% | 412.1 -8% | 444.9 -1% |
| Read 512 (MB/s) | 399.1 | 880 120% | 351.6 -12% | 459.9 15% | 301.6 -24% | 387.8 -3% |
| Write 512 (MB/s) | 355.1 | 1023 188% | 298.4 -16% | 305.1 -14% | 327.1 -8% | 386.3 9% |
| Read 4k (MB/s) | 33.44 | 21.93 -34% | 31.85 -5% | 33.03 -1% | 28.08 -16% | 28.74 -14% |
| Write 4k (MB/s) | 67.5 | 30.94 -54% | 68.5 1% | 85.2 26% | 71.9 7% | 90.5 34% |
| Read 4k QD32 (MB/s) | 368.5 | 339.5 -8% | 360.9 -2% | 235.6 -36% | 262 -29% | 300.5 -18% |
| Write 4k QD32 (MB/s) | 280.6 | 342.9 22% | 276.2 -2% | 234.4 -16% | 274.7 -2% | 243.3 -13% |
| 3DMark 06 Standard Score | 9977 points | |
| 3DMark 11 Performance | 1648 points | |
| 3DMark Ice Storm Standard Score | 57874 points | |
| 3DMark Cloud Gate Standard Score | 5745 points | |
| 3DMark Fire Strike Score | 807 points | |
Help | ||
| 3DMark 11 - 1280x720 Performance GPU | |
| Asus Zenbook UX303UB-R4100T | |
| Acer TravelMate X3 X349-M-7261 | |
| Asus Zenbook UX305UA-FC040T | |
| Apple MacBook Air 13 inch 2015-03 | |
| Acer TravelMate P238-M-5575 | |
| Lenovo ThinkPad 13-20GKS01100 | |
| 3DMark | |
| 1280x720 Cloud Gate Standard Graphics | |
| Asus Zenbook UX303UB-R4100T | |
| Acer TravelMate P238-M-5575 | |
| Apple MacBook Air 13 inch 2015-03 | |
| Acer TravelMate X3 X349-M-7261 | |
| Asus Zenbook UX305UA-FC040T | |
| Lenovo ThinkPad 13-20GKS01100 | |
| 1920x1080 Fire Strike Graphics | |
| Asus Zenbook UX303UB-R4100T | |
| Apple MacBook Air 13 inch 2015-03 | |
| Asus Zenbook UX305UA-FC040T | |
| Acer TravelMate X3 X349-M-7261 | |
| Acer TravelMate P238-M-5575 | |
| Lenovo ThinkPad 13-20GKS01100 | |
| low | med. | high | ultra | |
|---|---|---|---|---|
| Tomb Raider (2013) | 78.1 | 39.8 | 24.3 | 12.2 |
| BioShock Infinite (2013) | 49.9 | 28.3 | 23.4 | 7.6 |
| Battlefield 4 (2013) | 43.1 | 30.7 | 20.2 | 6.1 |
| GTA V (2015) | 35 | 29.5 | 6.9 | |
| Doom (2016) | 21.3 | 17.3 | 9.9 | |
| Deus Ex Mankind Divided (2016) | 12.9 | 8.8 | ||
| FIFA 17 (2016) | 60.8 | 50 | ||
| Mafia 3 (2016) | 8.2 | 6.1 |
Noise level
| Idle |
| 31.5 / 31.5 / 31.5 dB(A) |
| Load |
| 31.7 / 34.1 dB(A) |
 | ||
30 dB silent 40 dB(A) audible 50 dB(A) loud |
||
min: | ||
| Acer TravelMate X3 X349-M-7261 6500U, HD Graphics 520 | Apple MacBook Air 13 inch 2015-03 5650U, HD Graphics 6000 | Lenovo ThinkPad 13-20GKS01100 6200U, HD Graphics 520 | Acer TravelMate P238-M-5575 6200U, HD Graphics 520 | Asus Zenbook UX305UA-FC040T 6500U, HD Graphics 520 | Asus Zenbook UX303UB-R4100T 6500U, GeForce 940M | |
|---|---|---|---|---|---|---|
| Noise | -8% | 6% | -4% | -5% | -5% | |
| off / environment * (dB) | 31.15 | 29.1 7% | 31.2 -0% | 31.3 -0% | ||
| Idle Minimum * (dB) | 31.5 | 29.2 7% | 29.1 8% | 31.2 1% | 31.3 1% | 31.5 -0% |
| Idle Average * (dB) | 31.5 | 29.2 7% | 29.1 8% | 31.2 1% | 31.3 1% | 31.5 -0% |
| Idle Maximum * (dB) | 31.5 | 29.2 7% | 29.1 8% | 31.2 1% | 32.2 -2% | 31.5 -0% |
| Load Average * (dB) | 31.7 | 40.2 -27% | 31.5 1% | 35.71 -13% | 37.6 -19% | 35.9 -13% |
| Load Maximum * (dB) | 34.1 | 46.3 -36% | 33.5 2% | 38.1 -12% | 38 -11% | 38.2 -12% |
* ... smaller is better
(+) The maximum temperature on the upper side is 38.6 °C / 101 F, compared to the average of 35.9 °C / 97 F, ranging from 21.4 to 59 °C for the class Subnotebook.
(+) The bottom heats up to a maximum of 39.5 °C / 103 F, compared to the average of 39.2 °C / 103 F
(+) In idle usage, the average temperature for the upper side is 24.2 °C / 76 F, compared to the device average of 30.8 °C / 87 F.
(+) The palmrests and touchpad are cooler than skin temperature with a maximum of 28.3 °C / 82.9 F and are therefore cool to the touch.
(±) The average temperature of the palmrest area of similar devices was 28.2 °C / 82.8 F (-0.1 °C / -0.1 F).
| Acer TravelMate X3 X349-M-7261 6500U, HD Graphics 520 | Apple MacBook Air 13 inch 2015-03 5650U, HD Graphics 6000 | Lenovo ThinkPad 13-20GKS01100 6200U, HD Graphics 520 | Acer TravelMate P238-M-5575 6200U, HD Graphics 520 | Asus Zenbook UX305UA-FC040T 6500U, HD Graphics 520 | Asus Zenbook UX303UB-R4100T 6500U, GeForce 940M | |
|---|---|---|---|---|---|---|
| Heat | -12% | -20% | 4% | 0% | -19% | |
| Maximum Upper Side * (°C) | 38.6 | 43.8 -13% | 43.7 -13% | 34.2 11% | 40.8 -6% | 56.6 -47% |
| Maximum Bottom * (°C) | 39.5 | 42.1 -7% | 44.2 -12% | 31 22% | 37 6% | 54.3 -37% |
| Idle Upper Side * (°C) | 24.8 | 28.5 -15% | 31.4 -27% | 27.1 -9% | 25.2 -2% | 24 3% |
| Idle Bottom * (°C) | 25.4 | 28.9 -14% | 32.1 -26% | 27.7 -9% | 24.9 2% | 24.2 5% |
* ... smaller is better
Acer TravelMate X3 X349-M-7261 audio analysis
(-) | not very loud speakers (66 dB)
Bass 100 - 315 Hz
(-) | nearly no bass - on average 17.8% lower than median
(±) | linearity of bass is average (12.9% delta to prev. frequency)
Mids 400 - 2000 Hz
(+) | balanced mids - only 4.9% away from median
(±) | linearity of mids is average (10.9% delta to prev. frequency)
Highs 2 - 16 kHz
(+) | balanced highs - only 4.8% away from median
(±) | linearity of highs is average (8.1% delta to prev. frequency)
Overall 100 - 16.000 Hz
(±) | linearity of overall sound is average (25.1% difference to median)
Compared to same class
» 84% of all tested devices in this class were better, 4% similar, 12% worse
» The best had a delta of 5%, average was 18%, worst was 53%
Compared to all devices tested
» 77% of all tested devices were better, 5% similar, 18% worse
» The best had a delta of 4%, average was 24%, worst was 134%
Apple MacBook 12 (Early 2016) 1.1 GHz audio analysis
(+) | speakers can play relatively loud (83.6 dB)
Bass 100 - 315 Hz
(±) | reduced bass - on average 11.3% lower than median
(±) | linearity of bass is average (14.2% delta to prev. frequency)
Mids 400 - 2000 Hz
(+) | balanced mids - only 2.4% away from median
(+) | mids are linear (5.5% delta to prev. frequency)
Highs 2 - 16 kHz
(+) | balanced highs - only 2% away from median
(+) | highs are linear (4.5% delta to prev. frequency)
Overall 100 - 16.000 Hz
(+) | overall sound is linear (10.2% difference to median)
Compared to same class
» 7% of all tested devices in this class were better, 2% similar, 91% worse
» The best had a delta of 5%, average was 18%, worst was 53%
Compared to all devices tested
» 5% of all tested devices were better, 1% similar, 94% worse
» The best had a delta of 4%, average was 24%, worst was 134%
| Off / Standby | |
| Idle | |
| Load |
|
Key:
min: | |
| Acer TravelMate X3 X349-M-7261 6500U, HD Graphics 520 | Apple MacBook Air 13 inch 2015-03 5650U, HD Graphics 6000 | Lenovo ThinkPad 13-20GKS01100 6200U, HD Graphics 520 | Acer TravelMate P238-M-5575 6200U, HD Graphics 520 | Asus Zenbook UX305UA-FC040T 6500U, HD Graphics 520 | Asus Zenbook UX303UB-R4100T 6500U, GeForce 940M | |
|---|---|---|---|---|---|---|
| Power Consumption | 16% | 21% | 19% | 14% | -18% | |
| Idle Minimum * (Watt) | 4.9 | 2.7 45% | 3.1 37% | 3.2 35% | 3.2 35% | 3.2 35% |
| Idle Average * (Watt) | 7.3 | 5.7 22% | 5.5 25% | 5.5 25% | 6.5 11% | 7.6 -4% |
| Idle Maximum * (Watt) | 9.4 | 6 36% | 6 36% | 6 36% | 6.7 29% | 8 15% |
| Load Average * (Watt) | 26 | 32.1 -23% | 25.8 1% | 29.5 -13% | 30.6 -18% | 47 -81% |
| Load Maximum * (Watt) | 36 | 36.2 -1% | 33.6 7% | 30.9 14% | 31 14% | 55 -53% |
* ... smaller is better
| Acer TravelMate X3 X349-M-7261 6500U, HD Graphics 520, 48.9 Wh | Apple MacBook Air 13 inch 2015-03 5650U, HD Graphics 6000, 54 Wh | Lenovo ThinkPad 13-20GKS01100 6200U, HD Graphics 520, 42 Wh | Acer TravelMate P238-M-5575 6200U, HD Graphics 520, 49.7 Wh | Asus Zenbook UX305UA-FC040T 6500U, HD Graphics 520, 56 Wh | Asus Zenbook UX303UB-R4100T 6500U, GeForce 940M, 50 Wh | |
|---|---|---|---|---|---|---|
| Battery runtime | 60% | 18% | 56% | 51% | 17% | |
| Reader / Idle (h) | 11.3 | 26.2 132% | 15.7 39% | 21.5 90% | 23.8 111% | 16.6 47% |
| H.264 (h) | 6.7 | 7.8 16% | 9.3 39% | 9.1 36% | 6.9 3% | |
| WiFi v1.3 (h) | 6.5 | 10.3 58% | 6.2 -5% | 10.1 55% | 9.4 45% | 6.8 5% |
| Load (h) | 1.8 | 1.6 -11% | 2.2 22% | 2.5 39% | 2 11% | 2 11% |
Pros
Cons
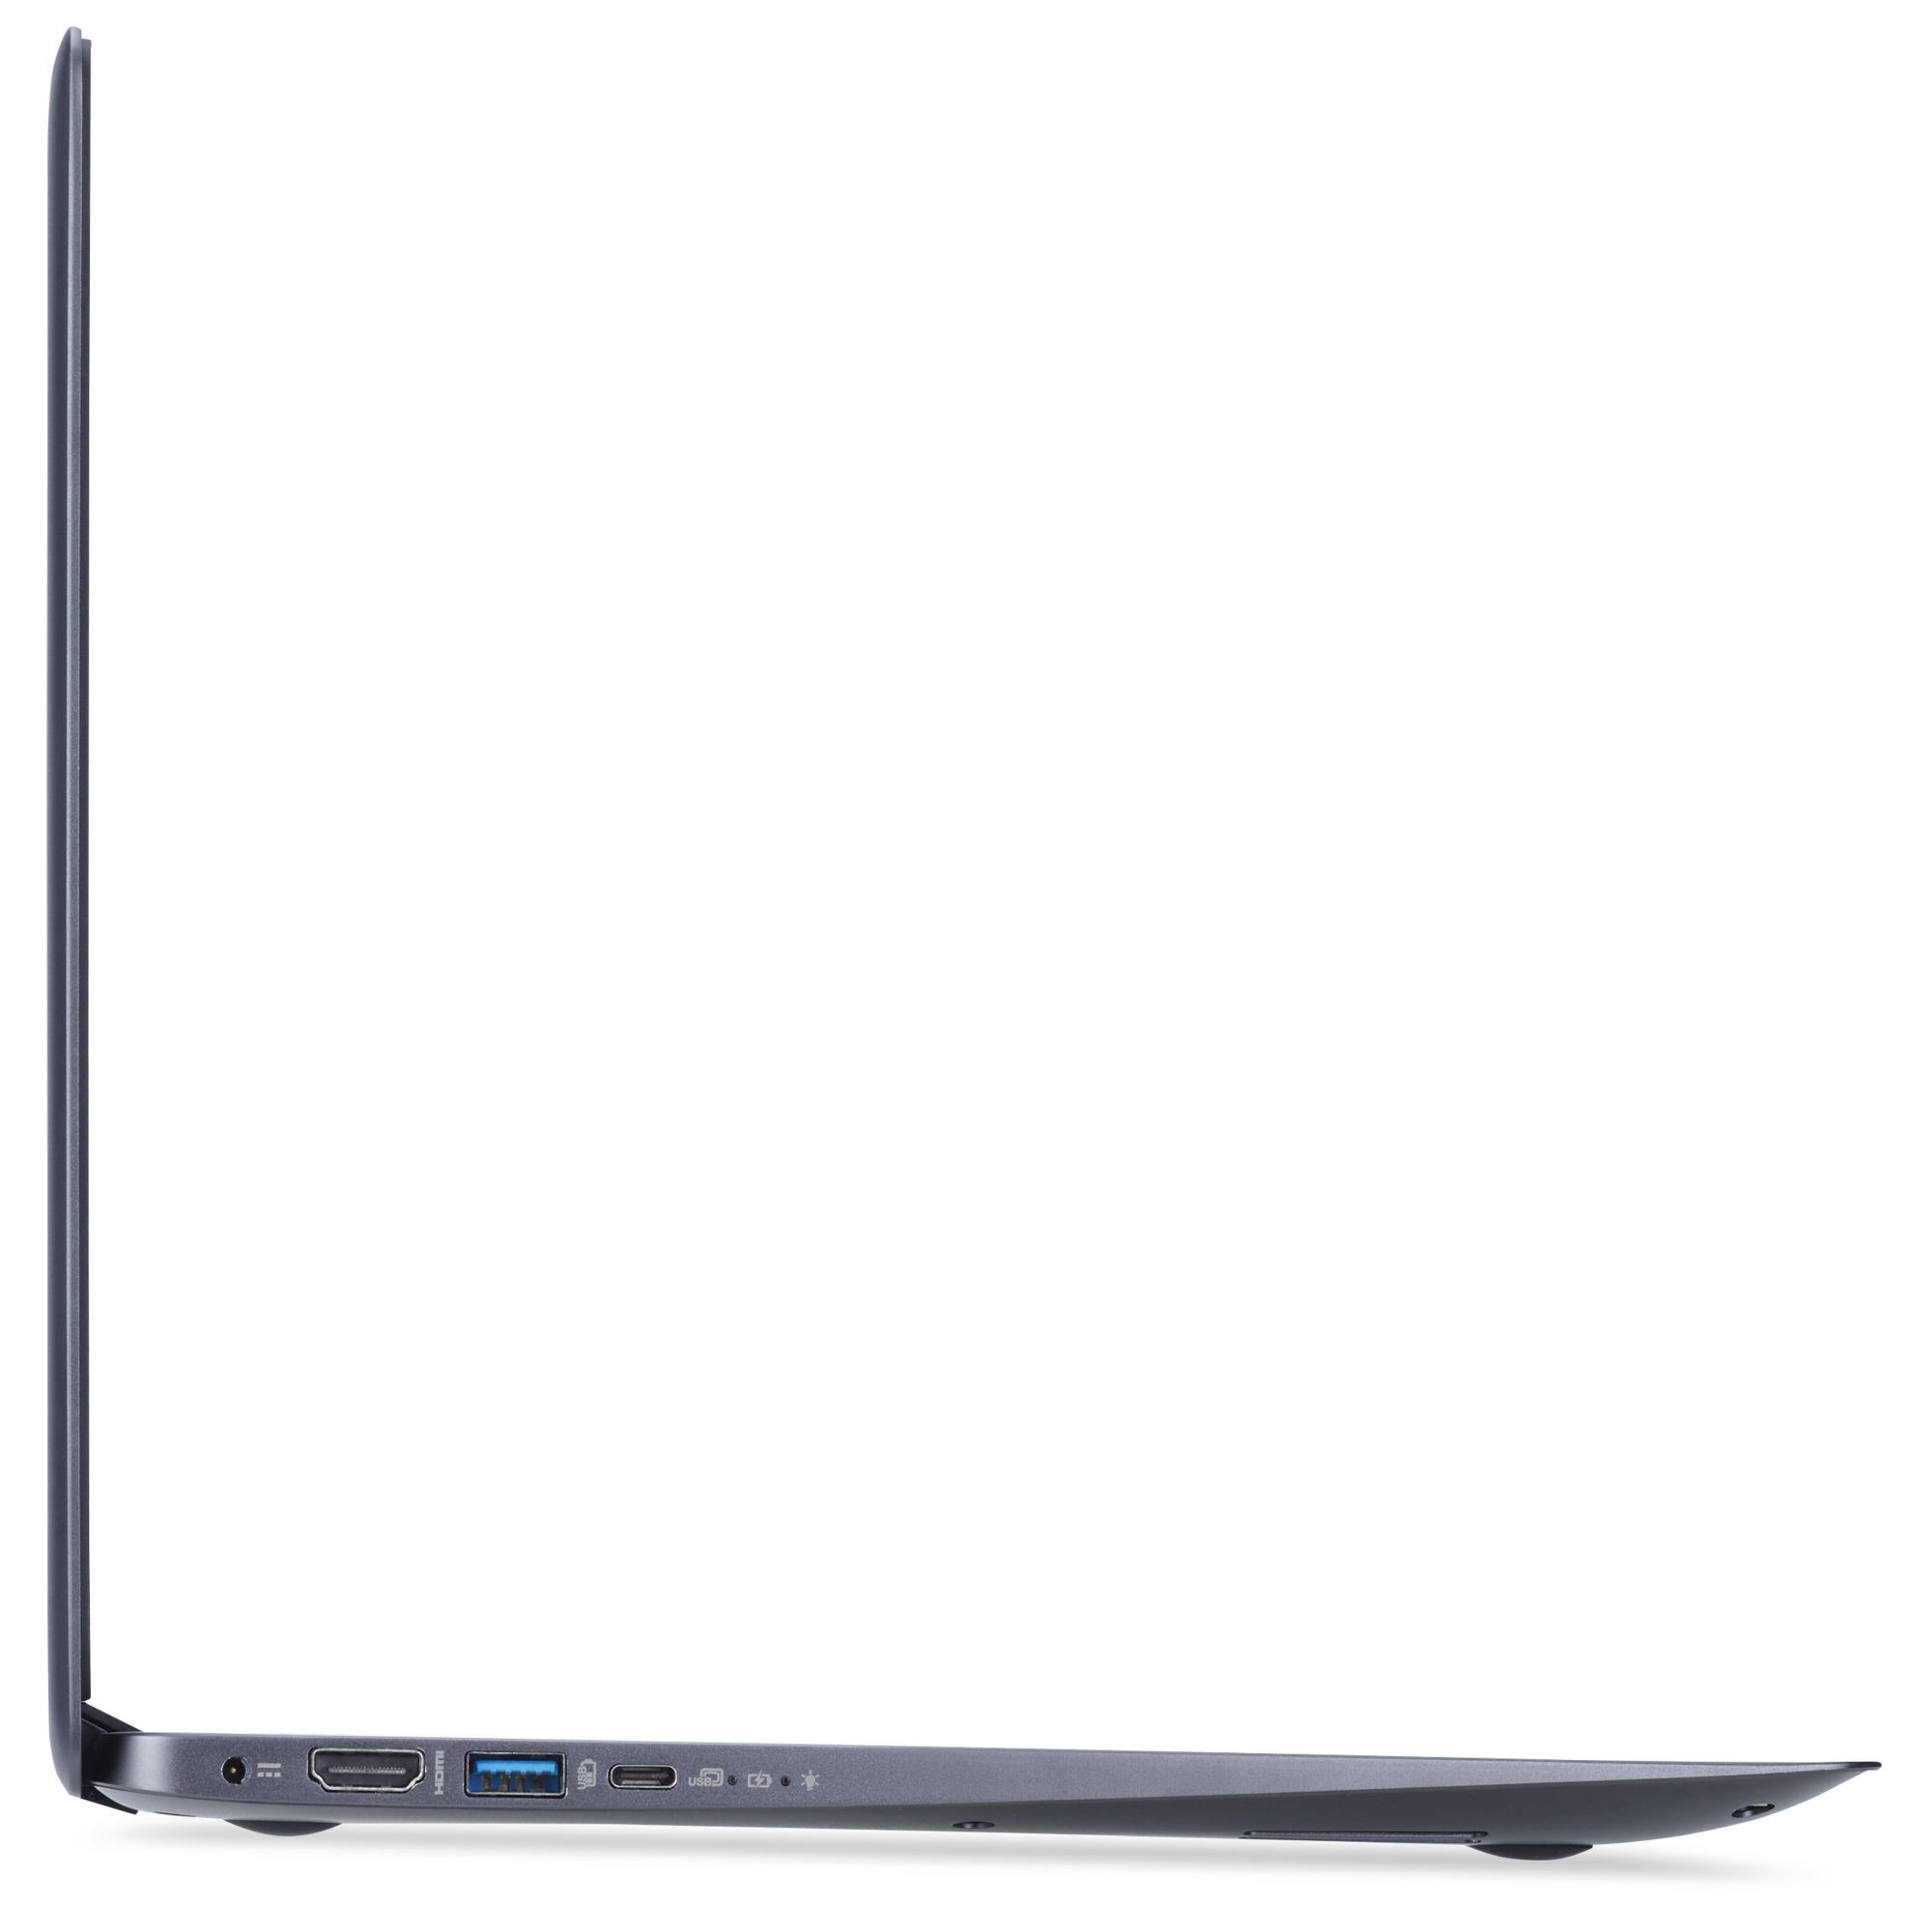
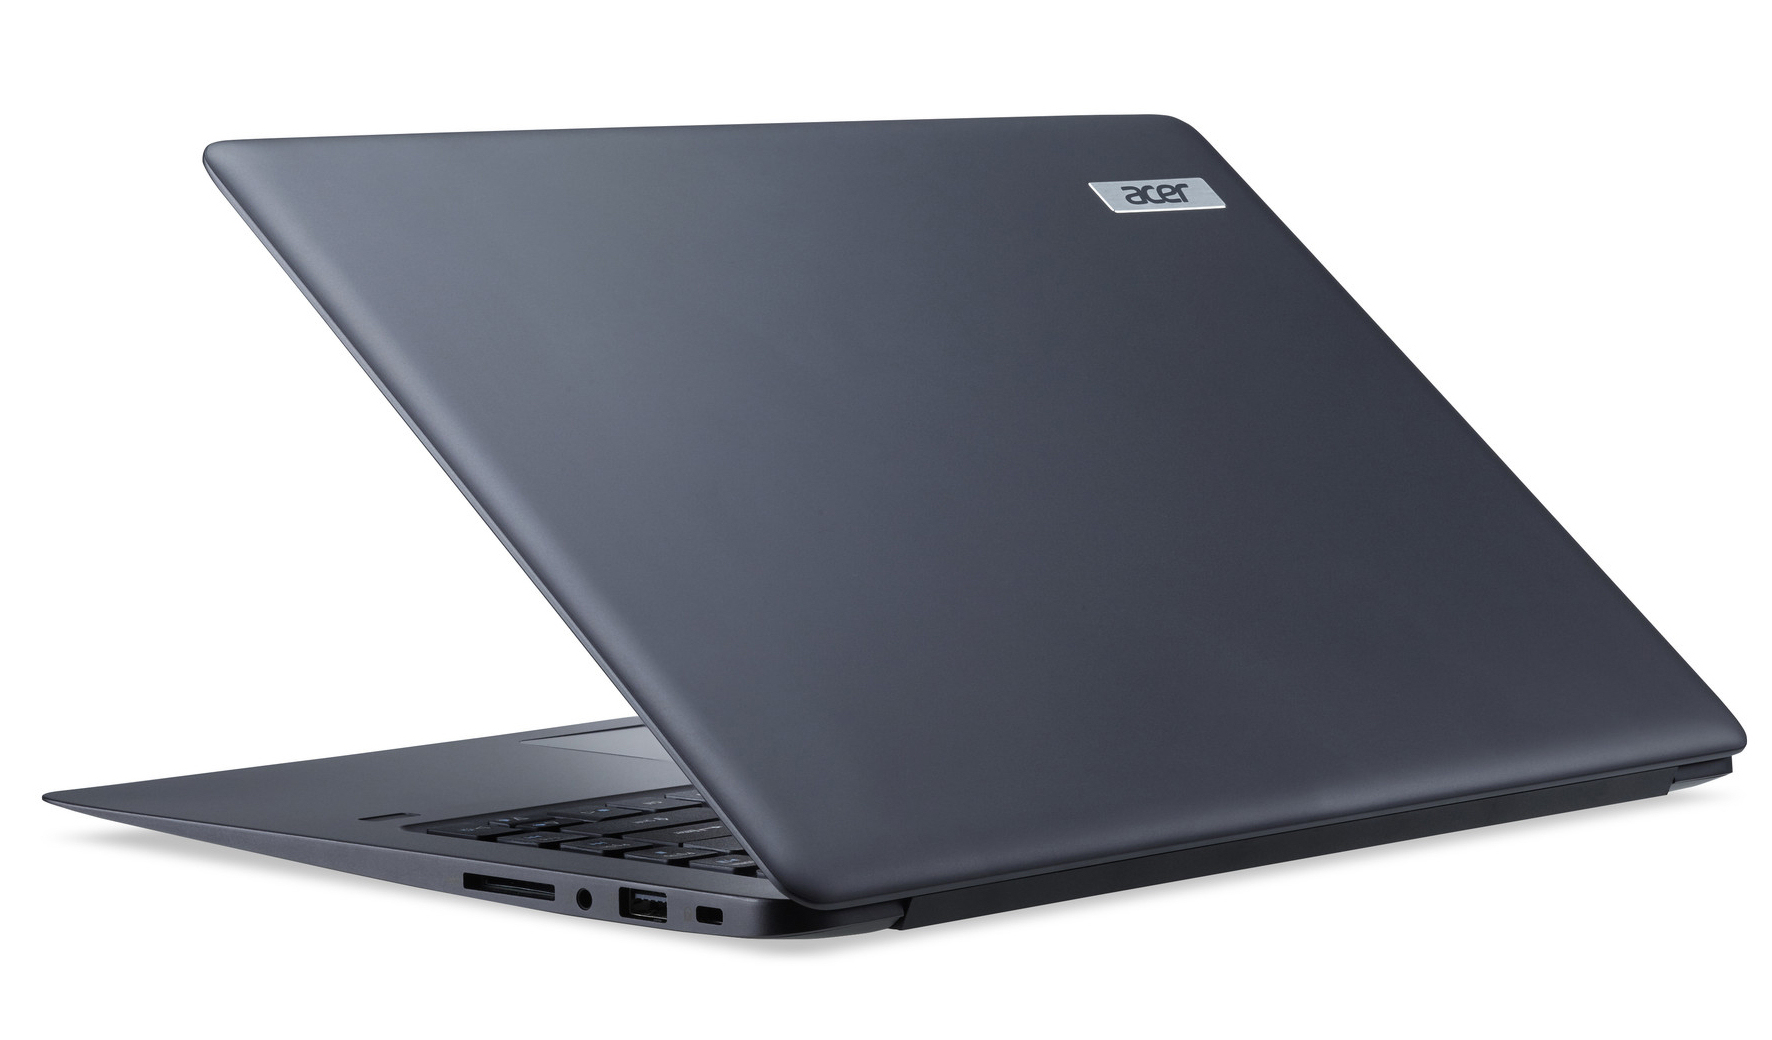
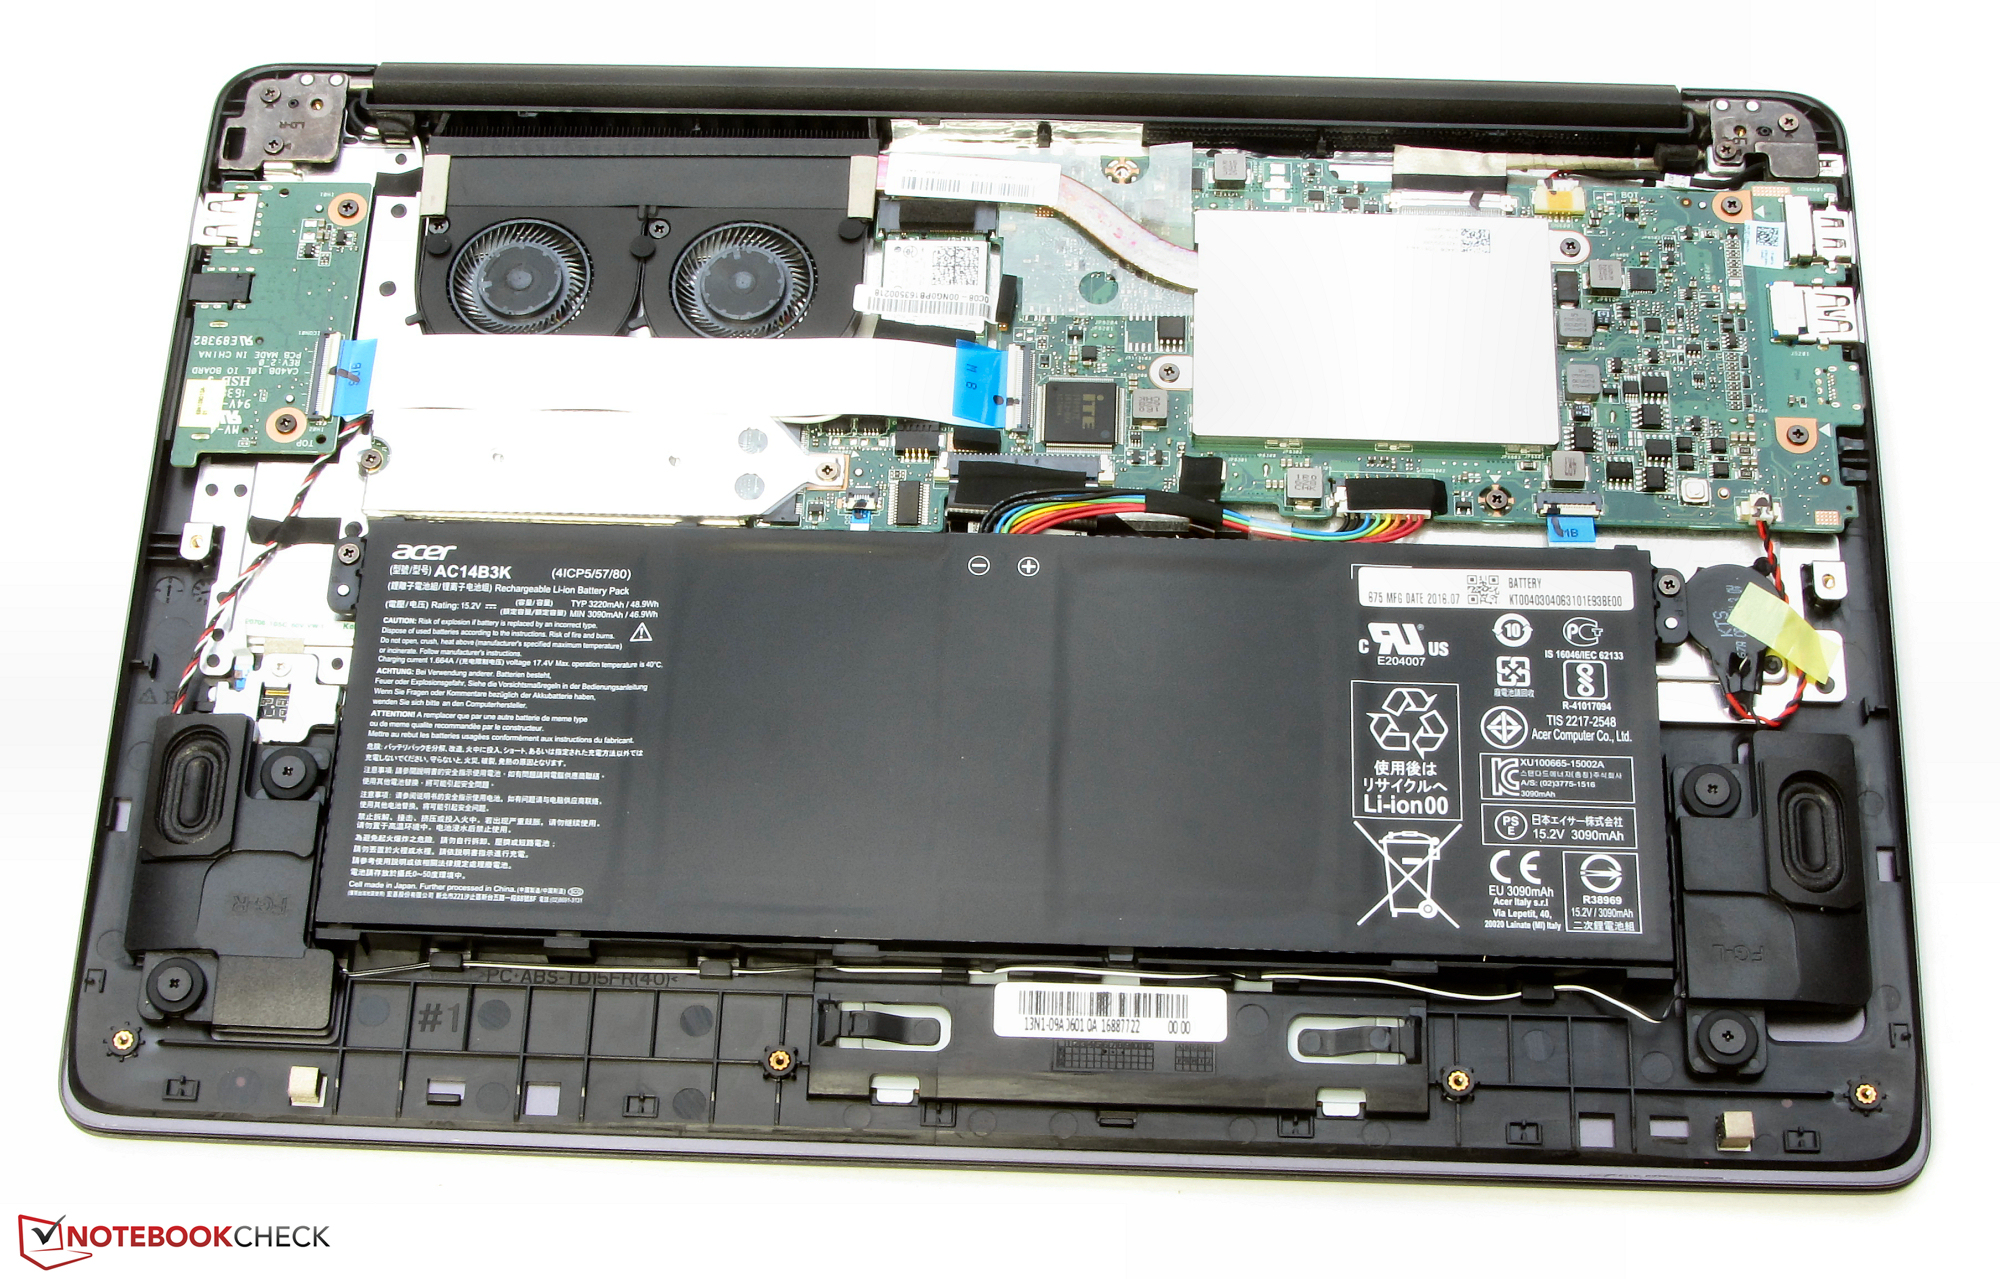
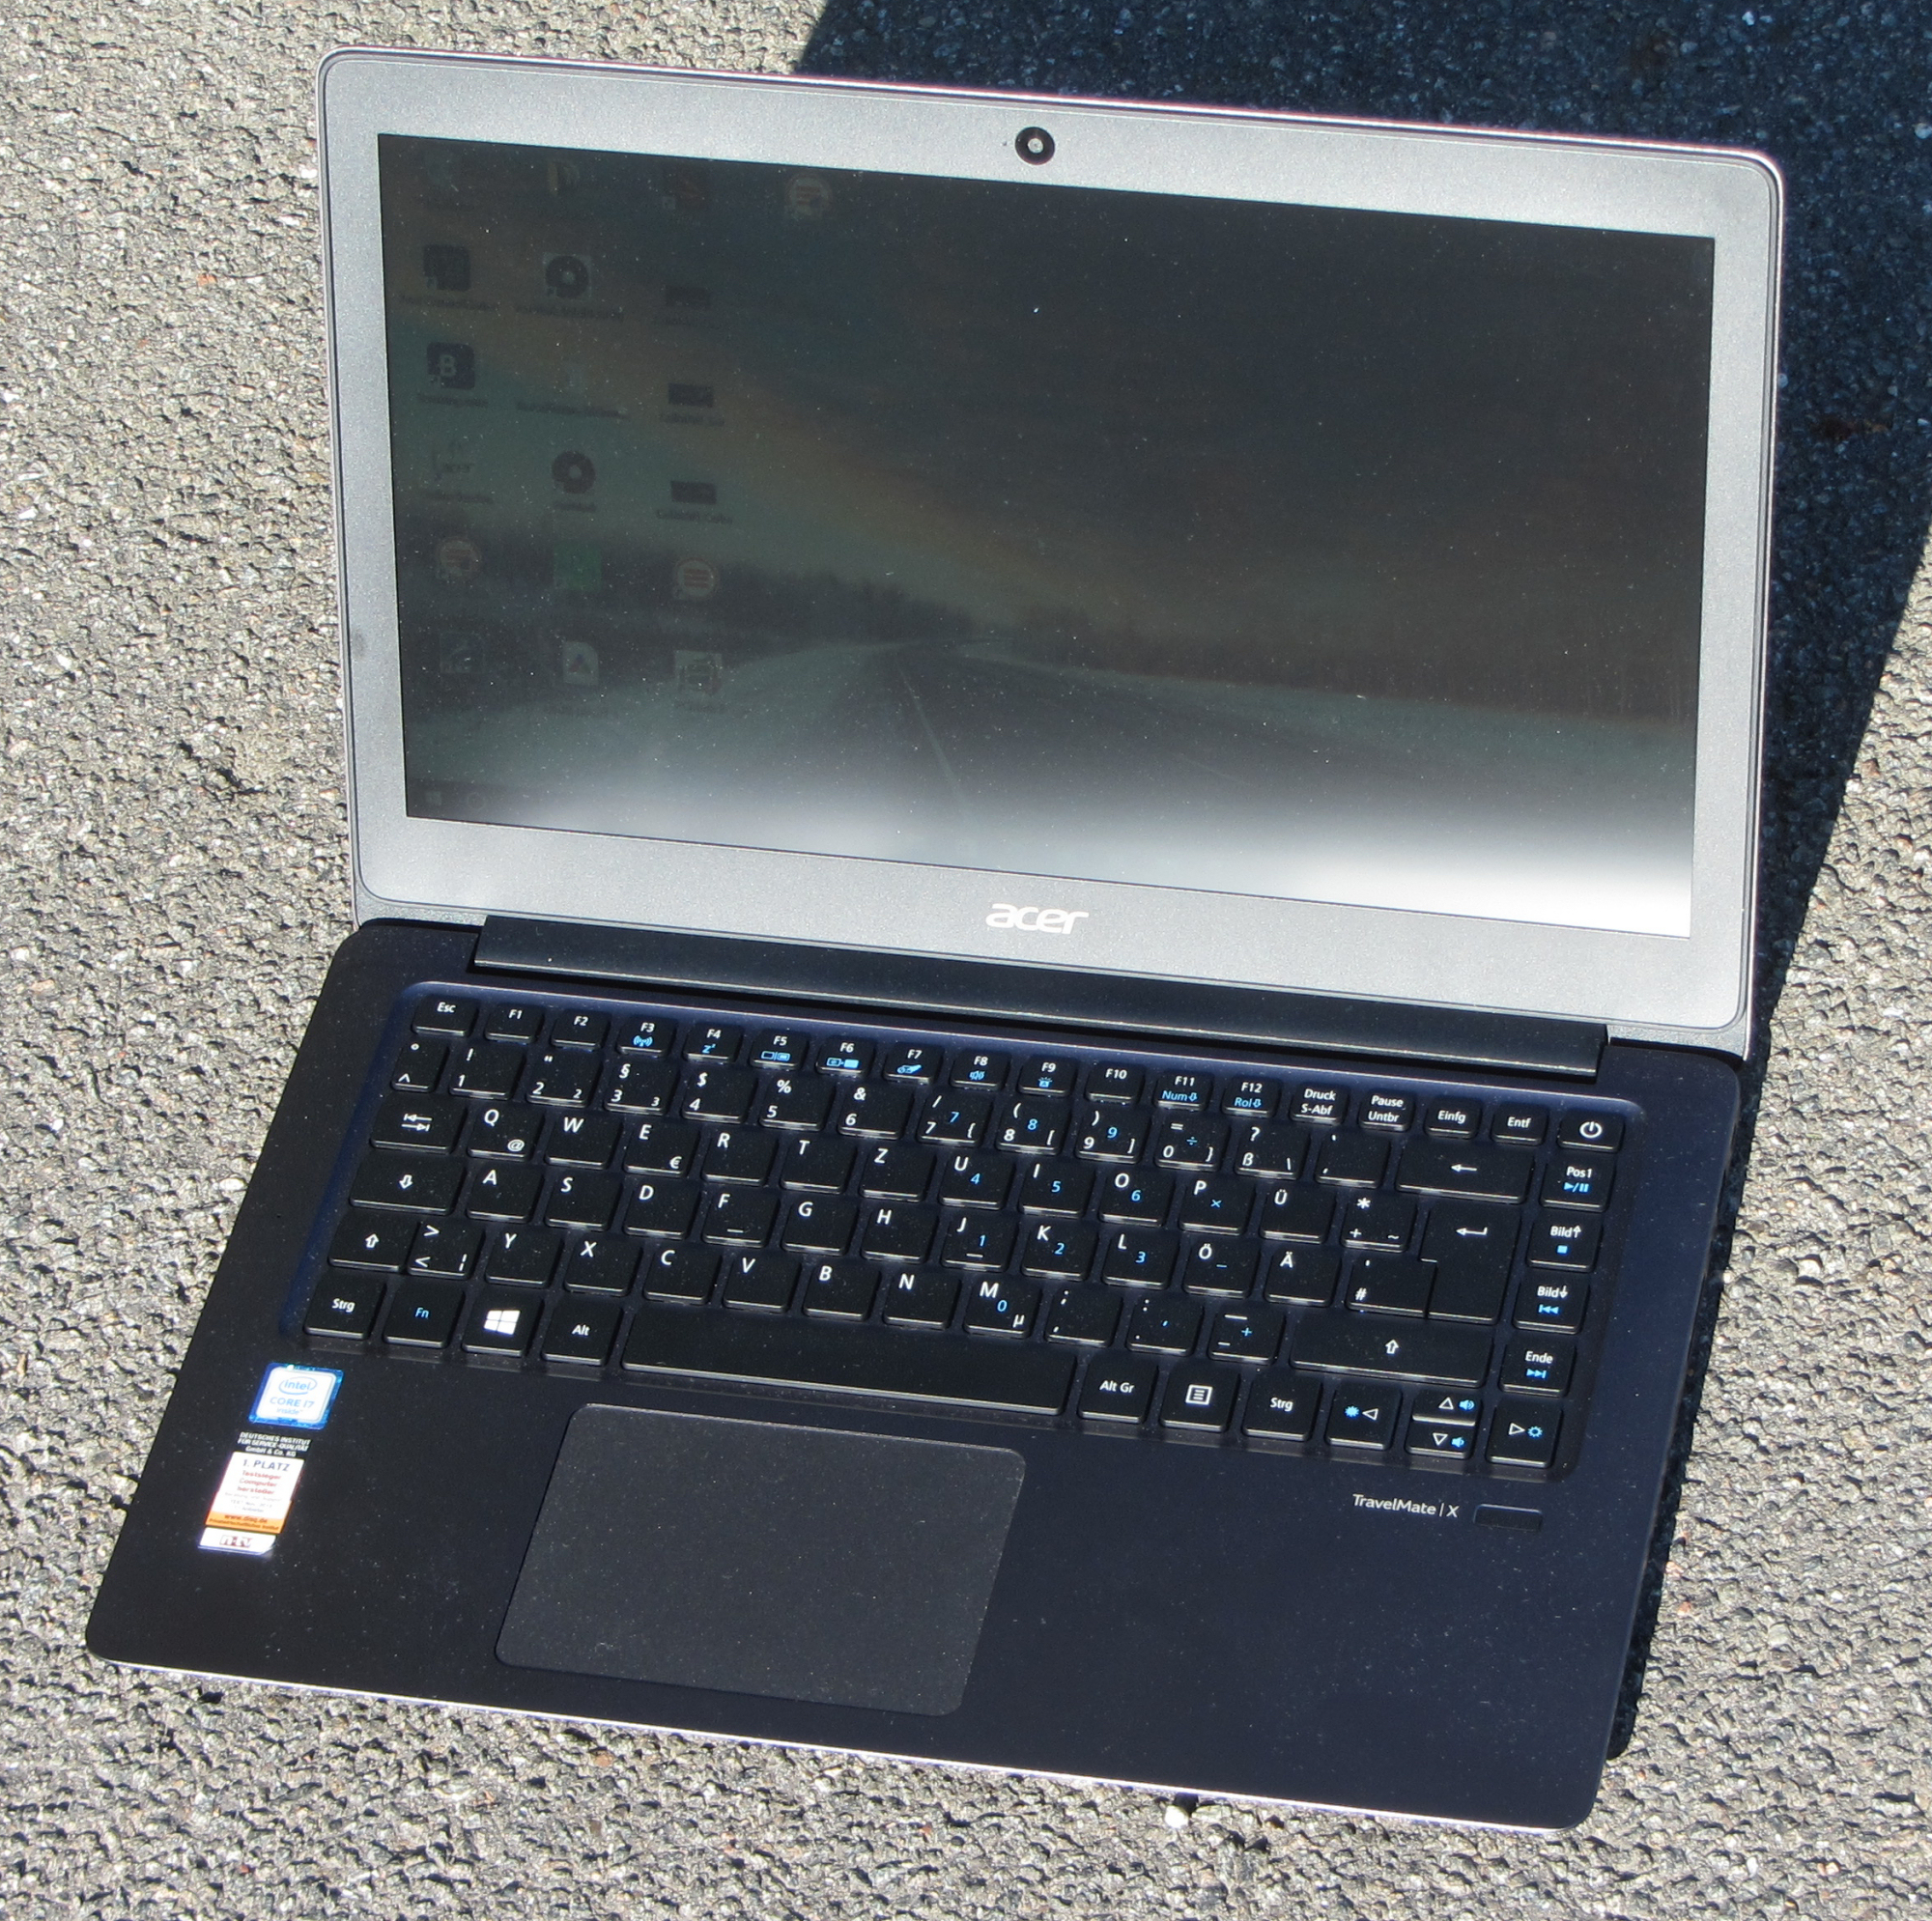
这台Travelmate将先进科技封存在了一个雅致纤薄的铝合金机身中。它也不缺乏处理性能:酷睿i7为各类应用都可以提供充足的运算性能。这台笔记本电脑运行安静,发热量合理。高速固态硬盘保证了系统的高速响应。用户可以通过打开机身升级硬盘。支持背光的键盘提供了不错的输入体验,而优秀的电池续航则让它更加全面。可视角度稳定的磨砂IPS屏幕提供了高对比度和非常准确的色彩还原。遗憾的是,它的屏幕亮度较低。三年的质保可以让用户高枕无忧。
宏碁的这台纤薄典雅的办公设备应该会受到很多用户的喜爱。
我们测试的是它的高配置型号。它的售价1050欧元,并不算是实惠型设备。不过售价不足600欧元(约4419人民币)的入门机型(Travelmate X3 X349-M-3373)应该会对更多消费者有更大的吸引力。这款Travelmate机型的配置(酷睿 i3-6100U,4GB内存,128GB固态硬盘,全高清IPS屏幕)应该可以满足大部分情况的需要。
注:本文是基于完整评测的缩减版本,阅读完整的英文评测,请点击这里。
Acer TravelMate X3 X349-M-7261
- 10/14/2016 v5.1 (old)
Sascha Mölck