富士通 Lifebook U747 笔记本简短评测

| SD Card Reader | |
| average JPG Copy Test (av. of 3 runs) | |
| Dell XPS 13 9360 QHD+ i7 | |
| Lenovo ThinkPad T470-20HD002HGE | |
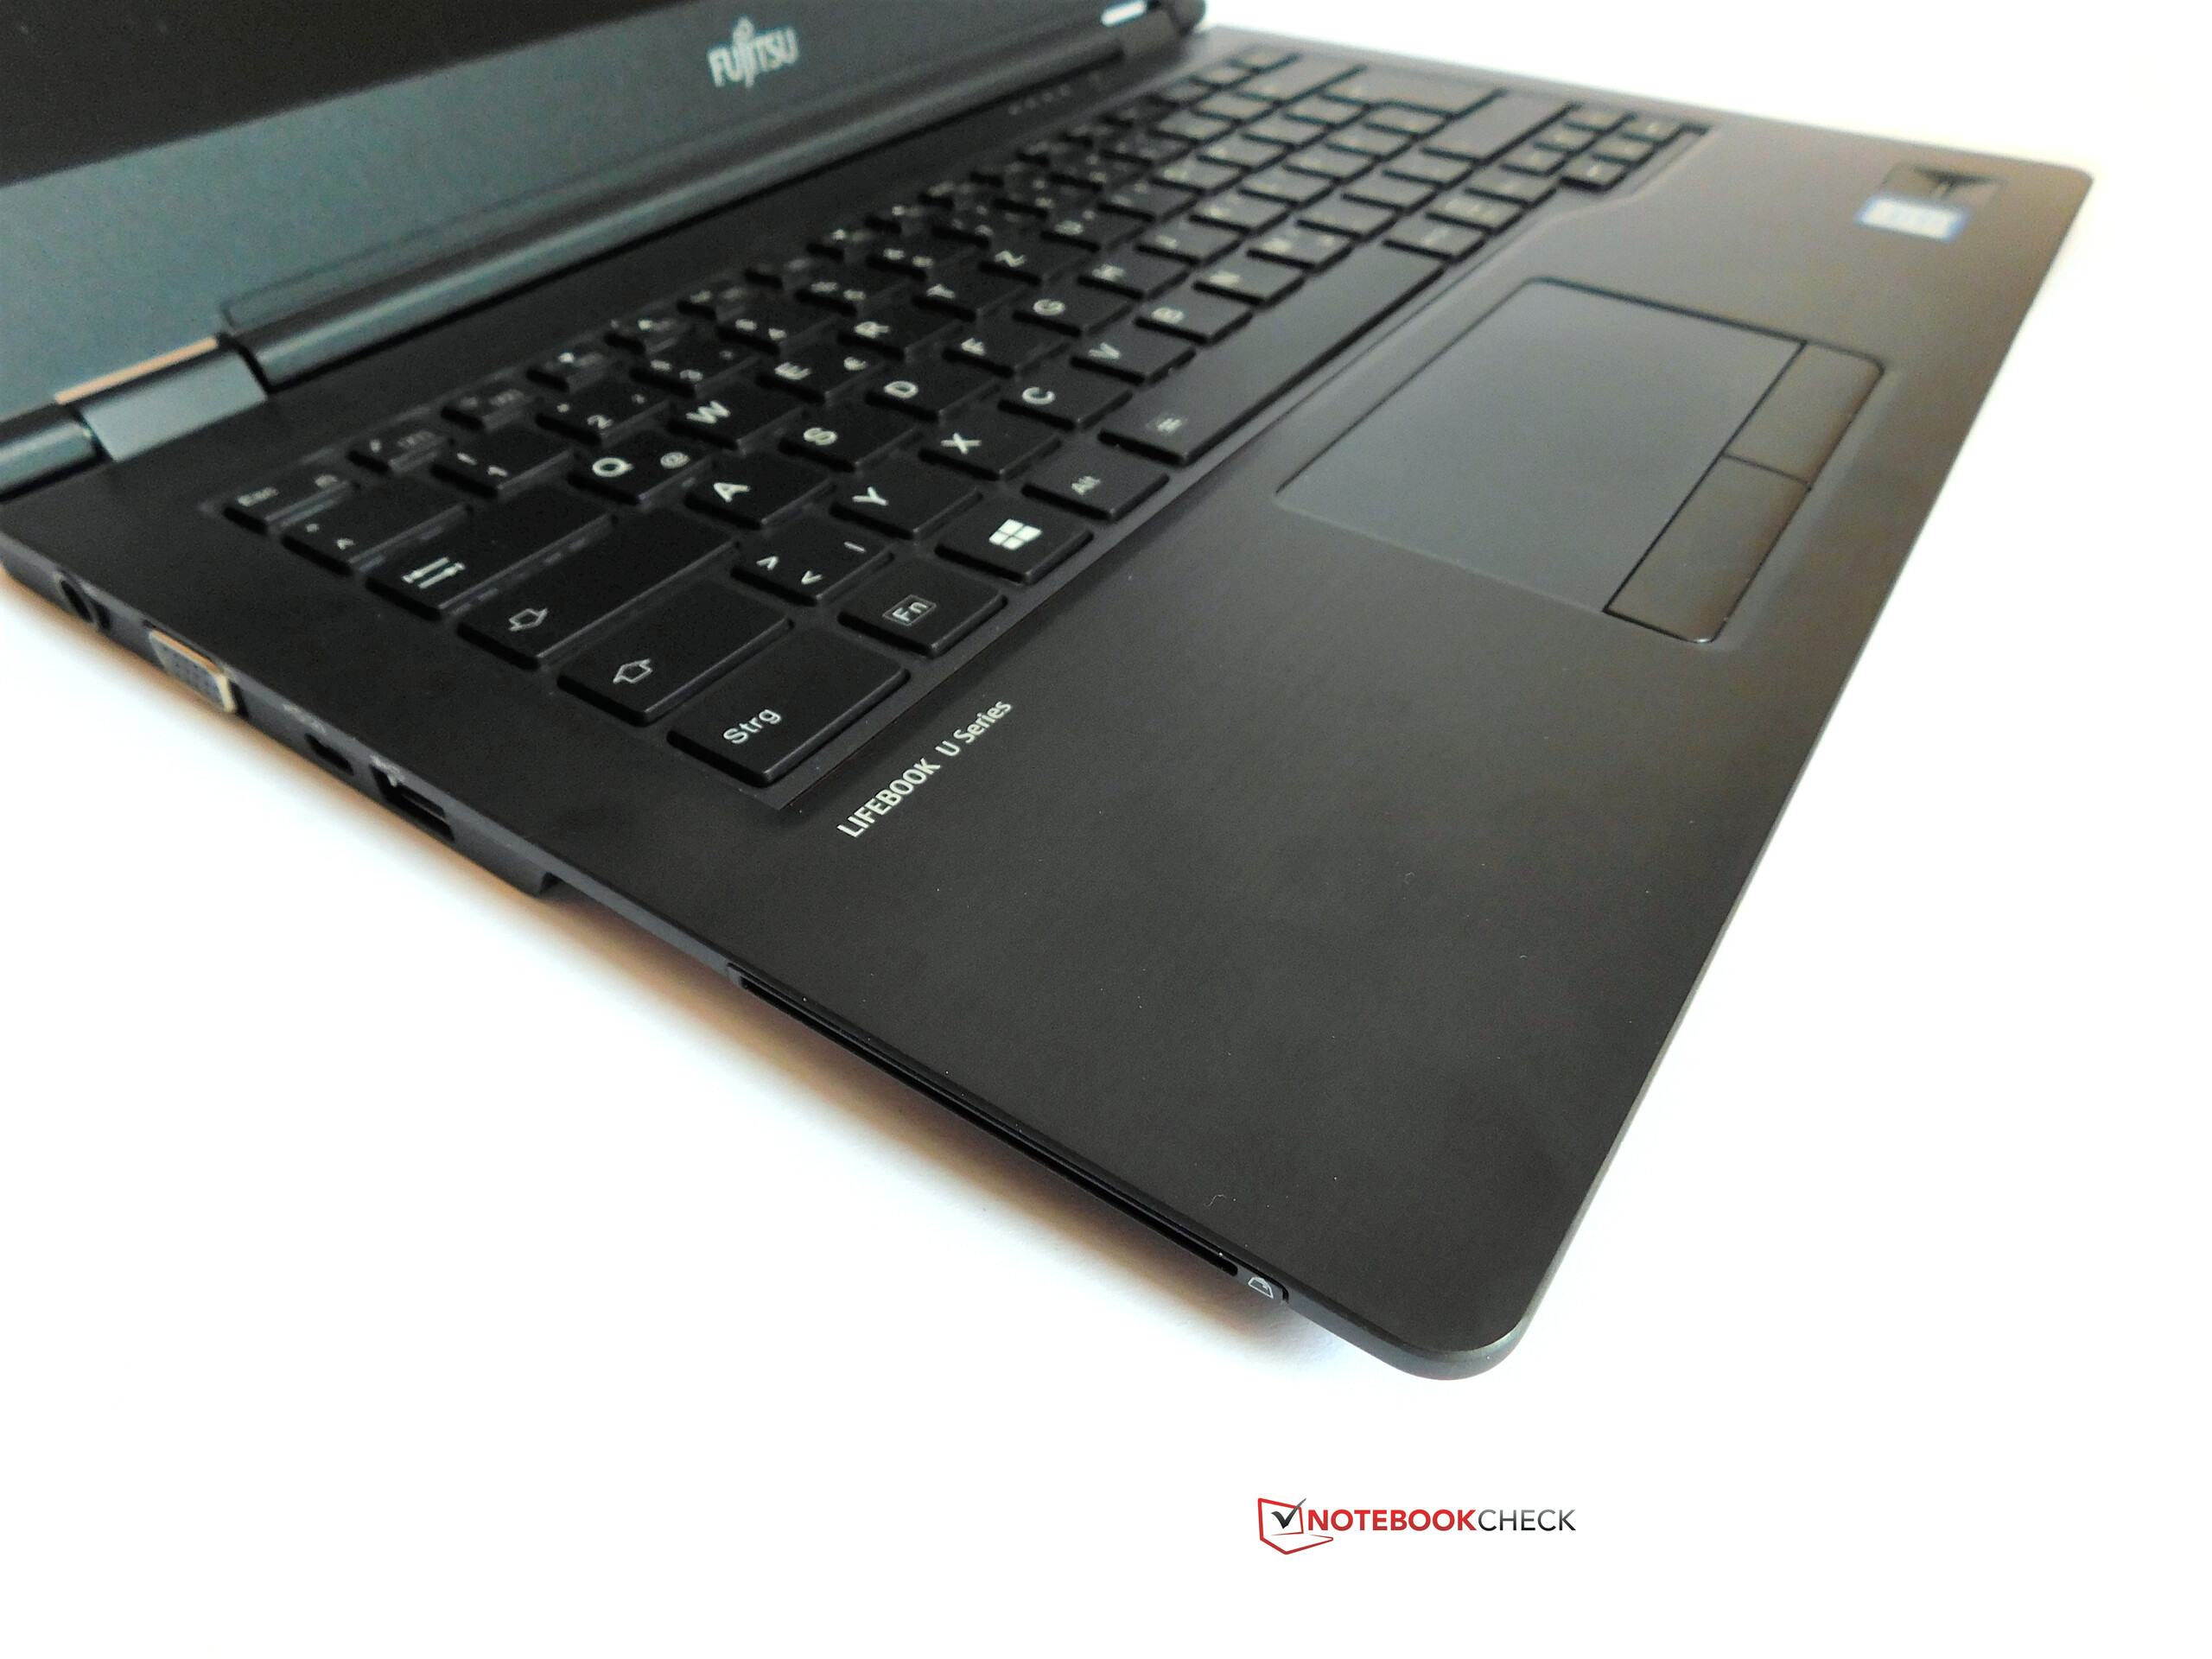
| Fujitsu LifeBook U747 | |
| maximum AS SSD Seq Read Test (1GB) | |
| Dell XPS 13 9360 QHD+ i7 | |
| Lenovo ThinkPad T470-20HD002HGE | |
| Fujitsu LifeBook U747 | |
| Networking | |
| iperf3 transmit AX12 | |
| Lenovo ThinkPad T470-20HD002HGE | |
| Fujitsu LifeBook U747 | |
| HP EliteBook 820 G4 Z2V72ET (jseb) | |
| iperf3 receive AX12 | |
| Lenovo ThinkPad T470-20HD002HGE | |
| Fujitsu LifeBook U747 | |
| HP EliteBook 820 G4 Z2V72ET (jseb) | |
| |||||||||||||||||||||||||
Brightness Distribution: 84 %
Center on Battery: 296 cd/m²
Contrast: 909:1 (Black: 0.32 cd/m²)
ΔE ColorChecker Calman: 4.3 | ∀{0.5-29.43 Ø4.71}
ΔE Greyscale Calman: 4.3 | ∀{0.09-98 Ø4.96}
84.77% sRGB (Argyll 1.6.3 3D)
55.46% AdobeRGB 1998 (Argyll 1.6.3 3D)
62% AdobeRGB 1998 (Argyll 3D)
84.8% sRGB (Argyll 3D)
66.1% Display P3 (Argyll 3D)
Gamma: 2.31
CCT: 6529 K
| Fujitsu LifeBook U747 LG LP140WF3, , 1920x1080, 14" | Lenovo ThinkPad T470-20HD002HGE N140HCA-EAB, , 1920x1080, 14" | Acer TravelMate P648-M-757N AU Optronics B140HAN02.1, , 1920x1080, 14" | Dell Latitude 14 7000 Series E7470 AUO B140QAN Dell PN F0WXVV, , 2560x1440, 14" | HP EliteBook 840 G3 T9X59ET#ABD Chi Mei CMN14C0, , 1920x1080, 14" | |
|---|---|---|---|---|---|
| Display | -32% | -41% | 9% | -19% | |
| Display P3 Coverage (%) | 66.1 | 41.6 -37% | 35.53 -46% | 67.2 2% | 48.93 -26% |
| sRGB Coverage (%) | 84.8 | 61.9 -27% | 53.3 -37% | 95.9 13% | 73.7 -13% |
| AdobeRGB 1998 Coverage (%) | 62 | 43.06 -31% | 36.72 -41% | 69.3 12% | 50.5 -19% |
| Response Times | -32% | -15% | -25% | -14% | |
| Response Time Grey 50% / Grey 80% * (ms) | 36 ? | 41.6 ? -16% | 44 ? -22% | 48 ? -33% | 43 ? -19% |
| Response Time Black / White * (ms) | 23.2 ? | 34 ? -47% | 25 ? -8% | 27 ? -16% | 25 ? -8% |
| PWM Frequency (Hz) | 204 ? | ||||
| Screen | -19% | -3% | 19% | -48% | |
| Brightness middle (cd/m²) | 291 | 306 5% | 254 -13% | 380 31% | 366 26% |
| Brightness (cd/m²) | 296 | 287 -3% | 243 -18% | 354 20% | 336 14% |
| Brightness Distribution (%) | 84 | 88 5% | 90 7% | 81 -4% | 87 4% |
| Black Level * (cd/m²) | 0.32 | 0.3 6% | 0.19 41% | 0.26 19% | 0.65 -103% |
| Contrast (:1) | 909 | 1020 12% | 1337 47% | 1462 61% | 563 -38% |
| Colorchecker dE 2000 * | 4.3 | 6.2 -44% | 4.93 -15% | 3.11 28% | 10.26 -139% |
| Colorchecker dE 2000 max. * | 7.5 | 13.6 -81% | 10.14 -35% | 6.73 10% | |
| Greyscale dE 2000 * | 4.3 | 5.8 -35% | 2.71 37% | 4.35 -1% | 11.51 -168% |
| Gamma | 2.31 95% | 2.04 108% | 2.36 93% | 2.37 93% | 2.4 92% |
| CCT | 6529 100% | 6277 104% | 6914 94% | 6771 96% | 12725 51% |
| Color Space (Percent of AdobeRGB 1998) (%) | 55.46 | 39.62 -29% | 34 -39% | 62 12% | 47 -15% |
| Color Space (Percent of sRGB) (%) | 84.77 | 61.44 -28% | 53 -37% | 96 13% | 74 -13% |
| Total Average (Program / Settings) | -28% /
-23% | -20% /
-12% | 1% /
11% | -27% /
-37% |
* ... smaller is better
Display Response Times
| ↔ Response Time Black to White | ||
|---|---|---|
| 23.2 ms ... rise ↗ and fall ↘ combined | ↗ 12.4 ms rise | 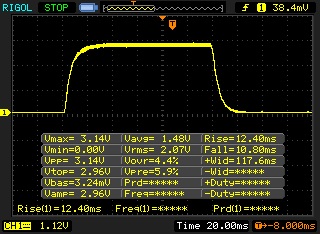 |
| ↘ 10.8 ms fall | ||
| The screen shows good response rates in our tests, but may be too slow for competitive gamers. In comparison, all tested devices range from 0.1 (minimum) to 240 (maximum) ms. » 53 % of all devices are better. This means that the measured response time is worse than the average of all tested devices (19.8 ms). | ||
| ↔ Response Time 50% Grey to 80% Grey | ||
| 36 ms ... rise ↗ and fall ↘ combined | ↗ 16.4 ms rise | 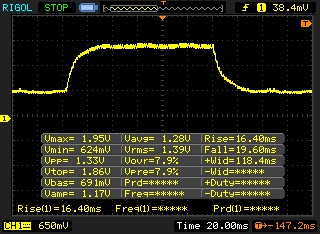 |
| ↘ 19.6 ms fall | ||
| The screen shows slow response rates in our tests and will be unsatisfactory for gamers. In comparison, all tested devices range from 0.165 (minimum) to 636 (maximum) ms. » 51 % of all devices are better. This means that the measured response time is worse than the average of all tested devices (31 ms). | ||
Screen Flickering / PWM (Pulse-Width Modulation)
| Screen flickering / PWM not detected | ||
In comparison: 52 % of all tested devices do not use PWM to dim the display. If PWM was detected, an average of 7757 (minimum: 5 - maximum: 343500) Hz was measured. | ||
| PCMark 8 Home Score Accelerated v2 | 3506 points | |
| PCMark 8 Work Score Accelerated v2 | 4653 points | |
Help | ||
| Fujitsu LifeBook U747 Samsung MZYTY256HDHP | Lenovo ThinkPad T470-20HD002HGE Samsung PM961 NVMe MZVLW512HMJP | Acer TravelMate P648-M-757N Lite-On CV1-8B256 | Dell Latitude 14 7000 Series E7470 Samsung SSD PM851 M.2 2280 256GB | HP EliteBook 840 G3 T9X59ET#ABD Samsung SSD PM851 256 GB MZNTE256HMHP | Lenovo ThinkPad T470s-20HGS00V00 Samsung SSD PM961 1TB M.2 PCIe 3.0 x4 NVMe (MZVLW1T0) | |
|---|---|---|---|---|---|---|
| CrystalDiskMark 3.0 | 94% | -9% | -5% | -13% | 148% | |
| Read Seq (MB/s) | 504 | 1155 129% | 531 5% | 518 3% | 497.8 -1% | 1760 249% |
| Write Seq (MB/s) | 497.8 | 1076 116% | 358.8 -28% | 300.7 -40% | 241.4 -52% | 1666 235% |
| Read 512 (MB/s) | 396.7 | 811 104% | 384.8 -3% | 470.8 19% | 396 0% | 832 110% |
| Write 512 (MB/s) | 283.4 | 862 204% | 363 28% | 214 -24% | 241.8 -15% | 1064 275% |
| Read 4k (MB/s) | 35.73 | 55.5 55% | 31.3 -12% | 36.32 2% | 27.02 -24% | 53.2 49% |
| Write 4k (MB/s) | 87.8 | 134.6 53% | 80.3 -9% | 110.9 26% | 82.6 -6% | 167.4 91% |
| Read 4k QD32 (MB/s) | 399.1 | 496.2 24% | 239.4 -40% | 400.9 0% | 388.5 -3% | 630 58% |
| Write 4k QD32 (MB/s) | 249.7 | 425.4 70% | 225.3 -10% | 191.7 -23% | 242.8 -3% | 533 113% |

| 3DMark 11 Performance | 1524 points | |
| 3DMark Cloud Gate Standard Score | 5656 points | |
| 3DMark Fire Strike Score | 738 points | |
Help | ||
| low | med. | high | ultra | |
|---|---|---|---|---|
| BioShock Infinite (2013) | 42.35 | 24.15 | 19.85 | |
| Company of Heroes 2 (2013) | 21.04 | 16.04 | ||
| Rise of the Tomb Raider (2016) | 14.45 |
Noise level
| Idle |
| 28.2 / 28.2 / 28.2 dB(A) |
| Load |
| 31.2 / 33 dB(A) |
 | ||
30 dB silent 40 dB(A) audible 50 dB(A) loud |
||
min: | ||
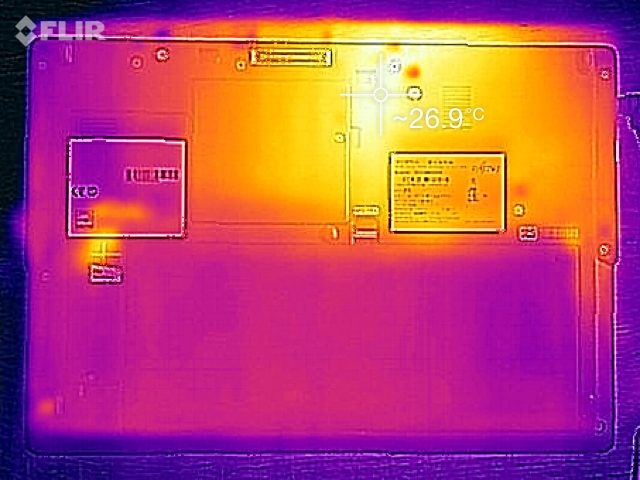
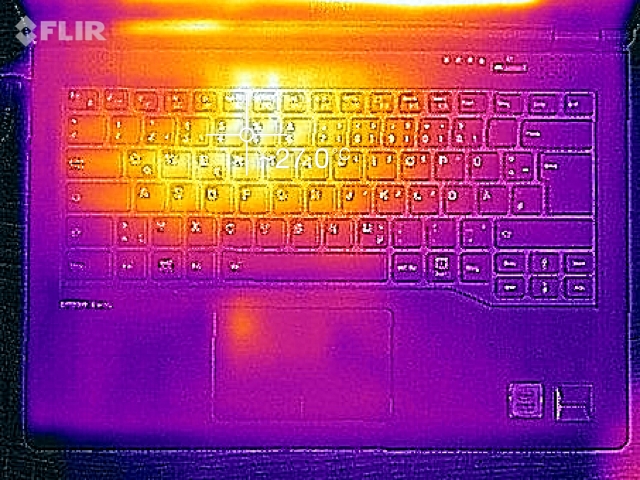
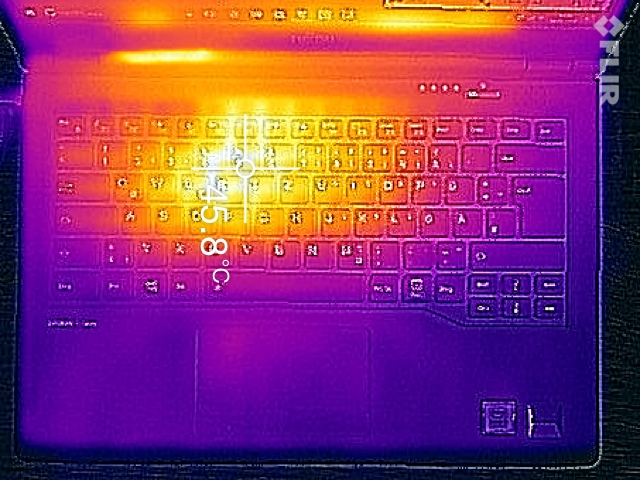
(±) The maximum temperature on the upper side is 42.6 °C / 109 F, compared to the average of 34.3 °C / 94 F, ranging from 21.2 to 62.5 °C for the class Office.
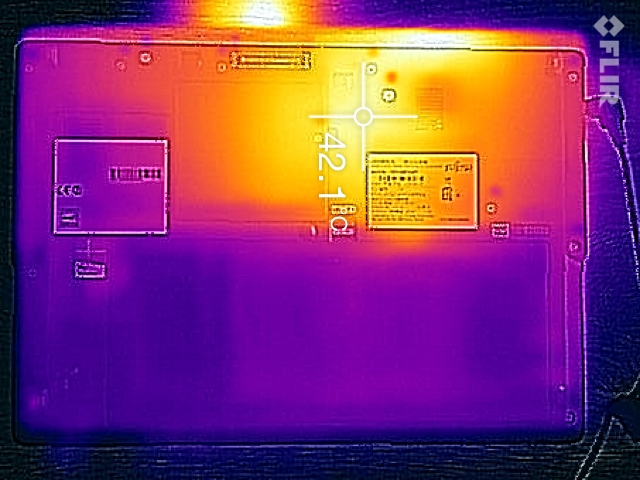
(+) The bottom heats up to a maximum of 34.4 °C / 94 F, compared to the average of 36.8 °C / 98 F
(+) In idle usage, the average temperature for the upper side is 22.8 °C / 73 F, compared to the device average of 29.5 °C / 85 F.
(+) The palmrests and touchpad are cooler than skin temperature with a maximum of 23.7 °C / 74.7 F and are therefore cool to the touch.
(+) The average temperature of the palmrest area of similar devices was 27.5 °C / 81.5 F (+3.8 °C / 6.8 F).
Fujitsu LifeBook U747 audio analysis
(-) | not very loud speakers (68.1 dB)
Bass 100 - 315 Hz
(-) | nearly no bass - on average 15.2% lower than median
(+) | bass is linear (6.6% delta to prev. frequency)
Mids 400 - 2000 Hz
(±) | higher mids - on average 6.1% higher than median
(±) | linearity of mids is average (8.4% delta to prev. frequency)
Highs 2 - 16 kHz
(+) | balanced highs - only 4.4% away from median
(±) | linearity of highs is average (10.4% delta to prev. frequency)
Overall 100 - 16.000 Hz
(±) | linearity of overall sound is average (26.3% difference to median)
Compared to same class
» 81% of all tested devices in this class were better, 7% similar, 13% worse
» The best had a delta of 7%, average was 21%, worst was 53%
Compared to all devices tested
» 81% of all tested devices were better, 4% similar, 15% worse
» The best had a delta of 4%, average was 23%, worst was 134%
Lenovo ThinkPad T470-20HD002HGE audio analysis
(±) | speaker loudness is average but good (80.4 dB)
Bass 100 - 315 Hz
(-) | nearly no bass - on average 16.6% lower than median
(±) | linearity of bass is average (8.8% delta to prev. frequency)
Mids 400 - 2000 Hz
(+) | balanced mids - only 4.3% away from median
(+) | mids are linear (6.7% delta to prev. frequency)
Highs 2 - 16 kHz
(±) | higher highs - on average 5.4% higher than median
(±) | linearity of highs is average (13.3% delta to prev. frequency)
Overall 100 - 16.000 Hz
(±) | linearity of overall sound is average (18.7% difference to median)
Compared to same class
» 35% of all tested devices in this class were better, 6% similar, 59% worse
» The best had a delta of 7%, average was 21%, worst was 53%
Compared to all devices tested
» 43% of all tested devices were better, 8% similar, 49% worse
» The best had a delta of 4%, average was 23%, worst was 134%
| Off / Standby | |
| Idle | |
| Load |
|
Key:
min: | |
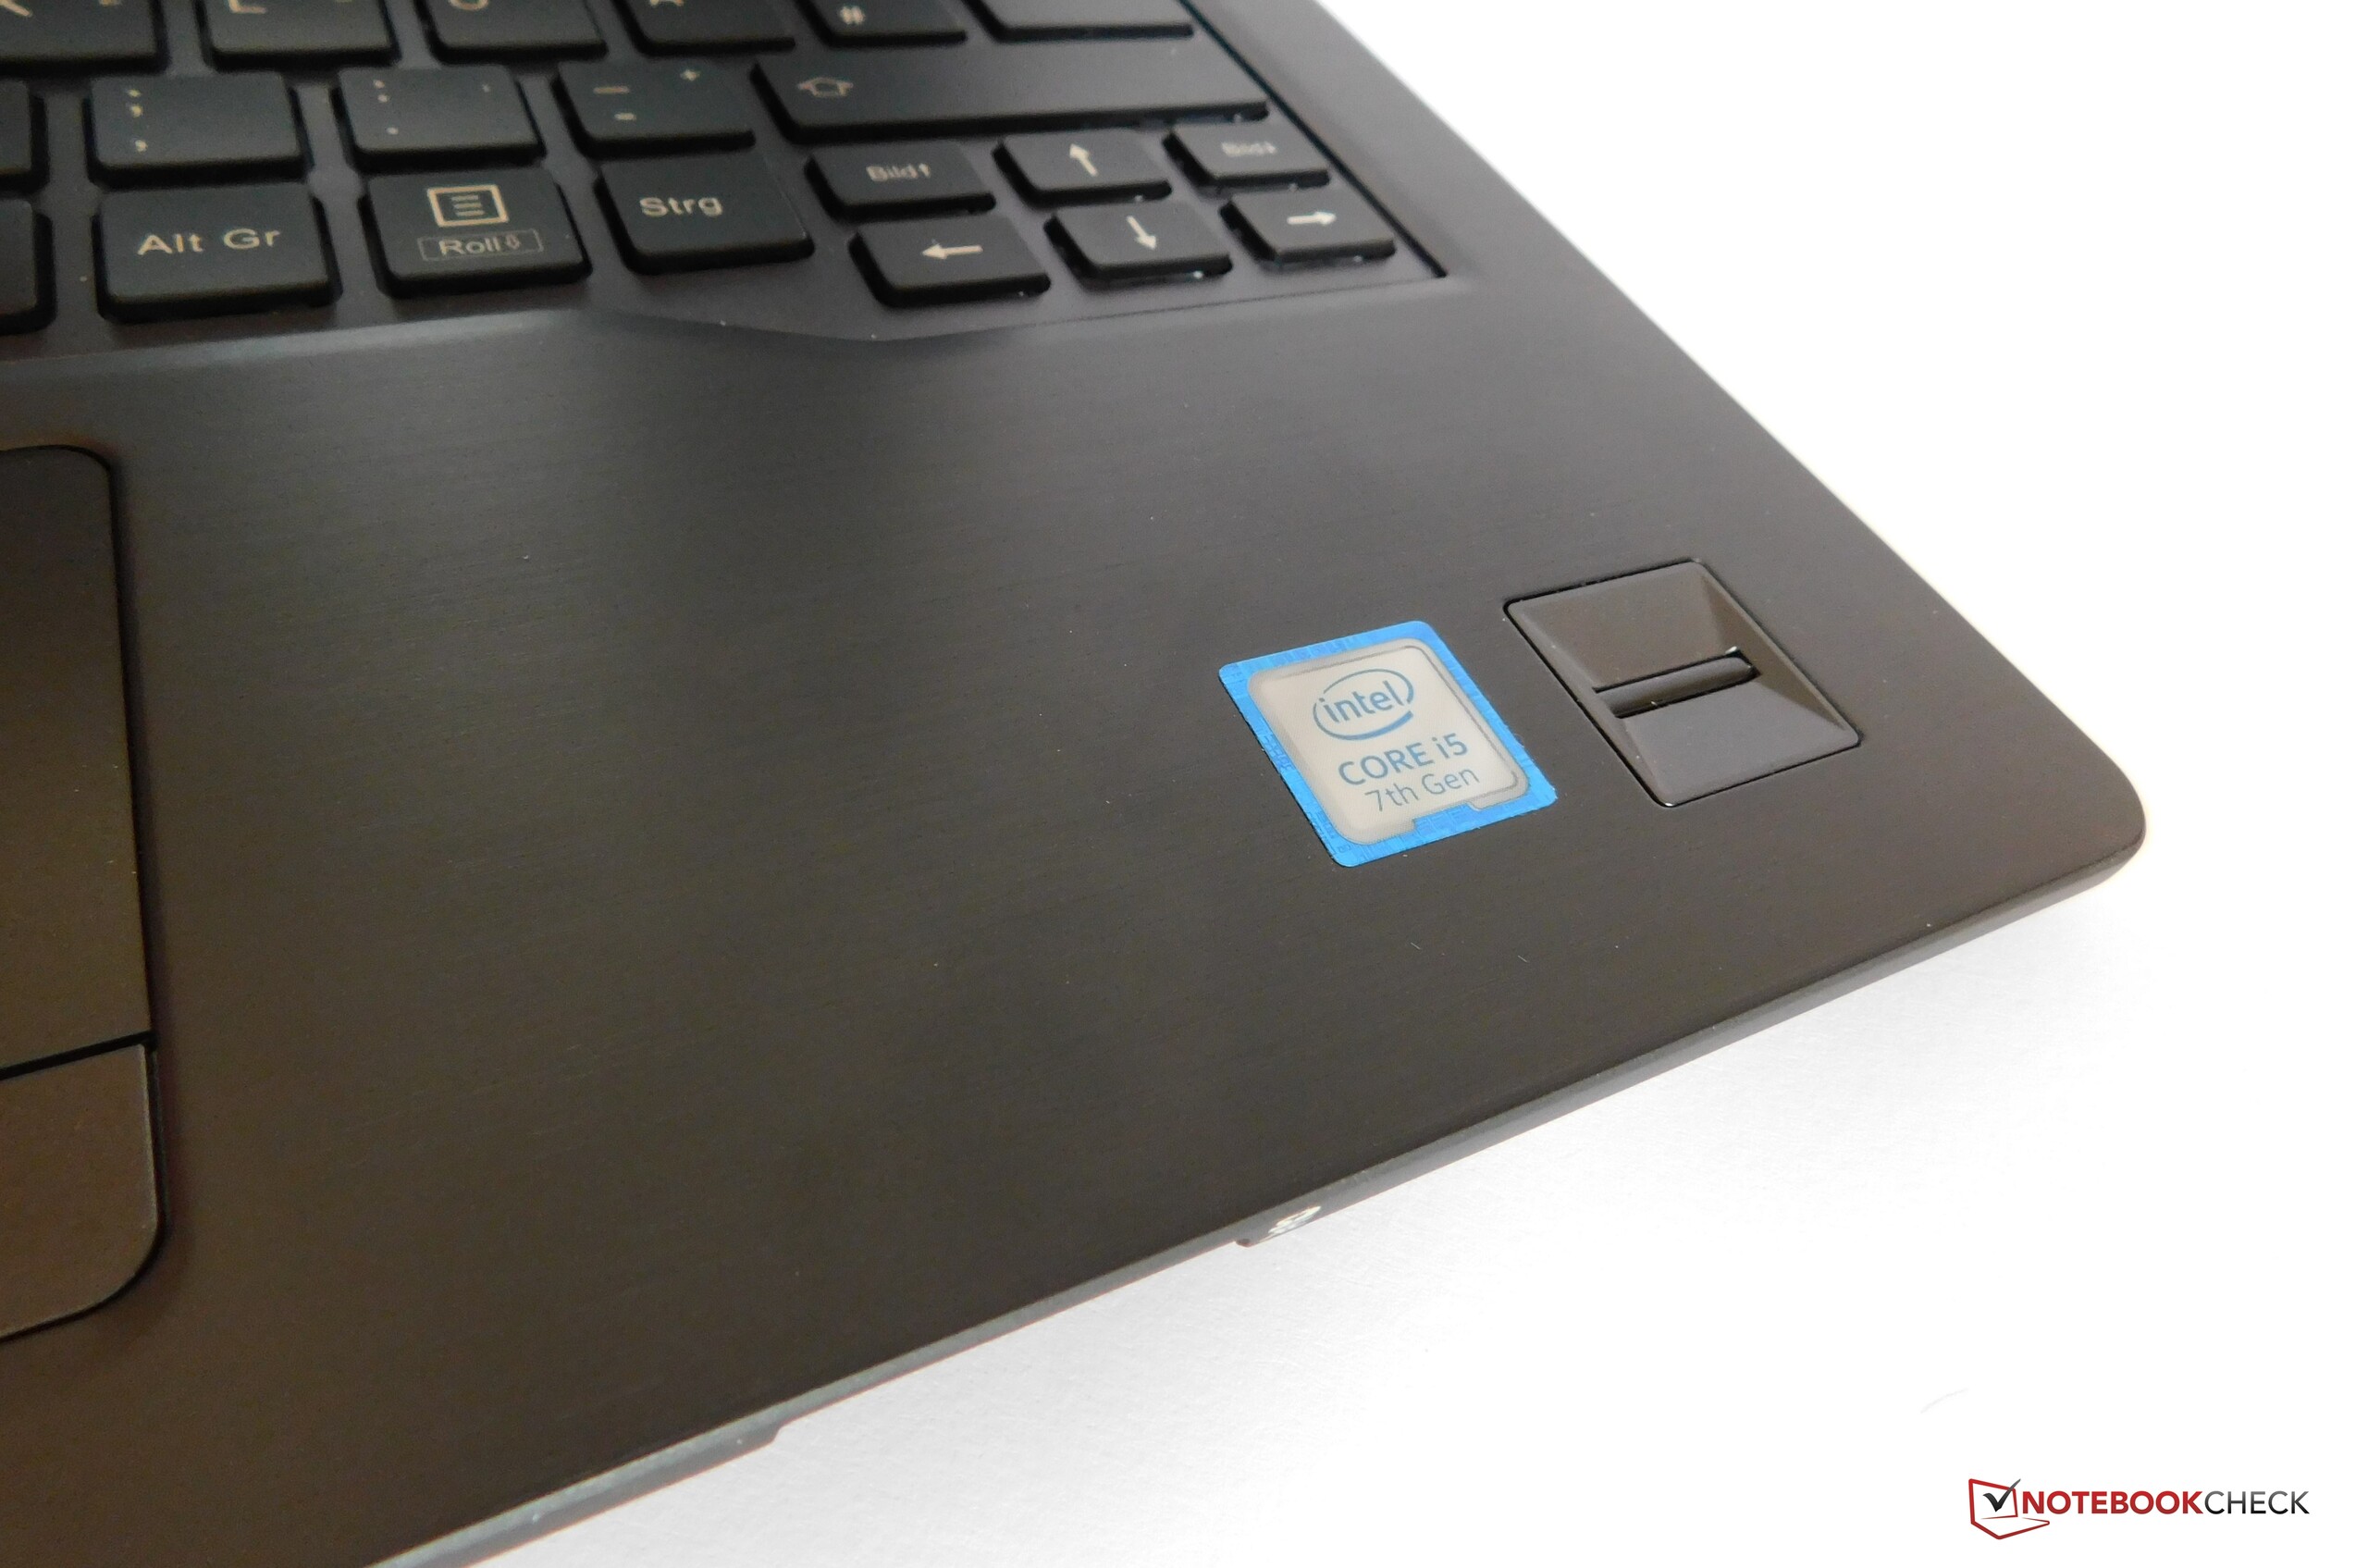
| Fujitsu LifeBook U747 i5-7200U, HD Graphics 620, Samsung MZYTY256HDHP, IPS LED, 1920x1080, 14" | Lenovo ThinkPad T470-20HD002HGE i5-7200U, HD Graphics 620, Samsung PM961 NVMe MZVLW512HMJP, IPS, 1920x1080, 14" | Acer TravelMate P648-M-757N 6500U, HD Graphics 520, Lite-On CV1-8B256, IPS, 1920x1080, 14" | Dell Latitude 14 7000 Series E7470 6600U, HD Graphics 520, Samsung SSD PM851 M.2 2280 256GB, IPS, 2560x1440, 14" | HP EliteBook 840 G3 T9X59ET#ABD 6500U, HD Graphics 520, Samsung SSD PM851 256 GB MZNTE256HMHP, TN LED, 1920x1080, 14" | Lenovo ThinkPad T470s-20HGS00V00 i7-7600U, HD Graphics 620, Samsung SSD PM961 1TB M.2 PCIe 3.0 x4 NVMe (MZVLW1T0), IPS, 2560x1440, 14" | |
|---|---|---|---|---|---|---|
| Power Consumption | 13% | -16% | -12% | 10% | -23% | |
| Idle Minimum * (Watt) | 4.11 | 3.21 22% | 5.3 -29% | 5.1 -24% | 3.8 8% | 4.64 -13% |
| Idle Average * (Watt) | 7.87 | 6.15 22% | 9.3 -18% | 8.5 -8% | 6.3 20% | 8.93 -13% |
| Idle Maximum * (Watt) | 8.74 | 6.82 22% | 11.5 -32% | 10.1 -16% | 6.8 22% | 9.12 -4% |
| Load Average * (Watt) | 30.2 | 28.5 6% | 30.8 -2% | 35.2 -17% | 34.4 -14% | 42.2 -40% |
| Load Maximum * (Watt) | 32.4 | 34.5 -6% | 32 1% | 31 4% | 28.3 13% | 47.3 -46% |
* ... smaller is better
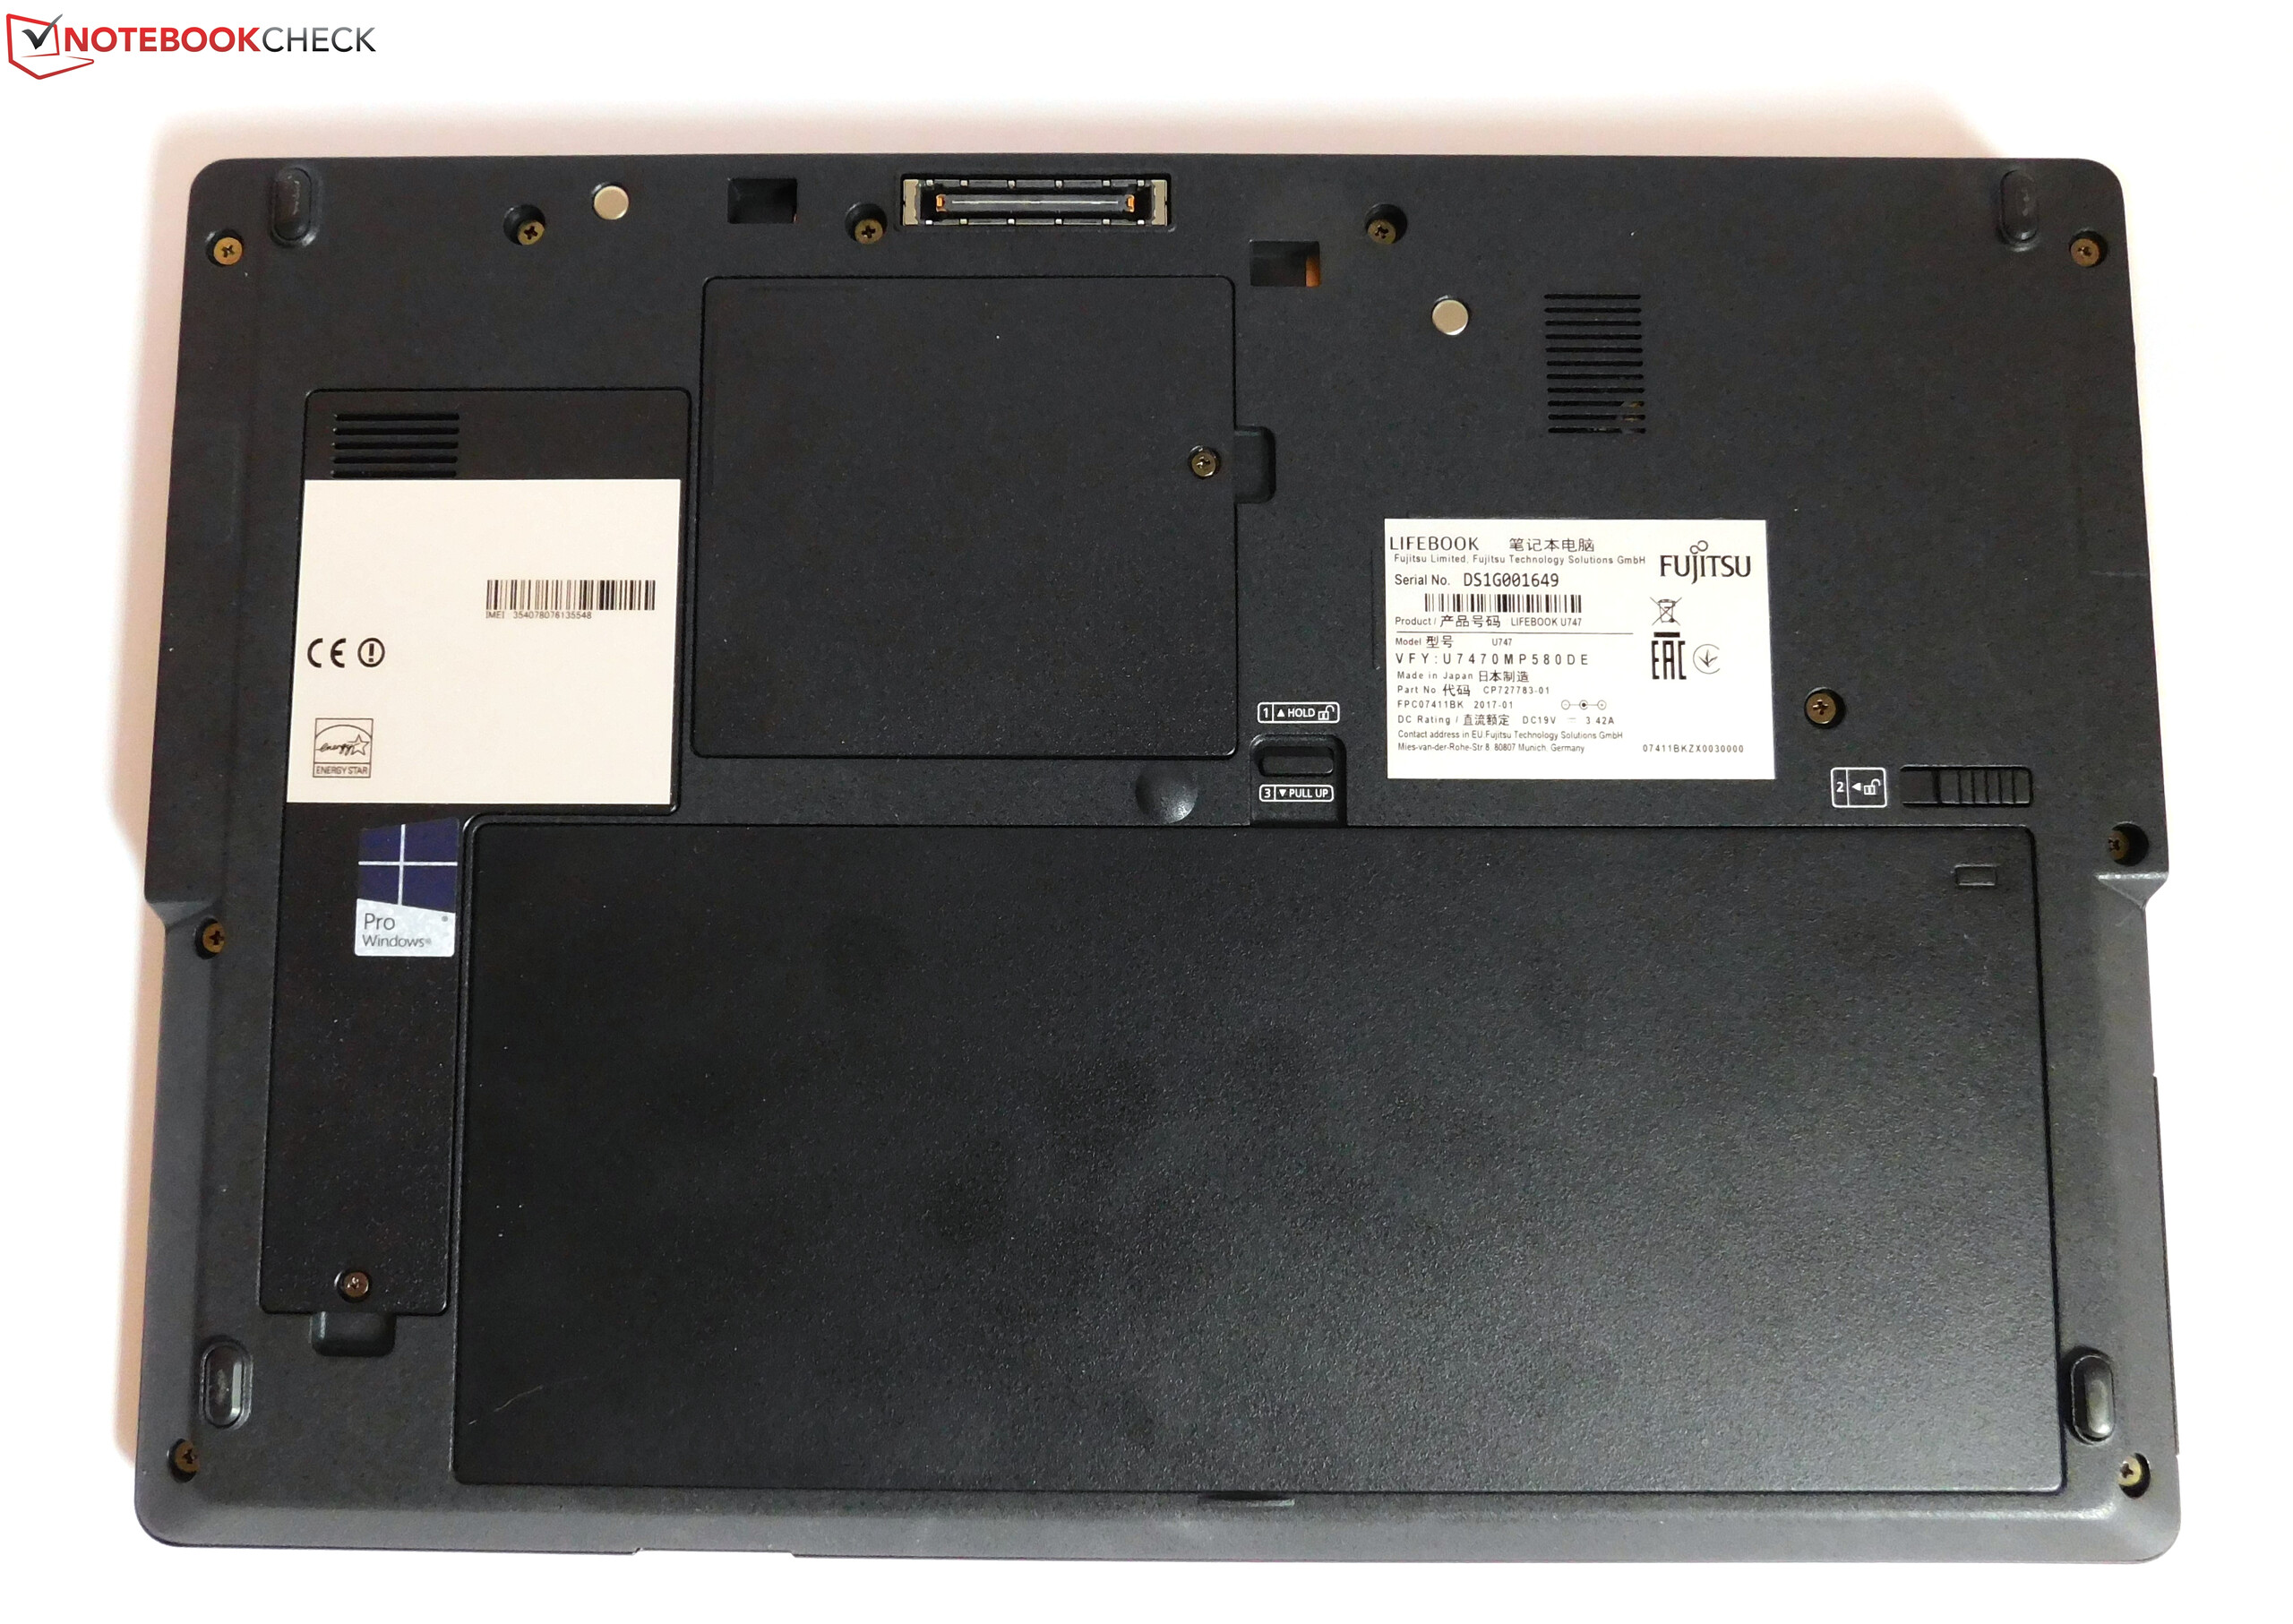
| Fujitsu LifeBook U747 i5-7200U, HD Graphics 620, 50 Wh | Lenovo ThinkPad T470-20HD002HGE i5-7200U, HD Graphics 620, 48 Wh | Acer TravelMate P648-M-757N 6500U, HD Graphics 520, 54 Wh | Dell Latitude 14 7000 Series E7470 6600U, HD Graphics 520, 55 Wh | HP EliteBook 840 G3 T9X59ET#ABD 6500U, HD Graphics 520, 46 Wh | Lenovo ThinkPad T470s-20HGS00V00 i7-7600U, HD Graphics 620, 51 Wh | |
|---|---|---|---|---|---|---|
| Battery runtime | 6% | 17% | -12% | 19% | -7% | |
| Reader / Idle (h) | 13 | 18.1 39% | 17 31% | 13.1 1% | ||
| H.264 (h) | 8.2 | 10.4 27% | 9.1 11% | 7.6 -7% | ||
| WiFi v1.3 (h) | 7.2 | 7.3 1% | 9.1 26% | 5.8 -19% | 7.6 6% | 7 -3% |
| Load (h) | 2 | 1.8 -10% | 1.8 -10% | 1.9 -5% | 2.4 20% | 1.6 -20% |
Pros
Cons

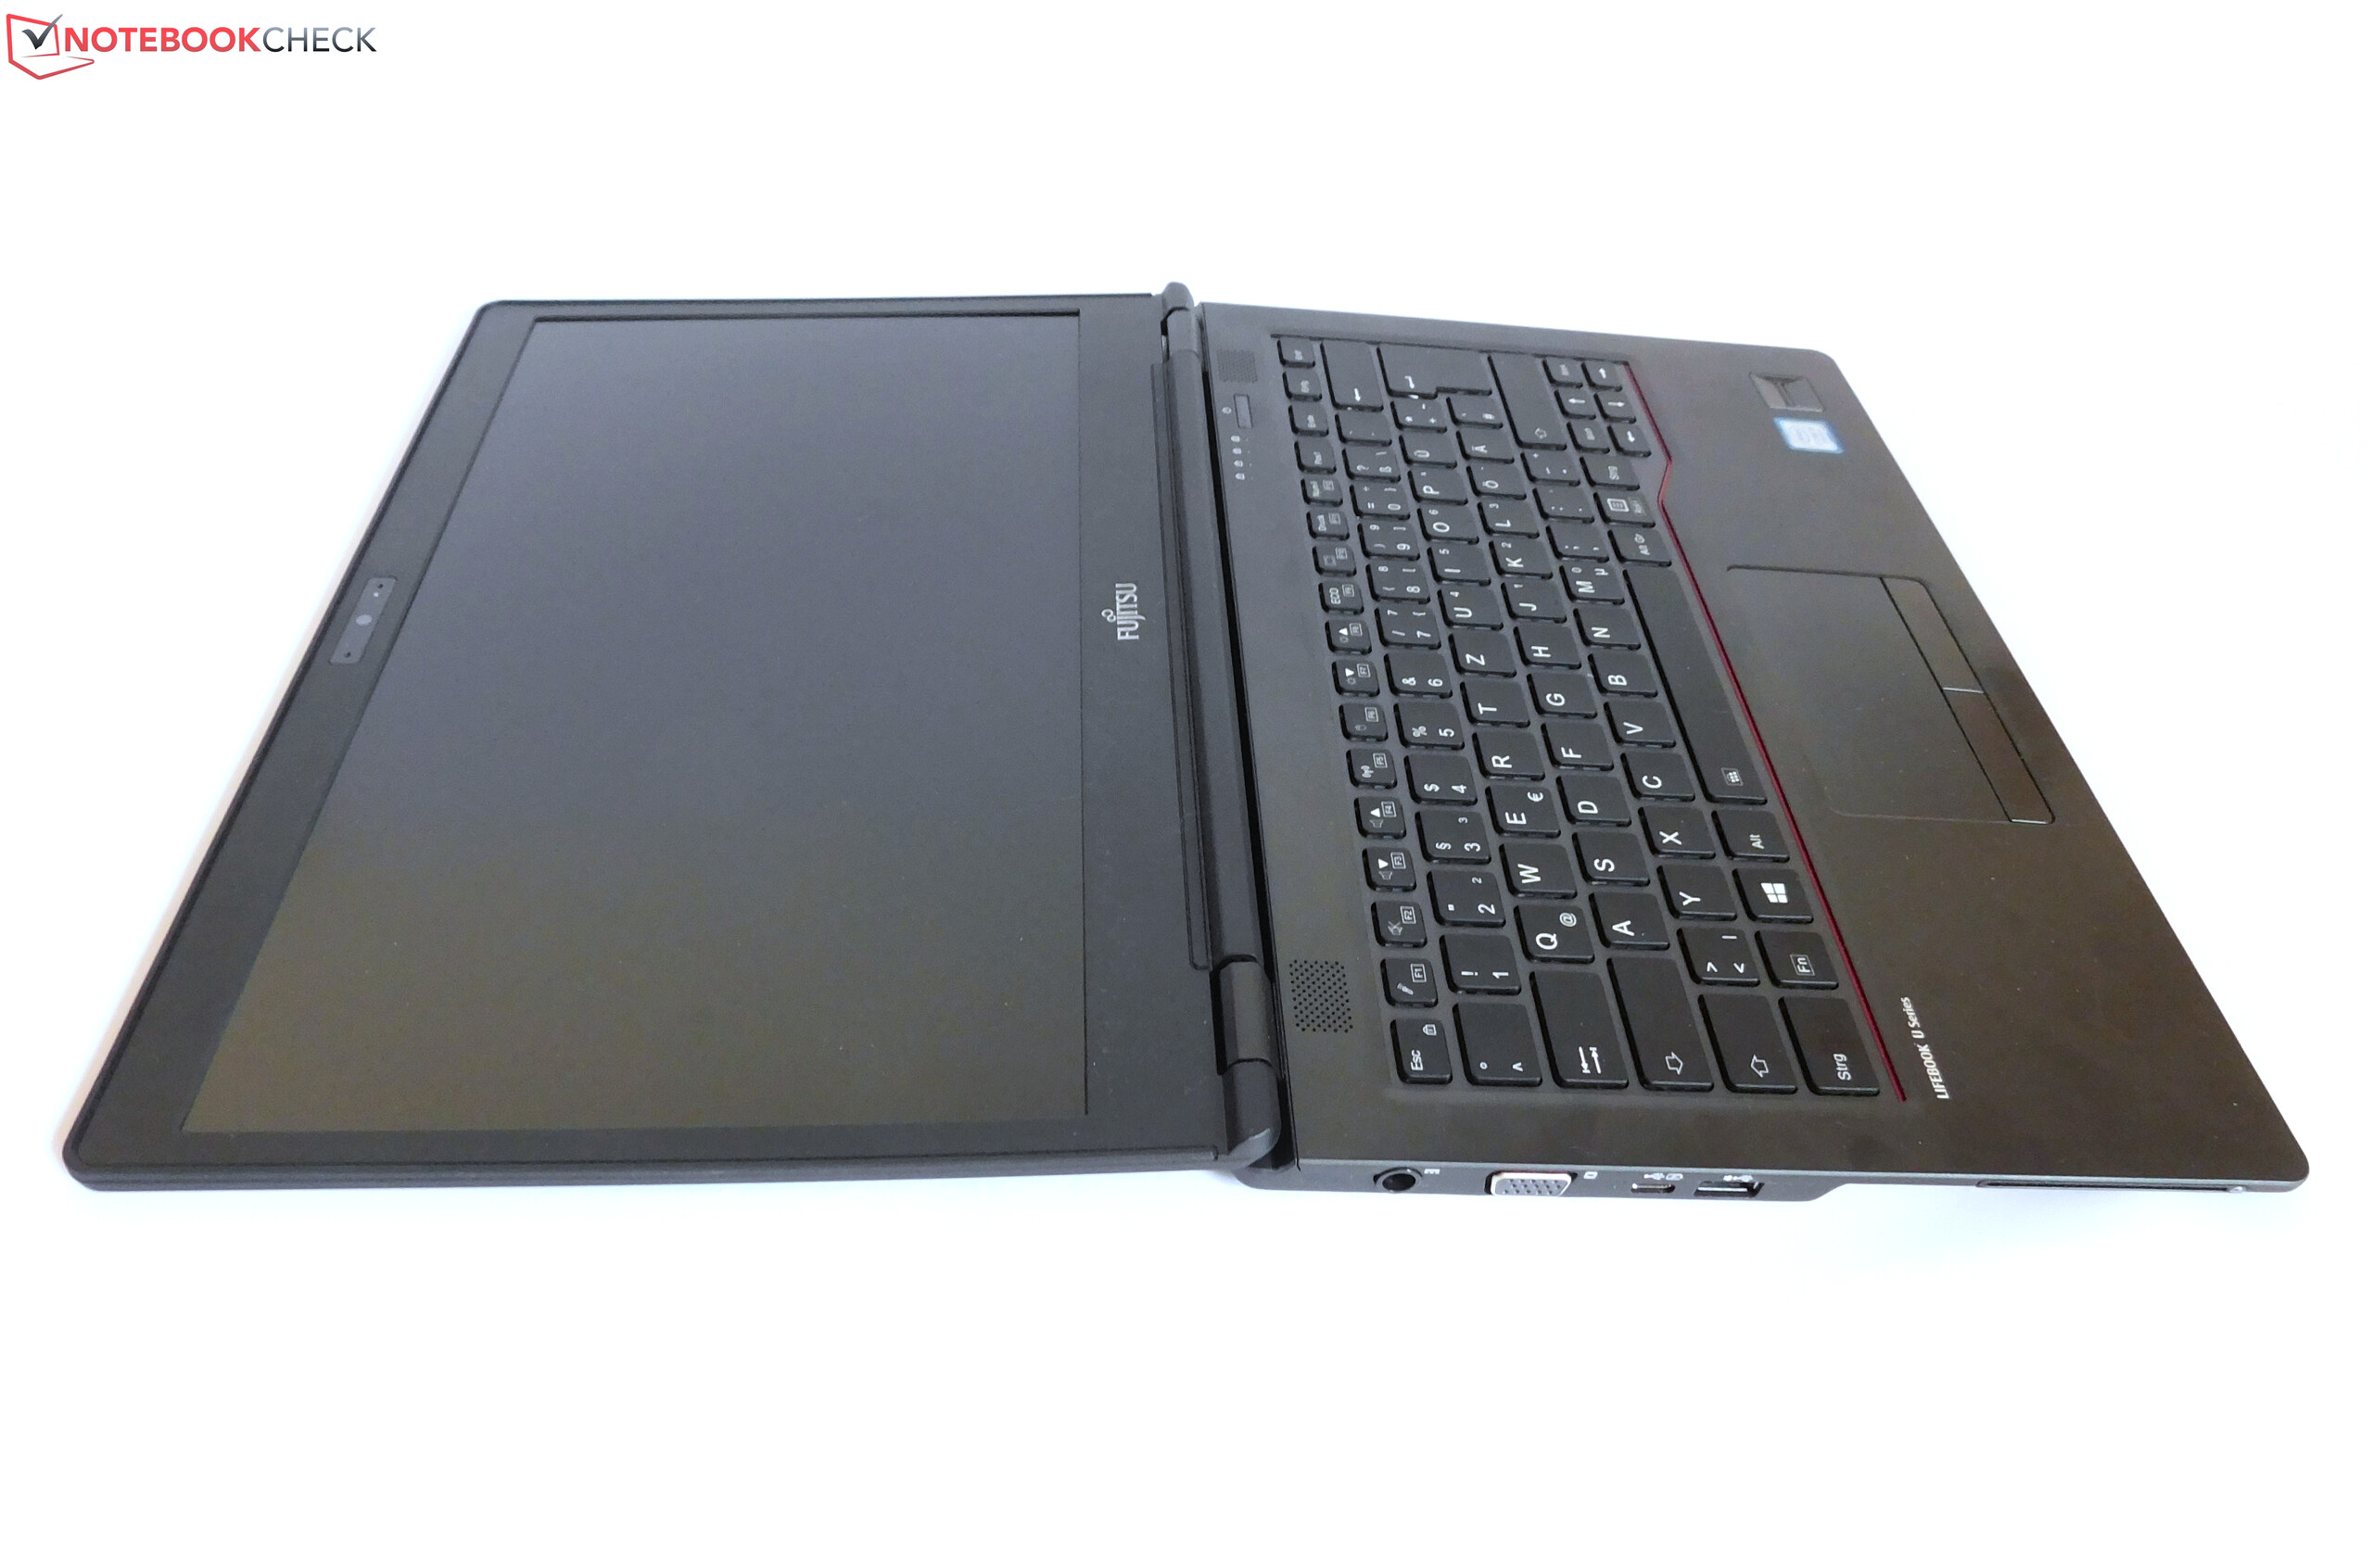
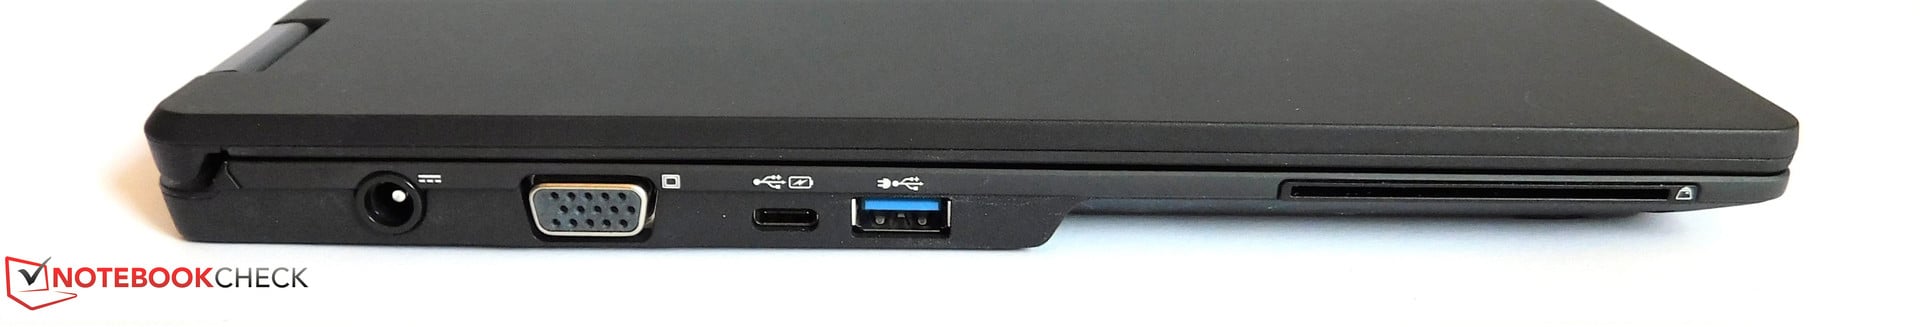
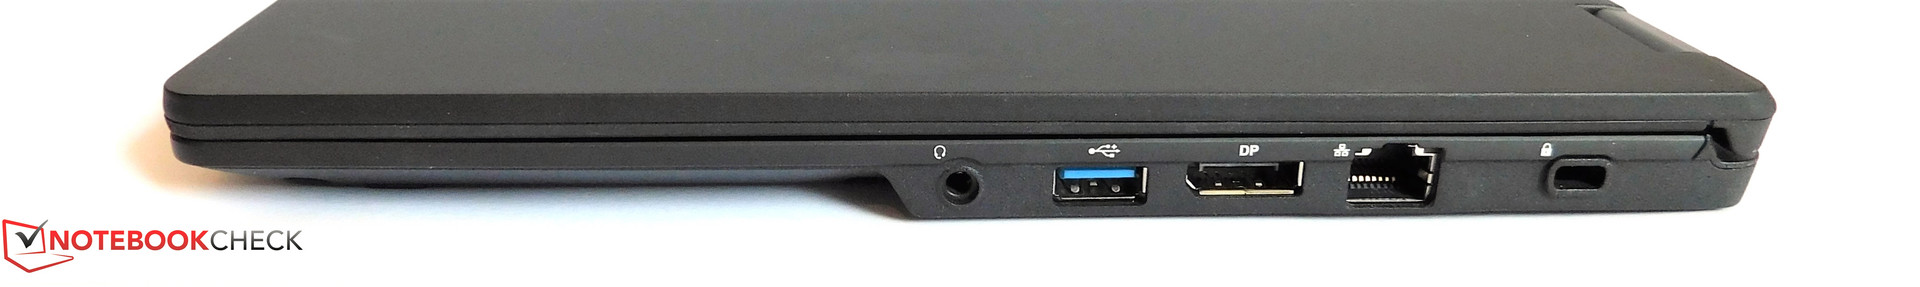
Lifebook U747是一台优秀的笔记本。富士通并没有犯很多的错误。它拥有出色的屏幕,优秀的电池续航时间,以及一块能够提供舒适打字体验的键盘。外壳设计坚固且制造质量出色,而且它的设计符合它的商务定位。这也可以说是有关于其接口的多样性。尽管确实缺失Thunderbolt 3接口,但这在近期更像是一个附加项缺乏也并不会成为缺点。评测样机的温度保持在较低水平,风扇也通常仅是待机。
我们来到了缺点部分:尽管风扇相对安静,但一旦开始工作便会产生高频噪音。这的确不是一个大问题,但是很烦人。同样的情况发生在扬声器和内置摄像头上。但是这两个部分通常都会被忽略。最大的缺点在于其鼠标替代品的选择:富士通并没有选择一块Precision触控板,这使得它显得有点过时,因此触摸板也不够好。不幸的是,触摸板的按键反馈也十分劣质而不准确。而Lifebook并没有配备用于代替触控板的指点杆。最后,保修时间相对于竞品来说也有些偏短。
富士通的Lifebook U747是商务市场中的有利竞品。但不幸的是,糟糕的触摸板毁了其对于商务人士的好印象。
除去触摸板,Lifebook整体上令人满意且值得推荐。但竞争激烈的市场并没有留给富士通一条好路。一款强有力的竞品联想 ThinkPad T470 在很多方面都比富士通得到了更高的分数,只有屏幕是其显著的弱点。戴尔的新Latitude和惠普的新EliteBook 型号(Latitude 7480 和 EliteBook 840 G4)也将肯定成为强力的竞争者。对应的评测将会在近日放出。
注:本文是基于完整评测的缩减版本,阅读完整的英文评测,请点击这里。
Fujitsu LifeBook U747
- 03/09/2017 v6 (old)
Benjamin Herzig