戴尔 Latitude 14 E7470 超级本简短评测
| |||||||||||||||||||||||||
Brightness Distribution: 81 %
Center on Battery: 380 cd/m²
Contrast: 1462:1 (Black: 0.26 cd/m²)
ΔE ColorChecker Calman: 3.11 | ∀{0.5-29.43 Ø4.71}
ΔE Greyscale Calman: 4.35 | ∀{0.09-98 Ø4.96}
96% sRGB (Argyll 1.6.3 3D)
62% AdobeRGB 1998 (Argyll 1.6.3 3D)
69.3% AdobeRGB 1998 (Argyll 3D)
95.9% sRGB (Argyll 3D)
67.2% Display P3 (Argyll 3D)
Gamma: 2.37
CCT: 6771 K
| Dell Latitude 14 7000 Series E7470 FHD IPS Touch | HP EliteBook 840 G3 T9X59ET#ABD FHD TN | Lenovo ThinkPad T460s-20FA003GGE WQHD IPS | Lenovo ThinkPad T460s-20F9003SGE FHD IPS | HP EliteBook Folio 1040 G2 WQHD IPS | Acer TravelMate P645-S-58HK FHD IPS | |
|---|---|---|---|---|---|---|
| Display | -26% | 2% | -37% | -1% | -3% | |
| Display P3 Coverage (%) | 67.2 | 48.93 -27% | 68.7 2% | 41.65 -38% | 66.1 -2% | 66.7 -1% |
| sRGB Coverage (%) | 95.9 | 73.7 -23% | 98.1 2% | 61.6 -36% | 94.8 -1% | 90.8 -5% |
| AdobeRGB 1998 Coverage (%) | 69.3 | 50.5 -27% | 70.4 2% | 43.14 -38% | 68.3 -1% | 66.5 -4% |
| Response Times | 9% | 9% | 2% | |||
| Response Time Grey 50% / Grey 80% * (ms) | 48 ? | 43 ? 10% | 35.6 ? 26% | 42 ? 12% | ||
| Response Time Black / White * (ms) | 27 ? | 25 ? 7% | 29.2 ? -8% | 29.2 ? -8% | ||
| PWM Frequency (Hz) | 204 ? | 220 ? | ||||
| Screen | -73% | -21% | -46% | -11% | -20% | |
| Brightness middle (cd/m²) | 380 | 366 -4% | 257 -32% | 226 -41% | 274 -28% | 331 -13% |
| Brightness (cd/m²) | 354 | 336 -5% | 248 -30% | 211 -40% | 263 -26% | 309 -13% |
| Brightness Distribution (%) | 81 | 87 7% | 94 16% | 89 10% | 85 5% | 82 1% |
| Black Level * (cd/m²) | 0.26 | 0.65 -150% | 0.26 -0% | 0.22 15% | 0.21 19% | 0.4 -54% |
| Contrast (:1) | 1462 | 563 -61% | 988 -32% | 1027 -30% | 1305 -11% | 828 -43% |
| Colorchecker dE 2000 * | 3.11 | 10.26 -230% | 4.59 -48% | 6.44 -107% | 3.93 -26% | 4.07 -31% |
| Colorchecker dE 2000 max. * | 6.73 | 9.72 -44% | 17.18 -155% | |||
| Greyscale dE 2000 * | 4.35 | 11.51 -165% | 6.38 -47% | 5.87 -35% | 5.28 -21% | 4.86 -12% |
| Gamma | 2.37 93% | 2.4 92% | 2.51 88% | 2.37 93% | 2.49 88% | 2.49 88% |
| CCT | 6771 96% | 12725 51% | 6238 104% | 6856 95% | 7108 91% | 6109 106% |
| Color Space (Percent of AdobeRGB 1998) (%) | 62 | 47 -24% | 65 5% | 39.58 -36% | 61 -2% | 59 -5% |
| Color Space (Percent of sRGB) (%) | 96 | 74 -23% | 98 2% | 61.15 -36% | 90.6 -6% | |
| Total Average (Program / Settings) | -30% /
-51% | -3% /
-12% | -27% /
-38% | -6% /
-9% | -12% /
-16% |
* ... smaller is better
Display Response Times
| ↔ Response Time Black to White | ||
|---|---|---|
| 27 ms ... rise ↗ and fall ↘ combined | ↗ 7 ms rise | 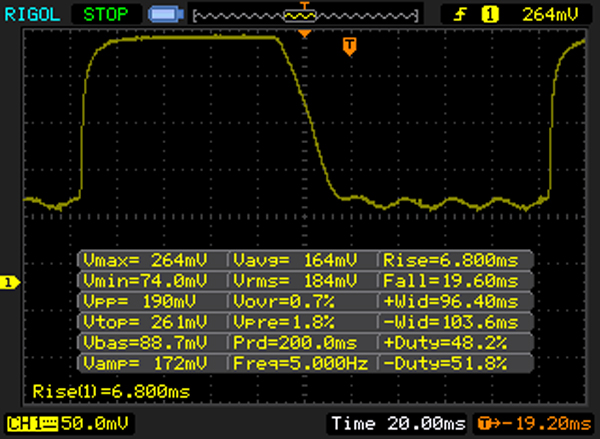 |
| ↘ 20 ms fall | ||
| The screen shows relatively slow response rates in our tests and may be too slow for gamers. In comparison, all tested devices range from 0.1 (minimum) to 240 (maximum) ms. » 67 % of all devices are better. This means that the measured response time is worse than the average of all tested devices (19.8 ms). | ||
| ↔ Response Time 50% Grey to 80% Grey | ||
| 48 ms ... rise ↗ and fall ↘ combined | ↗ 15 ms rise | 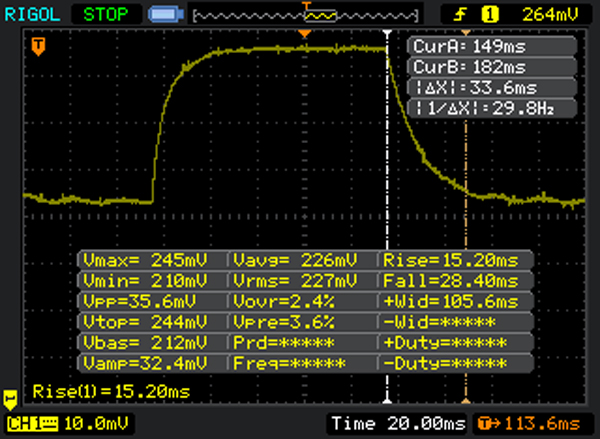 |
| ↘ 33 ms fall | ||
| The screen shows slow response rates in our tests and will be unsatisfactory for gamers. In comparison, all tested devices range from 0.165 (minimum) to 636 (maximum) ms. » 82 % of all devices are better. This means that the measured response time is worse than the average of all tested devices (31 ms). | ||
Screen Flickering / PWM (Pulse-Width Modulation)
| Screen flickering / PWM not detected | ||
In comparison: 52 % of all tested devices do not use PWM to dim the display. If PWM was detected, an average of 7754 (minimum: 5 - maximum: 343500) Hz was measured. | ||
| Cinebench R15 | |
| CPU Single 64Bit (sort by value) | |
| Dell Latitude 14 7000 Series E7470 | |
| HP EliteBook 840 G3 T9X59ET#ABD | |
| Dell Latitude E7450 | |
| Lenovo ThinkPad T460s-20FA003GGE | |
| HP EliteBook Folio 1040 G2 | |
| Lenovo ThinkPad T450s-20BWS1UT00 | |
| Acer TravelMate P645-S-58HK | |
| CPU Multi 64Bit (sort by value) | |
| Dell Latitude 14 7000 Series E7470 | |
| HP EliteBook 840 G3 T9X59ET#ABD | |
| Dell Latitude E7450 | |
| Lenovo ThinkPad T460s-20FA003GGE | |
| HP EliteBook Folio 1040 G2 | |
| Lenovo ThinkPad T450s-20BWS1UT00 | |
| Acer TravelMate P645-S-58HK | |
| Cinebench R11.5 | |
| CPU Single 64Bit (sort by value) | |
| Dell Latitude 14 7000 Series E7470 | |
| Dell Latitude E7450 | |
| Lenovo ThinkPad T460s-20FA003GGE | |
| HP EliteBook Folio 1040 G2 | |
| Lenovo ThinkPad T450s-20BWS1UT00 | |
| Acer TravelMate P645-S-58HK | |
| CPU Multi 64Bit (sort by value) | |
| Dell Latitude 14 7000 Series E7470 | |
| Dell Latitude E7450 | |
| Lenovo ThinkPad T460s-20FA003GGE | |
| HP EliteBook Folio 1040 G2 | |
| Lenovo ThinkPad T450s-20BWS1UT00 | |
| Acer TravelMate P645-S-58HK | |
| PCMark 7 - Score (sort by value) | |
| Dell Latitude 14 7000 Series E7470 | |
| Dell Latitude E7450 | |
| Lenovo ThinkPad T460s-20FA003GGE | |
| HP EliteBook Folio 1040 G2 | |
| Lenovo ThinkPad T450s-20BWS1UT00 | |
| Acer TravelMate P645-S-58HK | |
| PCMark 8 | |
| Work Score Accelerated v2 (sort by value) | |
| Dell Latitude 14 7000 Series E7470 | |
| HP EliteBook 840 G3 T9X59ET#ABD | |
| Dell Latitude E7450 | |
| Lenovo ThinkPad T460s-20FA003GGE | |
| Lenovo ThinkPad T450s-20BWS1UT00 | |
| Acer TravelMate P645-S-58HK | |
| Home Score Accelerated v2 (sort by value) | |
| Dell Latitude 14 7000 Series E7470 | |
| HP EliteBook 840 G3 T9X59ET#ABD | |
| Dell Latitude E7450 | |
| Lenovo ThinkPad T460s-20FA003GGE | |
| HP EliteBook Folio 1040 G2 | |
| Lenovo ThinkPad T450s-20BWS1UT00 | |
| Acer TravelMate P645-S-58HK | |
| PCMark 7 Score | 5194 points | |
| PCMark 8 Home Score Accelerated v2 | 3344 points | |
| PCMark 8 Work Score Accelerated v2 | 4543 points | |
Help | ||
| Dell Latitude 14 7000 Series E7470 HD Graphics 520, 6600U, Samsung SSD PM851 M.2 2280 256GB | Lenovo ThinkPad T460s-20FA003GGE HD Graphics 520, 6600U, Samsung SSD SM951a 512GB M.2 PCIe 3.0 x4 NVMe (MZVKV512) | Lenovo ThinkPad T450s-20BWS1UT00 GeForce 940M, 5200U, Samsung SSD PM871 MZ7LN256HCHP | HP EliteBook 840 G3 T9X59ET#ABD HD Graphics 520, 6500U, Samsung SSD PM851 256 GB MZNTE256HMHP | HP EliteBook Folio 1040 G2 HD Graphics 5500, 5600U, Samsung SSD PM851 256 GB MZNTE256HMHP | Acer TravelMate P645-S-58HK HD Graphics 5500, 5200U, Kingston RBU-SNS8100S3256GD | |
|---|---|---|---|---|---|---|
| CrystalDiskMark 3.0 | 134% | 7% | -9% | -2% | -29% | |
| Read Seq (MB/s) | 518 | 1778 243% | 517 0% | 497.8 -4% | 499.9 -3% | 506 -2% |
| Write Seq (MB/s) | 300.7 | 1530 409% | 302.4 1% | 241.4 -20% | 264.3 -12% | 343.2 14% |
| Read 4k (MB/s) | 36.32 | 51.3 41% | 36.72 1% | 27.02 -26% | 28.4 -22% | 28.73 -21% |
| Write 4k (MB/s) | 110.9 | 139.3 26% | 99.4 -10% | 82.6 -26% | 101.2 -9% | 66.4 -40% |
| Read 4k QD32 (MB/s) | 400.9 | 561 40% | 387.1 -3% | 388.5 -3% | 393.3 -2% | 91.6 -77% |
| Write 4k QD32 (MB/s) | 191.7 | 277 44% | 293.2 53% | 242.8 27% | 265.3 38% | 95.7 -50% |
| AS SSD | 182% | 14% | -5% | -3% | -9% | |
| Seq Read (MB/s) | 495.5 | 2039 312% | 503 2% | 505 2% | 480.7 -3% | 502 1% |
| Seq Write (MB/s) | 283.7 | 1407 396% | 285.2 1% | 231.6 -18% | 250.1 -12% | 324.6 14% |
| 4K Read (MB/s) | 30.91 | 45.41 47% | 33.27 8% | 25.24 -18% | 25.98 -16% | 31.82 3% |
| 4K Write (MB/s) | 85.1 | 114.4 34% | 84.6 -1% | 72.4 -15% | 84.4 -1% | 58 -32% |
| 4K-64 Read (MB/s) | 336.1 | 968 188% | 380 13% | 362 8% | 356.1 6% | 194.7 -42% |
| 4K-64 Write (MB/s) | 170 | 366 115% | 272.3 60% | 190.6 12% | 182.7 7% | 169.2 0% |
| Total Average (Program / Settings) | 158% /
158% | 11% /
10% | -7% /
-7% | -3% /
-2% | -19% /
-19% |

| 3DMark - 1280x720 Cloud Gate Standard Score (sort by value) | |
| Dell Latitude 14 7000 Series E7470 | |
| Toshiba Satellite Radius 12 P20W-C-106 | |
| HP EliteBook 840 G3 T9X59ET#ABD | |
| Lenovo ThinkPad T460s-20FA003GGE | |
| Lenovo ThinkPad T450s-20BWS1UT00 | |
| Dell Latitude E7450 | |
| HP EliteBook Folio 1040 G2 | |
| Acer TravelMate P645-S-58HK | |
| 3DMark 11 - 1280x720 Performance (sort by value) | |
| Dell Latitude 14 7000 Series E7470 | |
| Toshiba Satellite Radius 12 P20W-C-106 | |
| HP EliteBook 840 G3 T9X59ET#ABD | |
| Lenovo ThinkPad T460s-20FA003GGE | |
| Lenovo ThinkPad T450s-20BWS1UT00 | |
| Dell Latitude E7450 | |
| HP EliteBook Folio 1040 G2 | |
| Acer TravelMate P645-S-58HK | |
| 3DMark 11 Performance | 1418 points | |
| 3DMark Ice Storm Standard Score | 39400 points | |
| 3DMark Cloud Gate Standard Score | 5173 points | |
| 3DMark Fire Strike Score | 707 points | |
Help | ||
| Battlefield Hardline - 1024x768 Low Graphics Quality (DX11) (sort by value) | |
| Dell Latitude 14 7000 Series E7470 | |
| Lenovo ThinkPad Yoga 260 20FD001XGE | |
| Toshiba Satellite Radius 12 P20W-C-106 | |
| FIFA 16 - 1366x768 High Preset AA:2x MS (sort by value) | |
| Dell Latitude 14 7000 Series E7470 | |
| Star Wars Battlefront - 1024x768 Low Preset (sort by value) | |
| Dell Latitude 14 7000 Series E7470 | |
| Acer Aspire R14 R5-471T-79GQ | |
| low | med. | high | ultra | |
|---|---|---|---|---|
| Battlefield Hardline (2015) | 42 | 26 | 8 | |
| FIFA 16 (2015) | 48.8 | 31.4 | ||
| Star Wars Battlefront (2015) | 26 | 15 |
| Dell Latitude 14 7000 Series E7470 HD Graphics 520, 6600U, Samsung SSD PM851 M.2 2280 256GB | Dell Latitude E7450 HD Graphics 5500, 5300U, Samsung SSD PM851 mSATA 128 GB | HP EliteBook 840 G3 T9X59ET#ABD HD Graphics 520, 6500U, Samsung SSD PM851 256 GB MZNTE256HMHP | Lenovo ThinkPad T460s-20FA003GGE HD Graphics 520, 6600U, Samsung SSD SM951a 512GB M.2 PCIe 3.0 x4 NVMe (MZVKV512) | HP EliteBook Folio 1040 G2 HD Graphics 5500, 5600U, Samsung SSD PM851 256 GB MZNTE256HMHP | Lenovo ThinkPad T450s-20BWS1UT00 GeForce 940M, 5200U, Samsung SSD PM871 MZ7LN256HCHP | Acer TravelMate P645-S-58HK HD Graphics 5500, 5200U, Kingston RBU-SNS8100S3256GD | |
|---|---|---|---|---|---|---|---|
| Noise | -3% | -7% | -1% | -4% | 2% | -2% | |
| off / environment * (dB) | 31.2 | 31.2 -0% | 29.2 6% | ||||
| Idle Minimum * (dB) | 31.2 | 29.1 7% | 31.2 -0% | 29.2 6% | 29.6 5% | 29.1 7% | 29.6 5% |
| Idle Average * (dB) | 31.2 | 29.1 7% | 32.1 -3% | 29.2 6% | 29.6 5% | 29.1 7% | 29.6 5% |
| Idle Maximum * (dB) | 31.2 | 30 4% | 33.1 -6% | 29.2 6% | 32.2 -3% | 29.1 7% | 30.2 3% |
| Load Average * (dB) | 31.9 | 36.4 -14% | 36.2 -13% | 33.7 -6% | 36.4 -14% | 33.1 -4% | 35.6 -12% |
| Load Maximum * (dB) | 31.9 | 37.8 -18% | 37.8 -18% | 38.5 -21% | 36.4 -14% | 34.3 -8% | 35.9 -13% |
* ... smaller is better
Noise level
| Idle |
| 31.2 / 31.2 / 31.2 dB(A) |
| Load |
| 31.9 / 31.9 dB(A) |
 | ||
30 dB silent 40 dB(A) audible 50 dB(A) loud |
||
min: | ||
| Dell Latitude 14 7000 Series E7470 HD Graphics 520, 6600U, Samsung SSD PM851 M.2 2280 256GB | Dell Latitude E7450 HD Graphics 5500, 5300U, Samsung SSD PM851 mSATA 128 GB | HP EliteBook 840 G3 T9X59ET#ABD HD Graphics 520, 6500U, Samsung SSD PM851 256 GB MZNTE256HMHP | Lenovo ThinkPad T460s-20FA003GGE HD Graphics 520, 6600U, Samsung SSD SM951a 512GB M.2 PCIe 3.0 x4 NVMe (MZVKV512) | HP EliteBook Folio 1040 G2 HD Graphics 5500, 5600U, Samsung SSD PM851 256 GB MZNTE256HMHP | Lenovo ThinkPad T450s-20BWS1UT00 GeForce 940M, 5200U, Samsung SSD PM871 MZ7LN256HCHP | Acer TravelMate P645-S-58HK HD Graphics 5500, 5200U, Kingston RBU-SNS8100S3256GD | |
|---|---|---|---|---|---|---|---|
| Heat | -12% | -1% | -10% | -9% | -27% | -13% | |
| Maximum Upper Side * (°C) | 38.2 | 41.6 -9% | 37 3% | 40.8 -7% | 35.9 6% | 49.6 -30% | 41.6 -9% |
| Maximum Bottom * (°C) | 36.5 | 37.1 -2% | 37.1 -2% | 40.3 -10% | 42.4 -16% | 51.9 -42% | 41.7 -14% |
| Idle Upper Side * (°C) | 25.1 | 28.7 -14% | 25.3 -1% | 27.6 -10% | 28.5 -14% | 29 -16% | 30.6 -22% |
| Idle Bottom * (°C) | 25.8 | 31.4 -22% | 26.6 -3% | 28.7 -11% | 29 -12% | 30.9 -20% | 27.5 -7% |
* ... smaller is better
(+) The maximum temperature on the upper side is 38.2 °C / 101 F, compared to the average of 34.3 °C / 94 F, ranging from 21.2 to 62.5 °C for the class Office.
(+) The bottom heats up to a maximum of 36.5 °C / 98 F, compared to the average of 36.8 °C / 98 F
(+) In idle usage, the average temperature for the upper side is 24 °C / 75 F, compared to the device average of 29.5 °C / 85 F.
(+) The palmrests and touchpad are cooler than skin temperature with a maximum of 28.2 °C / 82.8 F and are therefore cool to the touch.
(±) The average temperature of the palmrest area of similar devices was 27.5 °C / 81.5 F (-0.7 °C / -1.3 F).
| Dell Latitude 14 7000 Series E7470 HD Graphics 520, 6600U, Samsung SSD PM851 M.2 2280 256GB | Dell Latitude E7450 HD Graphics 5500, 5300U, Samsung SSD PM851 mSATA 128 GB | HP EliteBook 840 G3 T9X59ET#ABD HD Graphics 520, 6500U, Samsung SSD PM851 256 GB MZNTE256HMHP | Lenovo ThinkPad T460s-20FA003GGE HD Graphics 520, 6600U, Samsung SSD SM951a 512GB M.2 PCIe 3.0 x4 NVMe (MZVKV512) | HP EliteBook Folio 1040 G2 HD Graphics 5500, 5600U, Samsung SSD PM851 256 GB MZNTE256HMHP | Lenovo ThinkPad T450s-20BWS1UT00 GeForce 940M, 5200U, Samsung SSD PM871 MZ7LN256HCHP | Acer TravelMate P645-S-58HK HD Graphics 5500, 5200U, Kingston RBU-SNS8100S3256GD | |
|---|---|---|---|---|---|---|---|
| Power Consumption | 11% | 19% | 3% | 26% | -3% | 19% | |
| Idle Minimum * (Watt) | 5.1 | 4 22% | 3.8 25% | 3.8 25% | 3.2 37% | 3.1 39% | 3.2 37% |
| Idle Average * (Watt) | 8.5 | 7.8 8% | 6.3 26% | 7.1 16% | 6.5 24% | 8.6 -1% | 6.3 26% |
| Idle Maximum * (Watt) | 10.1 | 9 11% | 6.8 33% | 7.8 23% | 7.4 27% | 9.6 5% | 8.6 15% |
| Load Average * (Watt) | 35.2 | 31.6 10% | 34.4 2% | 36.3 -3% | 25.6 27% | 35.6 -1% | 30.3 14% |
| Load Maximum * (Watt) | 31 | 29.6 5% | 28.3 9% | 46 -48% | 26.1 16% | 49.4 -59% | 30.4 2% |
* ... smaller is better
| Off / Standby | |
| Idle | |
| Load |
|
Key:
min: | |
Pros
Cons

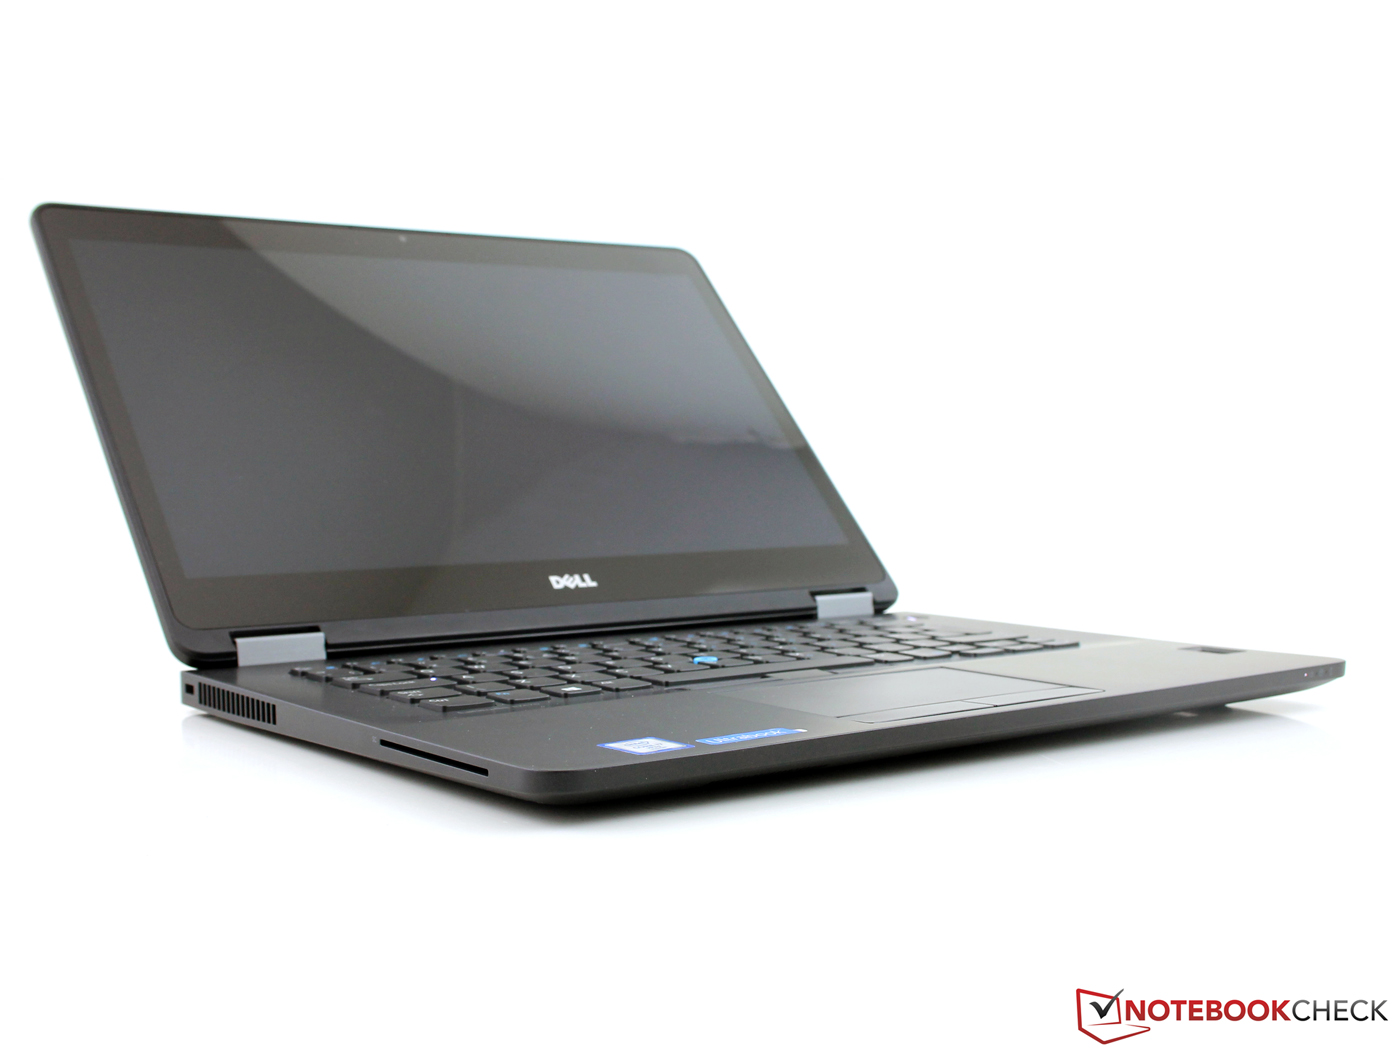
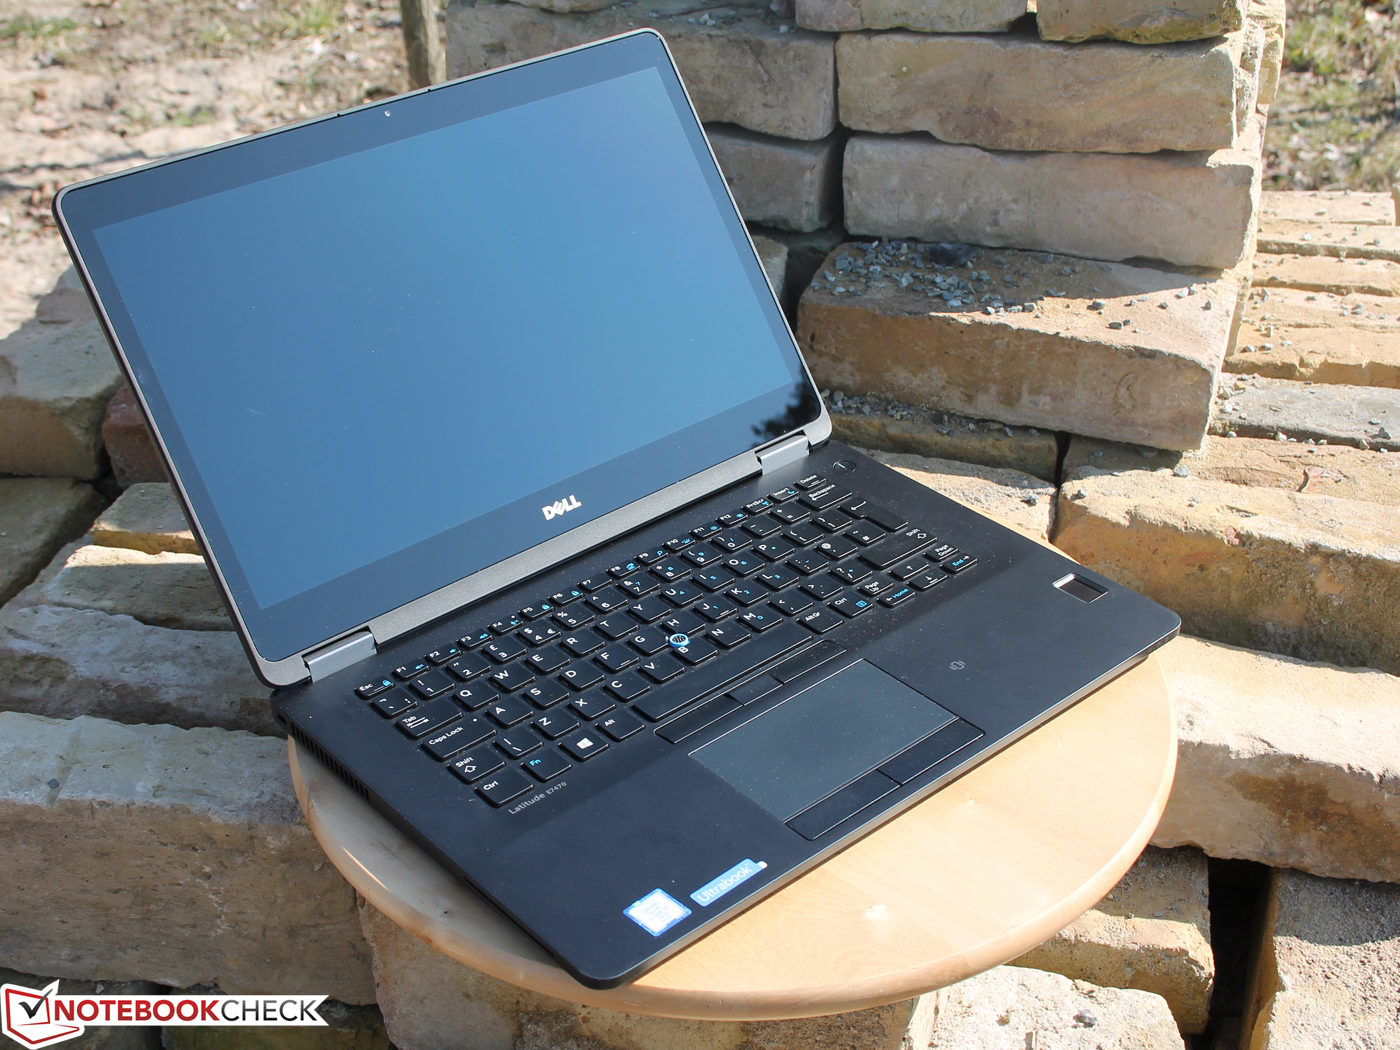
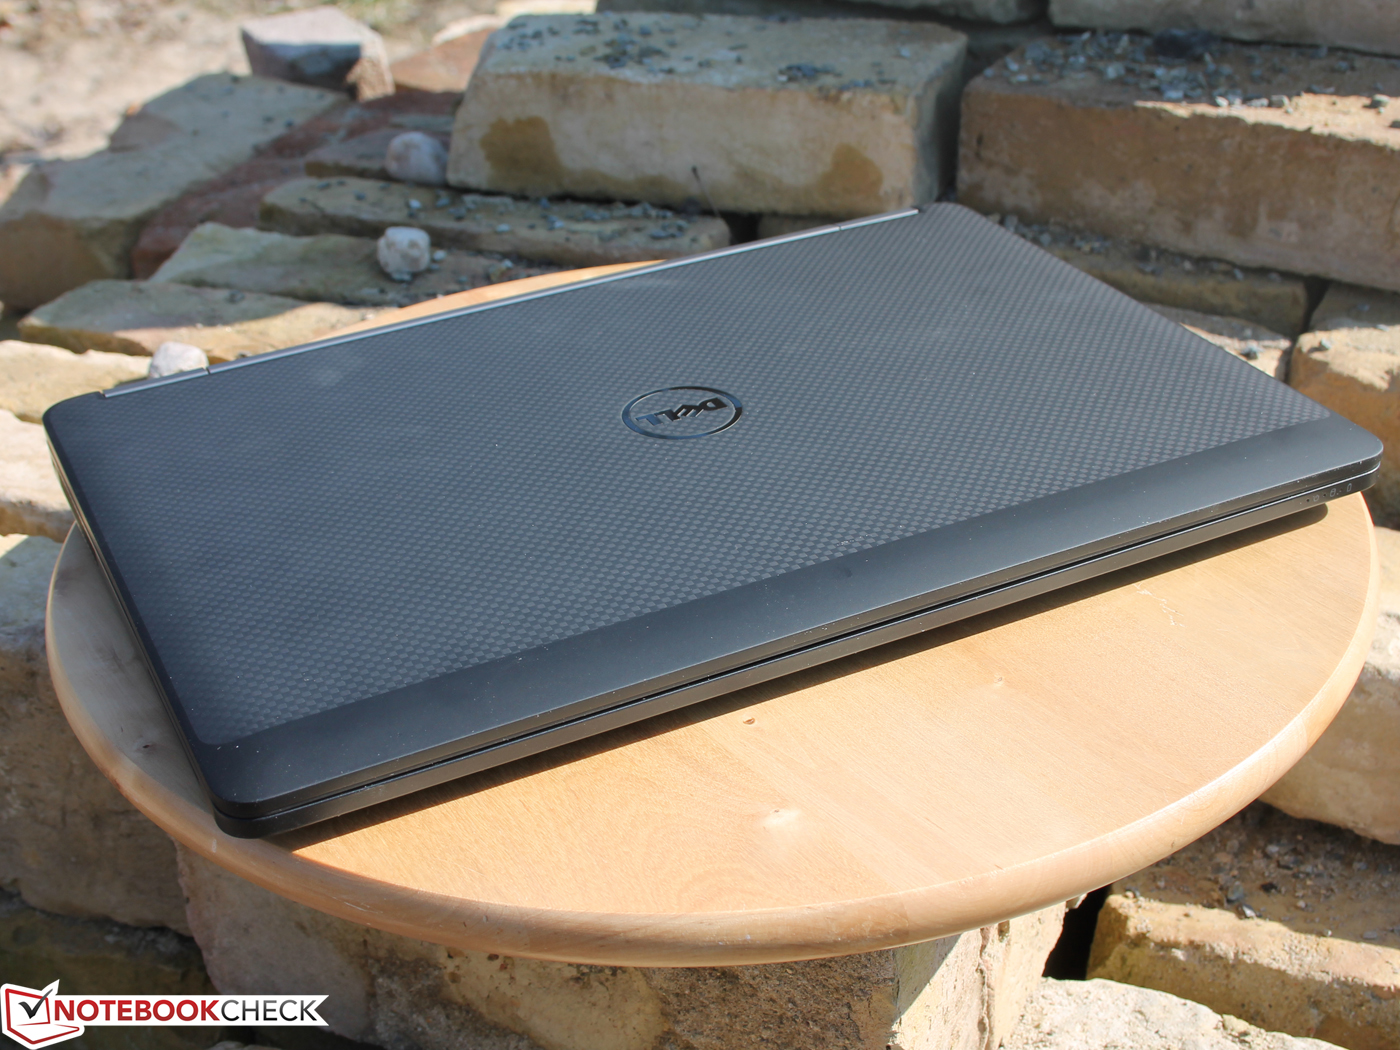
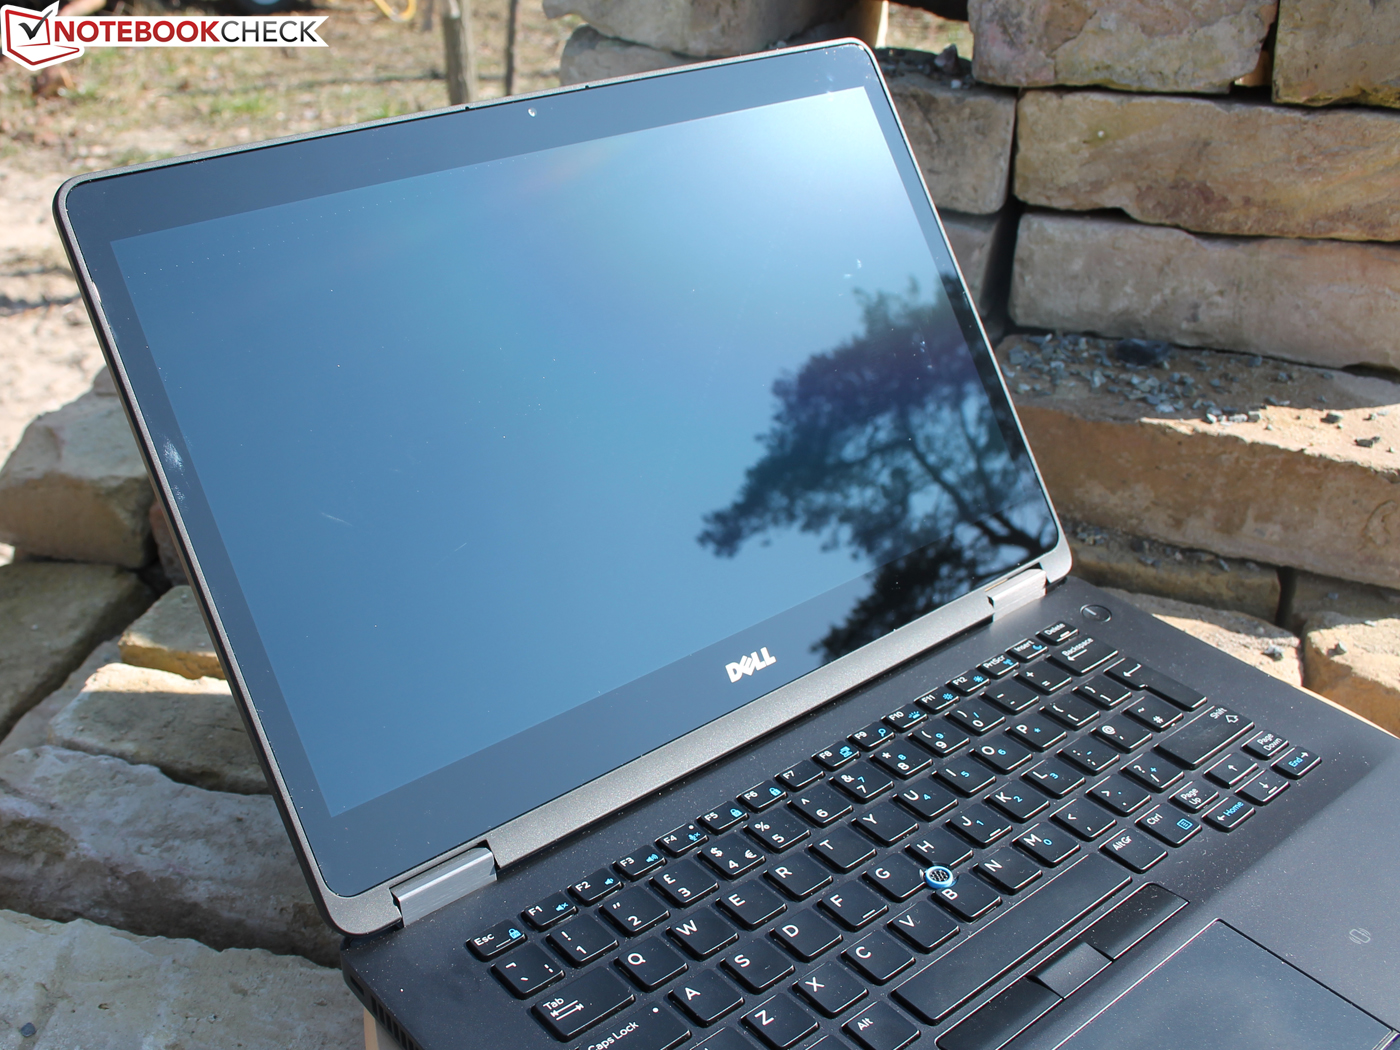
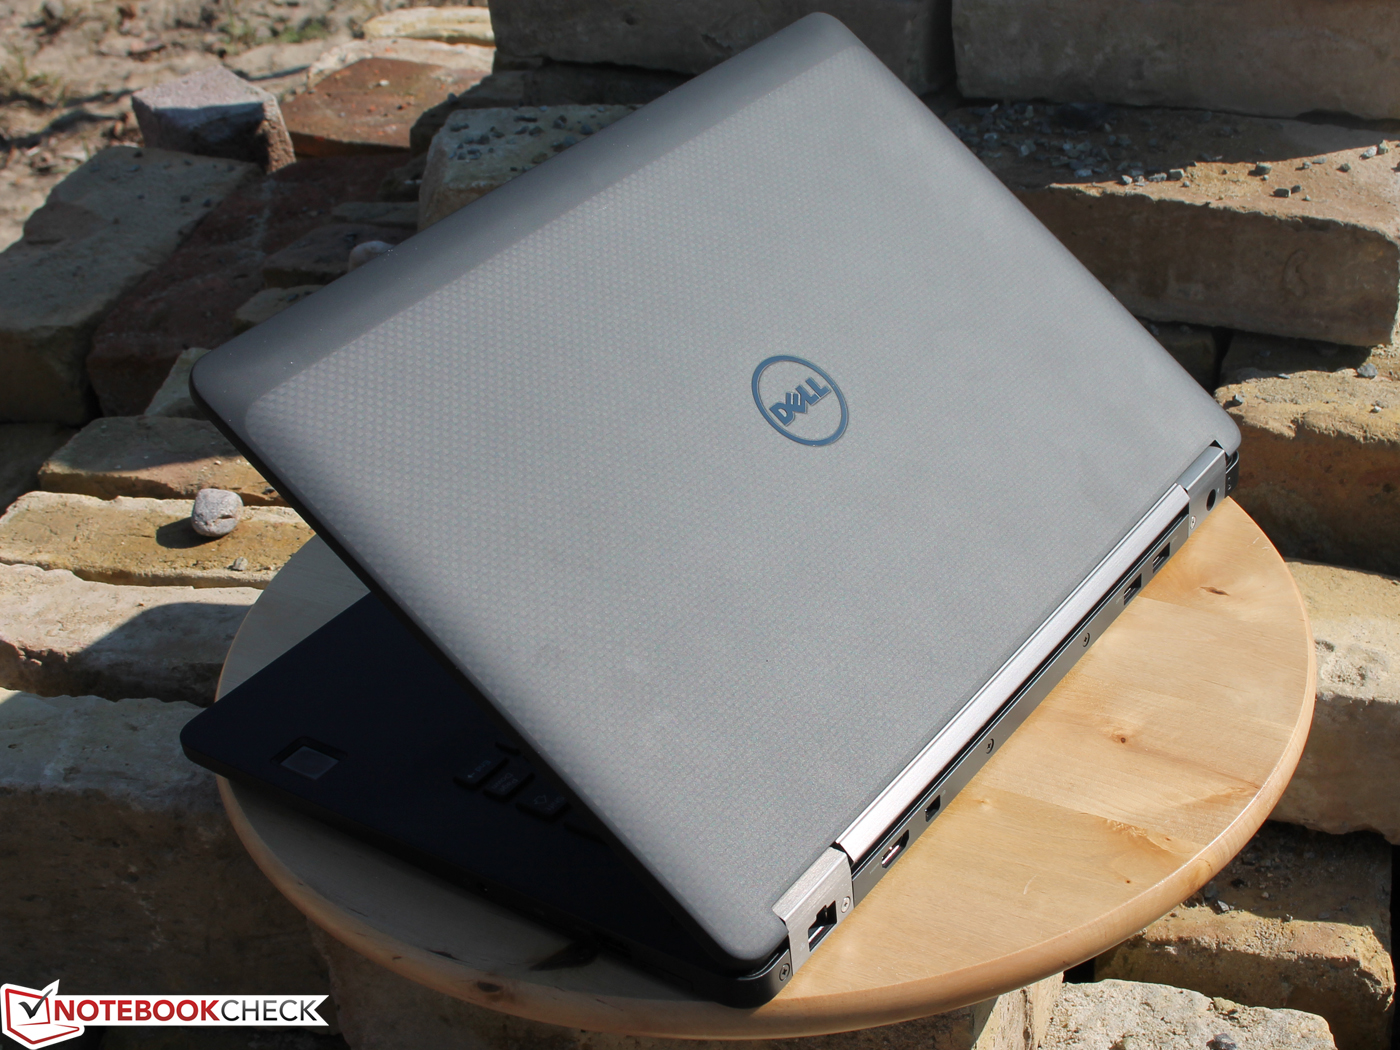
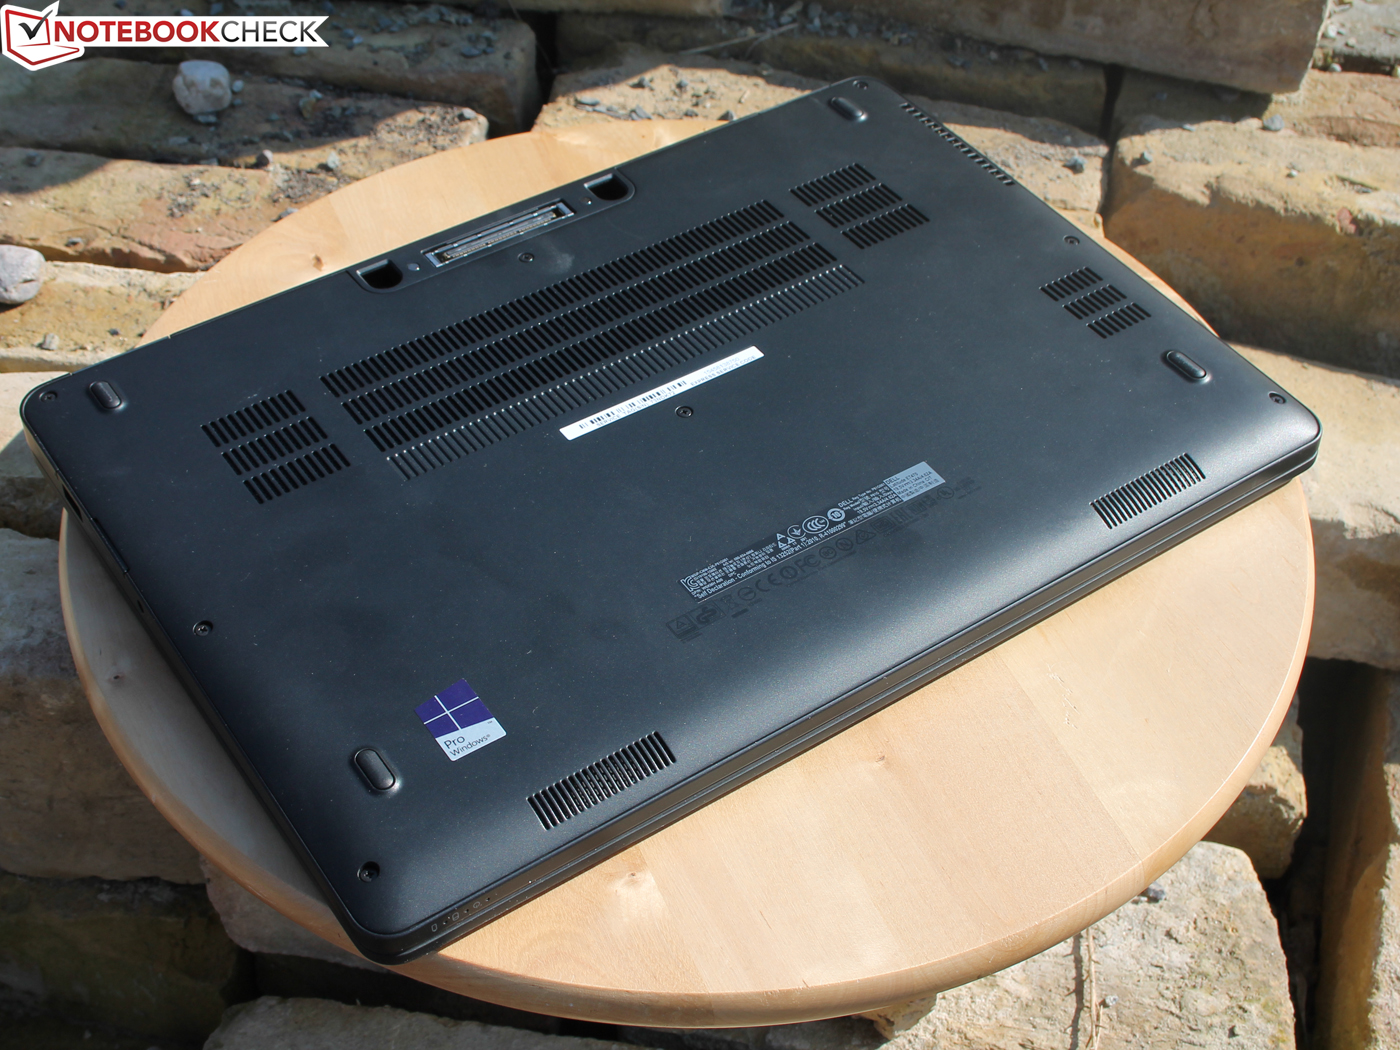
戴尔坚持着它的理念,没有为这台商务超级本的新版本减少任何功能。这台14寸设备工艺上乘,可以满足商务以及通常使用的需要。不过镜面的屏幕则非如此,它在日光下会造成十分影响使用的反光。WQHD屏幕的优秀表现则弥补了这个缺憾,在室内它显得特别养眼。出色的输入设备对于高端的Latitude来说必不可少,E7470也没有让我们失望。安全管理也是如此,一台笔记本电脑很少会支持如此多的(可选)安全功能。它的可维护性也值得赞誉;只需打开底盖你就可以更换升级所有的组件。
它唯一的短板是续航时间,5小时46分钟的无线上网对它来说就是极限了。这很难满足我们对一台售价2300欧元(约16952人民币)的设备的期待。搭配高清或全高清屏幕的型号将会提供相比4K型号稍长的续航时间。
可能它最强的竞争者是惠普的EliteBook Folio 1040 G2,不过它搭配磨砂全高清屏幕的型号售价还高出了200-300欧元(约1474到2211人民币)。它的电池续航稍长,不过接口较少。如果你想节省一些预算,IGP版本的联想 ThinkPad T450s也值得考虑;配置相当的型号起售价约1850欧元(约13635人民币)。如果考虑磨砂全高清屏幕型号的话,E7470和T450s的性价比十分接近。
2016/04/02更新:增加ThinkPad T460s全高清IPS和T460sWQHD屏幕型号到比较列表中。
注:本文是基于完整评测的缩减版本,阅读完整的英文评测,请点击这里。
Dell Latitude 14 7000 Series E7470
- 03/23/2016 v5 (old)
Sebastian Jentsch
Price comparison
