KUU LeBook 12.6二合一敞篷车评论。一个更便宜的微软Surface Pro替代品
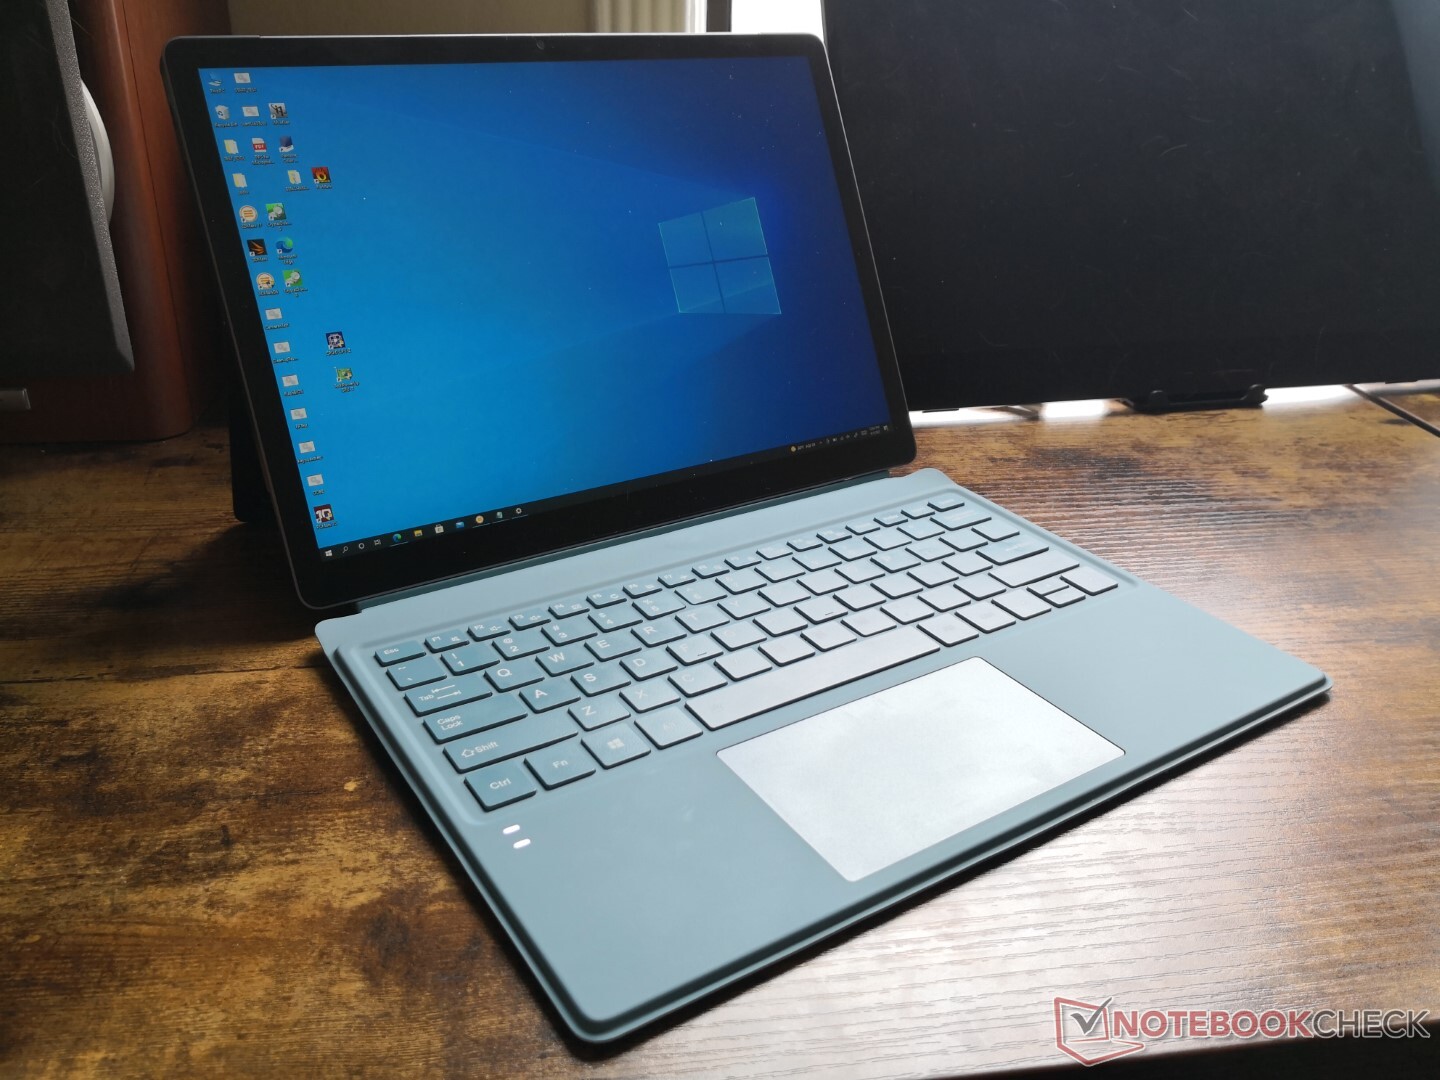
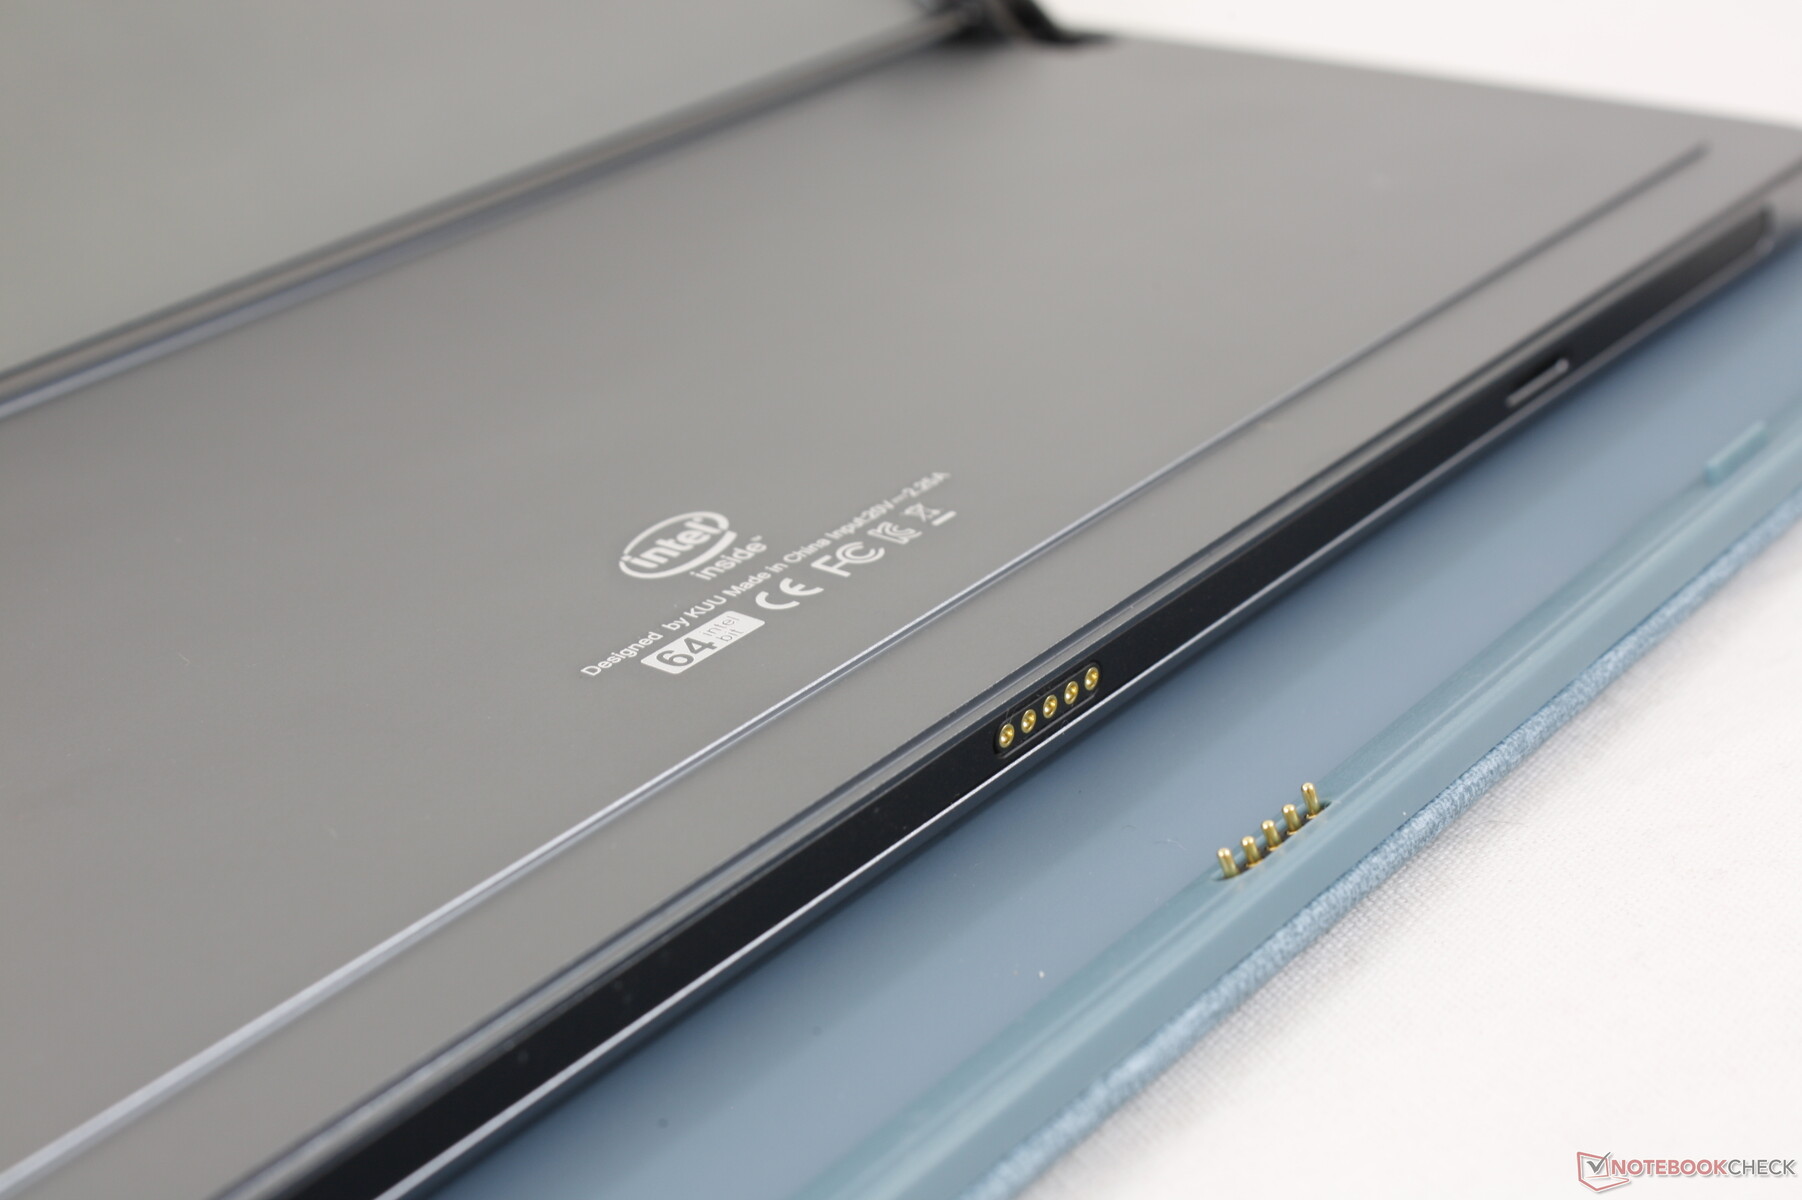
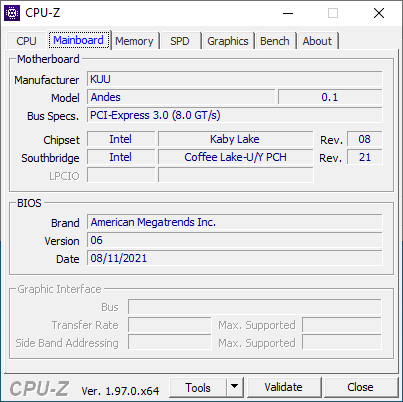
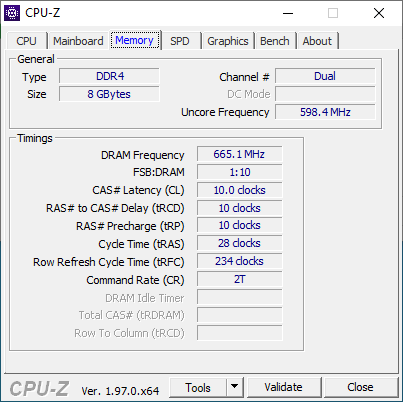
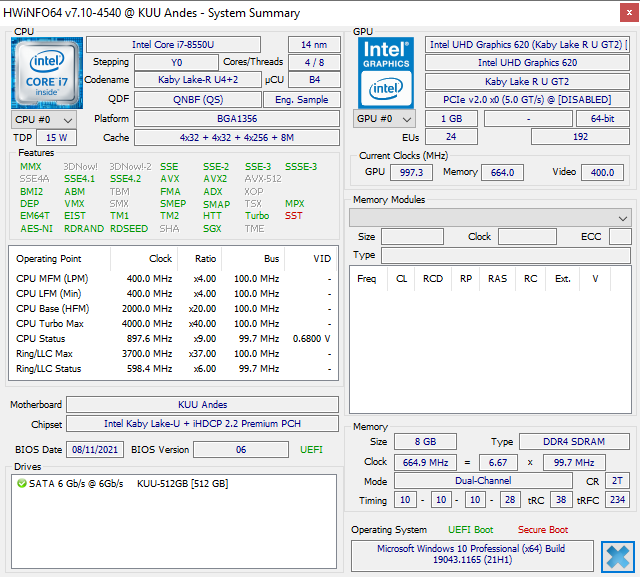
KUU LeBook 12.6是一款与Surface Pro系列相同的Windows 10可拆卸式。它的设计和功能显然受到了成功的微软平板电脑的启发,但为了保持价格的显著降低,它做了某些改变和偷工减料。这些变化之一是使用了较老的英特尔第八代酷睿U系列CPU,而不是目前市场上大多数PC上的最新11代版本。本评论将探讨用户在购买更便宜的LeBook而不是更传统的Surface Pro时可以期待的所有其他差异。
LeBook的竞争者包括其他Windows 10平板电脑或可拆卸设备,如 微软Surface, 联想ThinkPad X12,或 戴尔Latitude 12 7210 2合1所有这些产品的零售价格都较高。然而,LeBook的独特之处在于其稍大的3:2 12.6英寸显示屏,而不是通常的12.3英寸或12.5英寸屏幕。由于截至发稿时尚未广泛上市,制造商尚未最终确定LeBook的价格。
potential competitors in comparison
Rating | Date | Model | Weight | Height | Size | Resolution | Price |
|---|---|---|---|---|---|---|---|
| 75.3 % v7 (old) | 09 / 2021 | Kuu LeBook 12.6 Core i7-8550U i5-8550U, UHD Graphics 620 | 859 g | 9.5 mm | 12.60" | 2160x1440 | |
| 88.5 % v7 (old) | 04 / 2021 | Lenovo ThinkPad X12 20UVS03G00 i7-1160G7, Iris Xe G7 96EUs | 1.1 kg | 14.5 mm | 12.30" | 1920x1280 | |
| 88.5 % v7 (old) | 03 / 2021 | Microsoft Surface Pro 7 Plus i5-1135G7, Iris Xe G7 80EUs | 796 g | 8.5 mm | 12.30" | 2736x1824 | |
| 89.5 % v7 (old) | 08 / 2021 | Dell Latitude 12 7210 2-in-1 i7-10610U, UHD Graphics 620 | 850 g | 9.35 mm | 12.30" | 1920x1280 | |
| 84.6 % v7 (old) | 10 / 2020 | Microsoft Surface Laptop Go Core i5 i5-1035G1, UHD Graphics G1 (Ice Lake 32 EU) | 1.1 kg | 15.69 mm | 12.40" | 1536x1024 | |
| 77.1 % v6 (old) | NuVision Encite Book 12 Plus Celeron N3350, HD Graphics 500 | 1 kg | 15 mm | 12.50" | 2560x1440 |
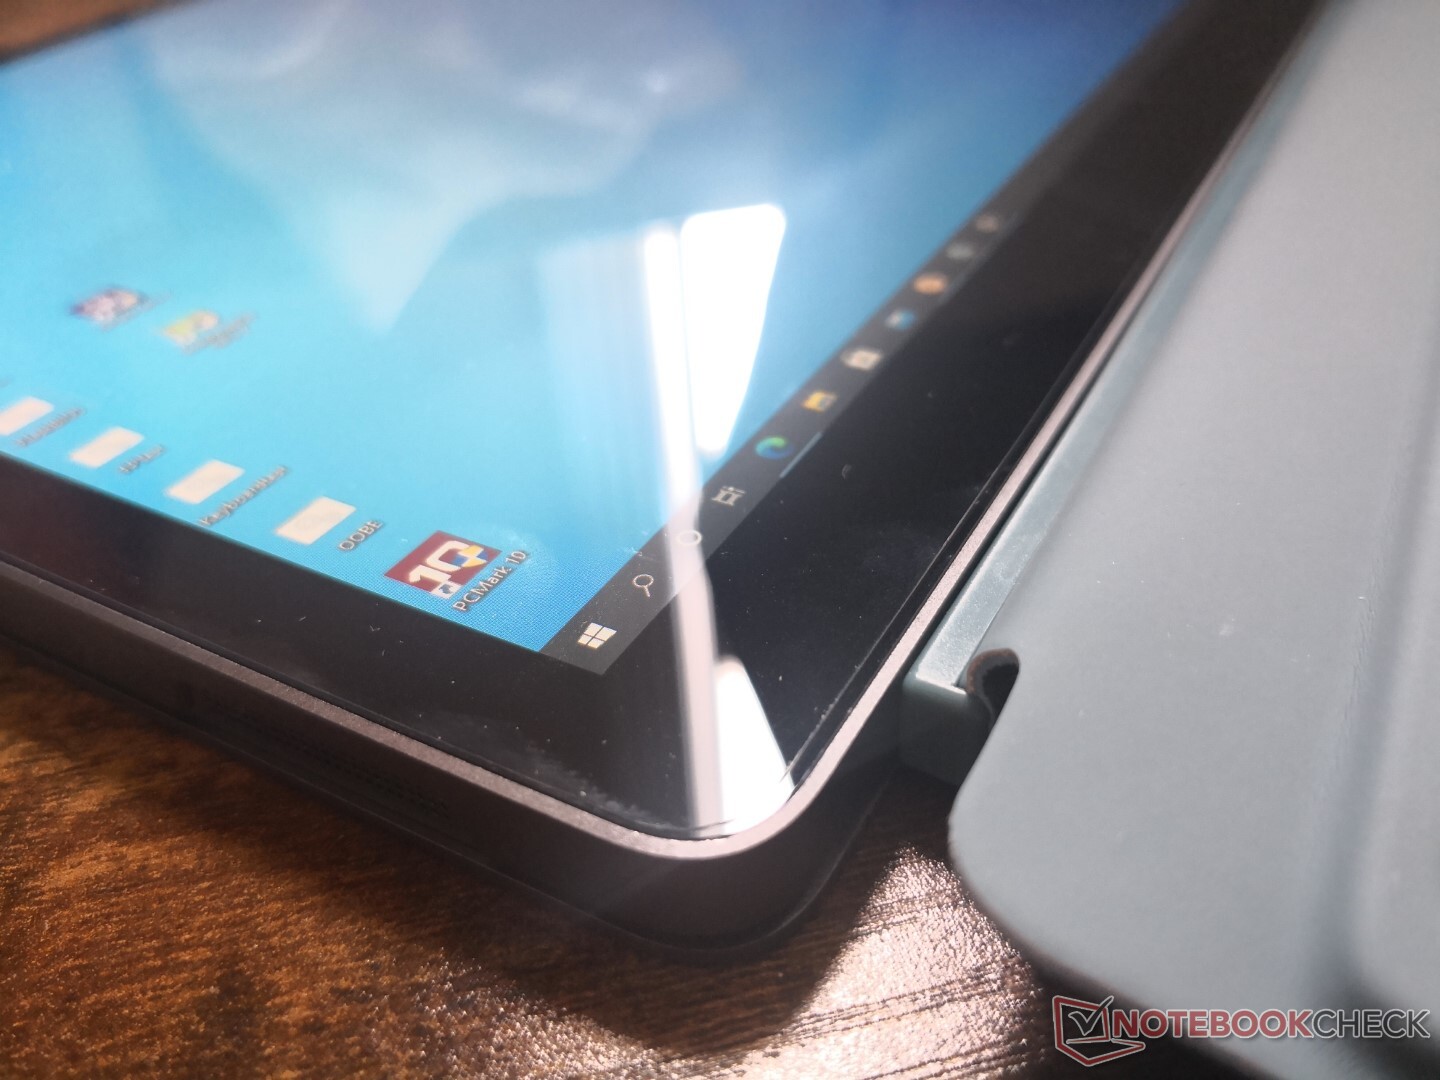
案例
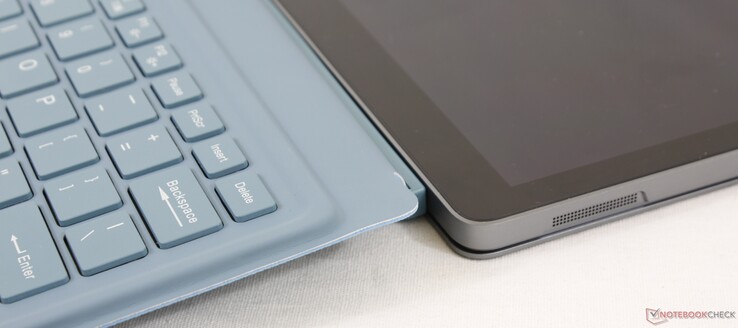
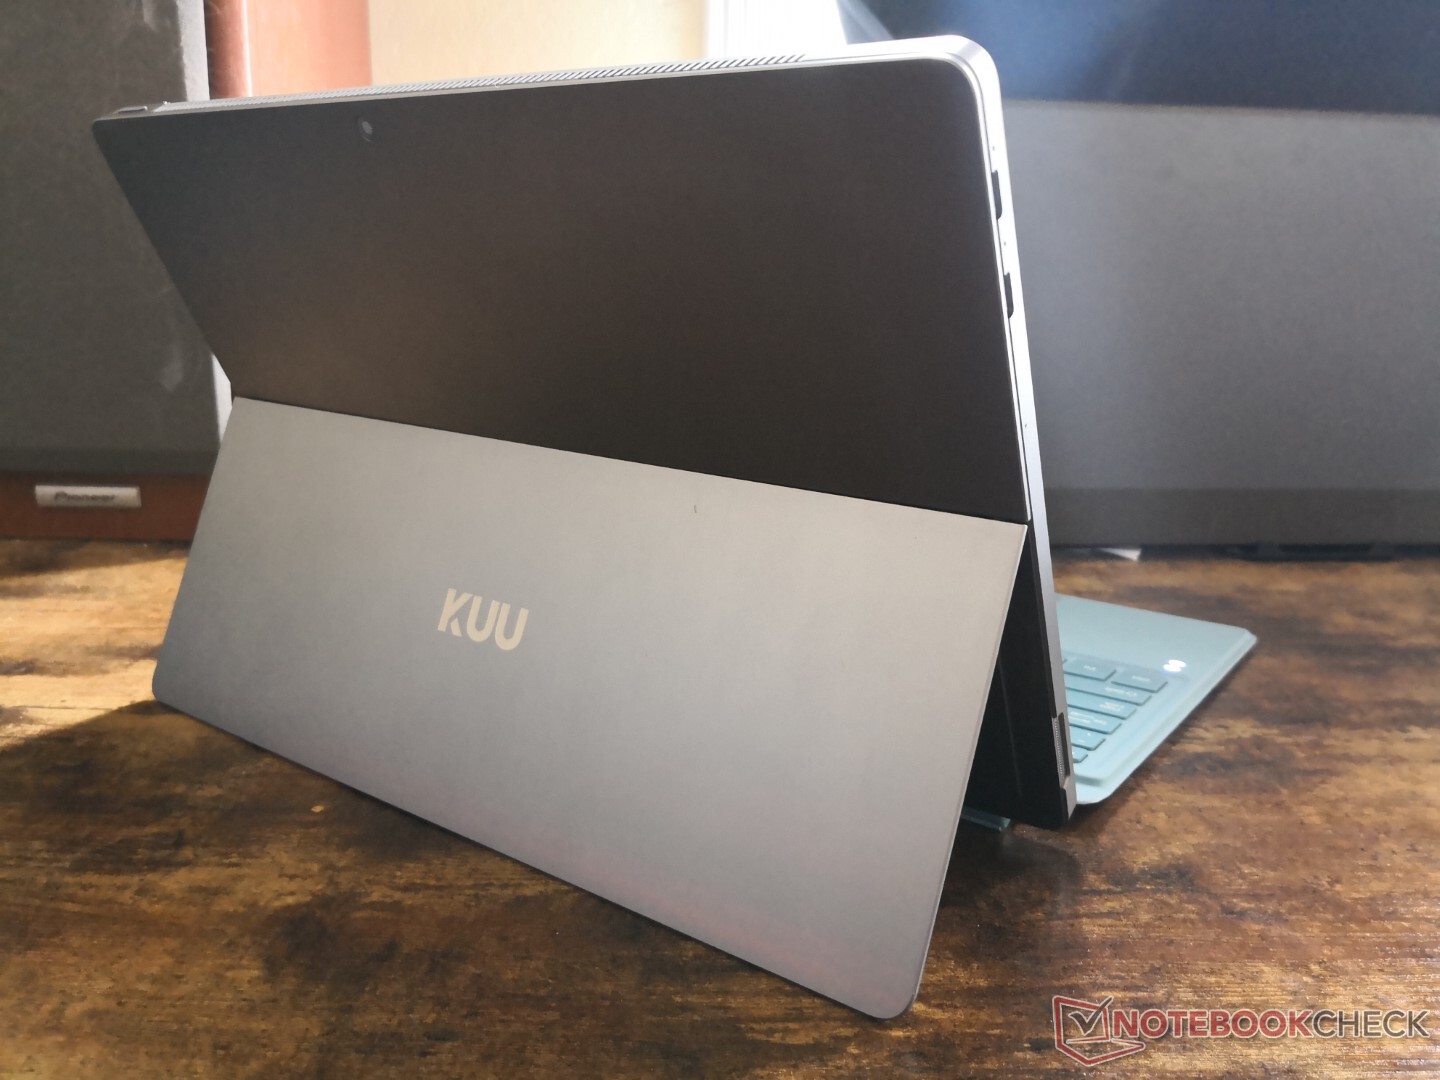
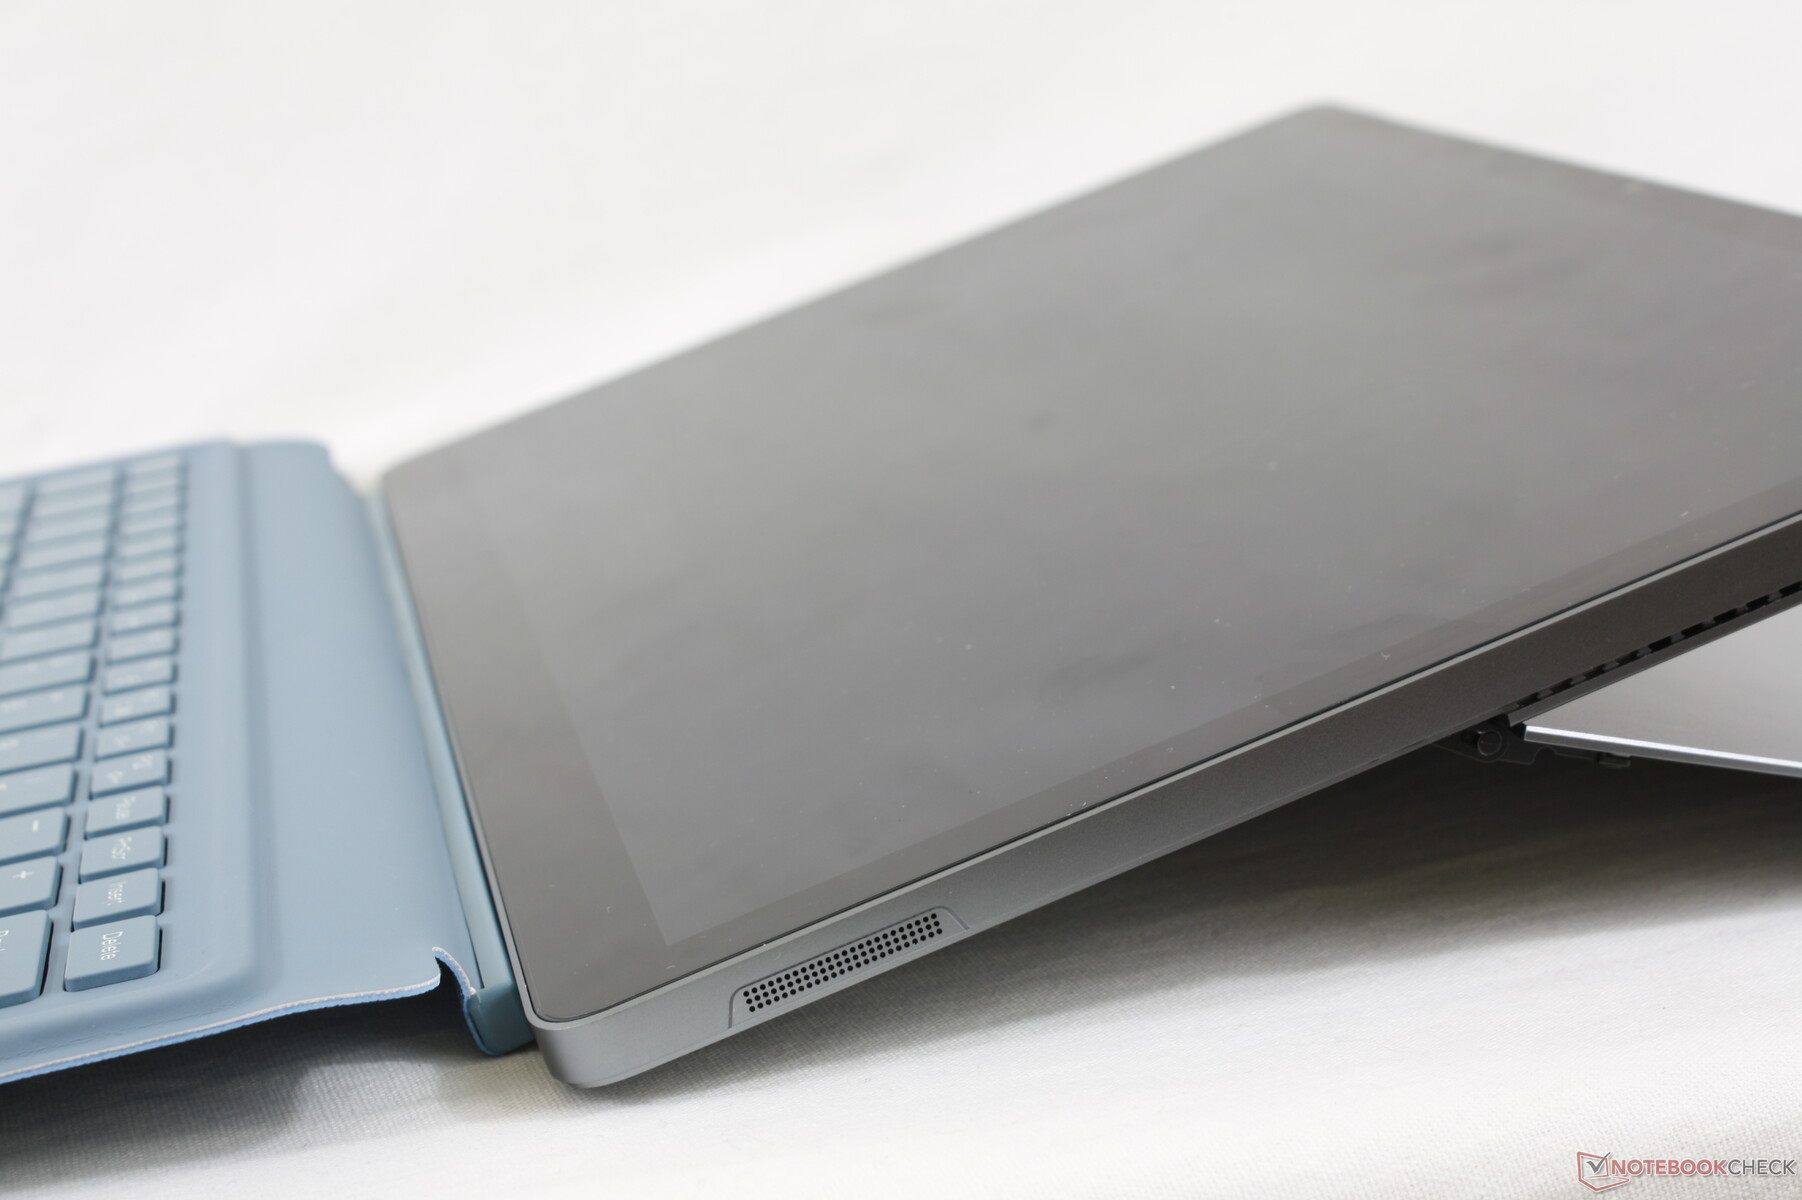
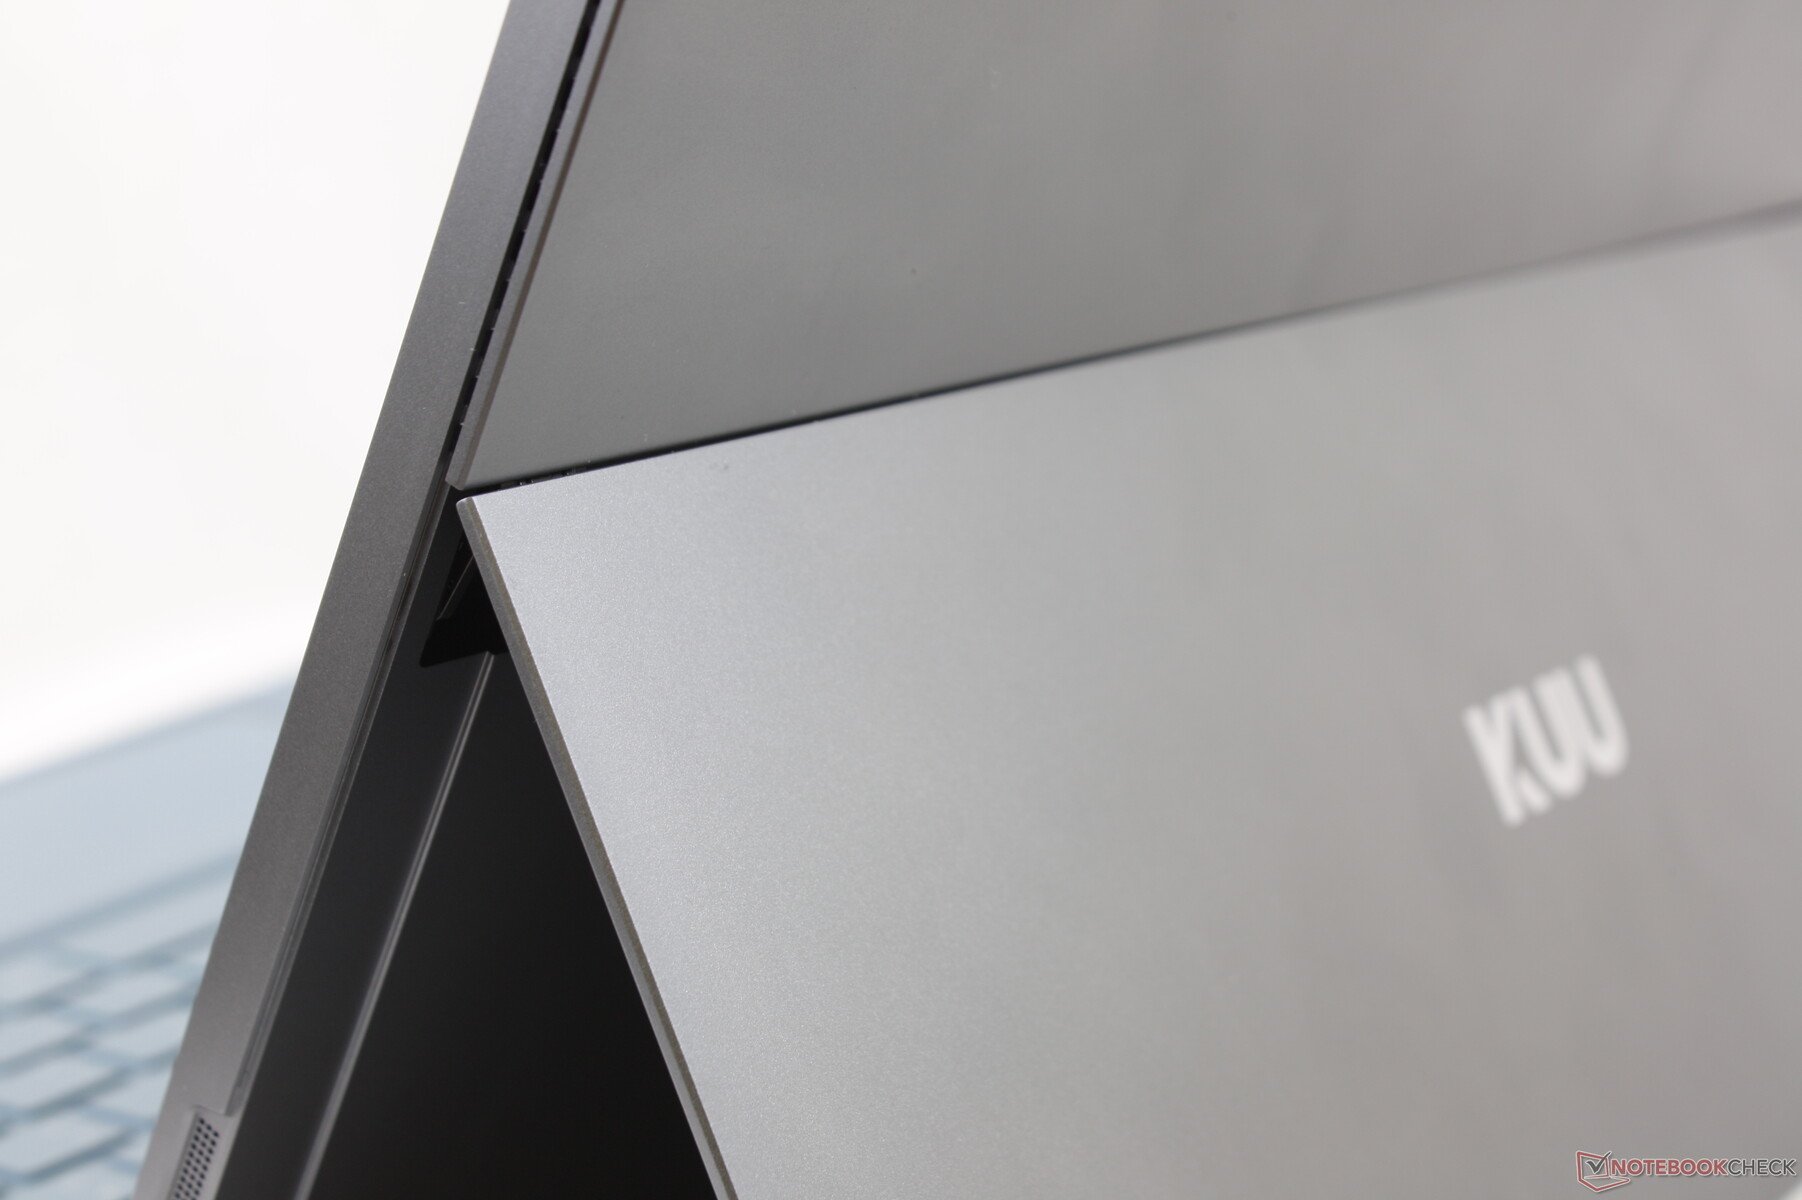
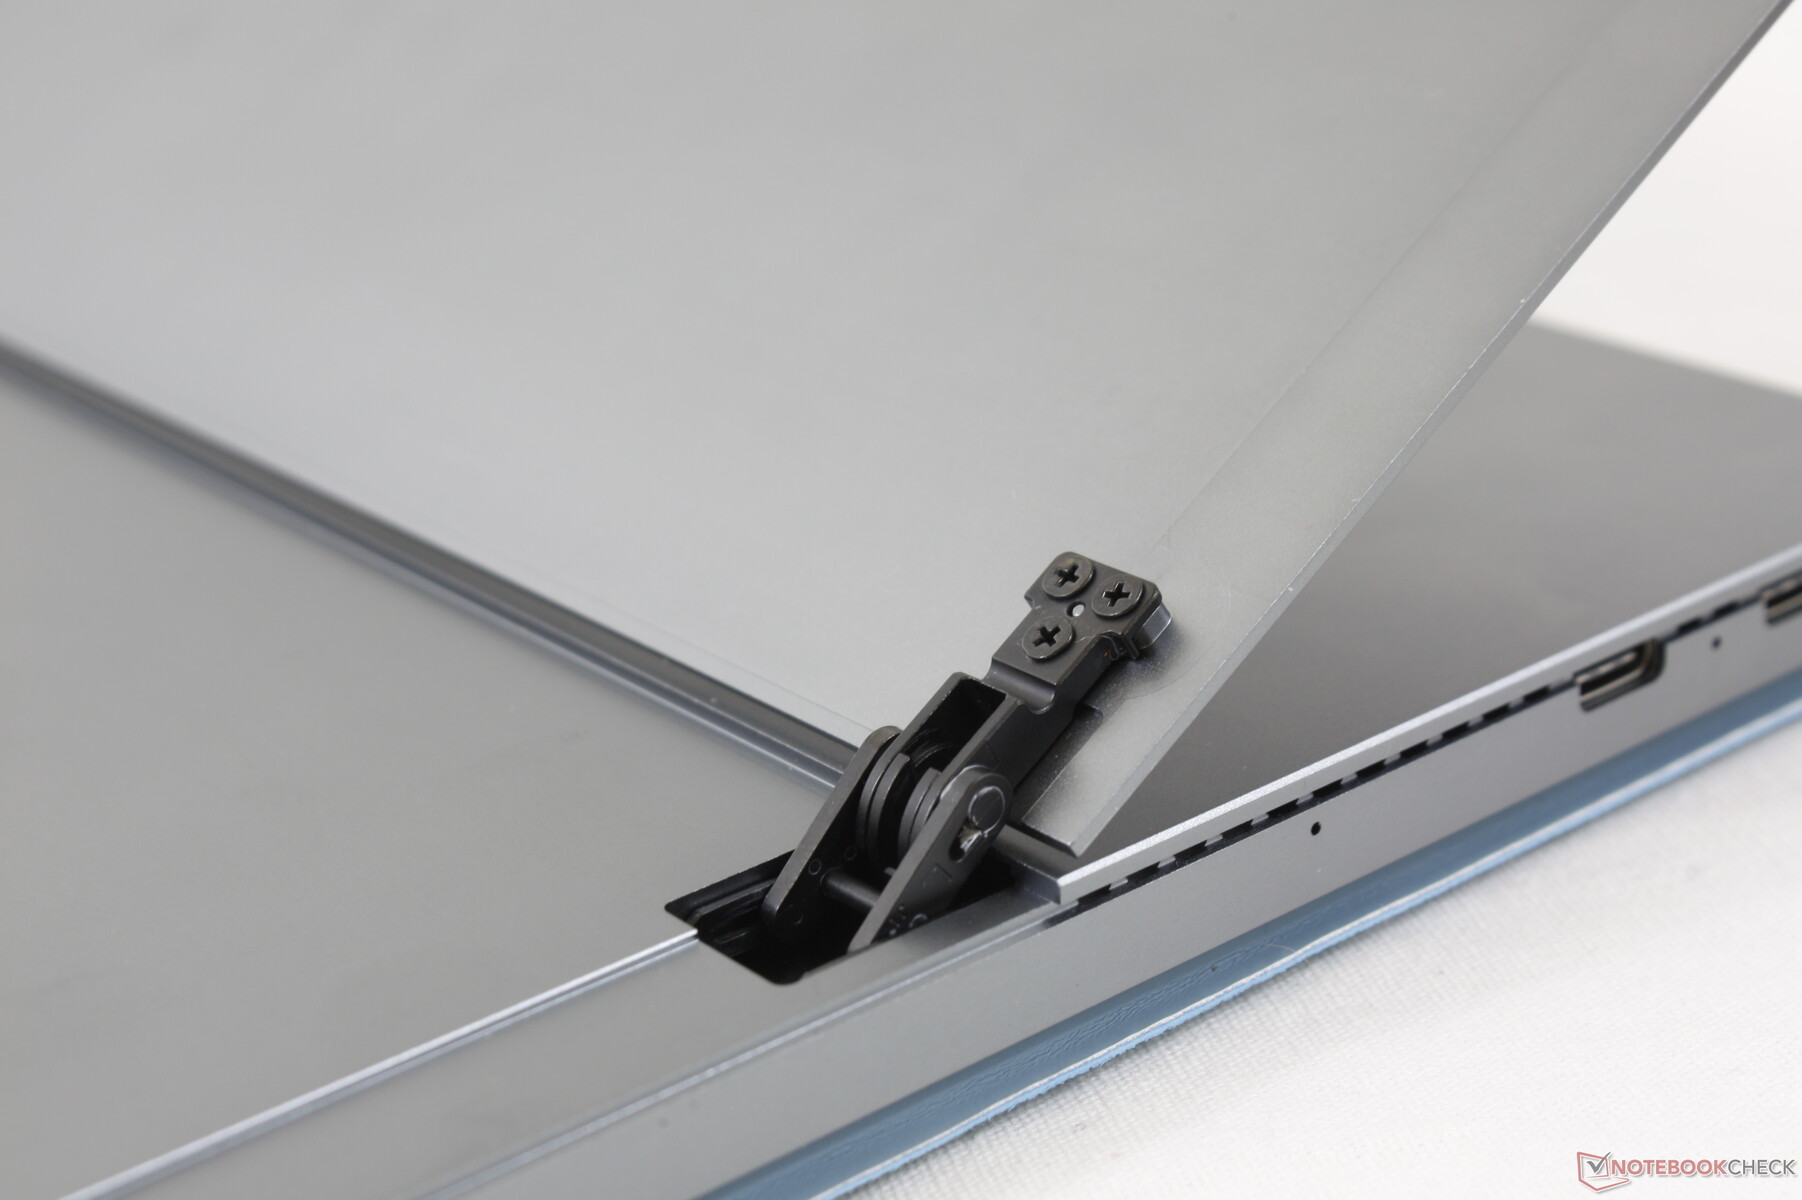
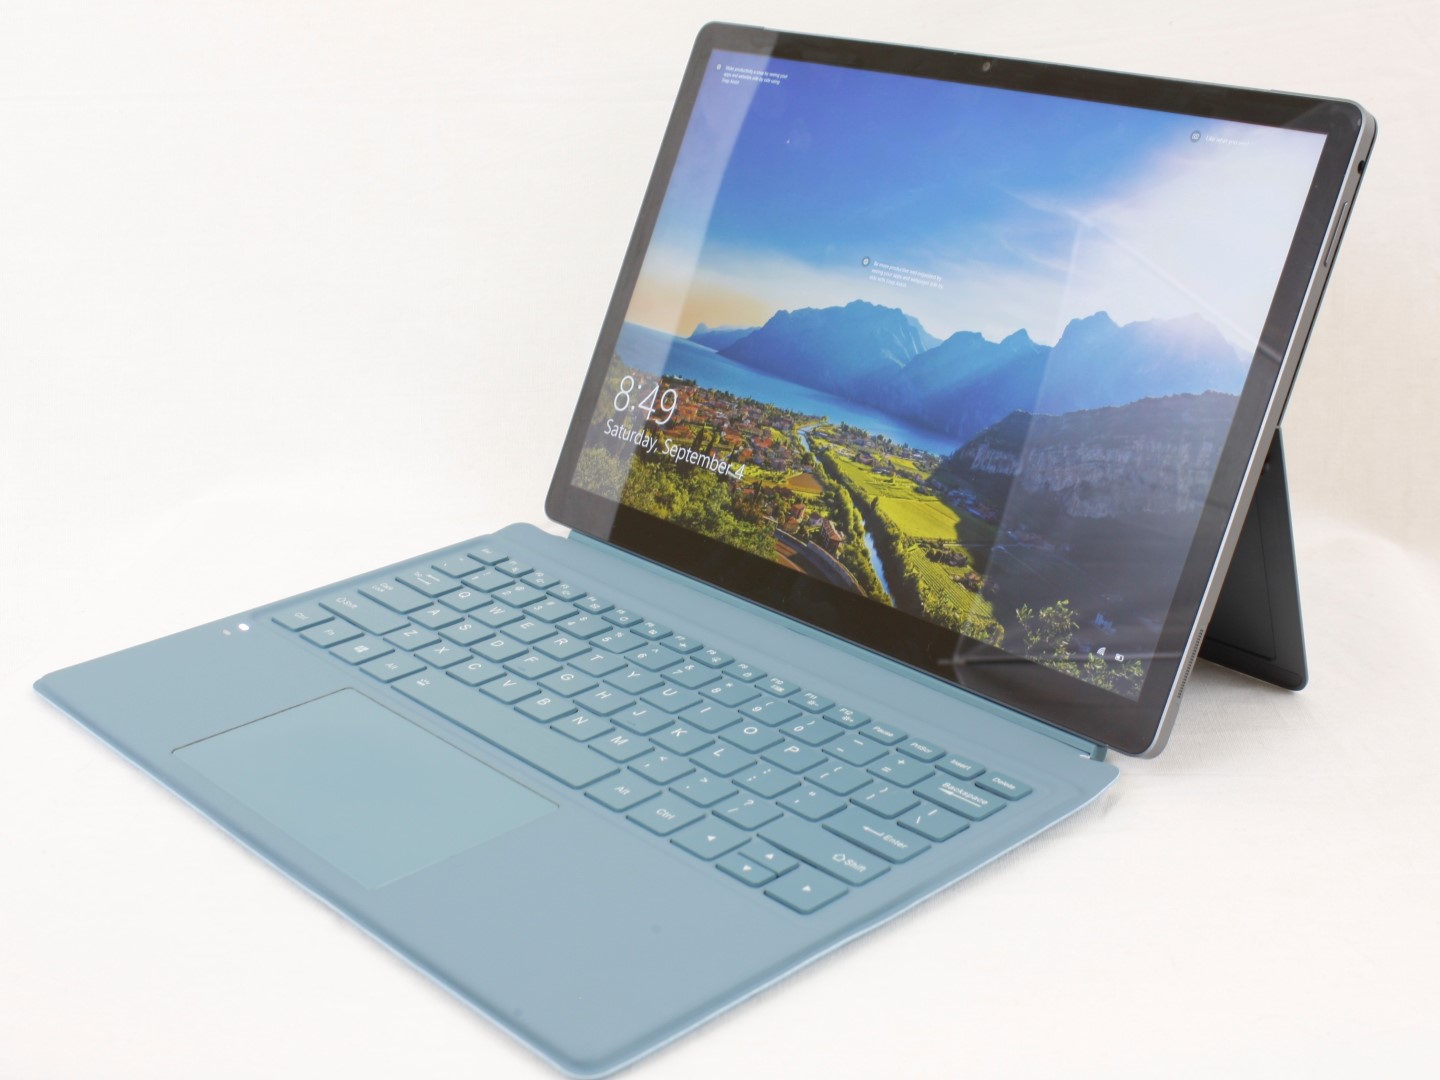
金属底盘是LeBook的一个亮点,因为它感觉接近于价格较高的Surface Pro的质量。然而,背面的金属支架本可以更坚硬或更厚,因为它有点容易变形。
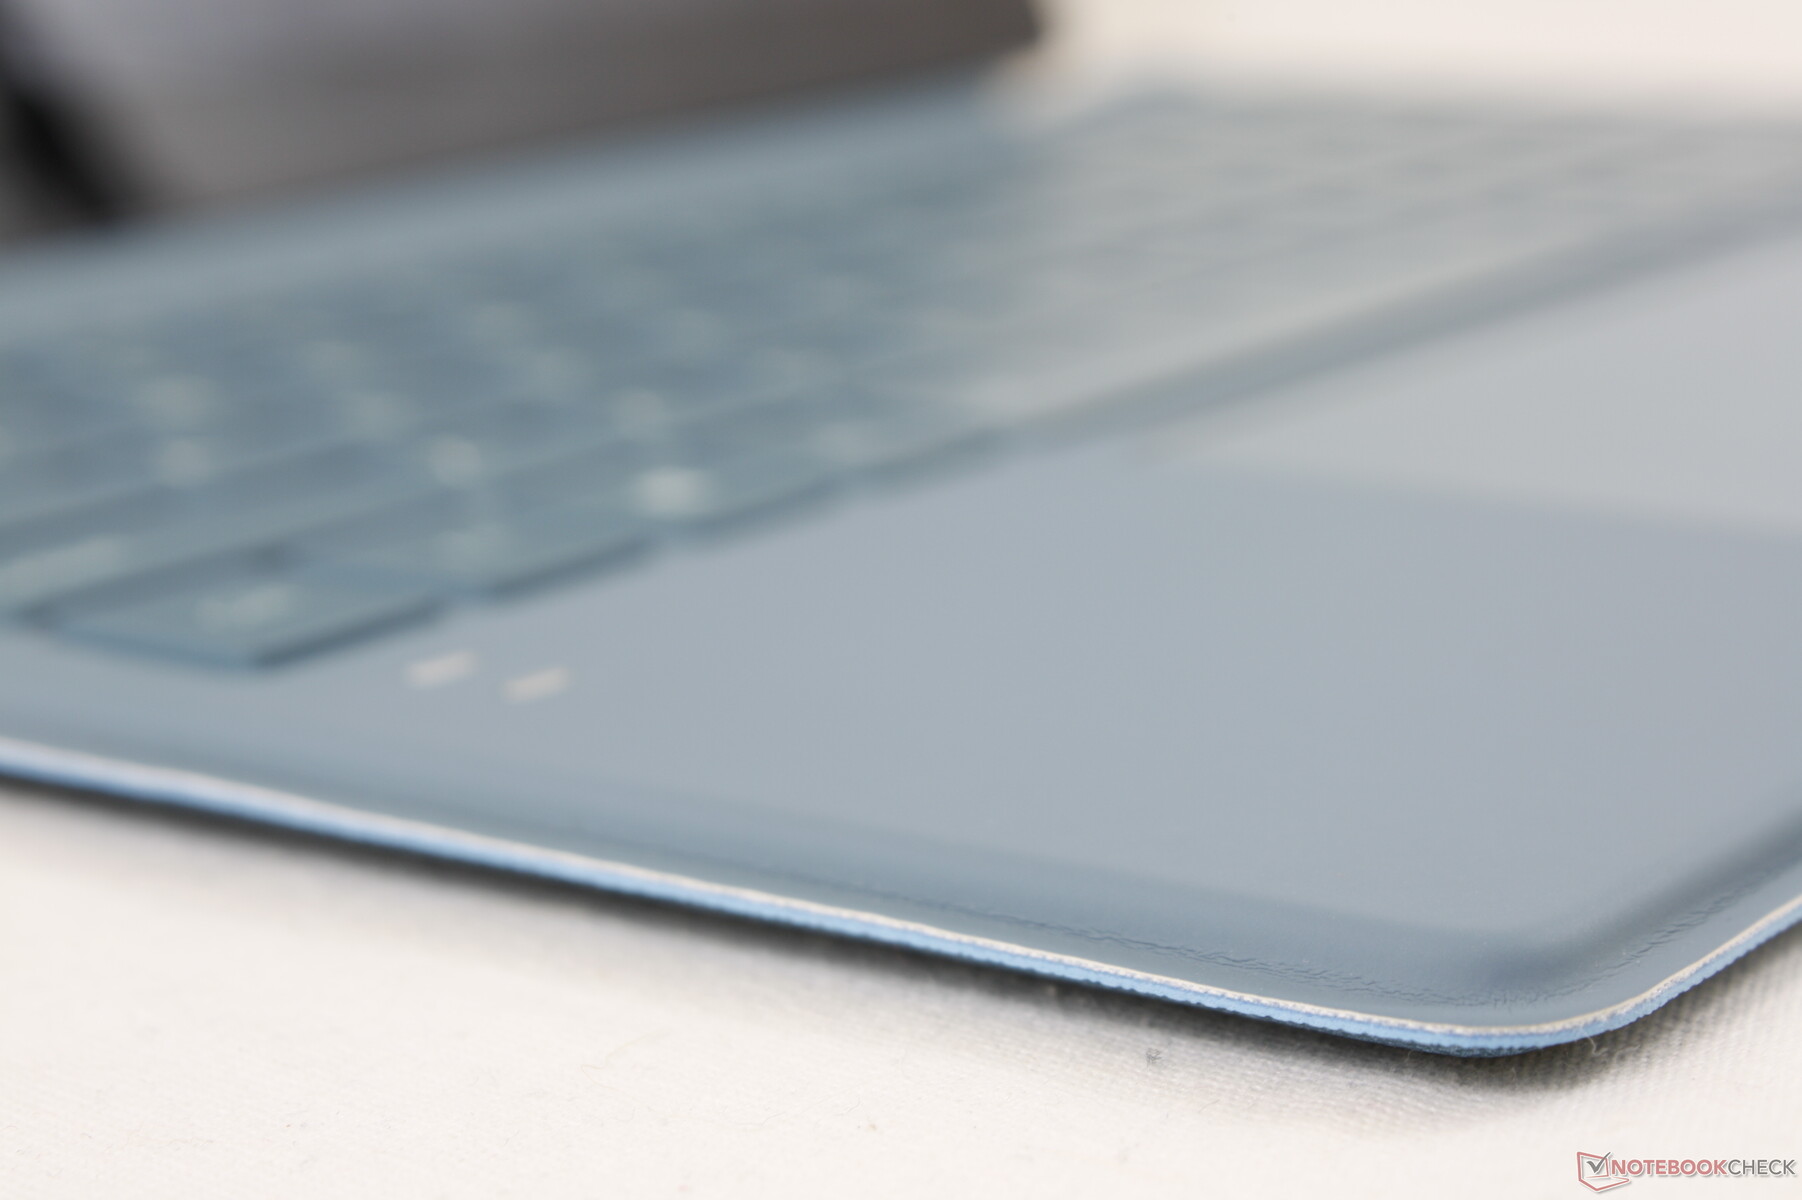
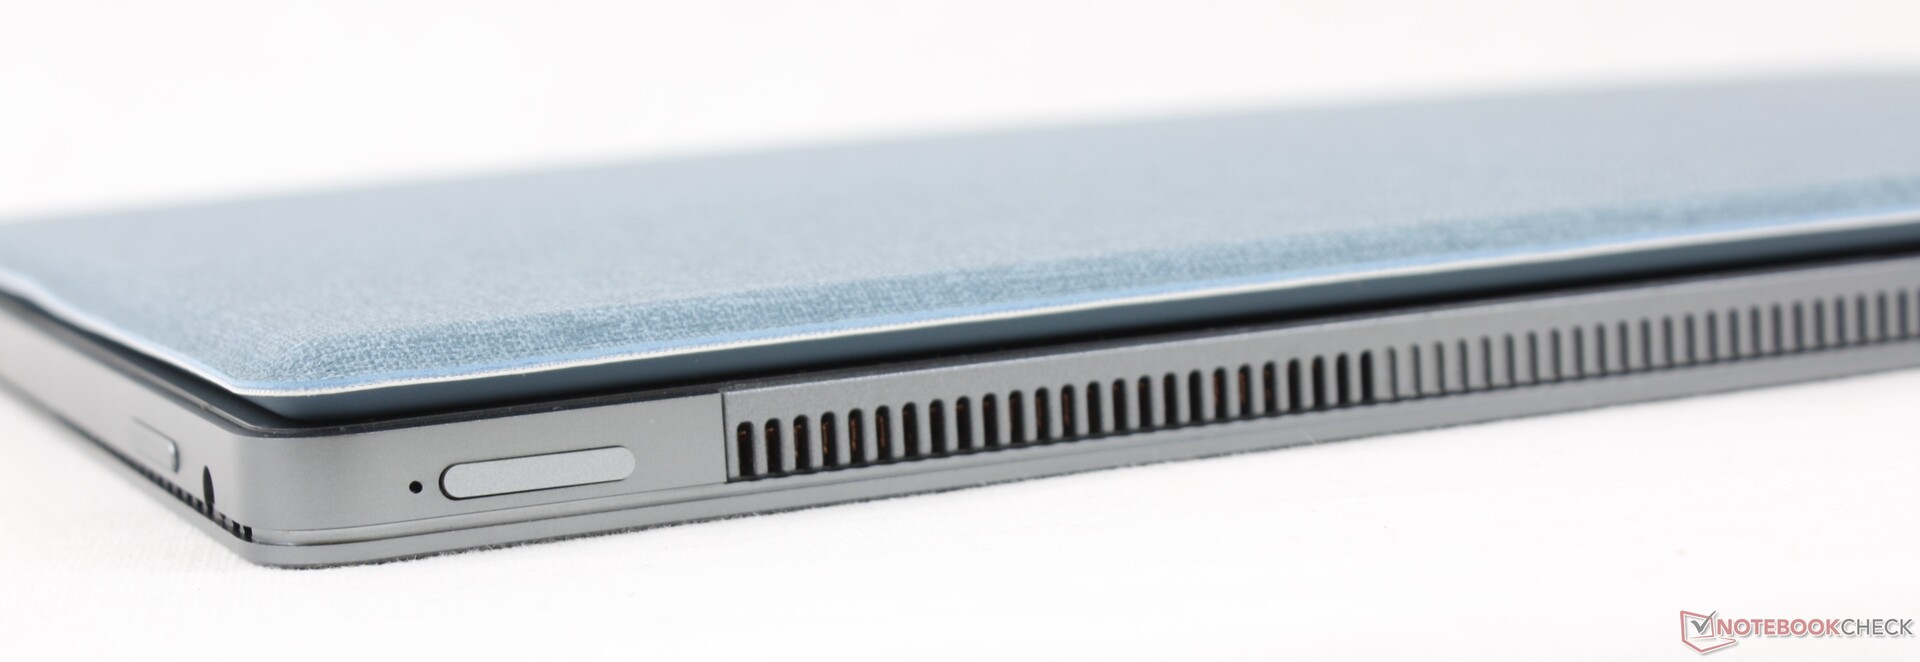
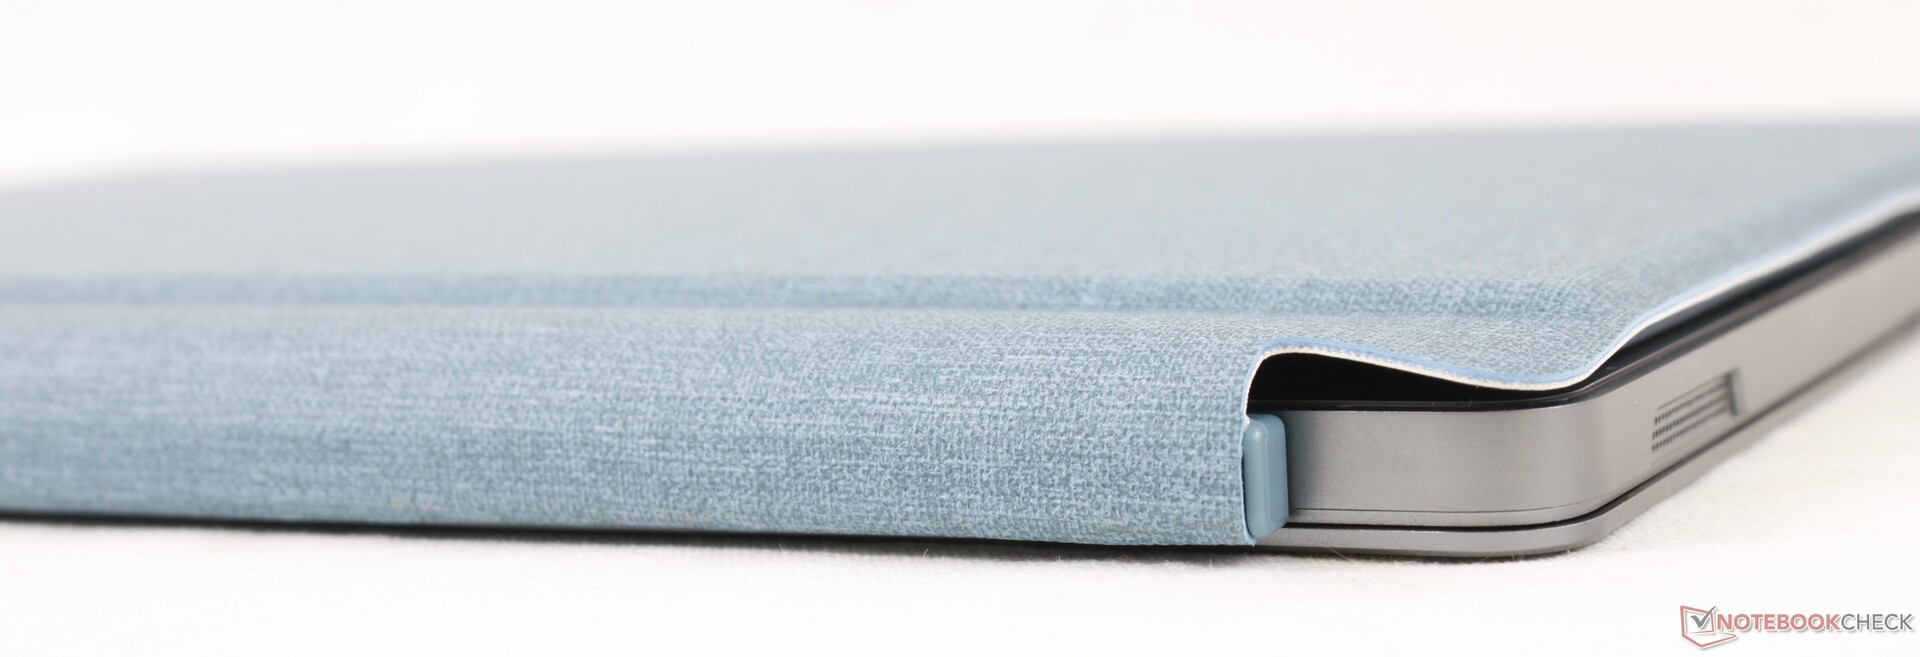
底部由Alcantara和仿皮的底部纹理组成。虽然它看起来很好,有高质量的感觉,但它太灵活了,容易扭曲,对打字体验有负面影响。如果有一个更牢固的、更坚实的键盘甲板会更好。
尺寸和重量都比Surface Pro 7略大和略重,这与稍大的12.6英寸显示屏有关。不管怎么说,KUU的屏占比是比较高的。使用键盘底座使平板电脑的重量增加了约308克。
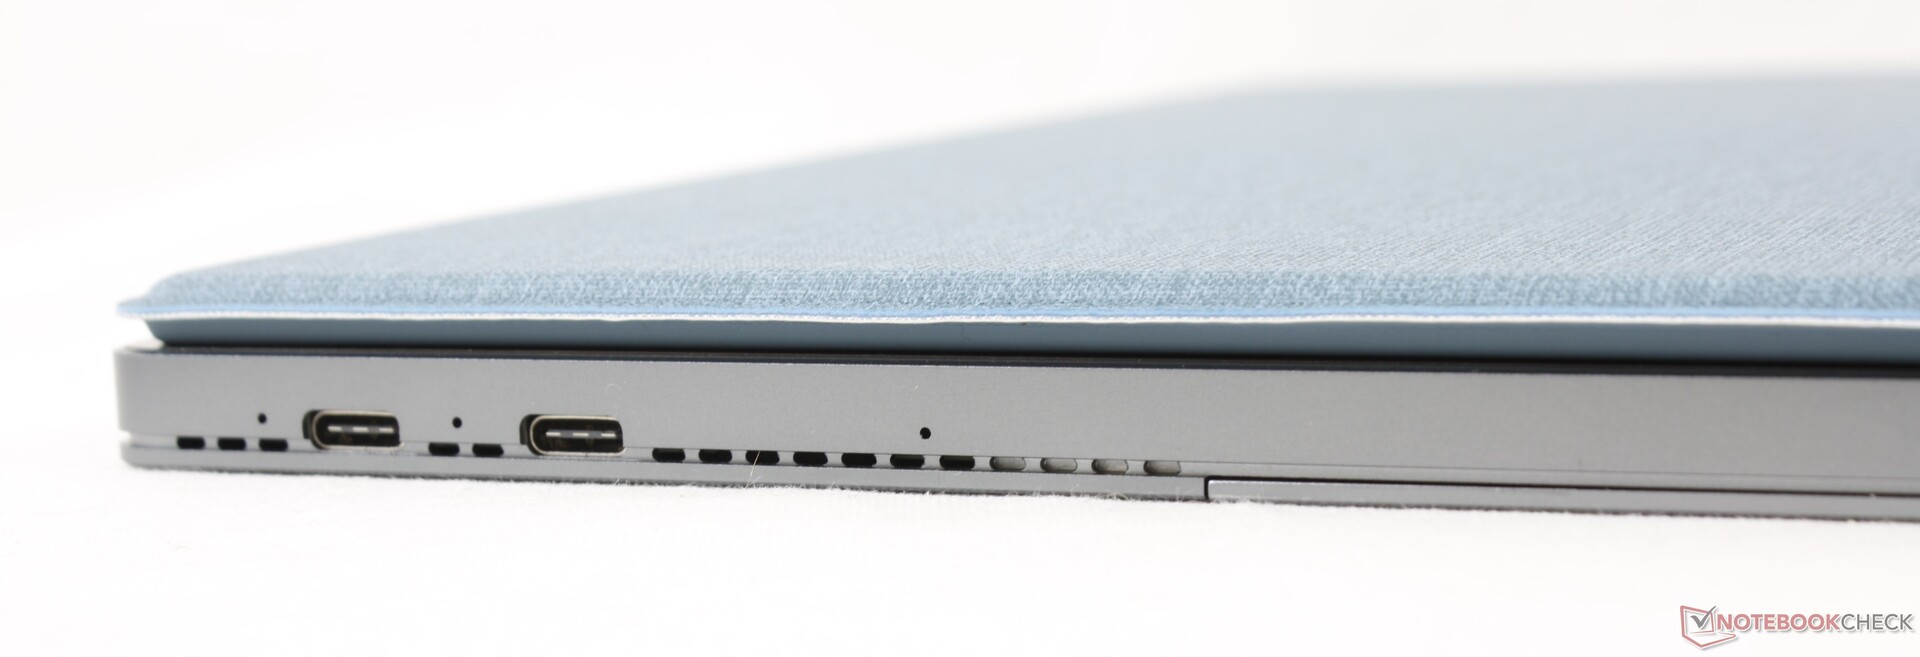
连接性
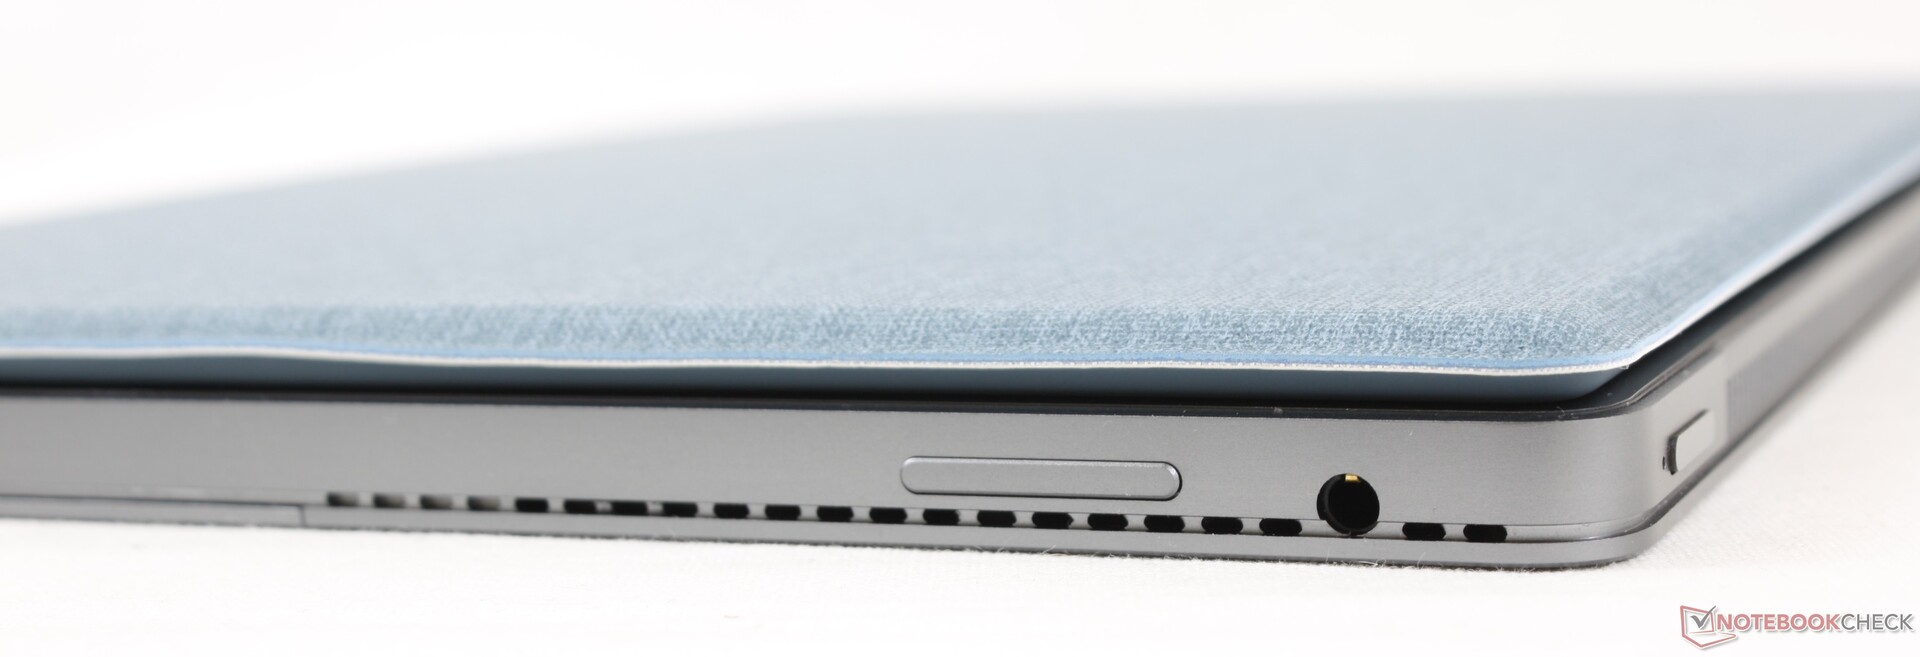
两个USB-C端口分别支持充电和外部显示器。不幸的是,与Surface Pro系列不同,没有集成的USB-A端口。
沟通
没有Wi-Fi 6支持可能是为了节省成本。集成的1x1英特尔3168提供的实际传输速率只有350Mbps左右,比配备英特尔AX200或AX201的昂贵笔记本电脑慢4倍以上。
| Networking | |
| iperf3 transmit AX12 | |
| Dell Latitude 12 7210 2-in-1 | |
| Microsoft Surface Pro 7 Plus | |
| Lenovo ThinkPad X12 20UVS03G00 | |
| Microsoft Surface Laptop Go Core i5 | |
| NuVision Encite Book 12 Plus | |
| Kuu LeBook 12.6 Core i7-8550U | |
| iperf3 receive AX12 | |
| Lenovo ThinkPad X12 20UVS03G00 | |
| Microsoft Surface Laptop Go Core i5 | |
| Microsoft Surface Pro 7 Plus | |
| Dell Latitude 12 7210 2-in-1 | |
| Kuu LeBook 12.6 Core i7-8550U | |
| NuVision Encite Book 12 Plus | |
网络摄像头


配件和保修
零售包装盒包括交流适配器、可拆卸的键盘底座和一支主动式手写笔。标准的一年有限制造商保修适用。
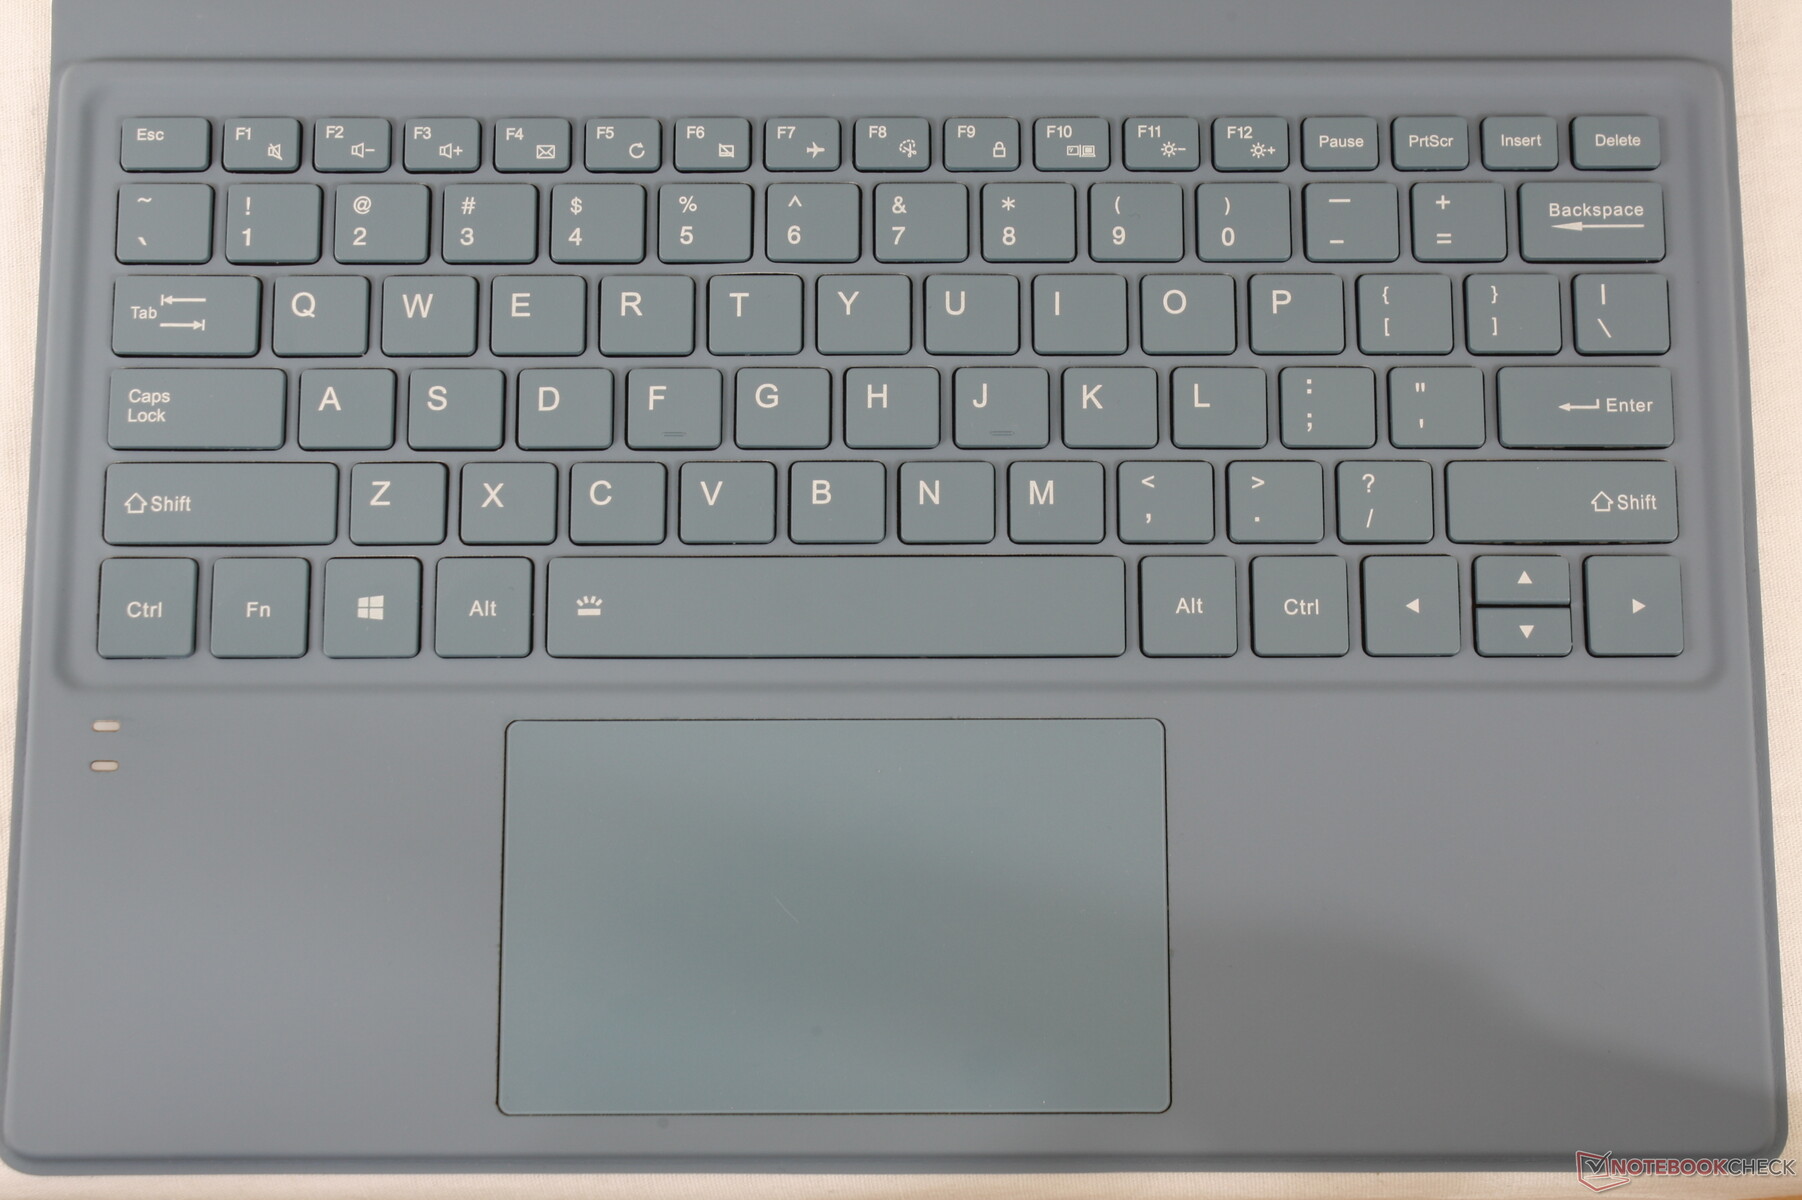
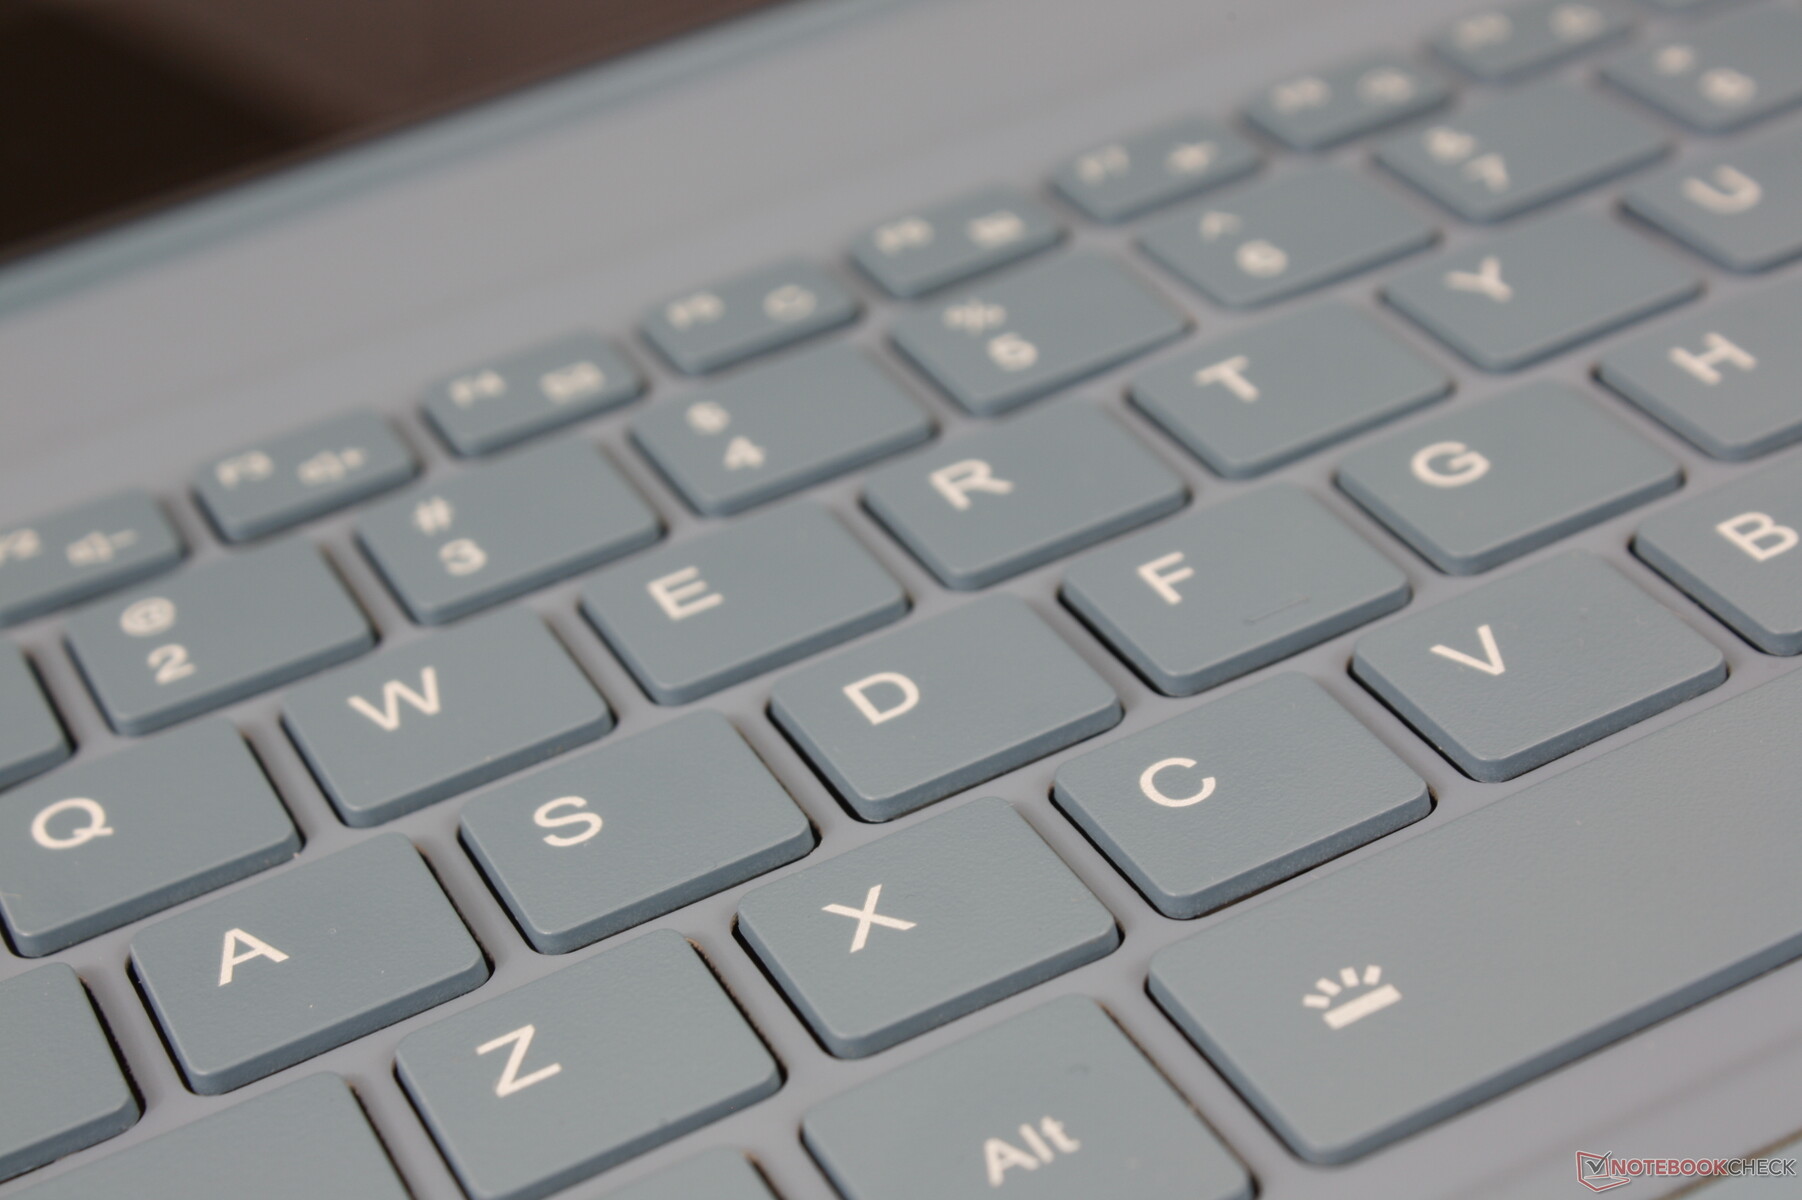
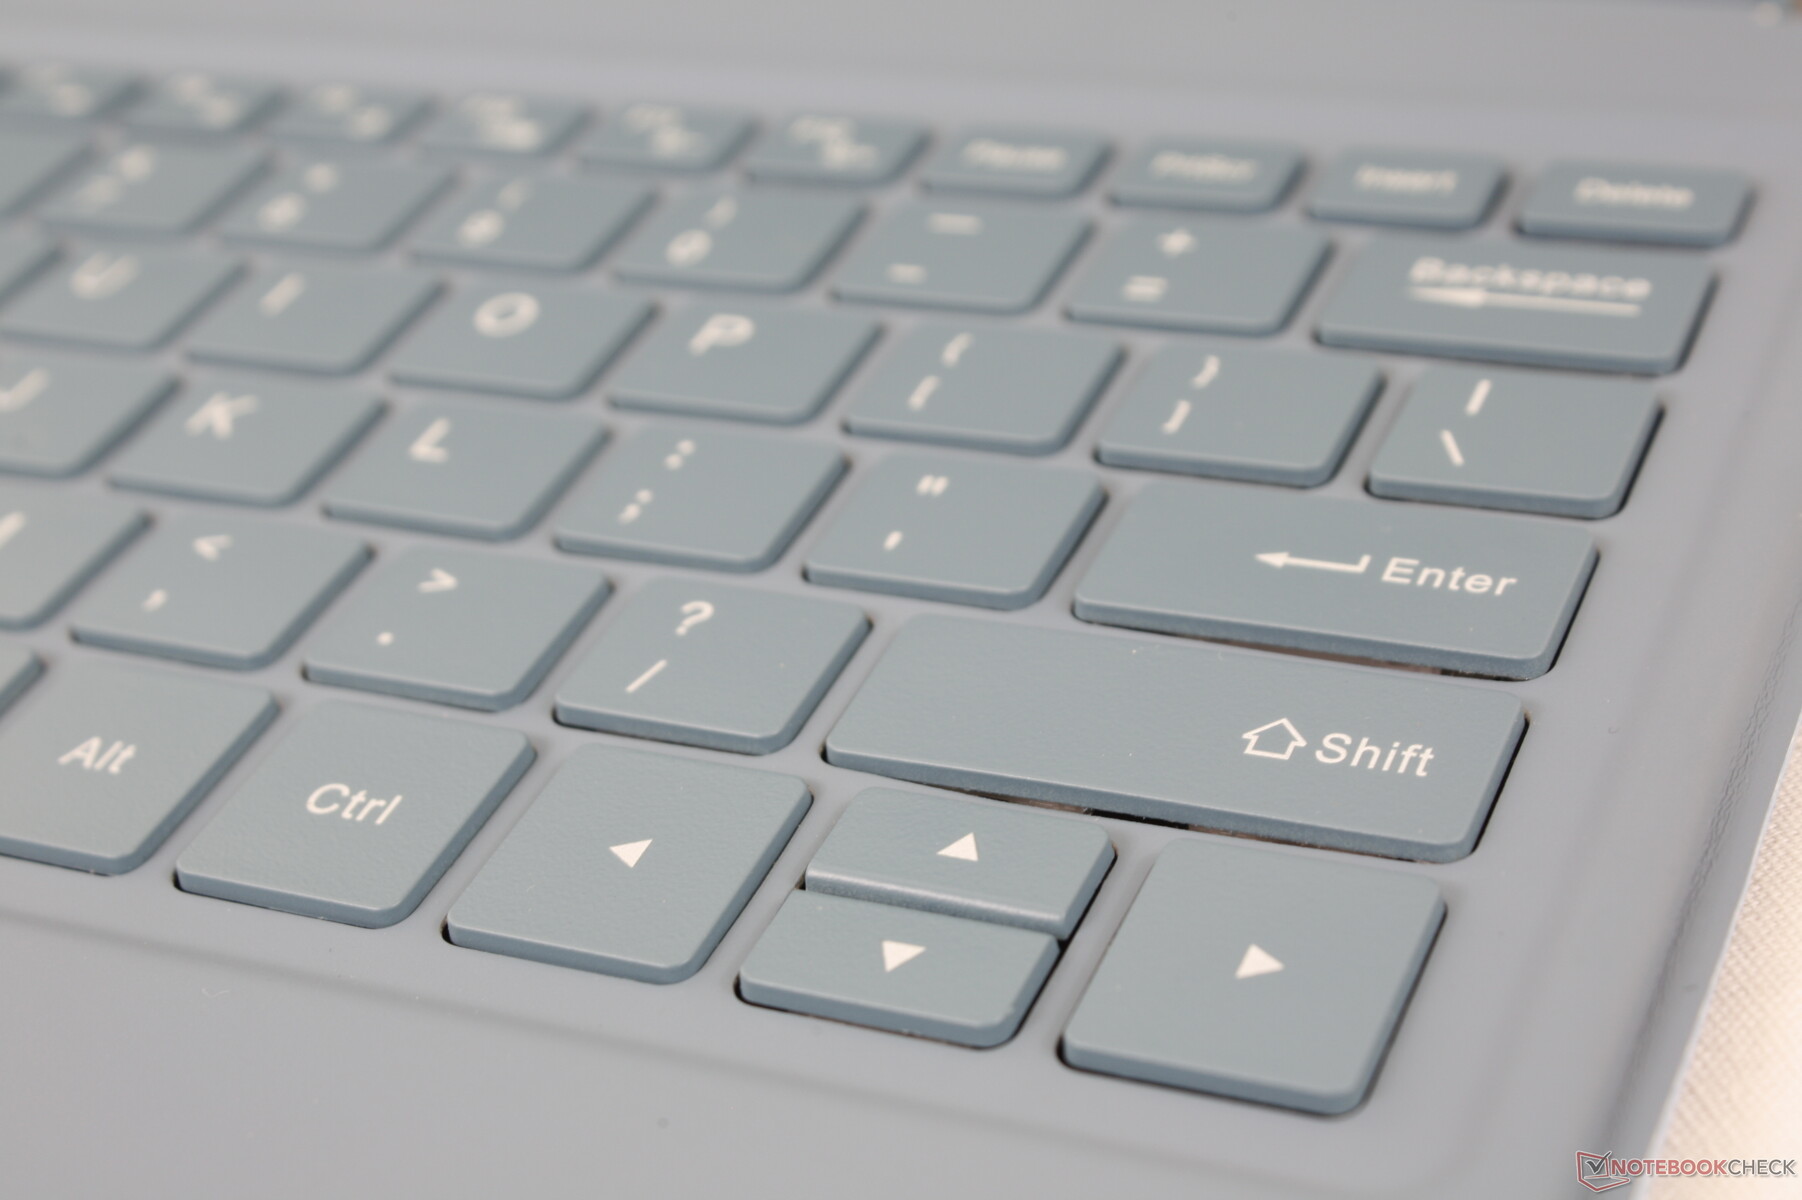
输入设备
键盘
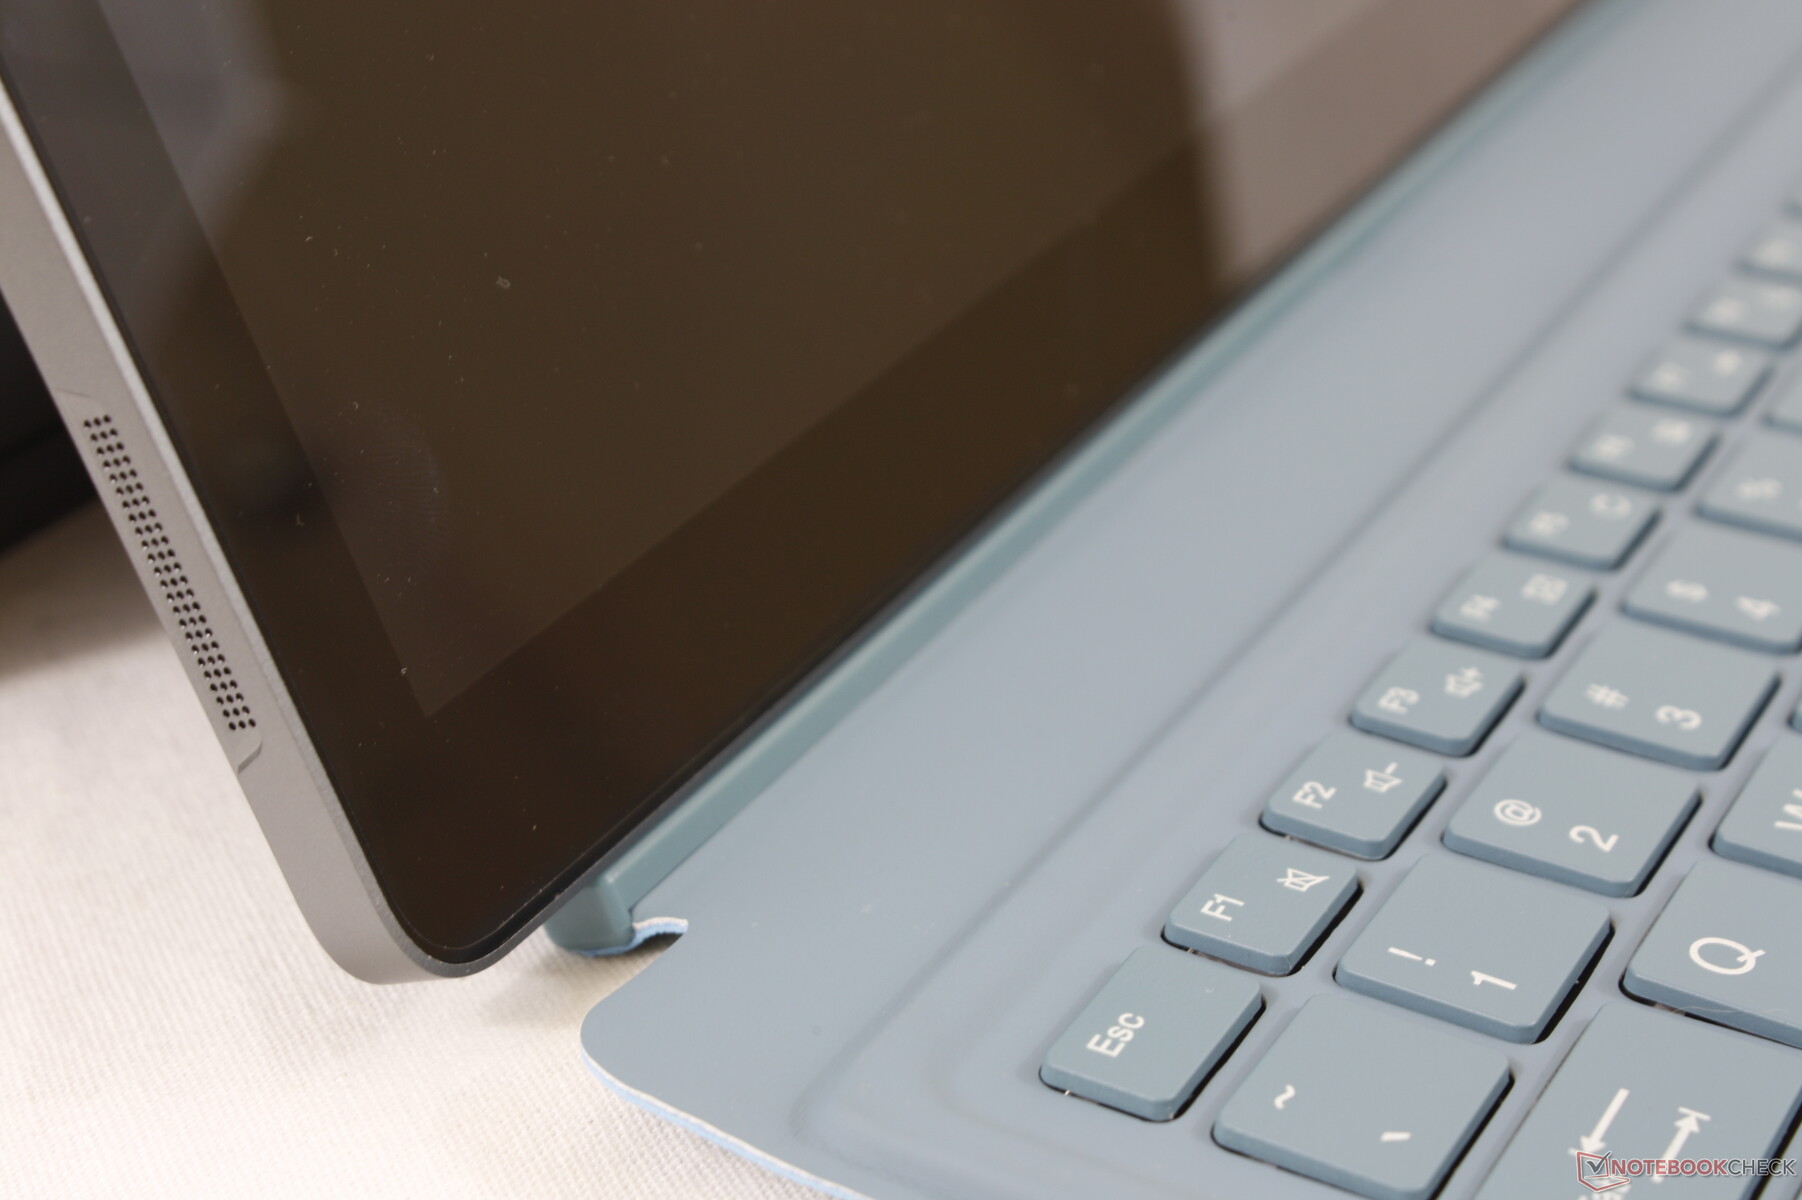
打字体验比Surface Pro系列差,主要是因为一个缺点:底座不能完全平放在桌子上。因此,键盘底座的背面在打字时总是上下跳动,影响了键盘按键的反馈。打字时感觉很有弹性,因为你每按一次键都要把整个底座压下去。
键盘底座的左手掌托上有两个LED指示灯。这些灯比较亮,我们希望它们能再小一点,以减少视觉上的干扰。
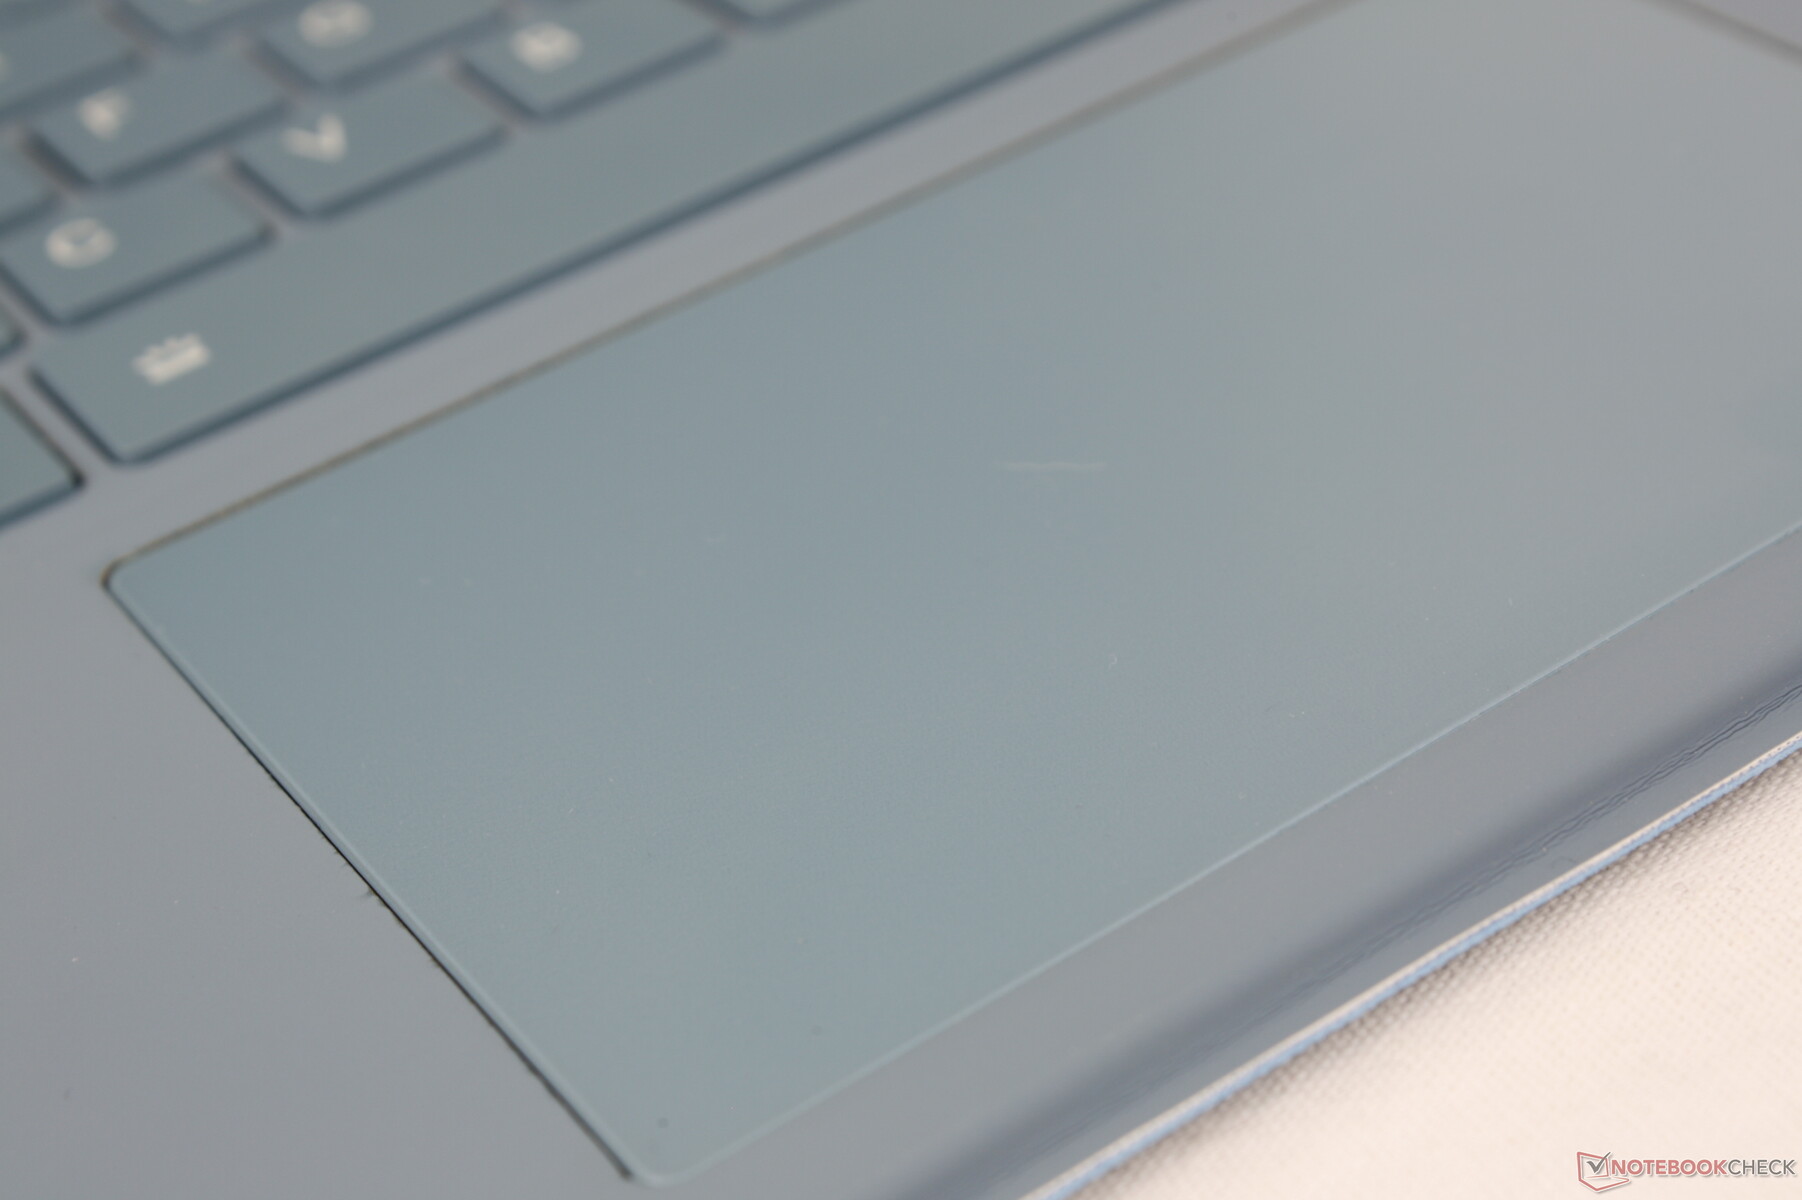
触摸板
点击板比Surface Pro 7的点击板大(10.8 x 6.4厘米对10.2 x 5.3厘米)。然而,它的优势到此为止,因为LeBook点击板的其他方面几乎都很糟糕。它的表面在以较慢的速度滑行时很粘,导致光标跳动。多点触摸输入也很不稳定,反应迟钝,而且经常不准确。例如,当试图拖放时,系统会经常将我们的动作登记为放大或缩小。集成的点击板按钮虽然响亮,但需要很大的力量才能真正按下。最后,点击板不支持Precision ,这意味着任何微软Precision 的功能都是不可能的。
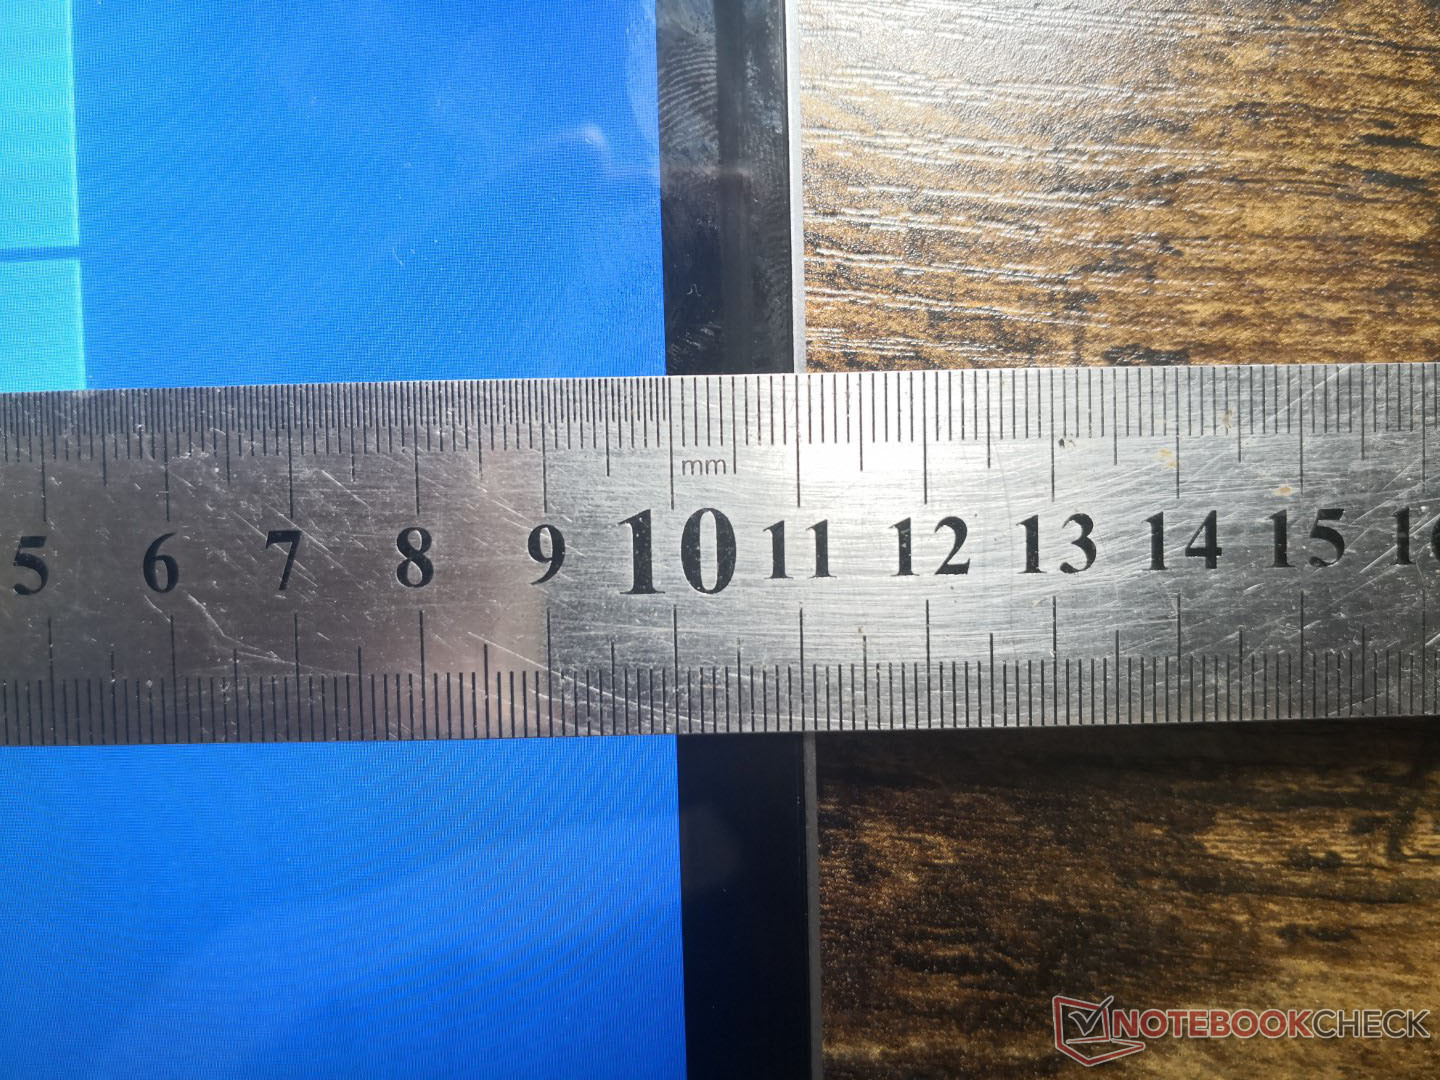
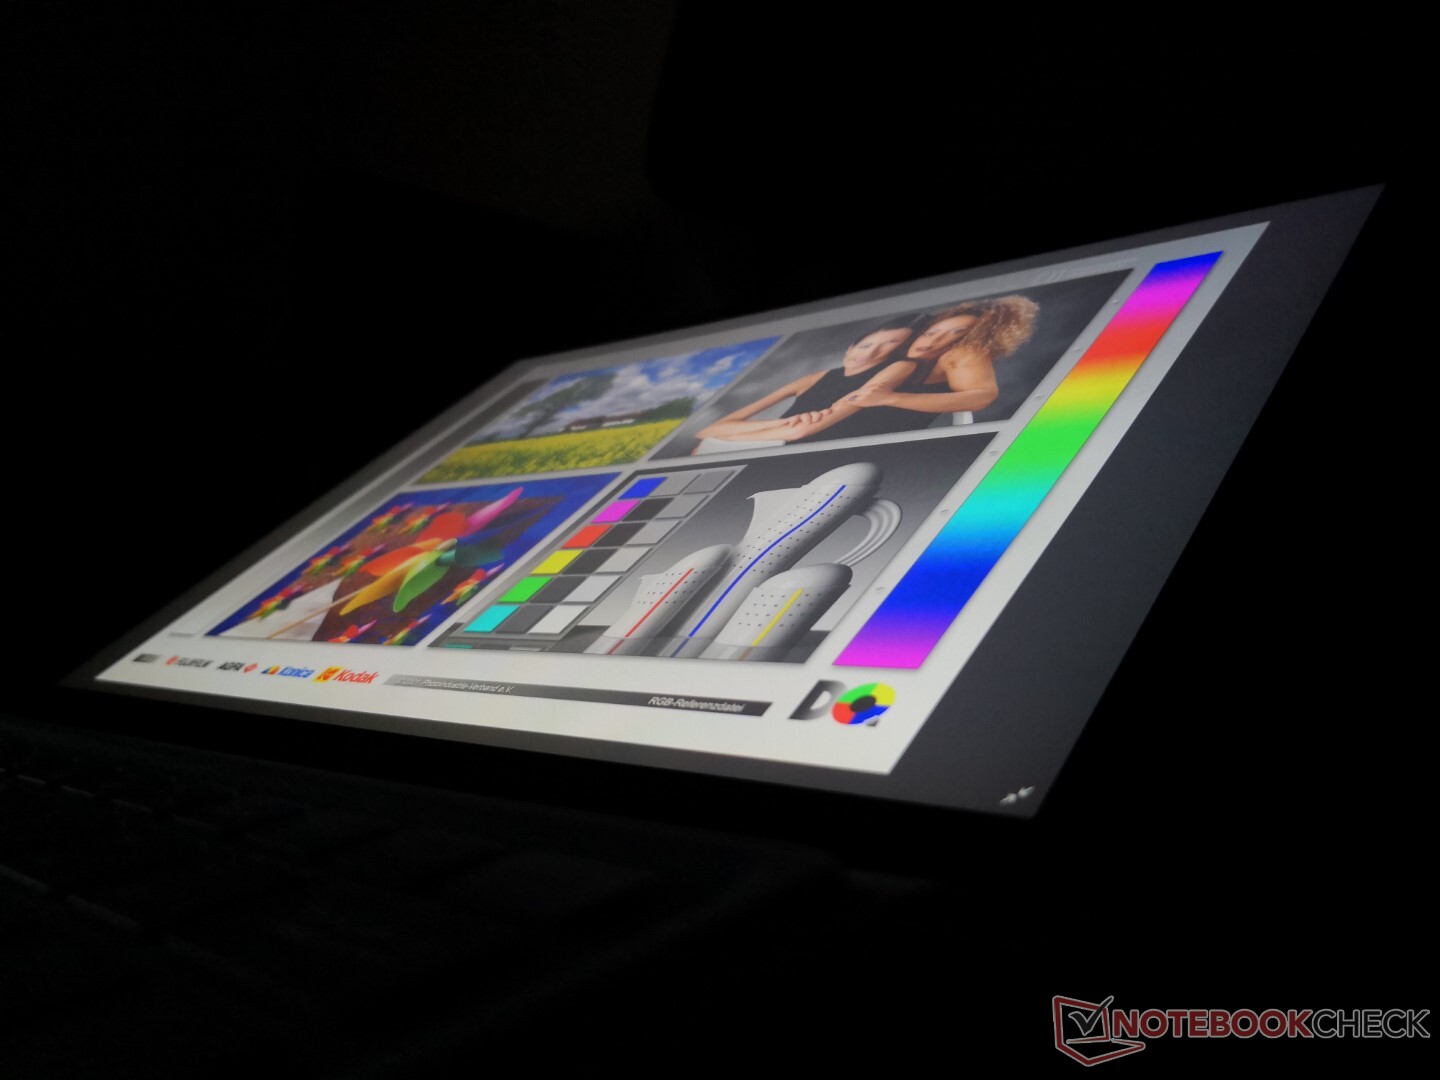
显示
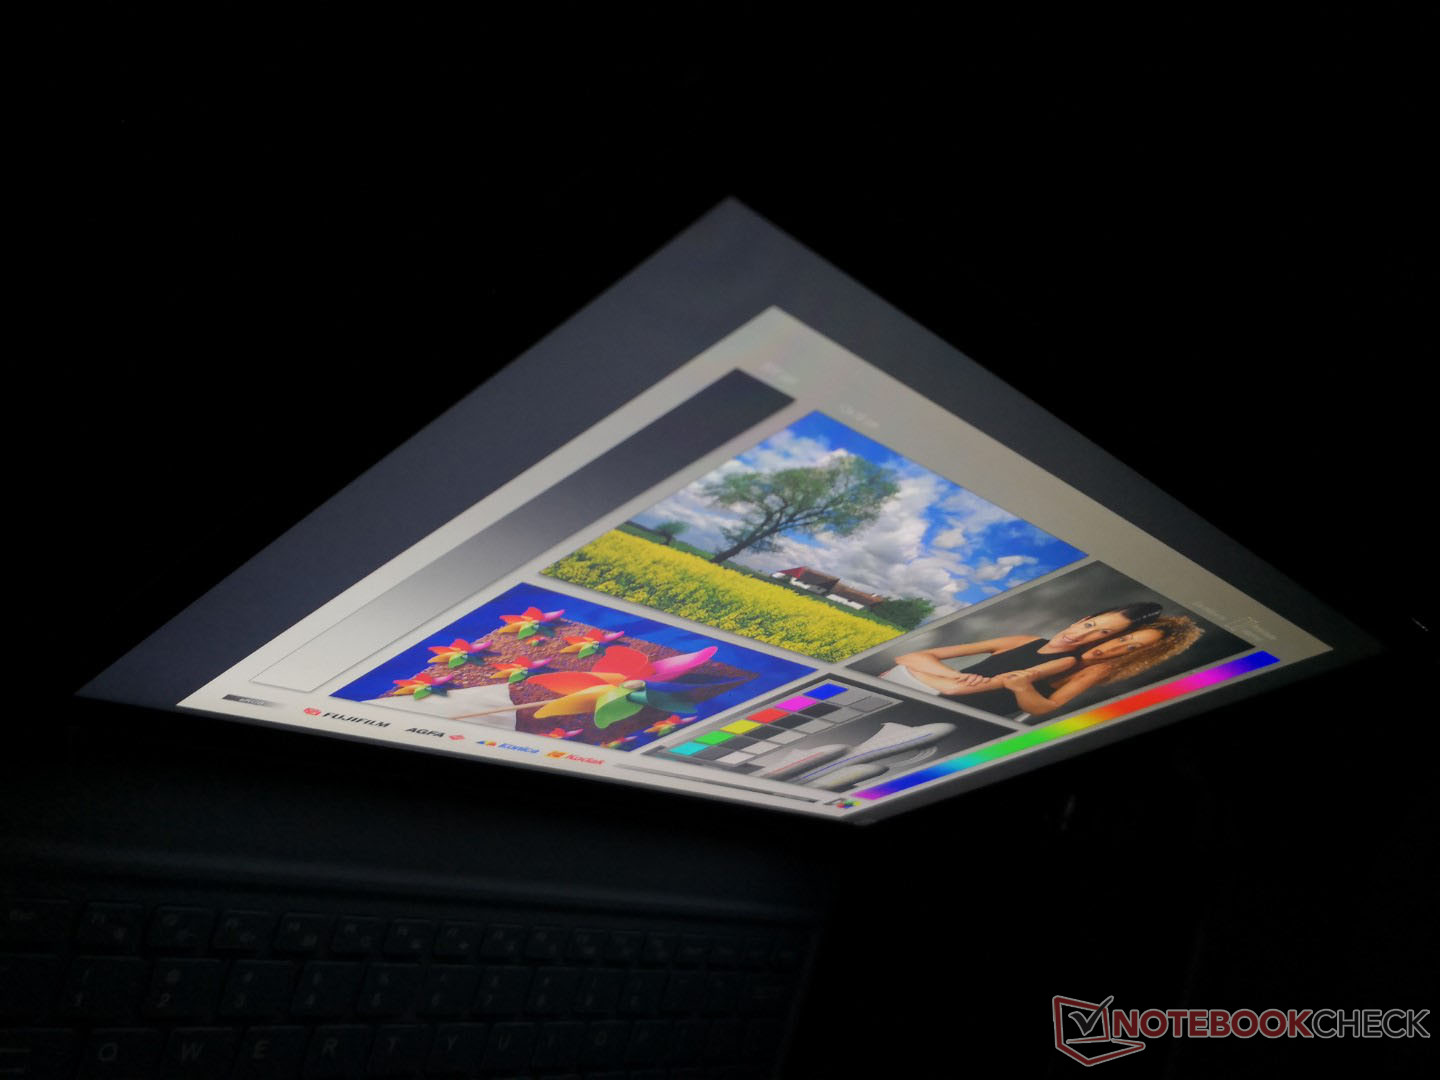
12.6英寸的京东方TV126WTM-NU0 IPS面板是第一个出现在我们数据库中的。某些属性,如 响应时间和色彩覆盖率比Surface Pro略差,幸好在网络浏览时不会有太大影响。其他属性,如对比度和最大亮度是微不足道的,是预算面板的代表。

| |||||||||||||||||||||||||
Brightness Distribution: 87 %
Center on Battery: 269.7 cd/m²
Contrast: 586:1 (Black: 0.46 cd/m²)
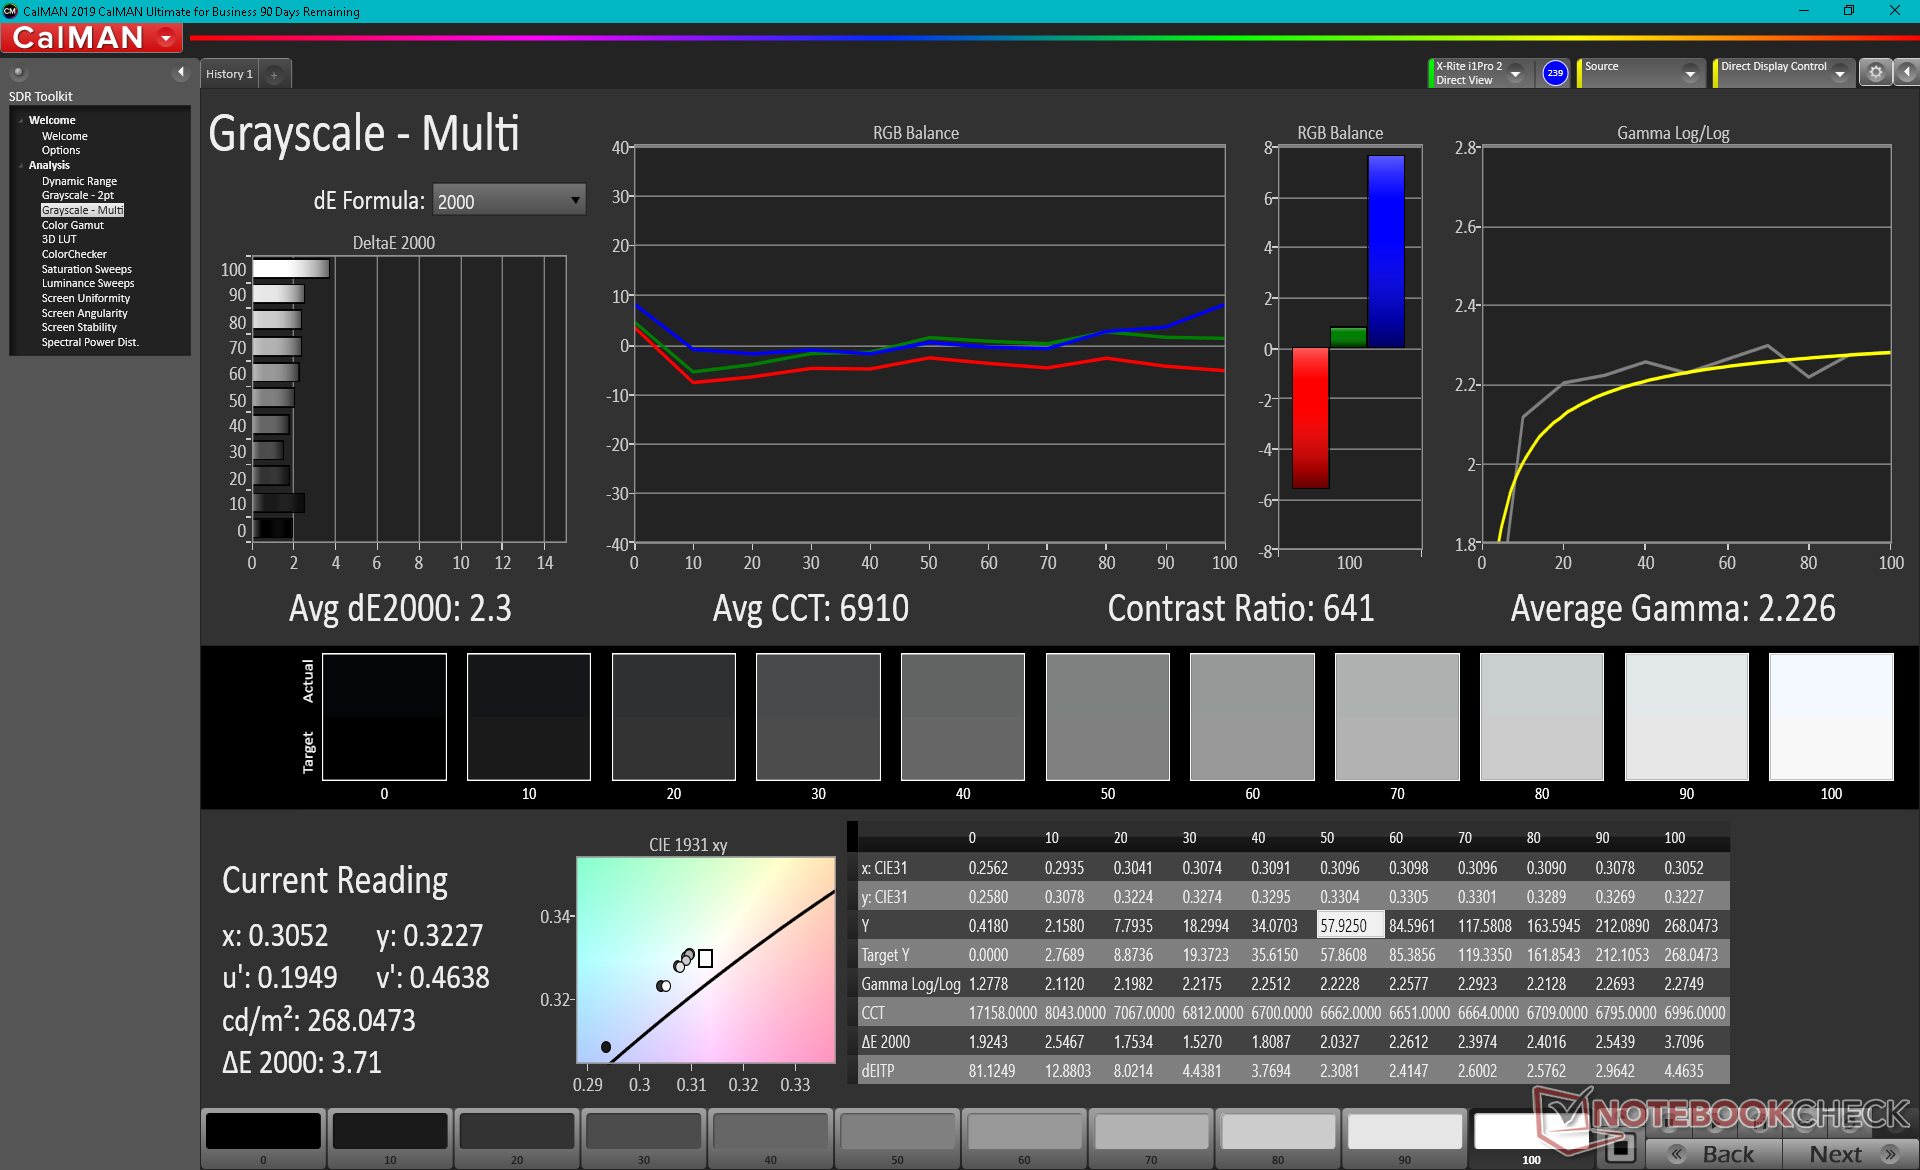
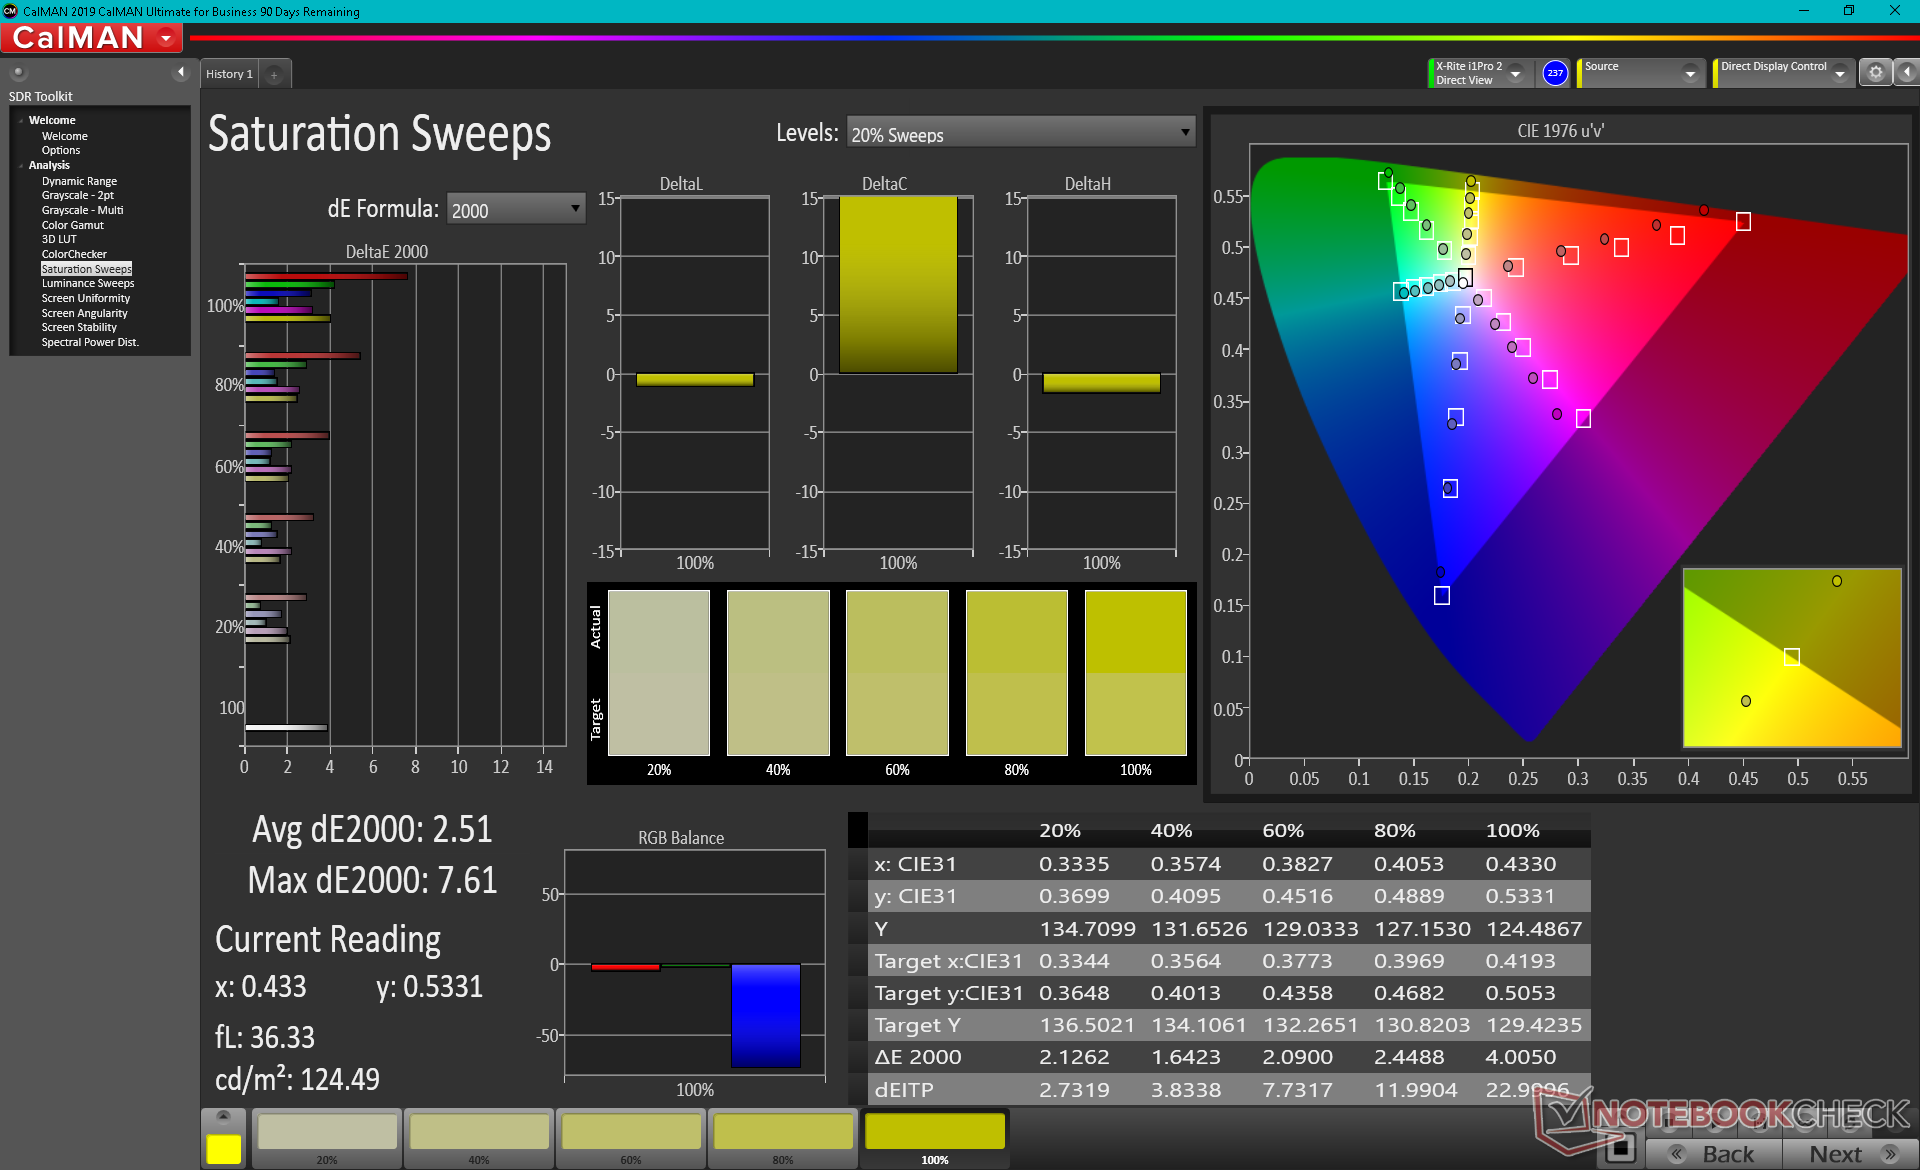
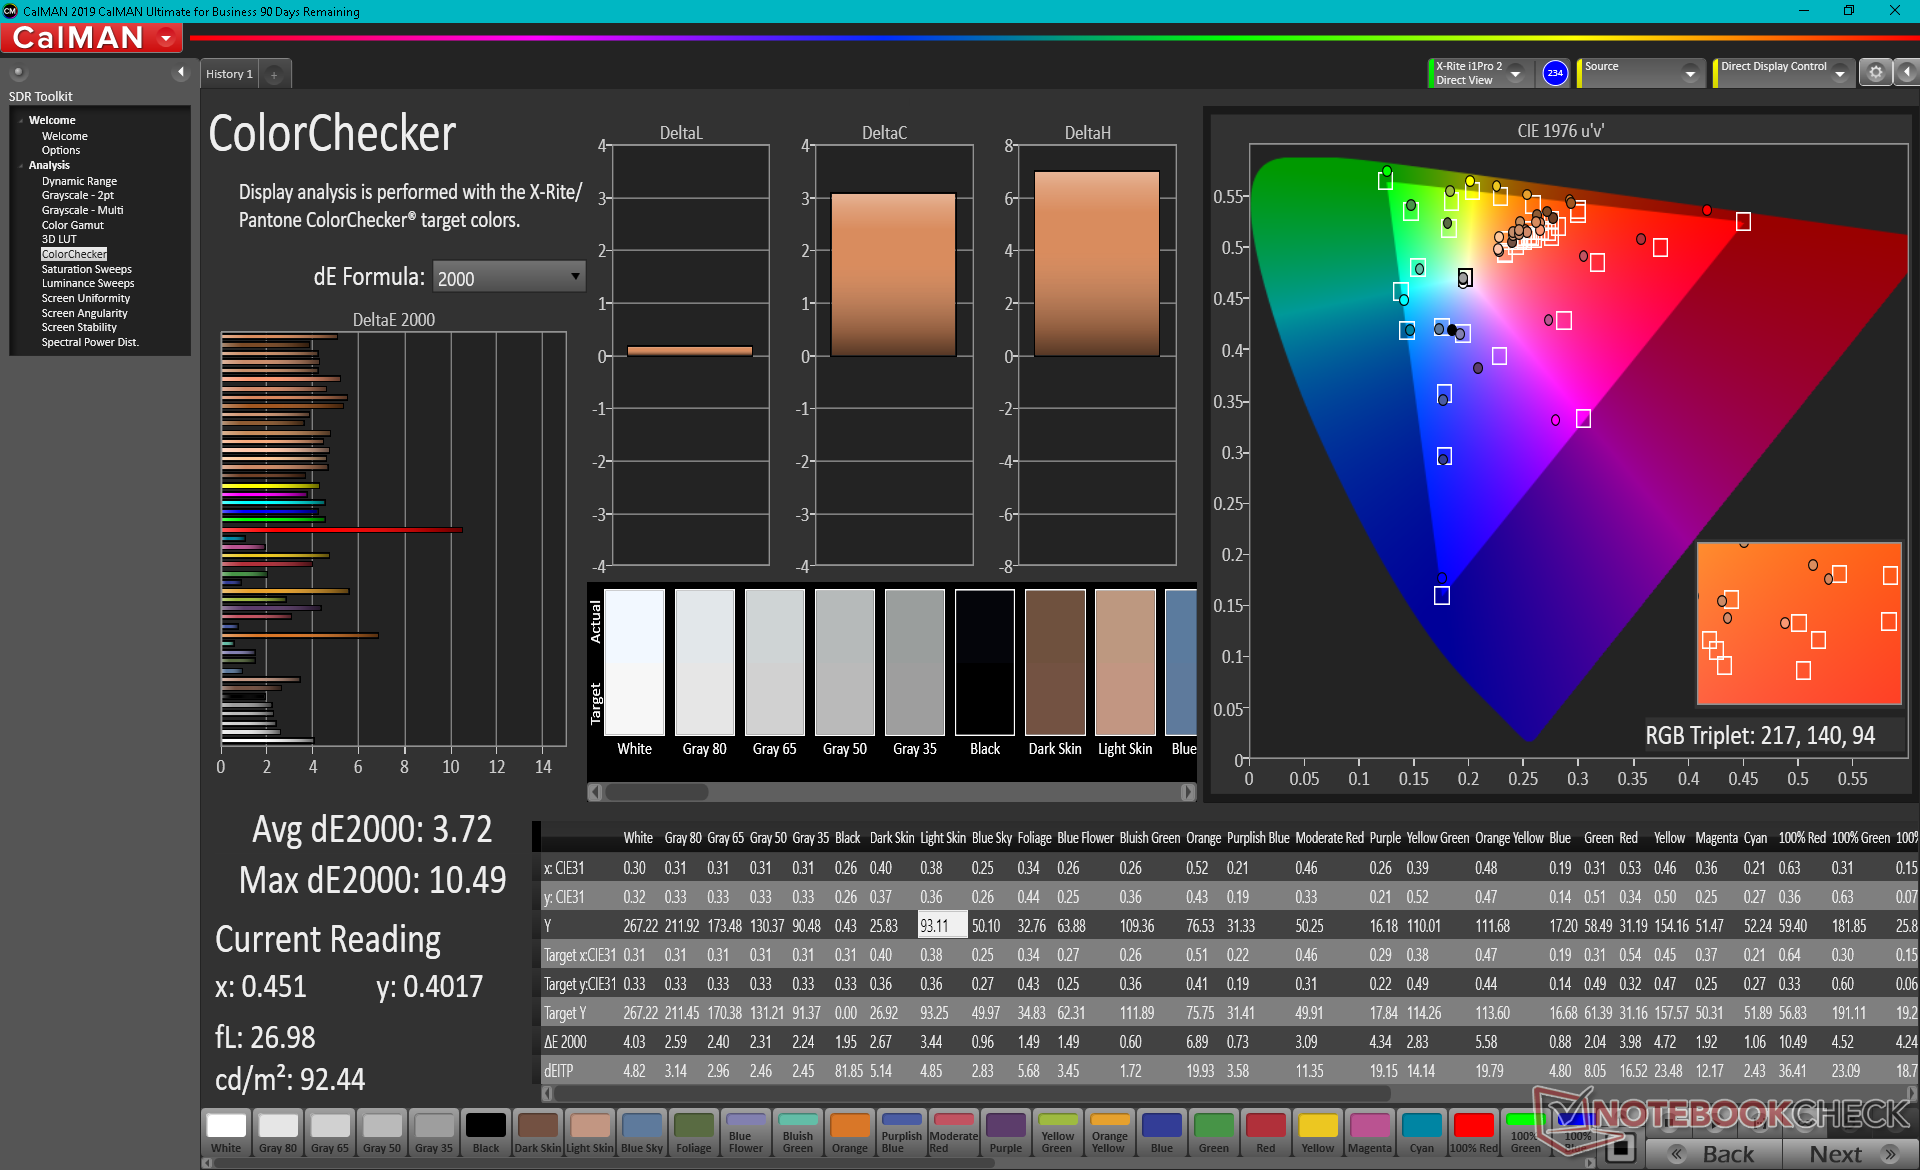
ΔE ColorChecker Calman: 3.72 | ∀{0.5-29.43 Ø4.72}
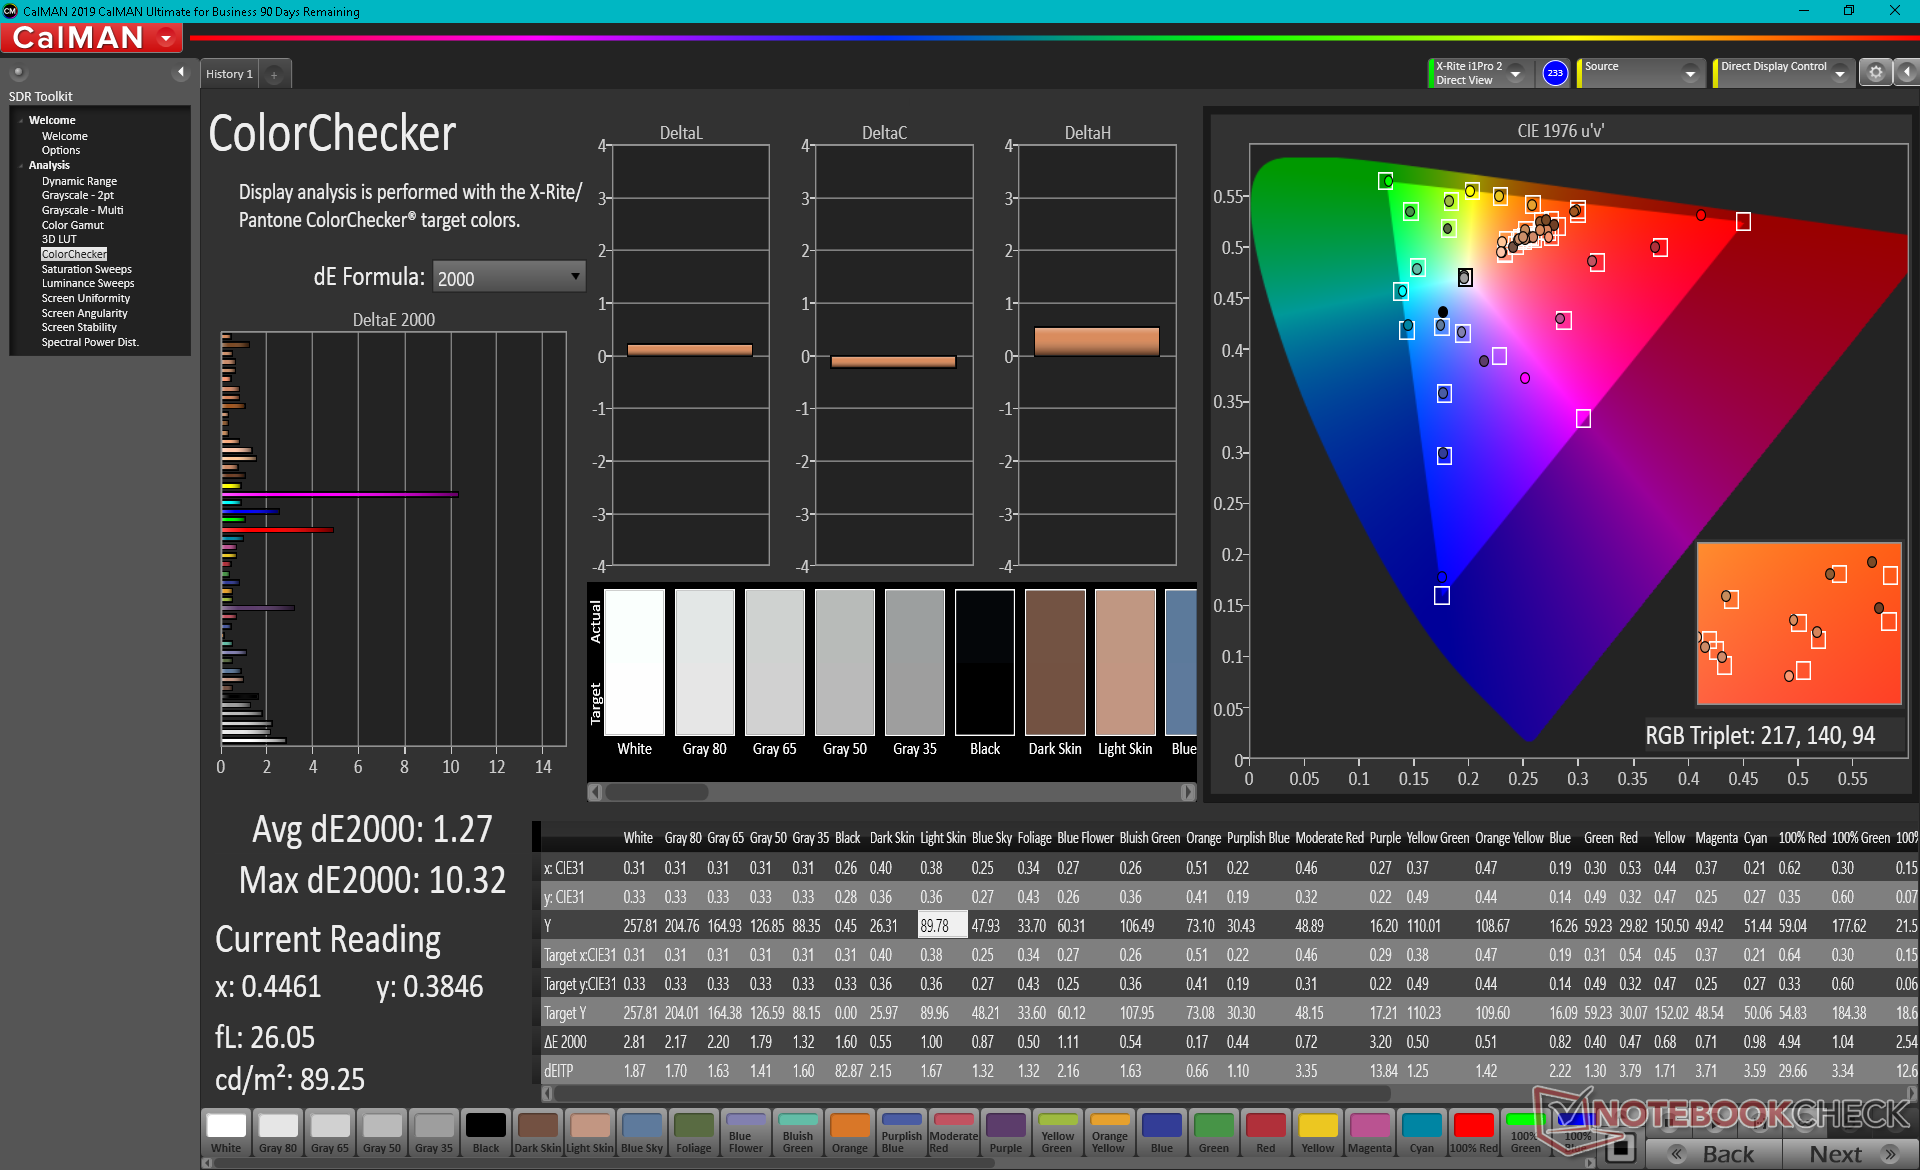
calibrated: 1.27
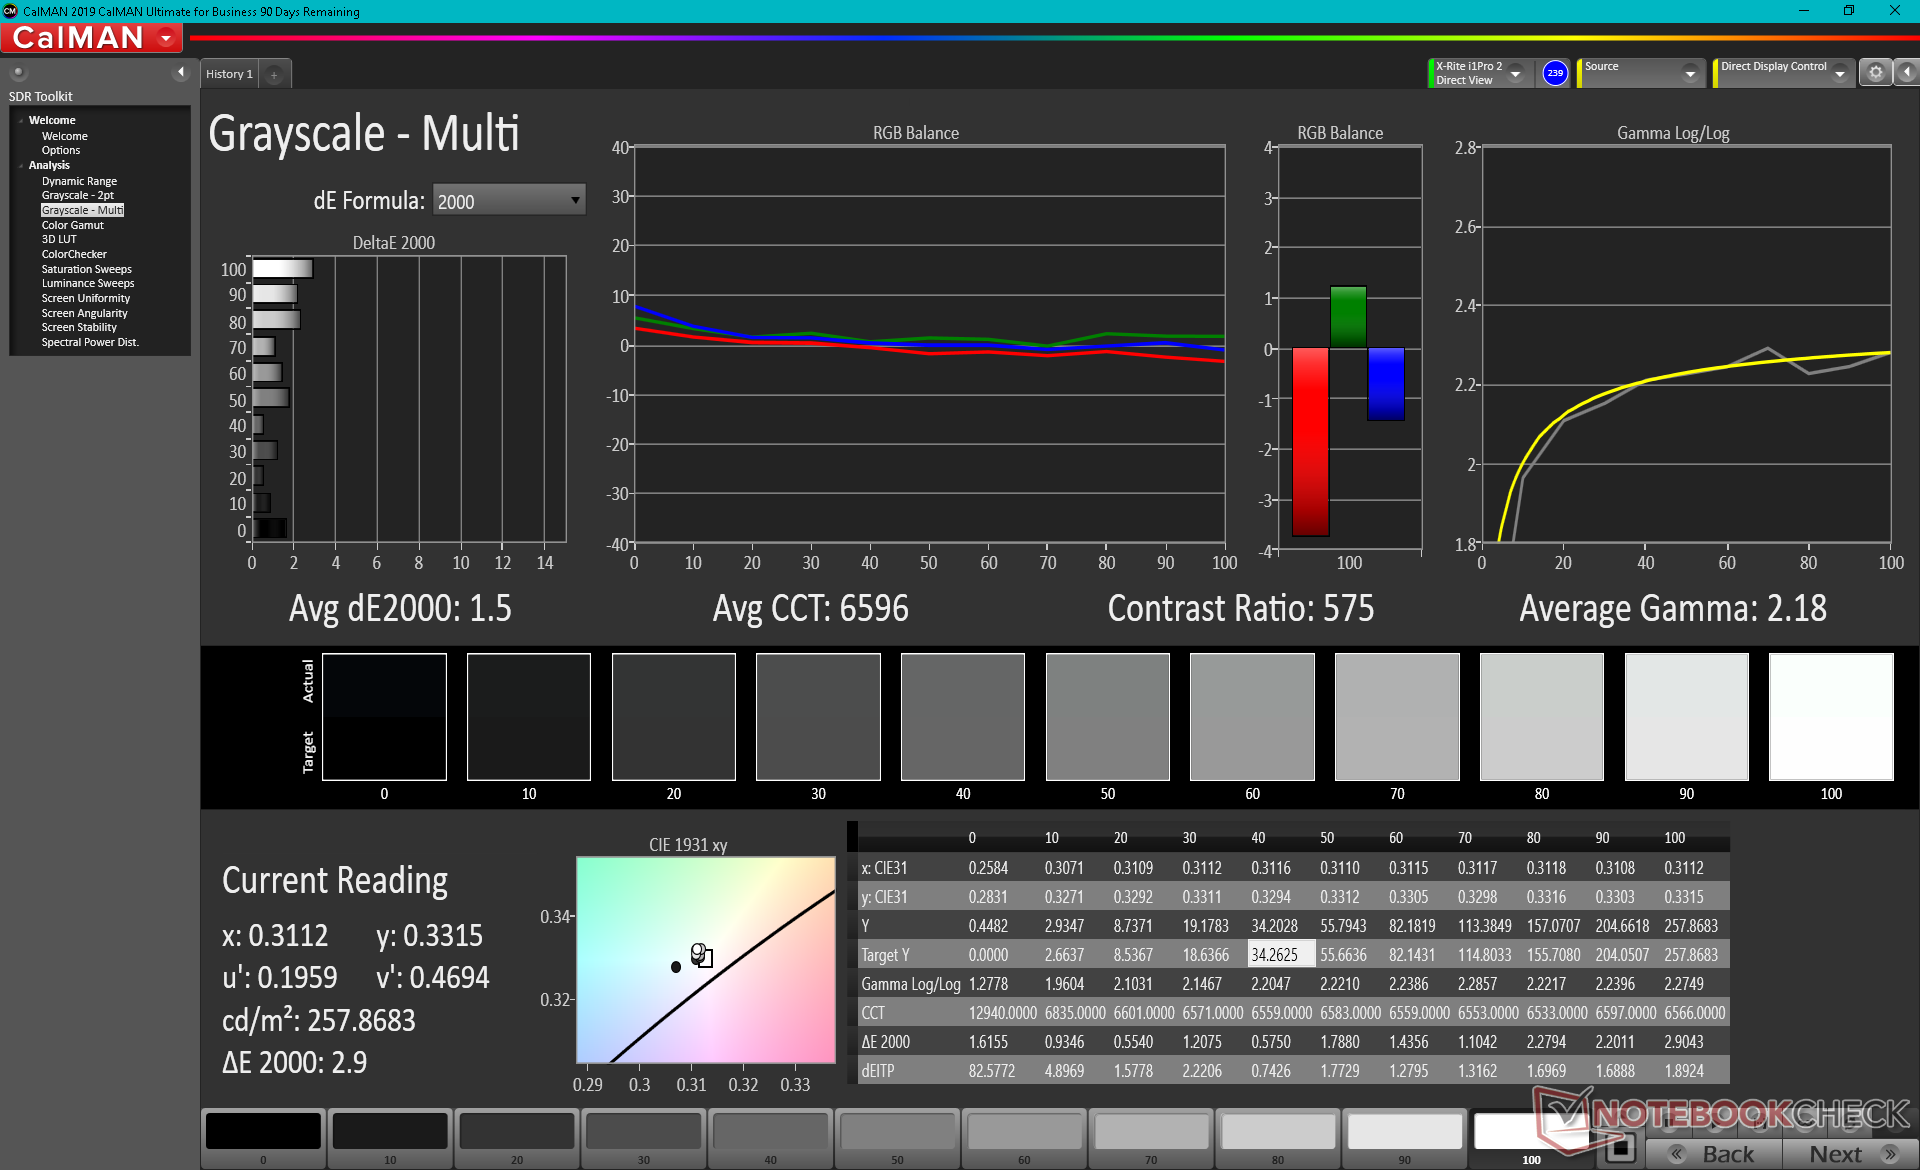
ΔE Greyscale Calman: 2.3 | ∀{0.09-98 Ø4.97}
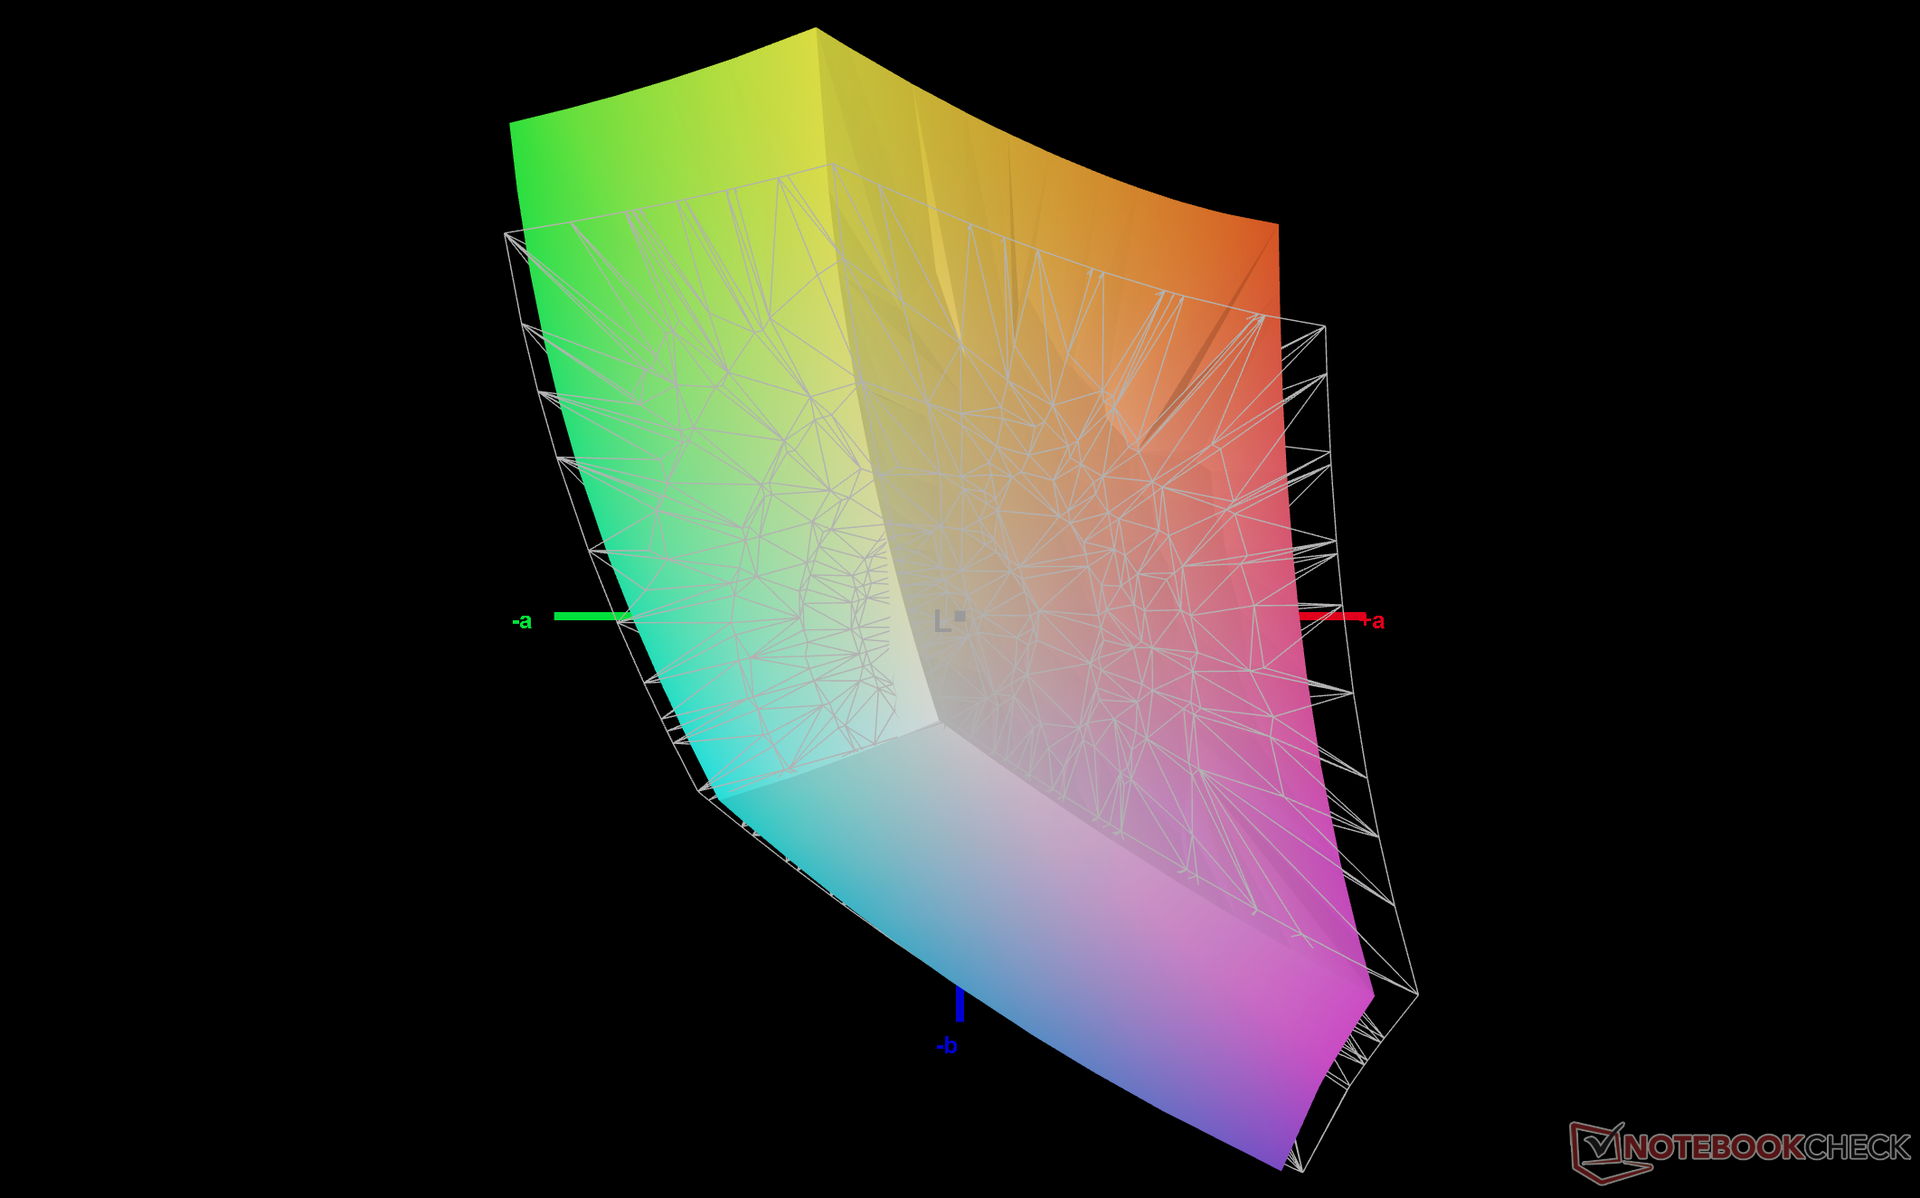
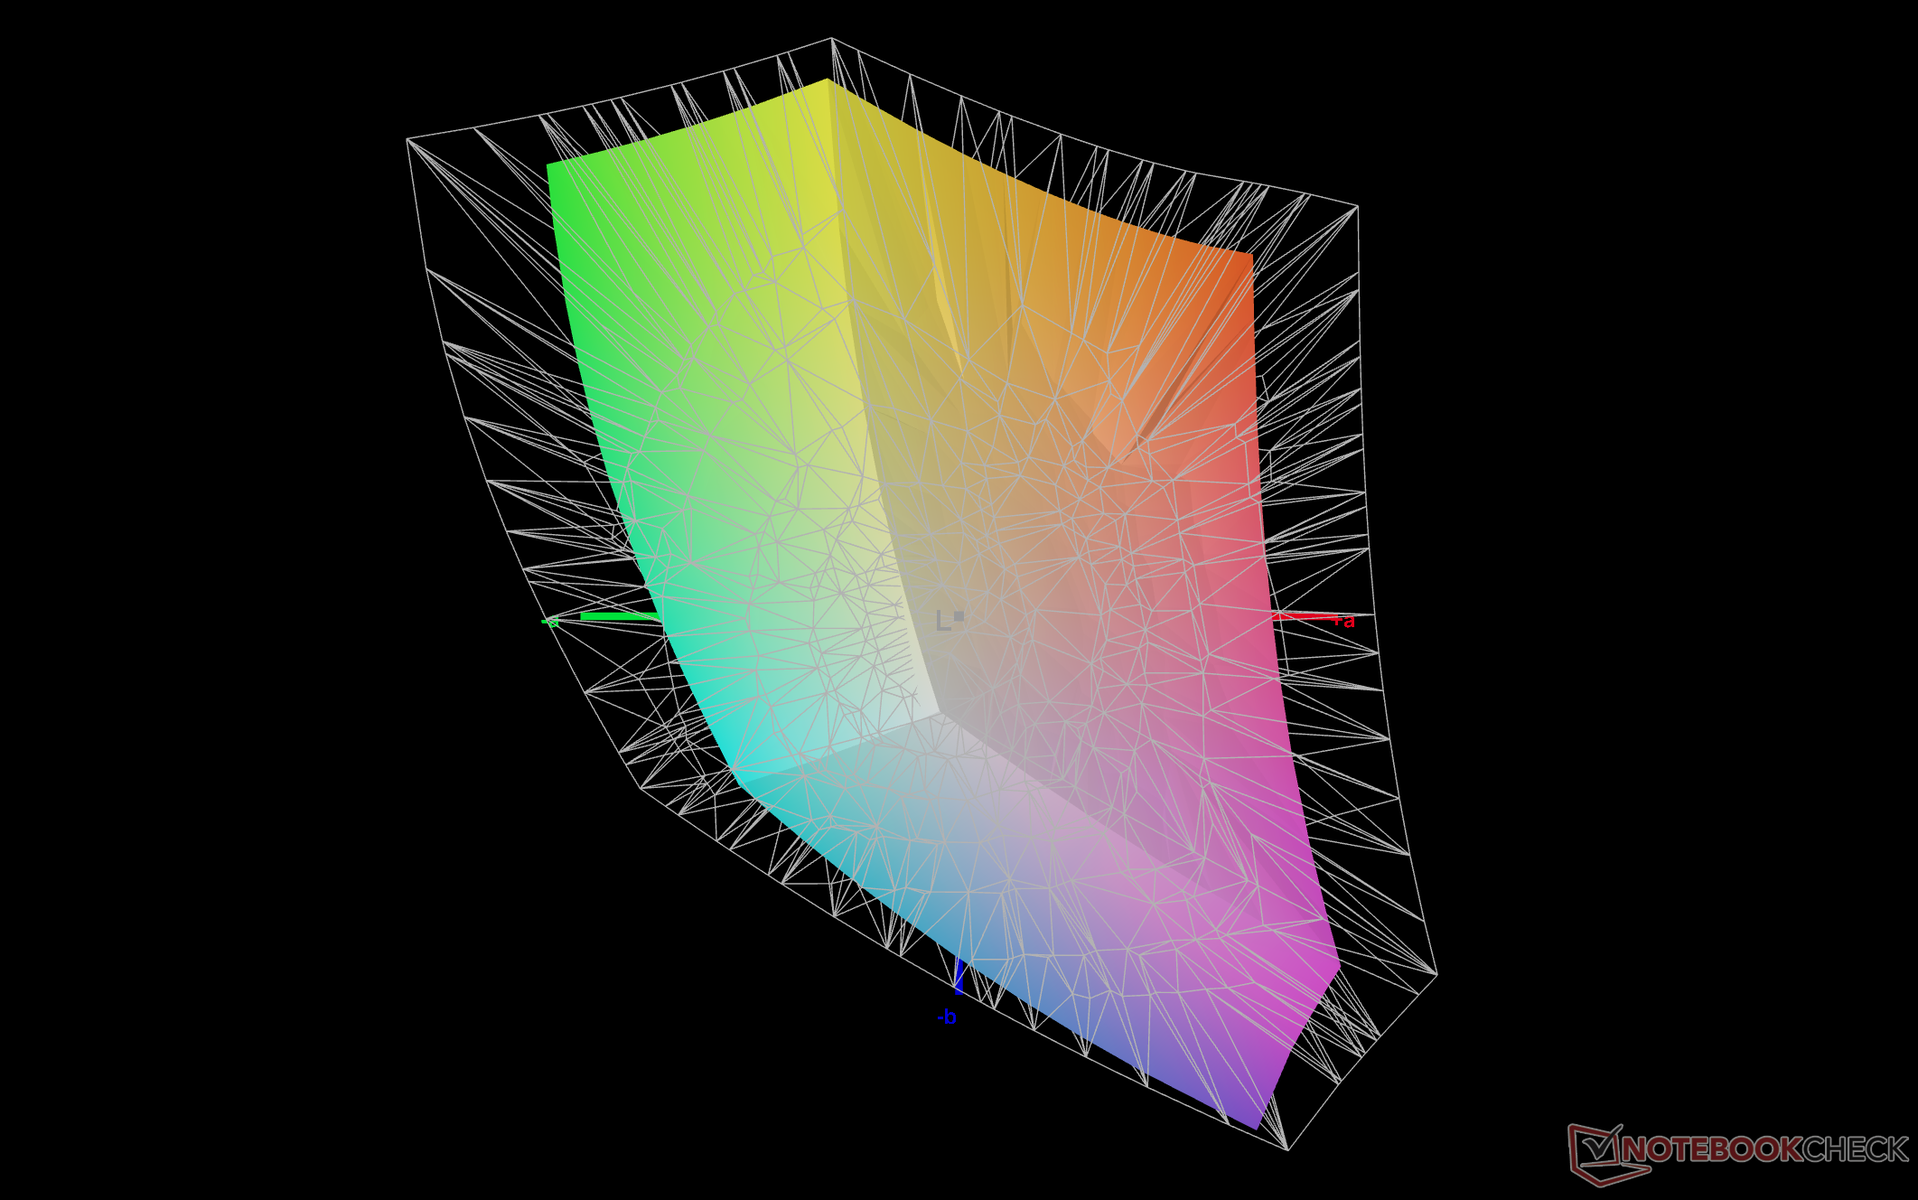
65.3% AdobeRGB 1998 (Argyll 3D)
89.1% sRGB (Argyll 3D)
68.8% Display P3 (Argyll 3D)
Gamma: 2.23
CCT: 6910 K
| Kuu LeBook 12.6 Core i7-8550U BOE TV126WTM-NU0, IPS, 12.6", 2160x1440 | Lenovo ThinkPad X12 20UVS03G00 N123NCA-GS1, a-Si IPS LED, 12.3", 1920x1280 | Microsoft Surface Pro 7 Plus LG Philips LP123WQ332684, IPS, 12.3", 2736x1824 | Dell Latitude 12 7210 2-in-1 Sharp LQ123N1, IPS, 12.3", 1920x1280 | Microsoft Surface Laptop Go Core i5 LG Philips LP125WX112403, IPS, 12.4", 1536x1024 | NuVision Encite Book 12 Plus Sharp SHP142C, IPS, 12.5", 2560x1440 | |
|---|---|---|---|---|---|---|
| Display | 4% | 4% | 4% | 0% | 12% | |
| Display P3 Coverage (%) | 68.8 | 67 -3% | 66.9 -3% | 67.9 -1% | 64.4 -6% | 74.8 9% |
| sRGB Coverage (%) | 89.1 | 99.2 11% | 96.7 9% | 96.8 9% | 94.6 6% | 98.9 11% |
| AdobeRGB 1998 Coverage (%) | 65.3 | 68.8 5% | 69.1 6% | 68.8 5% | 65.7 1% | 75.6 16% |
| Response Times | -29% | -11% | 42% | 15% | 8% | |
| Response Time Grey 50% / Grey 80% * (ms) | 42 ? | 63.2 ? -50% | 50.8 ? -21% | 29 ? 31% | 34.8 ? 17% | 37.6 ? 10% |
| Response Time Black / White * (ms) | 33.2 ? | 36 ? -8% | 33.6 ? -1% | 16 ? 52% | 29.2 ? 12% | 31.6 ? 5% |
| PWM Frequency (Hz) | 199.2 ? | 1250 ? | 21930 ? | 198.4 ? | ||
| Screen | 70% | 45% | 38% | 44% | 4% | |
| Brightness middle (cd/m²) | 269.7 | 419 55% | 408 51% | 380 41% | 354.3 31% | 431.5 60% |
| Brightness (cd/m²) | 256 | 406 59% | 425 66% | 378 48% | 353 38% | 406 59% |
| Brightness Distribution (%) | 87 | 94 8% | 85 -2% | 86 -1% | 95 9% | 80 -8% |
| Black Level * (cd/m²) | 0.46 | 0.23 50% | 0.34 26% | 0.31 33% | 0.29 37% | 0.43 7% |
| Contrast (:1) | 586 | 1822 211% | 1200 105% | 1226 109% | 1222 109% | 1003 71% |
| Colorchecker dE 2000 * | 3.72 | 1.1 70% | 1.5 60% | 2.28 39% | 1.41 62% | 3.56 4% |
| Colorchecker dE 2000 max. * | 10.49 | 2.2 79% | 2.5 76% | 3.93 63% | 2.96 72% | 7 33% |
| Colorchecker dE 2000 calibrated * | 1.27 | 0.5 61% | 1.4 -10% | 0.97 24% | 1.44 -13% | 3.34 -163% |
| Greyscale dE 2000 * | 2.3 | 1.5 35% | 1.6 30% | 2.56 -11% | 1.2 48% | 2.9 -26% |
| Gamma | 2.23 99% | 2.06 107% | 2.05 107% | 2.32 95% | 2.26 97% | 2.2 100% |
| CCT | 6910 94% | 6524 100% | 6432 101% | 6130 106% | 6600 98% | 6572 99% |
| Color Space (Percent of AdobeRGB 1998) (%) | 62.8 | 63.7 | 63 | 60.2 | 66.7 | |
| Color Space (Percent of sRGB) (%) | 99.2 | 96.8 | 97 | 94.4 | 98.9 | |
| Total Average (Program / Settings) | 15% /
42% | 13% /
28% | 28% /
32% | 20% /
30% | 8% /
6% |
* ... smaller is better
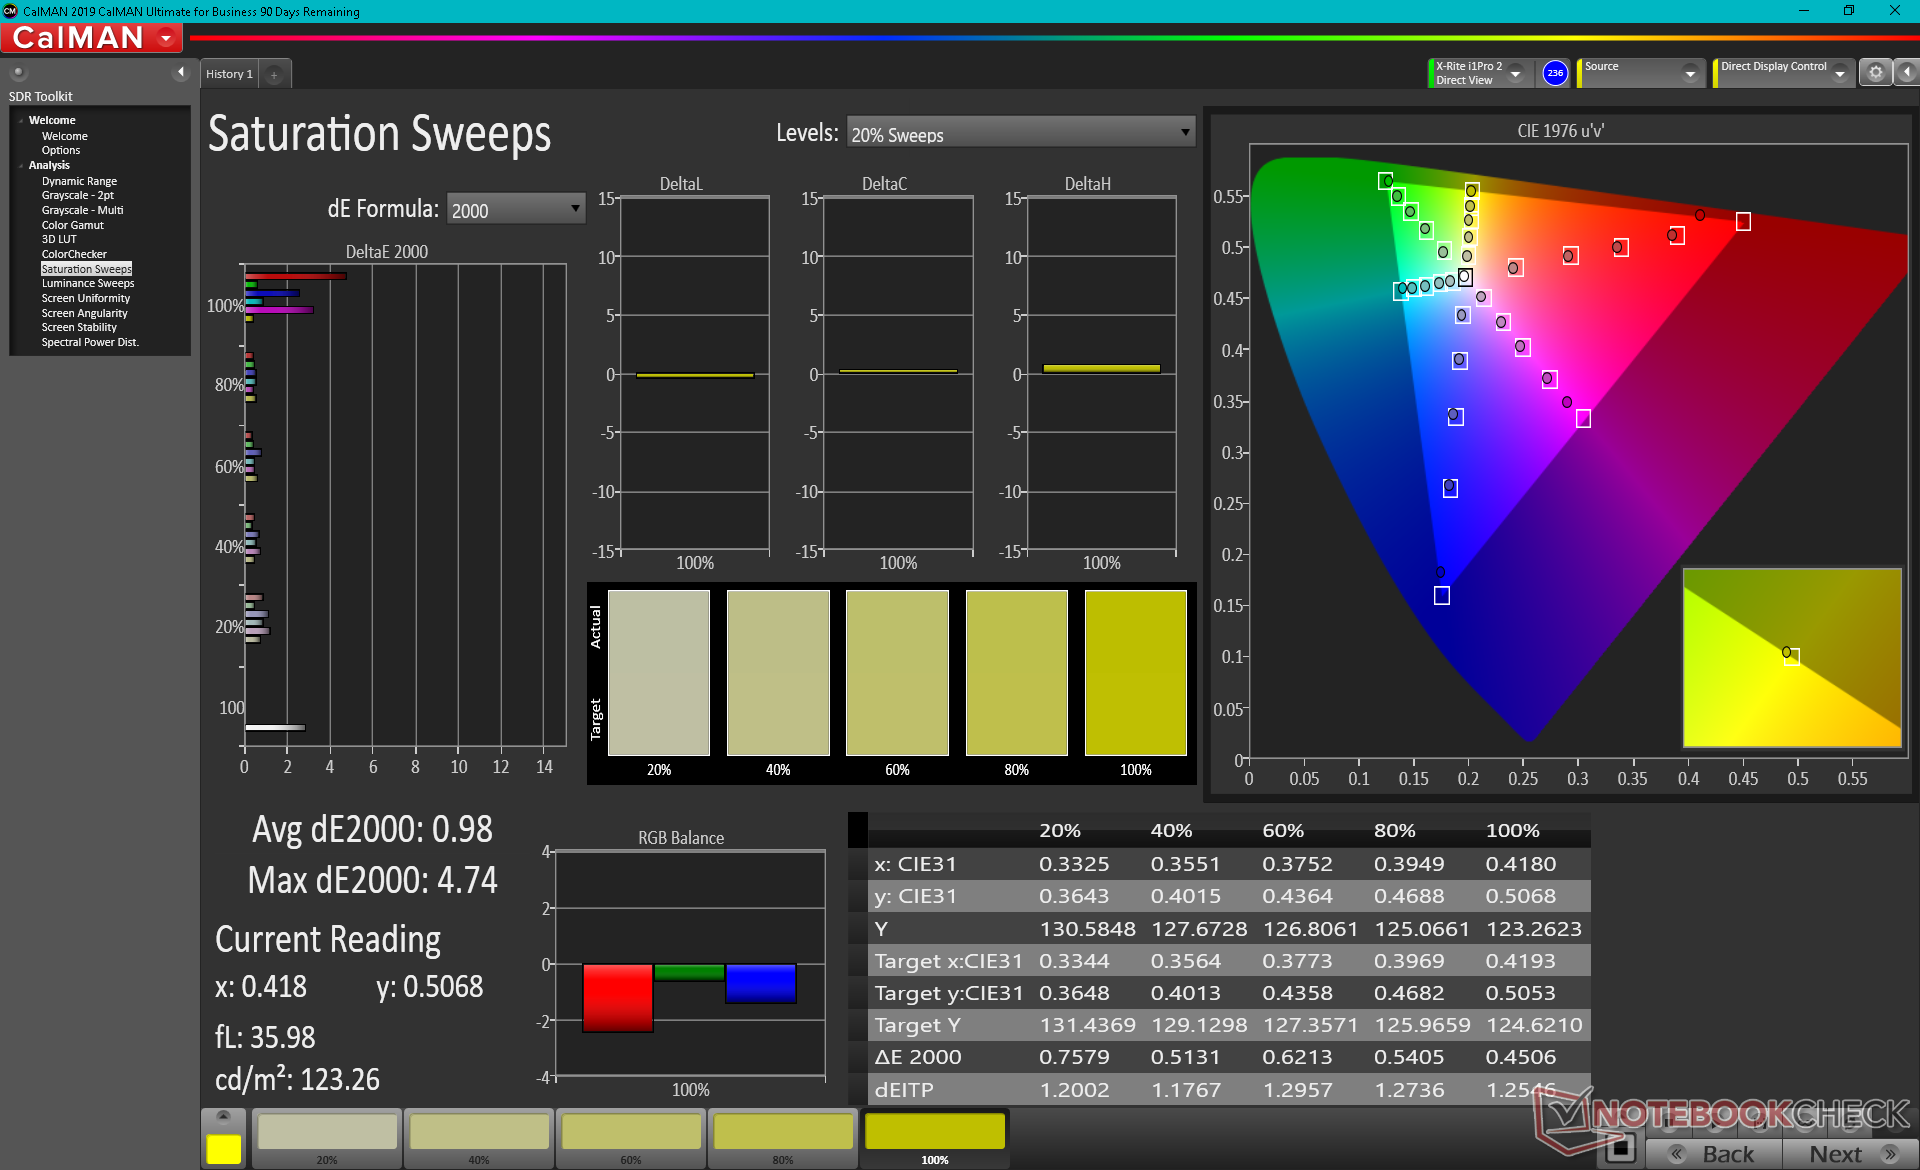
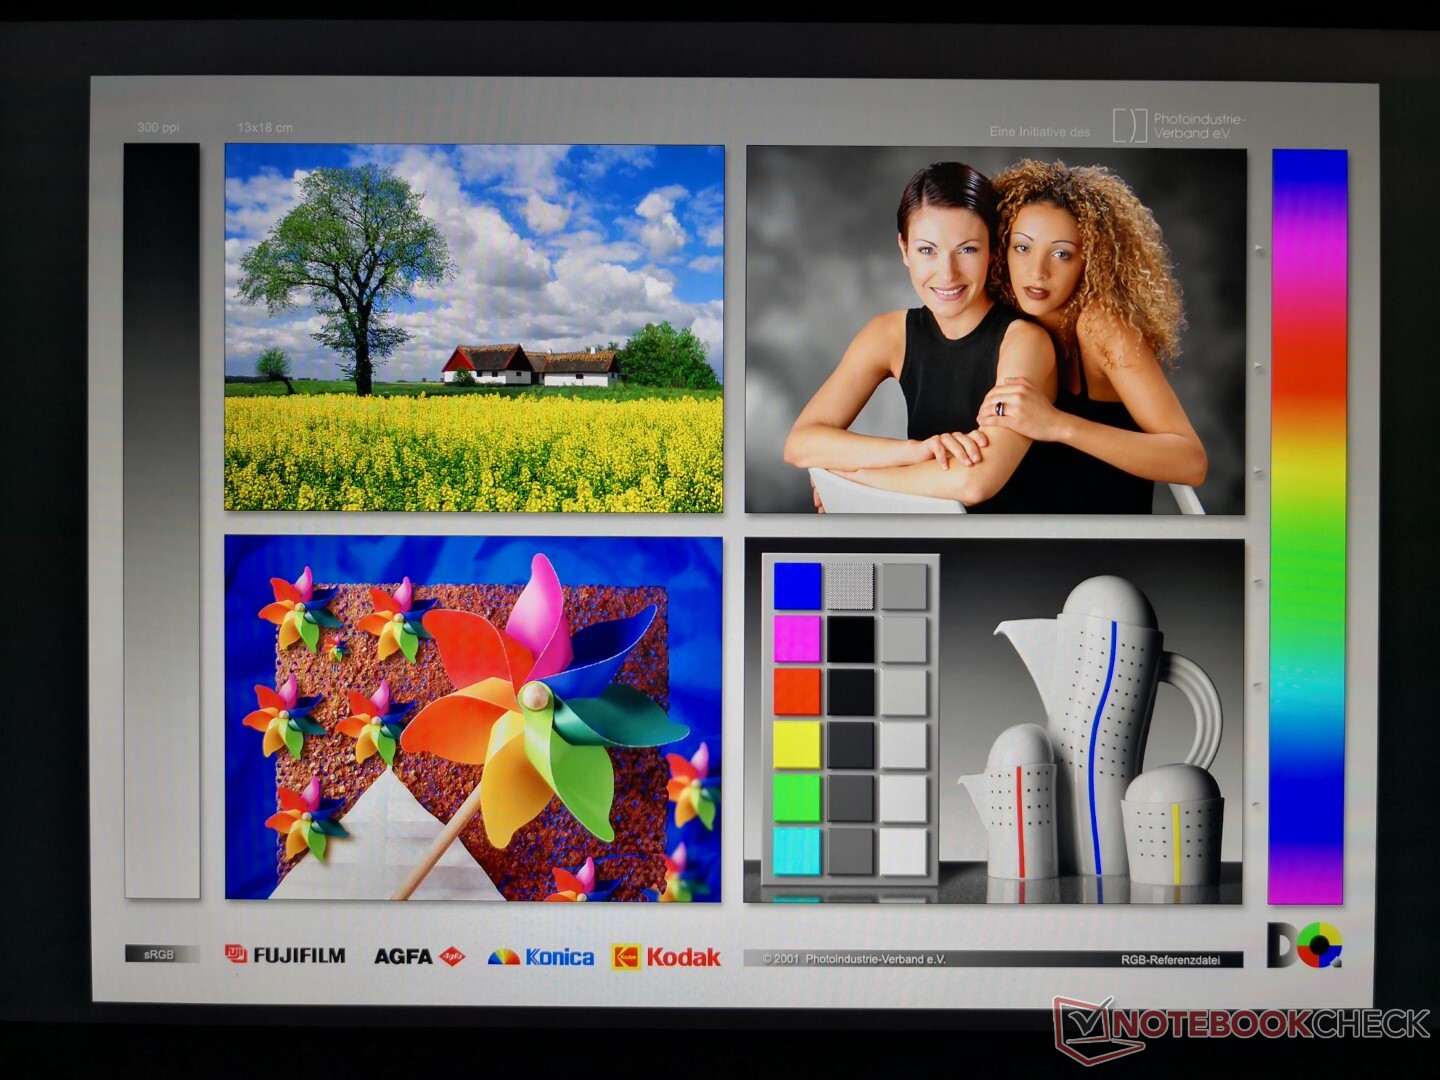
色彩空间很宽,约为sRGB的89%,而价格较高的超极本和平板电脑的色彩空间则超过95%。色彩再现大致与Surface Laptop Go的显示屏相当。 笔记本电脑.
尽管起步价很便宜,但显示屏开箱后的校准效果还不错。色温略微过冷,但校准后就能解决这个问题,没有任何问题。最终的平均灰度和ColorChecker deltaE值分别只有1.5和1.27,比我们最初的预期要好。然而,品红色的阴影可能比其他颜色更不准确。
Display Response Times
| ↔ Response Time Black to White | ||
|---|---|---|
| 33.2 ms ... rise ↗ and fall ↘ combined | ↗ 19.2 ms rise | 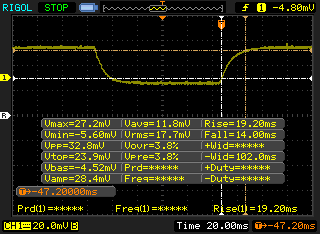 |
| ↘ 14 ms fall | ||
| The screen shows slow response rates in our tests and will be unsatisfactory for gamers. In comparison, all tested devices range from 0.1 (minimum) to 240 (maximum) ms. » 90 % of all devices are better. This means that the measured response time is worse than the average of all tested devices (19.8 ms). | ||
| ↔ Response Time 50% Grey to 80% Grey | ||
| 42 ms ... rise ↗ and fall ↘ combined | ↗ 22.4 ms rise | 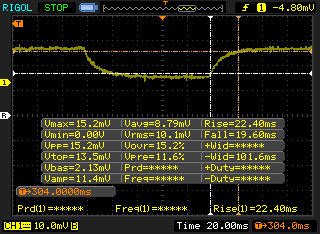 |
| ↘ 19.6 ms fall | ||
| The screen shows slow response rates in our tests and will be unsatisfactory for gamers. In comparison, all tested devices range from 0.165 (minimum) to 636 (maximum) ms. » 67 % of all devices are better. This means that the measured response time is worse than the average of all tested devices (31 ms). | ||
Screen Flickering / PWM (Pulse-Width Modulation)
| Screen flickering / PWM not detected | 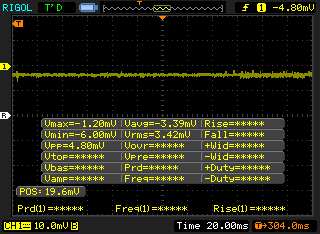 | ||
In comparison: 52 % of all tested devices do not use PWM to dim the display. If PWM was detected, an average of 7775 (minimum: 5 - maximum: 343500) Hz was measured. | |||
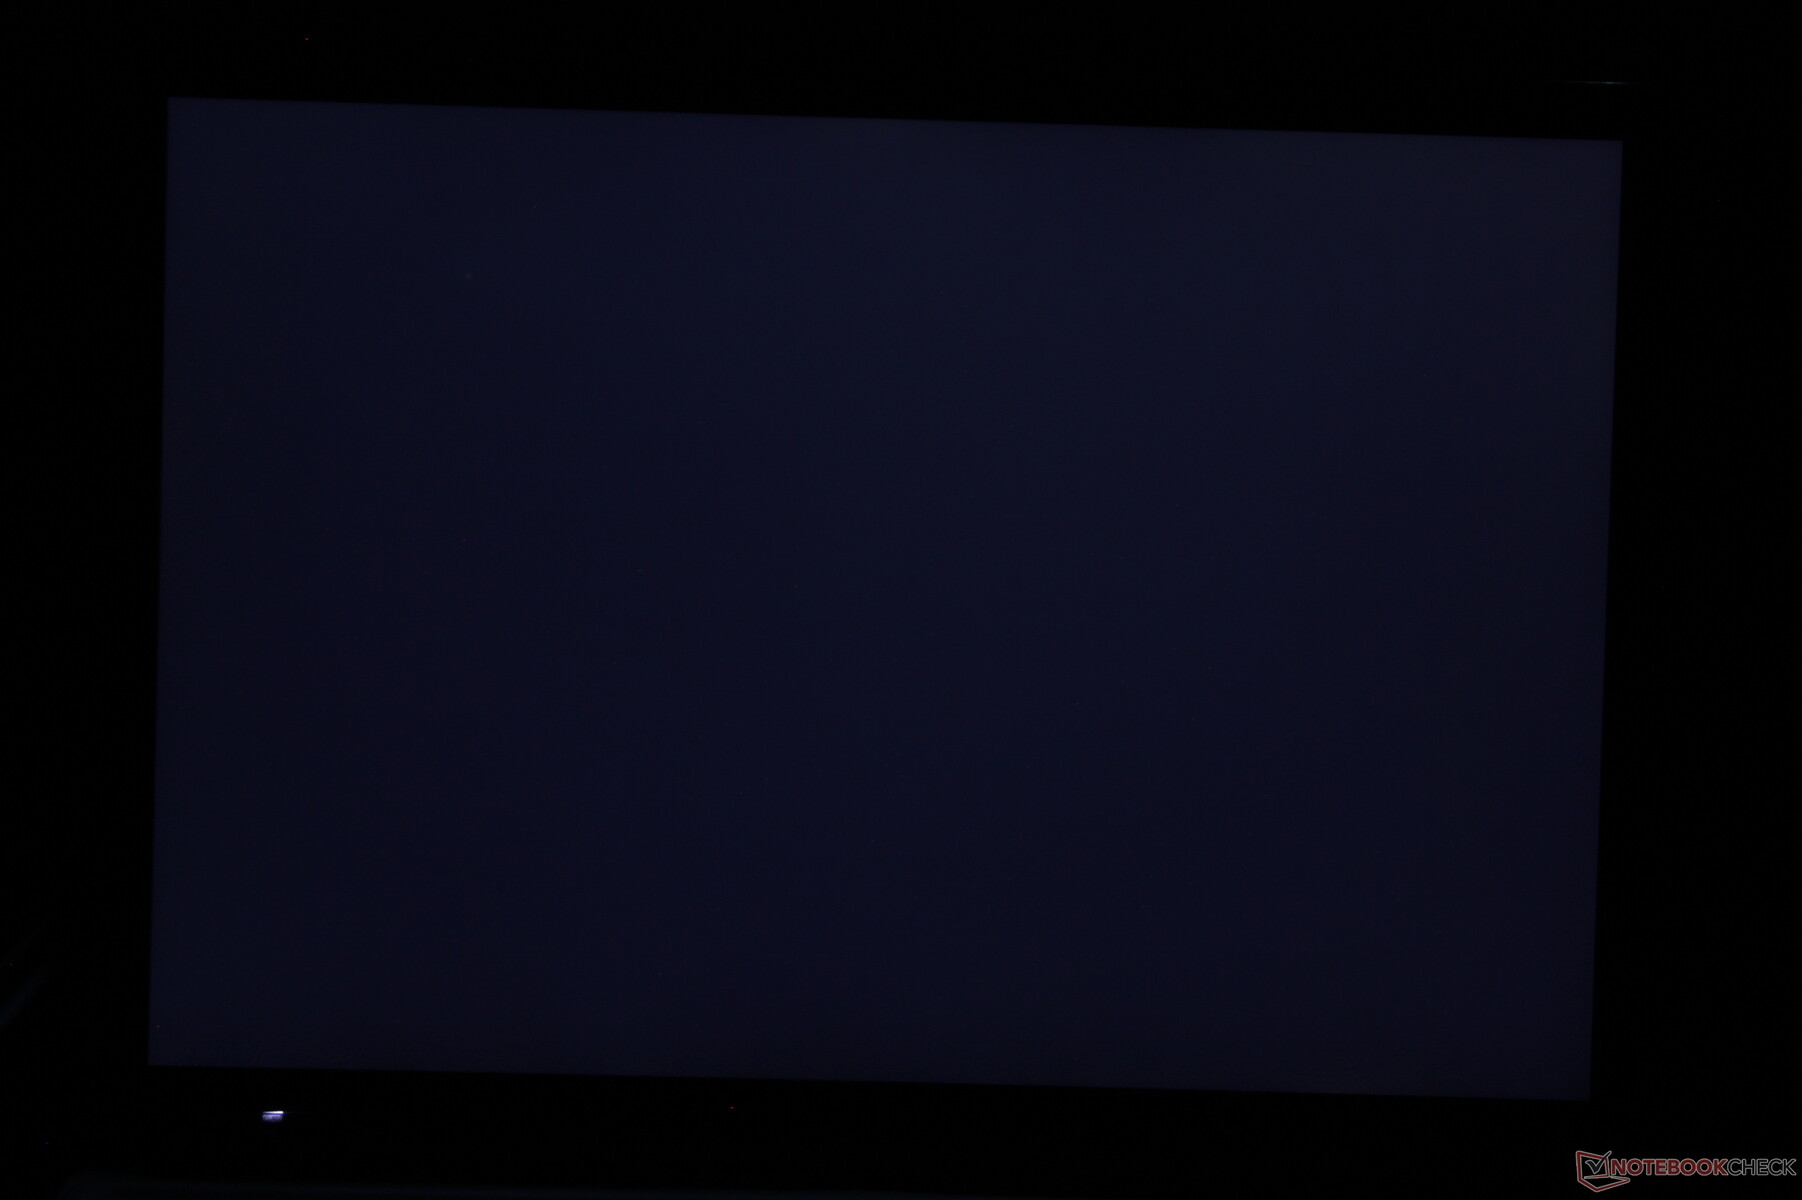
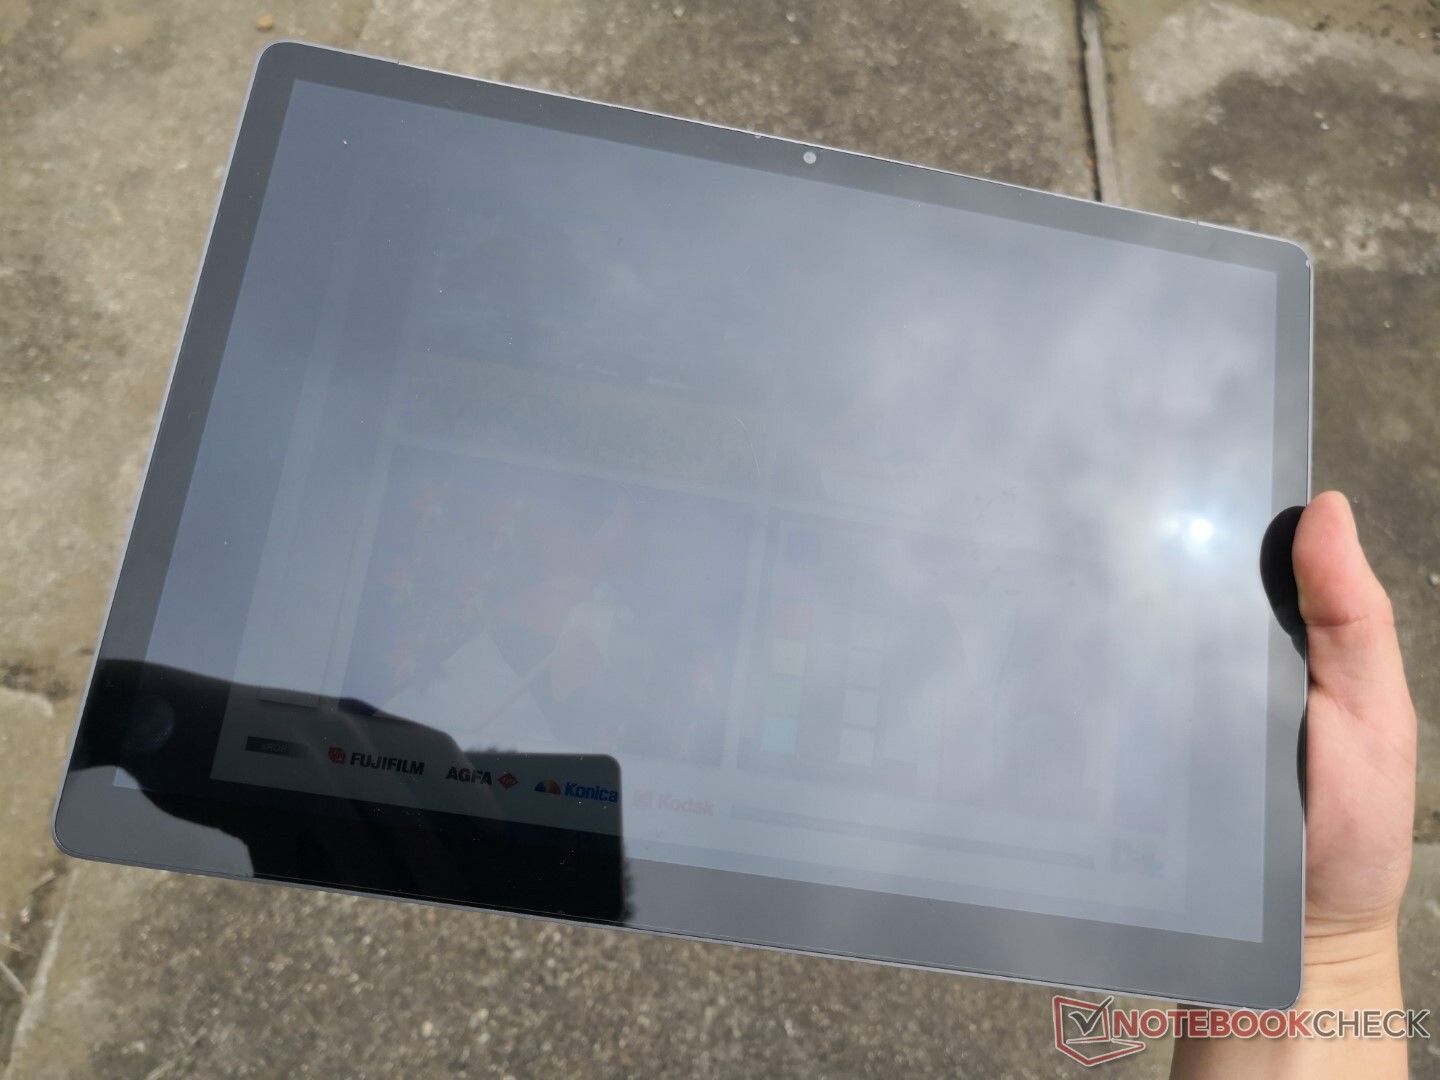
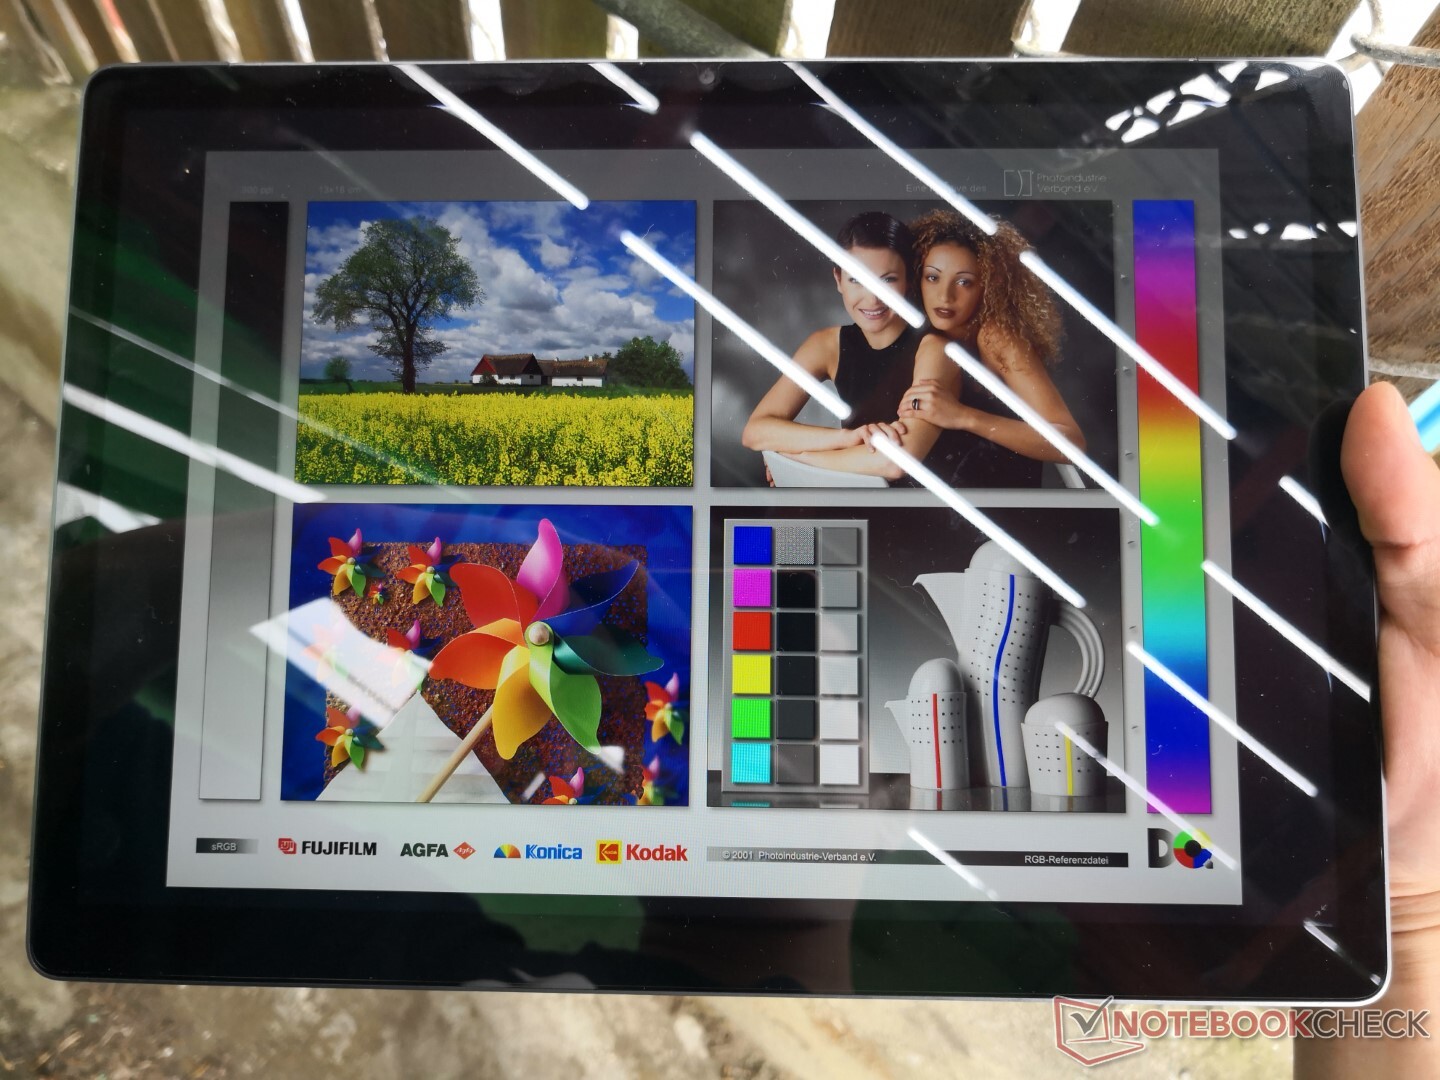
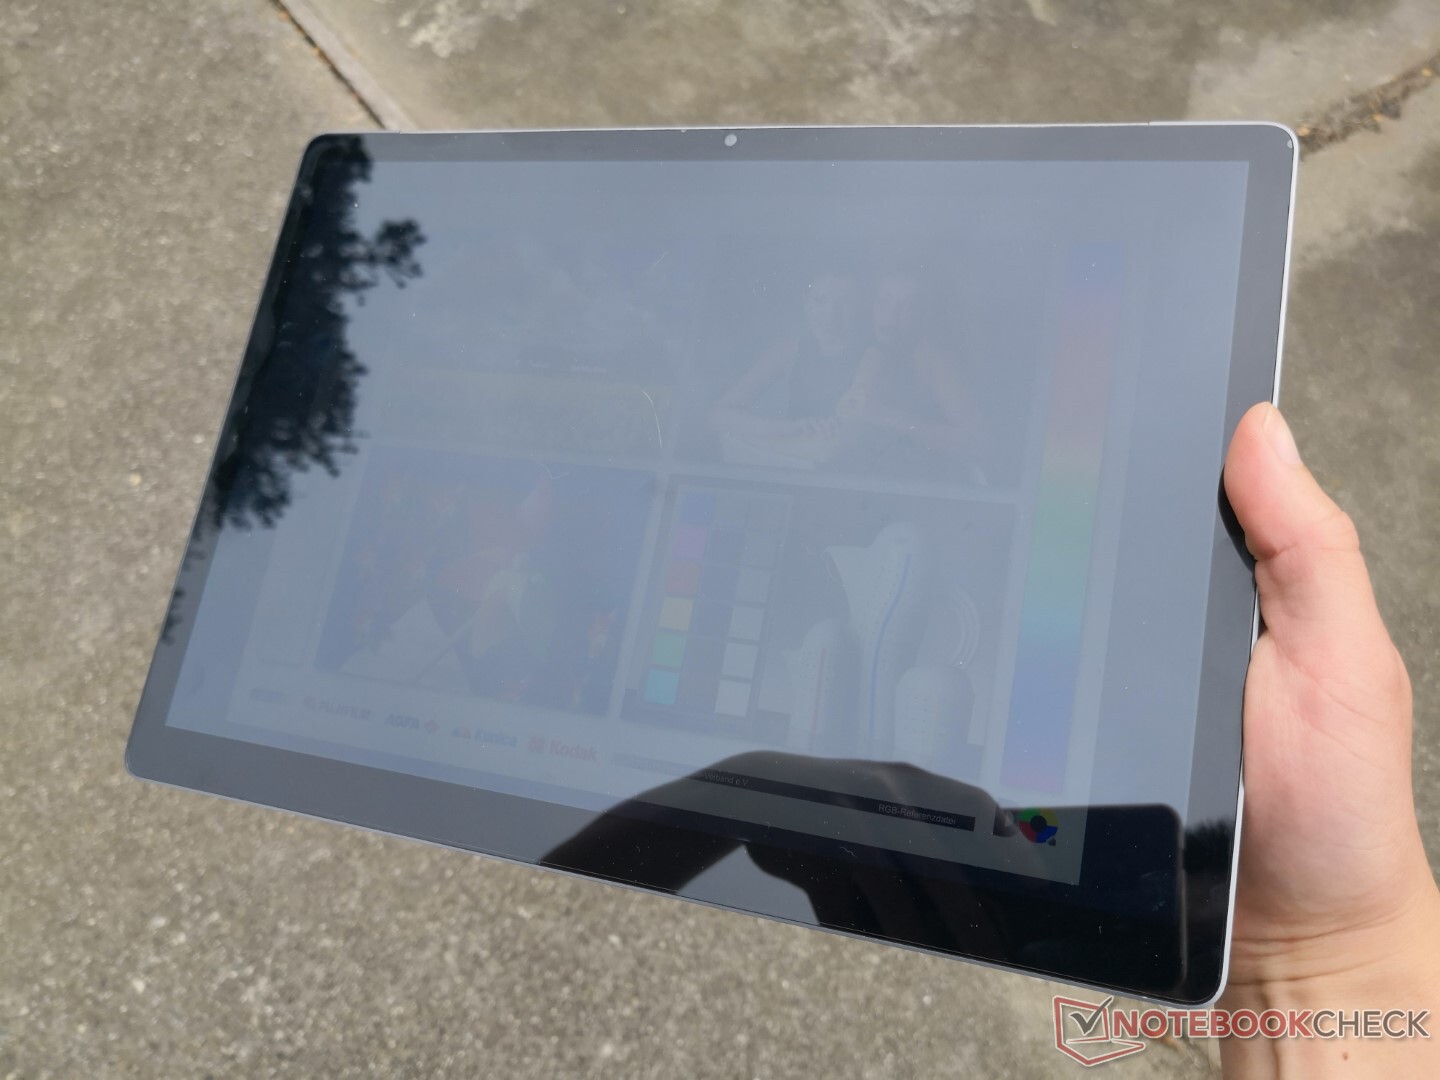
户外能见度比大多数其他平板电脑要差,因为显示屏比较暗。在大多数户外条件下,预计会有很多不可避免的眩光。
业绩

处理器
CPU的性能大约比最新的30%和45%慢 酷睿i7-1165G7 在单线程和多线程工作负载中分别慢30%和45%。虽然很重要,但对于网络浏览或文字处理等较简单的任务来说,这种差异并不十分明显。当然,它仍然比赛扬或Atom系统好,在那里应用程序需要更长的时间来启动或浏览。
Cinebench R15 Multi Loop
Cinebench R23: Multi Core | Single Core
Cinebench R15: CPU Multi 64Bit | CPU Single 64Bit
Blender: v2.79 BMW27 CPU
7-Zip 18.03: 7z b 4 -mmt1 | 7z b 4
Geekbench 5.5: Single-Core | Multi-Core
HWBOT x265 Benchmark v2.2: 4k Preset
LibreOffice : 20 Documents To PDF
R Benchmark 2.5: Overall mean
| Cinebench R20 / CPU (Multi Core) | |
| Asus VivoBook Flip 14 TM420IA | |
| Lenovo ThinkPad L14-20U50003GE | |
| Framework Laptop 13.5 | |
| Lenovo ThinkPad X12 20UVS03G00 | |
| Microsoft Surface Pro 7 Plus | |
| Dell Latitude 12 7210 2-in-1 | |
| Asus ZenBook 14 UX434FL-DB77 | |
| Microsoft Surface Laptop Go Core i5 | |
| Average Intel Core i7-8550U (1118 - 1138, n=2) | |
| Kuu LeBook 12.6 Core i7-8550U | |
| Dell Latitude 13 3390 | |
| HP Elite Dragonfly-8MK79EA | |
| Teclast F7 Air | |
| Cinebench R20 / CPU (Single Core) | |
| Framework Laptop 13.5 | |
| Microsoft Surface Pro 7 Plus | |
| Lenovo ThinkPad X12 20UVS03G00 | |
| Asus VivoBook Flip 14 TM420IA | |
| Dell Latitude 12 7210 2-in-1 | |
| Lenovo ThinkPad L14-20U50003GE | |
| Asus ZenBook 14 UX434FL-DB77 | |
| Microsoft Surface Laptop Go Core i5 | |
| Kuu LeBook 12.6 Core i7-8550U | |
| Average Intel Core i7-8550U (383 - 394, n=2) | |
| HP Elite Dragonfly-8MK79EA | |
| Dell Latitude 13 3390 | |
| Teclast F7 Air | |
| Cinebench R23 / Multi Core | |
| Framework Laptop 13.5 | |
| Microsoft Surface Pro 7 Plus | |
| Dell Latitude 12 7210 2-in-1 | |
| Lenovo ThinkPad X12 20UVS03G00 | |
| Kuu LeBook 12.6 Core i7-8550U | |
| Average Intel Core i7-8550U (n=1) | |
| Teclast F7 Air | |
| Cinebench R23 / Single Core | |
| Framework Laptop 13.5 | |
| Microsoft Surface Pro 7 Plus | |
| Dell Latitude 12 7210 2-in-1 | |
| Lenovo ThinkPad X12 20UVS03G00 | |
| Kuu LeBook 12.6 Core i7-8550U | |
| Average Intel Core i7-8550U (n=1) | |
| Teclast F7 Air | |
| Cinebench R15 / CPU Multi 64Bit | |
| Asus VivoBook Flip 14 TM420IA | |
| Lenovo ThinkPad L14-20U50003GE | |
| Lenovo ThinkPad X12 20UVS03G00 | |
| Framework Laptop 13.5 | |
| Microsoft Surface Pro 7 Plus | |
| Asus ZenBook 14 UX434FL-DB77 | |
| Dell Latitude 12 7210 2-in-1 | |
| Average Intel Core i7-8550U (301 - 761, n=78) | |
| Dell Latitude 13 3390 | |
| Samsung Notebook 9 NP930QAA | |
| Microsoft Surface Laptop Go Core i5 | |
| HP EliteBook x360 1030 G4 7YL44EA | |
| HP Elite Dragonfly-8MK79EA | |
| Kuu LeBook 12.6 Core i7-8550U | |
| Teclast F7 Air | |
| NuVision Encite Book 12 Plus | |
| Cinebench R15 / CPU Single 64Bit | |
| Framework Laptop 13.5 | |
| Microsoft Surface Pro 7 Plus | |
| Asus VivoBook Flip 14 TM420IA | |
| Asus ZenBook 14 UX434FL-DB77 | |
| Lenovo ThinkPad L14-20U50003GE | |
| Lenovo ThinkPad X12 20UVS03G00 | |
| HP EliteBook x360 1030 G4 7YL44EA | |
| Microsoft Surface Laptop Go Core i5 | |
| Average Intel Core i7-8550U (108 - 172, n=76) | |
| Samsung Notebook 9 NP930QAA | |
| HP Elite Dragonfly-8MK79EA | |
| Dell Latitude 13 3390 | |
| Kuu LeBook 12.6 Core i7-8550U | |
| Dell Latitude 12 7210 2-in-1 | |
| Teclast F7 Air | |
| NuVision Encite Book 12 Plus | |
| Blender / v2.79 BMW27 CPU | |
| Teclast F7 Air | |
| Lenovo ThinkPad X12 20UVS03G00 | |
| HP Elite Dragonfly-8MK79EA | |
| Microsoft Surface Laptop Go Core i5 | |
| Dell Latitude 13 3390 | |
| Kuu LeBook 12.6 Core i7-8550U | |
| Average Intel Core i7-8550U (841 - 937, n=4) | |
| Dell Latitude 12 7210 2-in-1 | |
| Asus ZenBook 14 UX434FL-DB77 | |
| Microsoft Surface Pro 7 Plus | |
| Lenovo ThinkPad L14-20U50003GE | |
| Framework Laptop 13.5 | |
| Asus VivoBook Flip 14 TM420IA | |
| 7-Zip 18.03 / 7z b 4 -mmt1 | |
| Framework Laptop 13.5 | |
| Asus VivoBook Flip 14 TM420IA | |
| Kuu LeBook 12.6 Core i7-8550U | |
| Average Intel Core i7-8550U (n=1) | |
| Microsoft Surface Pro 7 Plus | |
| Lenovo ThinkPad L14-20U50003GE | |
| Dell Latitude 12 7210 2-in-1 | |
| Microsoft Surface Laptop Go Core i5 | |
| HP Elite Dragonfly-8MK79EA | |
| Asus ZenBook 14 UX434FL-DB77 | |
| Dell Latitude 13 3390 | |
| Teclast F7 Air | |
| 7-Zip 18.03 / 7z b 4 | |
| Asus VivoBook Flip 14 TM420IA | |
| Lenovo ThinkPad L14-20U50003GE | |
| Framework Laptop 13.5 | |
| Microsoft Surface Pro 7 Plus | |
| Dell Latitude 12 7210 2-in-1 | |
| Lenovo ThinkPad X12 20UVS03G00 | |
| Asus ZenBook 14 UX434FL-DB77 | |
| Kuu LeBook 12.6 Core i7-8550U | |
| Average Intel Core i7-8550U (n=1) | |
| Dell Latitude 13 3390 | |
| HP Elite Dragonfly-8MK79EA | |
| Microsoft Surface Laptop Go Core i5 | |
| Teclast F7 Air | |
| Geekbench 5.5 / Single-Core | |
| Lenovo ThinkPad X12 20UVS03G00 | |
| Microsoft Surface Pro 7 Plus | |
| Asus ZenBook 14 UX434FL-DB77 | |
| Asus VivoBook Flip 14 TM420IA | |
| Dell Latitude 12 7210 2-in-1 | |
| Microsoft Surface Laptop Go Core i5 | |
| Lenovo ThinkPad L14-20U50003GE | |
| Teclast F7 Air | |
| Geekbench 5.5 / Multi-Core | |
| Asus VivoBook Flip 14 TM420IA | |
| Microsoft Surface Pro 7 Plus | |
| Lenovo ThinkPad X12 20UVS03G00 | |
| Lenovo ThinkPad L14-20U50003GE | |
| Dell Latitude 12 7210 2-in-1 | |
| Microsoft Surface Laptop Go Core i5 | |
| Asus ZenBook 14 UX434FL-DB77 | |
| Teclast F7 Air | |
| HWBOT x265 Benchmark v2.2 / 4k Preset | |
| Asus VivoBook Flip 14 TM420IA | |
| Framework Laptop 13.5 | |
| Lenovo ThinkPad L14-20U50003GE | |
| Microsoft Surface Pro 7 Plus | |
| Asus ZenBook 14 UX434FL-DB77 | |
| Dell Latitude 12 7210 2-in-1 | |
| Average Intel Core i7-8550U (3.77 - 4.43, n=3) | |
| Dell Latitude 13 3390 | |
| Microsoft Surface Laptop Go Core i5 | |
| Kuu LeBook 12.6 Core i7-8550U | |
| Lenovo ThinkPad X12 20UVS03G00 | |
| HP Elite Dragonfly-8MK79EA | |
| Teclast F7 Air | |
| LibreOffice / 20 Documents To PDF | |
| Teclast F7 Air | |
| Kuu LeBook 12.6 Core i7-8550U | |
| Average Intel Core i7-8550U (n=1) | |
| Asus ZenBook 14 UX434FL-DB77 | |
| Dell Latitude 12 7210 2-in-1 | |
| Microsoft Surface Laptop Go Core i5 | |
| Lenovo ThinkPad X12 20UVS03G00 | |
| Lenovo ThinkPad L14-20U50003GE | |
| Microsoft Surface Pro 7 Plus | |
| Asus VivoBook Flip 14 TM420IA | |
| Framework Laptop 13.5 | |
| R Benchmark 2.5 / Overall mean | |
| Teclast F7 Air | |
| Asus ZenBook 14 UX434FL-DB77 | |
| Dell Latitude 12 7210 2-in-1 | |
| Lenovo ThinkPad X12 20UVS03G00 | |
| Microsoft Surface Laptop Go Core i5 | |
| Kuu LeBook 12.6 Core i7-8550U | |
| Average Intel Core i7-8550U (n=1) | |
| Microsoft Surface Pro 7 Plus | |
| Lenovo ThinkPad L14-20U50003GE | |
| Asus VivoBook Flip 14 TM420IA | |
| Framework Laptop 13.5 | |
Cinebench R23: Multi Core | Single Core
Cinebench R15: CPU Multi 64Bit | CPU Single 64Bit
Blender: v2.79 BMW27 CPU
7-Zip 18.03: 7z b 4 -mmt1 | 7z b 4
Geekbench 5.5: Single-Core | Multi-Core
HWBOT x265 Benchmark v2.2: 4k Preset
LibreOffice : 20 Documents To PDF
R Benchmark 2.5: Overall mean
* ... smaller is better
系统性能
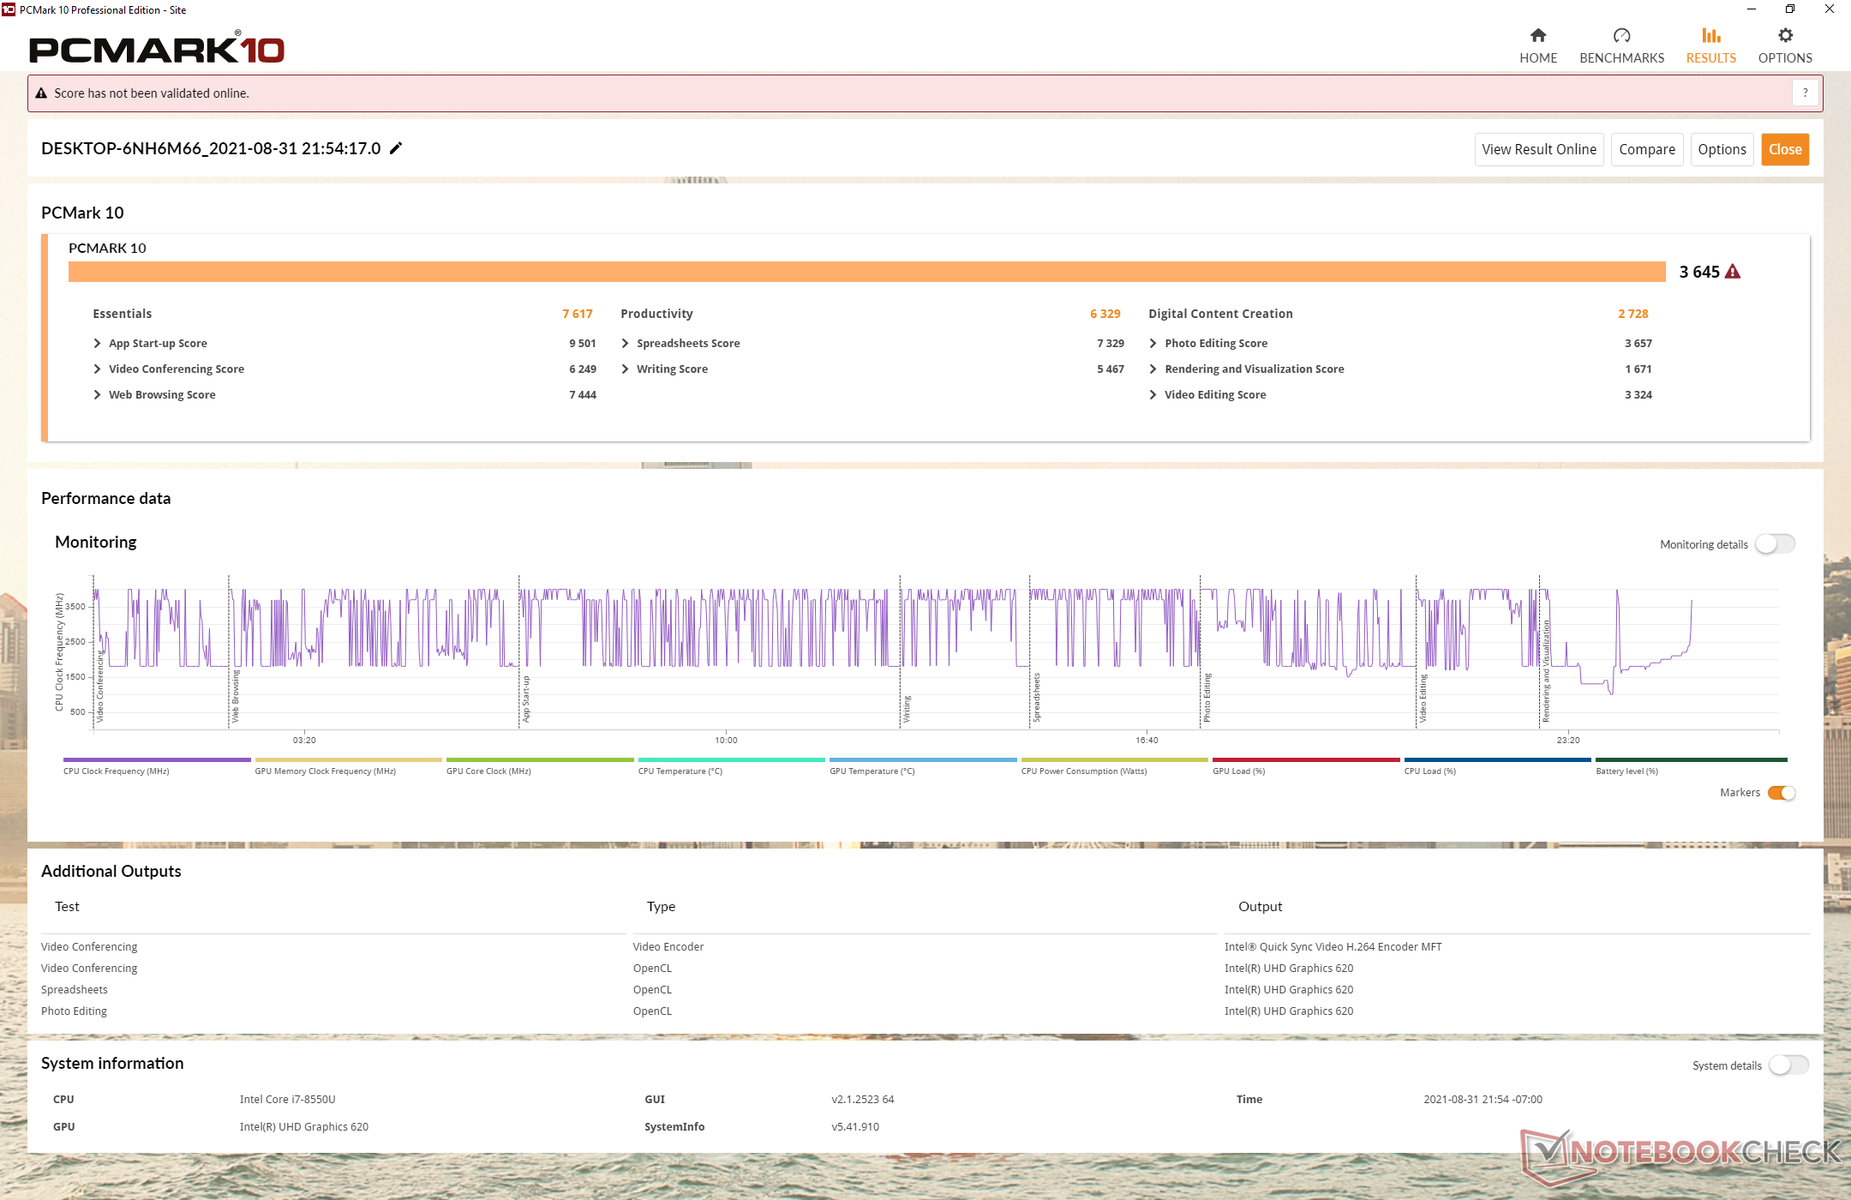
PCMark的结果是我们所期望的,相对于具有相同Core i7-8550U CPU的其他型号。我们很欣赏这个事实,即该系统没有制造商的臃肿软件,可以获得干净的Windows 10体验。
| PCMark 10 / Score | |
| Lenovo ThinkPad X12 20UVS03G00 | |
| Dell Latitude 12 7210 2-in-1 | |
| Microsoft Surface Pro 7 Plus | |
| Kuu LeBook 12.6 Core i7-8550U | |
| Average Intel Core i7-8550U, Intel UHD Graphics 620 (2629 - 4072, n=31) | |
| Microsoft Surface Laptop Go Core i5 | |
| NuVision Encite Book 12 Plus | |
| PCMark 10 / Essentials | |
| Lenovo ThinkPad X12 20UVS03G00 | |
| Dell Latitude 12 7210 2-in-1 | |
| Microsoft Surface Pro 7 Plus | |
| Microsoft Surface Laptop Go Core i5 | |
| Average Intel Core i7-8550U, Intel UHD Graphics 620 (6628 - 9291, n=29) | |
| Kuu LeBook 12.6 Core i7-8550U | |
| NuVision Encite Book 12 Plus | |
| PCMark 10 / Productivity | |
| Dell Latitude 12 7210 2-in-1 | |
| Kuu LeBook 12.6 Core i7-8550U | |
| Average Intel Core i7-8550U, Intel UHD Graphics 620 (4889 - 7006, n=29) | |
| Lenovo ThinkPad X12 20UVS03G00 | |
| Microsoft Surface Pro 7 Plus | |
| Microsoft Surface Laptop Go Core i5 | |
| NuVision Encite Book 12 Plus | |
| PCMark 10 / Digital Content Creation | |
| Lenovo ThinkPad X12 20UVS03G00 | |
| Microsoft Surface Pro 7 Plus | |
| Dell Latitude 12 7210 2-in-1 | |
| Microsoft Surface Laptop Go Core i5 | |
| Average Intel Core i7-8550U, Intel UHD Graphics 620 (1506 - 3160, n=29) | |
| Kuu LeBook 12.6 Core i7-8550U | |
| NuVision Encite Book 12 Plus | |
| PCMark 10 Score | 3645 points | |
Help | ||
DPC延时
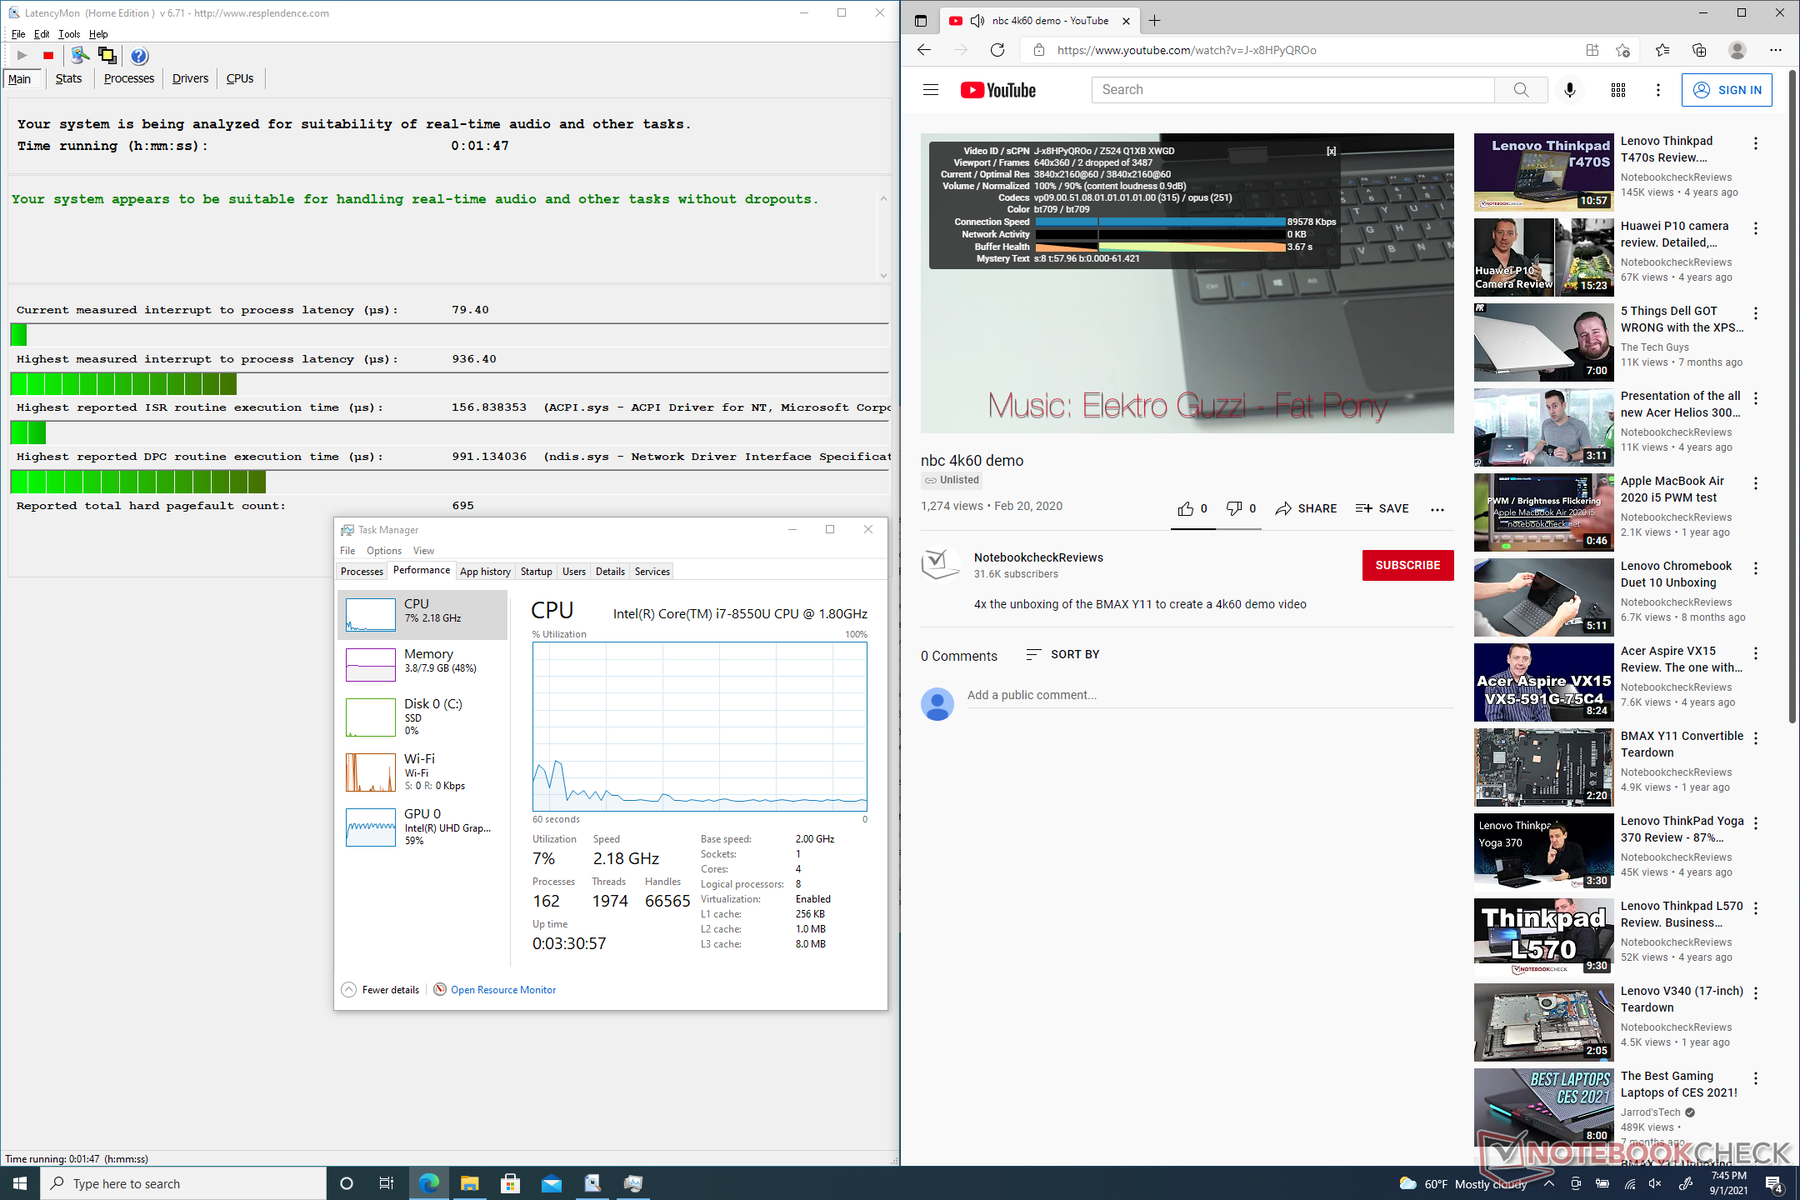
LatencyMon显示,在我们的主页上打开多个浏览器标签时,没有重大延迟问题。尽管采用了过时的英特尔CPU,但在60FPS下播放4K视频也没有任何问题。
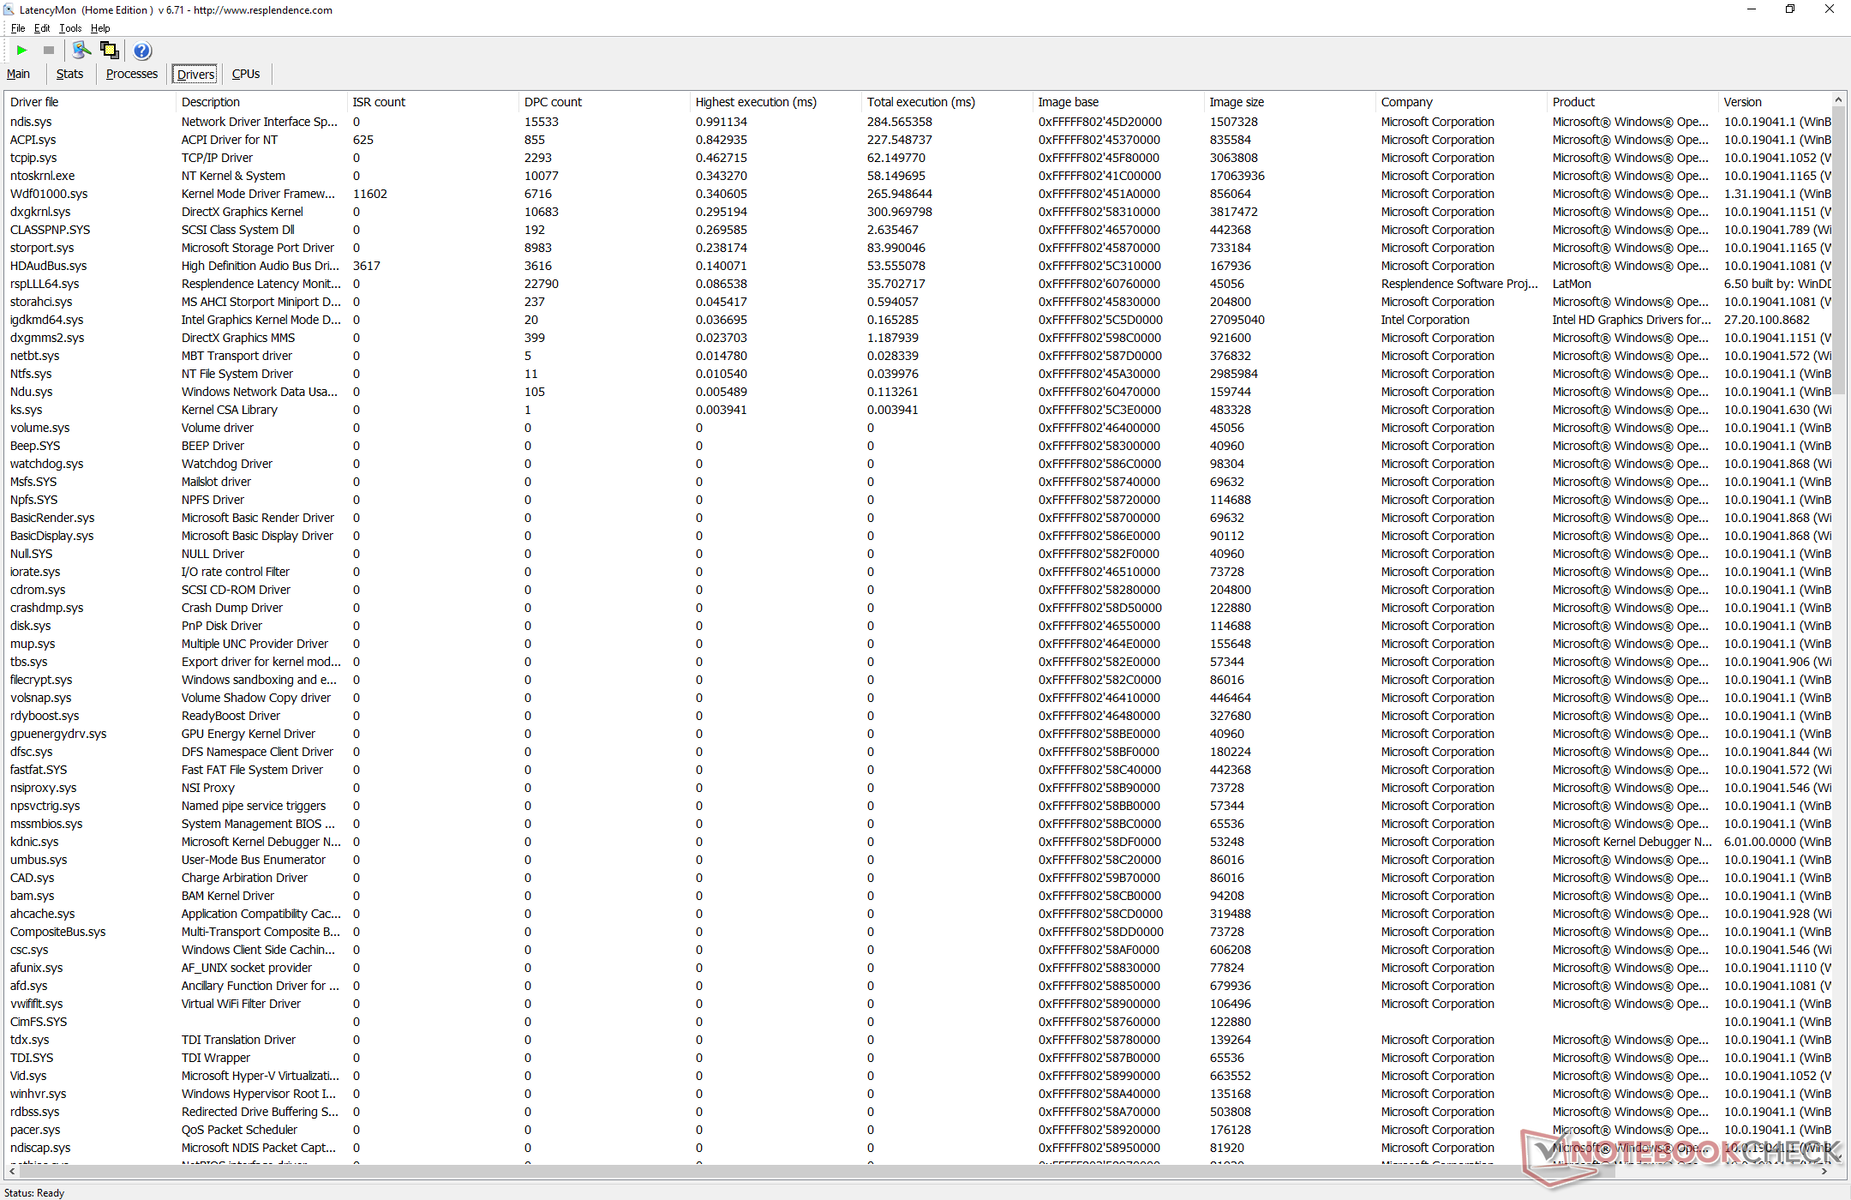
| DPC Latencies / LatencyMon - interrupt to process latency (max), Web, Youtube, Prime95 | |
| Dell Latitude 12 7210 2-in-1 | |
| Kuu LeBook 12.6 Core i7-8550U | |
| Microsoft Surface Laptop Go Core i5 | |
| Lenovo ThinkPad X12 20UVS03G00 | |
| Microsoft Surface Pro 7 Plus | |
* ... smaller is better
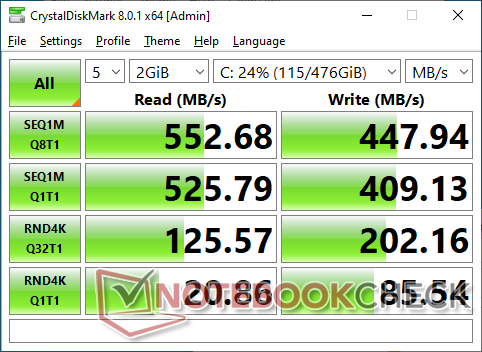
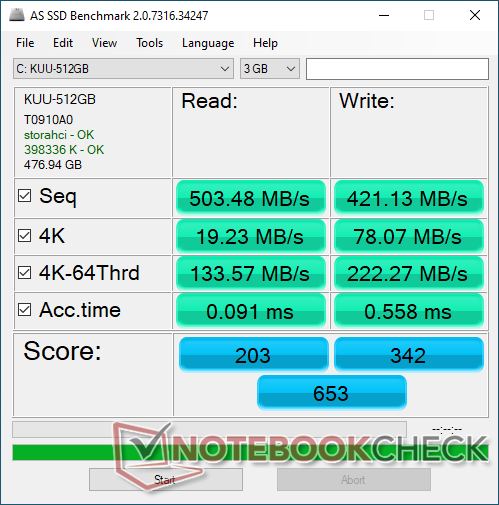
存储设备
内部存储的空间为512GB,传输率与大多数SATA III SSD相似。缺少SD卡读卡器意味着当内部驱动器像大多数笔记本电脑驱动器一样大时,这就不是一个问题了。
| Kuu LeBook 12.6 Core i7-8550U KUU-512GB | Lenovo ThinkPad X12 20UVS03G00 Toshiba BG4 KBG40ZNT512G | Microsoft Surface Pro 7 Plus Samsung PM991 MZ9LQ256HBJQ | Dell Latitude 12 7210 2-in-1 WDC PC SN530 SDBPTPZ-512G | Microsoft Surface Laptop Go Core i5 SK hynix BC501 HFM256GDGTNG | NuVision Encite Book 12 Plus SanDisk DF4064 | |
|---|---|---|---|---|---|---|
| AS SSD | 121% | 171% | 268% | 85% | -127% | |
| Seq Read (MB/s) | 503 | 1760 250% | 1725 243% | 2185 334% | 1347 168% | 154 -69% |
| Seq Write (MB/s) | 421.1 | 761 81% | 931 121% | 1731 311% | 491 17% | 102.4 -76% |
| 4K Read (MB/s) | 19.23 | 47.68 148% | 50.1 161% | 46.28 141% | 38.08 98% | 5.07 -74% |
| 4K Write (MB/s) | 78.1 | 176 125% | 136.9 75% | 161.6 107% | 98.2 26% | 8.42 -89% |
| 4K-64 Read (MB/s) | 133.6 | 581 335% | 870 551% | 1021 664% | 483.1 262% | 27.74 -79% |
| 4K-64 Write (MB/s) | 222.3 | 118.5 -47% | 762 243% | 1125 406% | 350.9 58% | 12.15 -95% |
| Access Time Read * (ms) | 0.091 | 0.155 -70% | 0.279 -207% | 0.069 24% | 0.057 37% | 0.747 -721% |
| Access Time Write * (ms) | 0.558 | 0.188 66% | 0.028 95% | 0.046 92% | 0.105 81% | 1.136 -104% |
| Score Read (Points) | 203 | 805 297% | 1093 438% | 1286 533% | 656 223% | 48 -76% |
| Score Write (Points) | 342 | 371 8% | 992 190% | 1460 327% | 498 46% | 31 -91% |
| Score Total (Points) | 653 | 1551 138% | 2616 301% | 3389 419% | 1458 123% | 103 -84% |
| Copy ISO MB/s (MB/s) | 433.4 | 1174 171% | 1555 259% | 765 77% | 119.7 -72% | |
| Copy Program MB/s (MB/s) | 365.8 | 262.8 -28% | 468.5 28% | 299.6 -18% | 72.8 -80% | |
| Copy Game MB/s (MB/s) | 409.2 | 562 37% | 841 106% | 371.5 -9% | 116.5 -72% | |
| CrystalDiskMark 5.2 / 6 | 98% | 156% | 211% | 93% | -77% | |
| Write 4K (MB/s) | 85.8 | 72.8 -15% | 165.3 93% | 182.7 113% | 87.6 2% | 7.837 -91% |
| Read 4K (MB/s) | 19.22 | 26.35 37% | 42.95 123% | 51.4 167% | 40.41 110% | 7.689 -60% |
| Write Seq (MB/s) | 412.7 | 823 99% | 955 131% | 1303 216% | 601 46% | 104.9 -75% |
| Read Seq (MB/s) | 518 | 1169 126% | 867 67% | 1450 180% | 1033 99% | 167.8 -68% |
| Write 4K Q32T1 (MB/s) | 201 | 112.6 -44% | 423.5 111% | 342.9 71% | 269.1 34% | 13.64 -93% |
| Read 4K Q32T1 (MB/s) | 125.6 | 327.2 161% | 479.2 282% | 523 316% | 261.4 108% | 32.95 -74% |
| Write Seq Q32T1 (MB/s) | 451.1 | 1039 130% | 1060 135% | 1776 294% | 818 81% | 99.5 -78% |
| Read Seq Q32T1 (MB/s) | 556 | 2176 291% | 2251 305% | 2378 328% | 2025 264% | 128.8 -77% |
| Total Average (Program / Settings) | 110% /
111% | 164% /
165% | 240% /
247% | 89% /
88% | -102% /
-109% |
* ... smaller is better

Disk Throttling: DiskSpd Read Loop, Queue Depth 8
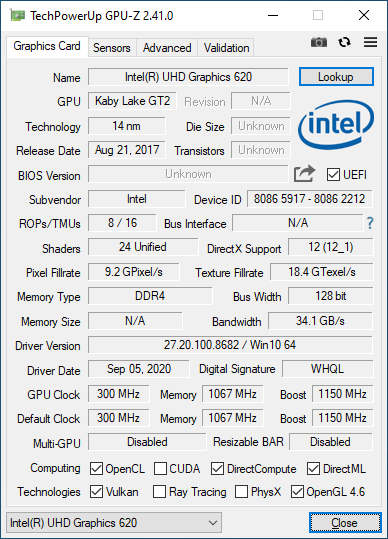
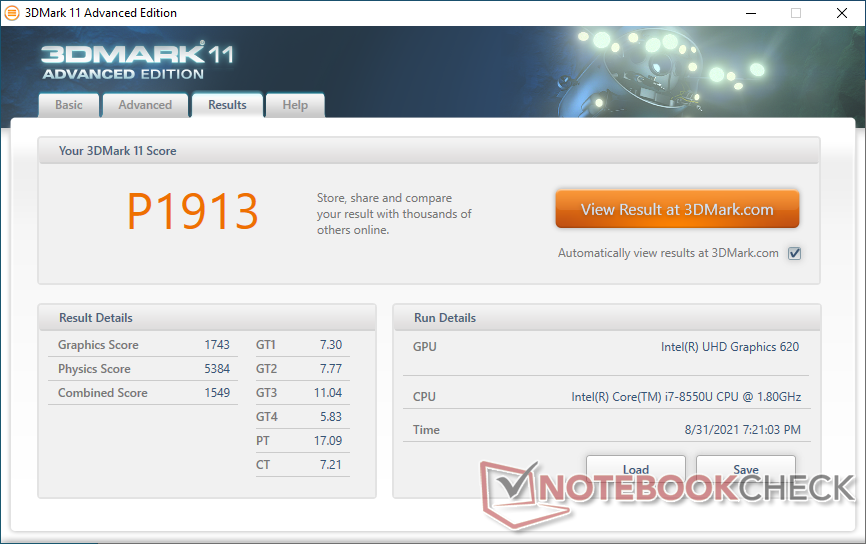
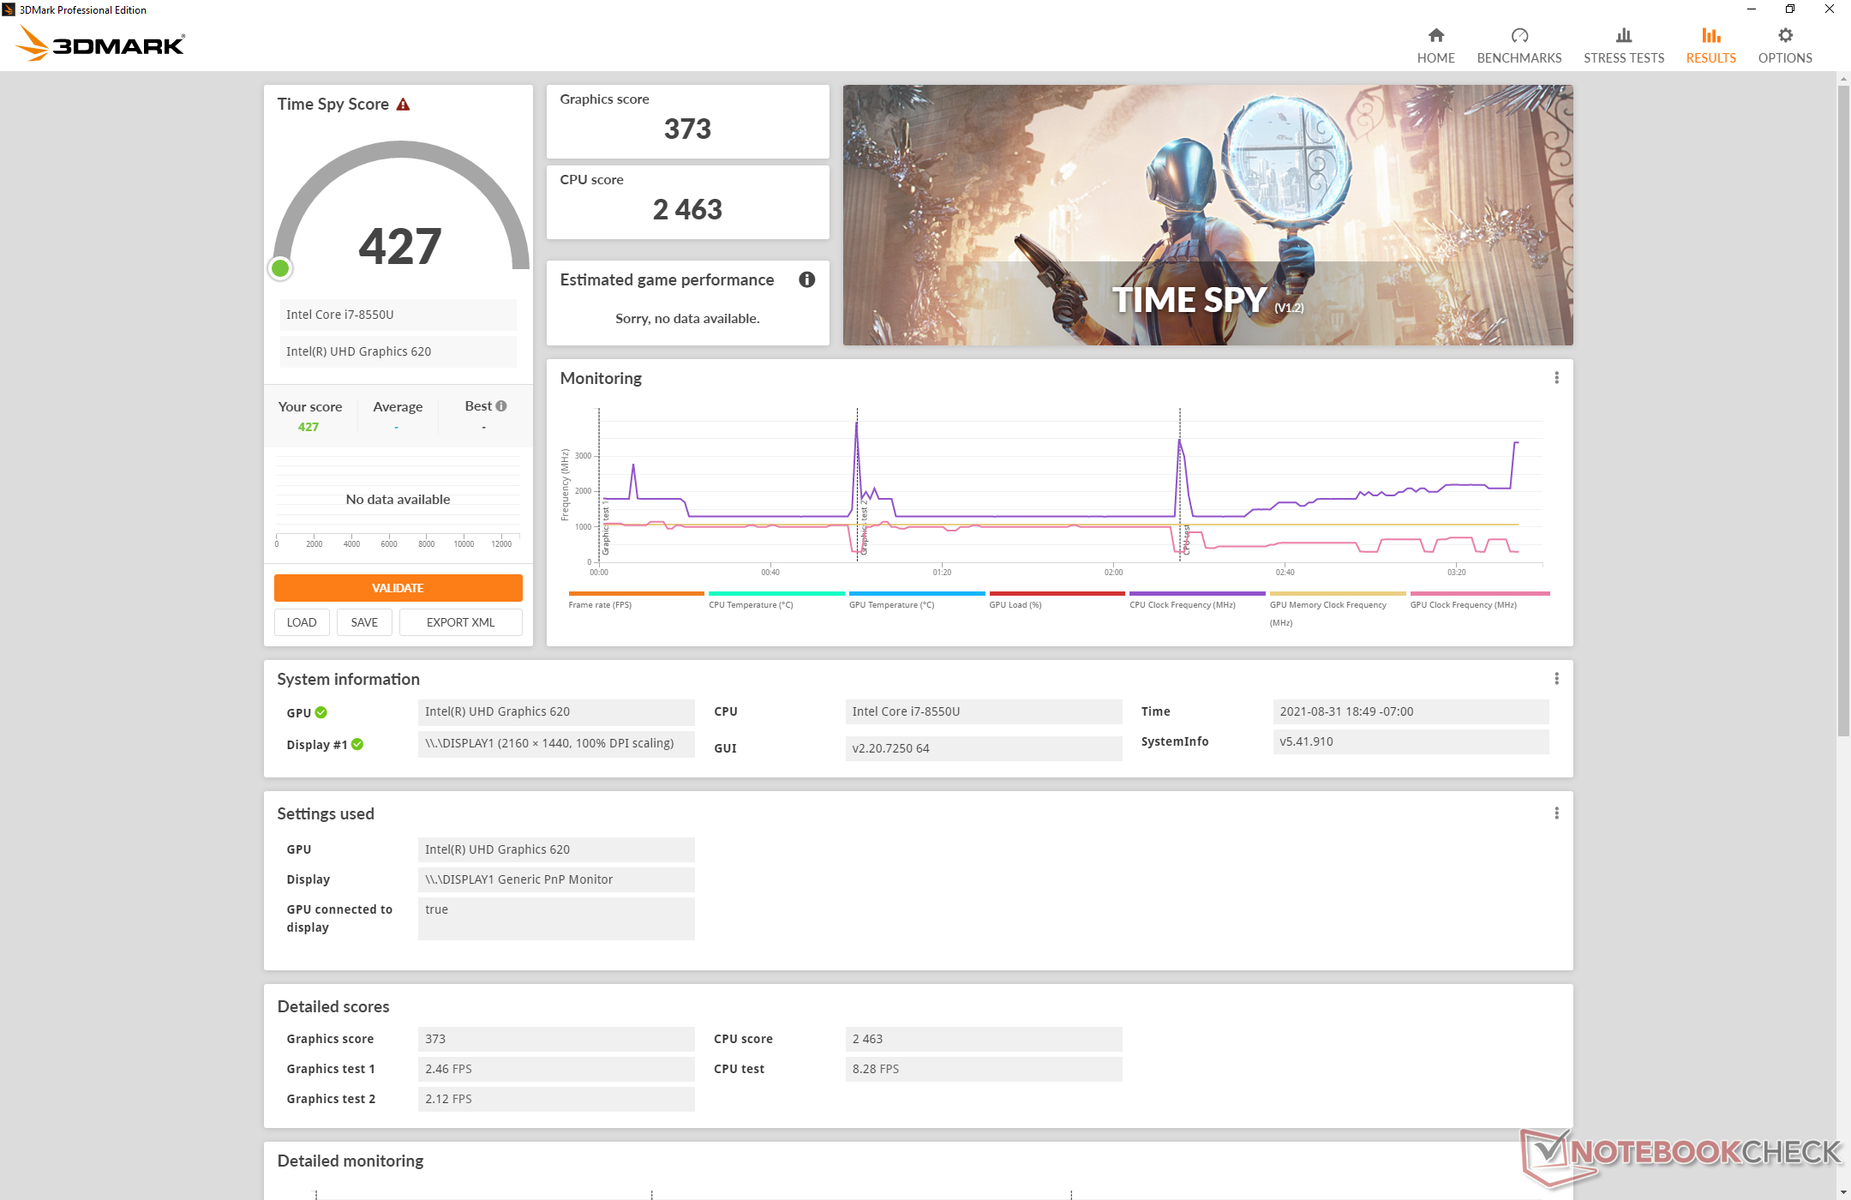
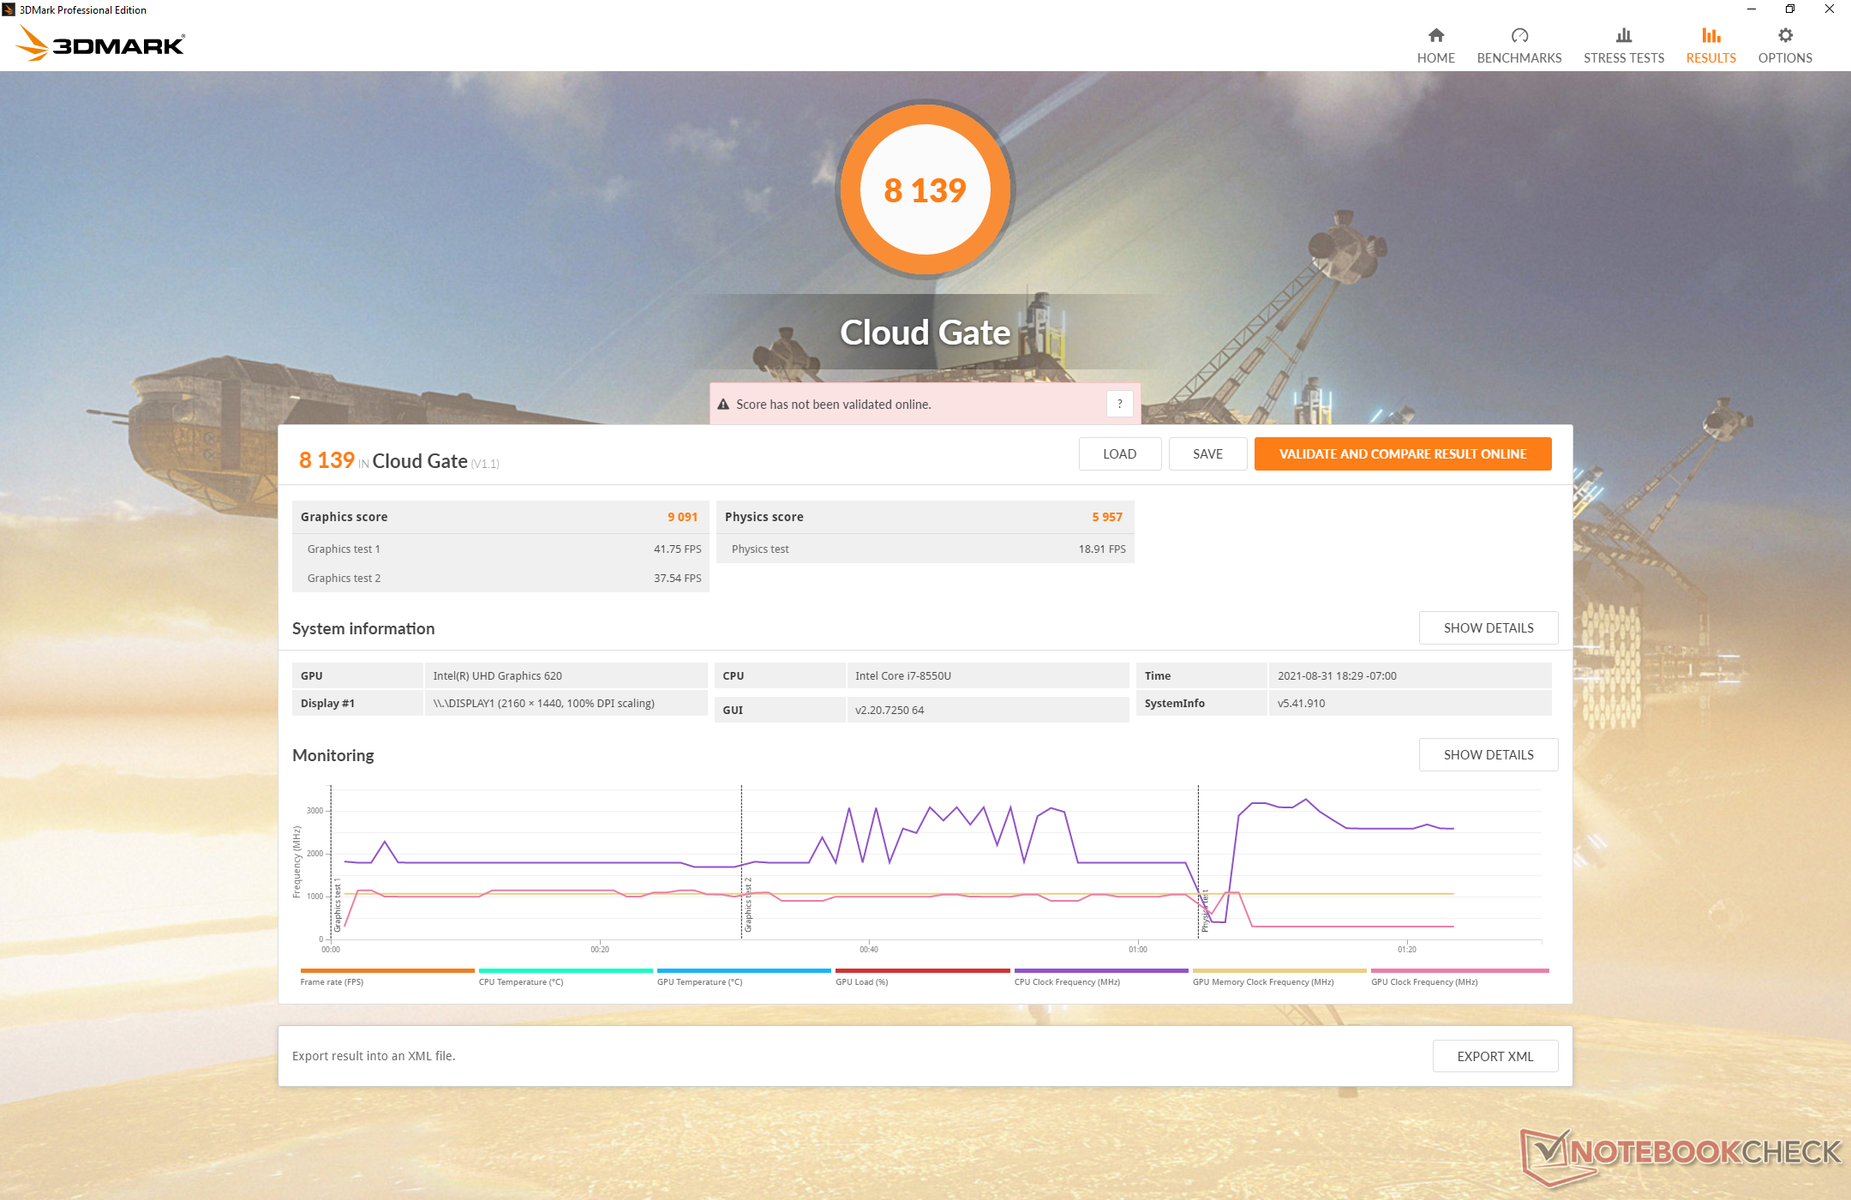
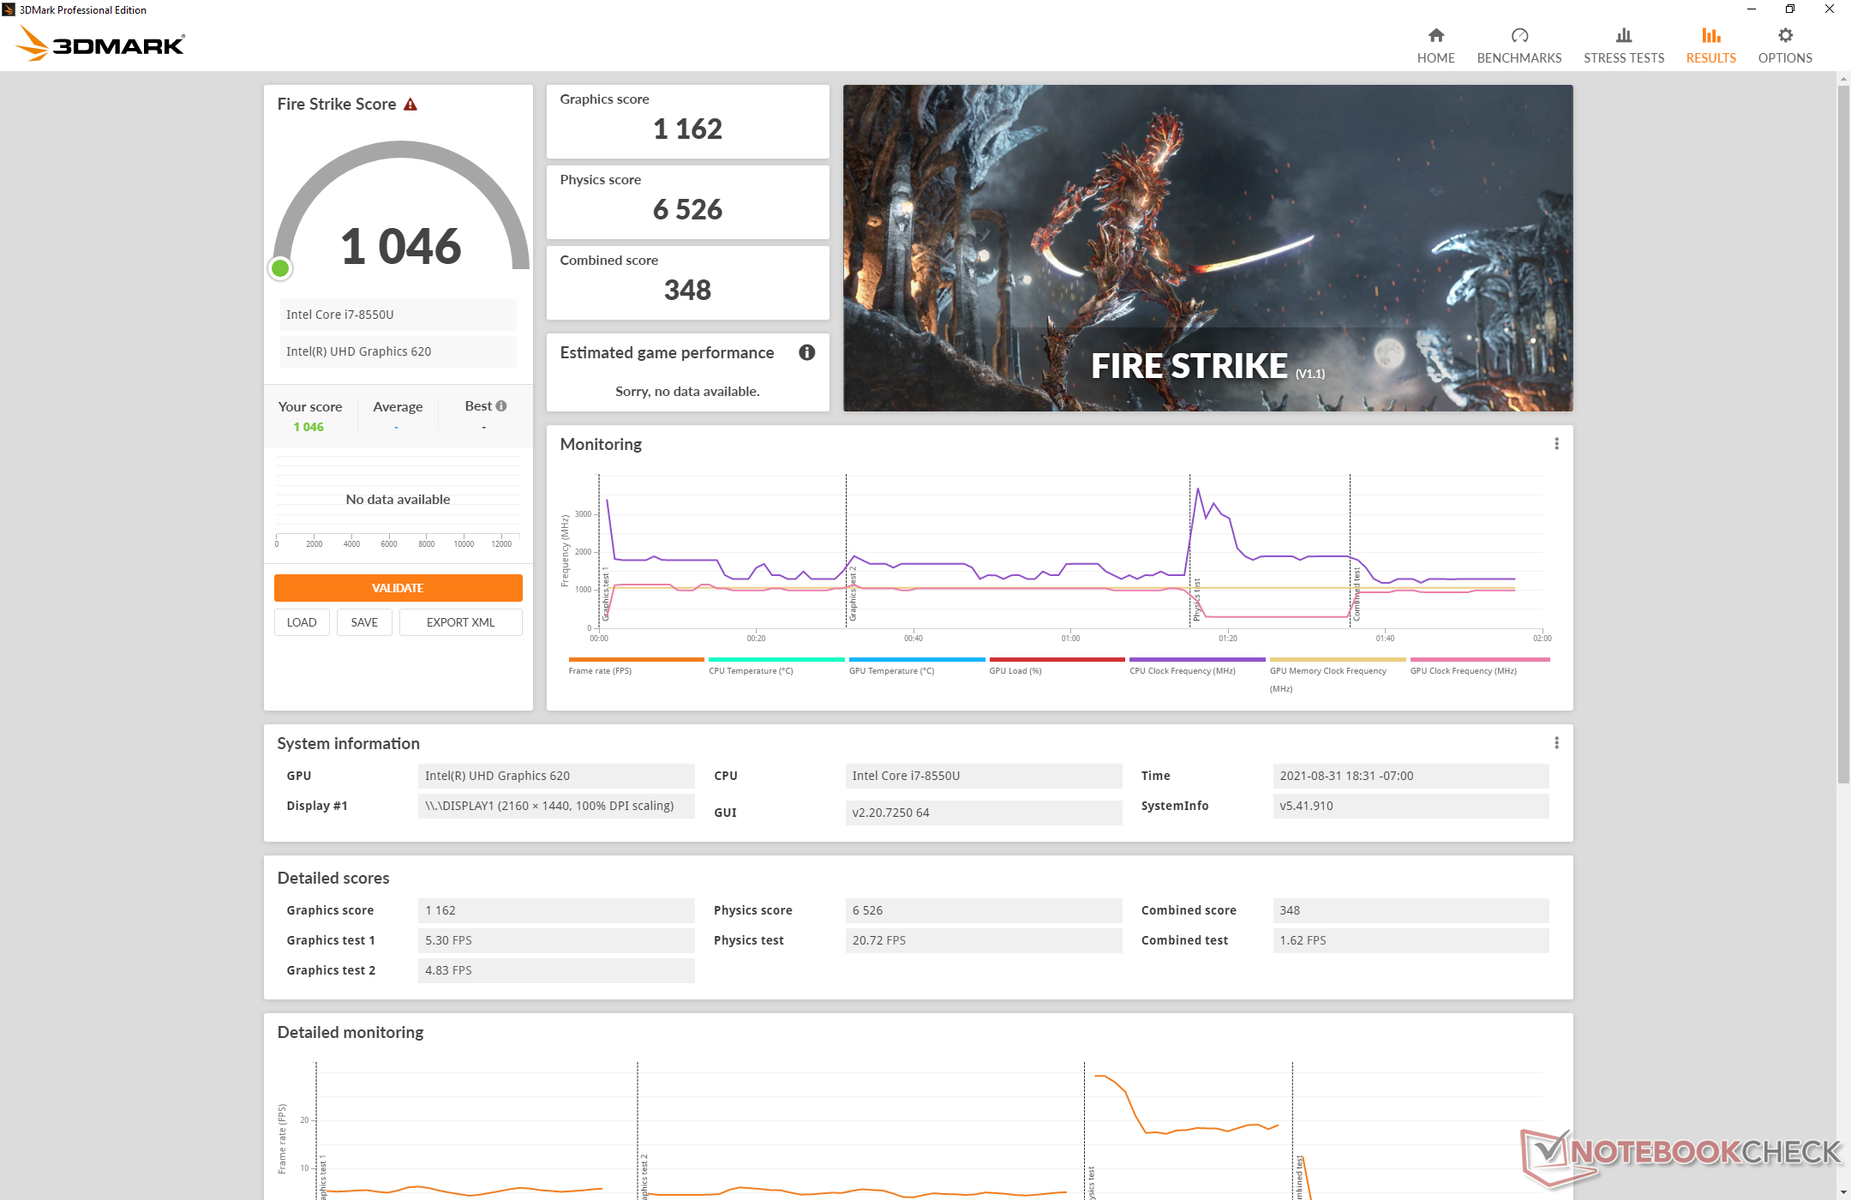
GPU性能
的。 UHD Graphics 620以今天的标准来看是很差的,因为 Radeon RX Vega和 Iris Xe型号是最高的。对于4K流媒体或非游戏玩家来说,这不会是一个问题,但即使是最轻微的编辑或游戏,也会从升级到Surface平板电脑或任何其他配备AMD Zen或11英特尔Tiger Lake CPU的设备中大大受益。
| 3DMark 11 | |
| 1280x720 Performance GPU | |
| Microsoft Surface Pro 7 Plus | |
| Lenovo ThinkPad X12 20UVS03G00 | |
| Asus VivoBook Flip 14 TM420IA | |
| Asus ZenBook 14 UX434FL-DB77 | |
| Lenovo ThinkPad L14-20U50003GE | |
| Microsoft Surface Laptop Go Core i5 | |
| Dell Latitude 12 7210 2-in-1 | |
| HP Elite Dragonfly-8MK79EA | |
| Average Intel UHD Graphics 620 (1144 - 3432, n=244) | |
| Kuu LeBook 12.6 Core i7-8550U | |
| Samsung Notebook 9 NP930QAA | |
| HP EliteBook x360 1030 G4 7YL44EA | |
| Dell Latitude 13 3390 | |
| NuVision Encite Book 12 Plus | |
| 1280x720 Performance Combined | |
| Microsoft Surface Pro 7 Plus | |
| Asus ZenBook 14 UX434FL-DB77 | |
| Asus VivoBook Flip 14 TM420IA | |
| Lenovo ThinkPad X12 20UVS03G00 | |
| Lenovo ThinkPad L14-20U50003GE | |
| Microsoft Surface Laptop Go Core i5 | |
| Dell Latitude 12 7210 2-in-1 | |
| HP EliteBook x360 1030 G4 7YL44EA | |
| Average Intel UHD Graphics 620 (927 - 2505, n=244) | |
| Samsung Notebook 9 NP930QAA | |
| Kuu LeBook 12.6 Core i7-8550U | |
| HP Elite Dragonfly-8MK79EA | |
| Dell Latitude 13 3390 | |
| NuVision Encite Book 12 Plus | |
| 3DMark | |
| 1920x1080 Fire Strike Graphics | |
| Microsoft Surface Pro 7 Plus | |
| Lenovo ThinkPad X12 20UVS03G00 | |
| Asus VivoBook Flip 14 TM420IA | |
| Asus ZenBook 14 UX434FL-DB77 | |
| Lenovo ThinkPad L14-20U50003GE | |
| Microsoft Surface Laptop Go Core i5 | |
| Dell Latitude 12 7210 2-in-1 | |
| HP Elite Dragonfly-8MK79EA | |
| HP EliteBook x360 1030 G4 7YL44EA | |
| Kuu LeBook 12.6 Core i7-8550U | |
| Average Intel UHD Graphics 620 (557 - 2608, n=213) | |
| Dell Latitude 13 3390 | |
| Teclast F7 Air | |
| 2560x1440 Time Spy Graphics | |
| Microsoft Surface Pro 7 Plus | |
| Lenovo ThinkPad X12 20UVS03G00 | |
| Asus VivoBook Flip 14 TM420IA | |
| Asus ZenBook 14 UX434FL-DB77 | |
| Dell Latitude 12 7210 2-in-1 | |
| Microsoft Surface Laptop Go Core i5 | |
| Average Intel UHD Graphics 620 (299 - 797, n=88) | |
| Kuu LeBook 12.6 Core i7-8550U | |
| HP Elite Dragonfly-8MK79EA | |
| Dell Latitude 13 3390 | |
| Teclast F7 Air | |
| 3DMark 11 Performance | 1913 points | |
| 3DMark Cloud Gate Standard Score | 8139 points | |
| 3DMark Fire Strike Score | 1046 points | |
| 3DMark Time Spy Score | 427 points | |
Help | ||
| low | med. | high | ultra | |
|---|---|---|---|---|
| Dota 2 Reborn (2015) | 75.3 | 40.9 | 17.9 | 16 |
| Final Fantasy XV Benchmark (2018) | 11.7 | 5.39 | 5.39 | |
| X-Plane 11.11 (2018) | 11.3 | 9.73 | 9.11 |
Emissions
系统噪音
内部风扇很吵,而且经常跳动。即使是简单的动作,如浏览网页,也会启动风扇,而在大多数其他平板电脑和超低电压笔记本电脑上,它将保持沉默。预计在大多数情况下,风扇的脉动在36至41dB(A)范围内,或者在运行游戏等高负荷时高达45dB(A)。
| Kuu LeBook 12.6 Core i7-8550U UHD Graphics 620, i5-8550U, KUU-512GB | Lenovo ThinkPad X12 20UVS03G00 Iris Xe G7 96EUs, i7-1160G7, Toshiba BG4 KBG40ZNT512G | Microsoft Surface Pro 7 Plus Iris Xe G7 80EUs, i5-1135G7, Samsung PM991 MZ9LQ256HBJQ | Dell Latitude 12 7210 2-in-1 UHD Graphics 620, i7-10610U, WDC PC SN530 SDBPTPZ-512G | Microsoft Surface Laptop Go Core i5 UHD Graphics G1 (Ice Lake 32 EU), i5-1035G1, SK hynix BC501 HFM256GDGTNG | |
|---|---|---|---|---|---|
| Noise | 10% | 14% | 4% | ||
| off / environment * (dB) | 23.8 | 25.1 -5% | 25 -5% | 26.4 -11% | |
| Idle Minimum * (dB) | 23.8 | 25.1 -5% | 25 -5% | 26.4 -11% | |
| Idle Average * (dB) | 23.8 | 25.1 -5% | 25 -5% | 26.4 -11% | |
| Idle Maximum * (dB) | 41.1 | 26 37% | 25 39% | 26.4 36% | |
| Load Average * (dB) | 44.5 | 34.6 22% | 28.7 36% | 36.9 17% | |
| Load Maximum * (dB) | 45 | 37 18% | 34.5 23% | 44.2 2% | |
| Witcher 3 ultra * (dB) | 34.6 |
* ... smaller is better
Noise level
| Idle |
| 23.8 / 23.8 / 41.1 dB(A) |
| Load |
| 44.5 / 45 dB(A) |
 | ||
30 dB silent 40 dB(A) audible 50 dB(A) loud |
||
min: | ||
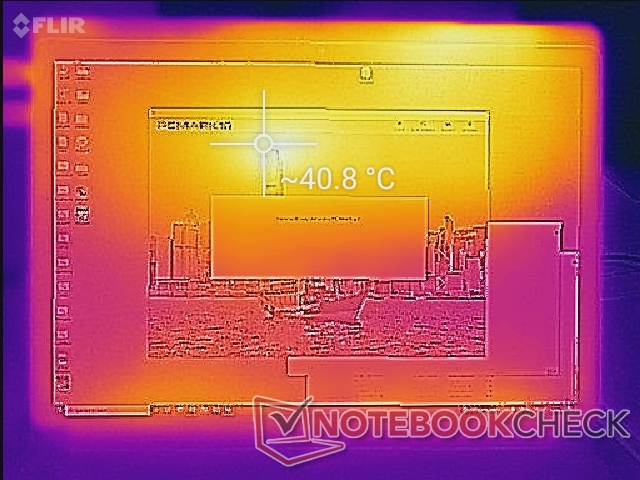
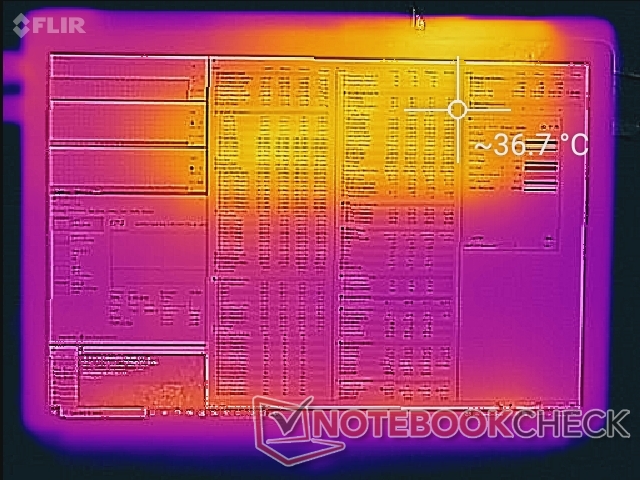
温度
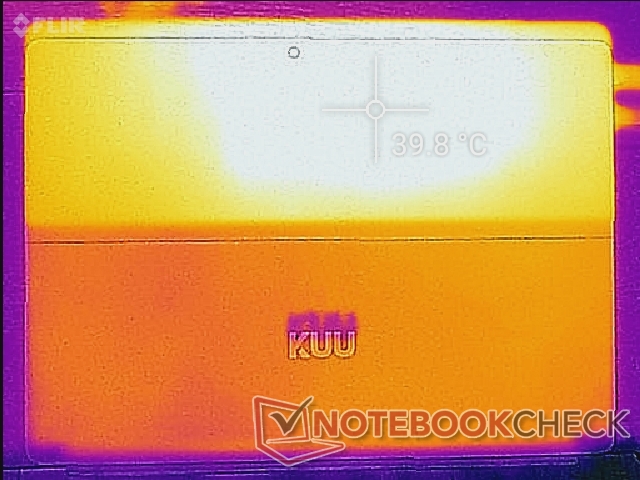
在桌面上空转时,表面温度比预期的要高,正面和背面的热点分别高达41℃和36℃。运行更高的负载会启动内部风扇,导致前面的热点温度略低,为37摄氏度,而后面的热点温度略高,为40摄氏度。在处理平板电脑时,温度很明显,但幸好边缘和角落的温度较低,不会让人分心。
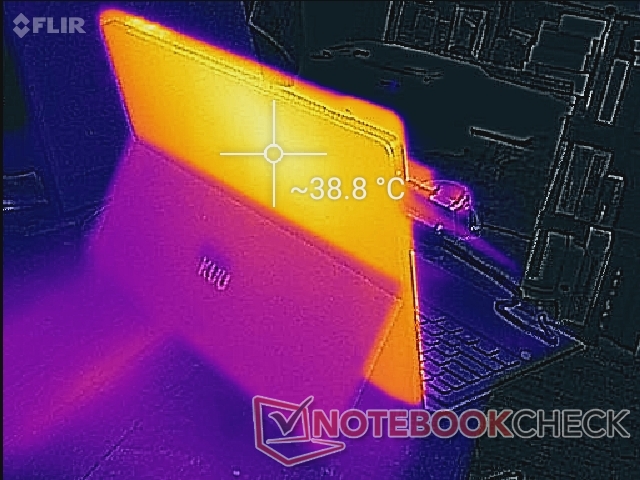
(+) The maximum temperature on the upper side is 36.8 °C / 98 F, compared to the average of 35.4 °C / 96 F, ranging from 19.6 to 60 °C for the class Convertible.
(+) The bottom heats up to a maximum of 39.8 °C / 104 F, compared to the average of 36.9 °C / 98 F
(±) In idle usage, the average temperature for the upper side is 34.5 °C / 94 F, compared to the device average of 30.3 °C / 87 F.
(+) The palmrests and touchpad are reaching skin temperature as a maximum (32.6 °C / 90.7 F) and are therefore not hot.
(-) The average temperature of the palmrest area of similar devices was 28 °C / 82.4 F (-4.6 °C / -8.3 F).

压力测试
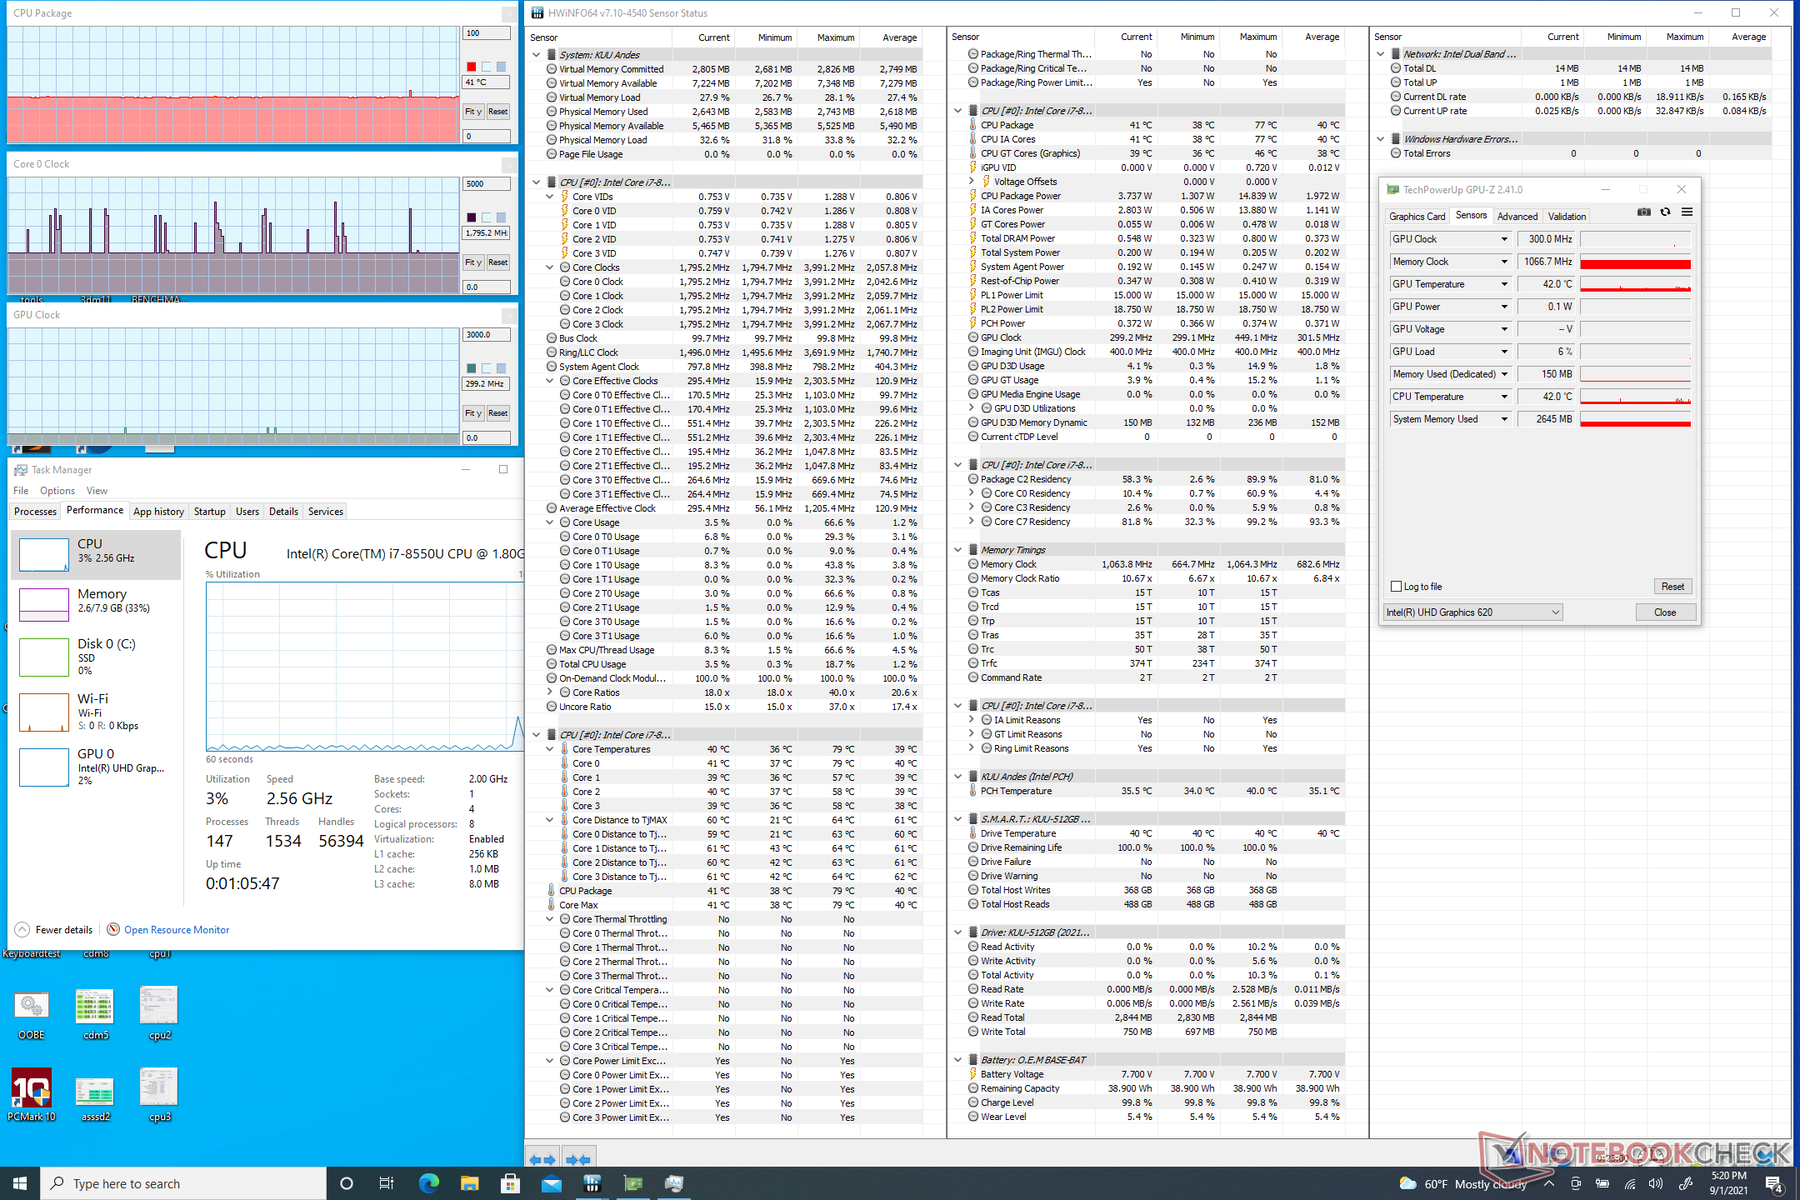
当运行Prime95时,CPU会在大约30秒内提升到2.4GHz,直到达到77℃的核心温度。此后,时钟频率会下降,在1GHz和1.7GHz之间循环,以保持60℃至65℃的冷却温度。因此,Turbo Boost的可持续性在LeBook上是有限的,因为它毕竟是一个平板电脑。
用电池供电运行不会限制性能。在电池上运行3DMark 11,物理学和图形学得分分别为6186和1689分,而在主电源上则为5384和1743分。
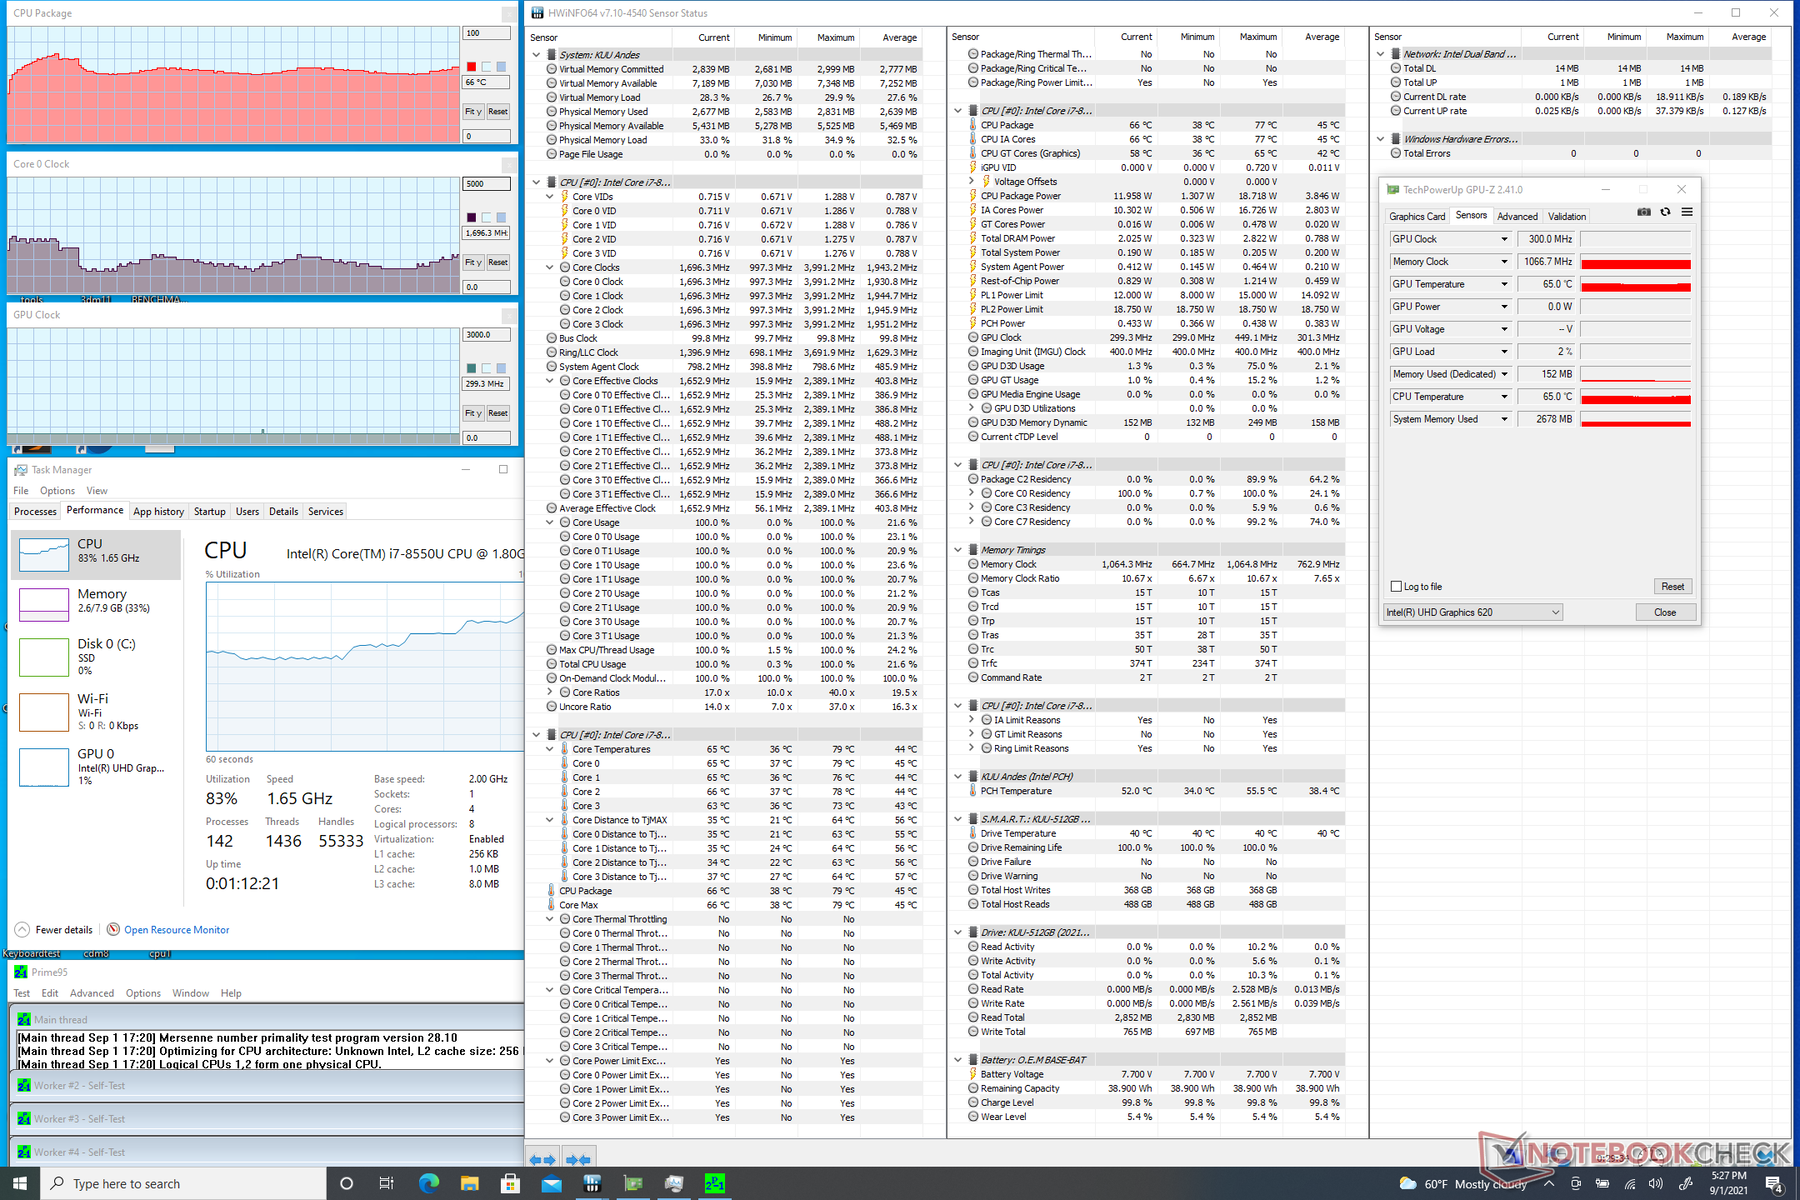
| CPU时钟(GHz) | GPU时钟(MHz) | CPU平均温度(℃) | |
| 系统空闲 | -- | -- | 41 |
| Prime95压力 | 1.0 - 1.7 | -- | 60 - 65 |
| Prime95 + FurMark压力 | 600 | 400 | 58 |
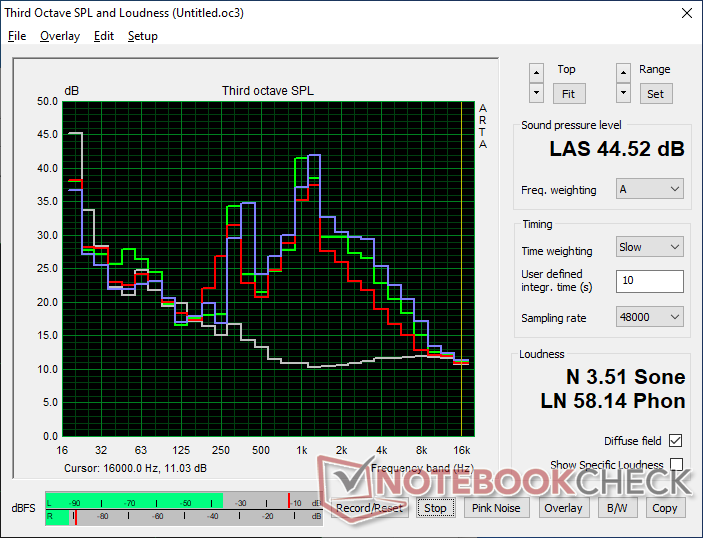
发言人


Kuu LeBook 12.6 Core i7-8550U audio analysis
(±) | speaker loudness is average but good (72.2 dB)
Bass 100 - 315 Hz
(-) | nearly no bass - on average 28.8% lower than median
(±) | linearity of bass is average (7.9% delta to prev. frequency)
Mids 400 - 2000 Hz
(±) | higher mids - on average 5.4% higher than median
(±) | linearity of mids is average (9.7% delta to prev. frequency)
Highs 2 - 16 kHz
(±) | higher highs - on average 5.5% higher than median
(±) | linearity of highs is average (9% delta to prev. frequency)
Overall 100 - 16.000 Hz
(±) | linearity of overall sound is average (29.5% difference to median)
Compared to same class
» 87% of all tested devices in this class were better, 3% similar, 10% worse
» The best had a delta of 6%, average was 20%, worst was 57%
Compared to all devices tested
» 87% of all tested devices were better, 3% similar, 10% worse
» The best had a delta of 4%, average was 24%, worst was 134%
Apple MacBook 12 (Early 2016) 1.1 GHz audio analysis
(+) | speakers can play relatively loud (83.6 dB)
Bass 100 - 315 Hz
(±) | reduced bass - on average 11.3% lower than median
(±) | linearity of bass is average (14.2% delta to prev. frequency)
Mids 400 - 2000 Hz
(+) | balanced mids - only 2.4% away from median
(+) | mids are linear (5.5% delta to prev. frequency)
Highs 2 - 16 kHz
(+) | balanced highs - only 2% away from median
(+) | highs are linear (4.5% delta to prev. frequency)
Overall 100 - 16.000 Hz
(+) | overall sound is linear (10.2% difference to median)
Compared to same class
» 7% of all tested devices in this class were better, 2% similar, 91% worse
» The best had a delta of 5%, average was 18%, worst was 53%
Compared to all devices tested
» 5% of all tested devices were better, 1% similar, 94% worse
» The best had a delta of 4%, average was 24%, worst was 134%
Energy Management
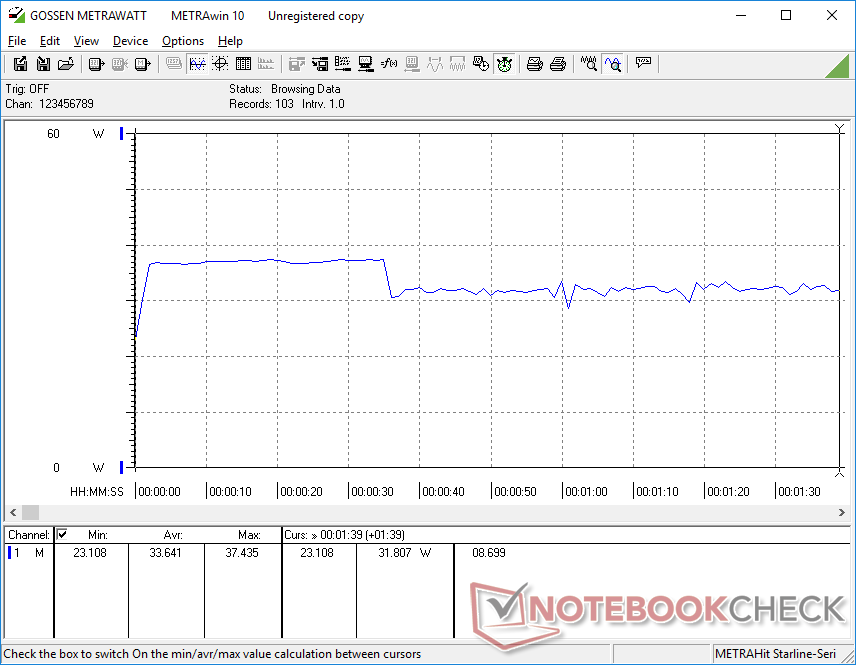
消耗功率
在运行类似的应用程序时,该系统的耗电量比Surface Pro 7 Plus略低。然而,与微软平板电脑能够提供的比LeBook更高的性能相比,仅仅几瓦的节省显得微不足道。
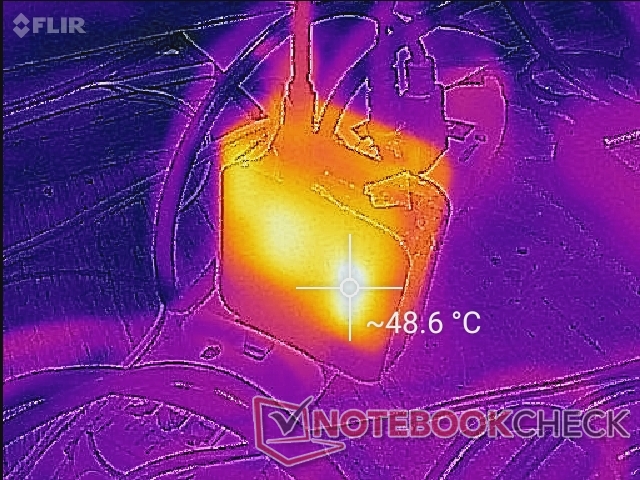
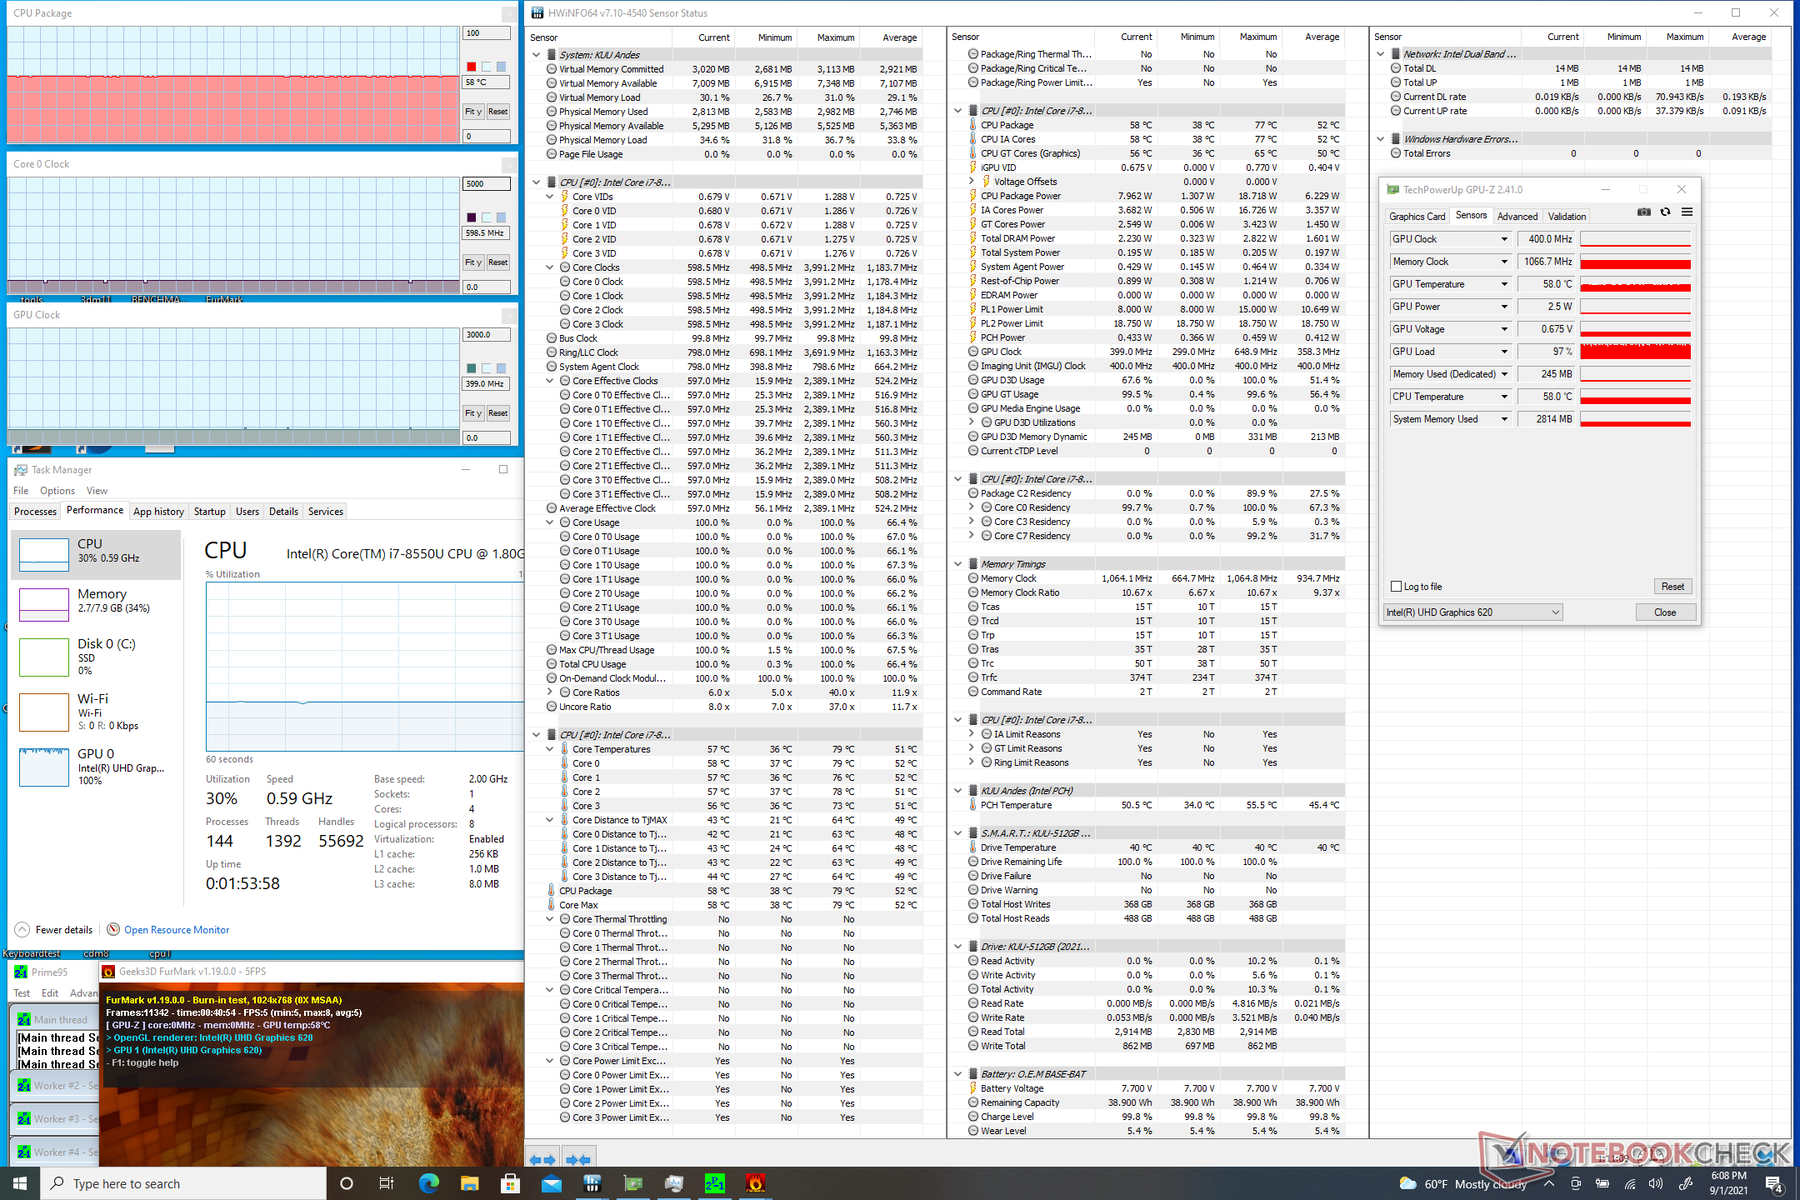
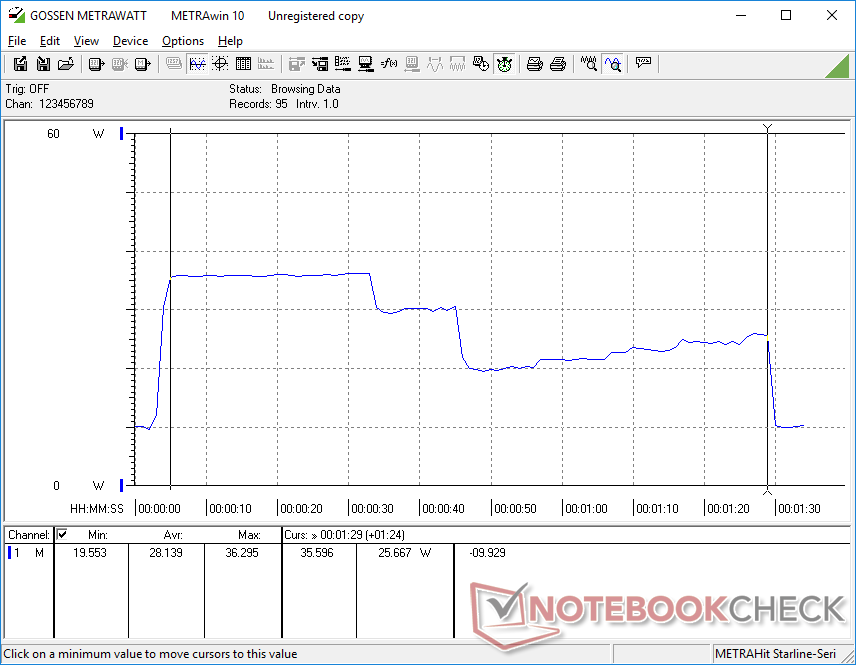
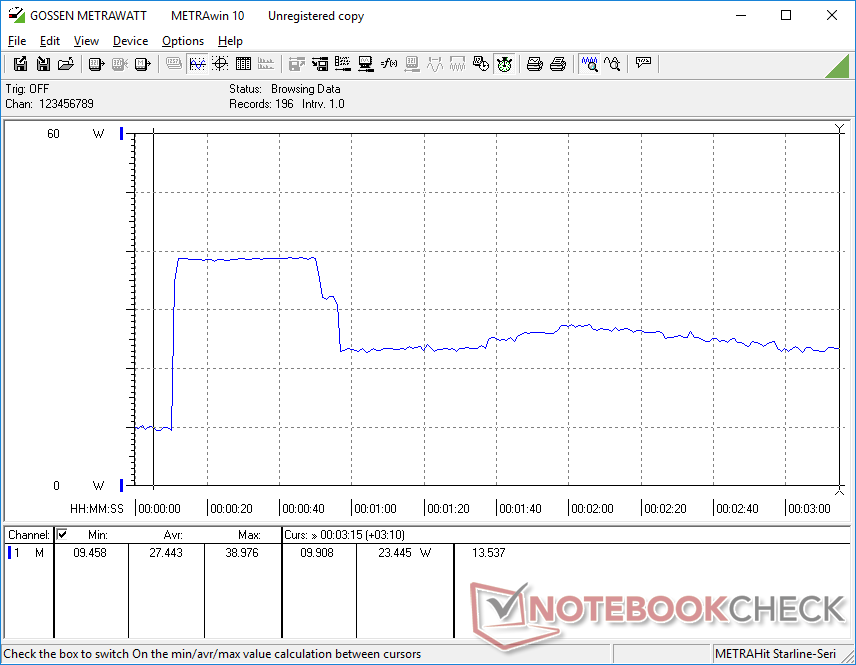
当同时运行Prime95和FurMark时,我们能够从小型(约6.3 x 6.3 x 3厘米)的45瓦交流适配器中测量到38.9瓦的临时最大功耗,然后热限制就开始了。前面提到的Surface Pro 7 Plus由于其较新的处理器具有较高的Turbo Boost潜力,其耗电量可以显著增加到62.5瓦。

| Off / Standby | |
| Idle | |
| Load |
|
Key:
min: | |
| Kuu LeBook 12.6 Core i7-8550U i5-8550U, UHD Graphics 620, KUU-512GB, IPS, 2160x1440, 12.6" | Lenovo ThinkPad X12 20UVS03G00 i7-1160G7, Iris Xe G7 96EUs, Toshiba BG4 KBG40ZNT512G, a-Si IPS LED, 1920x1280, 12.3" | Microsoft Surface Pro 7 Plus i5-1135G7, Iris Xe G7 80EUs, Samsung PM991 MZ9LQ256HBJQ, IPS, 2736x1824, 12.3" | Dell Latitude 12 7210 2-in-1 i7-10610U, UHD Graphics 620, WDC PC SN530 SDBPTPZ-512G, IPS, 1920x1280, 12.3" | Microsoft Surface Laptop Go Core i5 i5-1035G1, UHD Graphics G1 (Ice Lake 32 EU), SK hynix BC501 HFM256GDGTNG, IPS, 1536x1024, 12.4" | NuVision Encite Book 12 Plus Celeron N3350, HD Graphics 500, SanDisk DF4064, IPS, 2560x1440, 12.5" | |
|---|---|---|---|---|---|---|
| Power Consumption | 7% | -18% | 19% | 9% | 29% | |
| Idle Minimum * (Watt) | 6.4 | 4 37% | 5.5 14% | 3.2 50% | 2.8 56% | 4.7 27% |
| Idle Average * (Watt) | 8.8 | 5.9 33% | 9.1 -3% | 5.3 40% | 6.8 23% | 7 20% |
| Idle Maximum * (Watt) | 8.9 | 8.3 7% | 10.8 -21% | 8.4 6% | 8 10% | 8 10% |
| Load Average * (Watt) | 33.6 | 30.1 10% | 39.2 -17% | 27 20% | 37.2 -11% | 14.1 58% |
| Load Maximum * (Watt) | 38.9 | 59 -52% | 62.5 -61% | 46.9 -21% | 51.6 -33% | 27.1 30% |
| Witcher 3 ultra * (Watt) | 30.8 |
* ... smaller is better
Power Consumption Prime95 Stress Test
电池寿命
电池容量介于Surface Pro 7和Latitude 12 7210 2合1之间。然而,无线局域网的运行时间在KUU模型上大约短了两个小时,总共将近6.5小时。
从空电到满电大约需要两个整小时。
| Kuu LeBook 12.6 Core i7-8550U i5-8550U, UHD Graphics 620, 42 Wh | Lenovo ThinkPad X12 20UVS03G00 i7-1160G7, Iris Xe G7 96EUs, 42 Wh | Microsoft Surface Pro 7 Plus i5-1135G7, Iris Xe G7 80EUs, 48.9 Wh | Dell Latitude 12 7210 2-in-1 i7-10610U, UHD Graphics 620, 38 Wh | Microsoft Surface Laptop Go Core i5 i5-1035G1, UHD Graphics G1 (Ice Lake 32 EU), 39 Wh | NuVision Encite Book 12 Plus Celeron N3350, HD Graphics 500, 31.9 Wh | |
|---|---|---|---|---|---|---|
| Battery runtime | 28% | 27% | 28% | 25% | 6% | |
| WiFi v1.3 (h) | 6.4 | 8.2 28% | 8.1 27% | 8.2 28% | 8 25% | 6.8 6% |
| Load (h) | 2 | 3.9 | 1.9 | 2 | 3.6 | |
| Reader / Idle (h) | 13.6 | 22.8 | 35 | 11.3 |
Pros
Cons
结论 - 预算内较好的Windows平板电脑之一
KUU LeBook的优势是视觉上的和有形的。它是一款坚固的平板电脑,可以作为价格较高的旗舰机型,如Surface Pro或HP ElitePad。我们还必须赞扬制造商坚持使用酷睿U系列CPU,而不是像Surface Go或其他许多预算范围内的廉价Windows平板电脑那样采用更弱的Atom、Celeron或Pentium部分。宽敞的12.6英寸触摸屏和相对较窄的边框有助于使LeBook更有吸引力。
它看起来和感觉上都像是一款高质量的平板电脑,其酷睿U系列CPU的性能令人尊敬。然而,弹跳的键盘底座和高亢的风扇噪音很难被忽视。
KUU的好处大多是皮毛,因为脉动的高音调风扇、较暗的显示屏、较短的电池和海绵状的键盘按键都阻碍了用户体验,尽管机箱可能是多么光滑和顺畅。虽然LeBook在这些特定领域无法与Surface Pro相比,但它总体上仍比其他预算的Windows平板电脑好,包括华硕变形金刚书或 笔记本特别是在显示屏尺寸和性能方面。
价格和可用性
LeBook 12.6尚未广泛上市,在发布时也没有确切的上市日期。
Kuu LeBook 12.6 Core i7-8550U
- 09/04/2021 v7 (old)
Allen Ngo
Price comparison

