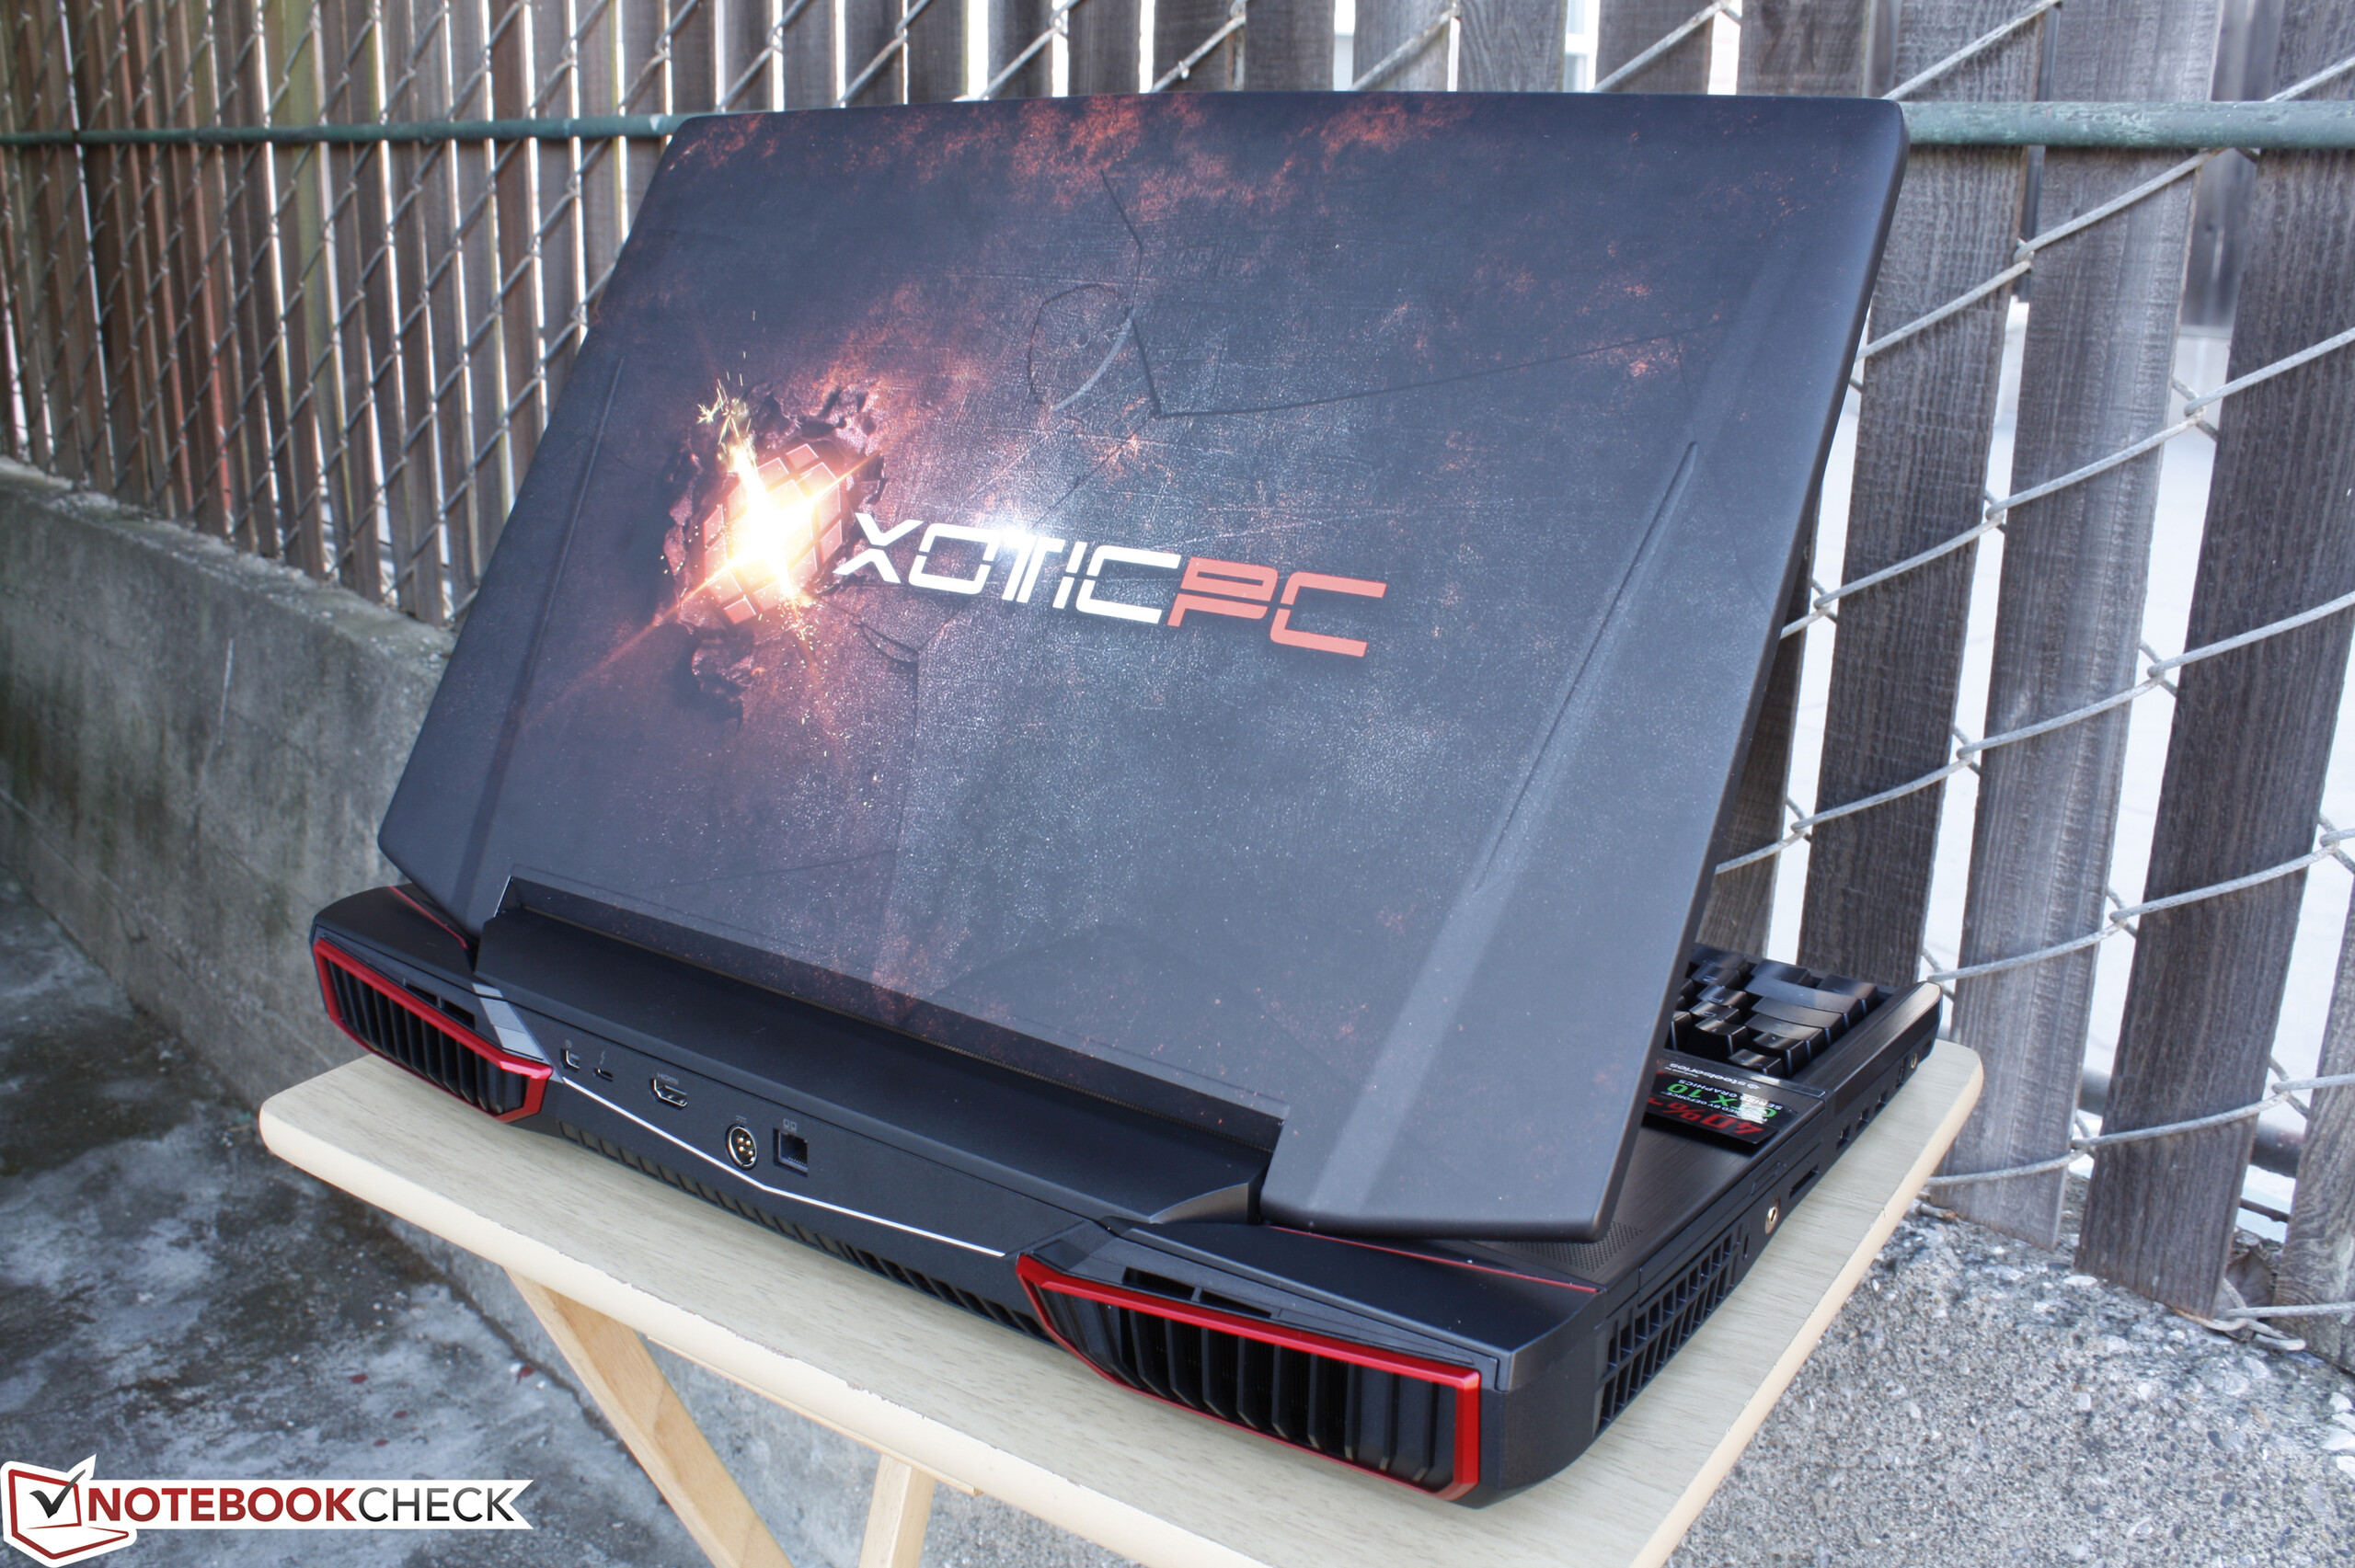
微星 GT83VR 6RE Titan SLI Xotic PC Edition 笔记本电脑简短评测
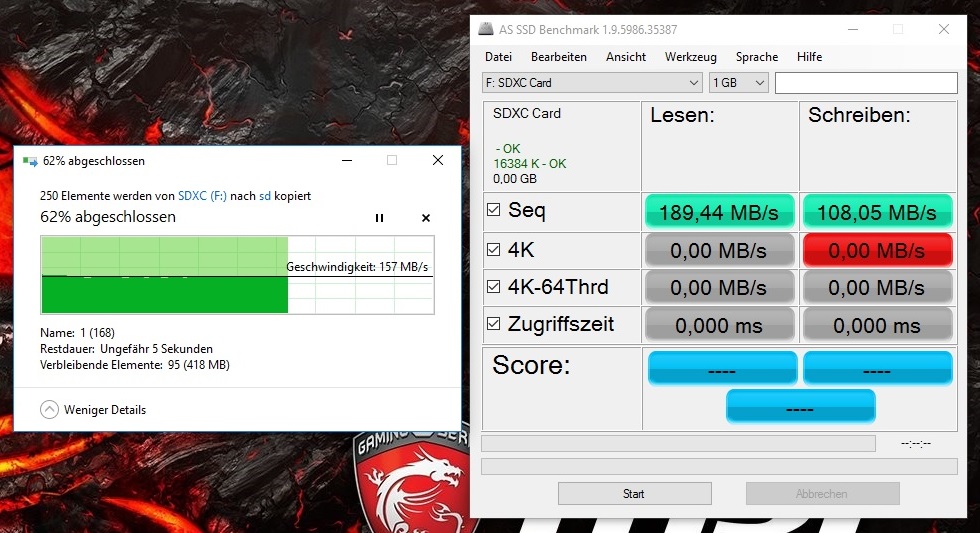
| SD Card Reader | |
| average JPG Copy Test (av. of 3 runs) | |
| Eurocom Sky X7E2 | |
| Schenker XMG U727 | |
| MSI GT83VR-6RE32SR451 | |
| MSI GT80S 6QF | |
| Asus G752VS-XB78K | |
| maximum AS SSD Seq Read Test (1GB) | |
| Eurocom Sky X7E2 | |
| Schenker XMG U727 | |
| MSI GT83VR-6RE32SR451 | |
| MSI GT80S 6QF | |
| Asus G752VS-XB78K | |
| Networking | |
| iperf3 transmit AX12 | |
| MSI GT83VR-6RE32SR451 | |
| HP Omen 17-w110ng | |
| iperf3 receive AX12 | |
| HP Omen 17-w110ng | |
| MSI GT83VR-6RE32SR451 | |
| |||||||||||||||||||||||||
Brightness Distribution: 84 %
Center on Battery: 310 cd/m²
Contrast: 775:1 (Black: 0.4 cd/m²)
ΔE ColorChecker Calman: 1.83 | ∀{0.5-29.43 Ø4.71}
ΔE Greyscale Calman: 1.38 | ∀{0.09-98 Ø4.96}
90% sRGB (Argyll 1.6.3 3D)
59% AdobeRGB 1998 (Argyll 1.6.3 3D)
66.1% AdobeRGB 1998 (Argyll 3D)
90.3% sRGB (Argyll 3D)
65.8% Display P3 (Argyll 3D)
Gamma: 2.44
CCT: 6723 K
| MSI GT83VR-6RE32SR451 Samsung 184HL (SDC4C48), | Schenker XMG U727 AU Optronics B173ZAN01.0 (AUO109B), | MSI GT80S 6QF Samsung 184HL (SDC4C48), | Eurocom Sky X7E2 | Asus G752VS-XB78K LG Philips LP173WF4-SPF3 (LGD04E8), | |
|---|---|---|---|---|---|
| Display | 31% | -1% | 31% | -3% | |
| Display P3 Coverage (%) | 65.8 | 86.9 32% | 65.5 0% | 86.6 32% | 66.9 2% |
| sRGB Coverage (%) | 90.3 | 100 11% | 89.2 -1% | 100 11% | 85.2 -6% |
| AdobeRGB 1998 Coverage (%) | 66.1 | 99.5 51% | 65.2 -1% | 99.2 50% | 62.3 -6% |
| Response Times | -10% | 5% | 12% | -4% | |
| Response Time Grey 50% / Grey 80% * (ms) | 37 ? | 39 ? -5% | 35 ? 5% | 28 ? 24% | 38 ? -3% |
| Response Time Black / White * (ms) | 21 ? | 24 ? -14% | 20 ? 5% | 21.2 ? -1% | 22 ? -5% |
| PWM Frequency (Hz) | 250 ? | 250 ? | |||
| Screen | -20% | -20% | -54% | -25% | |
| Brightness middle (cd/m²) | 310 | 360 16% | 298 -4% | 332.6 7% | 328 6% |
| Brightness (cd/m²) | 277 | 328 18% | 265 -4% | 329 19% | 317 14% |
| Brightness Distribution (%) | 84 | 87 4% | 78 -7% | 87 4% | 88 5% |
| Black Level * (cd/m²) | 0.4 | 0.32 20% | 0.35 13% | 0.314 22% | 0.3 25% |
| Contrast (:1) | 775 | 1125 45% | 851 10% | 1059 37% | 1093 41% |
| Colorchecker dE 2000 * | 1.83 | 3.94 -115% | 2.72 -49% | 5.94 -225% | 3.74 -104% |
| Colorchecker dE 2000 max. * | 3.92 | 6.01 -53% | 5.4 -38% | 8.6 -119% | 8.97 -129% |
| Greyscale dE 2000 * | 1.38 | 4.13 -199% | 3 -117% | 6.27 -354% | 2.67 -93% |
| Gamma | 2.44 90% | 2.46 89% | 2.36 93% | 2.2 100% | 2.41 91% |
| CCT | 6723 97% | 6533 99% | 6995 93% | 6704 97% | 6861 95% |
| Color Space (Percent of AdobeRGB 1998) (%) | 59 | 88 49% | 58 -2% | 91 54% | 56 -5% |
| Color Space (Percent of sRGB) (%) | 90 | 100 11% | 89 -1% | 100 11% | 85 -6% |
| Total Average (Program / Settings) | 0% /
-9% | -5% /
-13% | -4% /
-29% | -11% /
-18% |
* ... smaller is better
Display Response Times
| ↔ Response Time Black to White | ||
|---|---|---|
| 21 ms ... rise ↗ and fall ↘ combined | ↗ 5 ms rise | 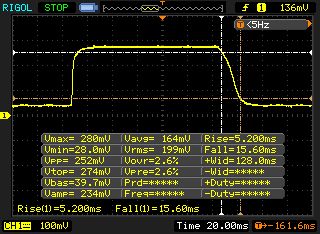 |
| ↘ 16 ms fall | ||
| The screen shows good response rates in our tests, but may be too slow for competitive gamers. In comparison, all tested devices range from 0.1 (minimum) to 240 (maximum) ms. » 47 % of all devices are better. This means that the measured response time is similar to the average of all tested devices (19.8 ms). | ||
| ↔ Response Time 50% Grey to 80% Grey | ||
| 37 ms ... rise ↗ and fall ↘ combined | ↗ 13 ms rise | 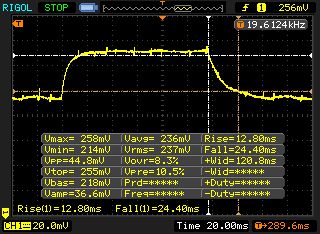 |
| ↘ 24 ms fall | ||
| The screen shows slow response rates in our tests and will be unsatisfactory for gamers. In comparison, all tested devices range from 0.165 (minimum) to 636 (maximum) ms. » 53 % of all devices are better. This means that the measured response time is worse than the average of all tested devices (31 ms). | ||
Screen Flickering / PWM (Pulse-Width Modulation)
| Screen flickering / PWM detected | 250 Hz | ≤ 90 % brightness setting | 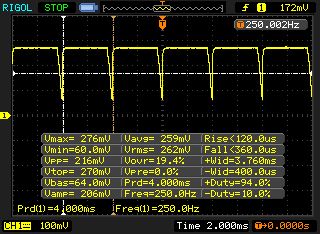 |
The display backlight flickers at 250 Hz (worst case, e.g., utilizing PWM) Flickering detected at a brightness setting of 90 % and below. There should be no flickering or PWM above this brightness setting. The frequency of 250 Hz is relatively low, so sensitive users will likely notice flickering and experience eyestrain at the stated brightness setting and below. In comparison: 52 % of all tested devices do not use PWM to dim the display. If PWM was detected, an average of 7757 (minimum: 5 - maximum: 343500) Hz was measured. | |||
| Cinebench R15 | |
| CPU Single 64Bit | |
| MSI GT80S 6QF | |
| MSI GT83VR-6RE32SR451 | |
| Schenker XMG U727 | |
| Asus G752VS-XB78K | |
| Eurocom Sky X7E2 | |
| CPU Multi 64Bit | |
| MSI GT80S 6QF | |
| Eurocom Sky X7E2 | |
| MSI GT83VR-6RE32SR451 | |
| Schenker XMG U727 | |
| Asus G752VS-XB78K | |
| Cinebench R11.5 | |
| CPU Single 64Bit | |
| MSI GT80S 6QF | |
| MSI GT83VR-6RE32SR451 | |
| Schenker XMG U727 | |
| Asus G752VS-XB78K | |
| Eurocom Sky X7E2 | |
| CPU Multi 64Bit | |
| MSI GT80S 6QF | |
| MSI GT83VR-6RE32SR451 | |
| Schenker XMG U727 | |
| Asus G752VS-XB78K | |
| Eurocom Sky X7E2 | |
| PCMark 7 Score | 7551 points | |
| PCMark 8 Home Score Accelerated v2 | 5332 points | |
| PCMark 8 Work Score Accelerated v2 | 5624 points | |
Help | ||
| PCMark 8 | |
| Home Score Accelerated v2 | |
| Asus G752VS-XB78K | |
| MSI GT83VR-6RE32SR451 | |
| Eurocom Sky X7E2 | |
| Schenker XMG U727 | |
| Work Score Accelerated v2 | |
| Asus G752VS-XB78K | |
| MSI GT83VR-6RE32SR451 | |
| Eurocom Sky X7E2 | |
| Schenker XMG U727 | |
| PCMark 7 - Score | |
| MSI GT83VR-6RE32SR451 | |
| MSI GT80S 6QF | |
| Asus G752VS-XB78K | |
| Schenker XMG U727 | |
| MSI GT83VR-6RE32SR451 2x Samsung SM951 MZVPV256HDGL (RAID 0) | Schenker XMG U727 Samsung SSD 950 Pro 512GB m.2 NVMe | MSI GT80S 6QF 2x Samsung SM951 MZVPV256HDGL (RAID 0) | Eurocom Sky X7E2 Samsung SM951 MZVPV512HDGL m.2 PCI-e | Asus G752VS-XB78K Toshiba NVMe THNSN5512GPU7 | |
|---|---|---|---|---|---|
| AS SSD | 3% | -15% | |||
| Seq Read (MB/s) | 2870 | 2892 1% | 1922 -33% | ||
| Seq Write (MB/s) | 2140 | 2408 13% | 1484 -31% | ||
| 4K Read (MB/s) | 45.97 | 44.96 -2% | 46.69 2% | ||
| 4K Write (MB/s) | 120.2 | 109.9 -9% | 119.3 -1% | ||
| Score Total (Points) | 3027 | 3336 10% | 2639 -13% |

| 3DMark Vantage P Result | 56476 points | |
| 3DMark 11 Performance | 24267 points | |
| 3DMark Ice Storm Standard Score | 178954 points | |
| 3DMark Cloud Gate Standard Score | 31696 points | |
| 3DMark Fire Strike Score | 21132 points | |
| 3DMark Time Spy Score | 8781 points | |
Help | ||
| 3DMark | |
| 1920x1080 Fire Strike Graphics | |
| Schenker XMG U727 | |
| MSI GT83VR-6RE32SR451 | |
| MSI GT80S 6QF | |
| Eurocom Sky X7E2 | |
| Asus G752VS-XB78K | |
| 2560x1440 Time Spy Graphics | |
| Schenker XMG U727 | |
| MSI GT83VR-6RE32SR451 | |
| Asus G752VS-XB78K | |
| 3DMark 11 - 1280x720 Performance GPU | |
| Schenker XMG U727 | |
| MSI GT83VR-6RE32SR451 | |
| MSI GT80S 6QF | |
| Eurocom Sky X7E2 | |
| Asus G752VS-XB78K | |
| Unigine Heaven 4.0 - Extreme Preset DX11 | |
| Schenker XMG U727 | |
| MSI GT83VR-6RE32SR451 | |
| MSI GT80S 6QF | |
| Asus G752VS-XB78K | |
| The Division | |
| 3840x2160 High Preset AF:8x | |
| Asus GX800VH Prototype | |
| MSI GT83VR-6RE32SR451 | |
| Asus G800VI Prototype | |
| MSI GT62VR-6RE16H21 | |
| Schenker XMG P507 | |
| 1920x1080 Ultra Preset AF:16x | |
| Asus GX800VH Prototype | |
| MSI GT83VR-6RE32SR451 | |
| Asus G800VI Prototype | |
| MSI GT62VR-6RE16H21 | |
| Schenker XMG P507 | |
| Mirror's Edge Catalyst | |
| 3840x2160 High Preset AF:16x | |
| Asus GX800VH Prototype | |
| MSI GT83VR-6RE32SR451 | |
| Asus G800VI Prototype | |
| MSI GT62VR-6RE16H21 | |
| Schenker XMG P507 | |
| 1920x1080 Ultra Preset AF:16x | |
| Asus G800VI Prototype | |
| Asus GX800VH Prototype | |
| MSI GT83VR-6RE32SR451 | |
| MSI GT62VR-6RE16H21 | |
| Schenker XMG P507 | |
| Overwatch | |
| 3840x2160 High (Render Scale 100 %) AA:SM AF:4x | |
| Asus GX800VH Prototype | |
| MSI GT83VR-6RE32SR451 | |
| Asus G800VI Prototype | |
| MSI GT62VR-6RE16H21 | |
| Schenker XMG P507 | |
| 1920x1080 Epic (Render Scale 100 %) AA:SM AF:16x | |
| MSI GT83VR-6RE32SR451 | |
| Asus GX800VH Prototype | |
| Asus G800VI Prototype | |
| MSI GT62VR-6RE16H21 | |
| Schenker XMG P507 | |
| Doom | |
| 3840x2160 High Preset AA:FX | |
| Asus GX800VH Prototype | |
| MSI GT83VR-6RE32SR451 | |
| Asus G800VI Prototype | |
| MSI GT62VR-6RE16H21 | |
| Schenker XMG P507 | |
| 1920x1080 Ultra Preset AA:SM | |
| MSI GT83VR-6RE32SR451 | |
| Asus G800VI Prototype | |
| Asus GX800VH Prototype | |
| MSI GT62VR-6RE16H21 | |
| Schenker XMG P507 | |
| Need for Speed 2016 | |
| 3840x2160 High / On AA:FX | |
| Asus GX800VH Prototype | |
| MSI GT83VR-6RE32SR451 | |
| Asus G800VI Prototype | |
| MSI GT62VR-6RE16H21 | |
| Schenker XMG P507 | |
| 1920x1080 Ultra / On AA:T | |
| Asus GX800VH Prototype | |
| MSI GT83VR-6RE32SR451 | |
| Asus G800VI Prototype | |
| MSI GT62VR-6RE16H21 | |
| Schenker XMG P507 | |
| Far Cry Primal | |
| 3840x2160 High Preset AA:SM | |
| Asus GX800VH Prototype | |
| MSI GT83VR-6RE32SR451 | |
| Asus G800VI Prototype | |
| MSI GT62VR-6RE16H21 | |
| Schenker XMG P507 | |
| 1920x1080 Ultra Preset AA:SM | |
| Asus G800VI Prototype | |
| MSI GT62VR-6RE16H21 | |
| MSI GT83VR-6RE32SR451 | |
| Asus GX800VH Prototype | |
| Schenker XMG P507 | |
| XCOM 2 | |
| 3840x2160 High Preset AA:FX AF:8x | |
| Asus GX800VH Prototype | |
| MSI GT83VR-6RE32SR451 | |
| Asus G800VI Prototype | |
| MSI GT62VR-6RE16H21 | |
| Schenker XMG P507 | |
| 1920x1080 Maximum Preset (8xMSAA instead of FXAA) AA:8xMS AF:16x | |
| Asus GX800VH Prototype | |
| MSI GT83VR-6RE32SR451 | |
| Asus G800VI Prototype | |
| MSI GT62VR-6RE16H21 | |
| Schenker XMG P507 | |
| Rise of the Tomb Raider | |
| 3840x2160 High Preset AA:FX AF:4x | |
| Asus GX800VH Prototype | |
| MSI GT83VR-6RE32SR451 | |
| Asus G800VI Prototype | |
| MSI GT62VR-6RE16H21 | |
| Schenker XMG P507 | |
| 1920x1080 Very High Preset AA:FX AF:16x | |
| Asus G800VI Prototype | |
| MSI GT62VR-6RE16H21 | |
| Asus GX800VH Prototype | |
| MSI GT83VR-6RE32SR451 | |
| Schenker XMG P507 | |
| Just Cause 3 | |
| 3840x2160 High / On AA:FX AF:8x | |
| Asus G800VI Prototype | |
| Asus GX800VH Prototype | |
| Schenker XMG P507 | |
| 1920x1080 Very High / On AA:SM AF:16x | |
| Asus GX800VH Prototype | |
| MSI GT83VR-6RE32SR451 | |
| Asus G800VI Prototype | |
| MSI GT62VR-6RE16H21 | |
| MSI GT80S 6QF | |
| Schenker XMG P507 | |
| Rainbow Six Siege | |
| 3840x2160 High Preset AA:T AF:4x | |
| Asus G800VI Prototype | |
| MSI GT62VR-6RE16H21 | |
| Asus GX800VH Prototype | |
| MSI GT83VR-6RE32SR451 | |
| MSI GT80S 6QF | |
| Schenker XMG P507 | |
| 1920x1080 Ultra Preset AA:T AF:16x | |
| Asus G800VI Prototype | |
| MSI GT62VR-6RE16H21 | |
| Asus GX800VH Prototype | |
| MSI GT83VR-6RE32SR451 | |
| MSI GT80S 6QF | |
| Schenker XMG P507 | |
| Assassin's Creed Syndicate | |
| 3840x2160 High Preset AA:FX | |
| MSI GT83VR-6RE32SR451 | |
| Asus GX800VH Prototype | |
| Asus G800VI Prototype | |
| MSI GT80S 6QF | |
| MSI GT62VR-6RE16H21 | |
| Schenker XMG P507 | |
| 1920x1080 Ultra High Preset AA:4x MSAA + FX | |
| Asus GX800VH Prototype | |
| MSI GT83VR-6RE32SR451 | |
| Asus G800VI Prototype | |
| MSI GT62VR-6RE16H21 | |
| MSI GT80S 6QF | |
| Schenker XMG P507 | |
| Star Wars Battlefront | |
| 3840x2160 High Preset AA:FX | |
| Asus GX800VH Prototype | |
| MSI GT83VR-6RE32SR451 | |
| Asus G800VI Prototype | |
| MSI GT80S 6QF | |
| MSI GT62VR-6RE16H21 | |
| Schenker XMG P507 | |
| 1920x1080 Ultra Preset AA:FX | |
| MSI GT83VR-6RE32SR451 | |
| Asus GX800VH Prototype | |
| Asus G800VI Prototype | |
| MSI GT62VR-6RE16H21 | |
| MSI GT80S 6QF | |
| Schenker XMG P507 | |
| Fallout 4 | |
| 3840x2160 High Preset AA:T AF:16x | |
| Asus GX800VH Prototype | |
| MSI GT83VR-6RE32SR451 | |
| MSI GT80S 6QF | |
| Asus G800VI Prototype | |
| MSI GT62VR-6RE16H21 | |
| Schenker XMG P507 | |
| 1920x1080 Ultra Preset AA:T AF:16x | |
| MSI GT83VR-6RE32SR451 | |
| MSI GT80S 6QF | |
| Asus GX800VH Prototype | |
| Asus G800VI Prototype | |
| MSI GT62VR-6RE16H21 | |
| Schenker XMG P507 | |
| Call of Duty: Black Ops 3 | |
| 3840x2160 High / On AA:FX | |
| Asus GX800VH Prototype | |
| MSI GT83VR-6RE32SR451 | |
| MSI GT80S 6QF | |
| Asus G800VI Prototype | |
| MSI GT62VR-6RE16H21 | |
| Schenker XMG P507 | |
| 1920x1080 Extra / On AA:T2x SM | |
| MSI GT80S 6QF | |
| Asus G800VI Prototype | |
| Asus GX800VH Prototype | |
| MSI GT83VR-6RE32SR451 | |
| MSI GT62VR-6RE16H21 | |
| Schenker XMG P507 | |
| Anno 2205 | |
| 3840x2160 High Preset AA:4x | |
| Asus GX800VH Prototype | |
| Asus G800VI Prototype | |
| MSI GT83VR-6RE32SR451 | |
| MSI GT62VR-6RE16H21 | |
| MSI GT80S 6QF | |
| Schenker XMG P507 | |
| 1920x1080 Ultra High Preset AA:8x | |
| Asus GX800VH Prototype | |
| Asus G800VI Prototype | |
| MSI GT83VR-6RE32SR451 | |
| MSI GT62VR-6RE16H21 | |
| MSI GT80S 6QF | |
| Schenker XMG P507 | |
| Mad Max | |
| 3840x2160 High Preset AF:6x | |
| Asus GX800VH Prototype | |
| Asus G800VI Prototype | |
| Schenker XMG P507 | |
| 1920x1080 Very High Preset AF:12x | |
| MSI GT83VR-6RE32SR451 | |
| Asus GX800VH Prototype | |
| MSI GT80S 6QF | |
| Asus G800VI Prototype | |
| MSI GT62VR-6RE16H21 | |
| Schenker XMG P507 | |
| Batman: Arkham Knight | |
| 3840x2160 High / On (Interactive Smoke & Paper Debris Off) AA:SM AF:8x | |
| Asus GX800VH Prototype | |
| Asus G800VI Prototype | |
| MSI GT83VR-6RE32SR451 | |
| MSI GT62VR-6RE16H21 | |
| MSI GT80S 6QF | |
| Schenker XMG P507 | |
| 1920x1080 High / On AA:SM AF:16x | |
| Asus G800VI Prototype | |
| Asus GX800VH Prototype | |
| MSI GT83VR-6RE32SR451 | |
| MSI GT62VR-6RE16H21 | |
| MSI GT80S 6QF | |
| Schenker XMG P507 | |
| The Witcher 3 | |
| 3840x2160 High Graphics & Postprocessing (Nvidia HairWorks Off) | |
| Asus GX800VH Prototype | |
| MSI GT83VR-6RE32SR451 | |
| MSI GT80S 6QF | |
| Asus G800VI Prototype | |
| MSI GT62VR-6RE16H21 | |
| Schenker XMG P507 | |
| 1920x1080 Ultra Graphics & Postprocessing (HBAO+) | |
| Asus GX800VH Prototype | |
| MSI GT83VR-6RE32SR451 | |
| Asus G800VI Prototype | |
| MSI GT80S 6QF | |
| MSI GT62VR-6RE16H21 | |
| Schenker XMG P507 | |
| Dirt Rally | |
| 3840x2160 High Preset | |
| MSI GT83VR-6RE32SR451 | |
| Asus GX800VH Prototype | |
| Asus G800VI Prototype | |
| MSI GT80S 6QF | |
| Schenker XMG P507 | |
| 1920x1080 Ultra Preset AA:4x MS | |
| MSI GT83VR-6RE32SR451 | |
| Asus GX800VH Prototype | |
| Asus G800VI Prototype | |
| MSI GT80S 6QF | |
| Schenker XMG P507 | |
| MSI GT62VR-6RE16H21 | |
| Dragon Age: Inquisition - 1920x1080 Ultra Graphics Quality AA:2x MS | |
| Asus GX800VH Prototype | |
| MSI GT83VR-6RE32SR451 | |
| MSI GT80S 6QF | |
| Asus G800VI Prototype | |
| MSI GT62VR-6RE16H21 | |
| Schenker XMG P507 | |
| Alien: Isolation - 1920x1080 Ultra, On, Shadow Map 2048, HDAO AA:2x SM AF:16x | |
| Asus GX800VH Prototype | |
| Asus G800VI Prototype | |
| MSI GT83VR-6RE32SR451 | |
| MSI GT80S 6QF | |
| MSI GT62VR-6RE16H21 | |
| Schenker XMG P507 | |
| low | med. | high | ultra | 4K | |
|---|---|---|---|---|---|
| Alien: Isolation (2014) | 199 | 190 | |||
| Dragon Age: Inquisition (2014) | 159 | 138 | |||
| Dirt Rally (2015) | 170 | 168 | 163 | ||
| The Witcher 3 (2015) | 169 | 103 | 74.6 | ||
| Batman: Arkham Knight (2015) | 134 | 89 | 48 | ||
| Mad Max (2015) | 265 | 262 | |||
| Anno 2205 (2015) | 111 | 49.8 | 54.8 | ||
| Call of Duty: Black Ops 3 (2015) | 140 | 121 | 87.9 | ||
| Fallout 4 (2015) | 141 | 137 | 82.3 | ||
| Star Wars Battlefront (2015) | 198 | 196 | 106 | ||
| Assassin's Creed Syndicate (2015) | 87.7 | 75.3 | 74.1 | ||
| Rainbow Six Siege (2015) | 176 | 160 | 60.7 | ||
| Just Cause 3 (2015) | 129 | 115 | |||
| Rise of the Tomb Raider (2016) | 80.9 | 79.8 | 67.7 | ||
| XCOM 2 (2016) | 103 | 82.3 | 53.1 | ||
| Far Cry Primal (2016) | 78 | 72 | 69 | ||
| The Division (2016) | 128 | 113 | 67.4 | ||
| Need for Speed 2016 (2016) | 99.3 | 85.7 | 84 | ||
| Doom (2016) | 158 | 152 | 74.1 | ||
| Overwatch (2016) | 294 | 293 | 177 | ||
| Mirror's Edge Catalyst (2016) | 102 | 97.4 | 53.9 | ||
| No Man's Sky (2016) | 146 | 77.4 | 74.7 | ||
| Deus Ex Mankind Divided (2016) | 73.9 | 56.1 | |||
| FIFA 17 (2016) | 293 | 286 | 174 | ||
| Mafia 3 (2016) | 54 | 21.3 |
Noise level
| Idle |
| 33 / 34 / 35 dB(A) |
| DVD |
| 36 / dB(A) |
| Load |
| 48 / 57 dB(A) |
 | ||
30 dB silent 40 dB(A) audible 50 dB(A) loud |
||
min: | ||
| MSI GT83VR-6RE32SR451 GeForce GTX 1070 SLI (Laptop), 6820HK | Schenker XMG U727 GeForce GTX 1080 SLI (Laptop), 6700 | MSI GT80S 6QF GeForce GTX 980 SLI (Laptop), 6820HK | Eurocom Sky X7E2 GeForce GTX 1080 Mobile, 6700K | Asus G752VS-XB78K GeForce GTX 1070 Mobile, 6820HK | |
|---|---|---|---|---|---|
| Noise | -0% | -7% | 4% | 9% | |
| off / environment * (dB) | 30 | 30 -0% | 28.9 4% | 30 -0% | |
| Idle Minimum * (dB) | 33 | 33 -0% | 34 -3% | 28.9 12% | 31 6% |
| Idle Average * (dB) | 34 | 35 -3% | 36 -6% | 30.6 10% | 32 6% |
| Idle Maximum * (dB) | 35 | 40 -14% | 40 -14% | 35.7 -2% | 33 6% |
| Load Average * (dB) | 48 | 44 8% | 51 -6% | 49 -2% | 40 17% |
| Load Maximum * (dB) | 57 | 53 7% | 60 -5% | 55 4% | 47 18% |
* ... smaller is better
(+) The maximum temperature on the upper side is 35.8 °C / 96 F, compared to the average of 40.4 °C / 105 F, ranging from 21.2 to 68.8 °C for the class Gaming.
(±) The bottom heats up to a maximum of 42.8 °C / 109 F, compared to the average of 43.2 °C / 110 F
(+) In idle usage, the average temperature for the upper side is 23.2 °C / 74 F, compared to the device average of 33.9 °C / 93 F.
(+) The palmrests and touchpad are cooler than skin temperature with a maximum of 21.7 °C / 71.1 F and are therefore cool to the touch.
(+) The average temperature of the palmrest area of similar devices was 28.8 °C / 83.8 F (+7.1 °C / 12.7 F).
| MSI GT83VR-6RE32SR451 GeForce GTX 1070 SLI (Laptop), 6820HK | Schenker XMG U727 GeForce GTX 1080 SLI (Laptop), 6700 | MSI GT80S 6QF GeForce GTX 980 SLI (Laptop), 6820HK | Eurocom Sky X7E2 GeForce GTX 1080 Mobile, 6700K | Asus G752VS-XB78K GeForce GTX 1070 Mobile, 6820HK | |
|---|---|---|---|---|---|
| Heat | -49% | -48% | -41% | -19% | |
| Maximum Upper Side * (°C) | 35.8 | 55.8 -56% | 45.7 -28% | 53.8 -50% | 42.9 -20% |
| Maximum Bottom * (°C) | 42.8 | 63.7 -49% | 61 -43% | 57.6 -35% | 41.5 3% |
| Idle Upper Side * (°C) | 24.7 | 34.7 -40% | 36.4 -47% | 33.6 -36% | 31.6 -28% |
| Idle Bottom * (°C) | 22.8 | 34.7 -52% | 39.2 -72% | 32.2 -41% | 29.5 -29% |
* ... smaller is better
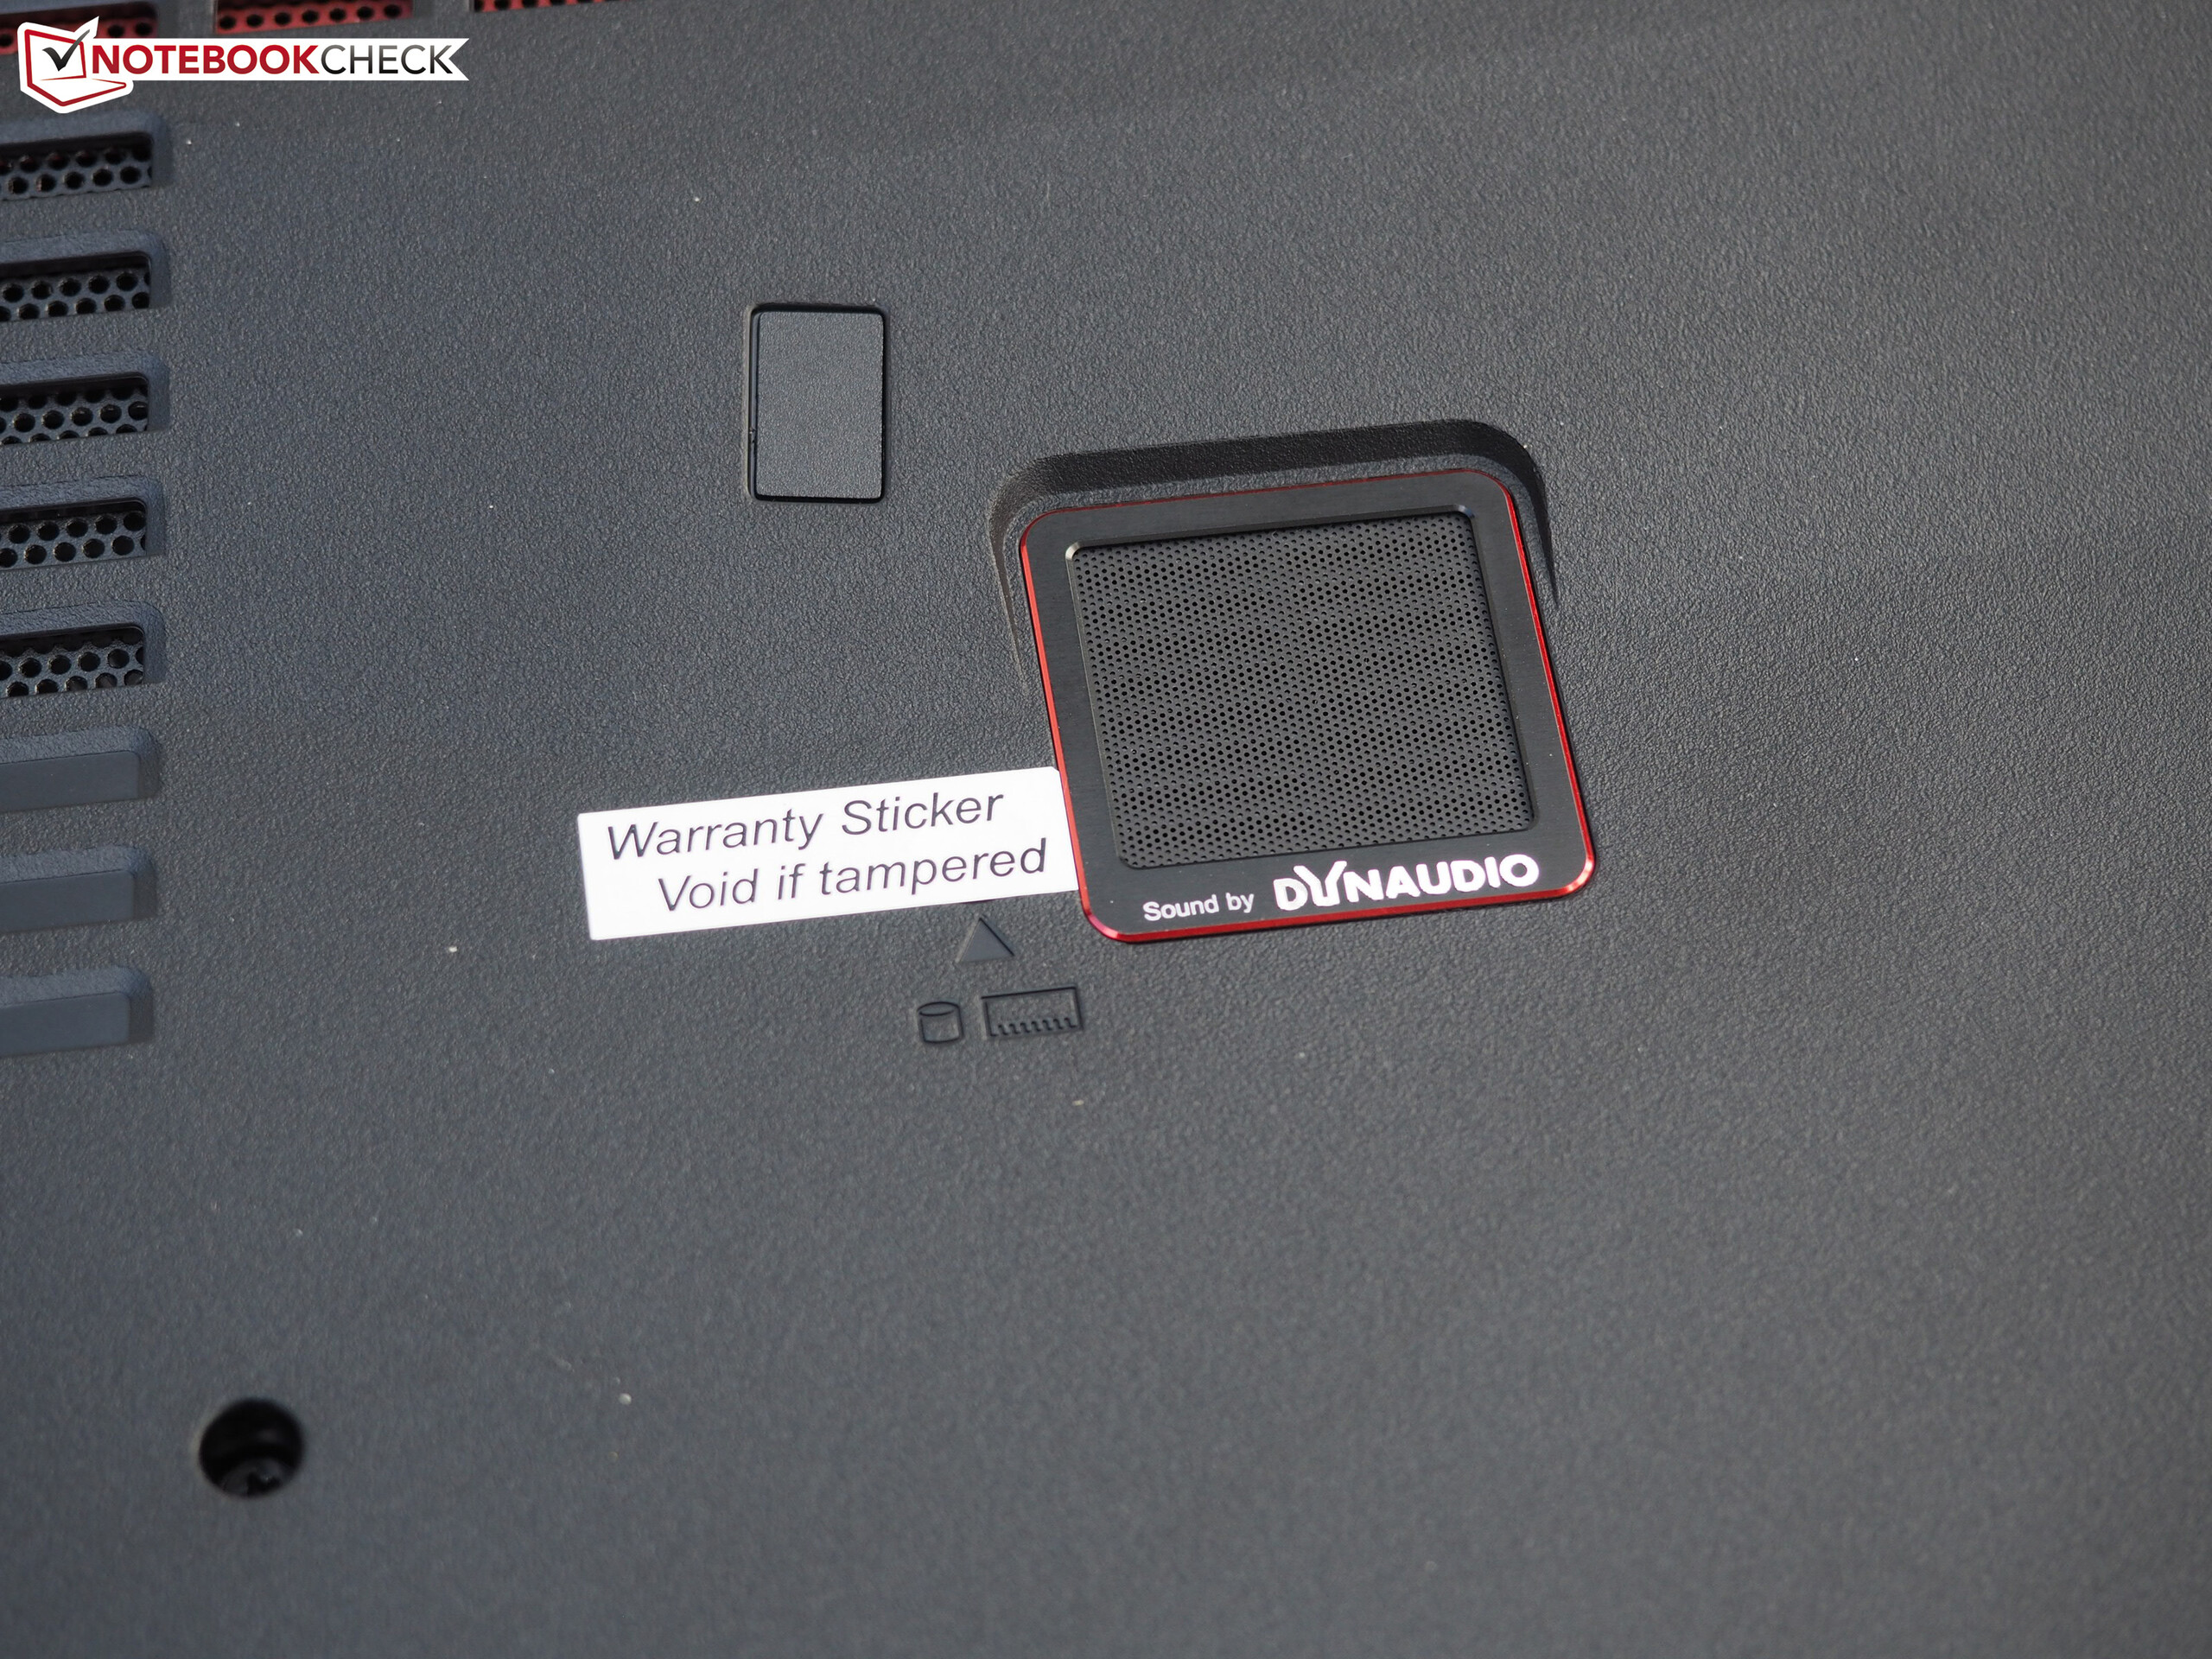
MSI GT83VR-6RE32SR451 audio analysis
(+) | speakers can play relatively loud (82 dB)
Bass 100 - 315 Hz
(±) | reduced bass - on average 13.2% lower than median
(±) | linearity of bass is average (10.9% delta to prev. frequency)
Mids 400 - 2000 Hz
(+) | balanced mids - only 4.8% away from median
(+) | mids are linear (3.8% delta to prev. frequency)
Highs 2 - 16 kHz
(+) | balanced highs - only 1.3% away from median
(+) | highs are linear (2.9% delta to prev. frequency)
Overall 100 - 16.000 Hz
(+) | overall sound is linear (13.9% difference to median)
Compared to same class
» 22% of all tested devices in this class were better, 7% similar, 70% worse
» The best had a delta of 6%, average was 18%, worst was 132%
Compared to all devices tested
» 16% of all tested devices were better, 4% similar, 80% worse
» The best had a delta of 4%, average was 23%, worst was 134%
Schenker XMG U727 audio analysis
(+) | speakers can play relatively loud (87 dB)
Bass 100 - 315 Hz
(±) | reduced bass - on average 9.3% lower than median
(±) | linearity of bass is average (12.4% delta to prev. frequency)
Mids 400 - 2000 Hz
(+) | balanced mids - only 3.7% away from median
(+) | mids are linear (5.3% delta to prev. frequency)
Highs 2 - 16 kHz
(+) | balanced highs - only 1.4% away from median
(+) | highs are linear (4% delta to prev. frequency)
Overall 100 - 16.000 Hz
(+) | overall sound is linear (10.2% difference to median)
Compared to same class
» 5% of all tested devices in this class were better, 2% similar, 93% worse
» The best had a delta of 6%, average was 18%, worst was 132%
Compared to all devices tested
» 5% of all tested devices were better, 1% similar, 94% worse
» The best had a delta of 4%, average was 23%, worst was 134%
| Off / Standby | |
| Idle | |
| Load |
|
Key:
min: | |
| MSI GT83VR-6RE32SR451 GeForce GTX 1070 SLI (Laptop), 6820HK | Schenker XMG U727 GeForce GTX 1080 SLI (Laptop), 6700 | MSI GT80S 6QF GeForce GTX 980 SLI (Laptop), 6820HK | Eurocom Sky X7E2 GeForce GTX 1080 Mobile, 6700K | Asus G752VS-XB78K GeForce GTX 1070 Mobile, 6820HK | |
|---|---|---|---|---|---|
| Power Consumption | -25% | -18% | -8% | 34% | |
| Idle Minimum * (Watt) | 32 | 43 -34% | 44 -38% | 34.3 -7% | 24 25% |
| Idle Average * (Watt) | 47 | 53 -13% | 53 -13% | 42.9 9% | 31 34% |
| Idle Maximum * (Watt) | 52 | 64 -23% | 62 -19% | 43.5 16% | 36 31% |
| Load Average * (Watt) | 152 | 185 -22% | 163 -7% | 258 -70% | 94 38% |
| Load Maximum * (Watt) | 366 | 490 -34% | 411 -12% | 329.8 10% | 204 44% |
* ... smaller is better
| MSI GT83VR-6RE32SR451 75 Wh | Schenker XMG U727 89 Wh | MSI GT80S 6QF 75 Wh | Eurocom Sky X7E2 89 Wh | Asus G752VS-XB78K 90 Wh | |
|---|---|---|---|---|---|
| Battery runtime | 16% | 6% | 11% | 80% | |
| Reader / Idle (h) | 2.5 | 2.6 4% | 2.5 0% | 2.3 -8% | 5.2 108% |
| WiFi v1.3 (h) | 2 | 2 0% | 1.7 -15% | 3.5 75% | |
| Load (h) | 0.9 | 1.3 44% | 1 11% | 1.4 56% | 1.4 56% |
| H.264 (h) | 3.1 |
Pros
Cons

就算不看价码的话,微星GT83VR面向的用户群体也很小。
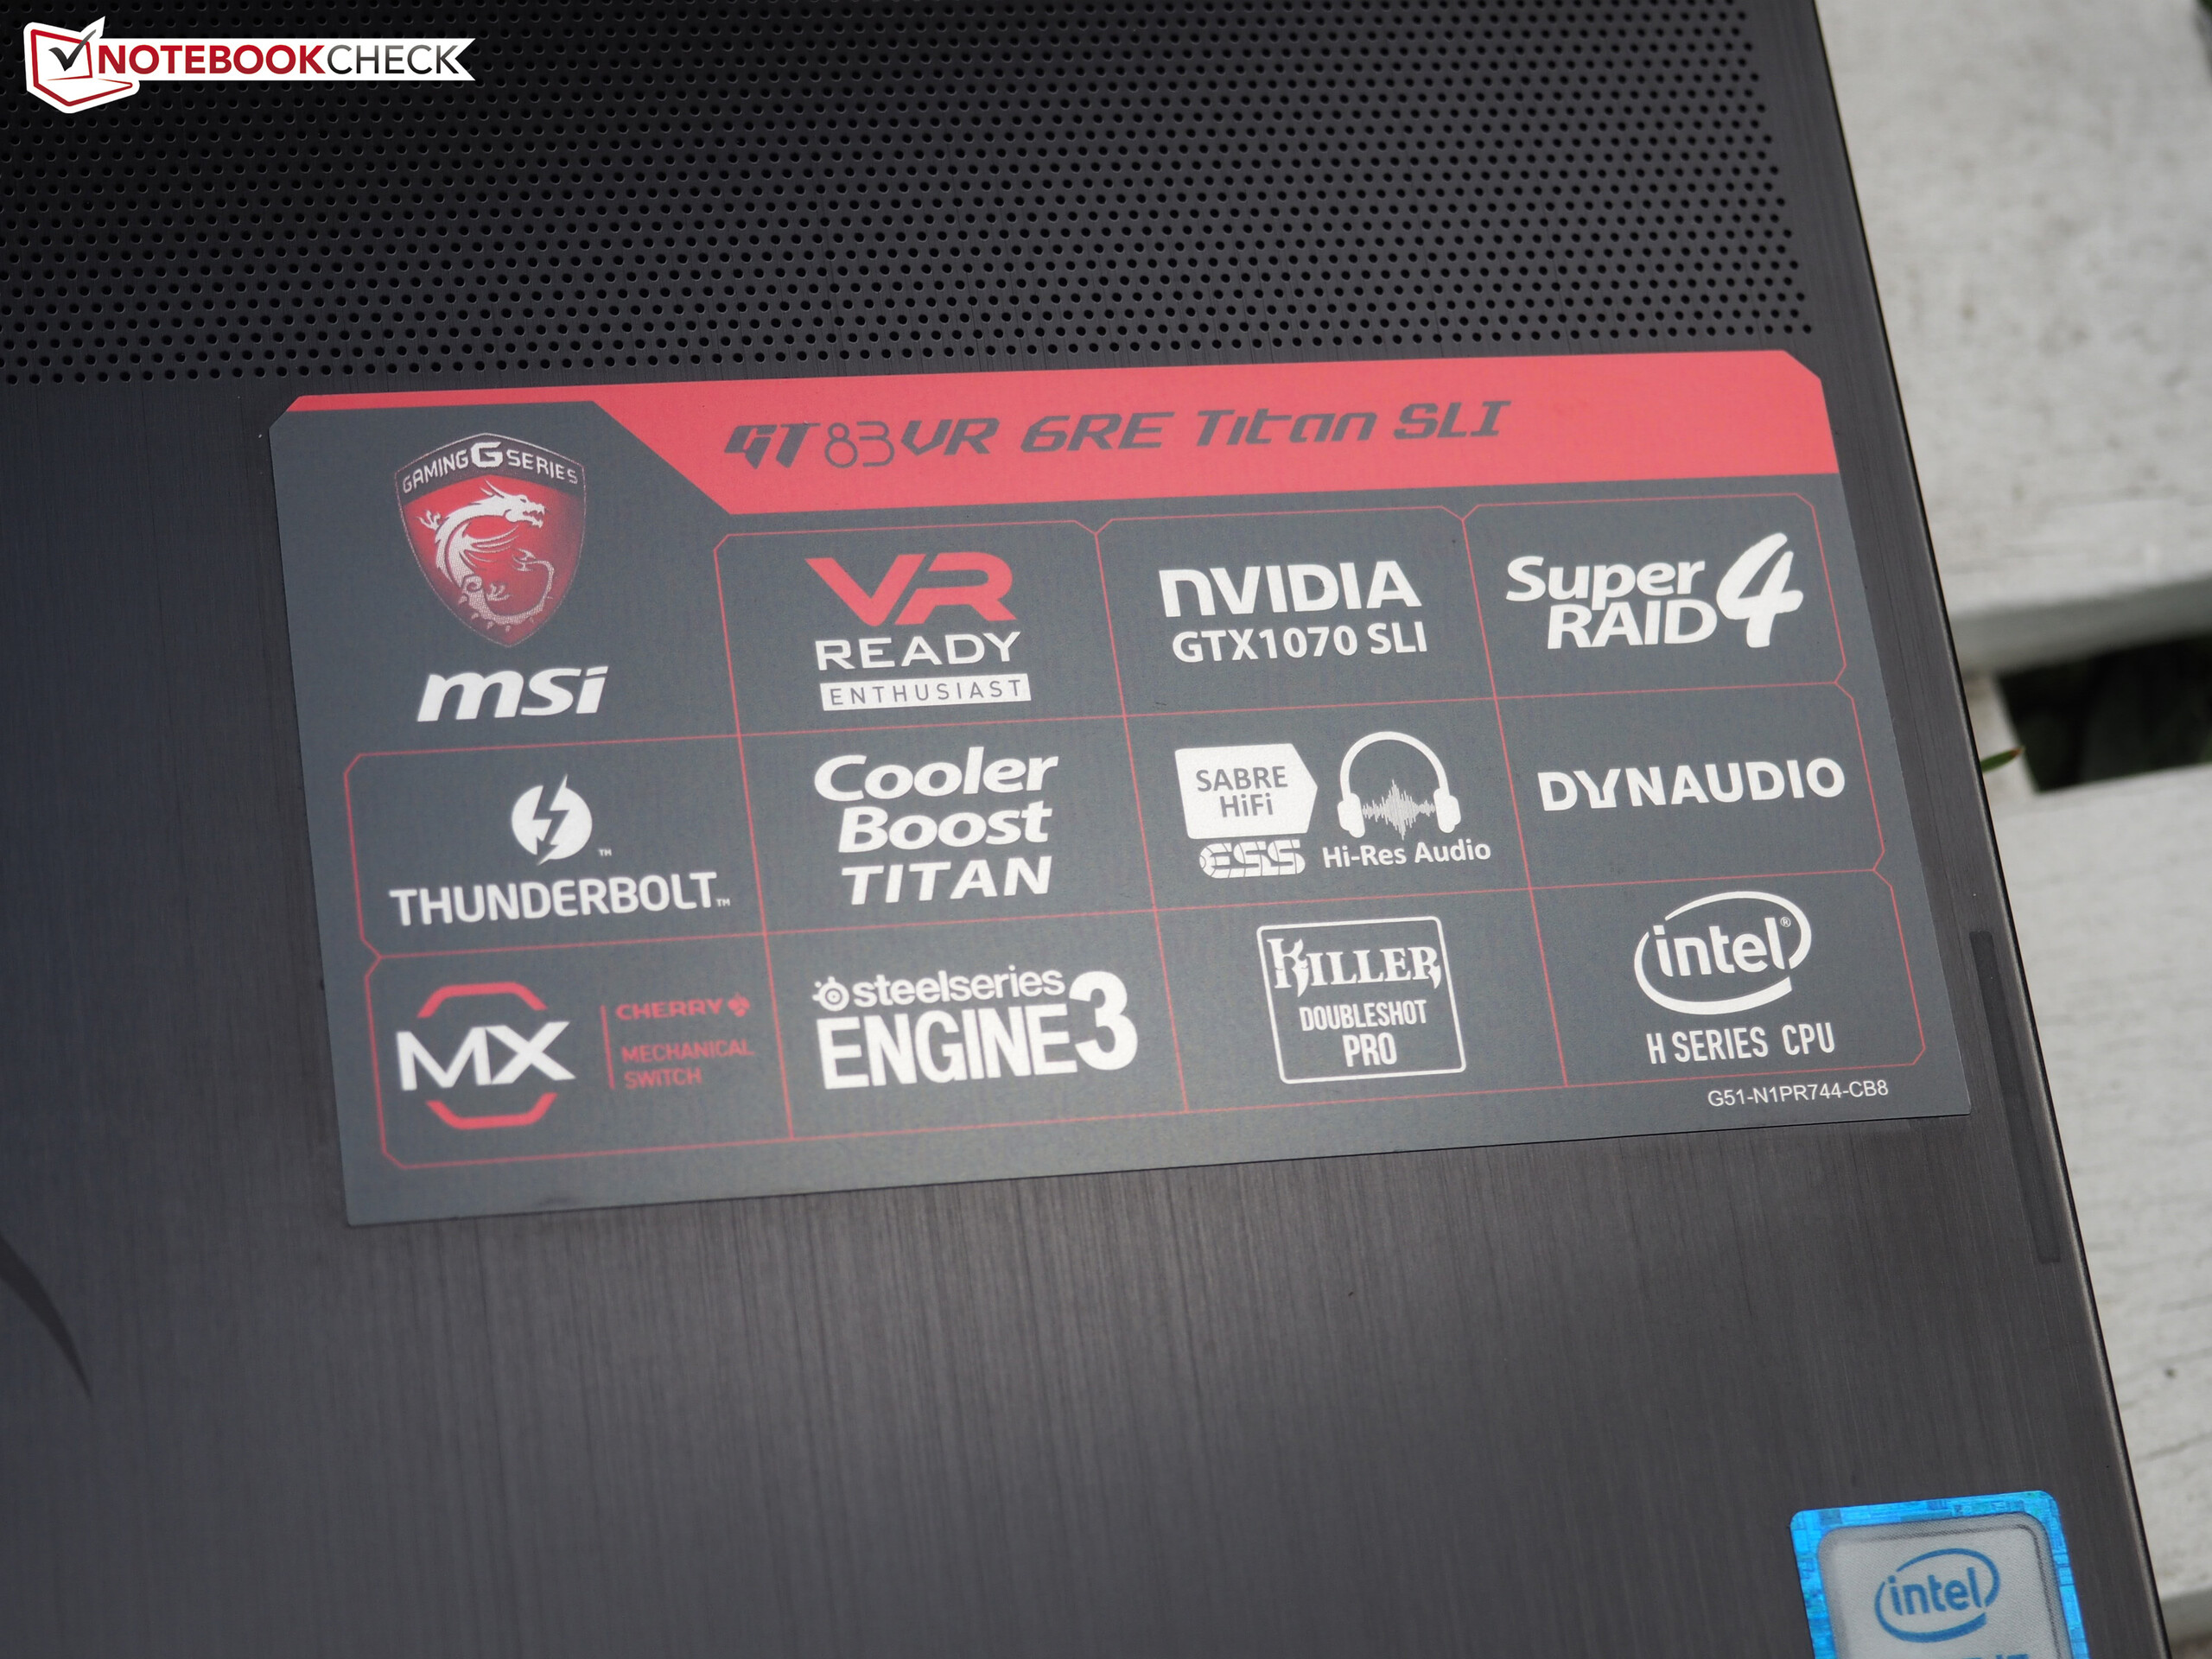
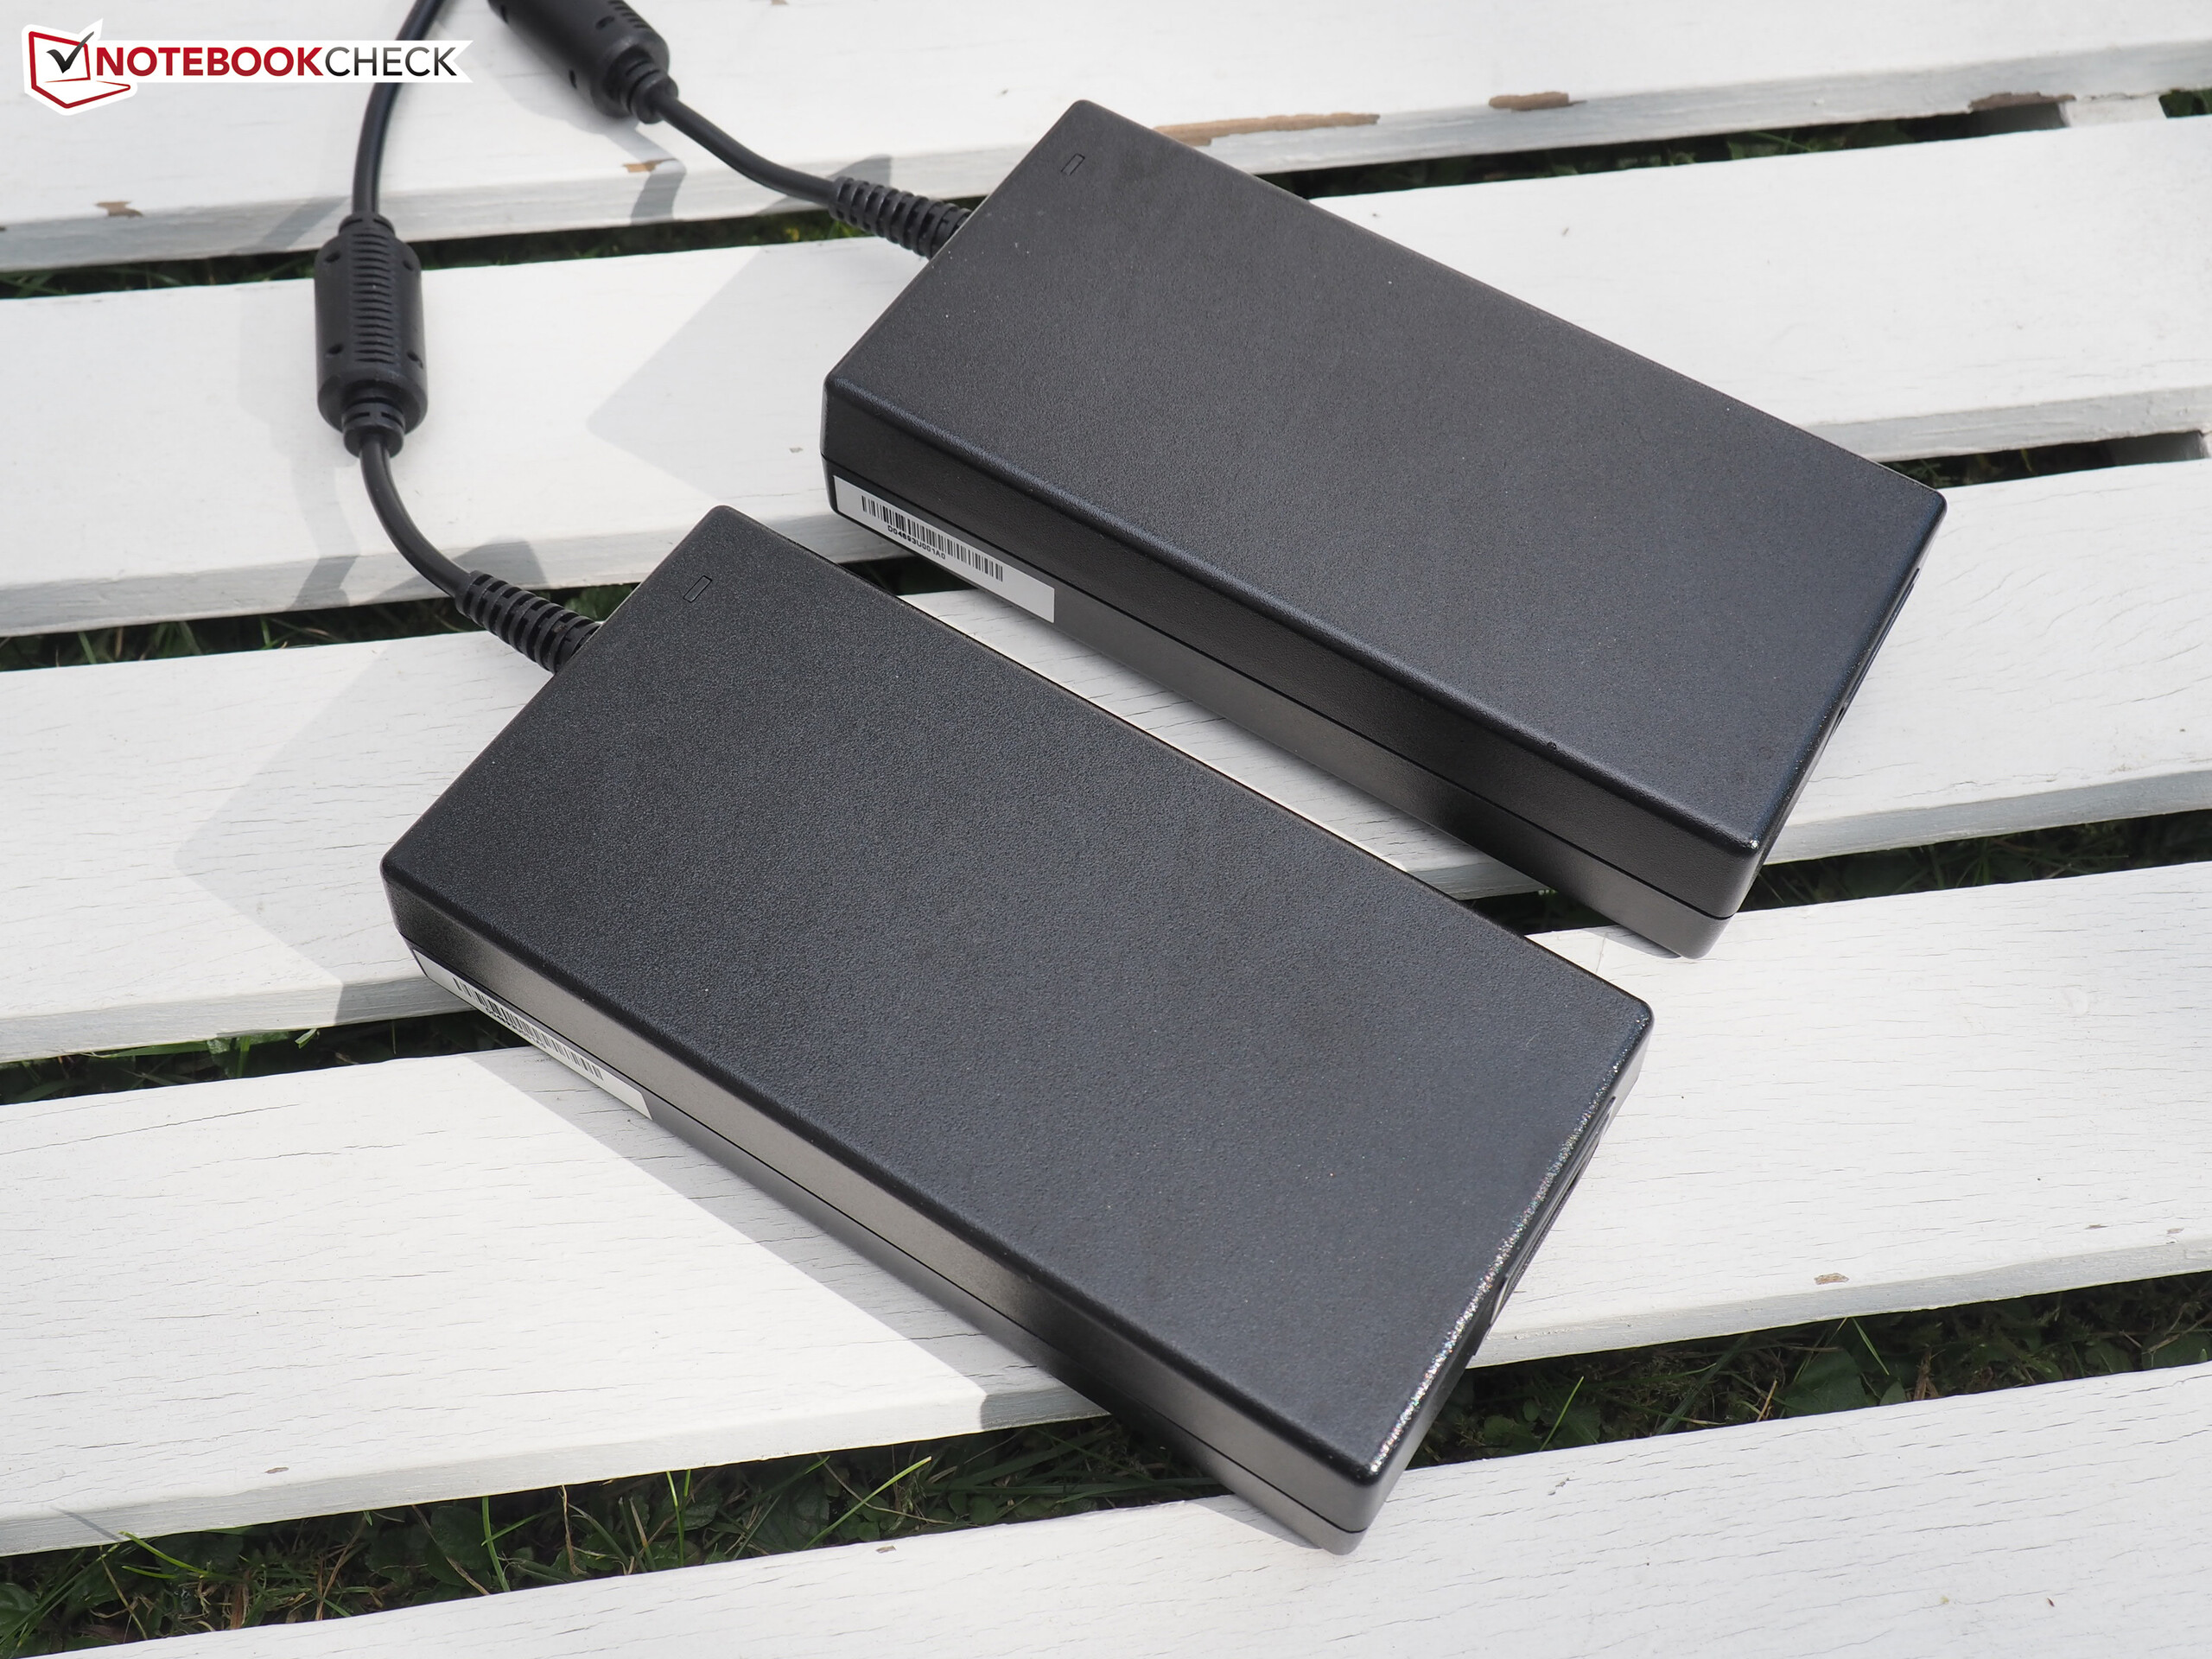
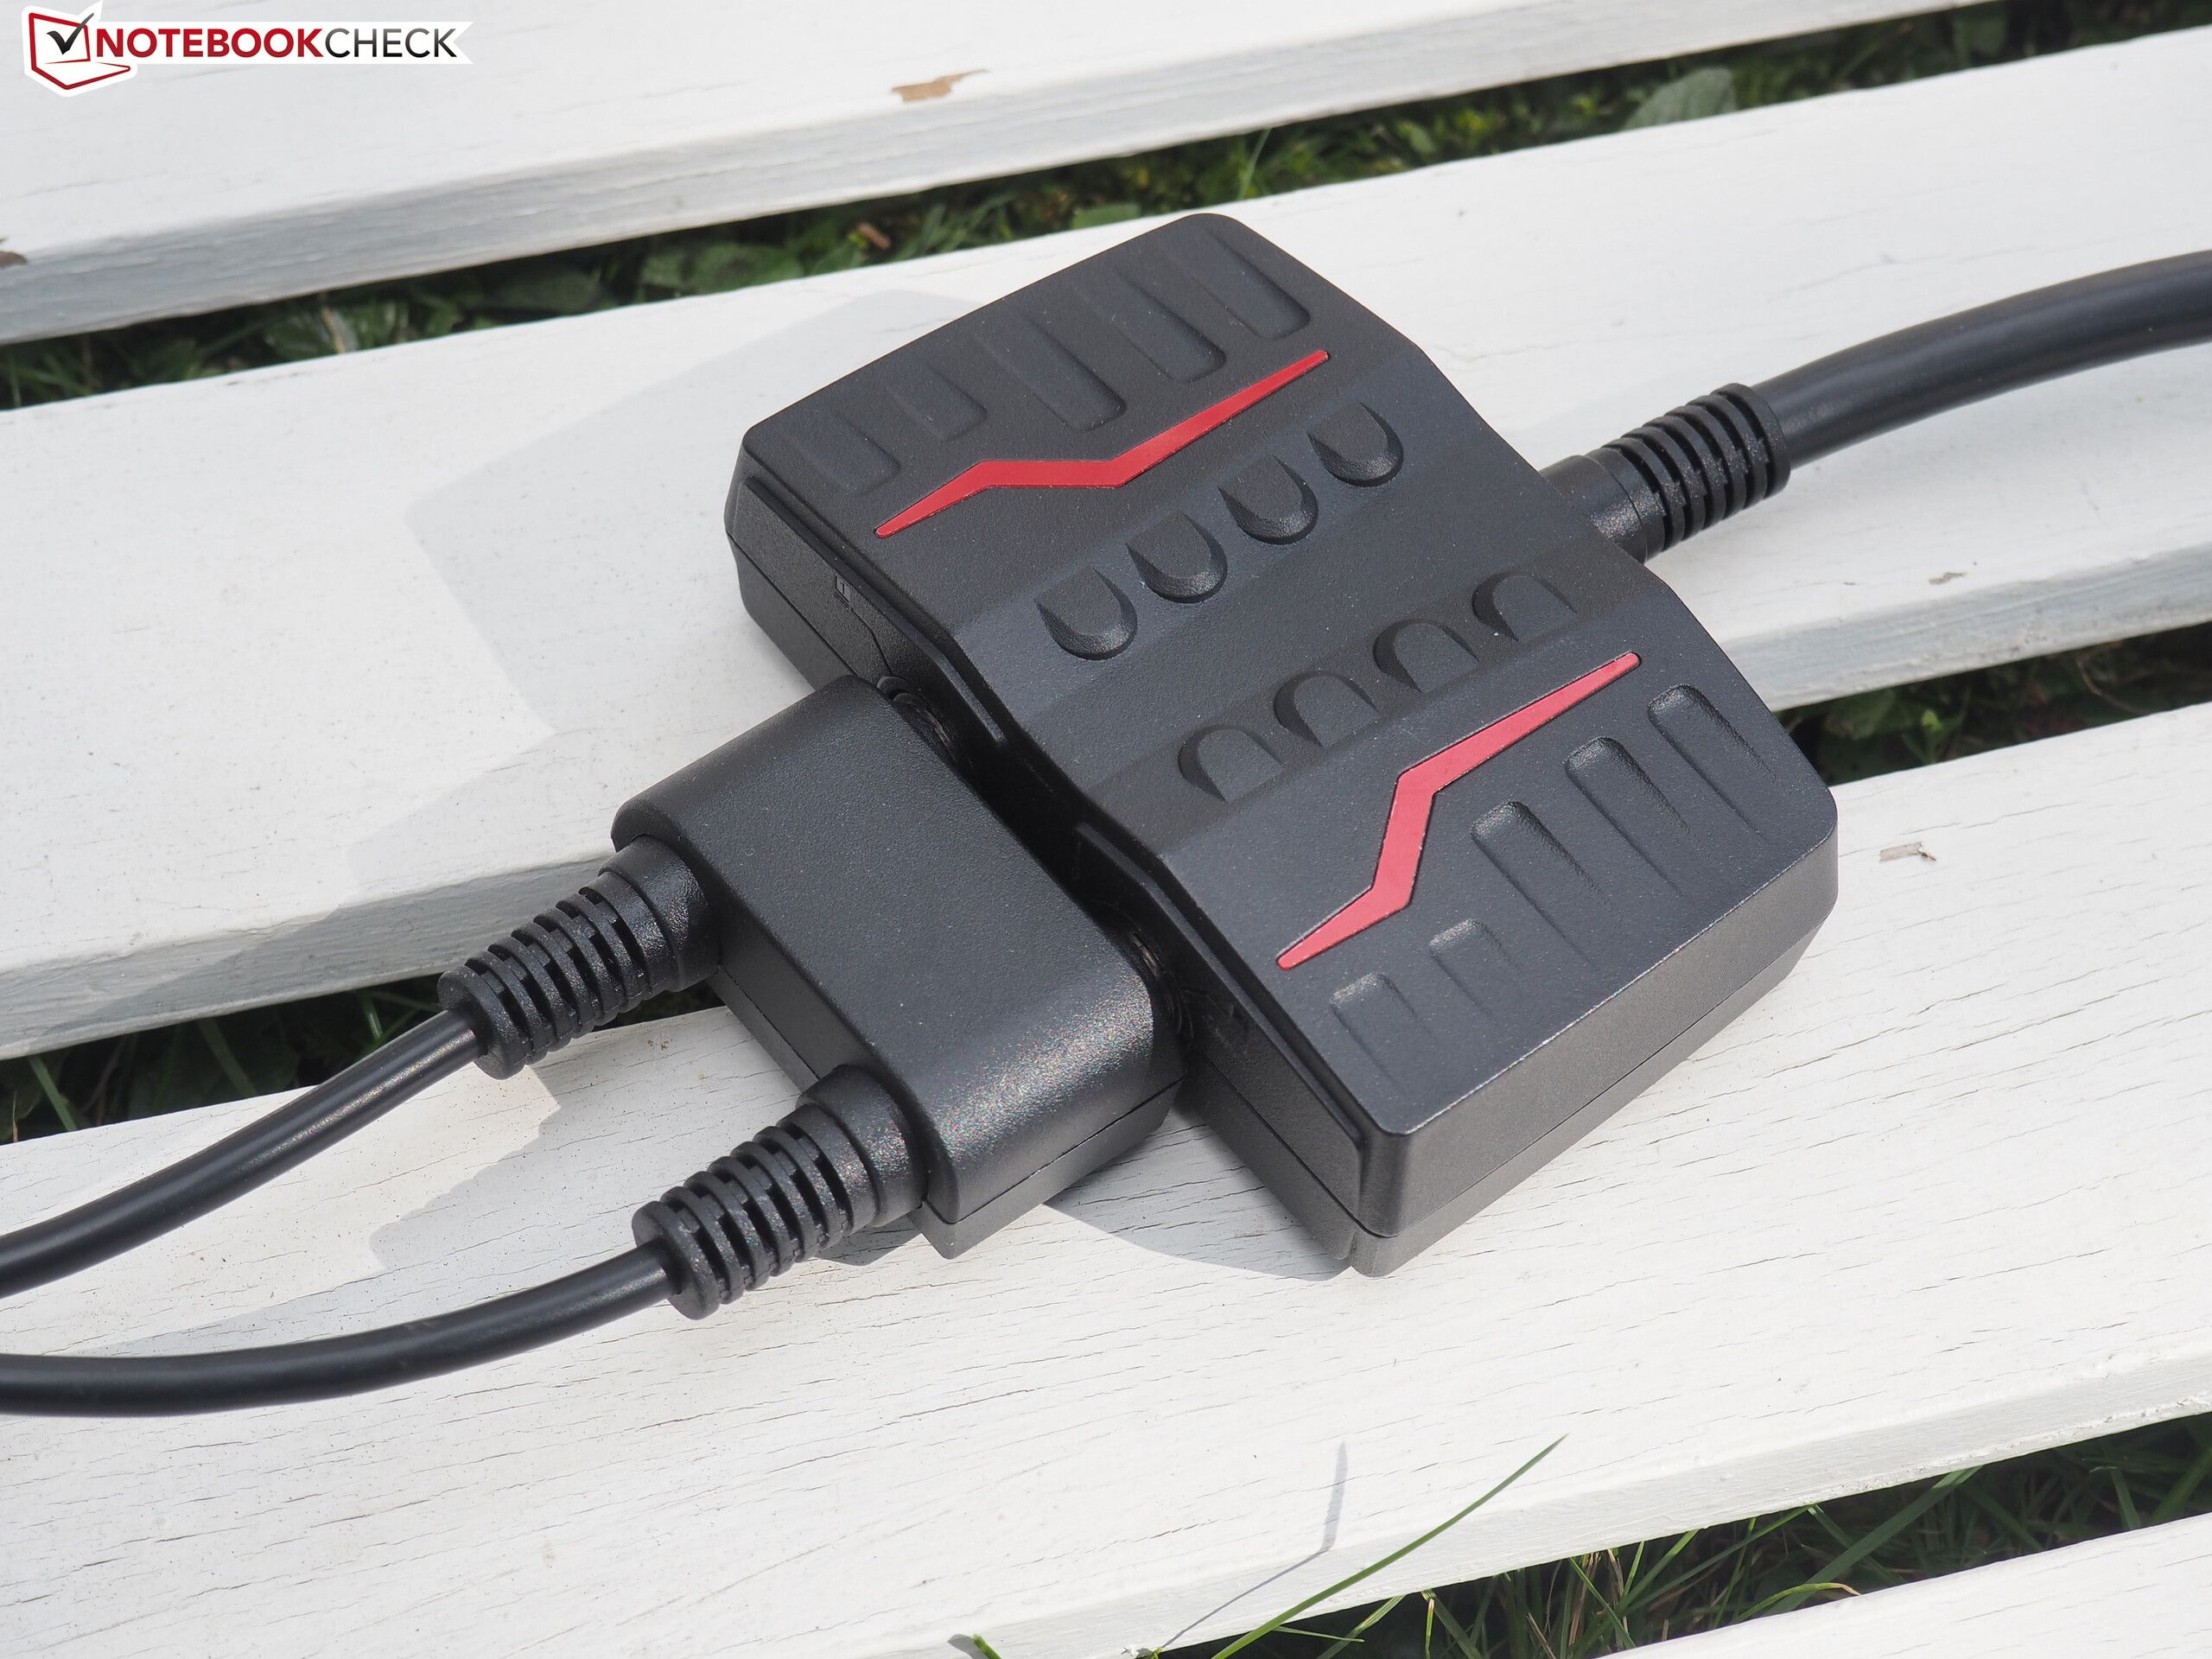
几乎所有游戏玩家都不会对双帕斯卡显卡说不,不过SLI设置也有自己的问题。包括对驱动的依赖,高功耗和更高的风扇噪音:GT83VR对于噪音承受力较低的玩家不太适合。
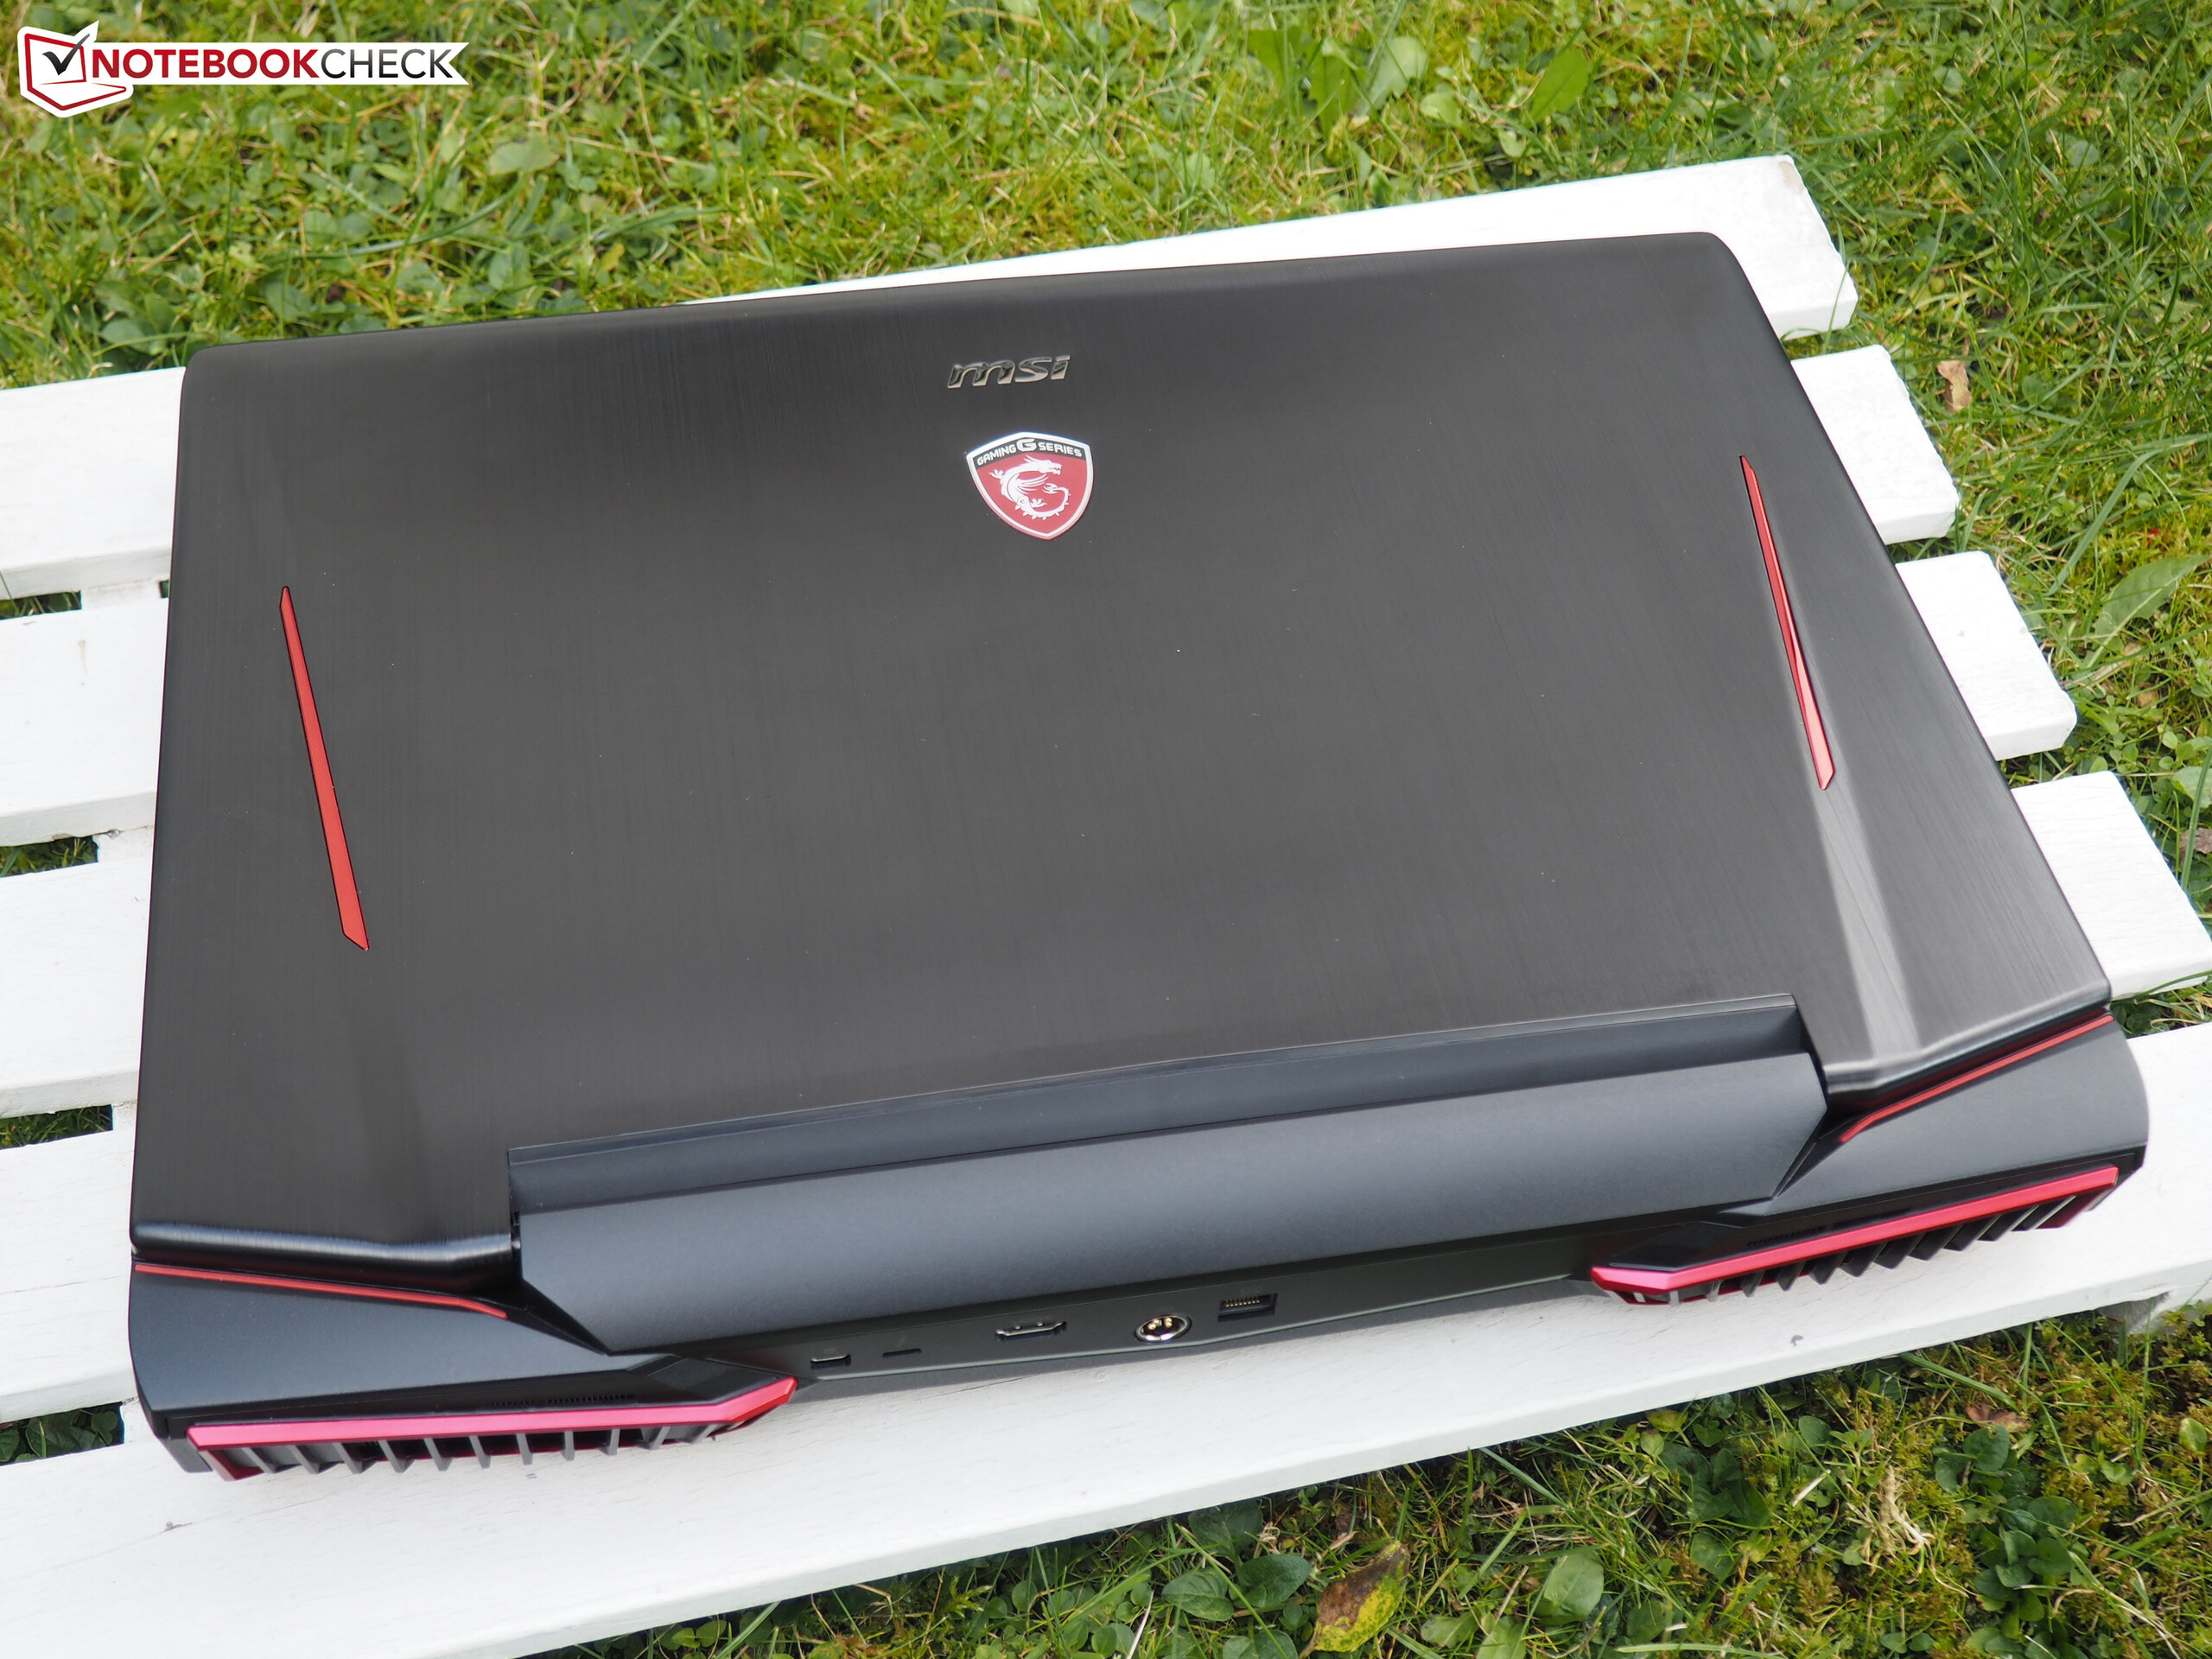
它的便携性也不算优秀。高达5.5千克的重量和7厘米的厚度都刷新了负面记录,“笔记本电脑”这个名字对它来说并不太贴切。
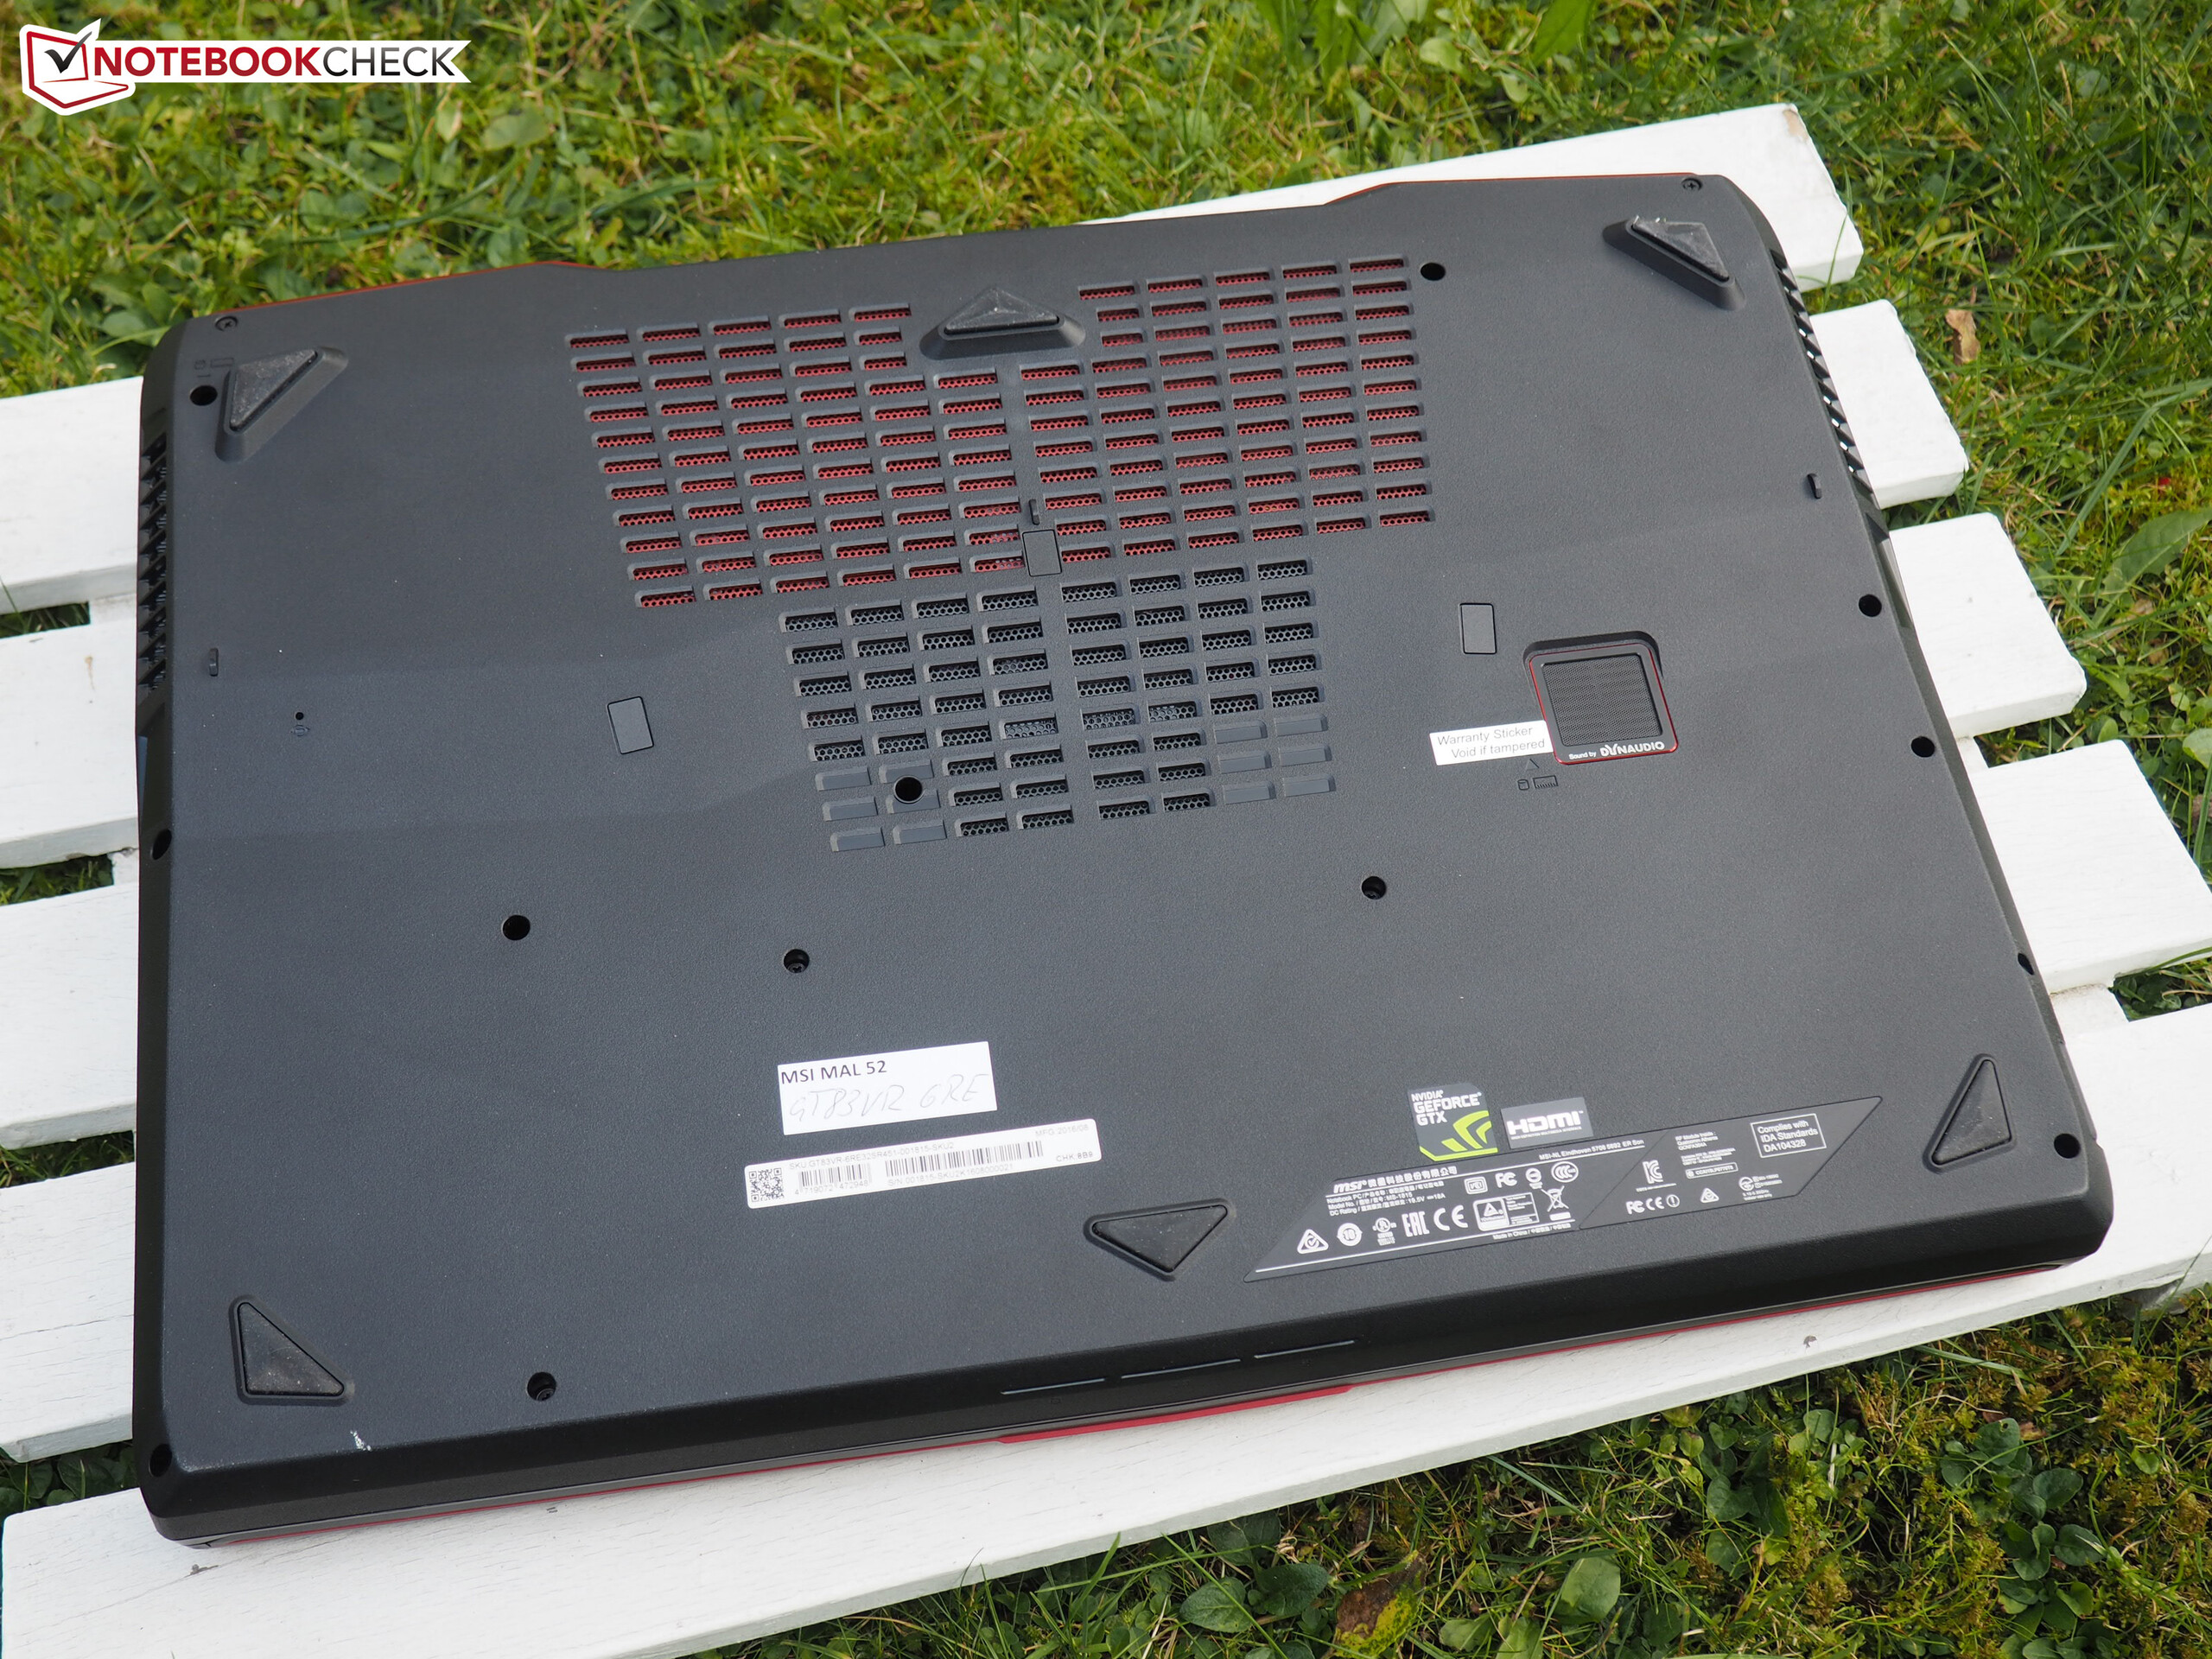
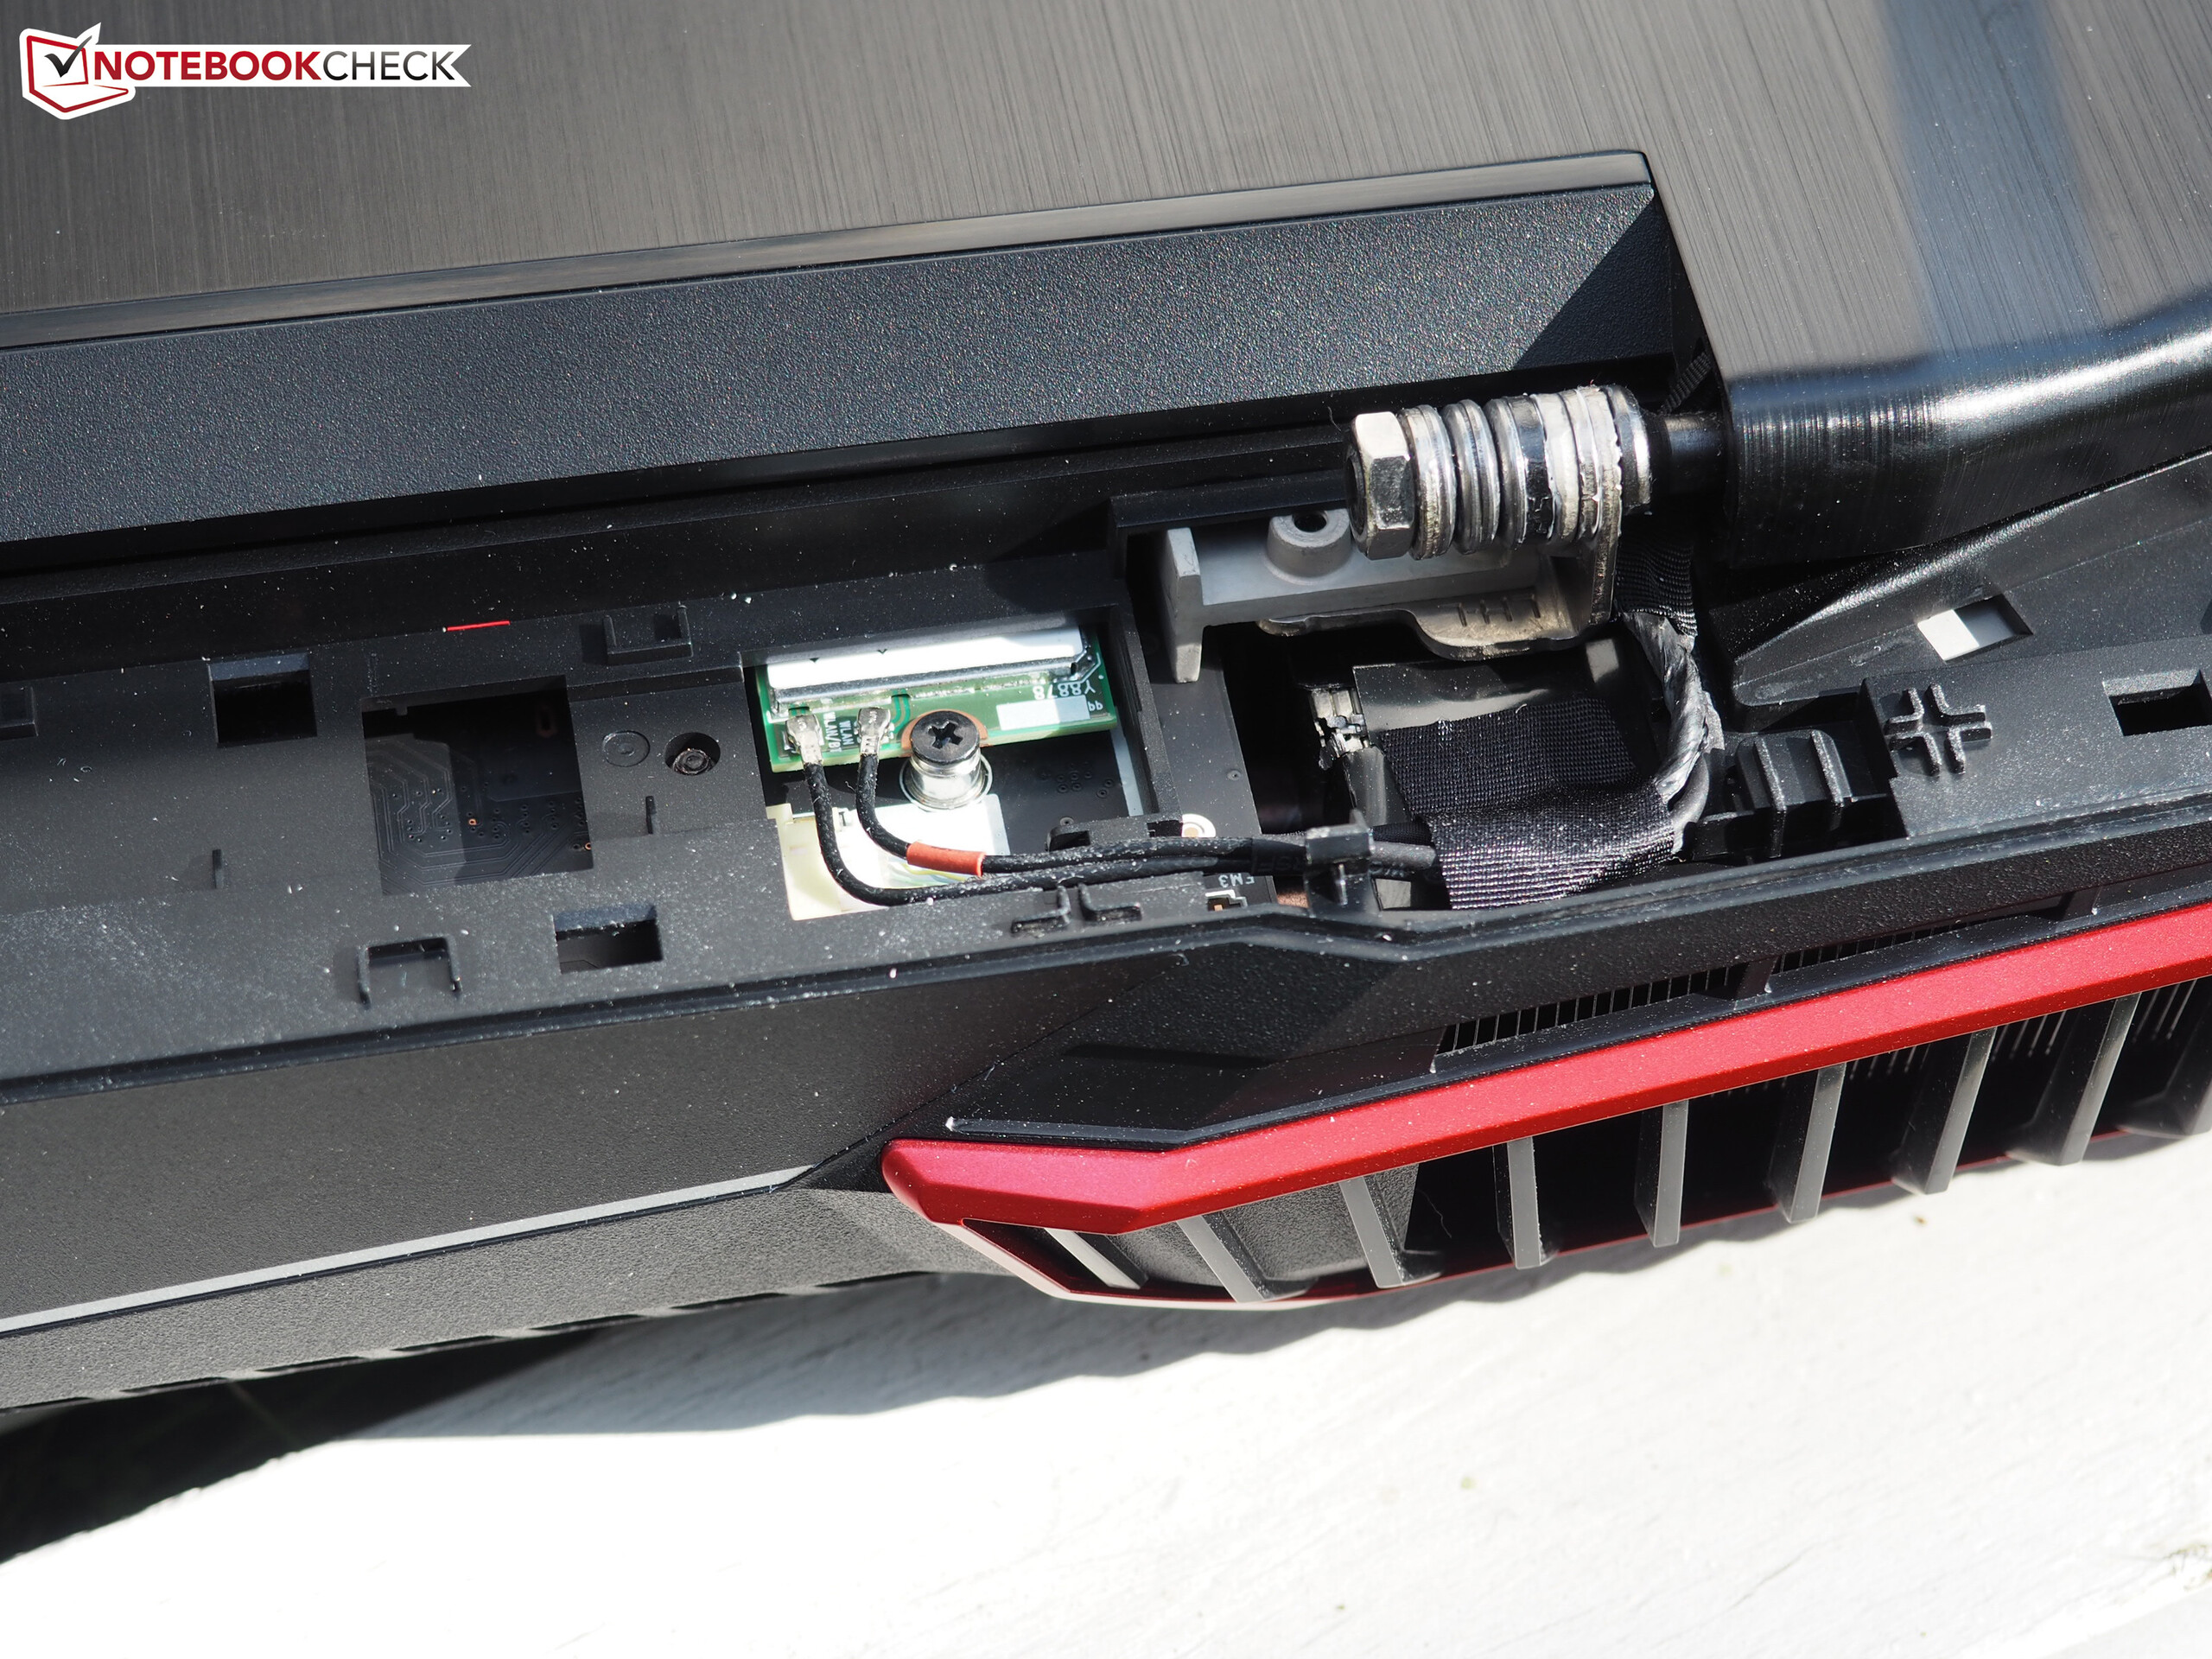
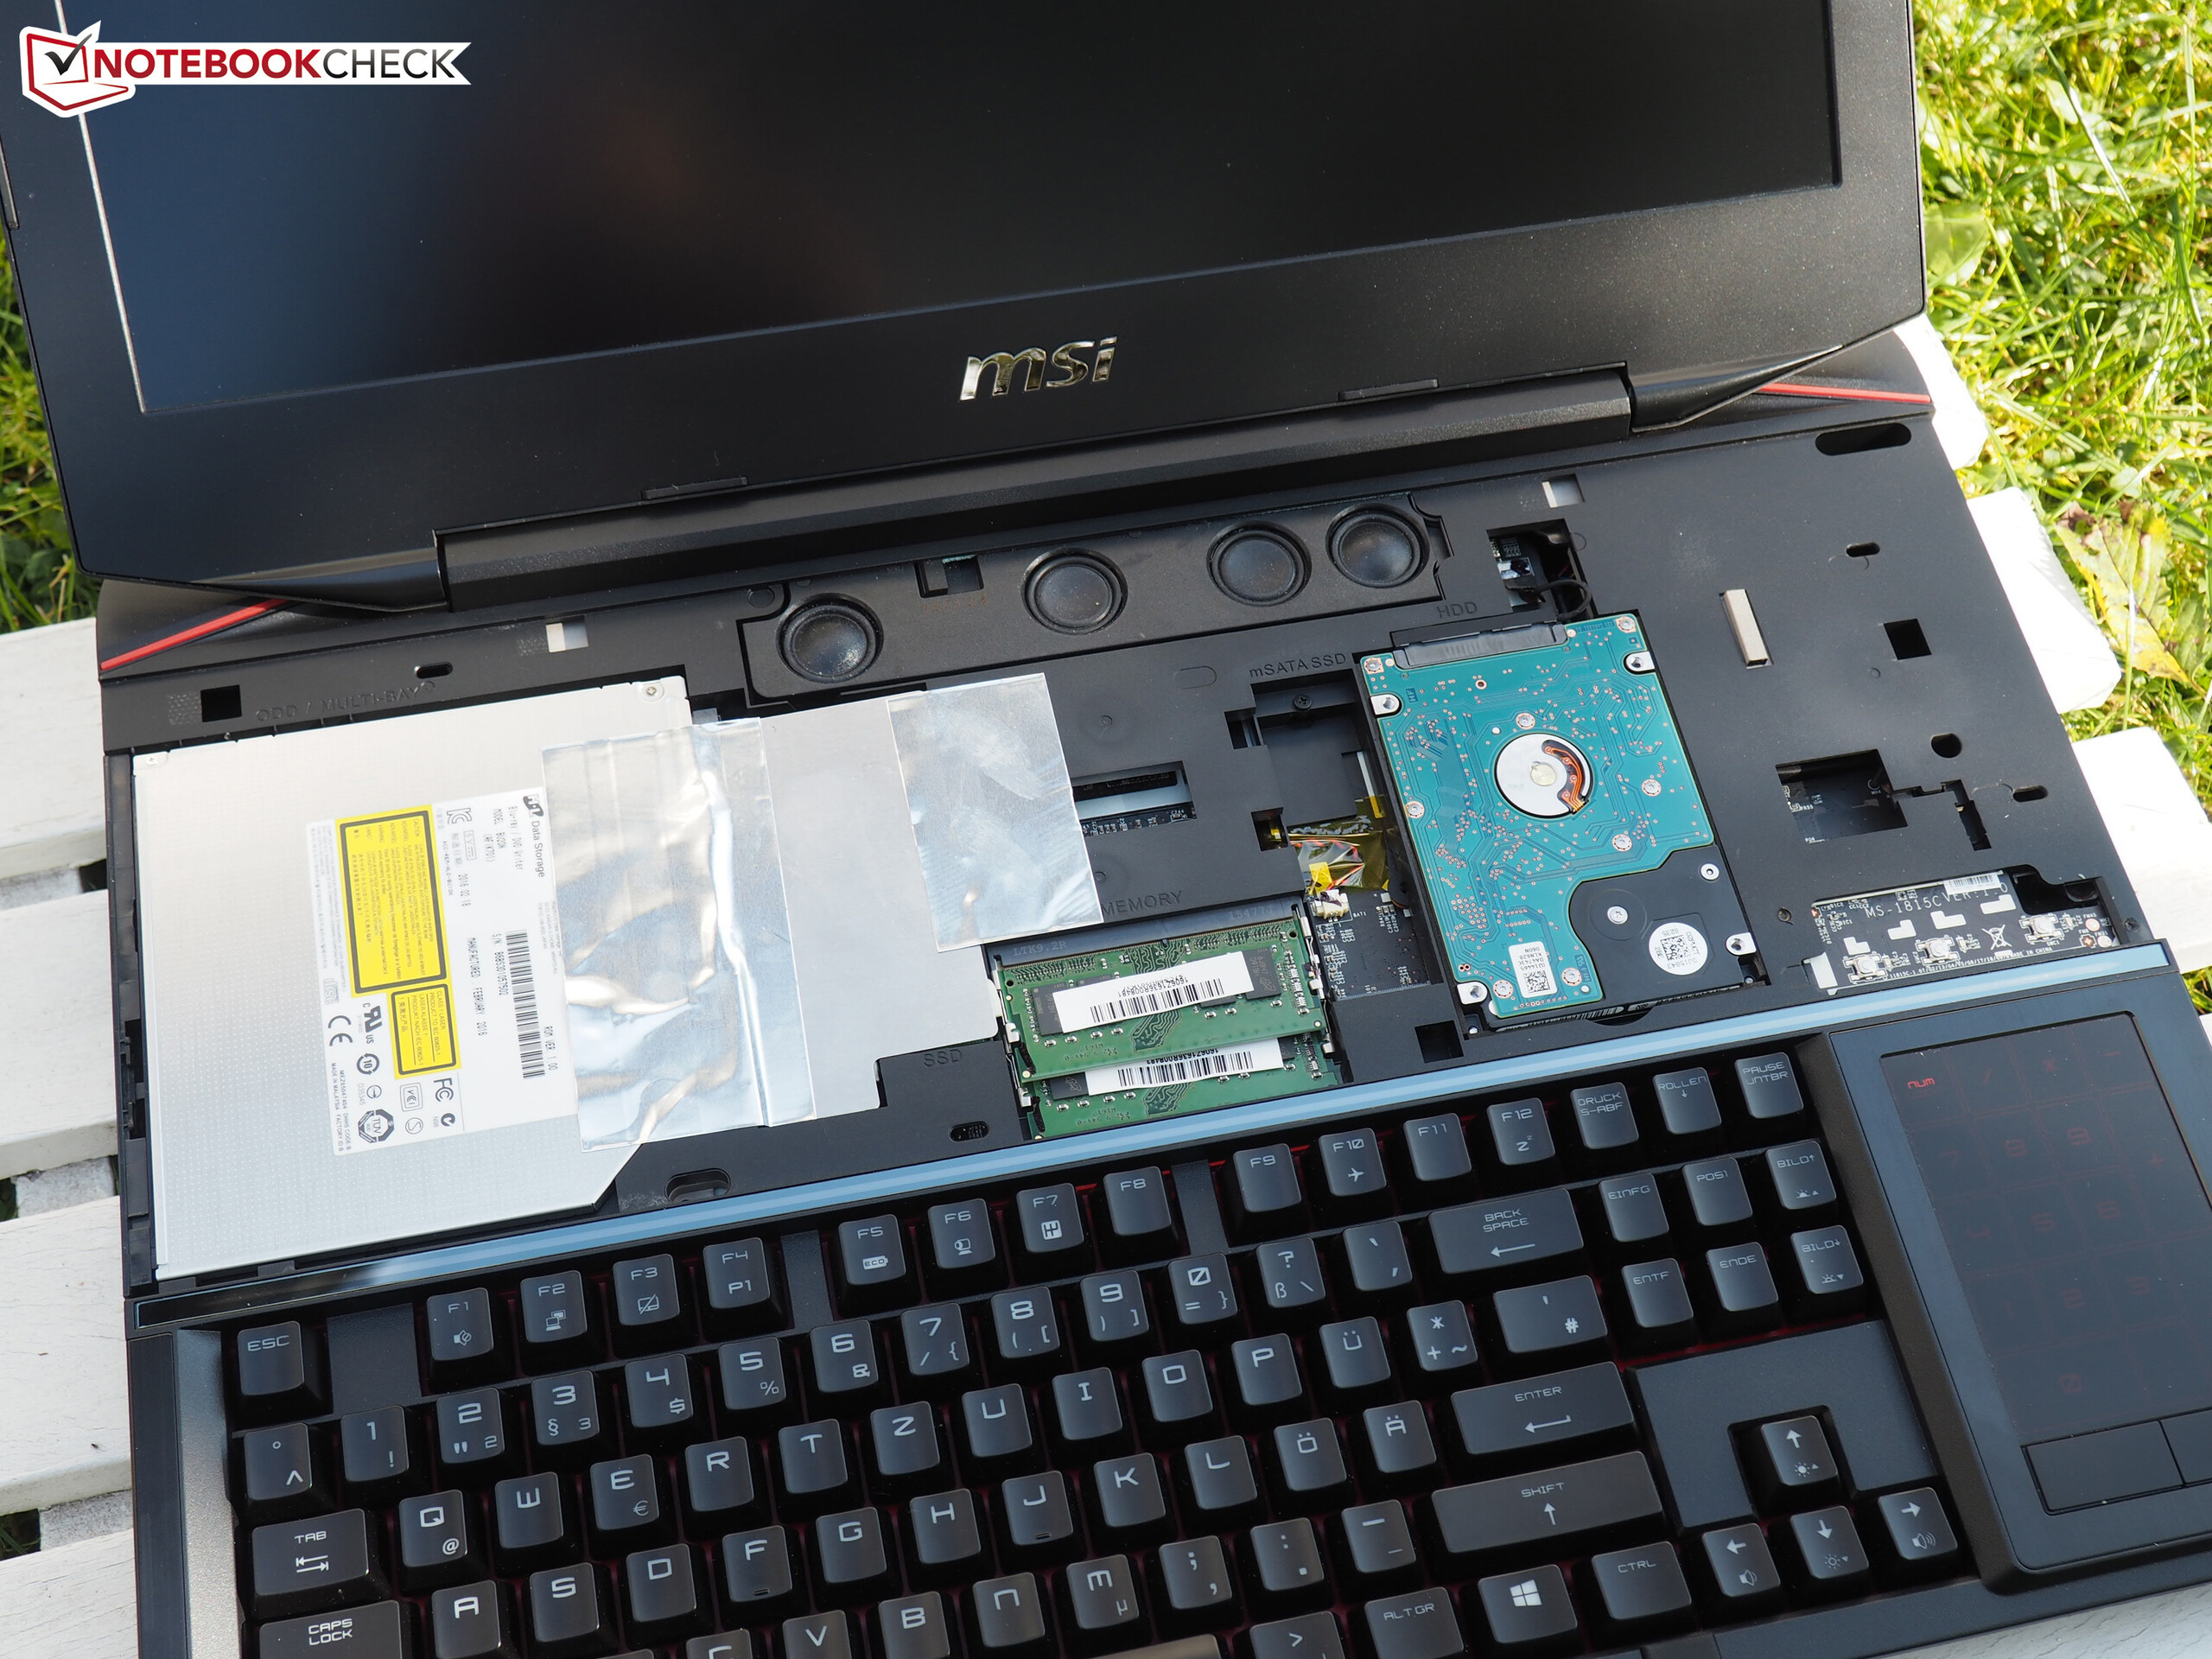
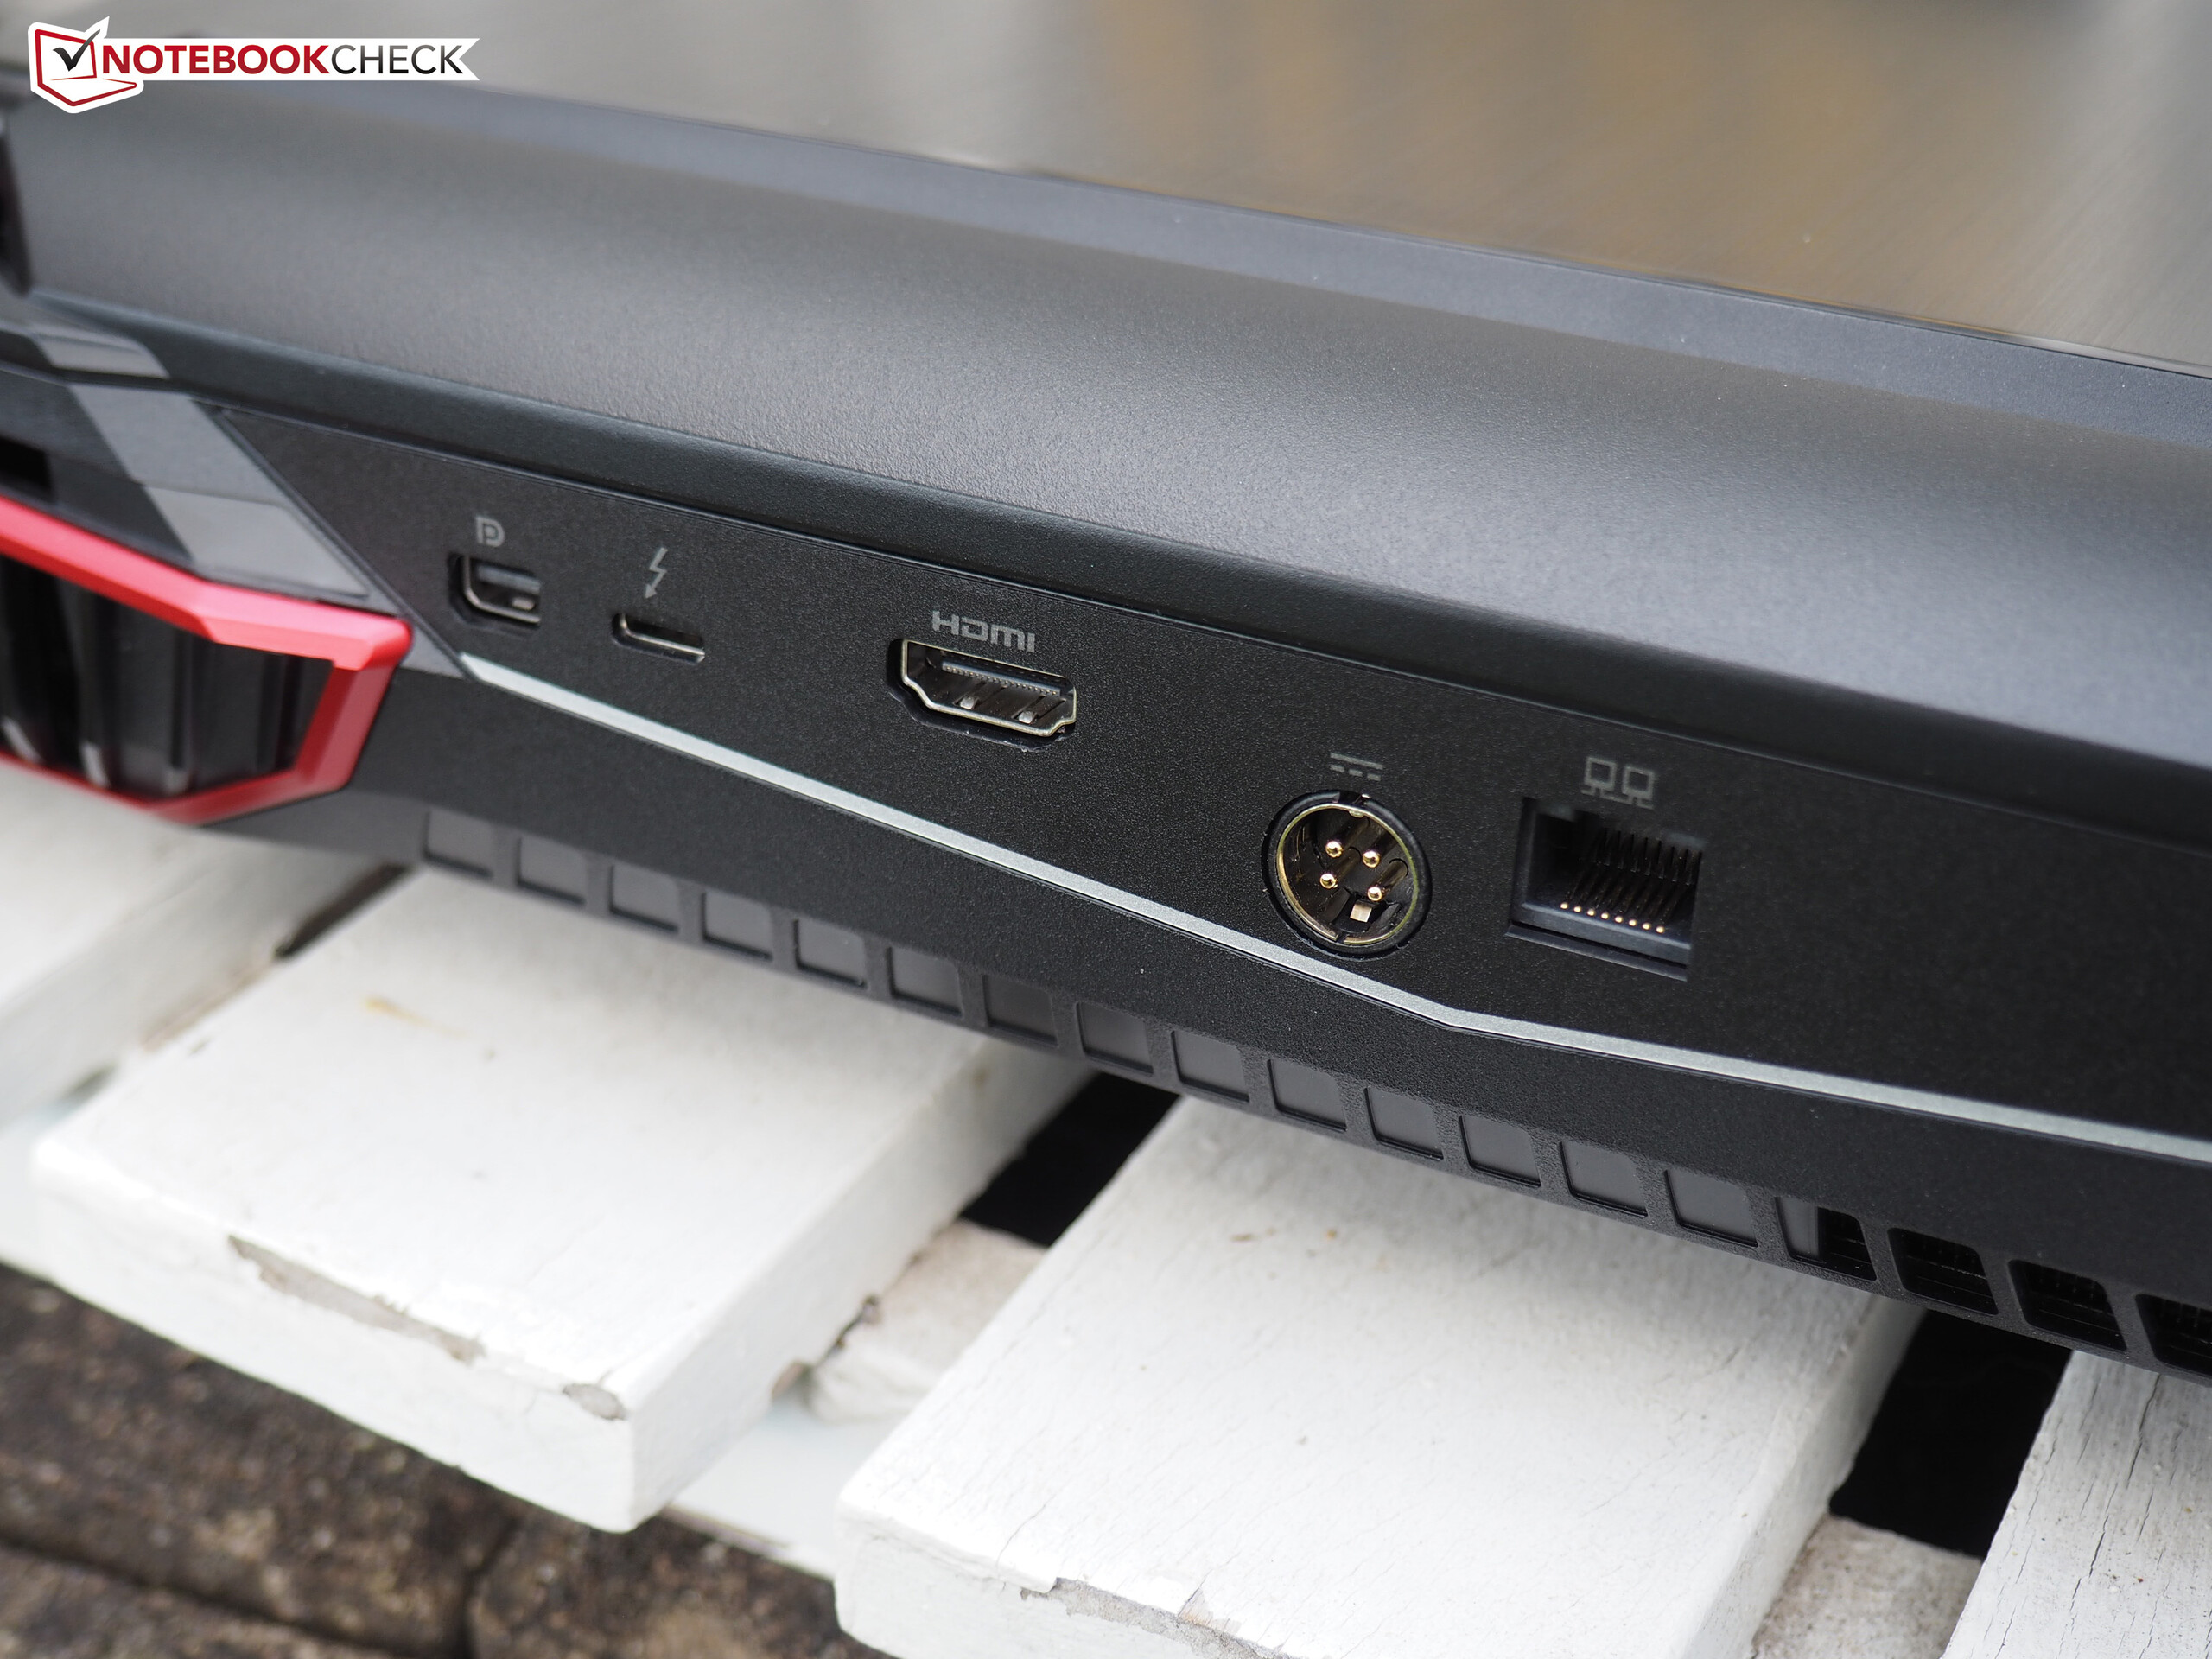
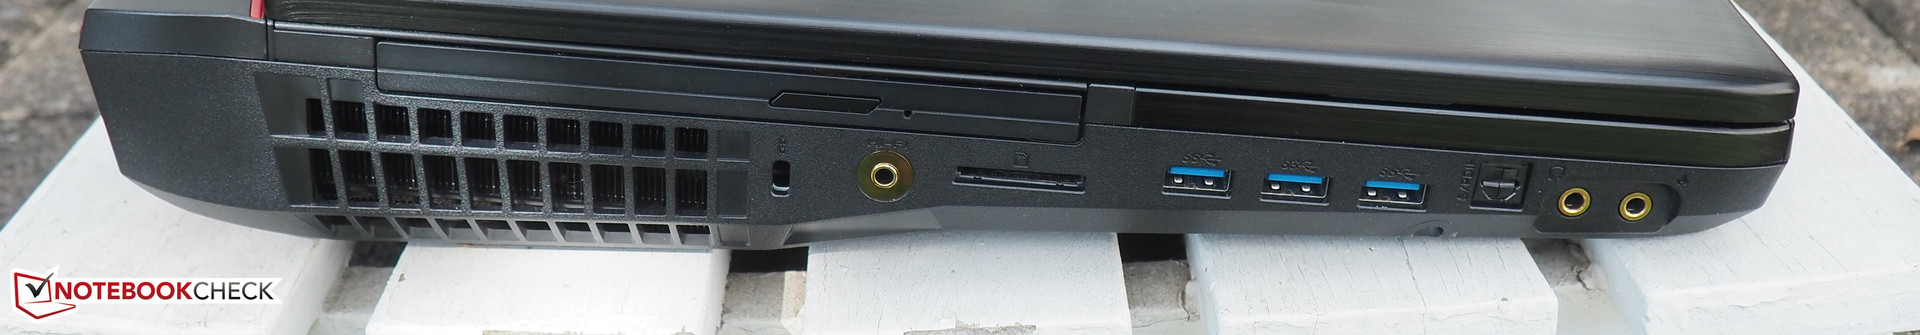
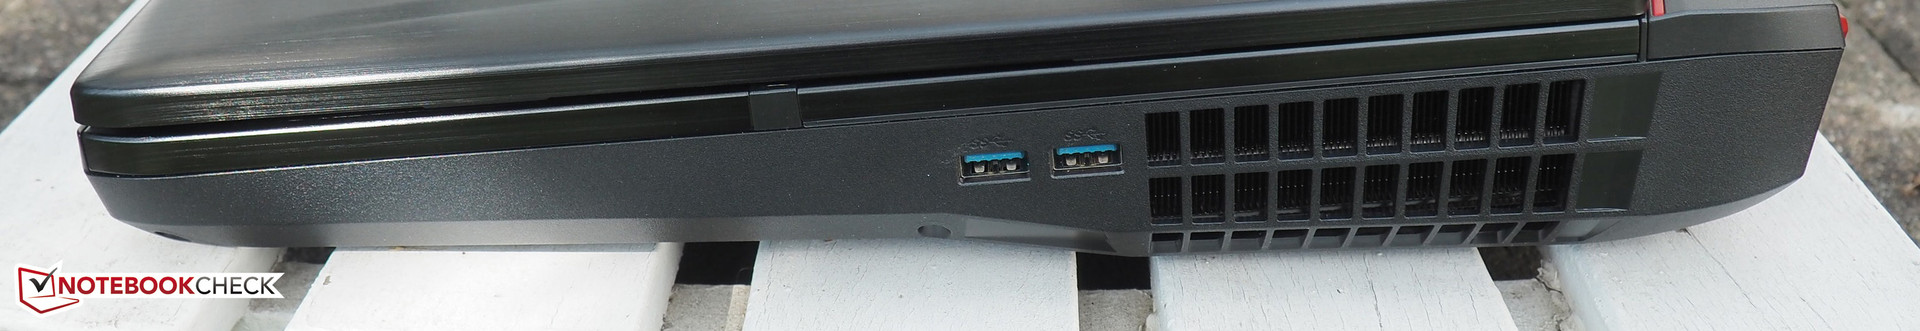
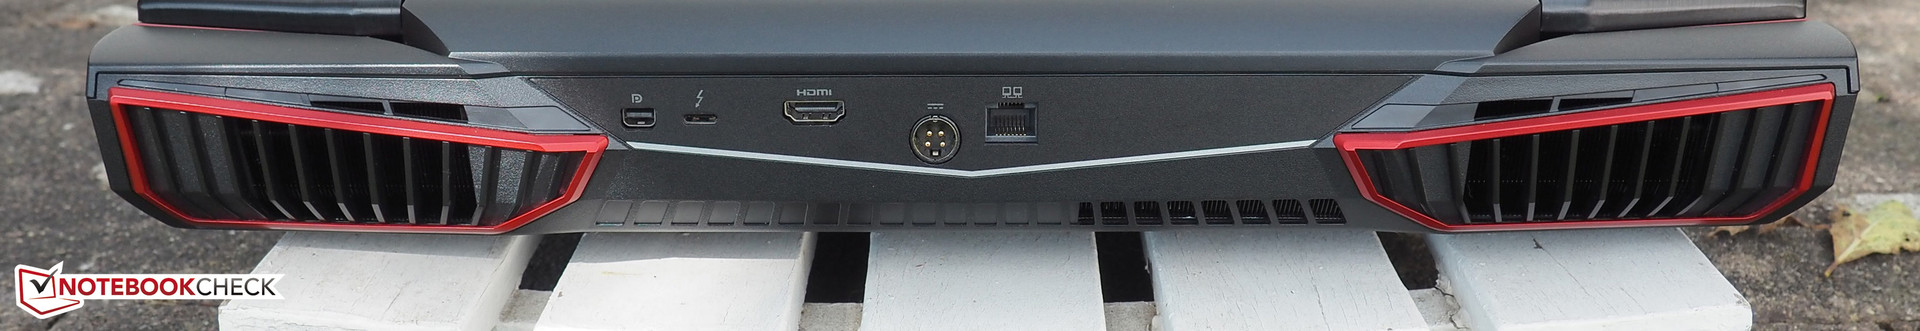
不过微星在设计这台18寸设备时也确实专注于桌面使用,如果从这方面来看的话它也十分让人满意。从接口配备到(尽管不算完美的)可维护性再到工具软件,GT83VR都是面向不愿意接受妥协的骨灰级游戏玩家所设计,在功能和性能上都给用户提供了自定义空间。
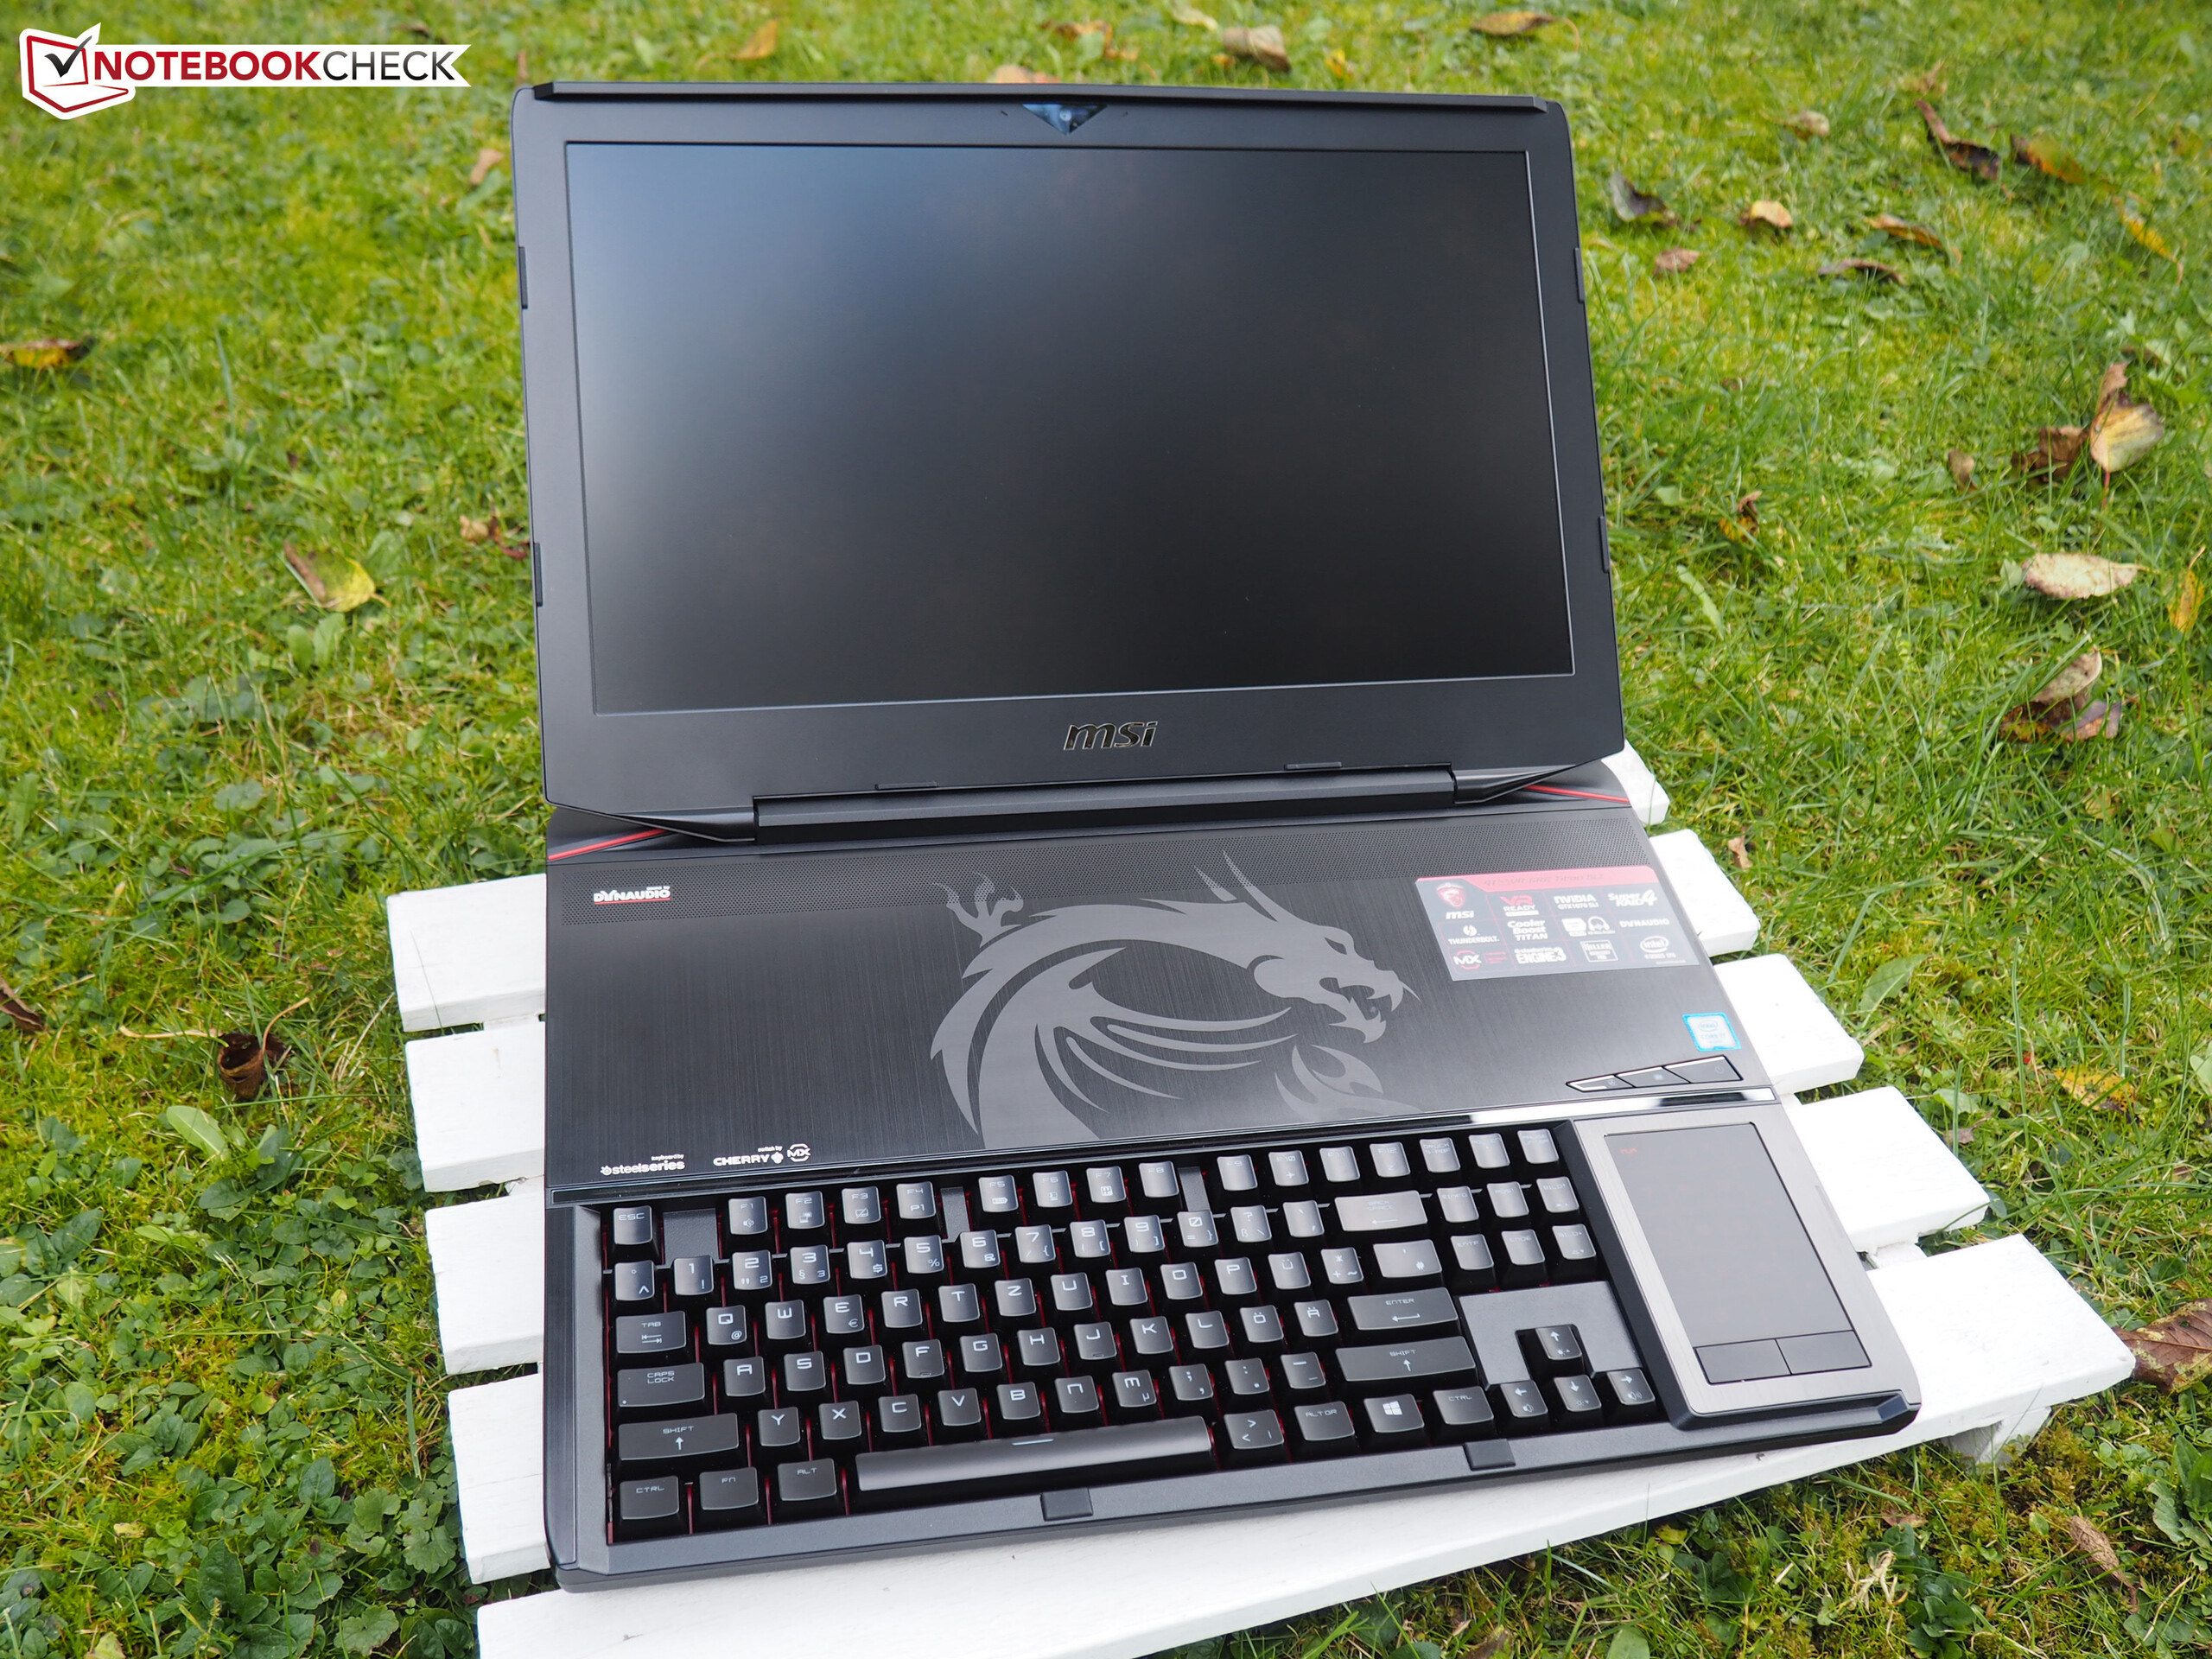
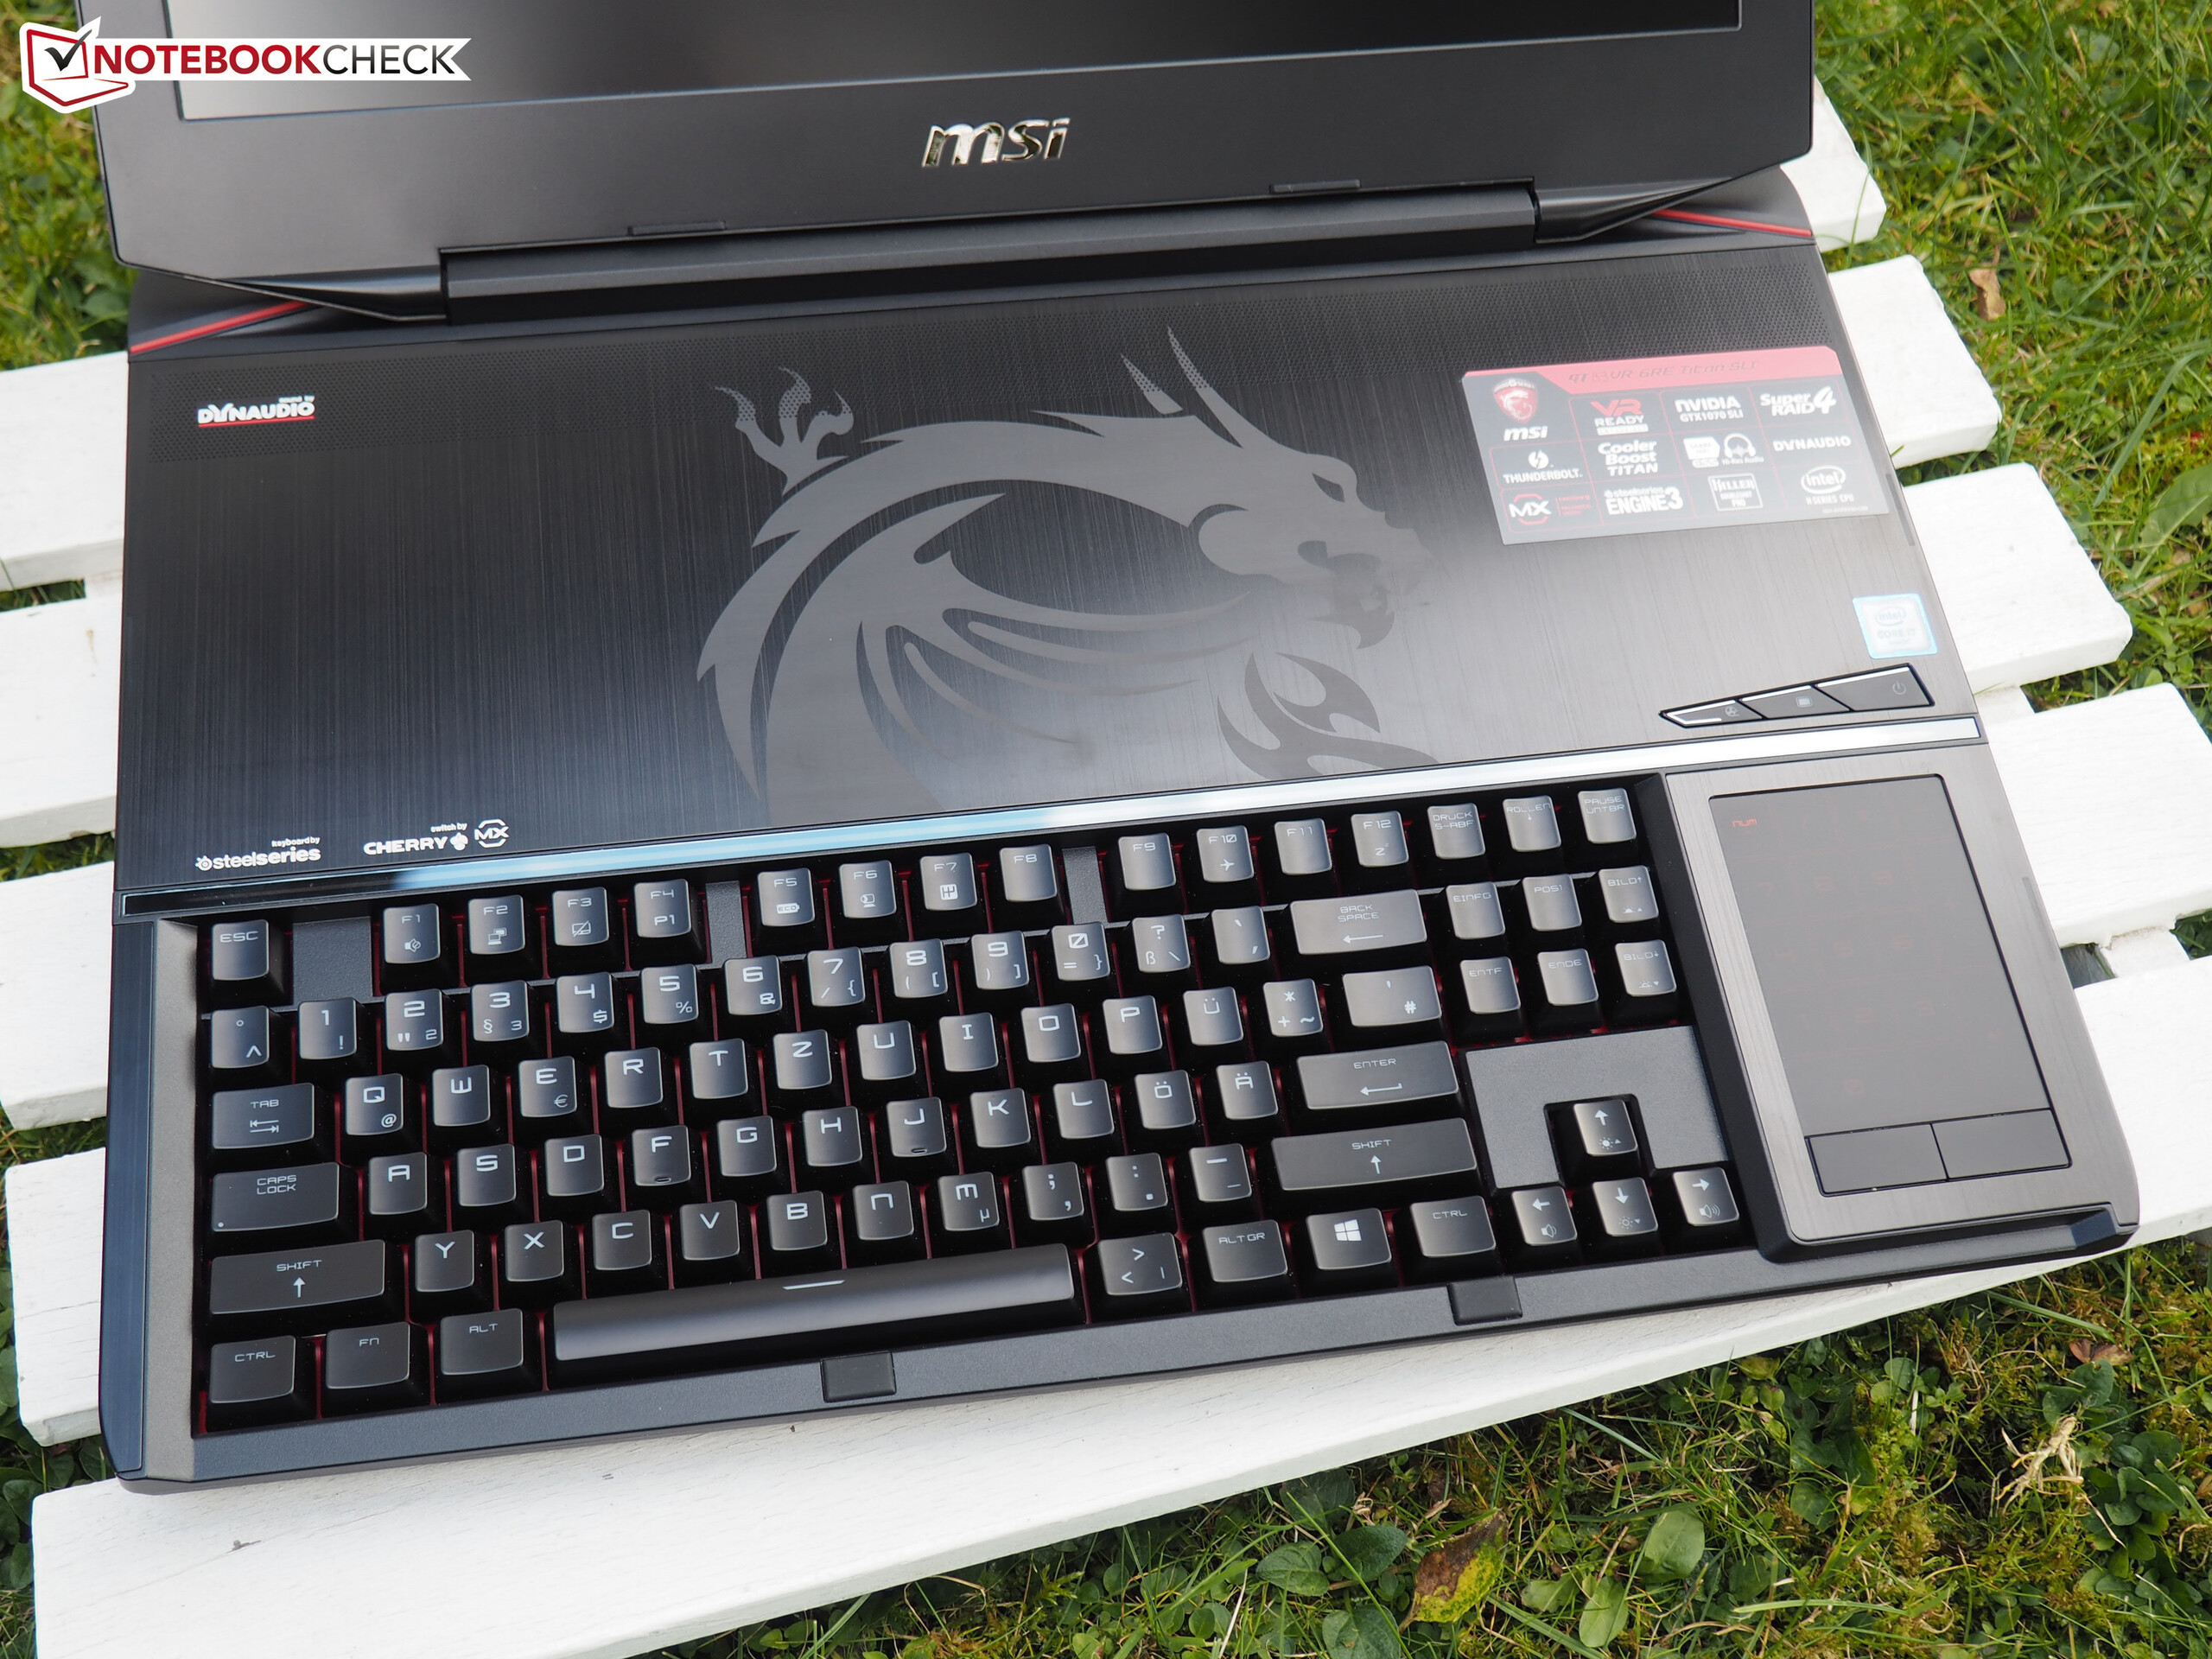
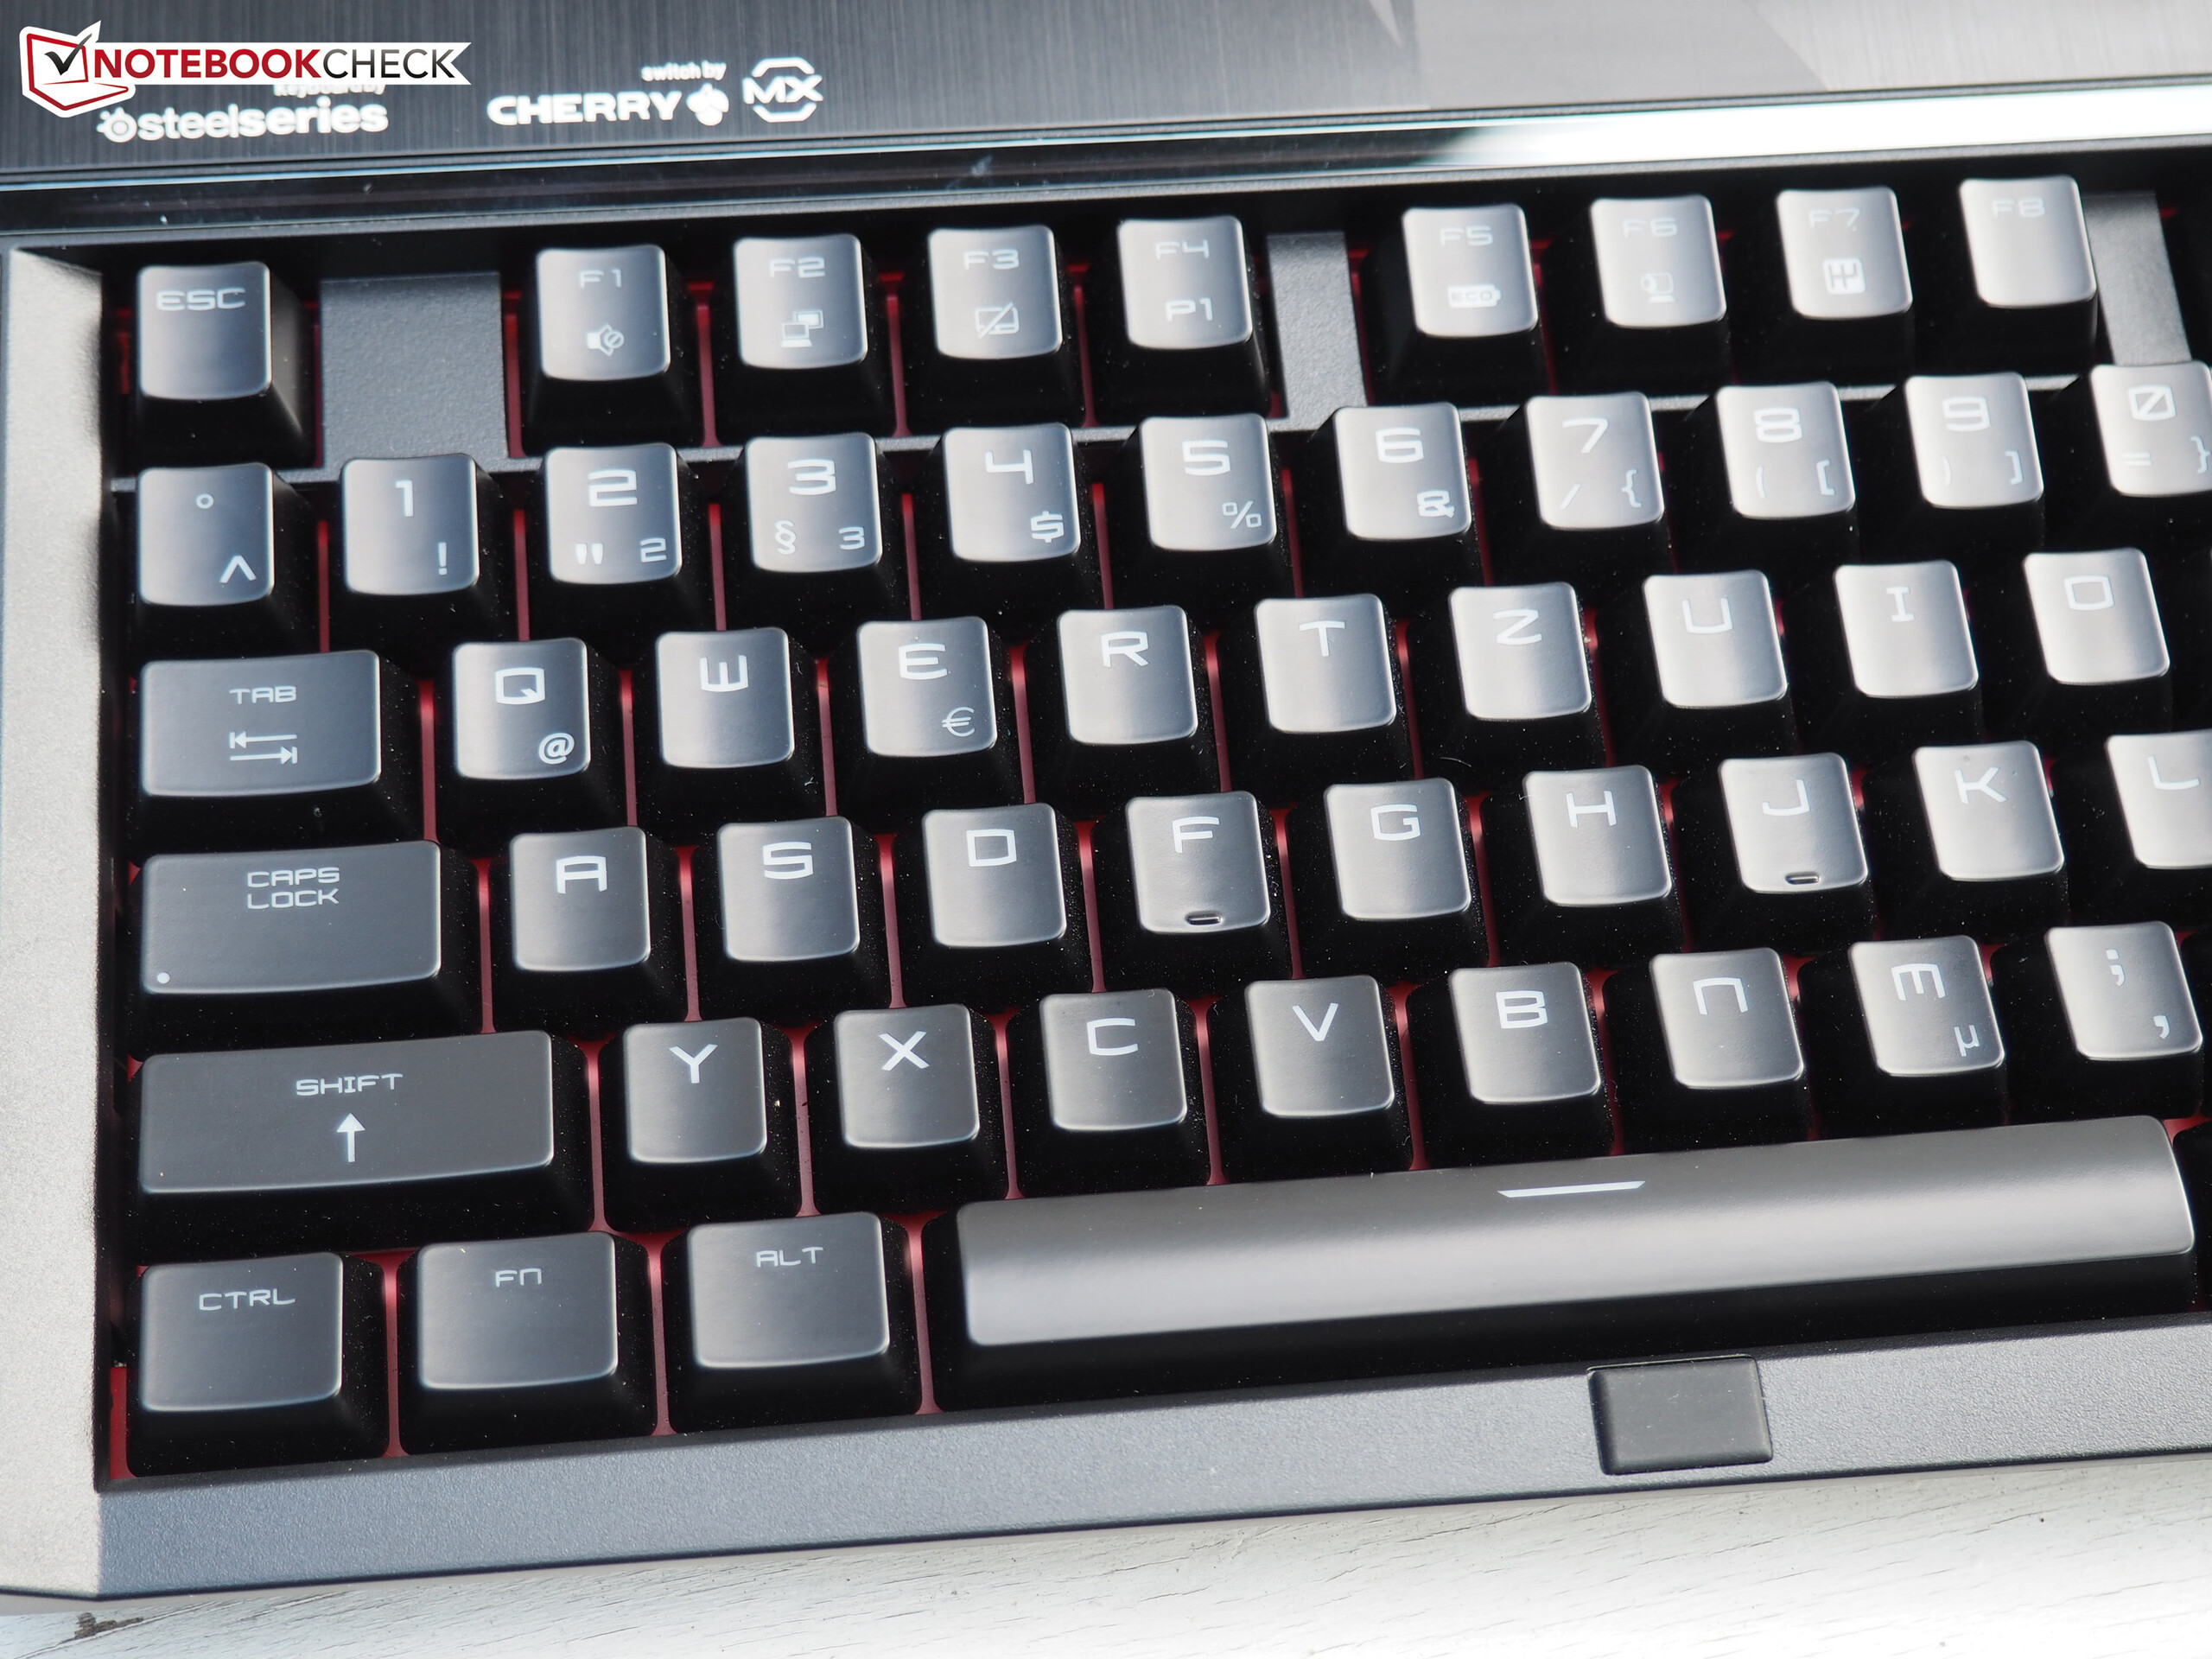
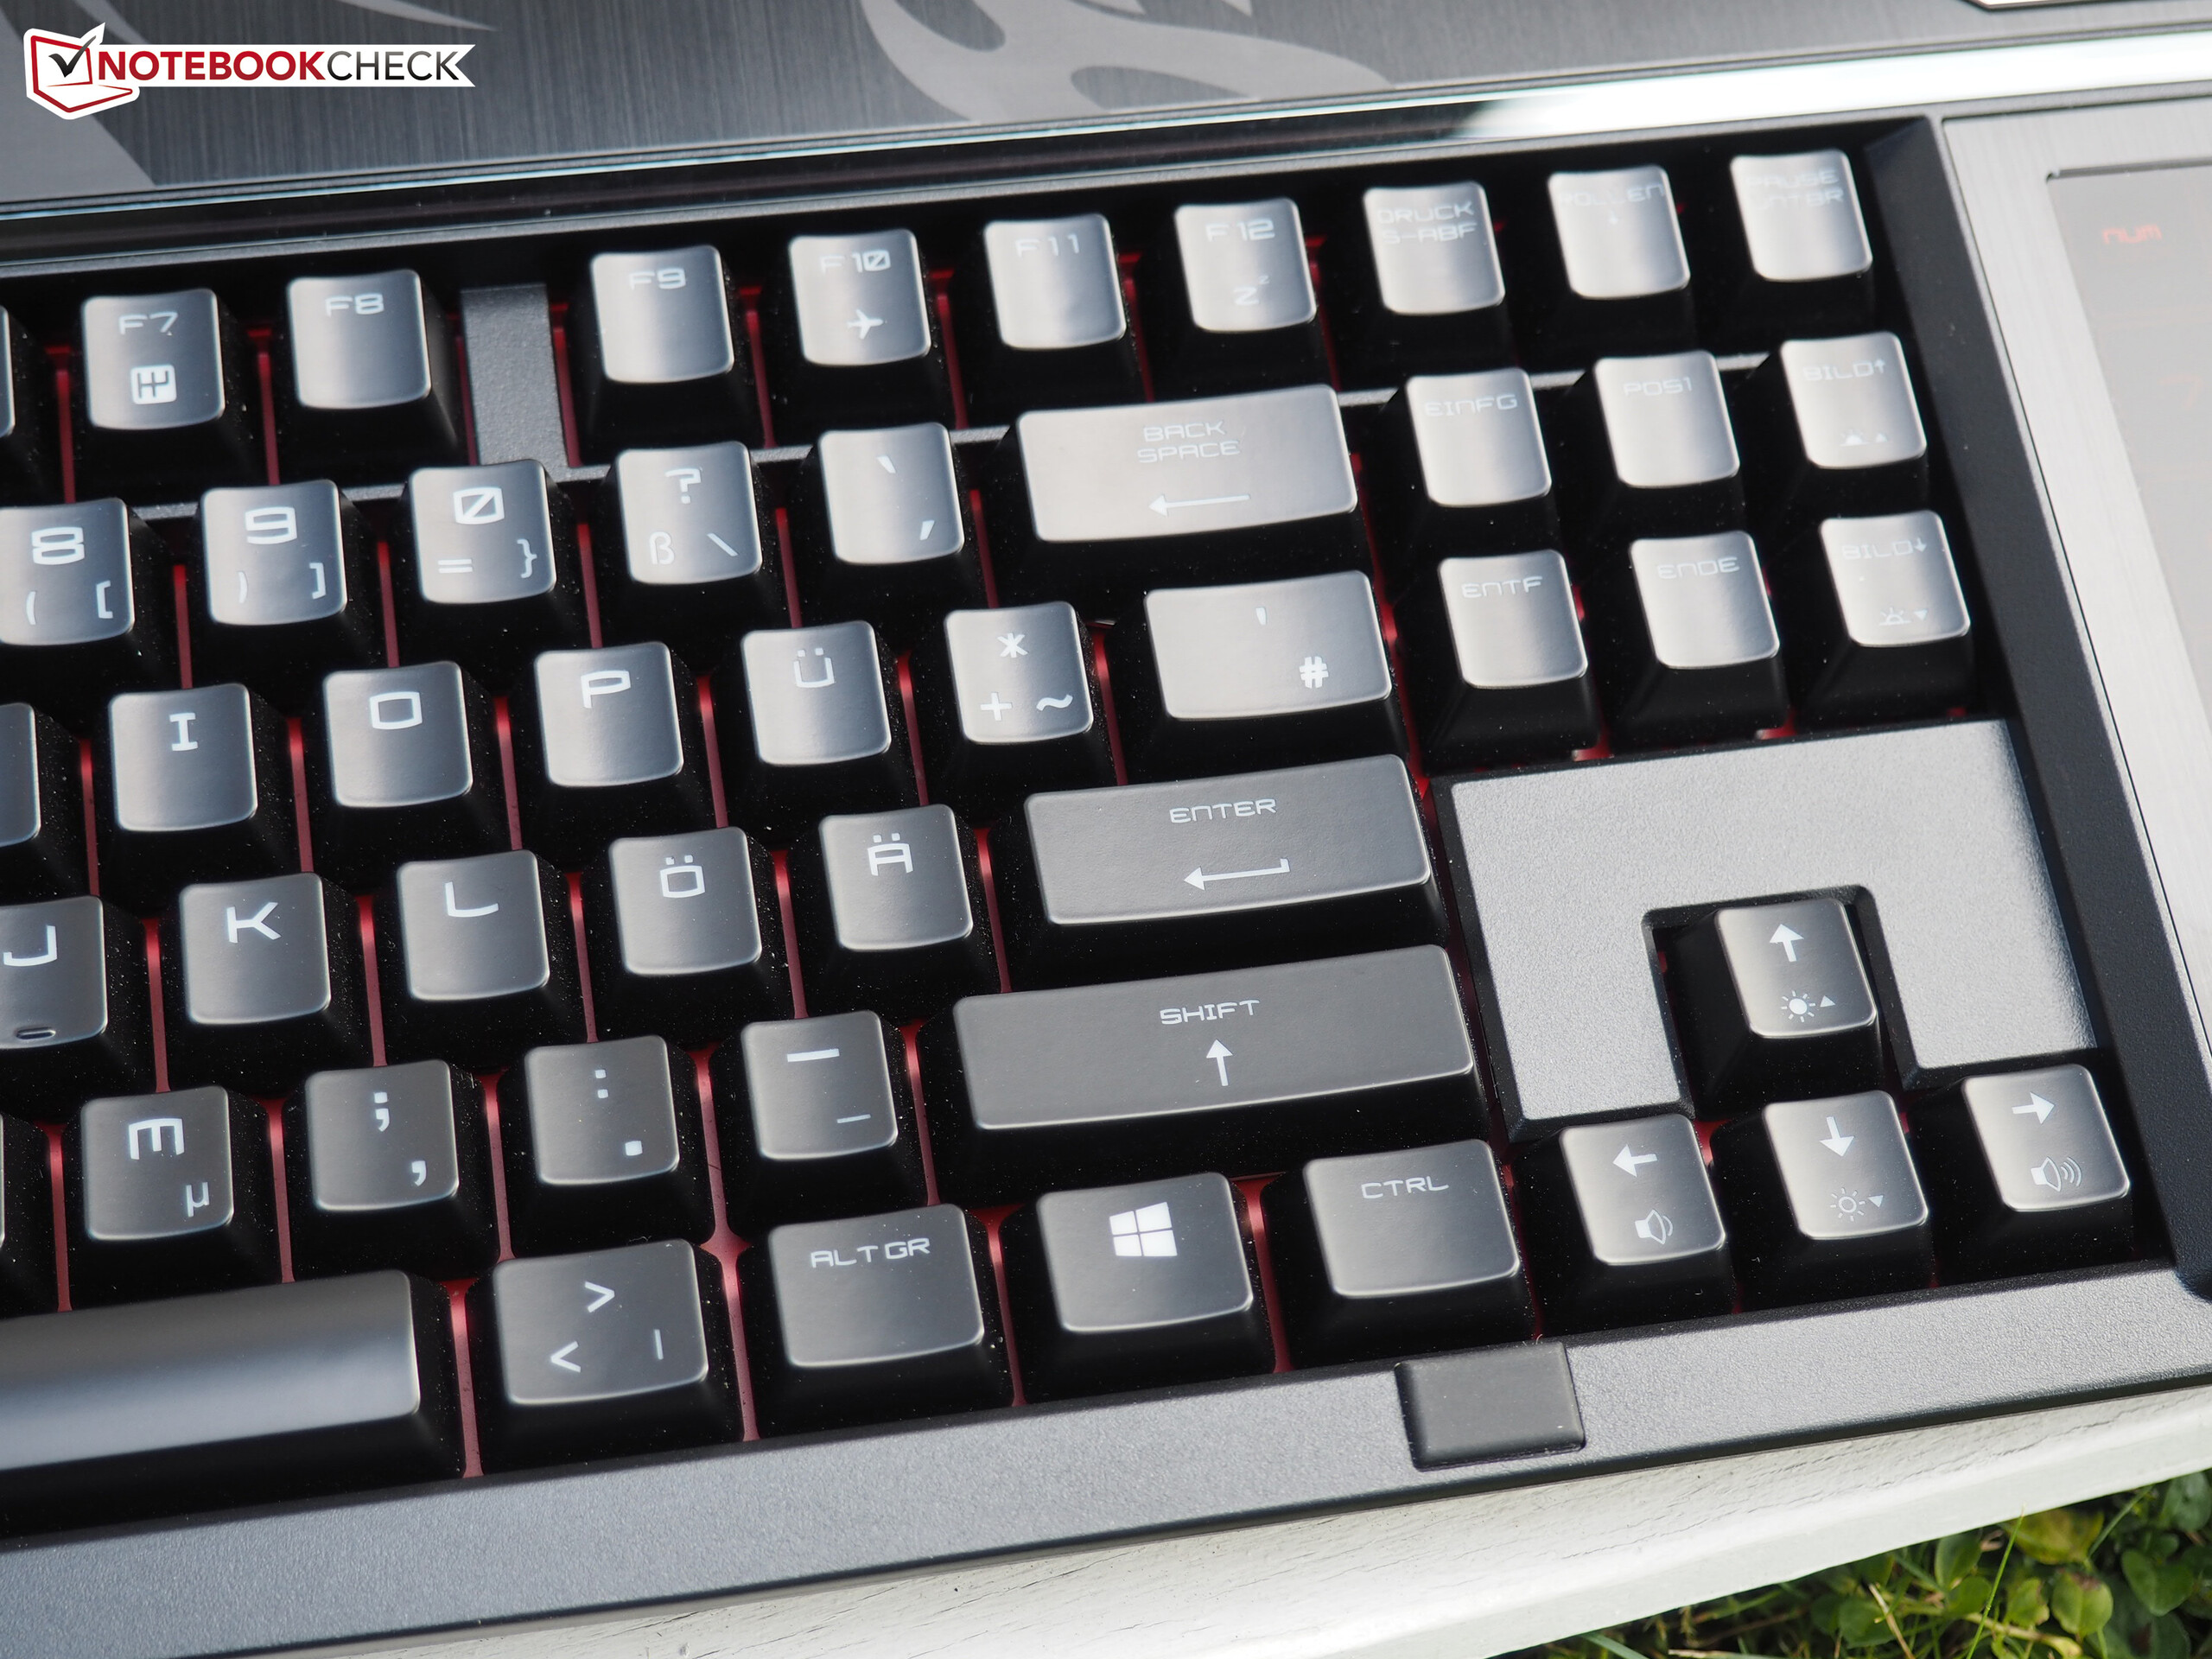
罕有敌手的机械键盘确实可以达到微星对它的高端旗舰定位。它的音响效果和散热控制也都十分优秀。不过,如果新版本机型能够增加对UHD屏幕的支持就更好了,这也会让SLI显卡更有意义。目前的全高清屏幕完全无法发挥显卡的潜能。
总分87%的微星GT83VR以细微的优势击败了竞争对手Schenker XMG U727。
注:本文是基于完整评测的缩减版本,阅读完整的英文评测,请点击这里。
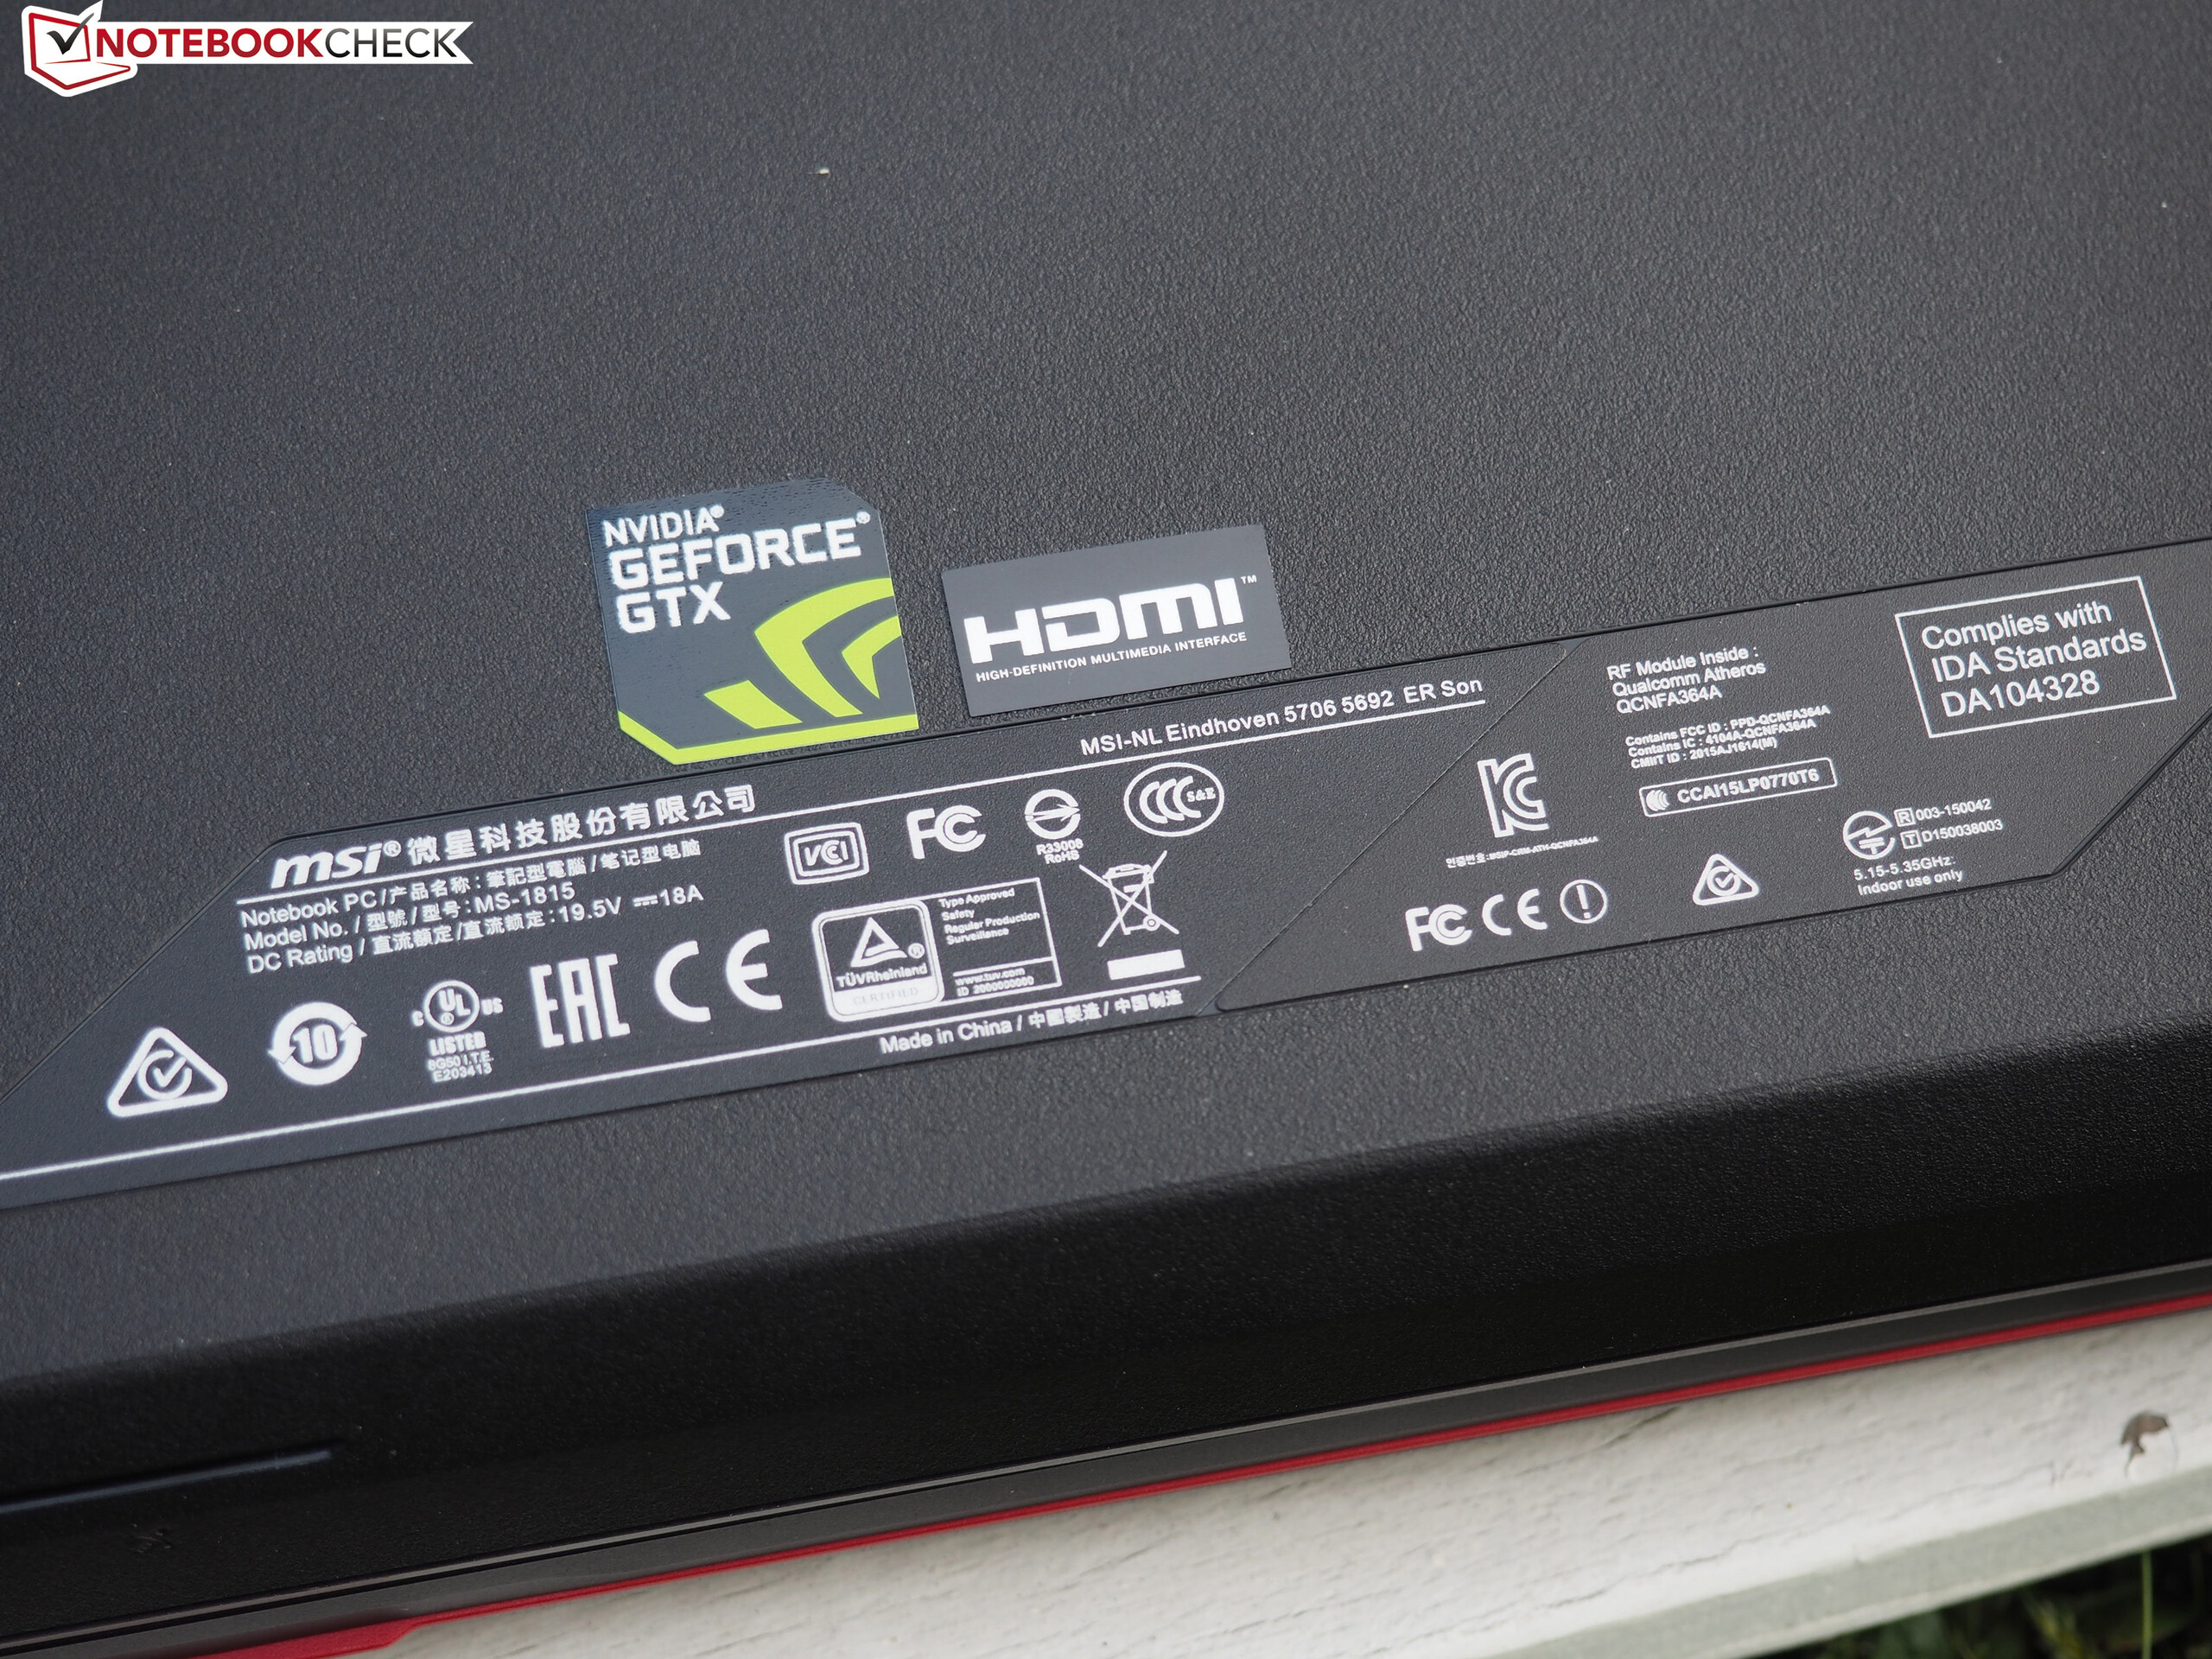
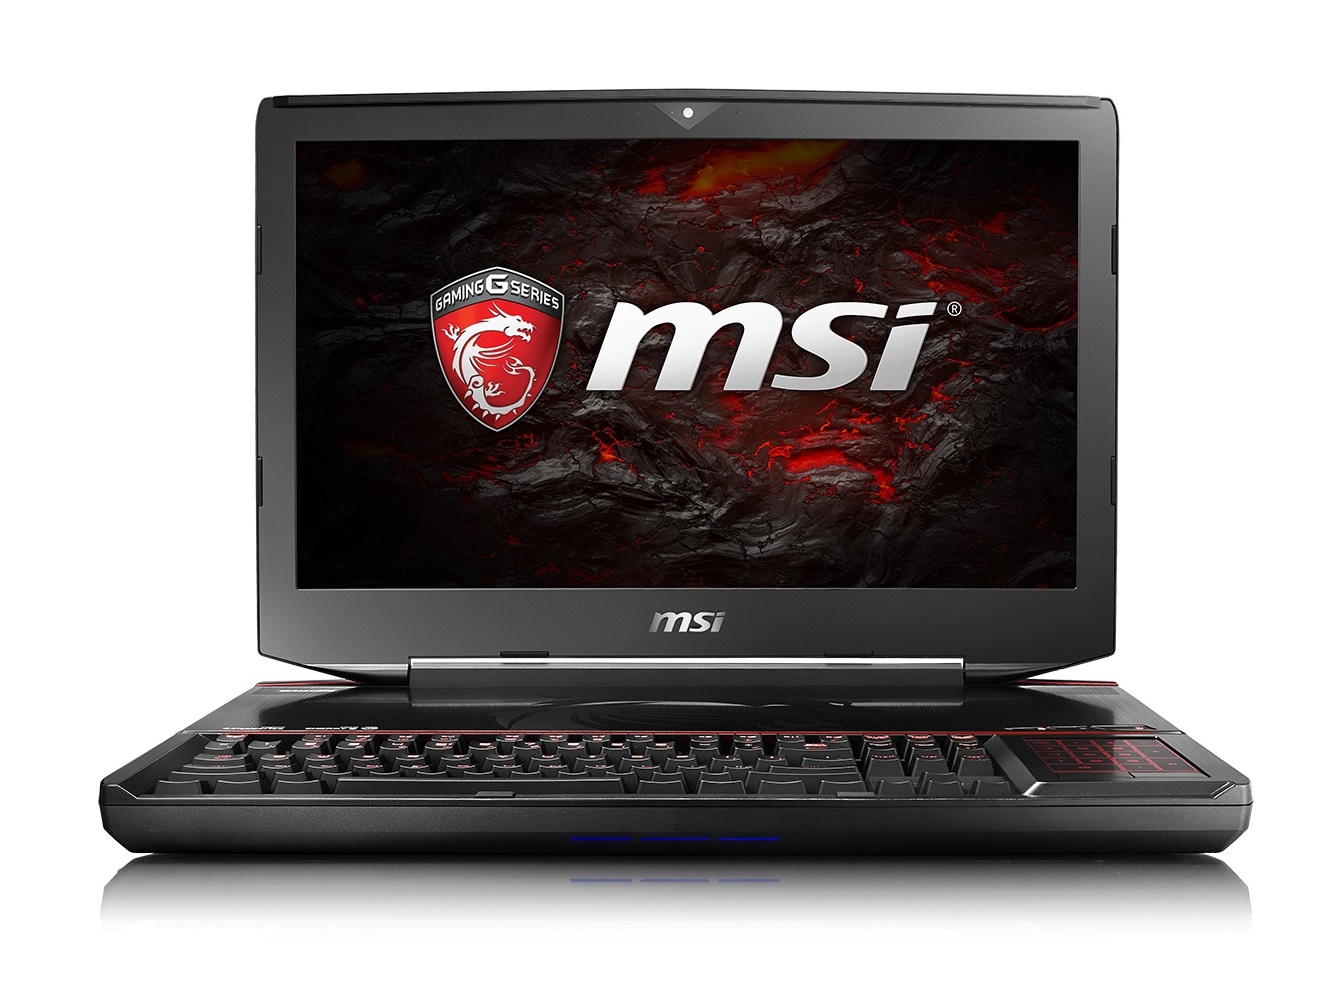
MSI GT83VR-6RE32SR451
- 10/14/2016 v5.1 (old)
Florian Glaser
Price comparison