Schenker XMG U727 (Clevo P870DM3-G) 笔记本电脑简短评测
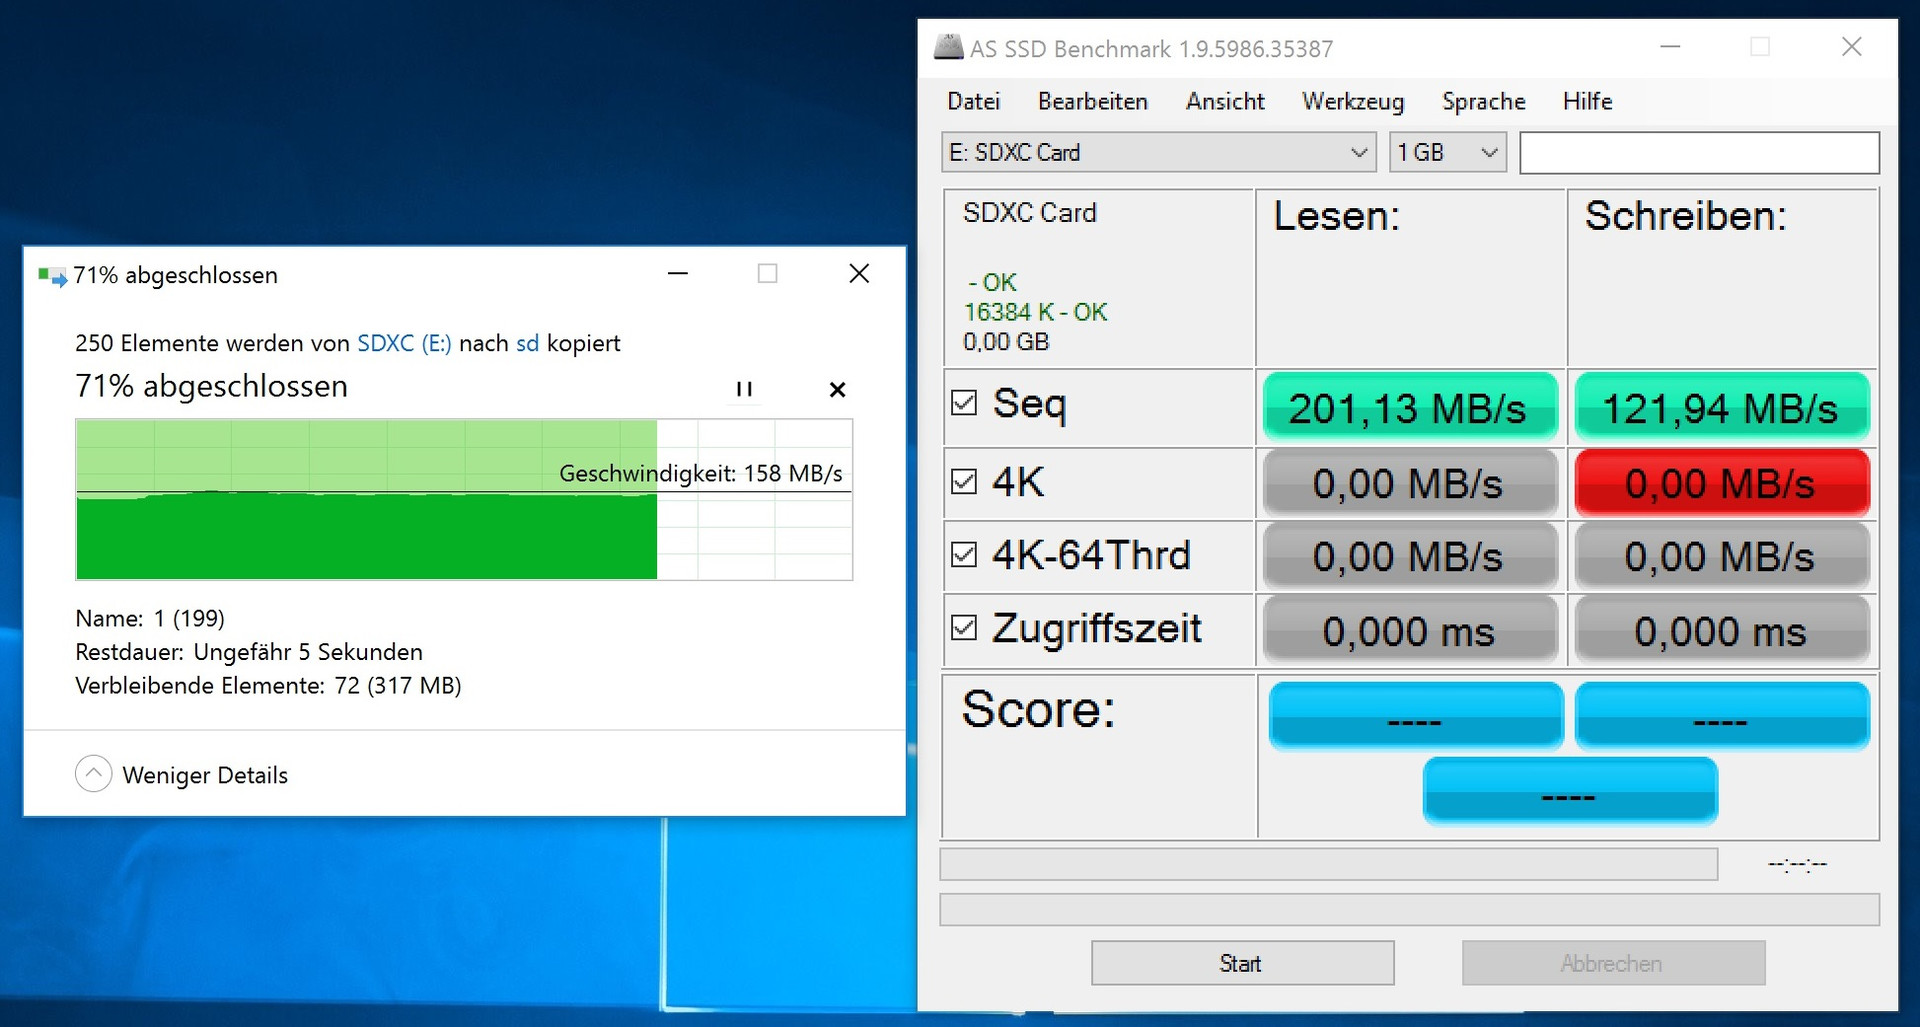
| SD Card Reader | |
| average JPG Copy Test (av. of 3 runs) | |
| Schenker XMG U726 | |
| Schenker XMG U727 | |
| MSI GT73VR-6RE16SR451 | |
| MSI GT80S 6QF | |
| Asus G752VS-XB78K | |
| maximum AS SSD Seq Read Test (1GB) | |
| Schenker XMG U726 | |
| Schenker XMG U727 | |
| MSI GT73VR-6RE16SR451 | |
| MSI GT80S 6QF | |
| Asus G752VS-XB78K | |
| Networking | |
| iperf Server (receive) TCP 1 m | |
| MSI GT73VR-6RE16SR451 | |
| Asus G752VS-XB78K | |
| Schenker XMG U727 | |
| iperf Client (transmit) TCP 1 m | |
| Schenker XMG U727 | |
| MSI GT73VR-6RE16SR451 | |
| Asus G752VS-XB78K | |
| |||||||||||||||||||||||||
Brightness Distribution: 87 %
Center on Battery: 360 cd/m²
Contrast: 1125:1 (Black: 0.32 cd/m²)
ΔE ColorChecker Calman: 3.94 | ∀{0.5-29.43 Ø4.73}
ΔE Greyscale Calman: 4.13 | ∀{0.09-98 Ø4.97}
100% sRGB (Argyll 1.6.3 3D)
88% AdobeRGB 1998 (Argyll 1.6.3 3D)
99.5% AdobeRGB 1998 (Argyll 3D)
100% sRGB (Argyll 3D)
86.9% Display P3 (Argyll 3D)
Gamma: 2.46
CCT: 6533 K
| Schenker XMG U727 AU Optronics B173ZAN01.0 (AUO109B), 3840x2160 | MSI GT80S 6QF Samsung 184HL (SDC4C48), 1920x1080 | Schenker XMG U726 AU B173ZAN01.0 (AUO109B), 3840x2160 | MSI GT73VR-6RE16SR451 N173HHE-G32 (CMN1747), 1920x1080 | Asus G752VS-XB78K LG Philips LP173WF4-SPF3 (LGD04E8), 1920x1080 | |
|---|---|---|---|---|---|
| Display | -23% | -0% | -3% | -25% | |
| Display P3 Coverage (%) | 86.9 | 65.5 -25% | 87 0% | 91.2 5% | 66.9 -23% |
| sRGB Coverage (%) | 100 | 89.2 -11% | 100 0% | 100 0% | 85.2 -15% |
| AdobeRGB 1998 Coverage (%) | 99.5 | 65.2 -34% | 98.9 -1% | 84.9 -15% | 62.3 -37% |
| Response Times | 14% | 53% | 6% | ||
| Response Time Grey 50% / Grey 80% * (ms) | 39 ? | 35 ? 10% | 26 ? 33% | 38 ? 3% | |
| Response Time Black / White * (ms) | 24 ? | 20 ? 17% | 6.8 ? 72% | 22 ? 8% | |
| PWM Frequency (Hz) | 250 ? | ||||
| Screen | -6% | -1% | -43% | -7% | |
| Brightness middle (cd/m²) | 360 | 298 -17% | 330 -8% | 314 -13% | 328 -9% |
| Brightness (cd/m²) | 328 | 265 -19% | 327 0% | 294 -10% | 317 -3% |
| Brightness Distribution (%) | 87 | 78 -10% | 86 -1% | 89 2% | 88 1% |
| Black Level * (cd/m²) | 0.32 | 0.35 -9% | 0.38 -19% | 0.23 28% | 0.3 6% |
| Contrast (:1) | 1125 | 851 -24% | 868 -23% | 1365 21% | 1093 -3% |
| Colorchecker dE 2000 * | 3.94 | 2.72 31% | 3 24% | 9.74 -147% | 3.74 5% |
| Colorchecker dE 2000 max. * | 6.01 | 5.4 10% | 5.3 12% | 15.71 -161% | 8.97 -49% |
| Greyscale dE 2000 * | 4.13 | 3 27% | 3.81 8% | 9.58 -132% | 2.67 35% |
| Gamma | 2.46 89% | 2.36 93% | 2.52 87% | 2.5 88% | 2.41 91% |
| CCT | 6533 99% | 6995 93% | 6306 103% | 11854 55% | 6861 95% |
| Color Space (Percent of AdobeRGB 1998) (%) | 88 | 58 -34% | 88 0% | 76 -14% | 56 -36% |
| Color Space (Percent of sRGB) (%) | 100 | 89 -11% | 100 0% | 100 0% | 85 -15% |
| Total Average (Program / Settings) | -5% /
-7% | -1% /
-1% | 2% /
-22% | -9% /
-9% |
* ... smaller is better
Display Response Times
| ↔ Response Time Black to White | ||
|---|---|---|
| 24 ms ... rise ↗ and fall ↘ combined | ↗ 4 ms rise | 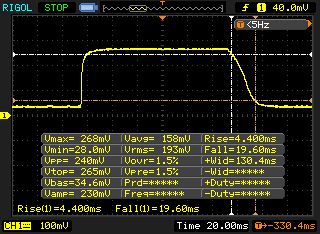 |
| ↘ 20 ms fall | ||
| The screen shows good response rates in our tests, but may be too slow for competitive gamers. In comparison, all tested devices range from 0.1 (minimum) to 240 (maximum) ms. » 54 % of all devices are better. This means that the measured response time is worse than the average of all tested devices (19.9 ms). | ||
| ↔ Response Time 50% Grey to 80% Grey | ||
| 39 ms ... rise ↗ and fall ↘ combined | ↗ 14 ms rise | 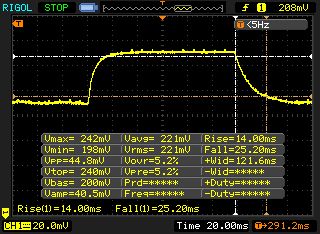 |
| ↘ 25 ms fall | ||
| The screen shows slow response rates in our tests and will be unsatisfactory for gamers. In comparison, all tested devices range from 0.165 (minimum) to 636 (maximum) ms. » 59 % of all devices are better. This means that the measured response time is worse than the average of all tested devices (31.1 ms). | ||
Screen Flickering / PWM (Pulse-Width Modulation)
| Screen flickering / PWM not detected | 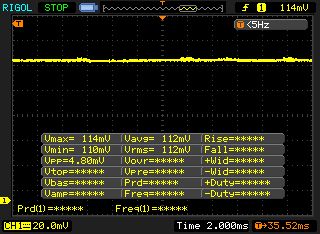 | ||
In comparison: 52 % of all tested devices do not use PWM to dim the display. If PWM was detected, an average of 7798 (minimum: 5 - maximum: 343500) Hz was measured. | |||
| Cinebench R15 | |
| CPU Single 64Bit | |
| MSI GT80S 6QF | |
| Schenker XMG U726 | |
| Schenker XMG U727 | |
| Asus G752VS-XB78K | |
| MSI GT73VR-6RE16SR451 | |
| CPU Multi 64Bit | |
| MSI GT80S 6QF | |
| MSI GT73VR-6RE16SR451 | |
| Schenker XMG U727 | |
| Schenker XMG U726 | |
| Asus G752VS-XB78K | |
| Cinebench R11.5 | |
| CPU Single 64Bit | |
| MSI GT80S 6QF | |
| Schenker XMG U726 | |
| Schenker XMG U727 | |
| MSI GT73VR-6RE16SR451 | |
| Asus G752VS-XB78K | |
| CPU Multi 64Bit | |
| MSI GT80S 6QF | |
| MSI GT73VR-6RE16SR451 | |
| Schenker XMG U726 | |
| Schenker XMG U727 | |
| Asus G752VS-XB78K | |
| PCMark 7 Score | 6605 points | |
| PCMark 8 Home Score Accelerated v2 | 4507 points | |
| PCMark 8 Work Score Accelerated v2 | 4662 points | |
Help | ||
| PCMark 7 - Score | |
| MSI GT80S 6QF | |
| Schenker XMG U726 | |
| MSI GT73VR-6RE16SR451 | |
| Asus G752VS-XB78K | |
| Schenker XMG U727 | |
| PCMark 8 | |
| Home Score Accelerated v2 | |
| Asus G752VS-XB78K | |
| MSI GT73VR-6RE16SR451 | |
| Schenker XMG U727 | |
| Schenker XMG U726 | |
| Work Score Accelerated v2 | |
| Asus G752VS-XB78K | |
| MSI GT73VR-6RE16SR451 | |
| Schenker XMG U727 | |
| Schenker XMG U726 | |
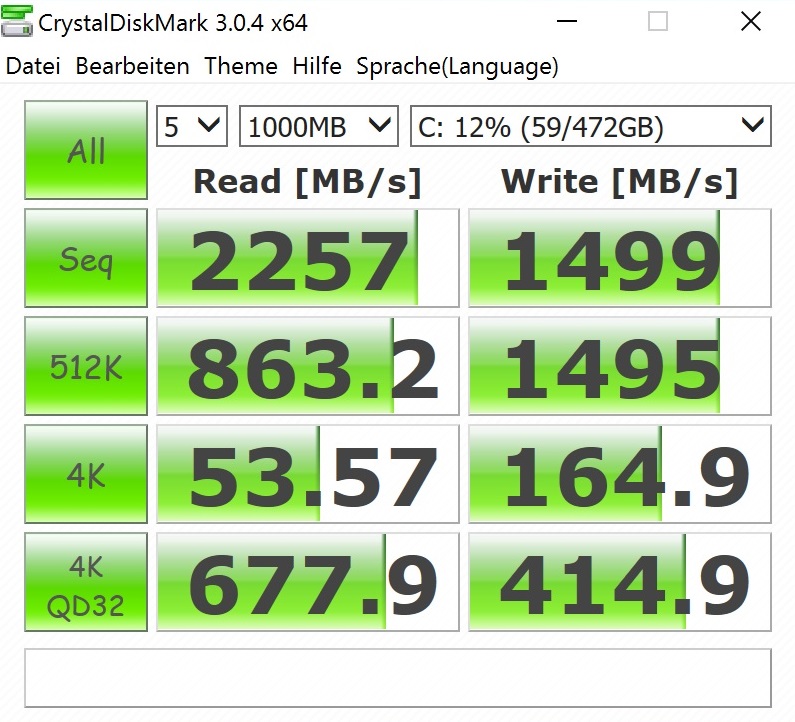
| Schenker XMG U727 Samsung SSD 950 Pro 512GB m.2 NVMe | MSI GT80S 6QF 2x Samsung SM951 MZVPV256HDGL (RAID 0) | Schenker XMG U726 Samsung SM951 MZHPV512HDGL m.2 PCI-e | MSI GT73VR-6RE16SR451 2x Samsung SM951 MZVPV256HDGL (RAID 0) | Asus G752VS-XB78K Toshiba NVMe THNSN5512GPU7 | |
|---|---|---|---|---|---|
| CrystalDiskMark 3.0 | 22% | -16% | 27% | -15% | |
| Read Seq (MB/s) | 2257 | 3259 44% | 1661 -26% | 3285 46% | 1718 -24% |
| Write Seq (MB/s) | 1499 | 2556 71% | 1560 4% | 2560 71% | 1305 -13% |
| Read 4k (MB/s) | 53.6 | 49.38 -8% | 45.42 -15% | 52.2 -3% | 44.42 -17% |
| Write 4k (MB/s) | 164.9 | 130.3 -21% | 121.5 -26% | 153.1 -7% | 154.4 -6% |

| 3DMark 11 Performance | 24547 points | |
| 3DMark Fire Strike Score | 21423 points | |
| 3DMark Time Spy Score | 9768 points | |
Help | ||
| 3DMark | |
| 1920x1080 Fire Strike Graphics | |
| Schenker XMG U727 | |
| MSI GT80S 6QF | |
| MSI GT73VR-6RE16SR451 | |
| Asus G752VS-XB78K | |
| Schenker XMG U726 | |
| 3840x2160 Fire Strike Ultra Graphics | |
| Schenker XMG U727 | |
| MSI GT80S 6QF | |
| MSI GT73VR-6RE16SR451 | |
| Asus G752VS-XB78K | |
| Schenker XMG U726 | |
| 3DMark 11 - 1280x720 Performance GPU | |
| Schenker XMG U727 | |
| MSI GT80S 6QF | |
| MSI GT73VR-6RE16SR451 | |
| Asus G752VS-XB78K | |
| Schenker XMG U726 | |
| Unigine Heaven 4.0 - Extreme Preset DX11 | |
| Schenker XMG U727 | |
| MSI GT80S 6QF | |
| MSI GT73VR-6RE16SR451 | |
| Asus G752VS-XB78K | |
| Schenker XMG U726 | |
| low | med. | high | ultra | 4K | |
|---|---|---|---|---|---|
| Rise of the Tomb Raider (2016) | 80.2 | 79.2 | 72.3 | ||
| XCOM 2 (2016) | 96 | 85.4 | 57.4 | ||
| Far Cry Primal (2016) | 76 | 75 | 73 | ||
| The Division (2016) | 133 | 122 | 70.1 | ||
| Need for Speed 2016 (2016) | 106 | 89.5 | 87.8 | ||
| Doom (2016) | 147 | 141 | 83.2 | ||
| Overwatch (2016) | 294 | 291 | 211 | ||
| Mirror's Edge Catalyst (2016) | 115 | 112 | 65.5 |
| Mirror's Edge Catalyst - 3840x2160 High Preset AF:16x | |
| Schenker XMG U727 | |
| Asus GX800 Prototype | |
| Asus G800VI Prototype | |
| MSI GT62VR-6RE16H21 | |
| Asus GX800 Prototype | |
| Overwatch - 3840x2160 High (Render Scale 100 %) AA:SM AF:4x | |
| Schenker XMG U727 | |
| Asus GX800 Prototype | |
| Asus G800VI Prototype | |
| MSI GT62VR-6RE16H21 | |
| Asus GX800 Prototype | |
| Doom - 3840x2160 High Preset AA:FX | |
| Schenker XMG U727 | |
| Asus GX800 Prototype | |
| Asus G800VI Prototype | |
| MSI GT62VR-6RE16H21 | |
| Asus GX800 Prototype | |
| Need for Speed 2016 - 3840x2160 High / On AA:FX | |
| Schenker XMG U727 | |
| Asus GX800 Prototype | |
| Asus G800VI Prototype | |
| MSI GT62VR-6RE16H21 | |
| Asus GX800 Prototype | |
| The Division - 3840x2160 High Preset AF:8x | |
| Schenker XMG U727 | |
| Asus GX800 Prototype | |
| Asus G800VI Prototype | |
| MSI GT62VR-6RE16H21 | |
| Asus GX800 Prototype | |
| Far Cry Primal - 3840x2160 High Preset AA:SM | |
| Schenker XMG U727 | |
| Asus GX800 Prototype | |
| Asus G800VI Prototype | |
| MSI GT62VR-6RE16H21 | |
| Asus GX800 Prototype | |
| XCOM 2 - 3840x2160 High Preset AA:FX AF:8x | |
| Schenker XMG U727 | |
| Asus GX800 Prototype | |
| Asus G800VI Prototype | |
| MSI GT62VR-6RE16H21 | |
| Asus GX800 Prototype | |
| Rise of the Tomb Raider - 3840x2160 High Preset AA:FX AF:4x | |
| Schenker XMG U727 | |
| Asus GX800 Prototype | |
| Asus G800VI Prototype | |
| MSI GT62VR-6RE16H21 | |
| Asus GX800 Prototype | |
Noise level
| Idle |
| 33 / 35 / 40 dB(A) |
| HDD |
| 33 dB(A) |
| Load |
| 44 / 53 dB(A) |
 | ||
30 dB silent 40 dB(A) audible 50 dB(A) loud |
||
min: | ||
| Schenker XMG U727 GeForce GTX 1080 SLI (Laptop), 6700 | MSI GT80S 6QF GeForce GTX 980 SLI (Laptop), 6820HK | Schenker XMG U726 GeForce GTX 980 (Laptop), 6700 | MSI GT73VR-6RE16SR451 GeForce GTX 1070 Mobile, 6820HK | Asus G752VS-XB78K GeForce GTX 1070 Mobile, 6820HK | |
|---|---|---|---|---|---|
| Noise | -7% | 7% | 8% | 9% | |
| off / environment * (dB) | 30 | 30 -0% | 30 -0% | ||
| Idle Minimum * (dB) | 33 | 34 -3% | 33 -0% | 32 3% | 31 6% |
| Idle Average * (dB) | 35 | 36 -3% | 34 3% | 33 6% | 32 9% |
| Idle Maximum * (dB) | 40 | 40 -0% | 35 12% | 35 12% | 33 17% |
| Load Average * (dB) | 44 | 51 -16% | 42 5% | 35 20% | 40 9% |
| Load Maximum * (dB) | 53 | 60 -13% | 46 13% | 49 8% | 47 11% |
* ... smaller is better
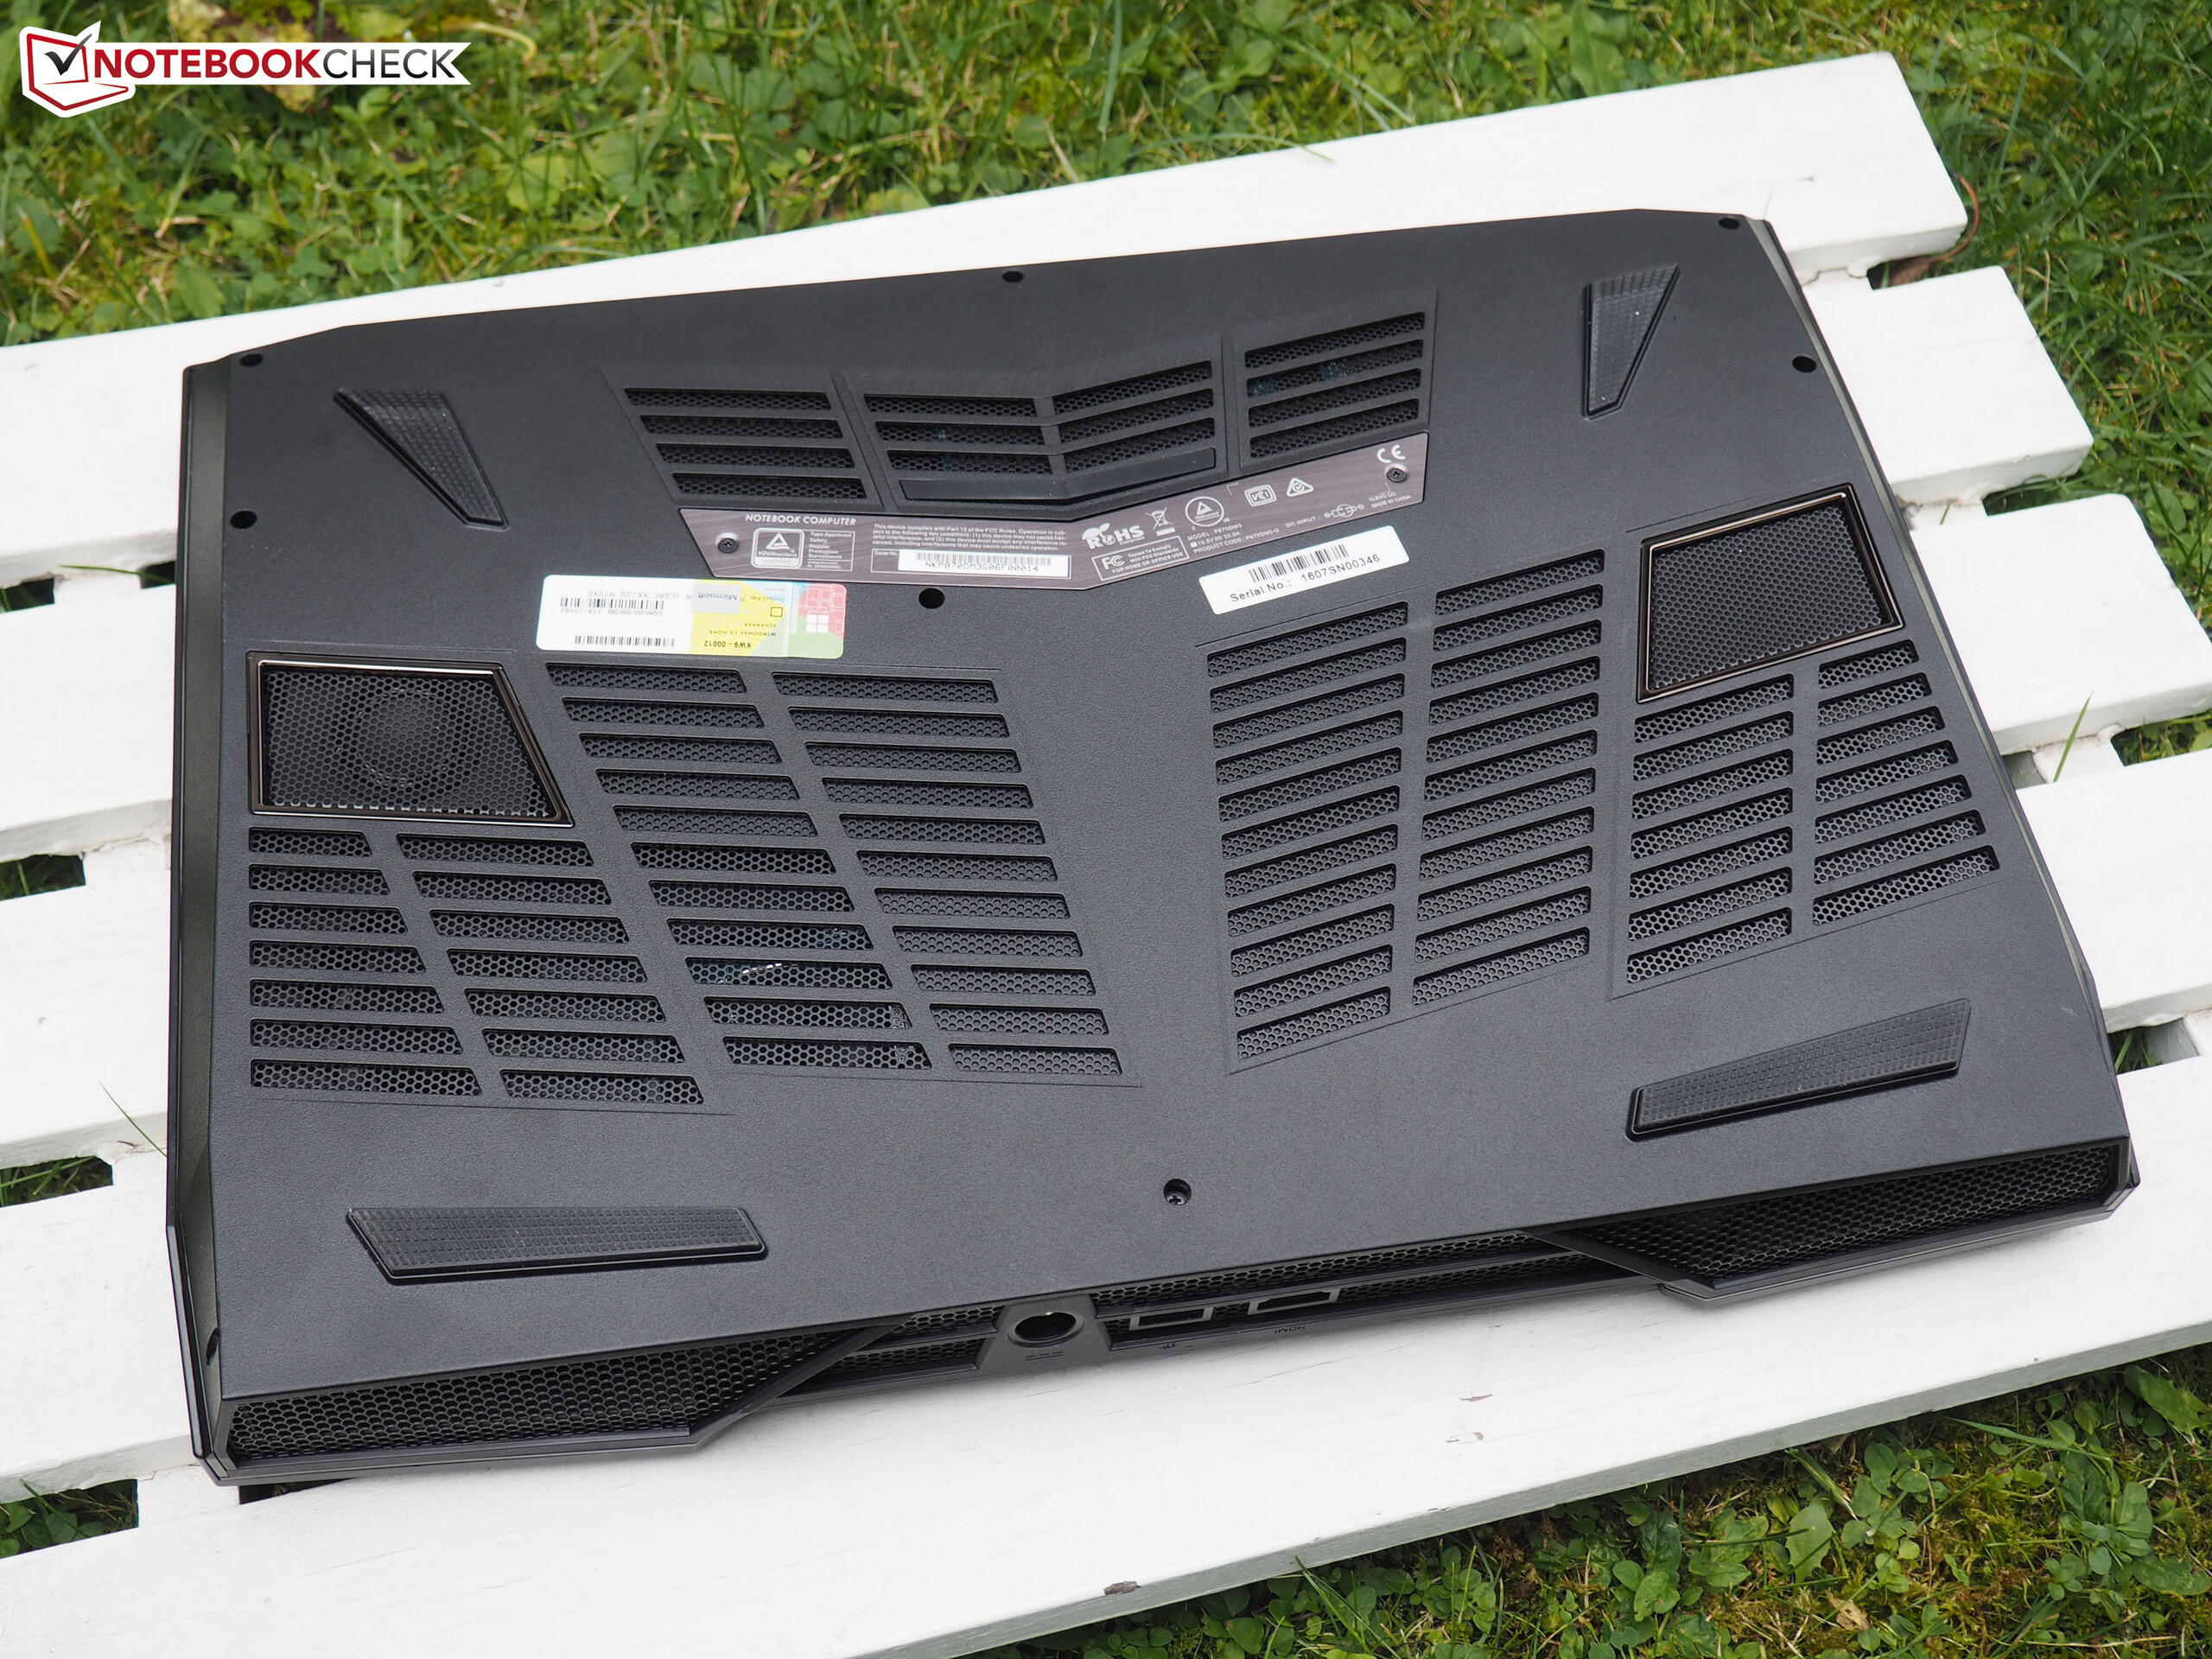
(-) The maximum temperature on the upper side is 55.8 °C / 132 F, compared to the average of 40.4 °C / 105 F, ranging from 21.2 to 68.8 °C for the class Gaming.
(-) The bottom heats up to a maximum of 63.7 °C / 147 F, compared to the average of 43.2 °C / 110 F
(±) In idle usage, the average temperature for the upper side is 32.9 °C / 91 F, compared to the device average of 33.9 °C / 93 F.
(-) The palmrests and touchpad can get very hot to the touch with a maximum of 47.5 °C / 117.5 F.
(-) The average temperature of the palmrest area of similar devices was 28.8 °C / 83.8 F (-18.7 °C / -33.7 F).
| Schenker XMG U727 GeForce GTX 1080 SLI (Laptop), 6700 | MSI GT80S 6QF GeForce GTX 980 SLI (Laptop), 6820HK | Schenker XMG U726 GeForce GTX 980 (Laptop), 6700 | MSI GT73VR-6RE16SR451 GeForce GTX 1070 Mobile, 6820HK | Asus G752VS-XB78K GeForce GTX 1070 Mobile, 6820HK | |
|---|---|---|---|---|---|
| Heat | 1% | -1% | 12% | 21% | |
| Maximum Upper Side * (°C) | 55.8 | 45.7 18% | 46.9 16% | 44.9 20% | 42.9 23% |
| Maximum Bottom * (°C) | 63.7 | 61 4% | 61 4% | 51.2 20% | 41.5 35% |
| Idle Upper Side * (°C) | 34.7 | 36.4 -5% | 36.3 -5% | 32.7 6% | 31.6 9% |
| Idle Bottom * (°C) | 34.7 | 39.2 -13% | 40.8 -18% | 34.2 1% | 29.5 15% |
* ... smaller is better
Schenker XMG U727 audio analysis
(+) | speakers can play relatively loud (87 dB)
Bass 100 - 315 Hz
(±) | reduced bass - on average 9.3% lower than median
(±) | linearity of bass is average (12.4% delta to prev. frequency)
Mids 400 - 2000 Hz
(+) | balanced mids - only 3.7% away from median
(+) | mids are linear (5.3% delta to prev. frequency)
Highs 2 - 16 kHz
(+) | balanced highs - only 1.4% away from median
(+) | highs are linear (4% delta to prev. frequency)
Overall 100 - 16.000 Hz
(+) | overall sound is linear (10.2% difference to median)
Compared to same class
» 5% of all tested devices in this class were better, 2% similar, 93% worse
» The best had a delta of 6%, average was 18%, worst was 132%
Compared to all devices tested
» 5% of all tested devices were better, 1% similar, 94% worse
» The best had a delta of 4%, average was 24%, worst was 134%
MSI GT73VR-6RE16SR451 audio analysis
(+) | speakers can play relatively loud (82 dB)
Bass 100 - 315 Hz
(±) | reduced bass - on average 6.2% lower than median
(+) | bass is linear (6.4% delta to prev. frequency)
Mids 400 - 2000 Hz
(+) | balanced mids - only 1.6% away from median
(+) | mids are linear (5.3% delta to prev. frequency)
Highs 2 - 16 kHz
(±) | higher highs - on average 6.6% higher than median
(+) | highs are linear (6.8% delta to prev. frequency)
Overall 100 - 16.000 Hz
(+) | overall sound is linear (13.8% difference to median)
Compared to same class
» 21% of all tested devices in this class were better, 7% similar, 72% worse
» The best had a delta of 6%, average was 18%, worst was 132%
Compared to all devices tested
» 15% of all tested devices were better, 4% similar, 81% worse
» The best had a delta of 4%, average was 24%, worst was 134%
Asus G752VS-XB78K audio analysis
(±) | speaker loudness is average but good (76 dB)
Bass 100 - 315 Hz
(±) | reduced bass - on average 9.6% lower than median
(±) | linearity of bass is average (10.7% delta to prev. frequency)
Mids 400 - 2000 Hz
(+) | balanced mids - only 4.7% away from median
(±) | linearity of mids is average (10.3% delta to prev. frequency)
Highs 2 - 16 kHz
(±) | reduced highs - on average 8.3% lower than median
(±) | linearity of highs is average (9.7% delta to prev. frequency)
Overall 100 - 16.000 Hz
(±) | linearity of overall sound is average (22.4% difference to median)
Compared to same class
» 80% of all tested devices in this class were better, 6% similar, 14% worse
» The best had a delta of 6%, average was 18%, worst was 132%
Compared to all devices tested
» 65% of all tested devices were better, 6% similar, 29% worse
» The best had a delta of 4%, average was 24%, worst was 134%
| Off / Standby | |
| Idle | |
| Load |
|
Key:
min: | |
| Schenker XMG U727 GeForce GTX 1080 SLI (Laptop), 6700 | MSI GT80S 6QF GeForce GTX 980 SLI (Laptop), 6820HK | Schenker XMG U726 GeForce GTX 980 (Laptop), 6700 | MSI GT73VR-6RE16SR451 GeForce GTX 1070 Mobile, 6820HK | Asus G752VS-XB78K GeForce GTX 1070 Mobile, 6820HK | |
|---|---|---|---|---|---|
| Power Consumption | 6% | 22% | 40% | 47% | |
| Idle Minimum * (Watt) | 43 | 44 -2% | 36 16% | 31 28% | 24 44% |
| Idle Average * (Watt) | 53 | 53 -0% | 45 15% | 35 34% | 31 42% |
| Idle Maximum * (Watt) | 64 | 62 3% | 53 17% | 40 37% | 36 44% |
| Load Average * (Watt) | 185 | 163 12% | 139 25% | 106 43% | 94 49% |
| Load Maximum * (Watt) | 490 | 411 16% | 306 38% | 218 56% | 204 58% |
* ... smaller is better
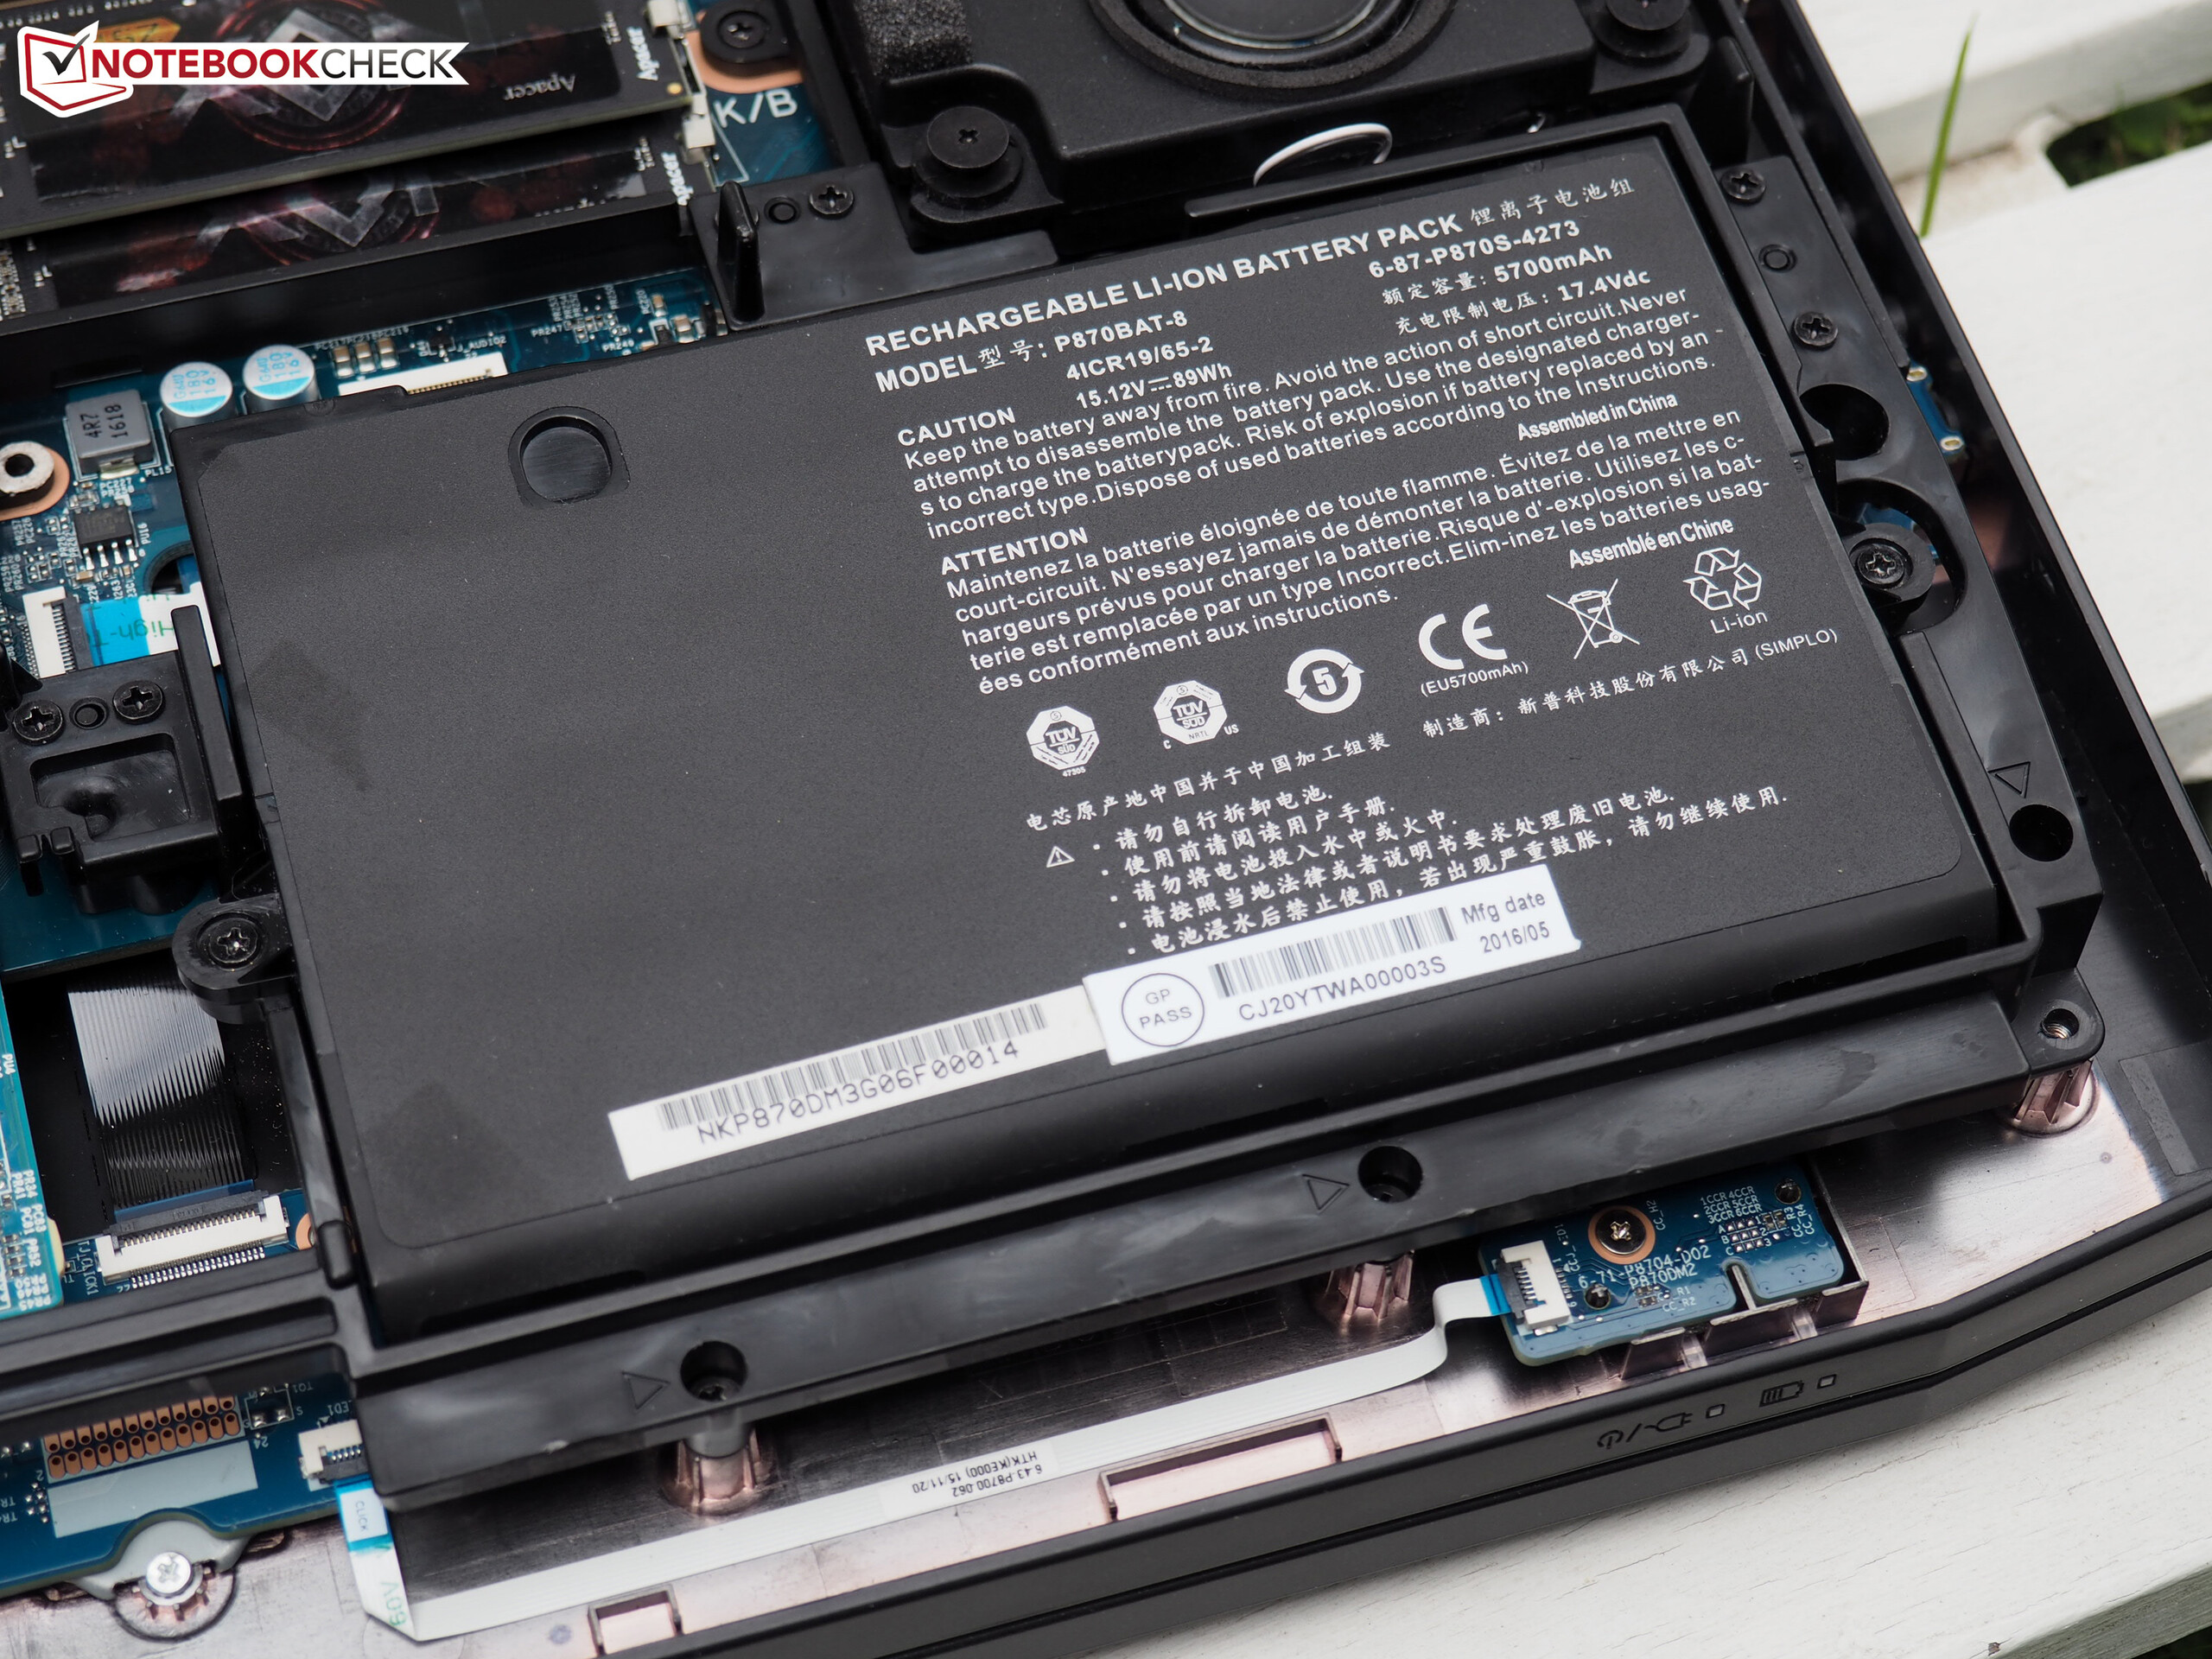
| Schenker XMG U727 89 Wh | MSI GT80S 6QF 75 Wh | Schenker XMG U726 89 Wh | MSI GT73VR-6RE16SR451 75.2 Wh | Asus G752VS-XB78K 90 Wh | |
|---|---|---|---|---|---|
| Battery runtime | -14% | 16% | 49% | 61% | |
| Reader / Idle (h) | 2.6 | 2.5 -4% | 2.8 8% | 4.8 85% | 5.2 100% |
| WiFi v1.3 (h) | 2 | 3.4 70% | 3.5 75% | ||
| Load (h) | 1.3 | 1 -23% | 1.6 23% | 1.2 -8% | 1.4 8% |
| Gaming (h) | 1.1 | ||||
| H.264 (h) | 3.1 |
Pros
Cons
引人瞩目的高端设备还是名不副实的漫天要价?和奢侈运动轿车的情况相似,对这个问题的答案可能因人而异。
是的,你可以说XMG U727售价过高,完全不如同时买一台台式机和一台游戏本。而如果你不想买台式机而仍然希望最大化笔记本电脑的性能的话,那么这台测试机可能值得参考。
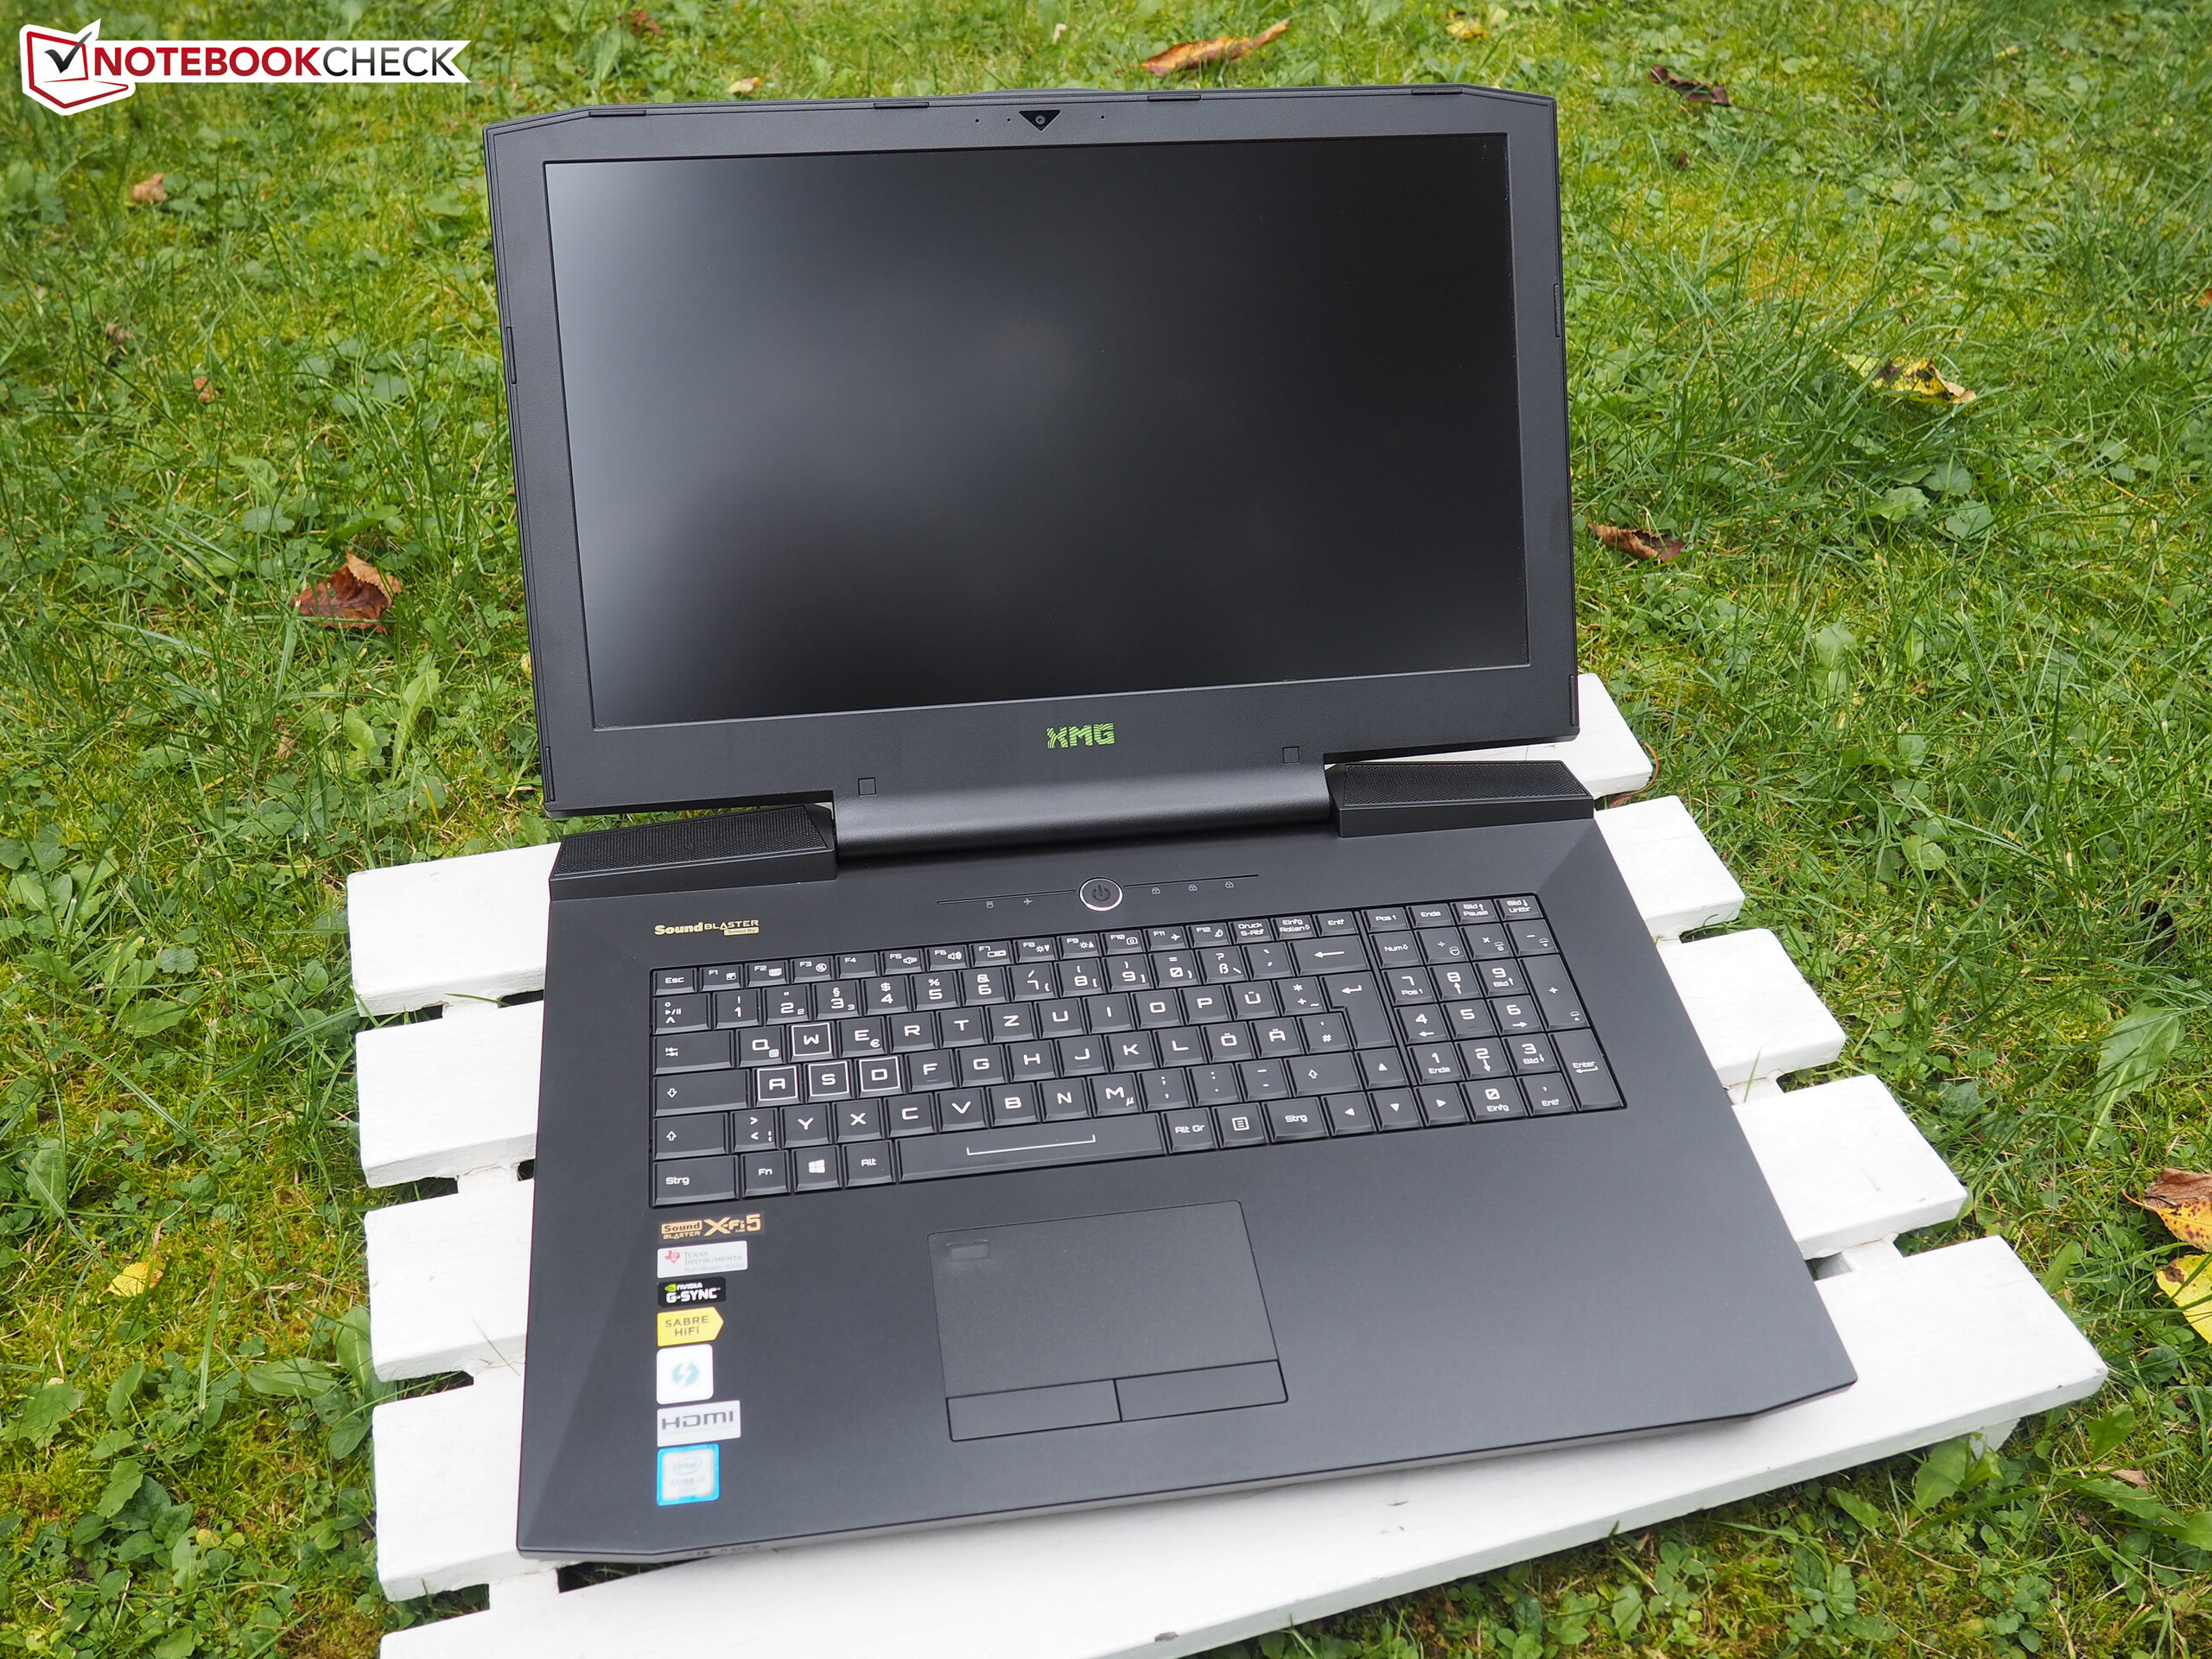
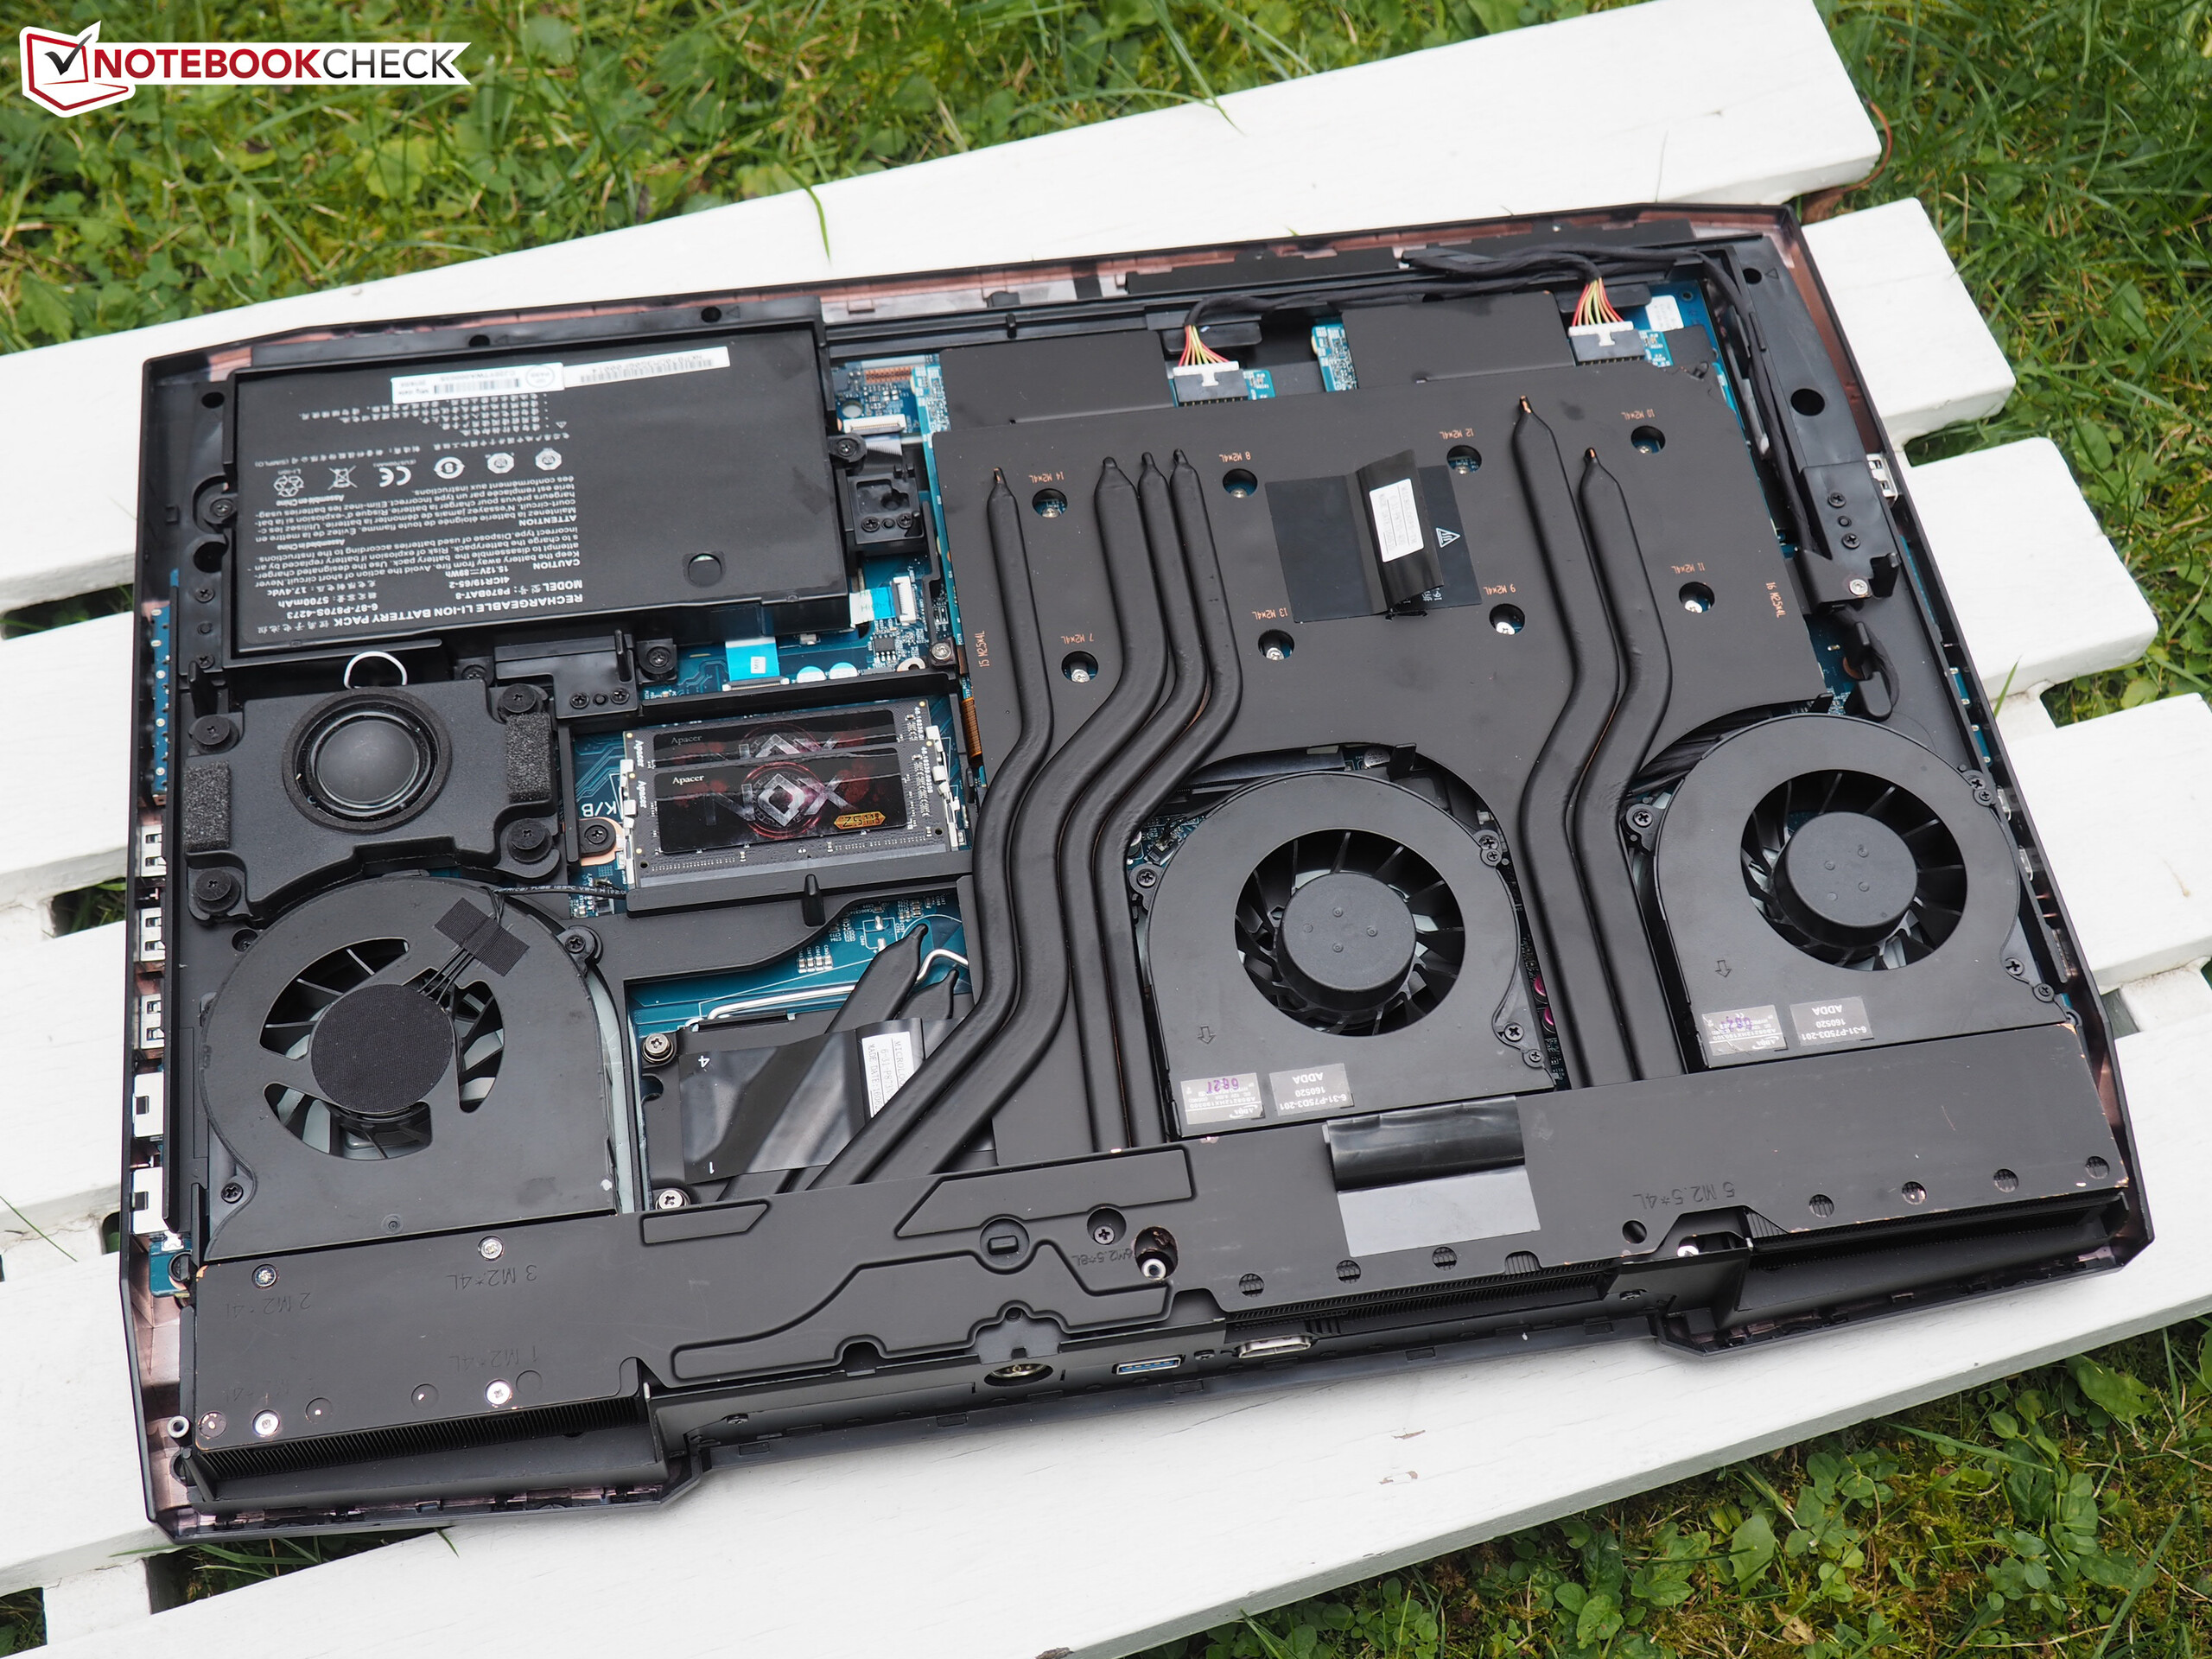
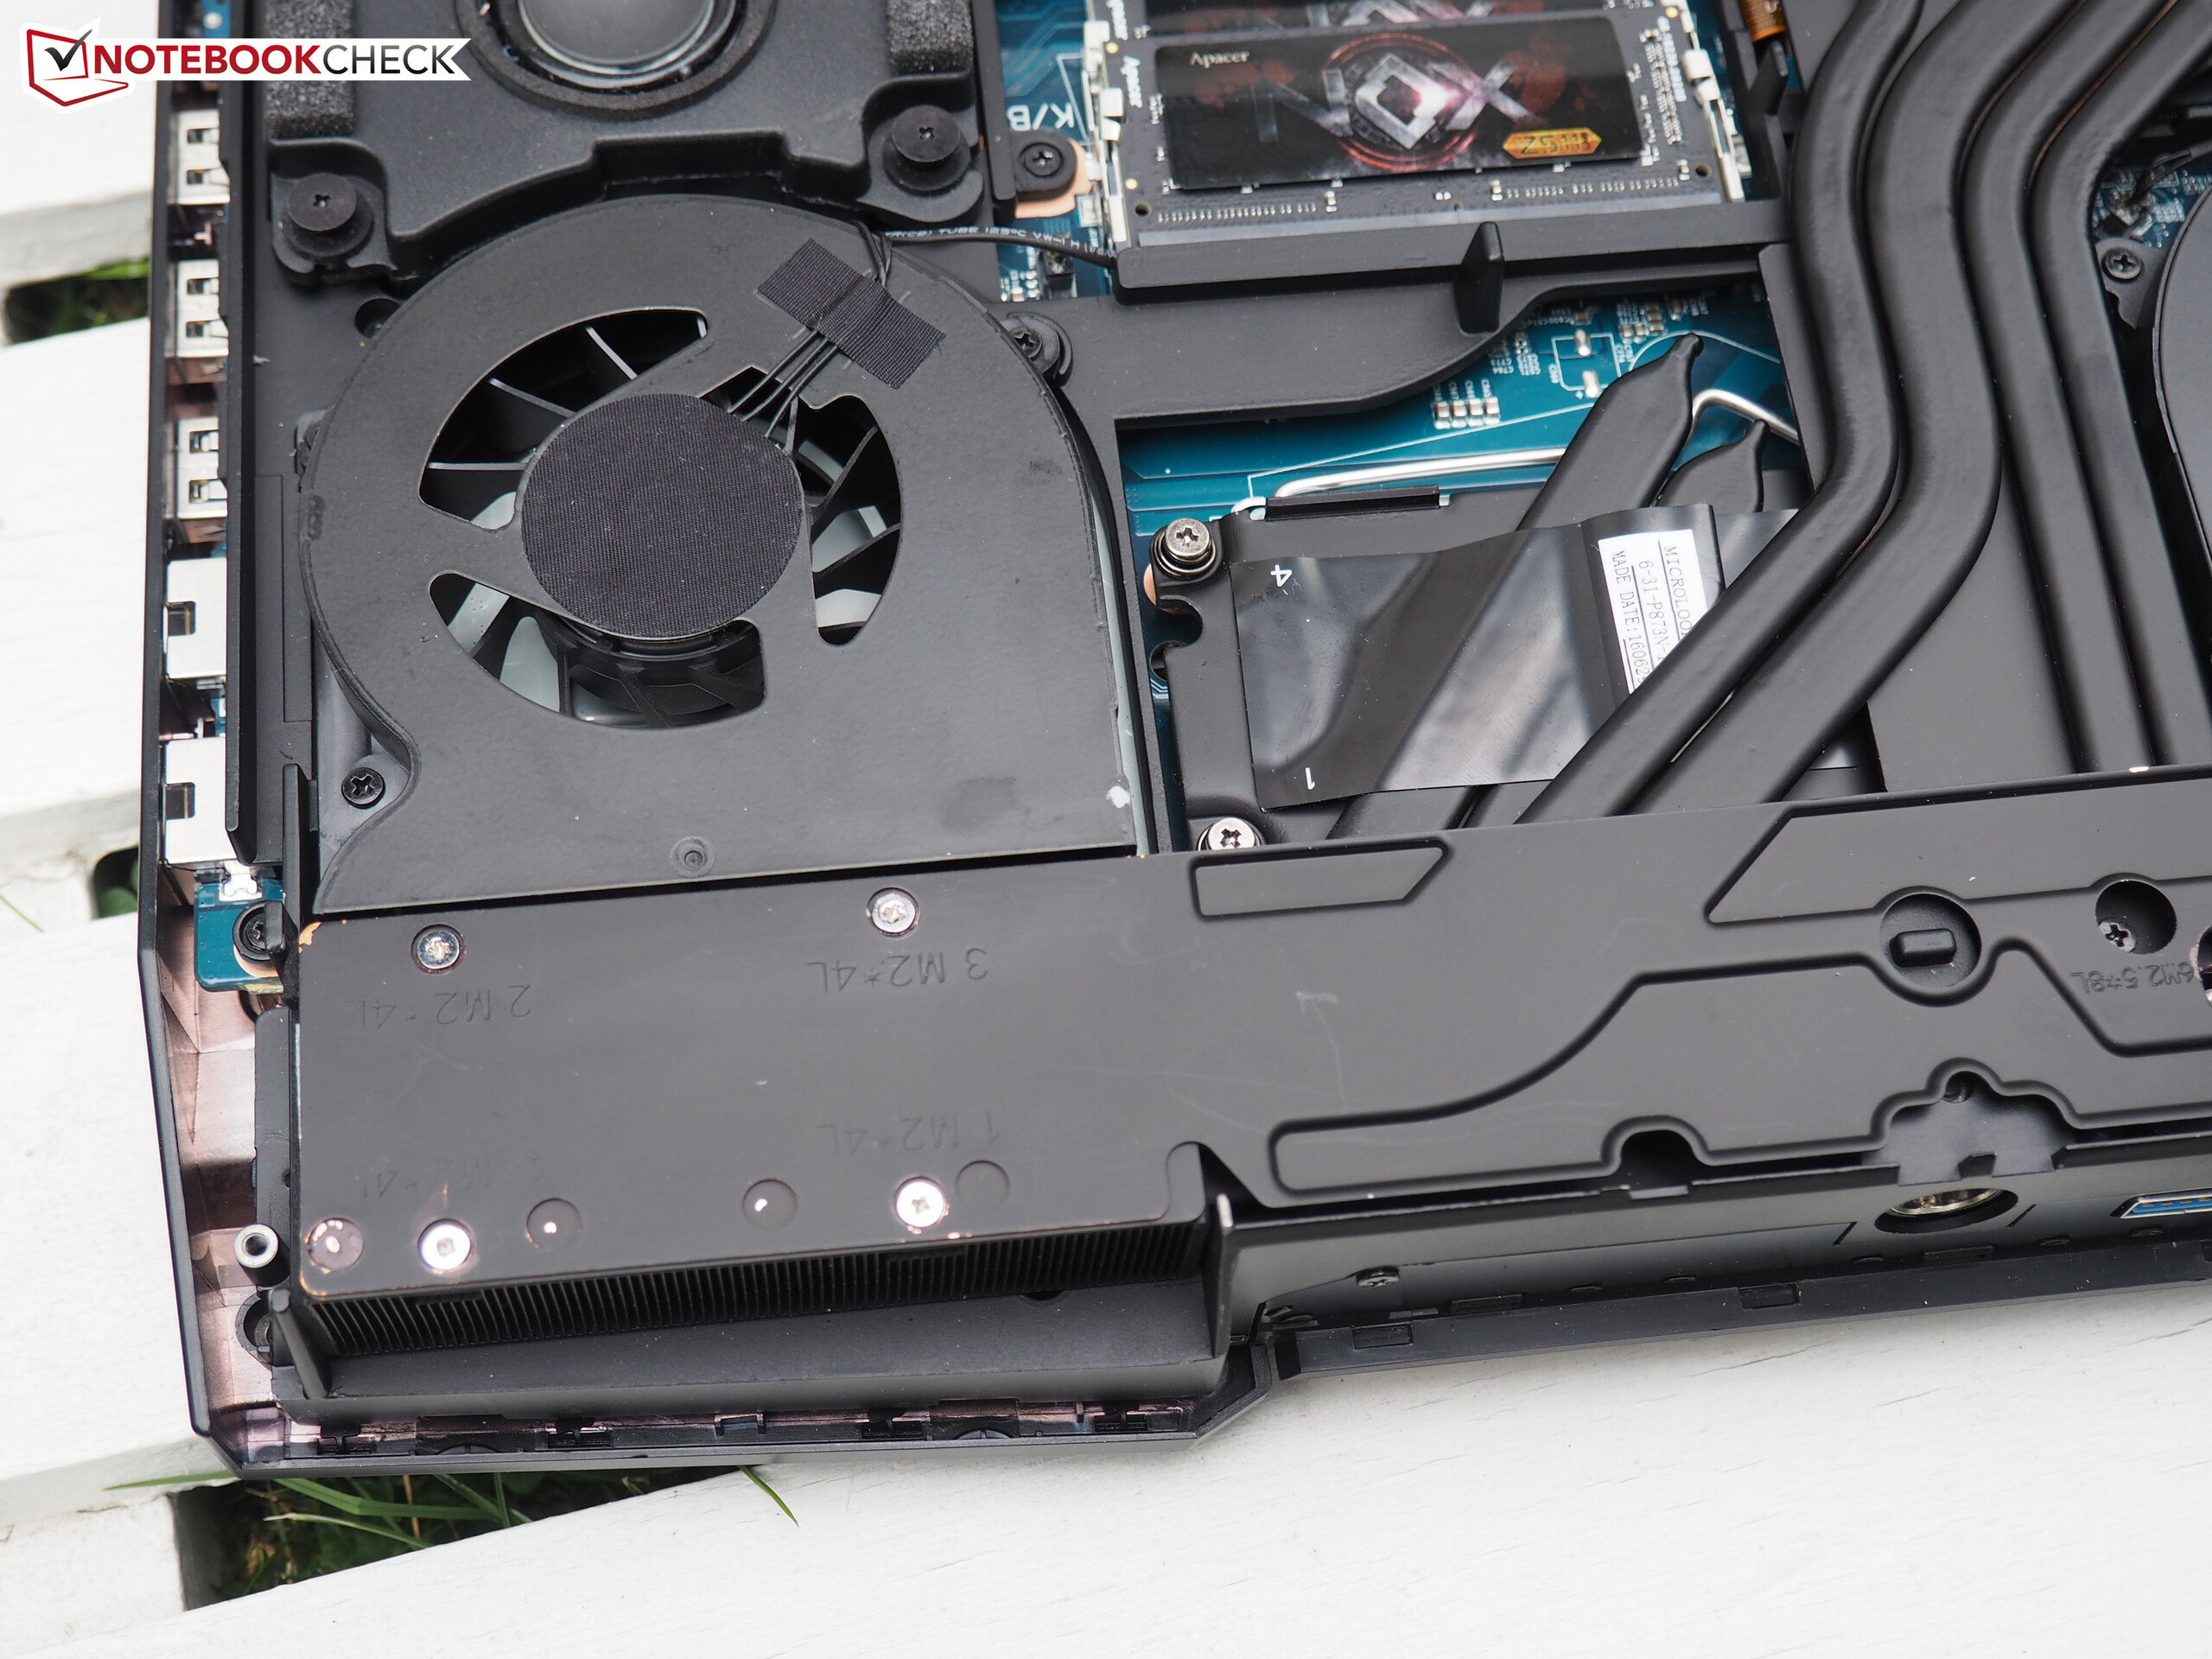
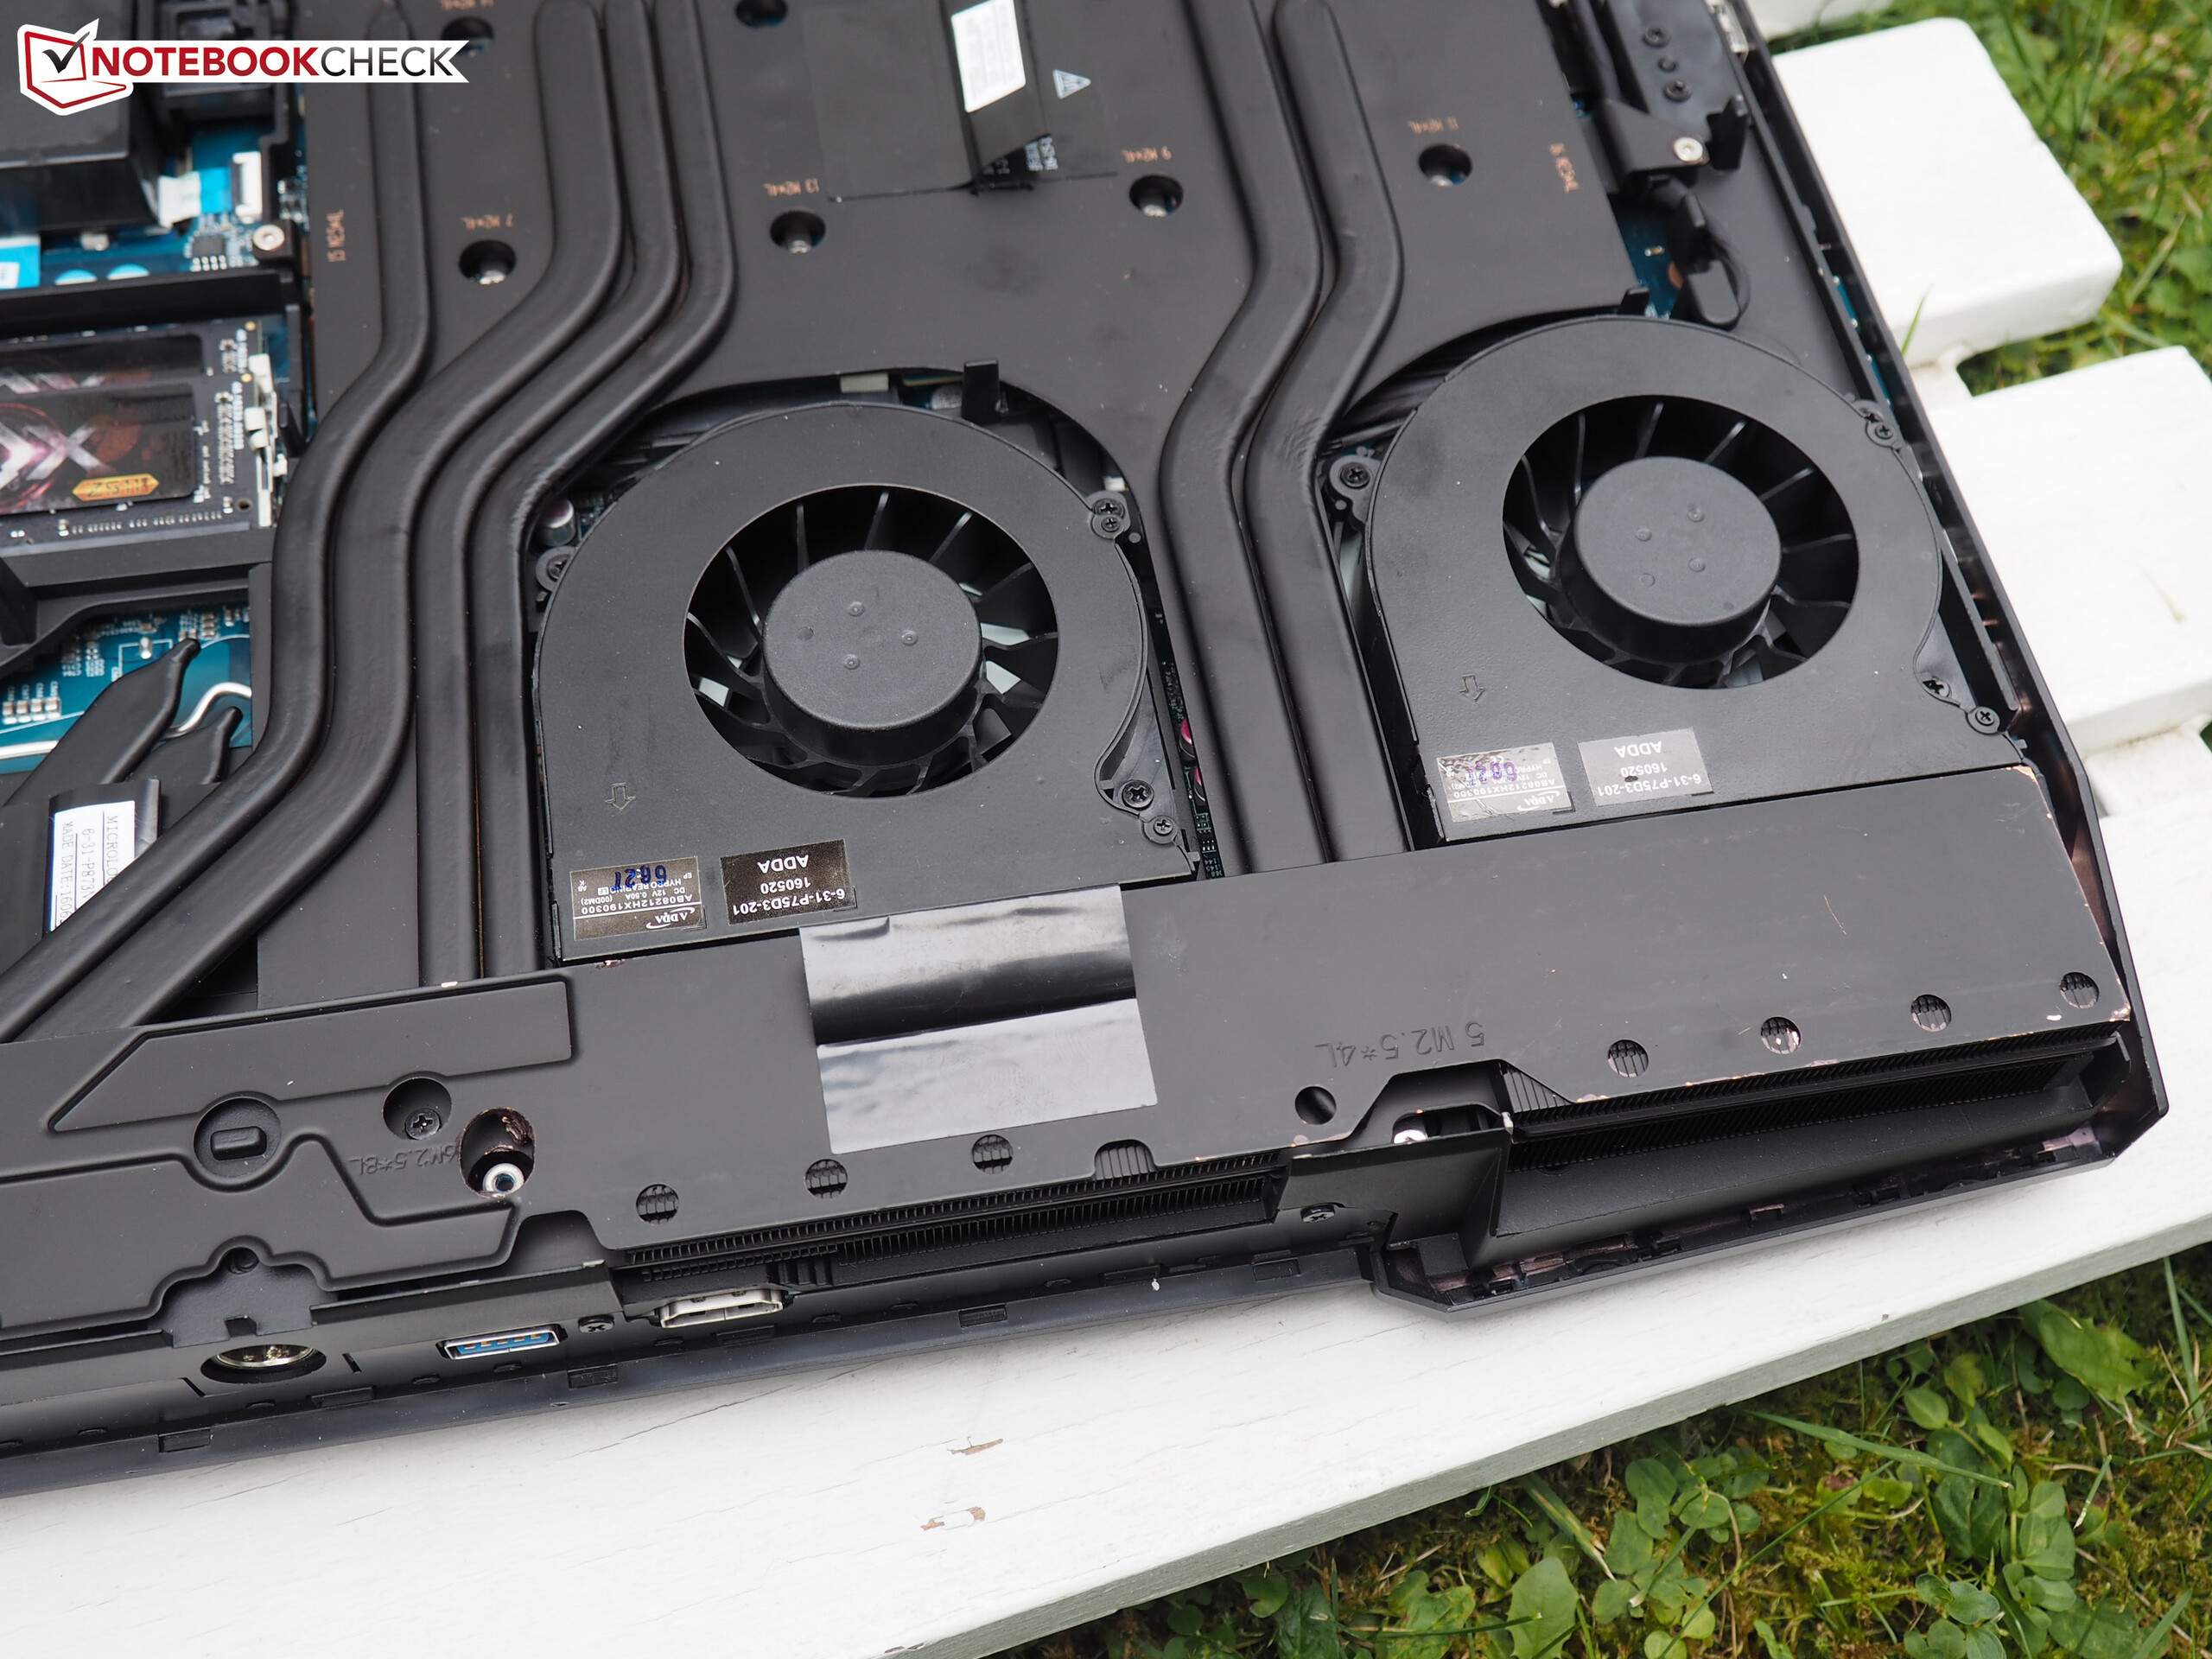
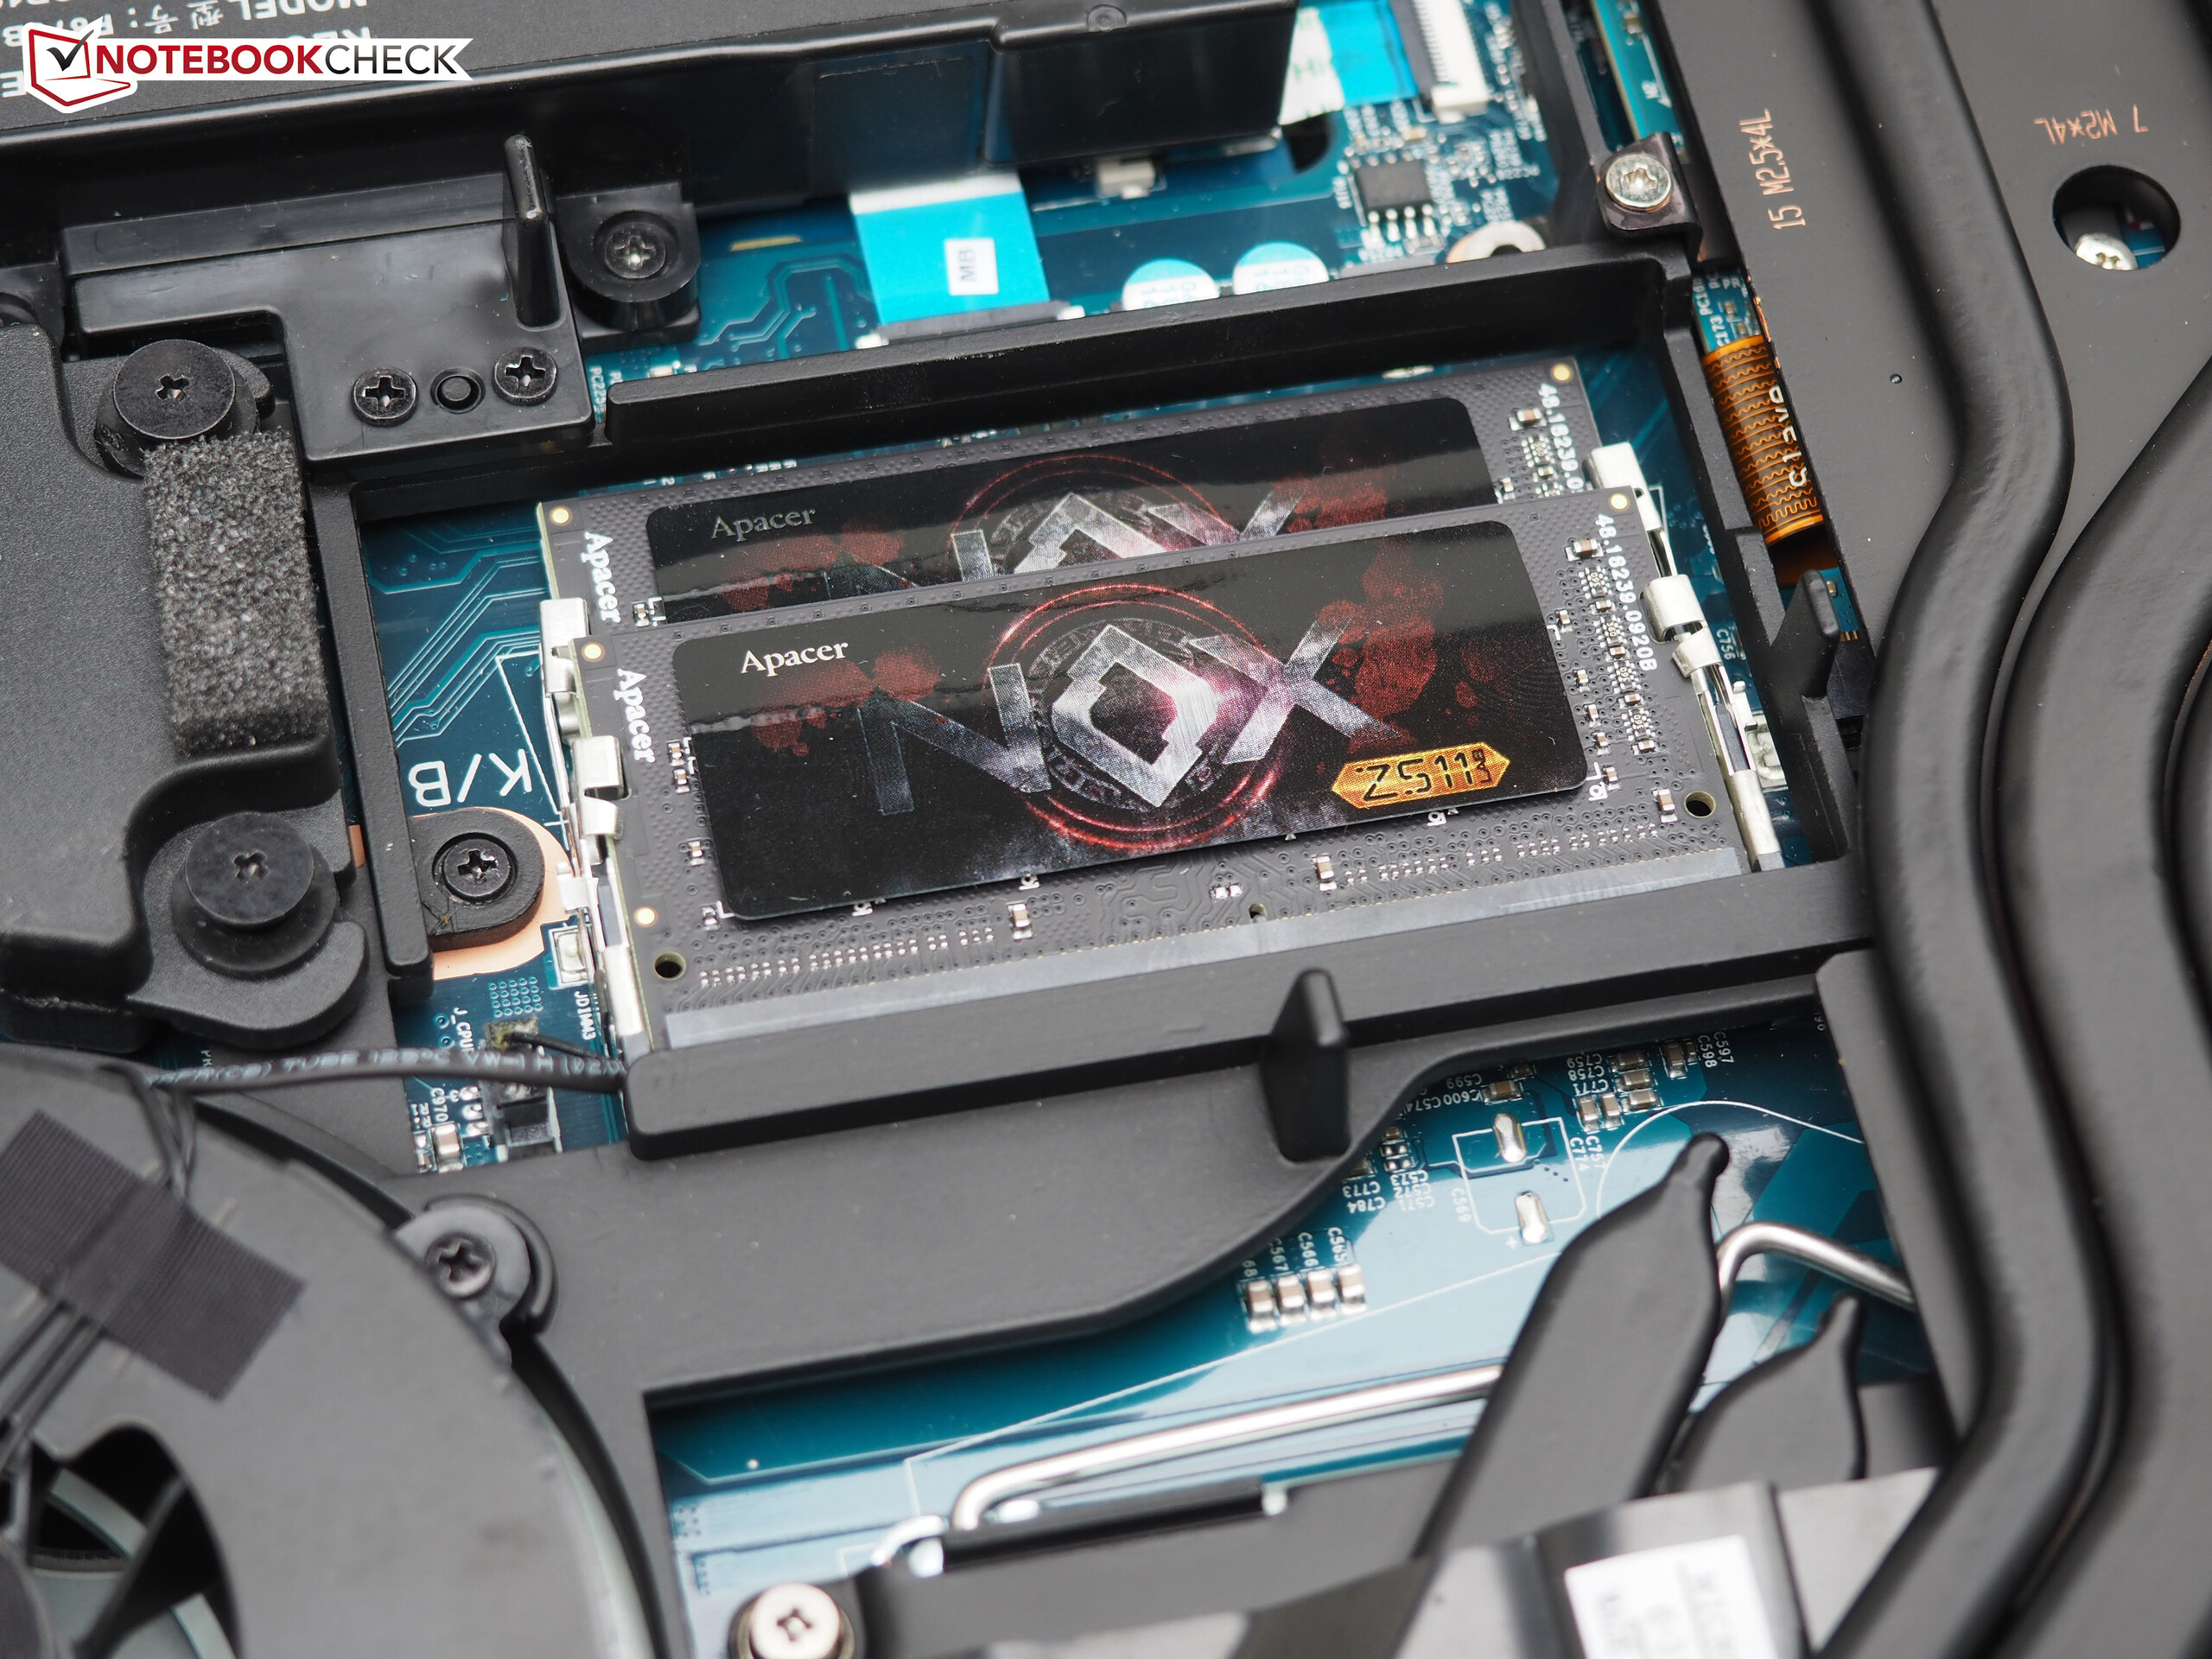
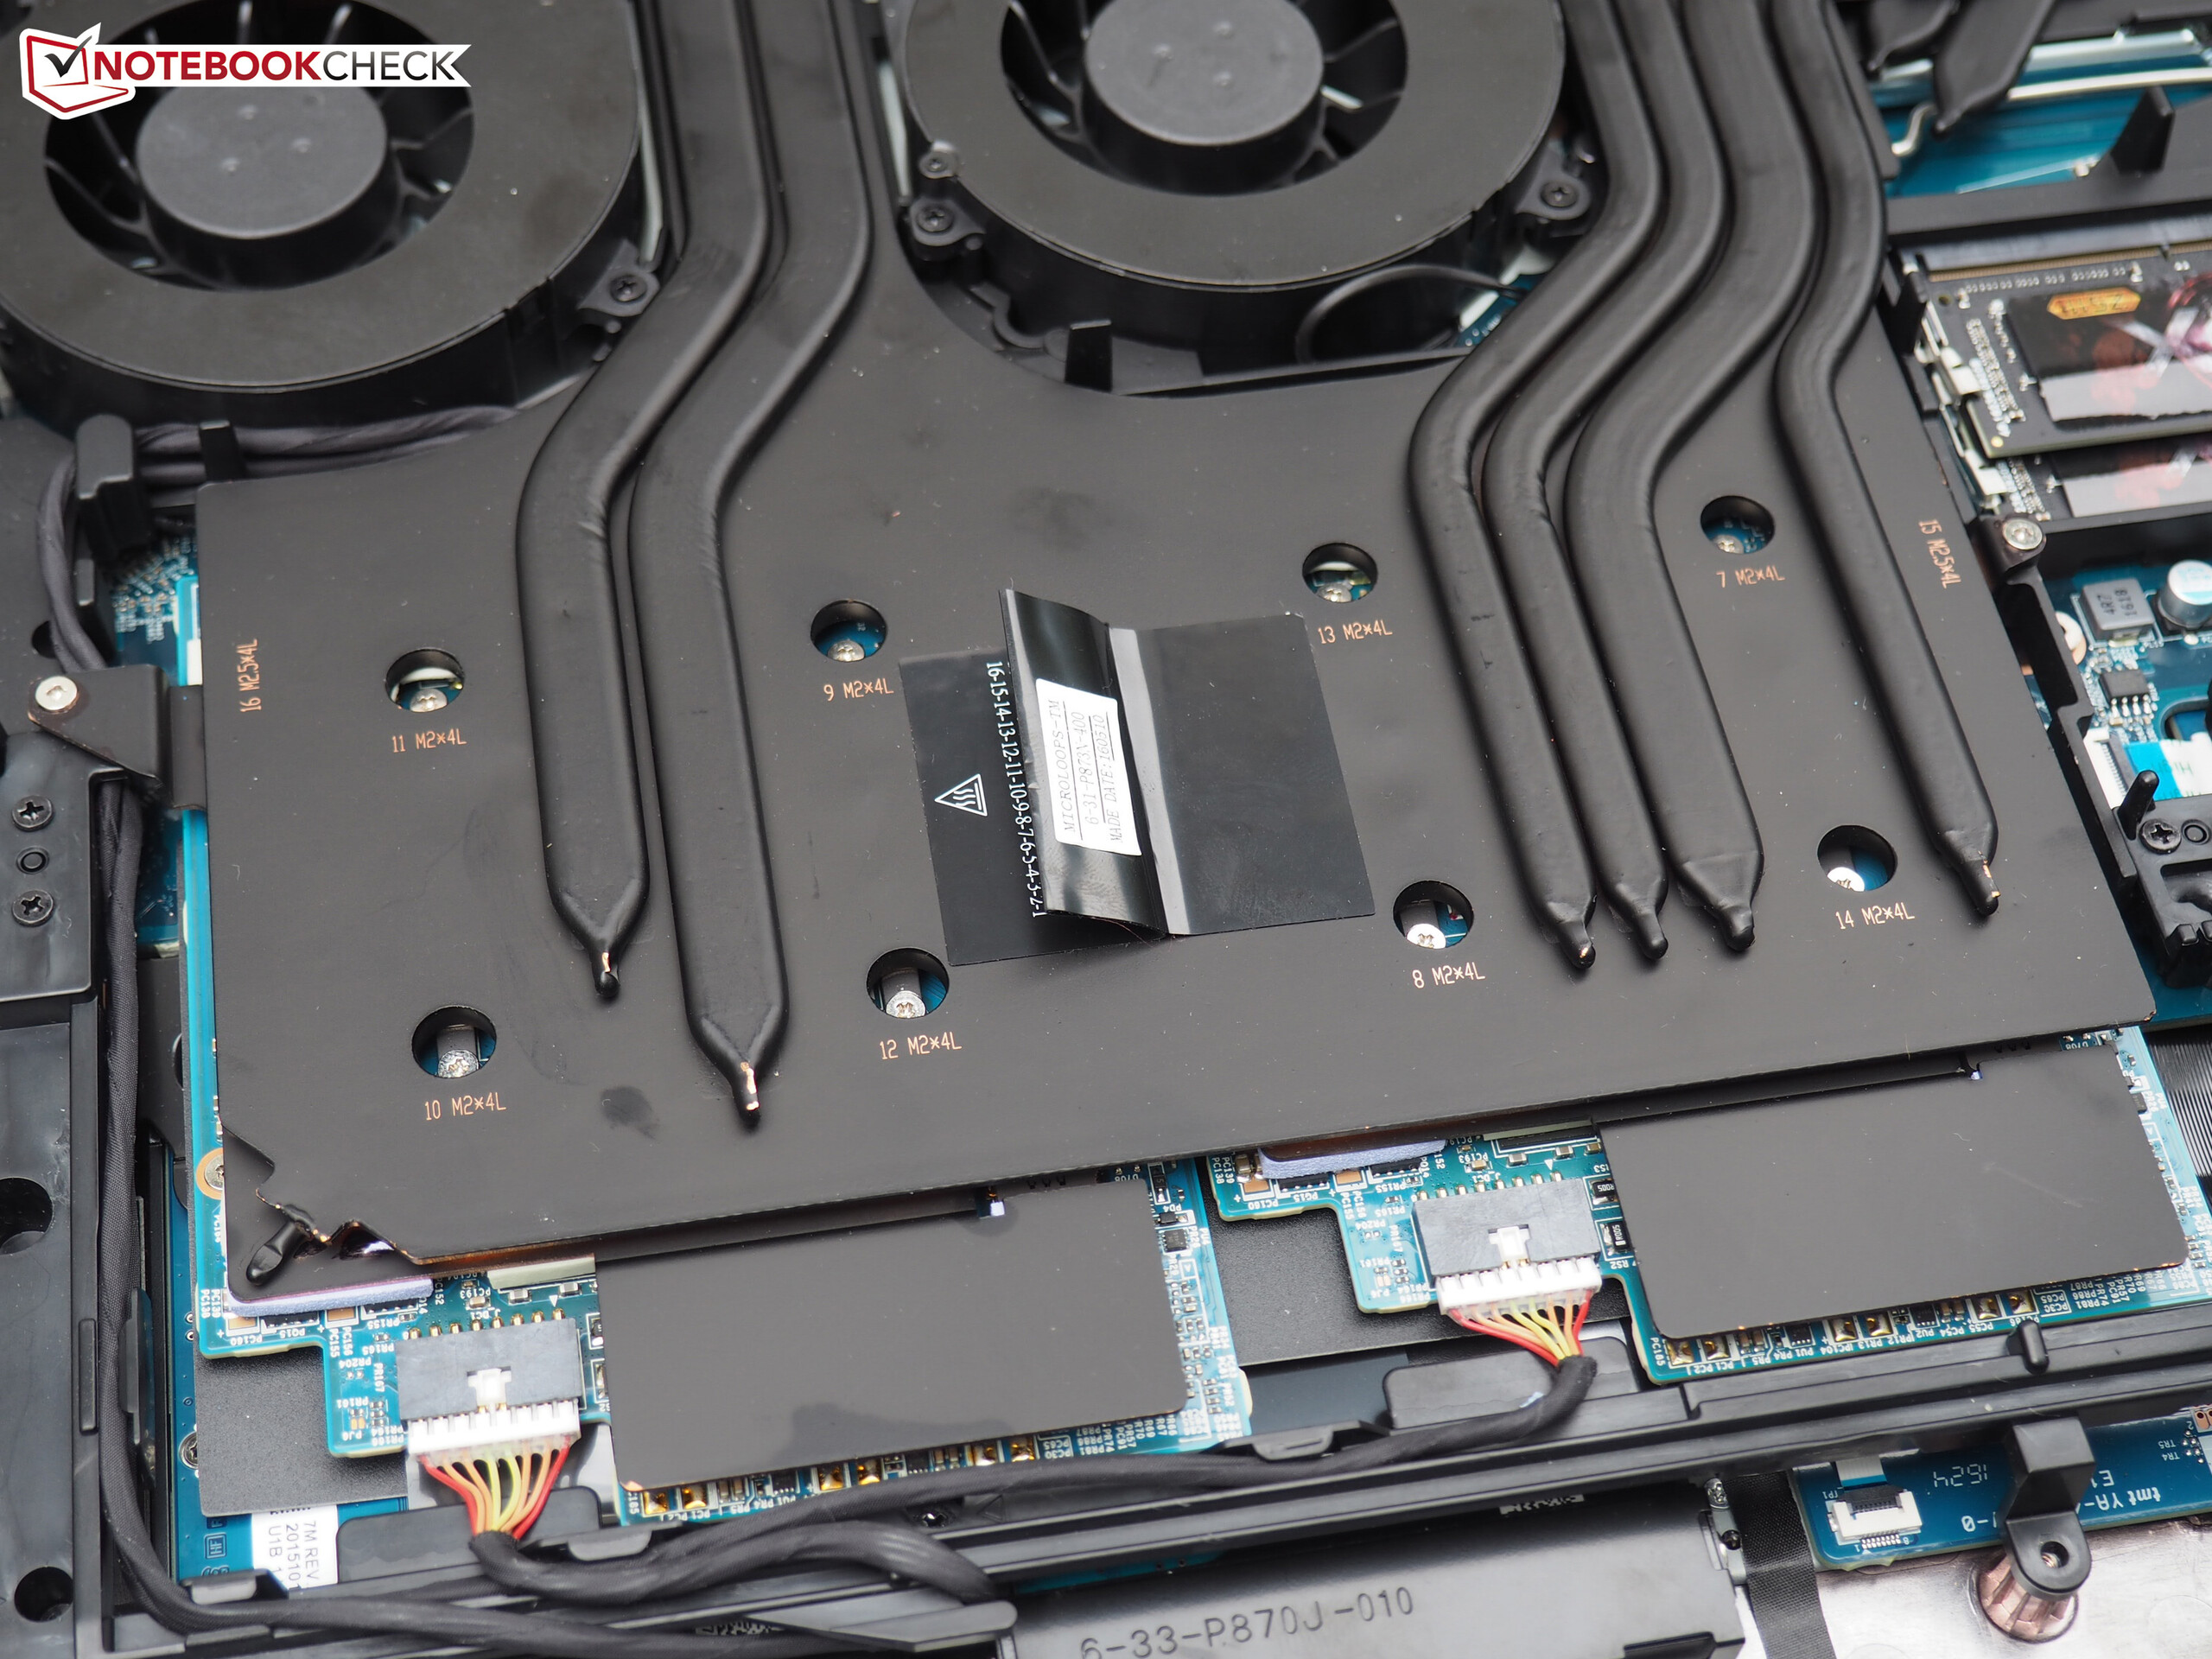
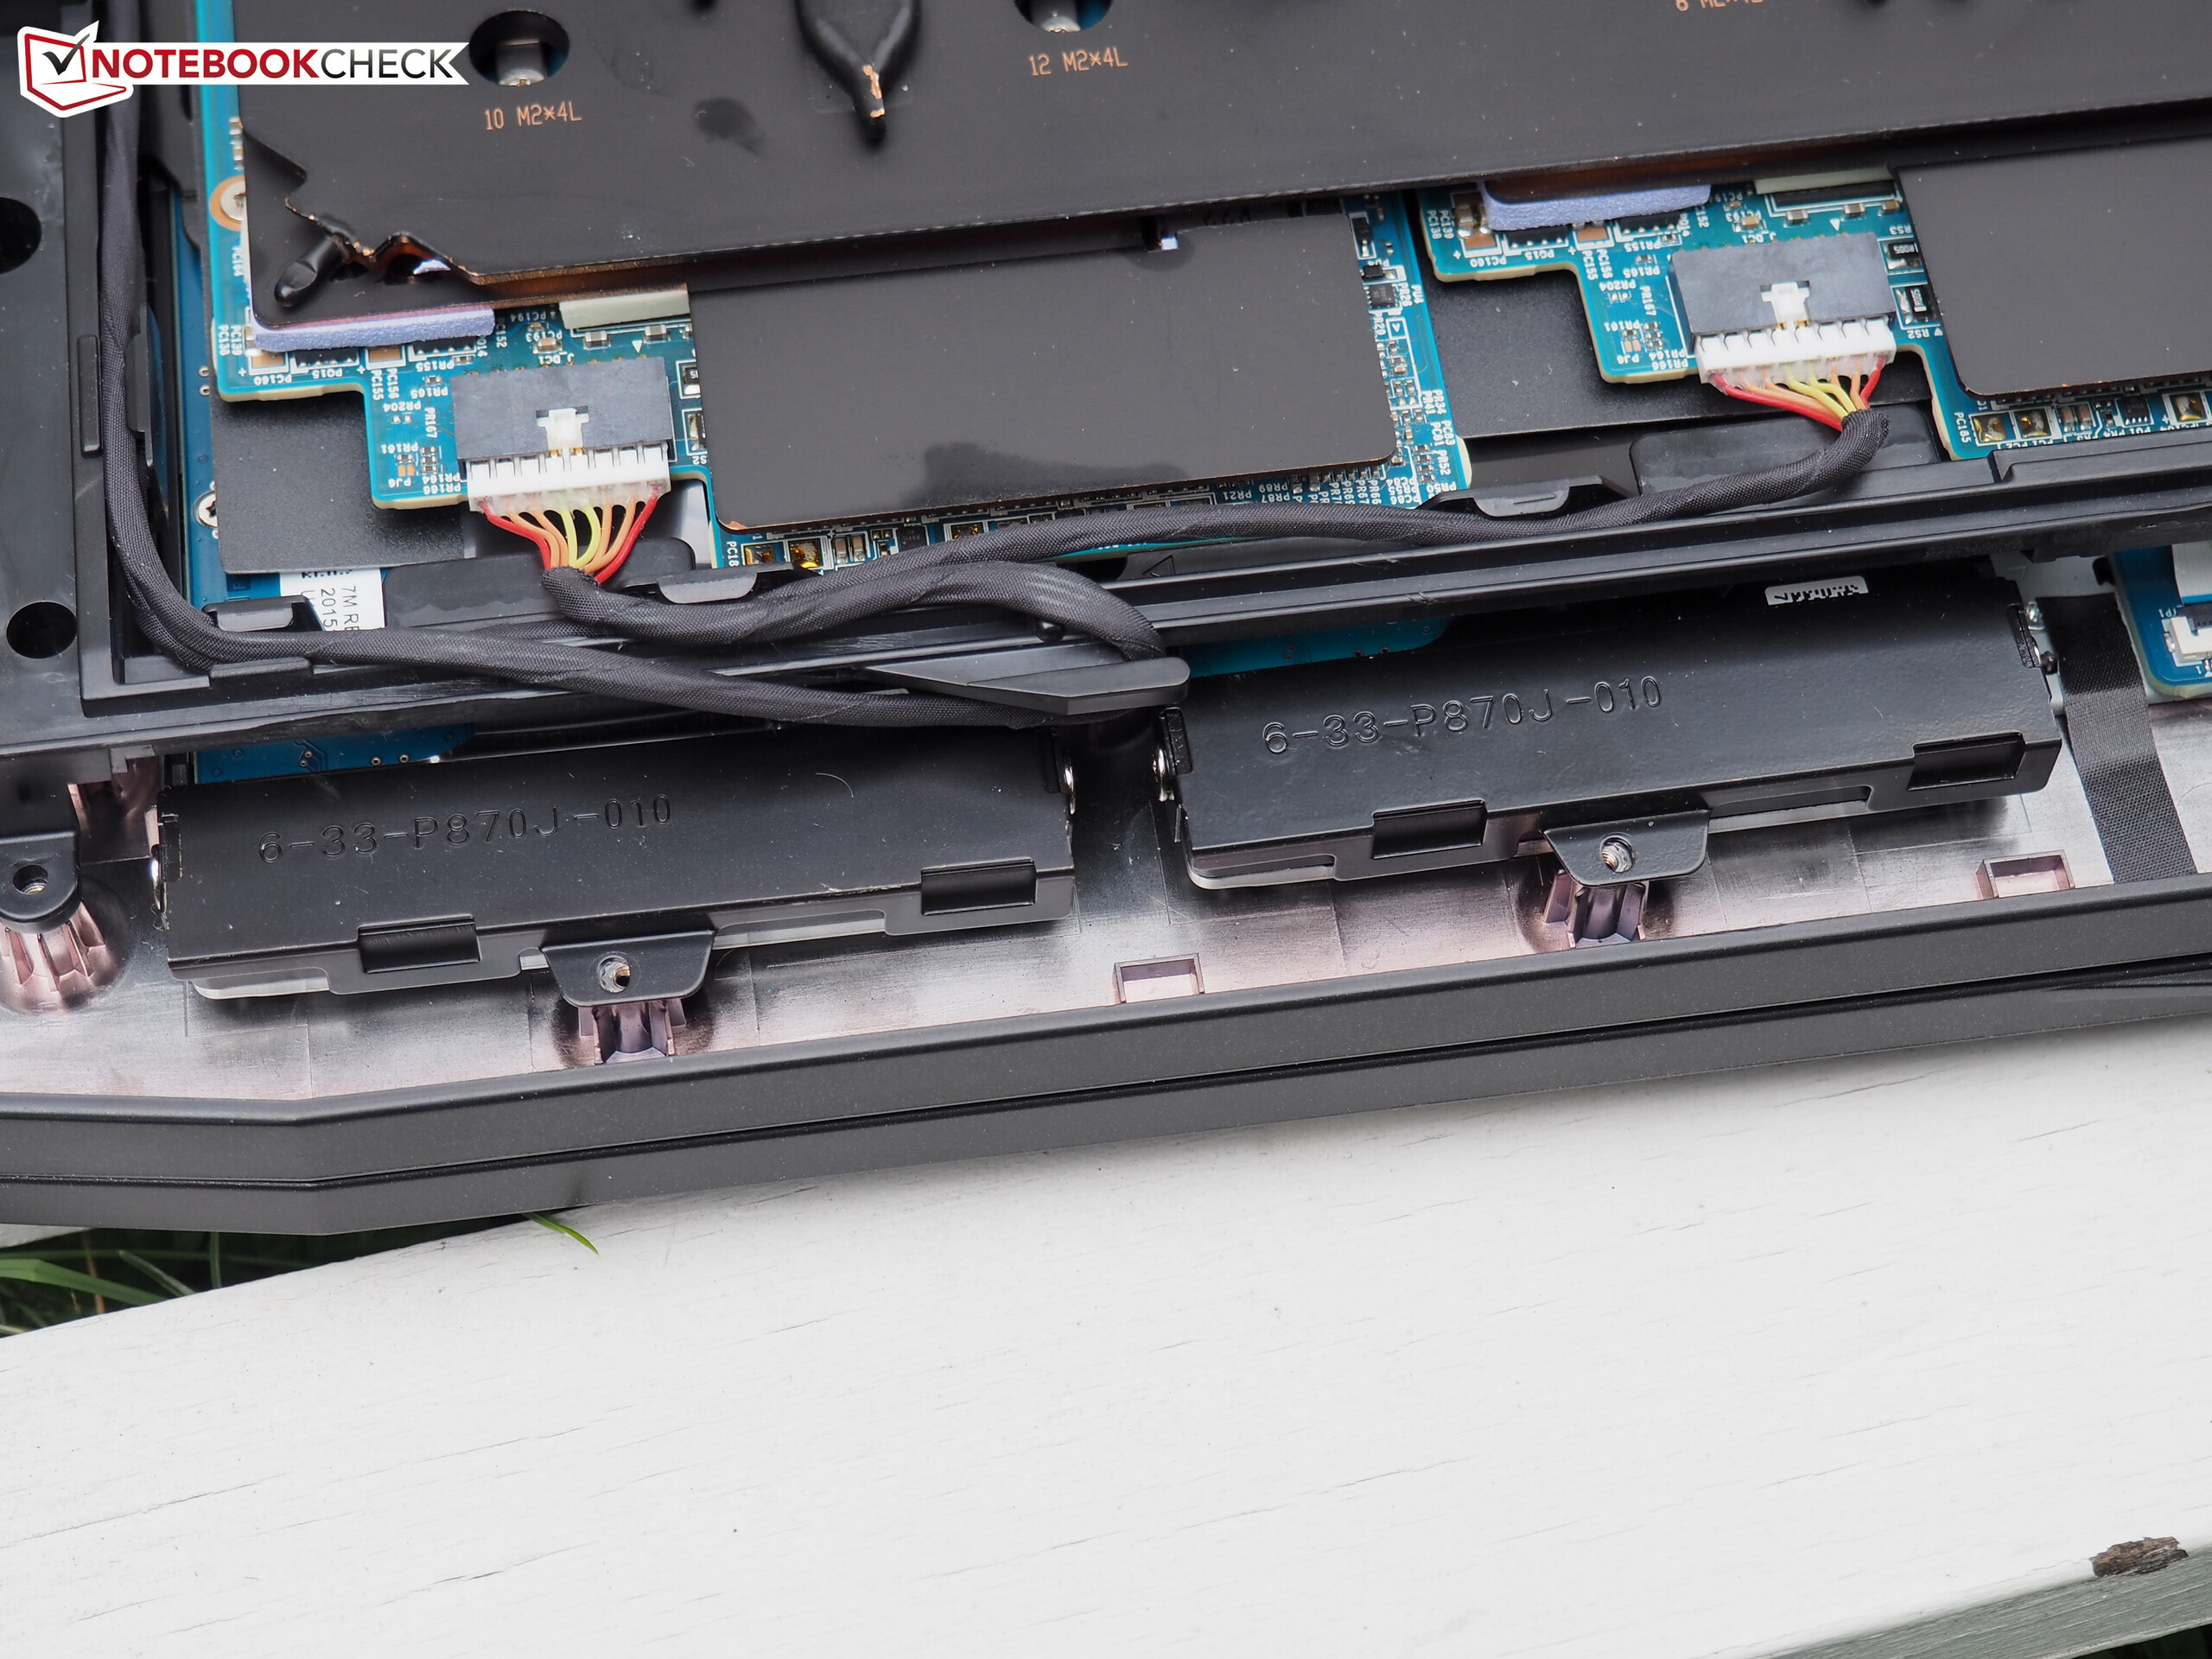
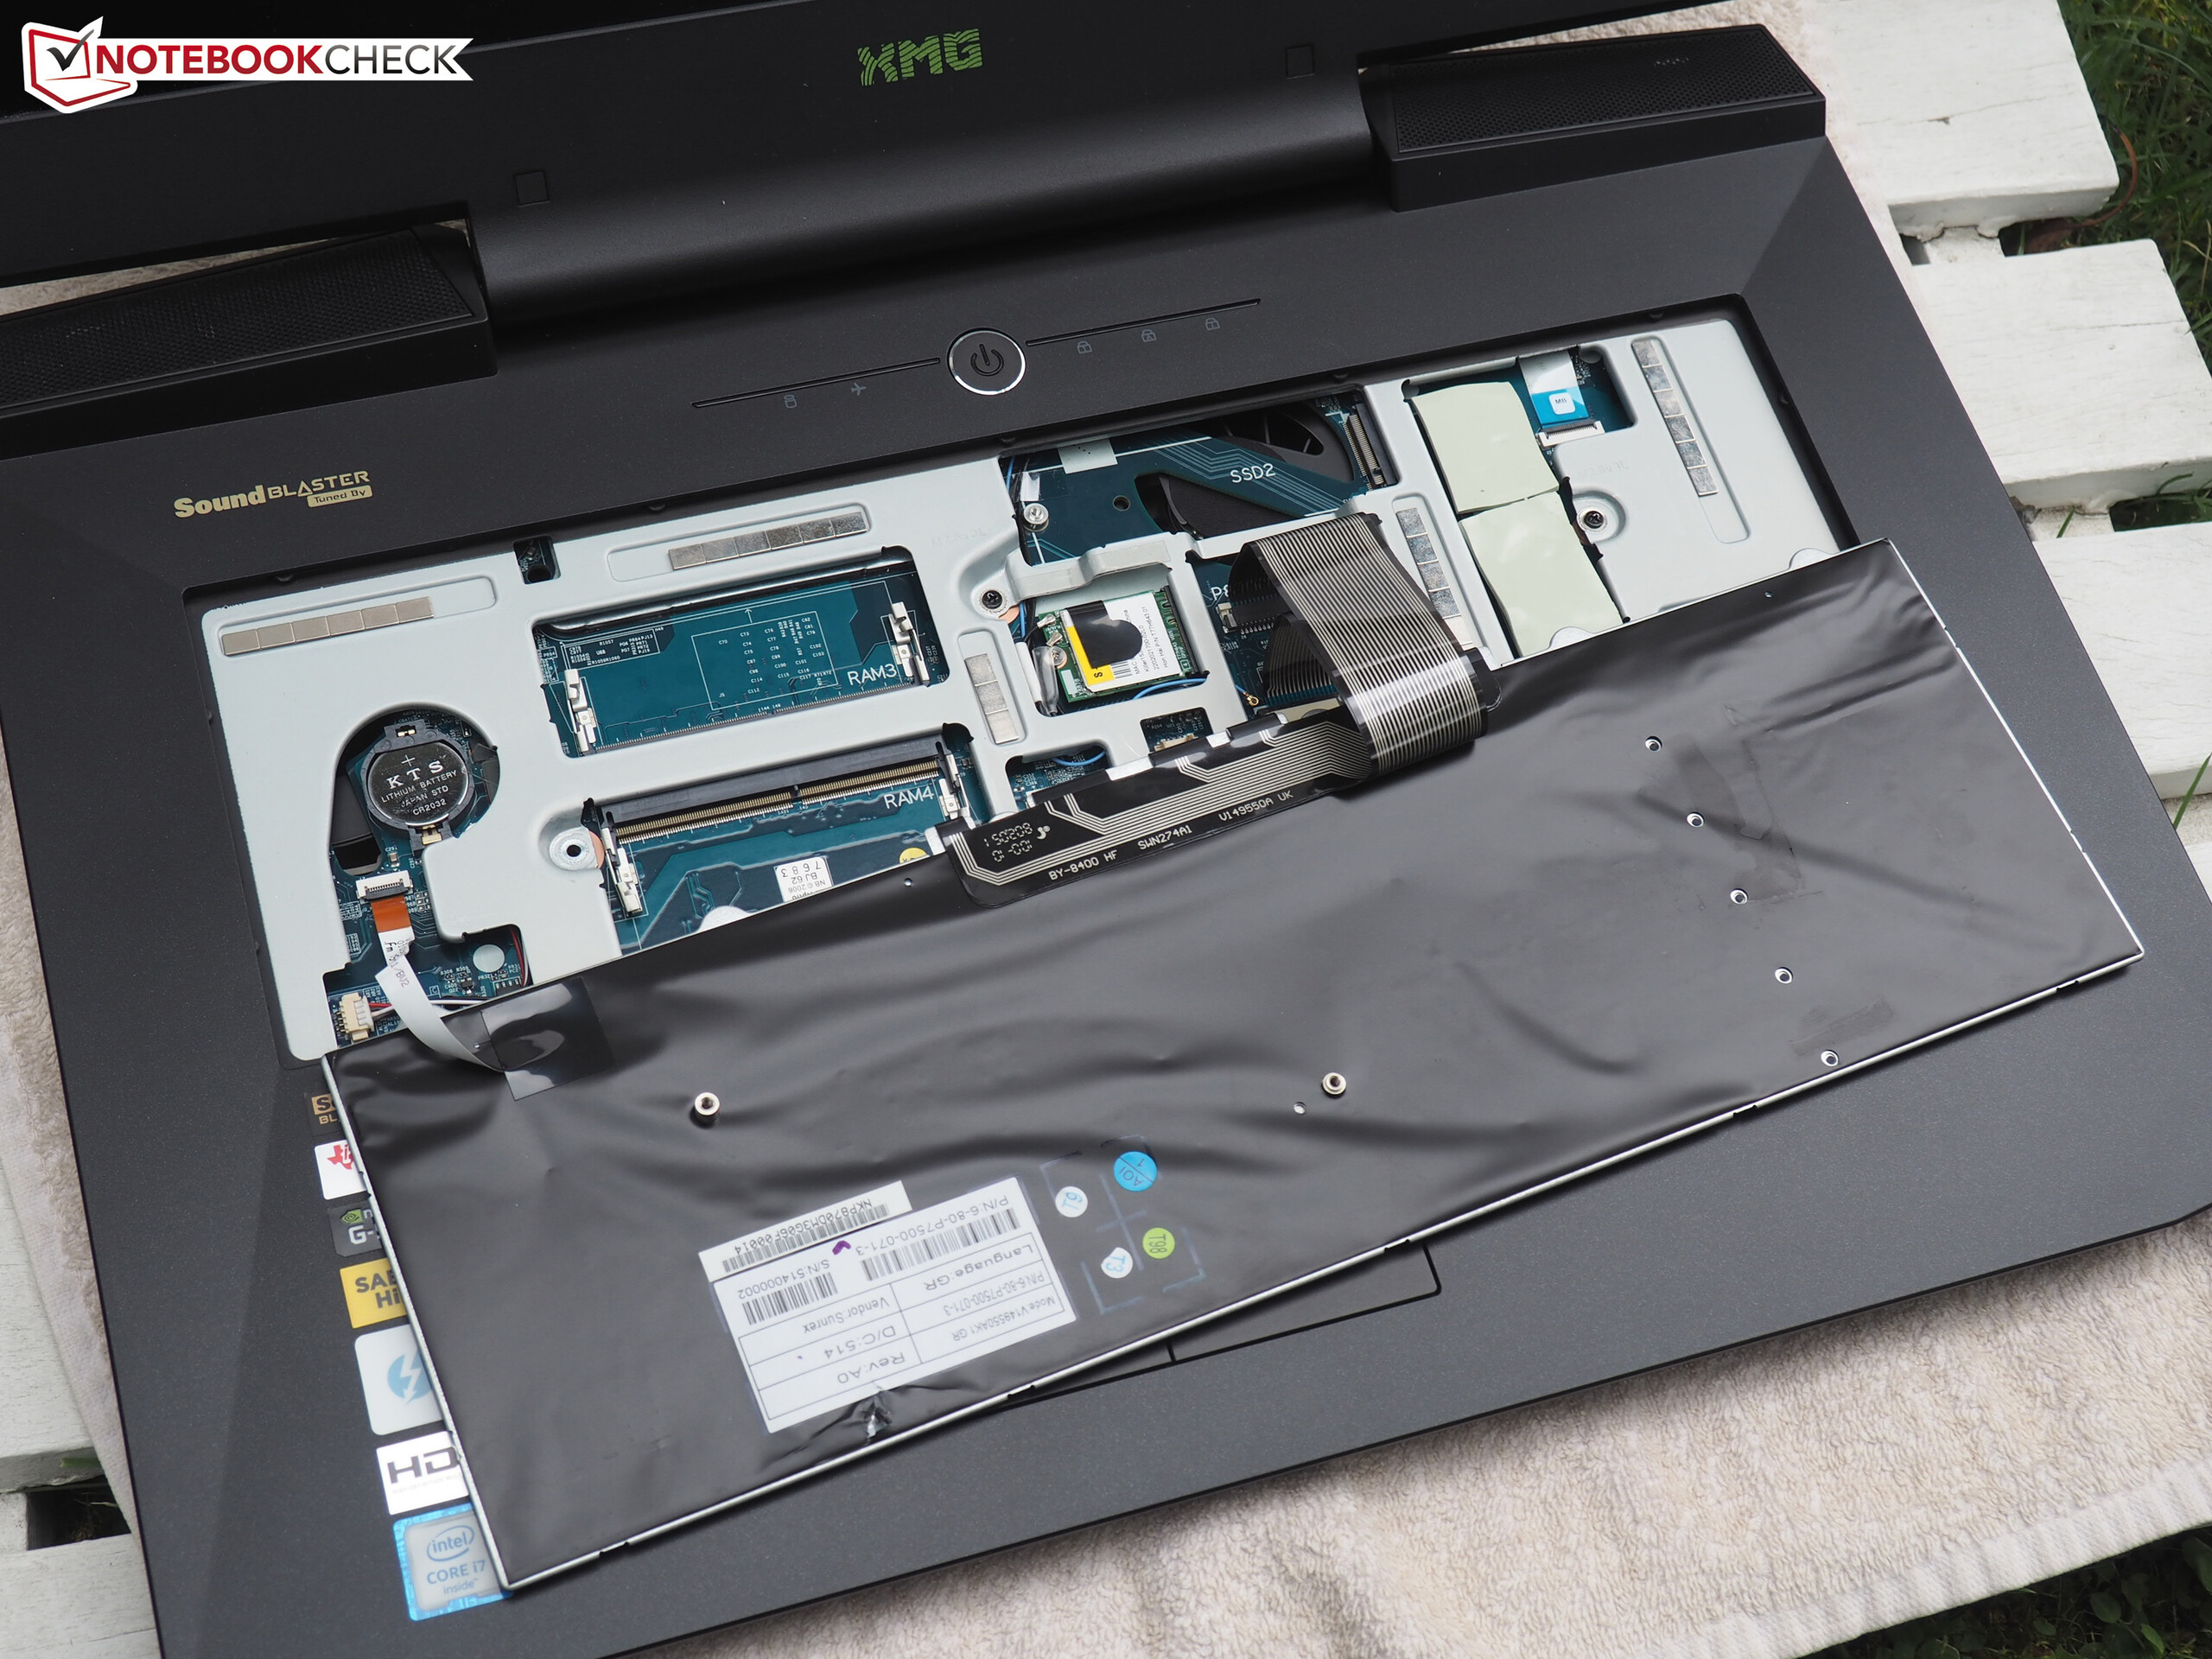
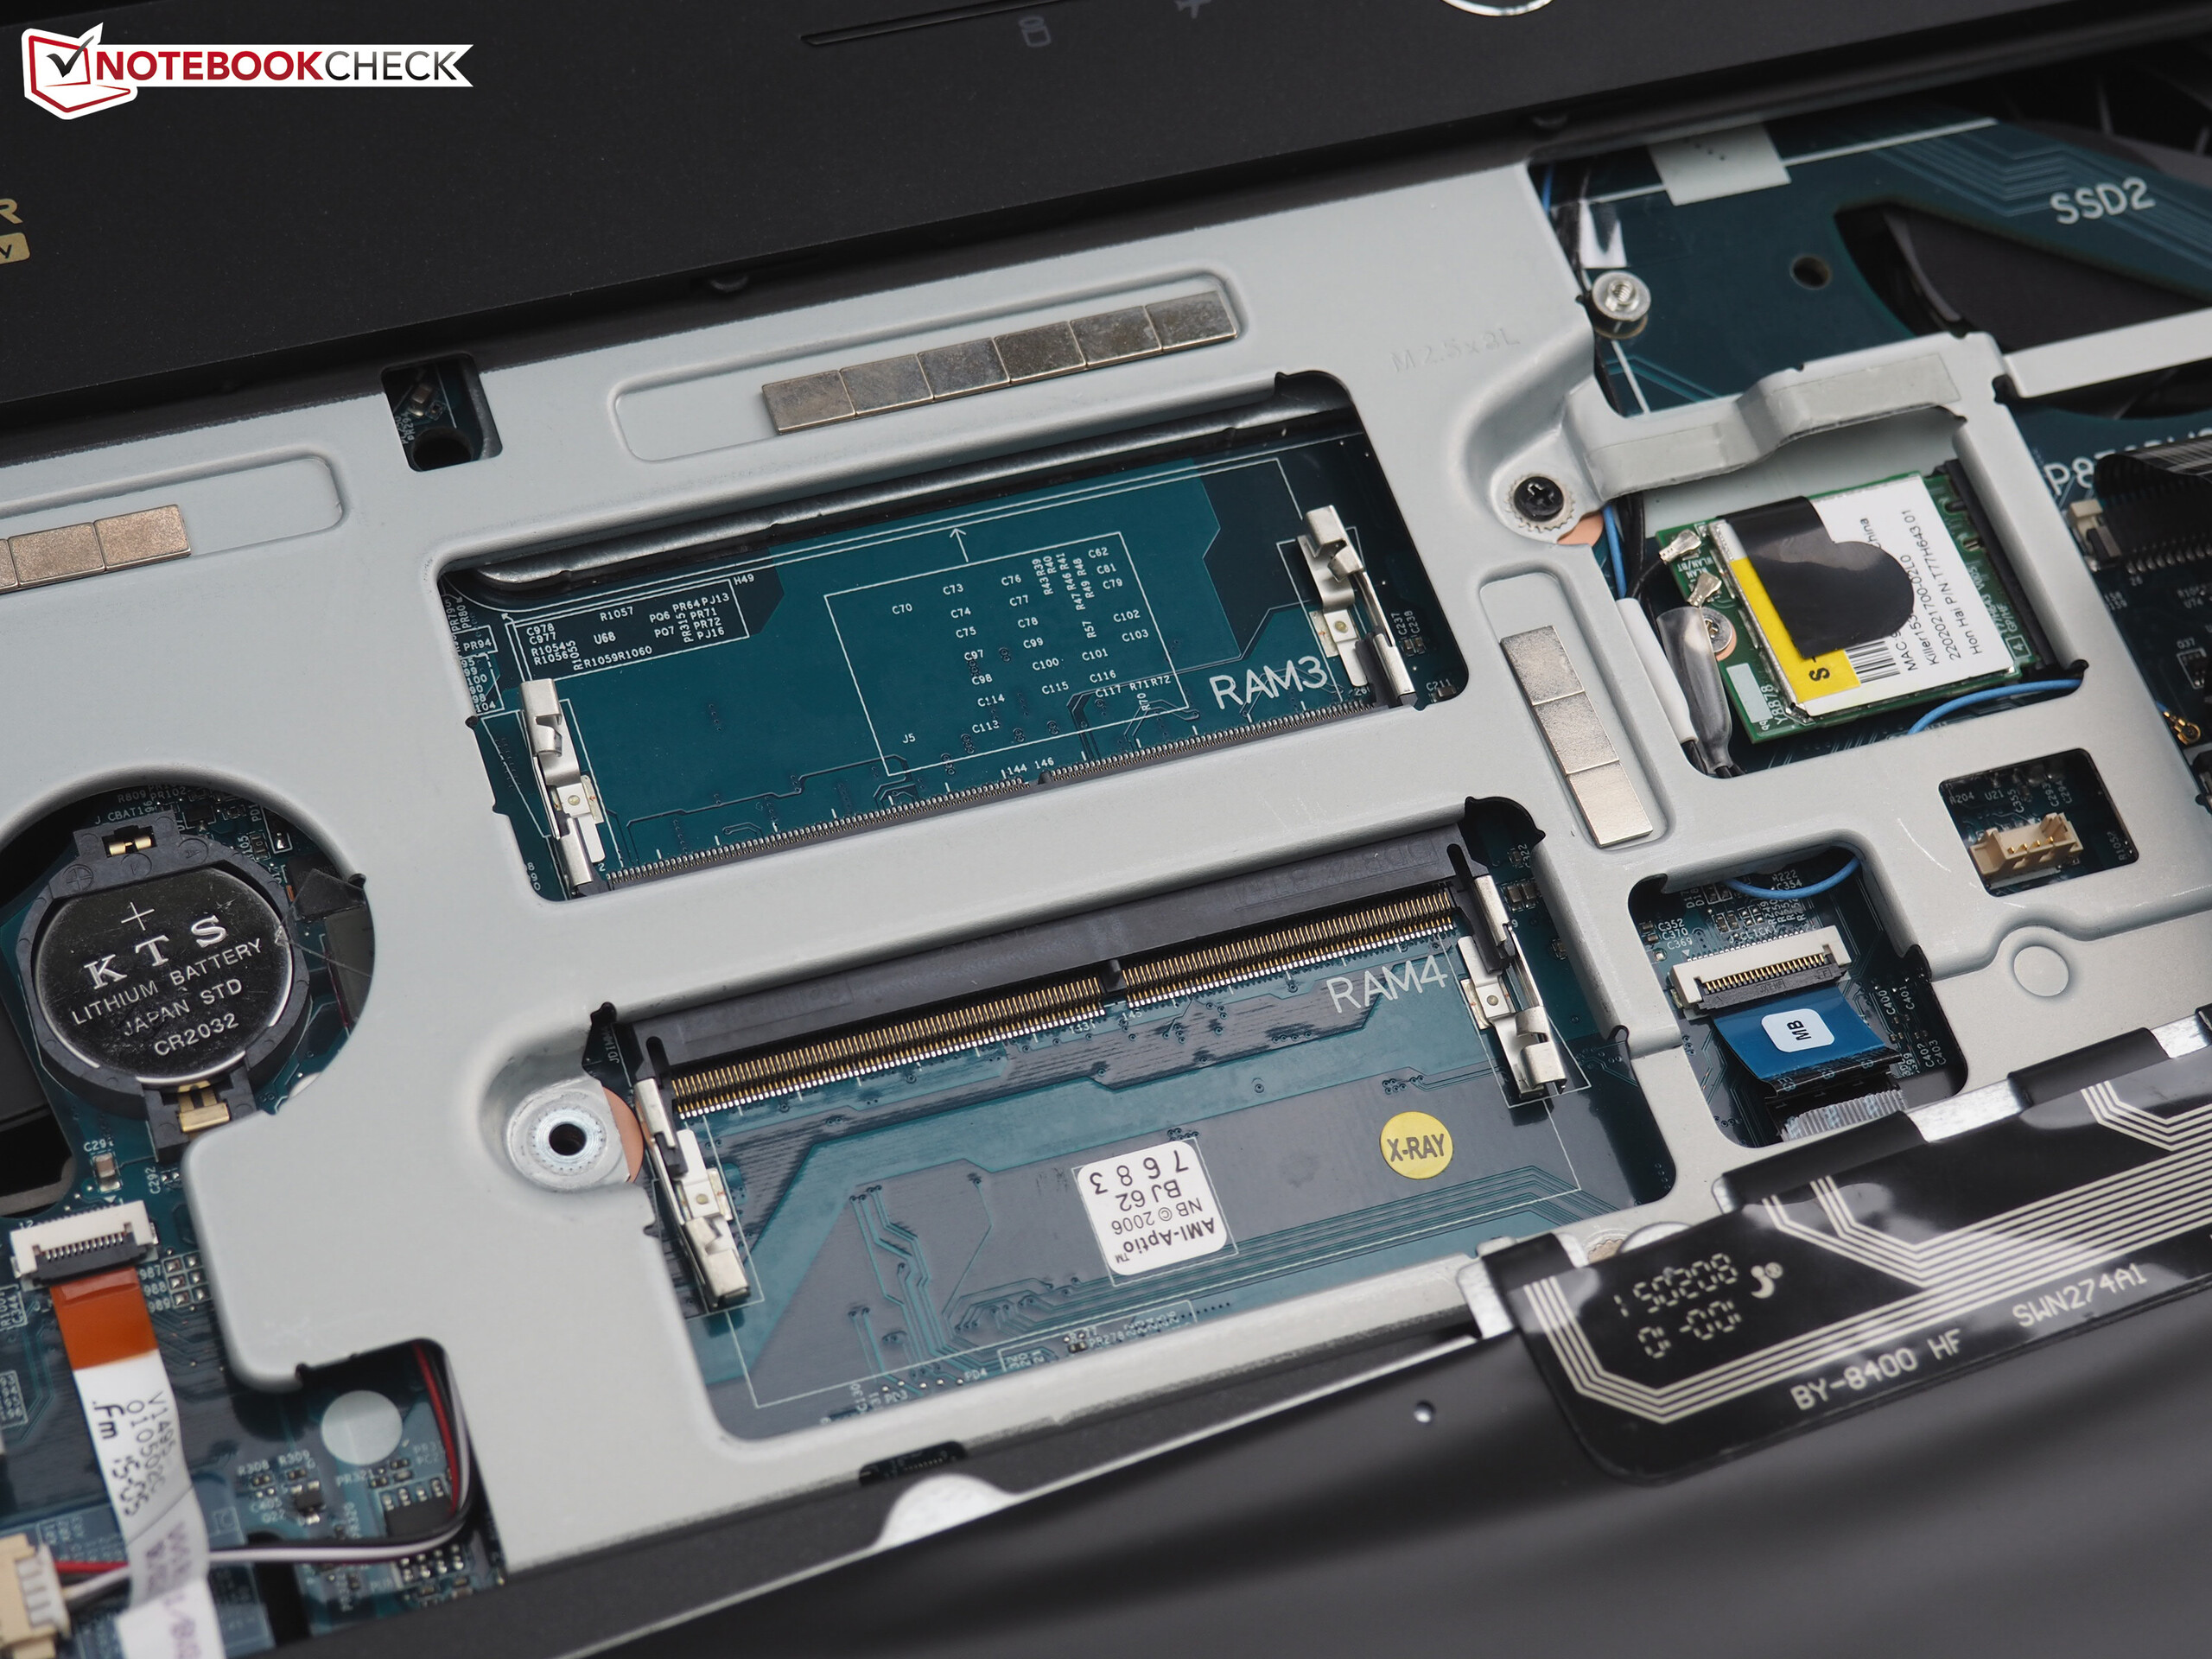
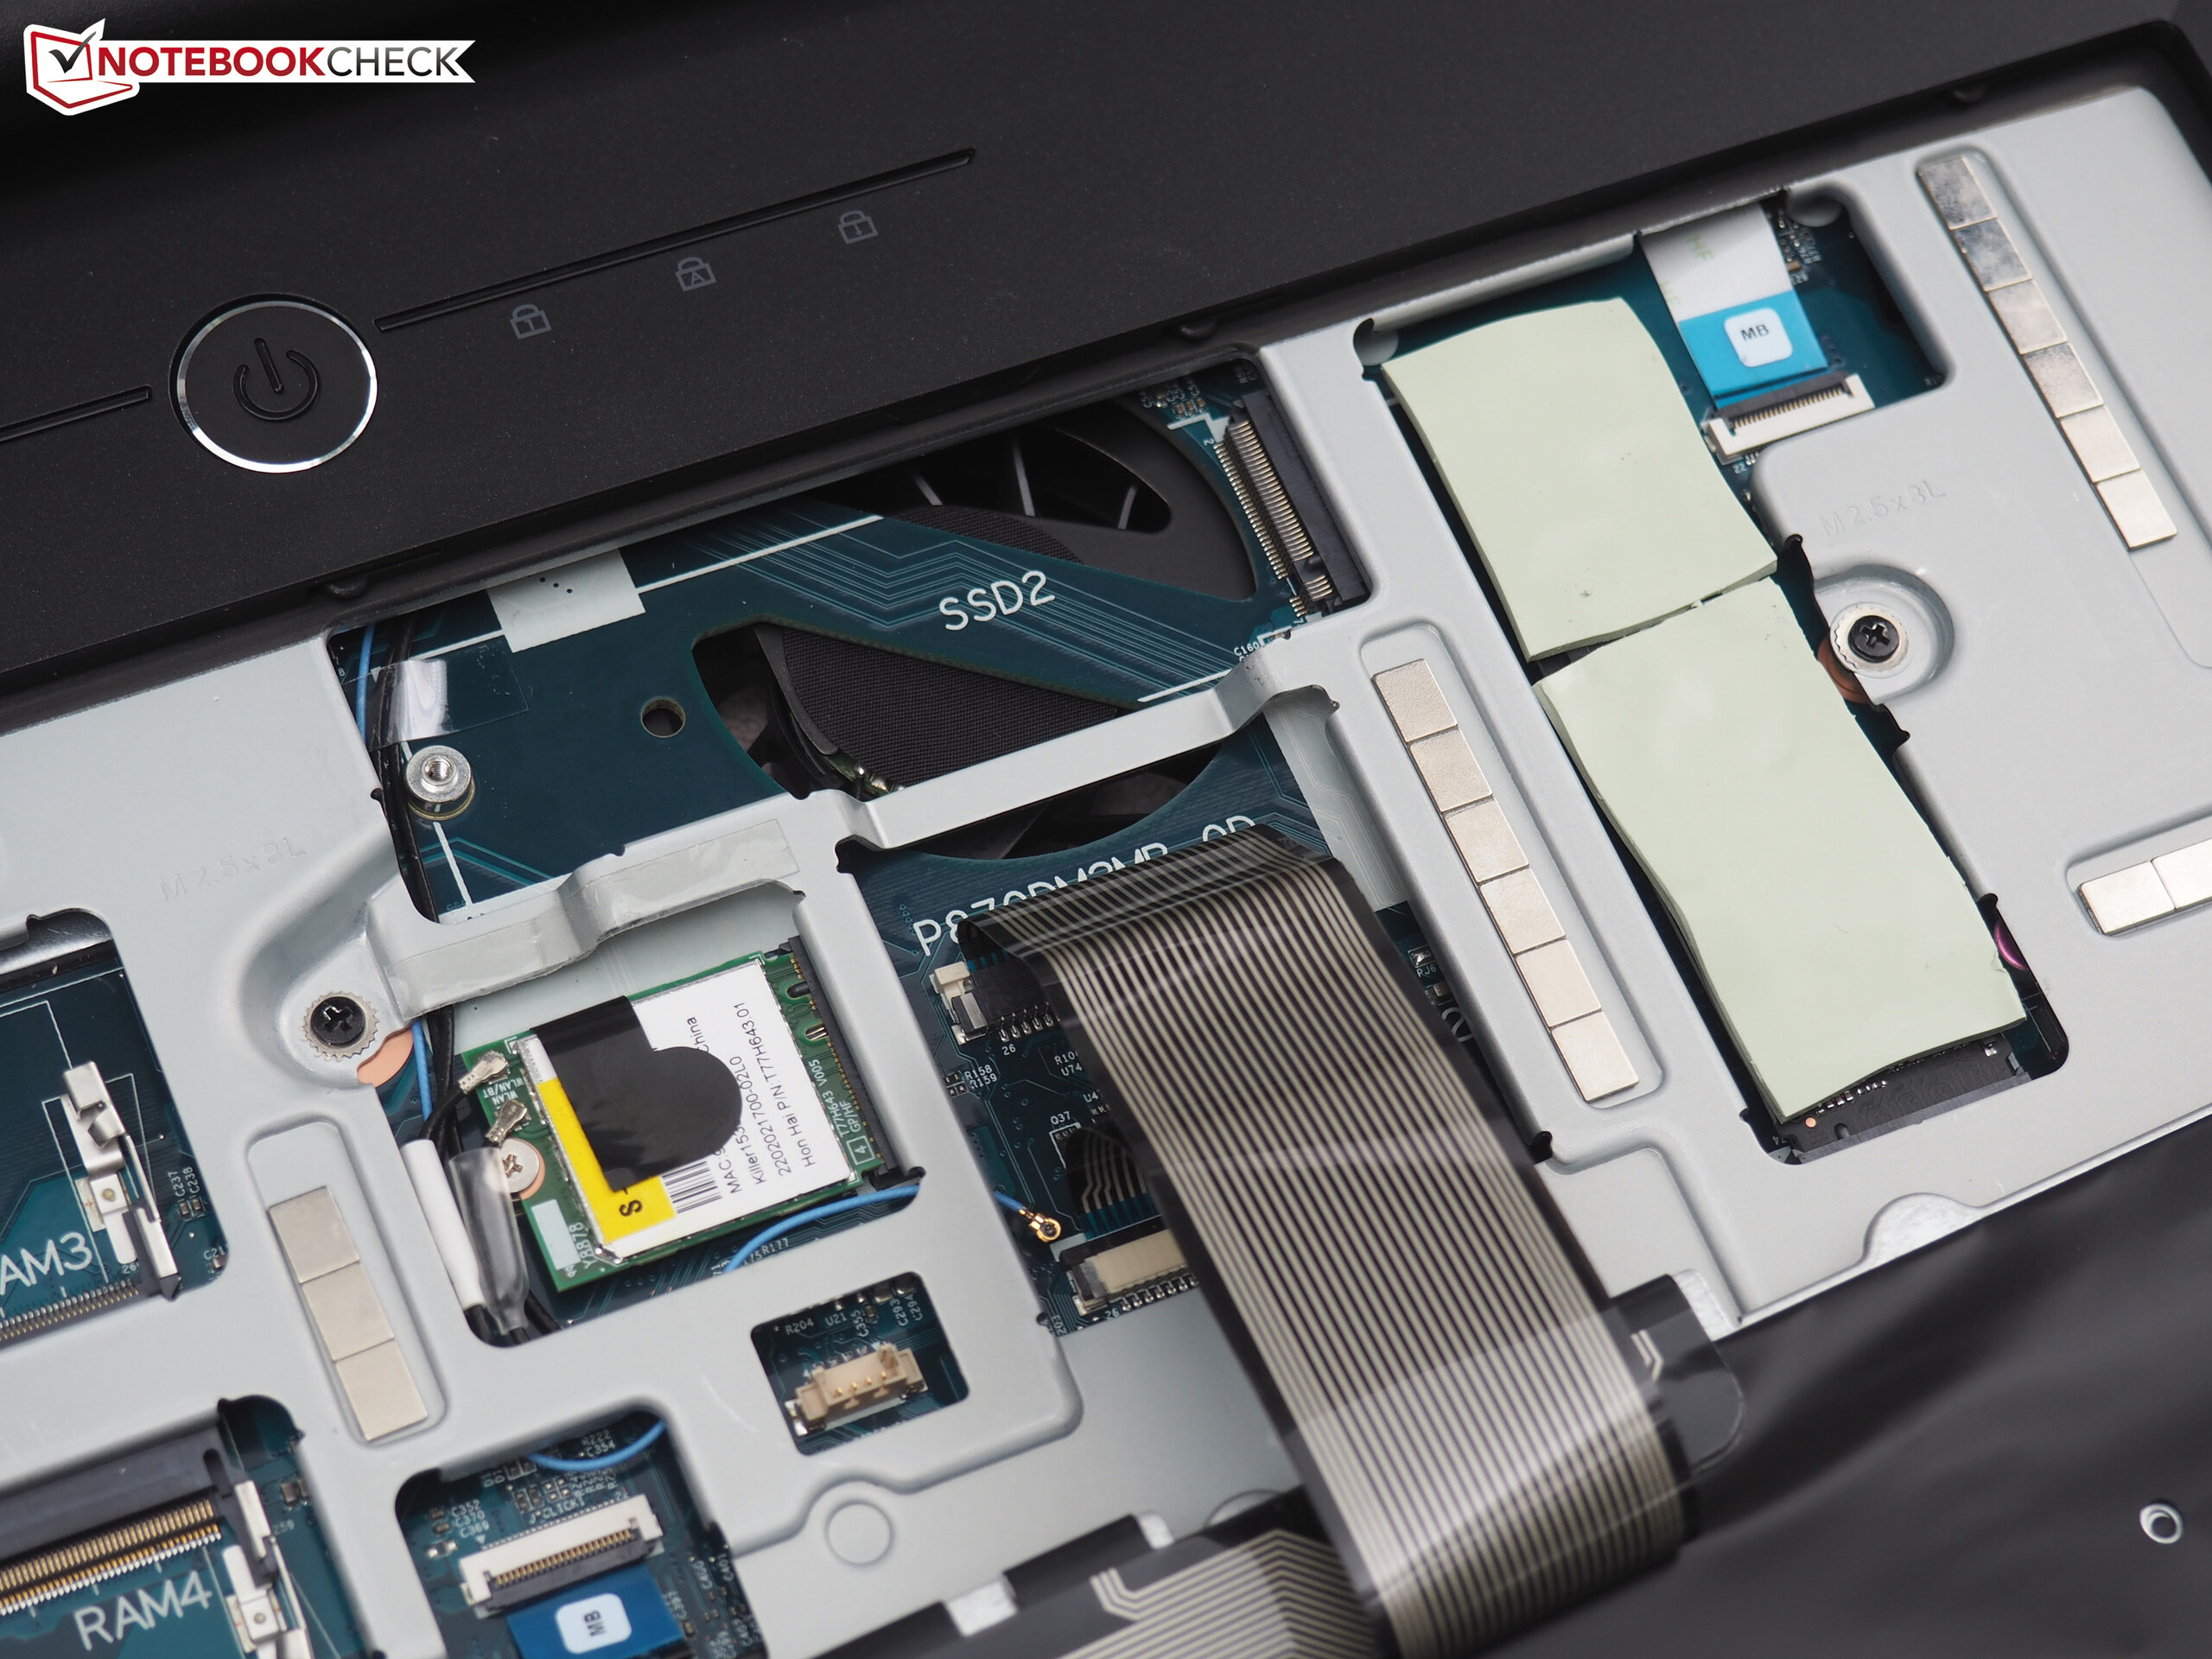
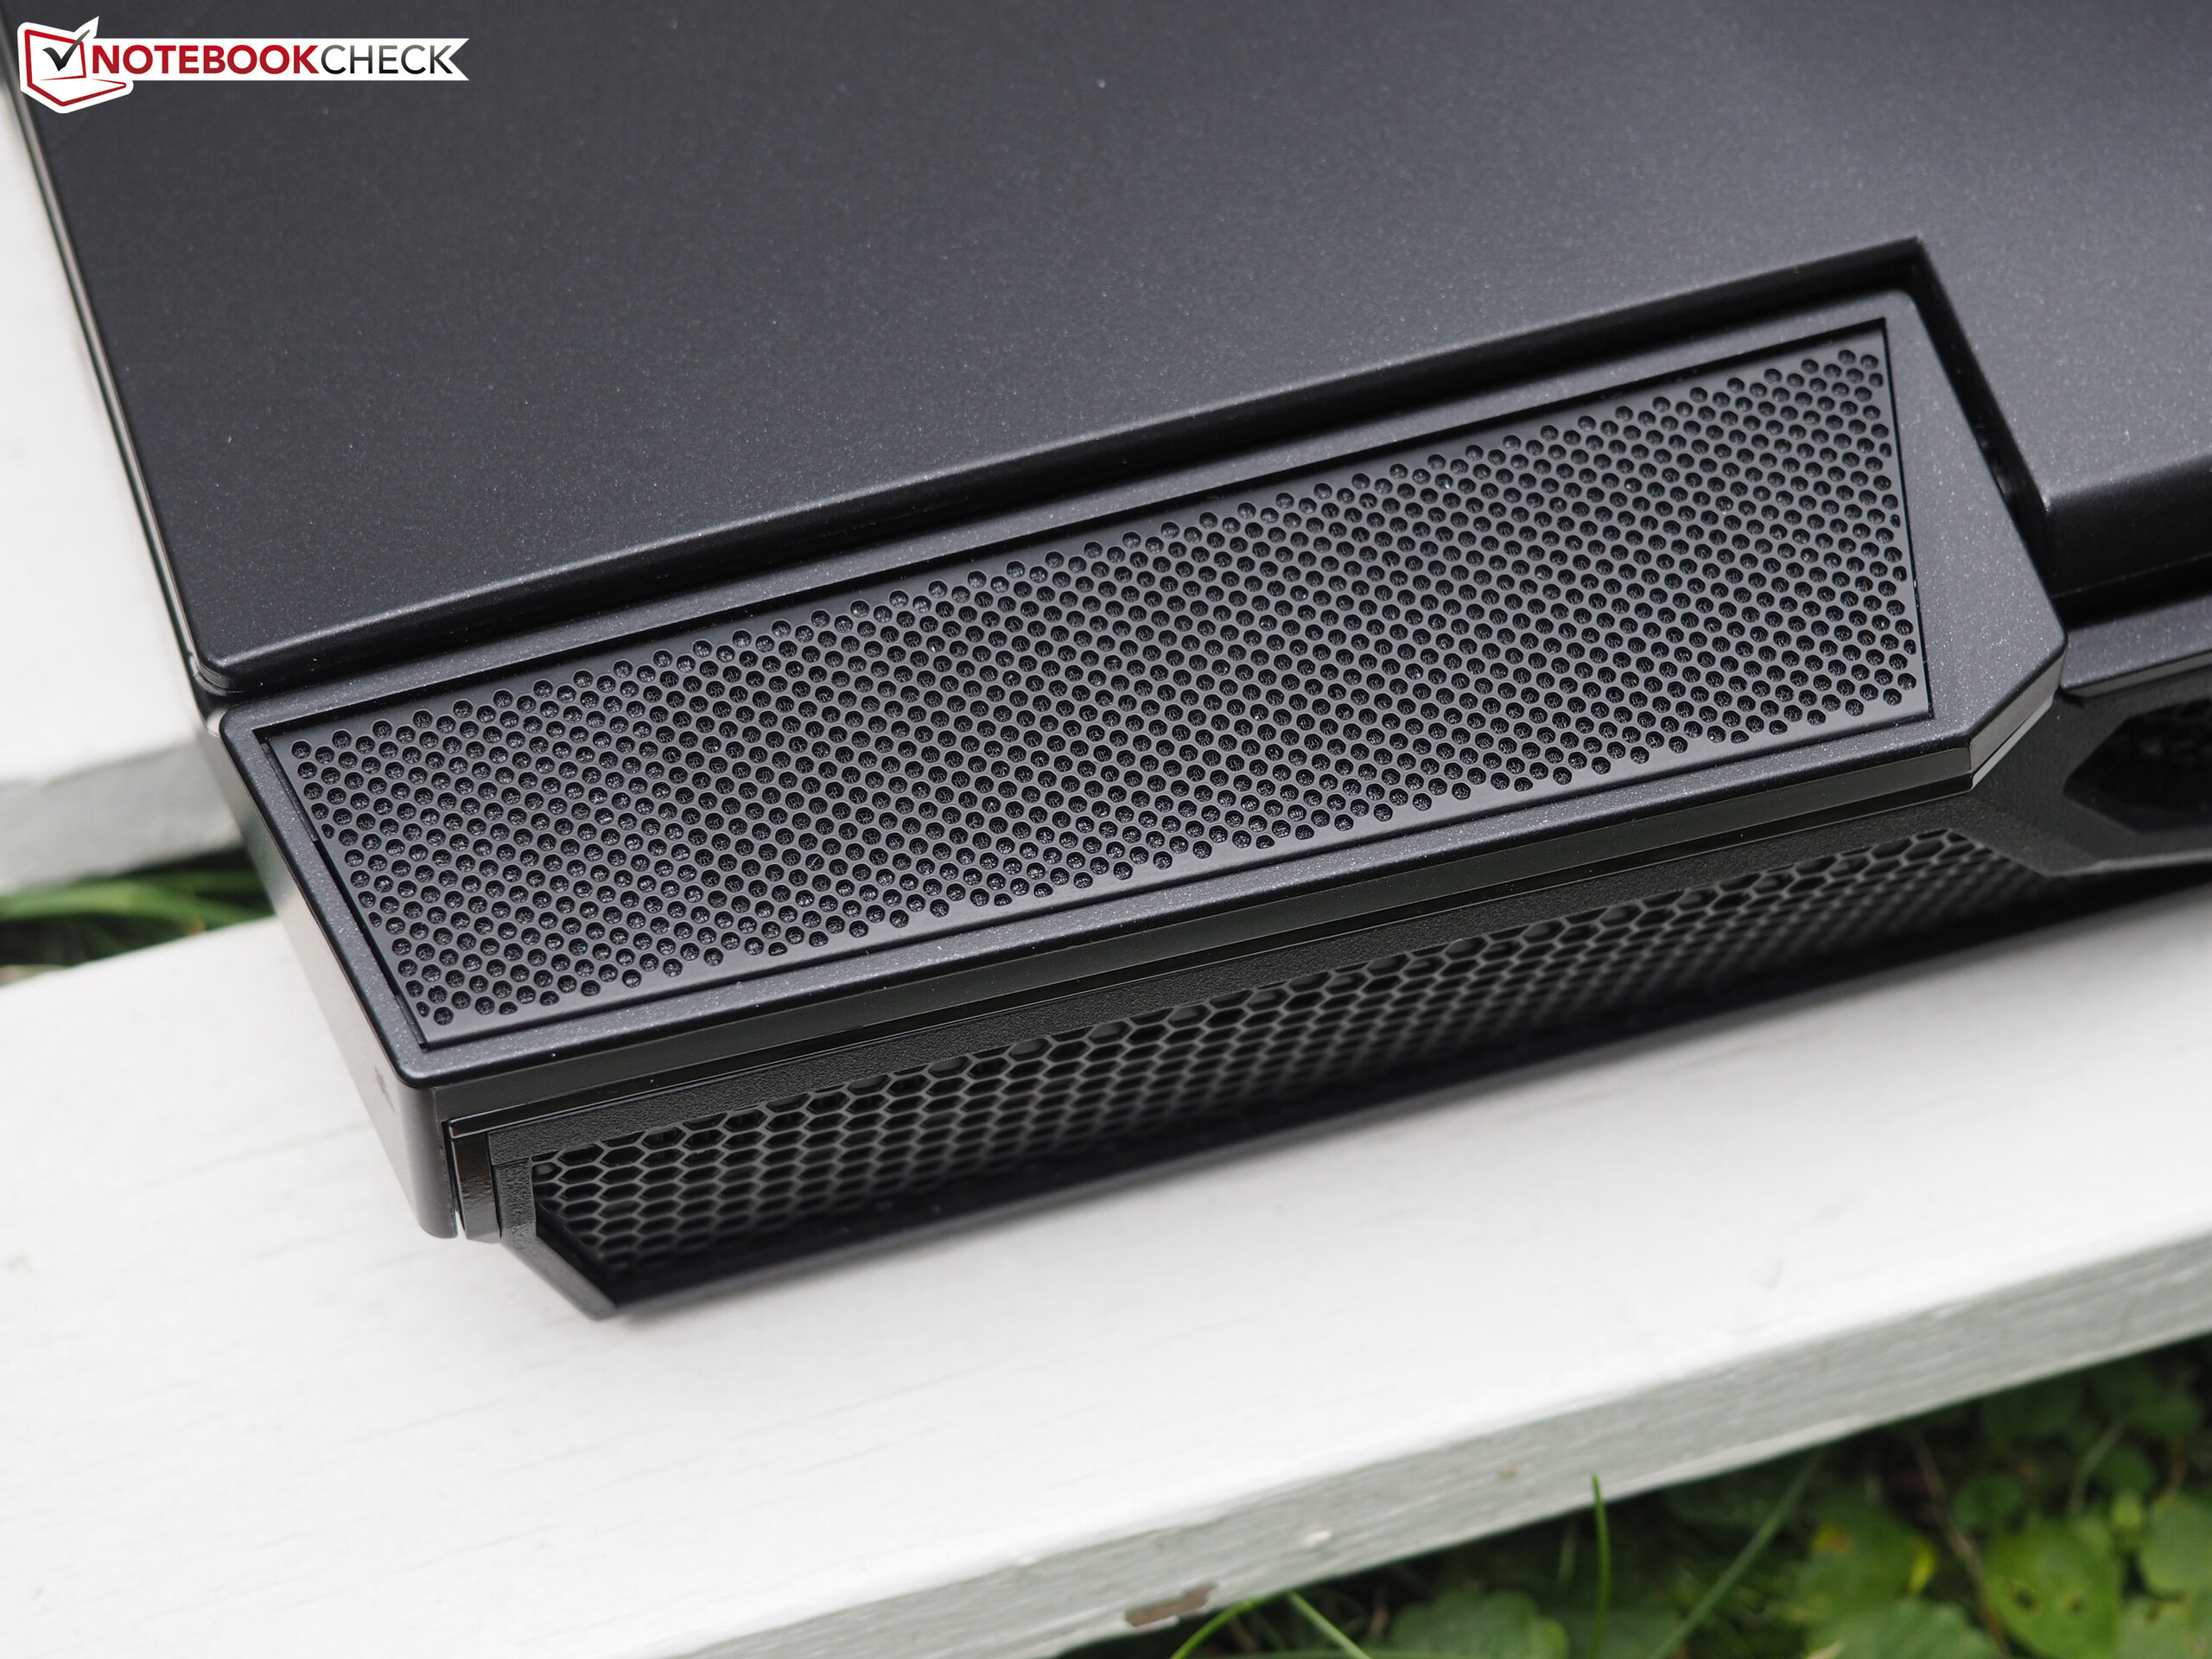
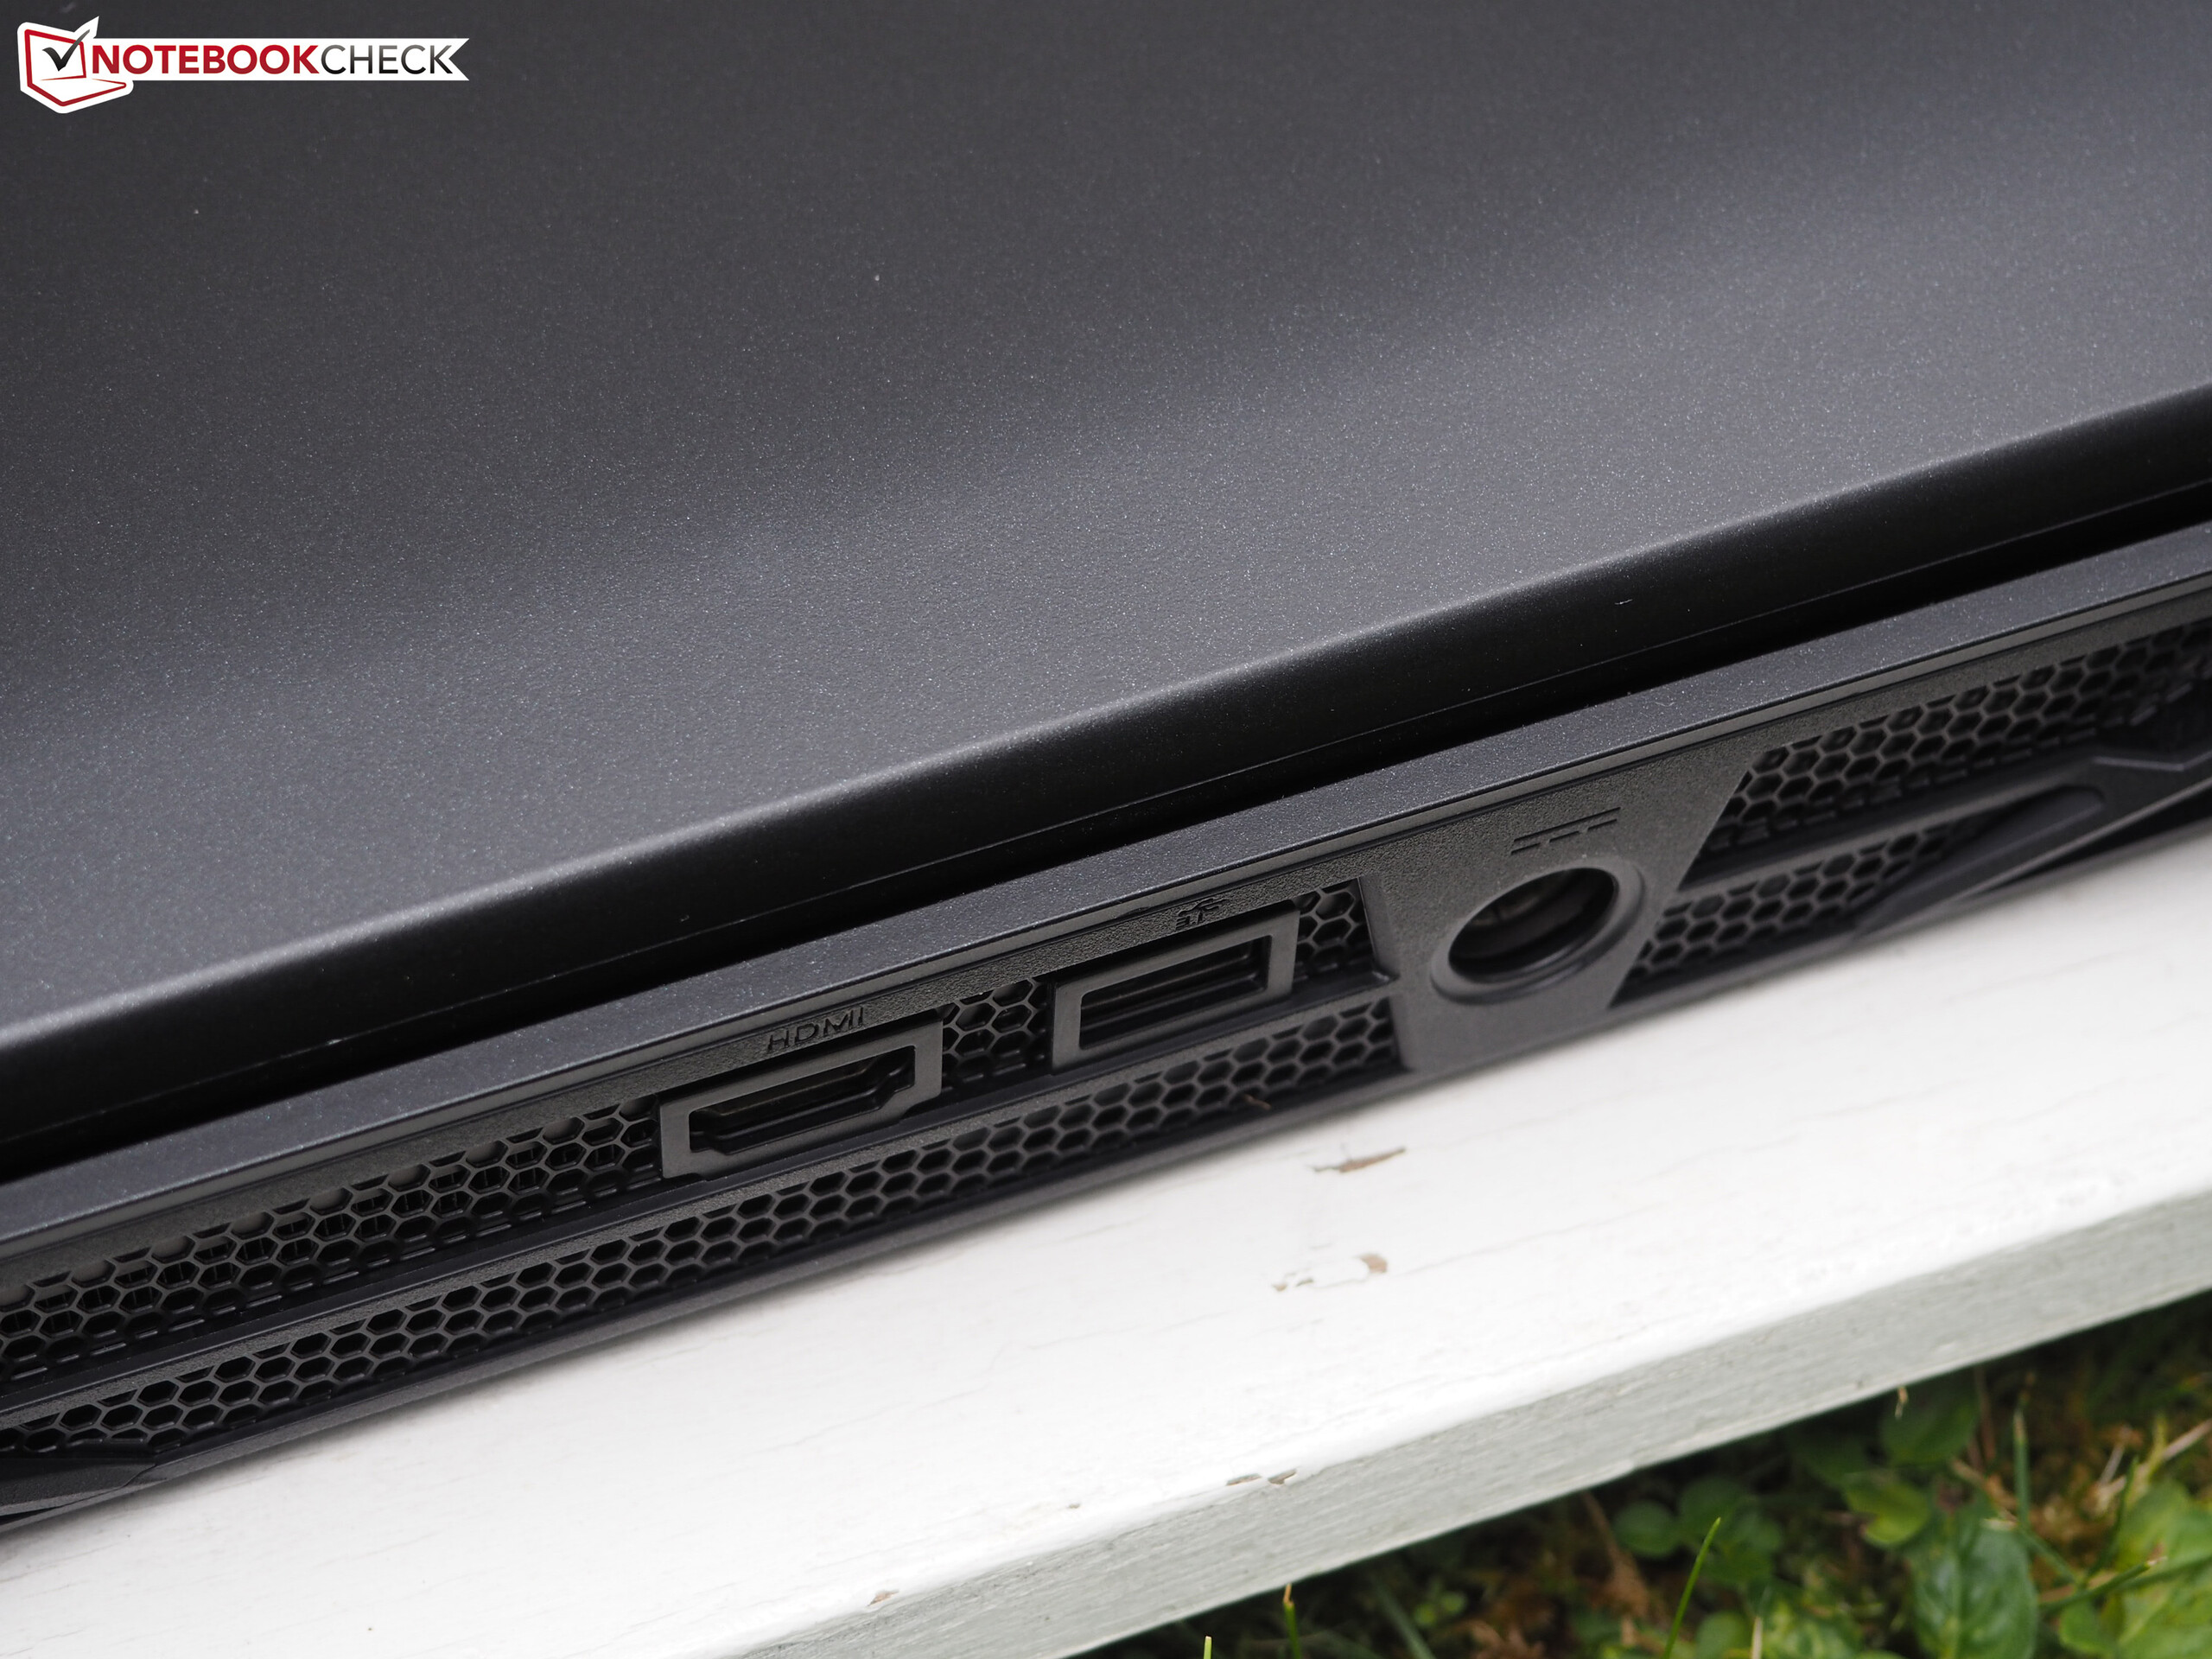
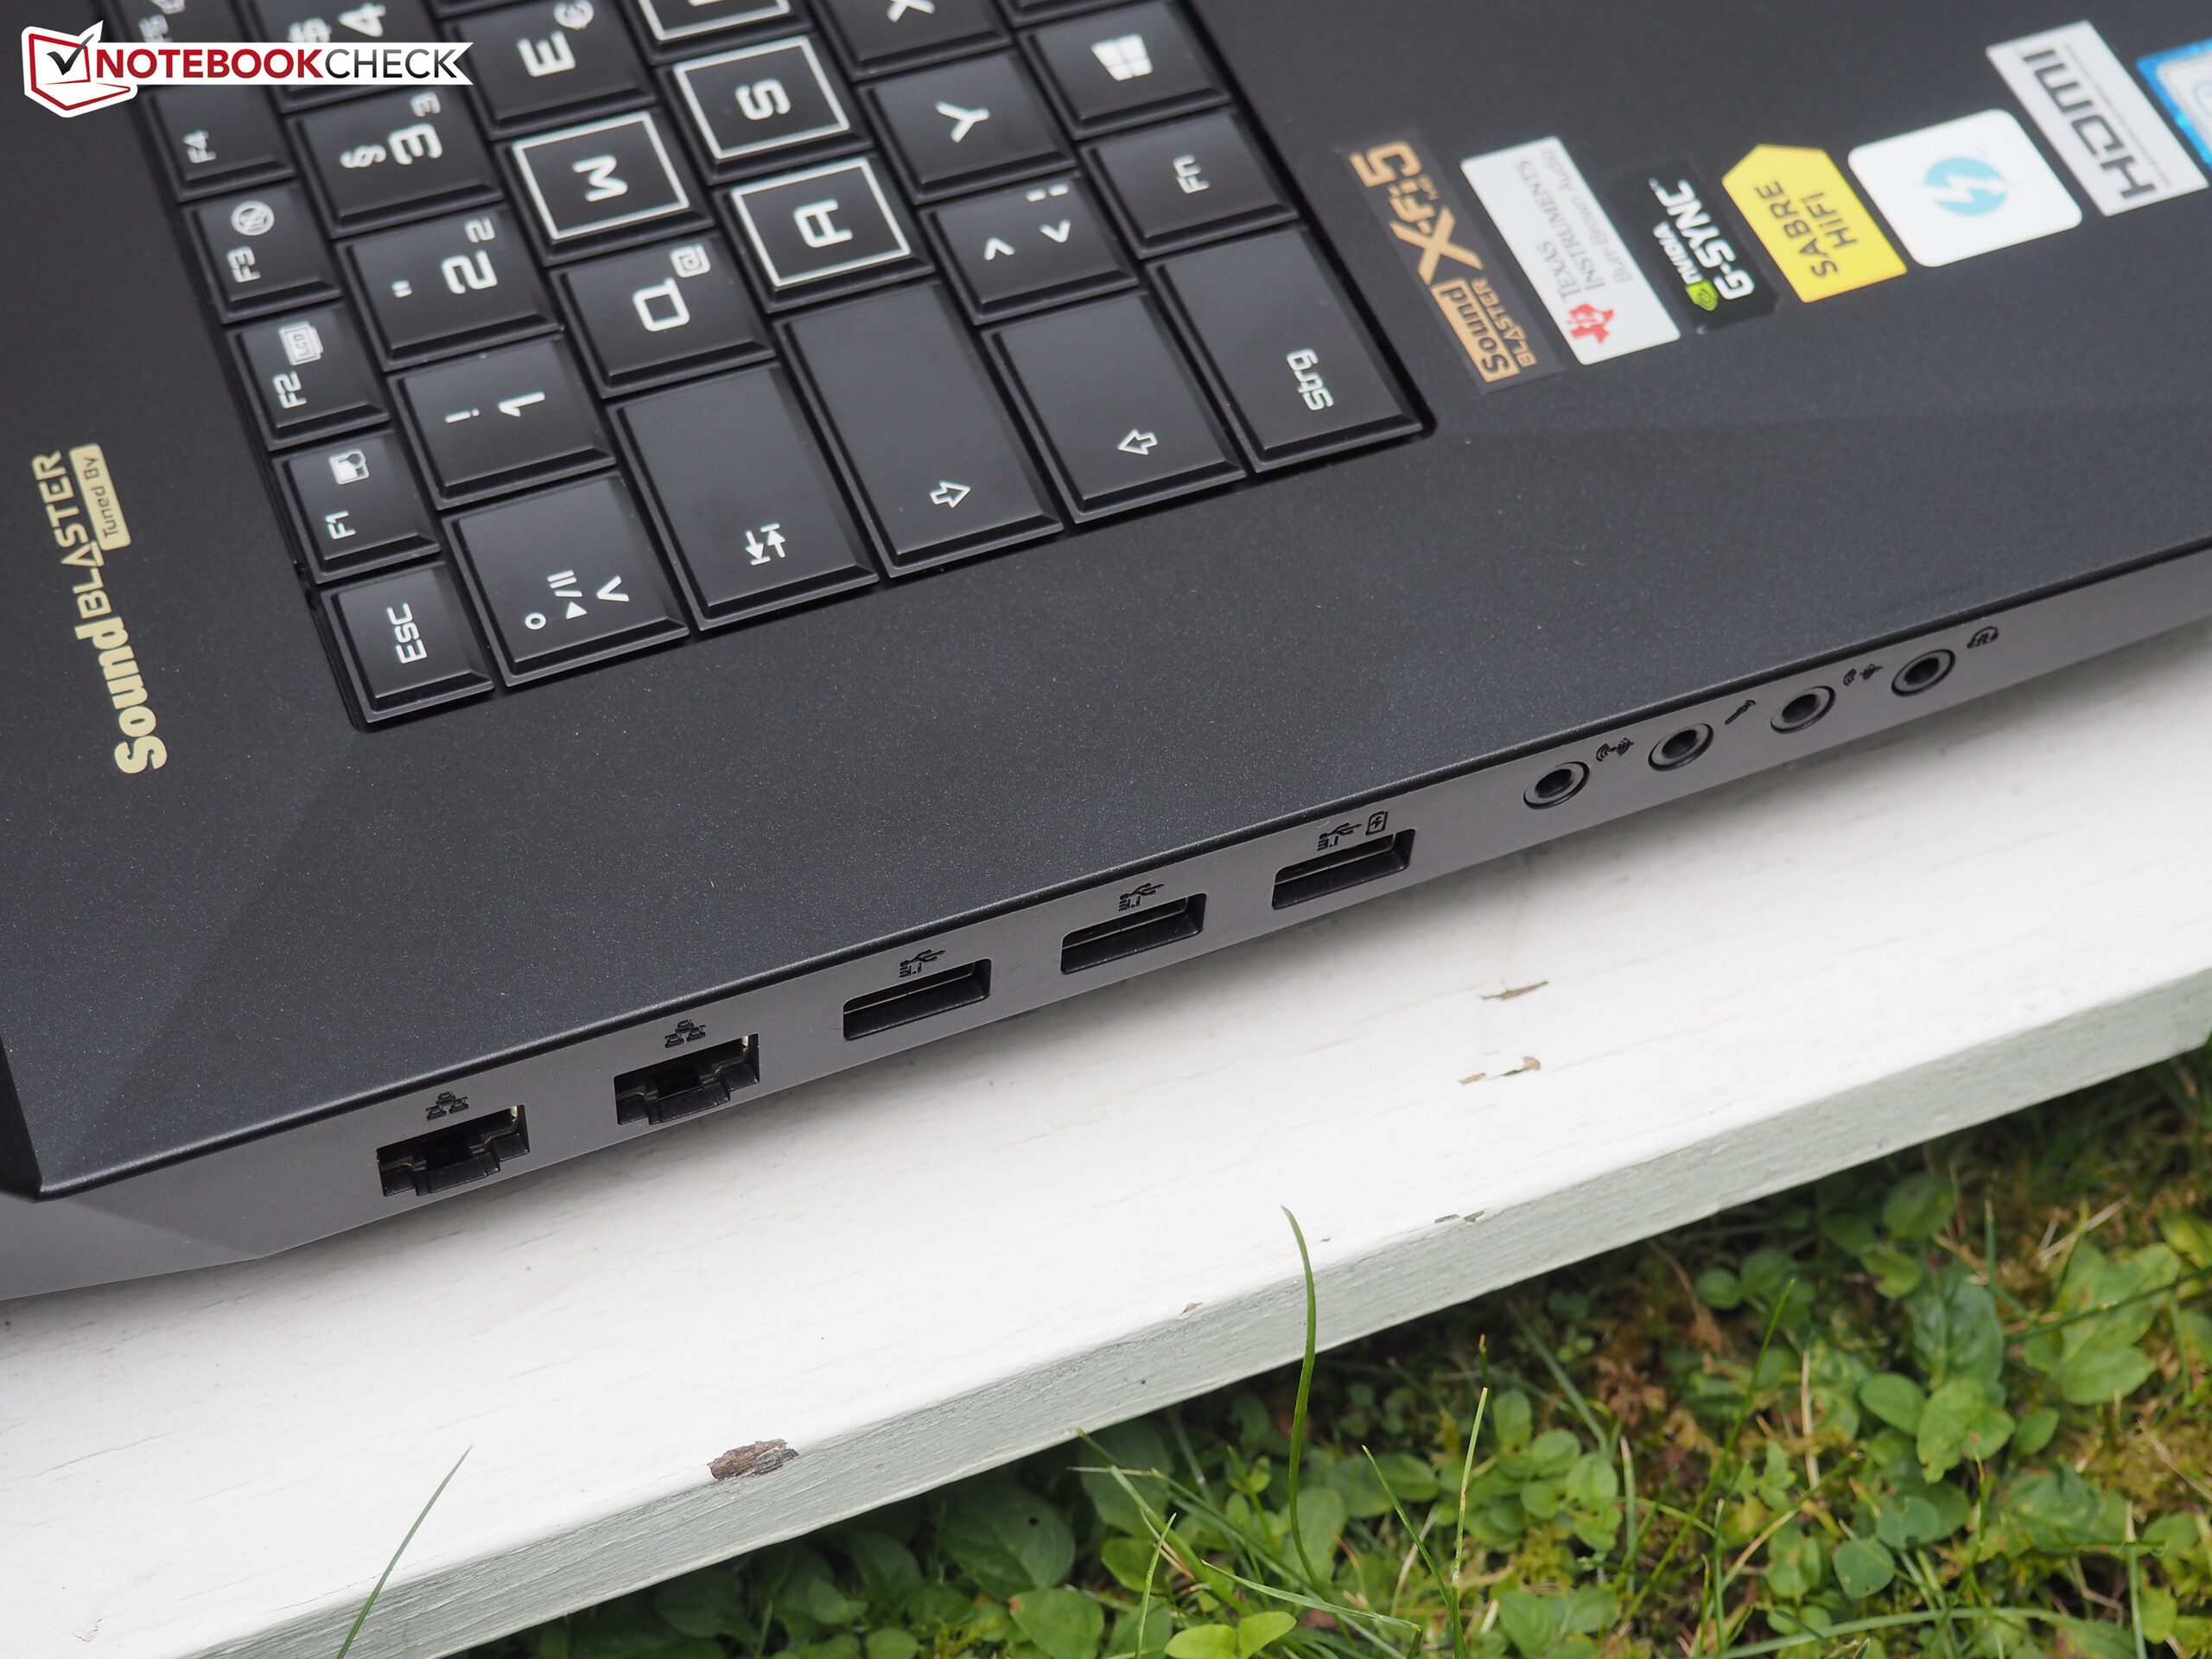
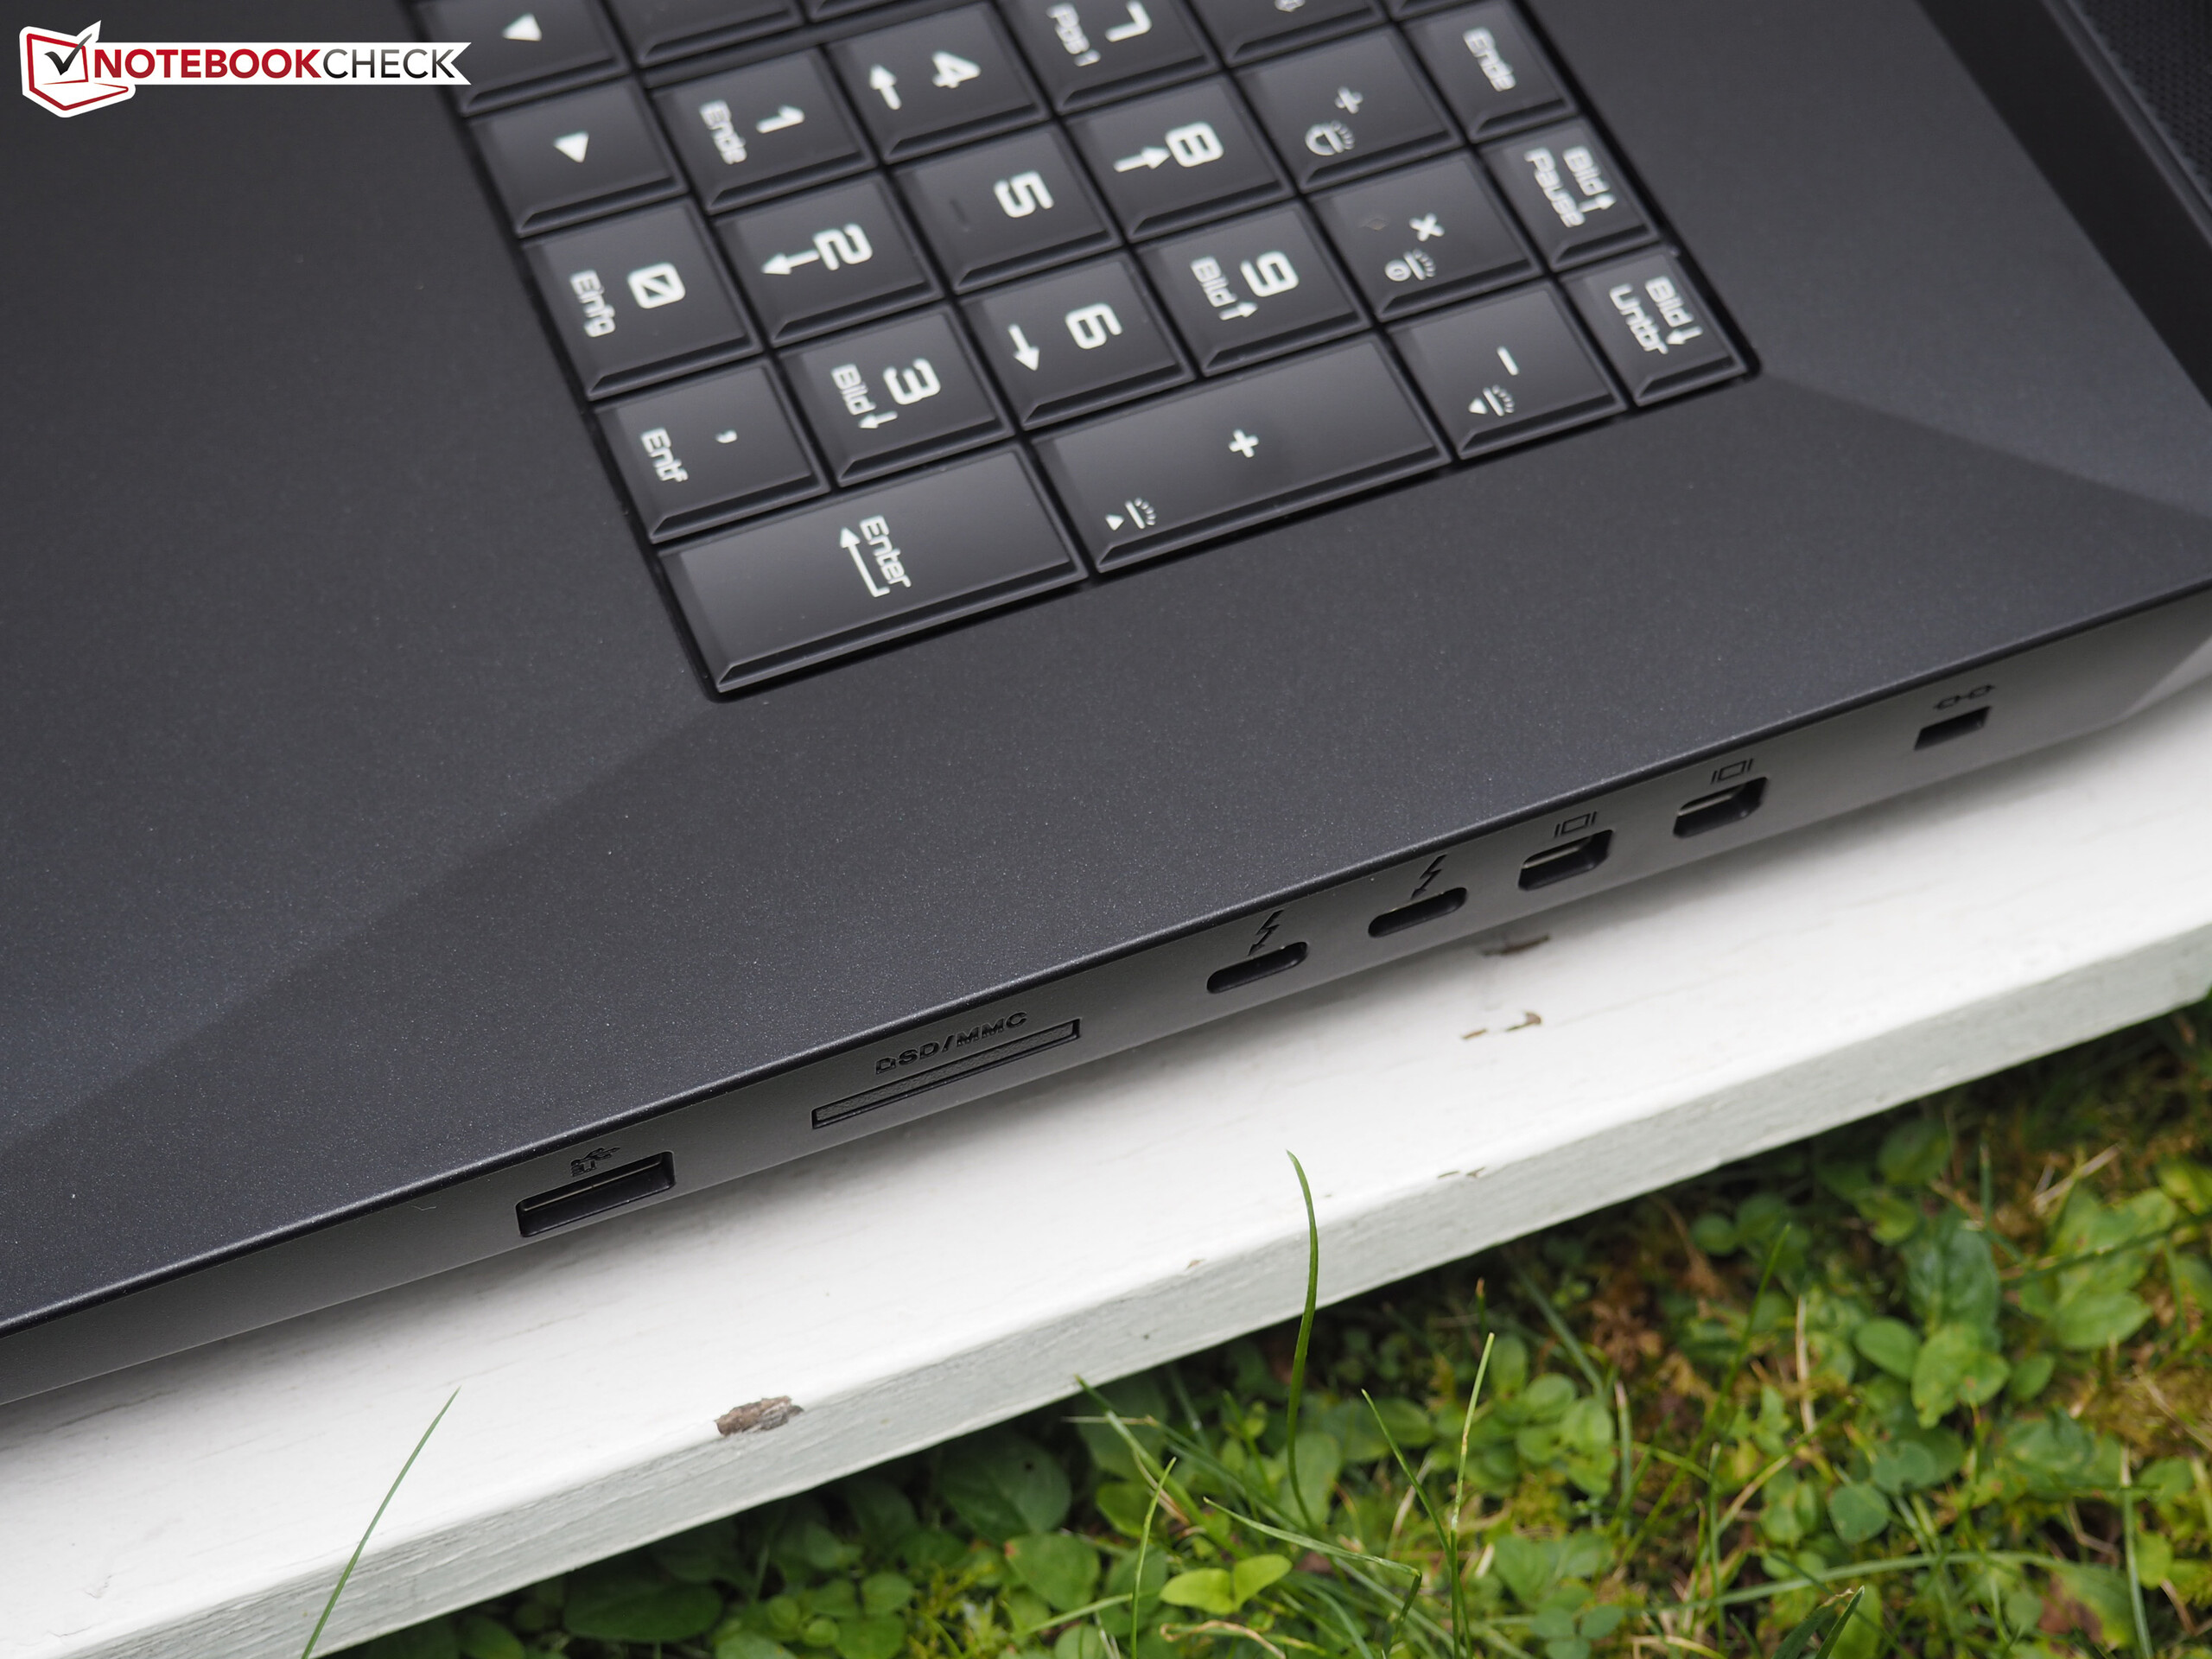
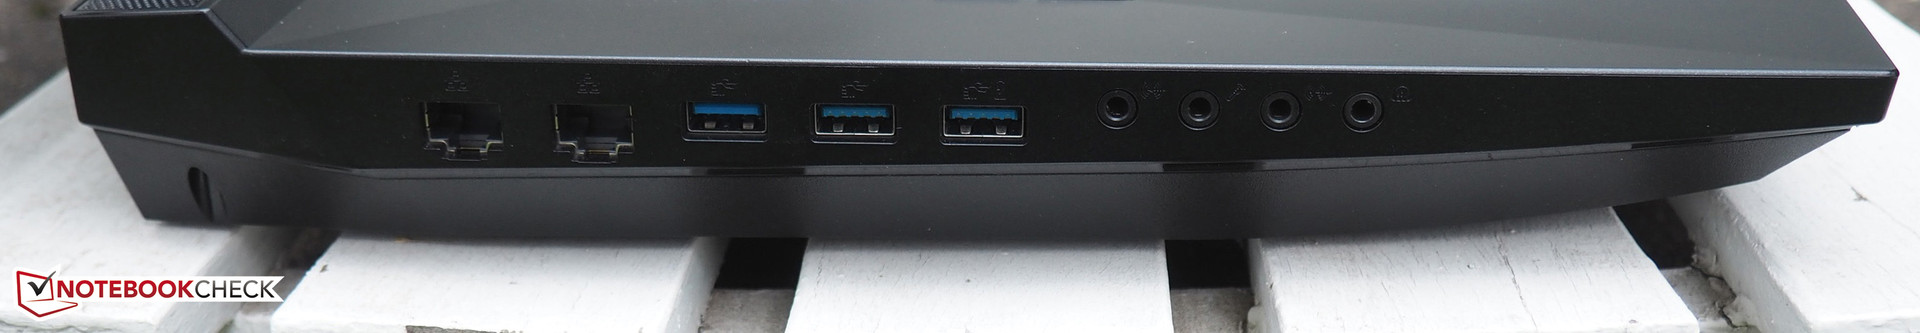
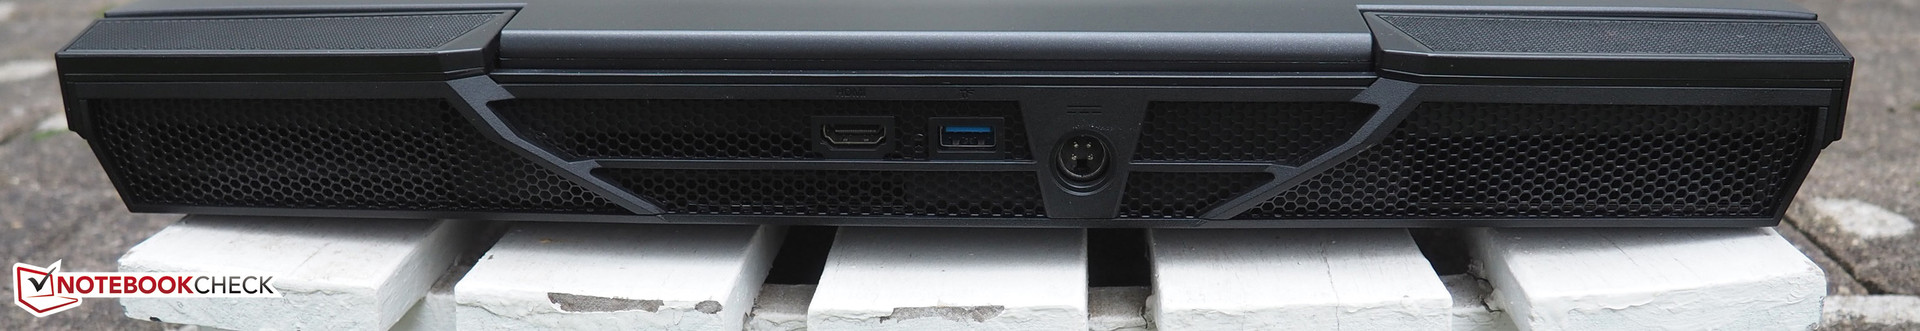
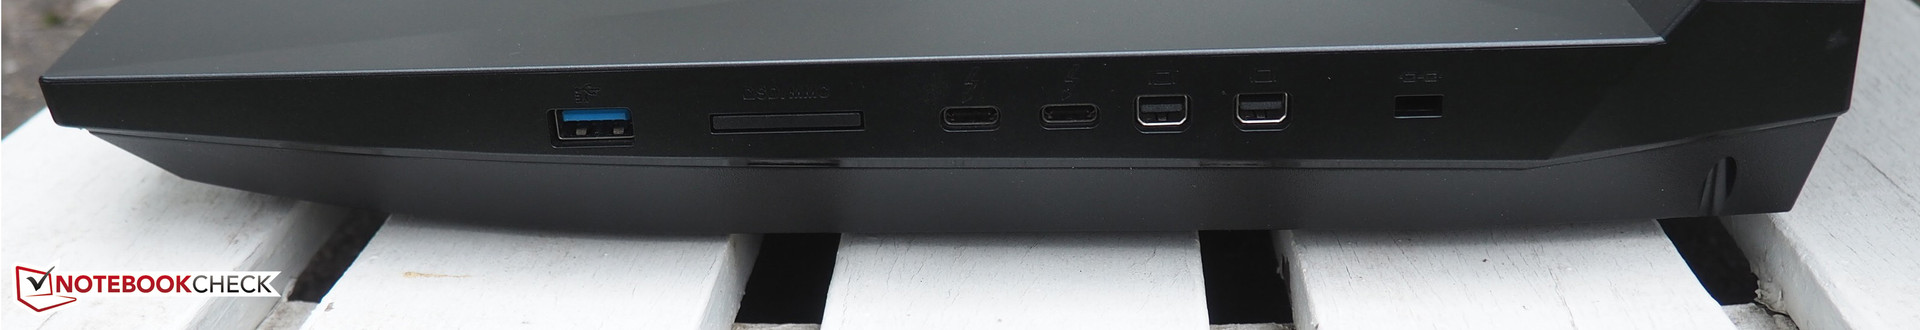
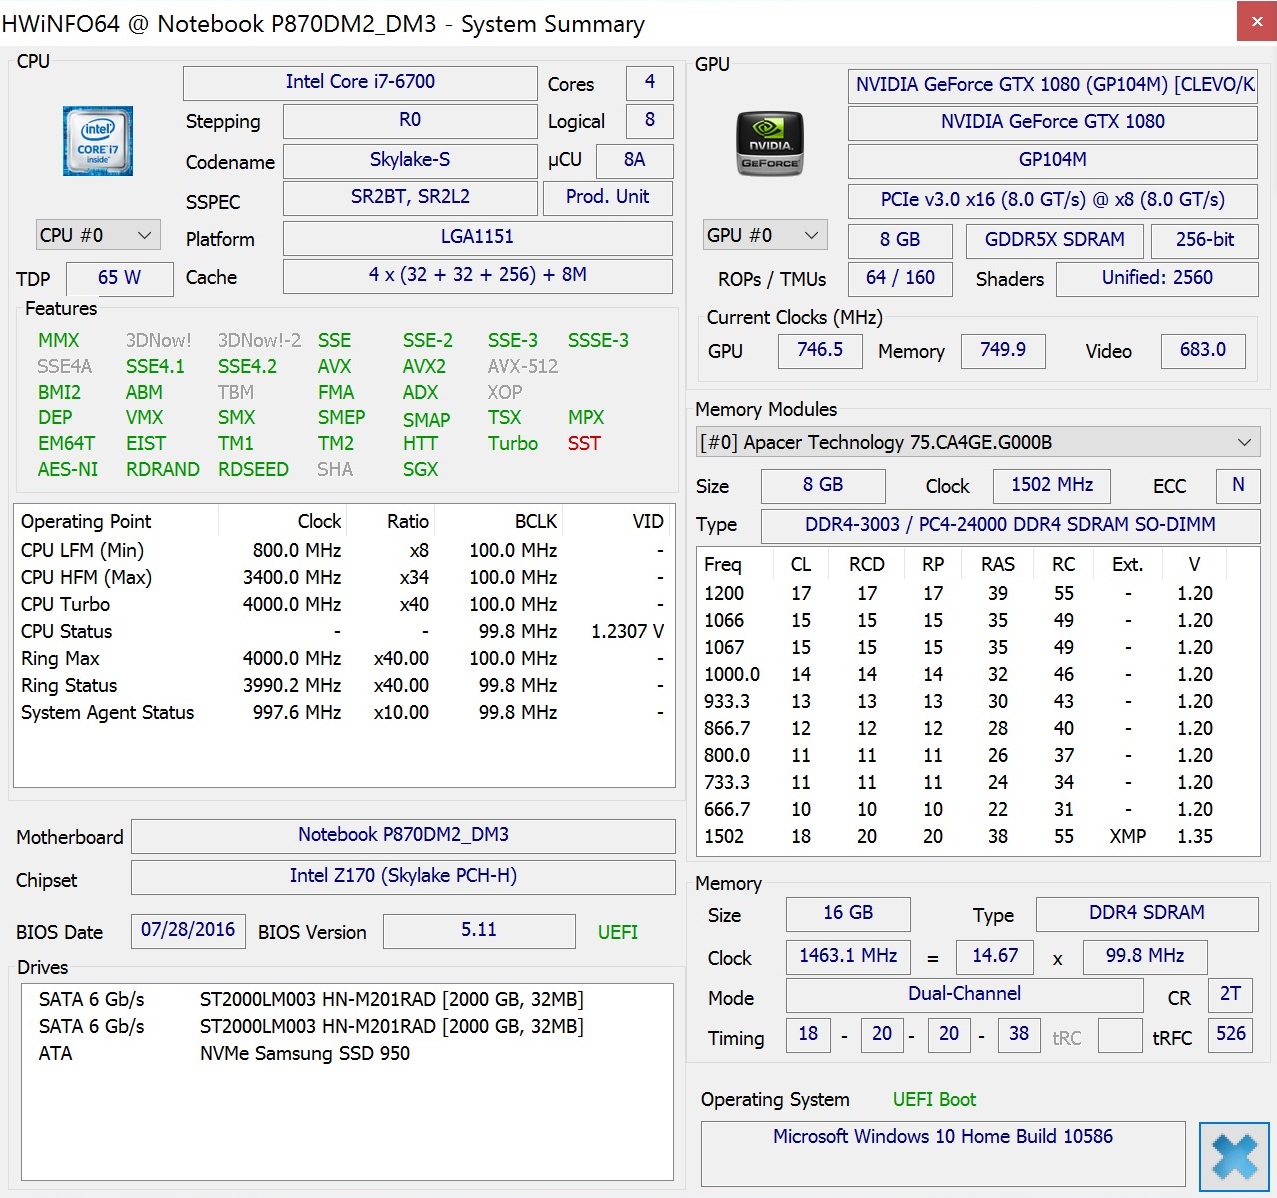
除了丰富的接口外,它的4K屏幕(覆盖88%的AdobeRGB色域)、升级空间和性能也都非常出色。USB 3.1C型接口,Thunderbolt 3,MXM显卡接口和插槽式处理器,这些都是Schenker对于“一次性设备”(板载组件)的革命宣言。
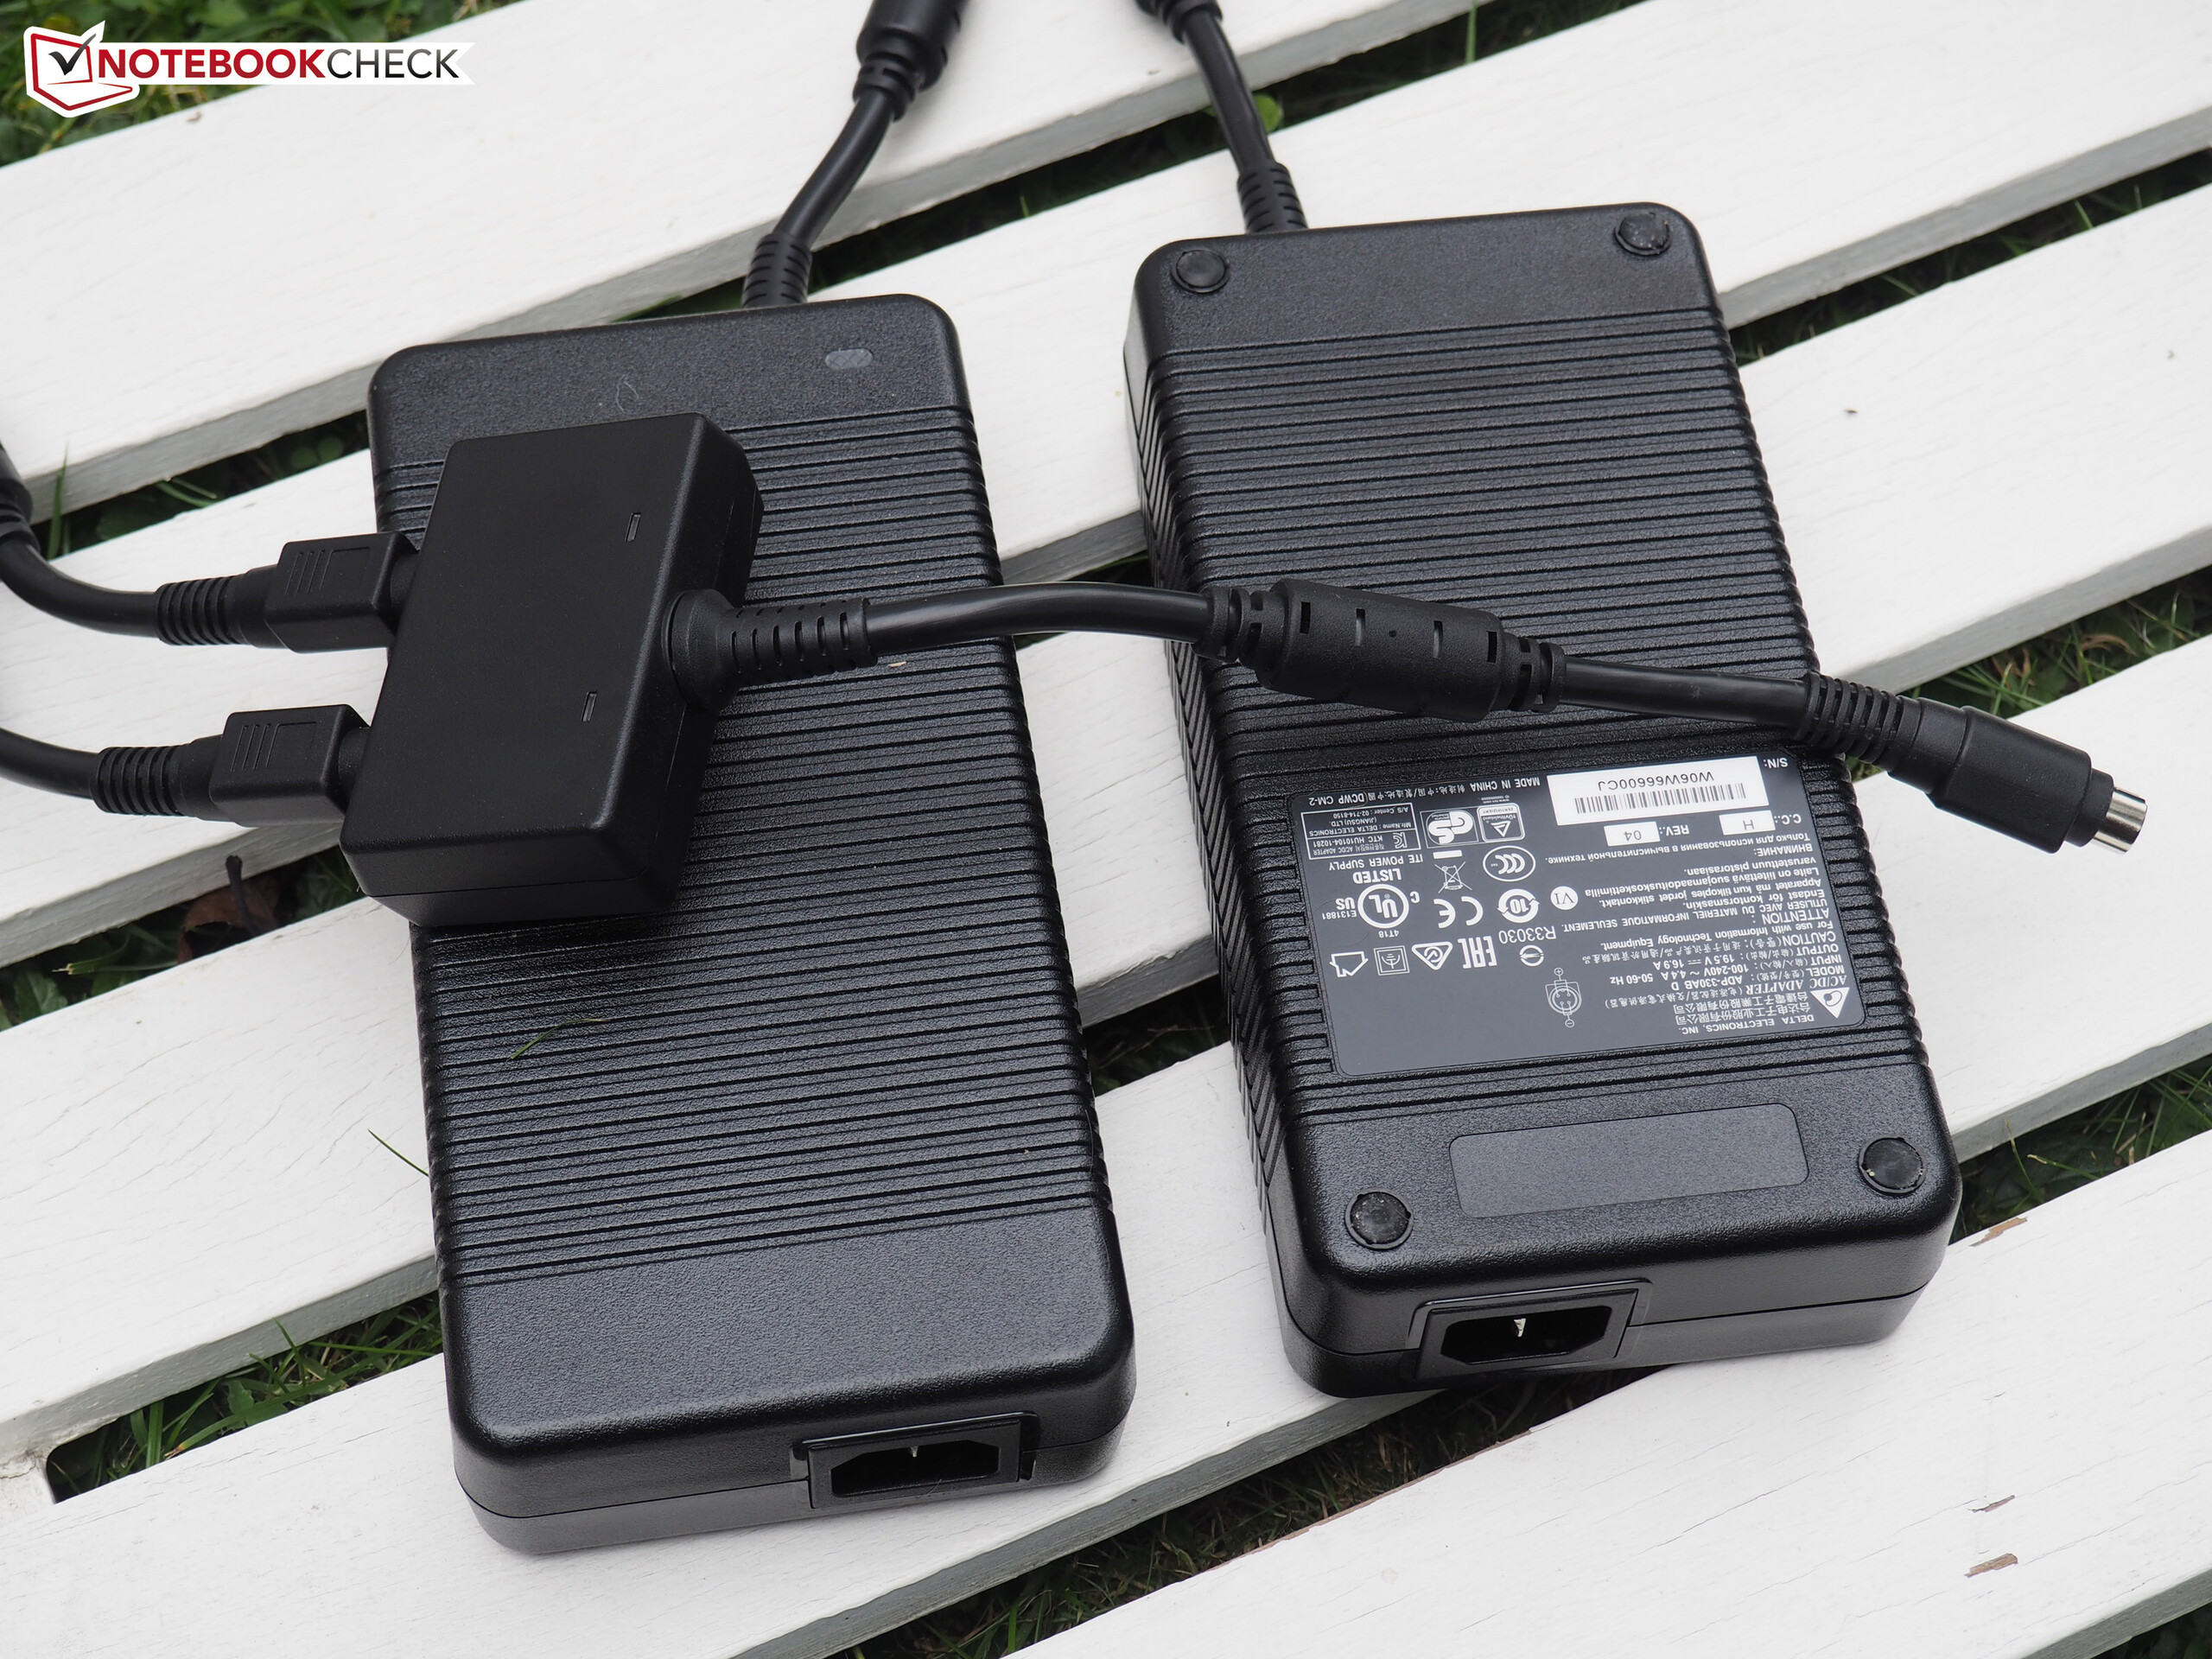
不过感兴趣的用户需要注意的是,这台桌面式设备的电池续航时间非常短。如果考虑上两个电源适配器,P870DM3-G准系统的总重量达到了8千克。至少我们在为它拍了户外照片之后就再也不想带着它出门了。
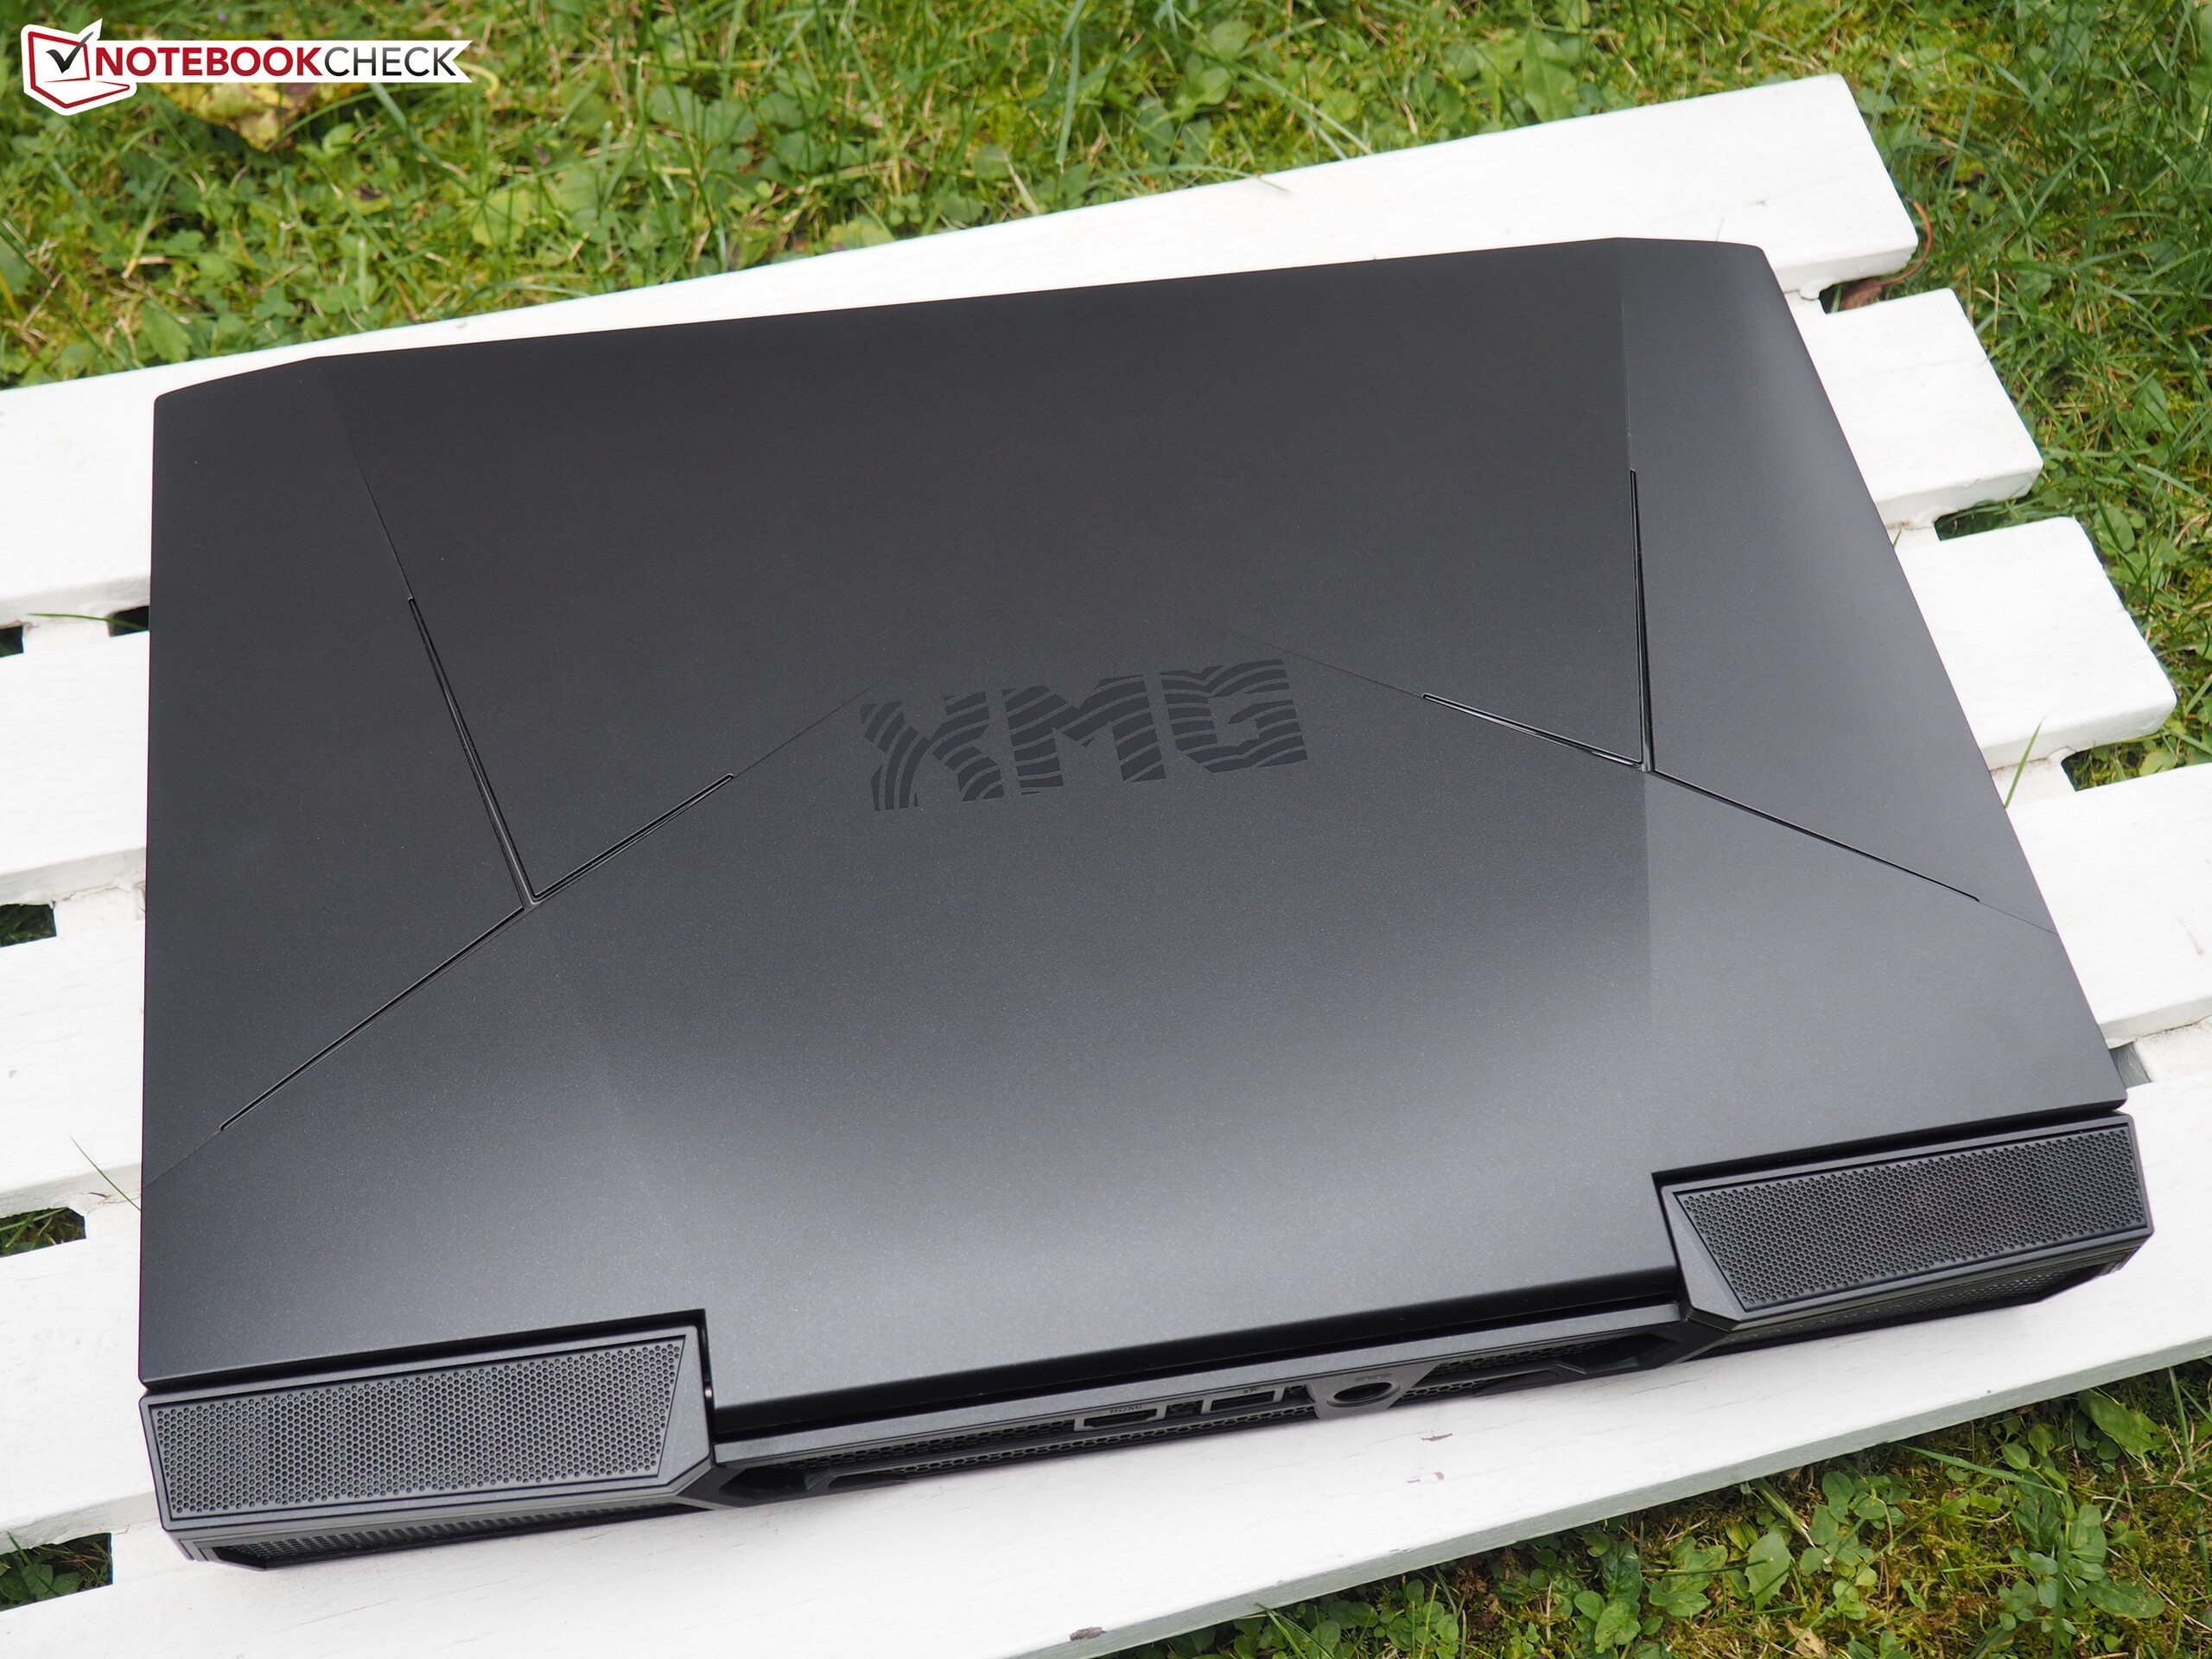
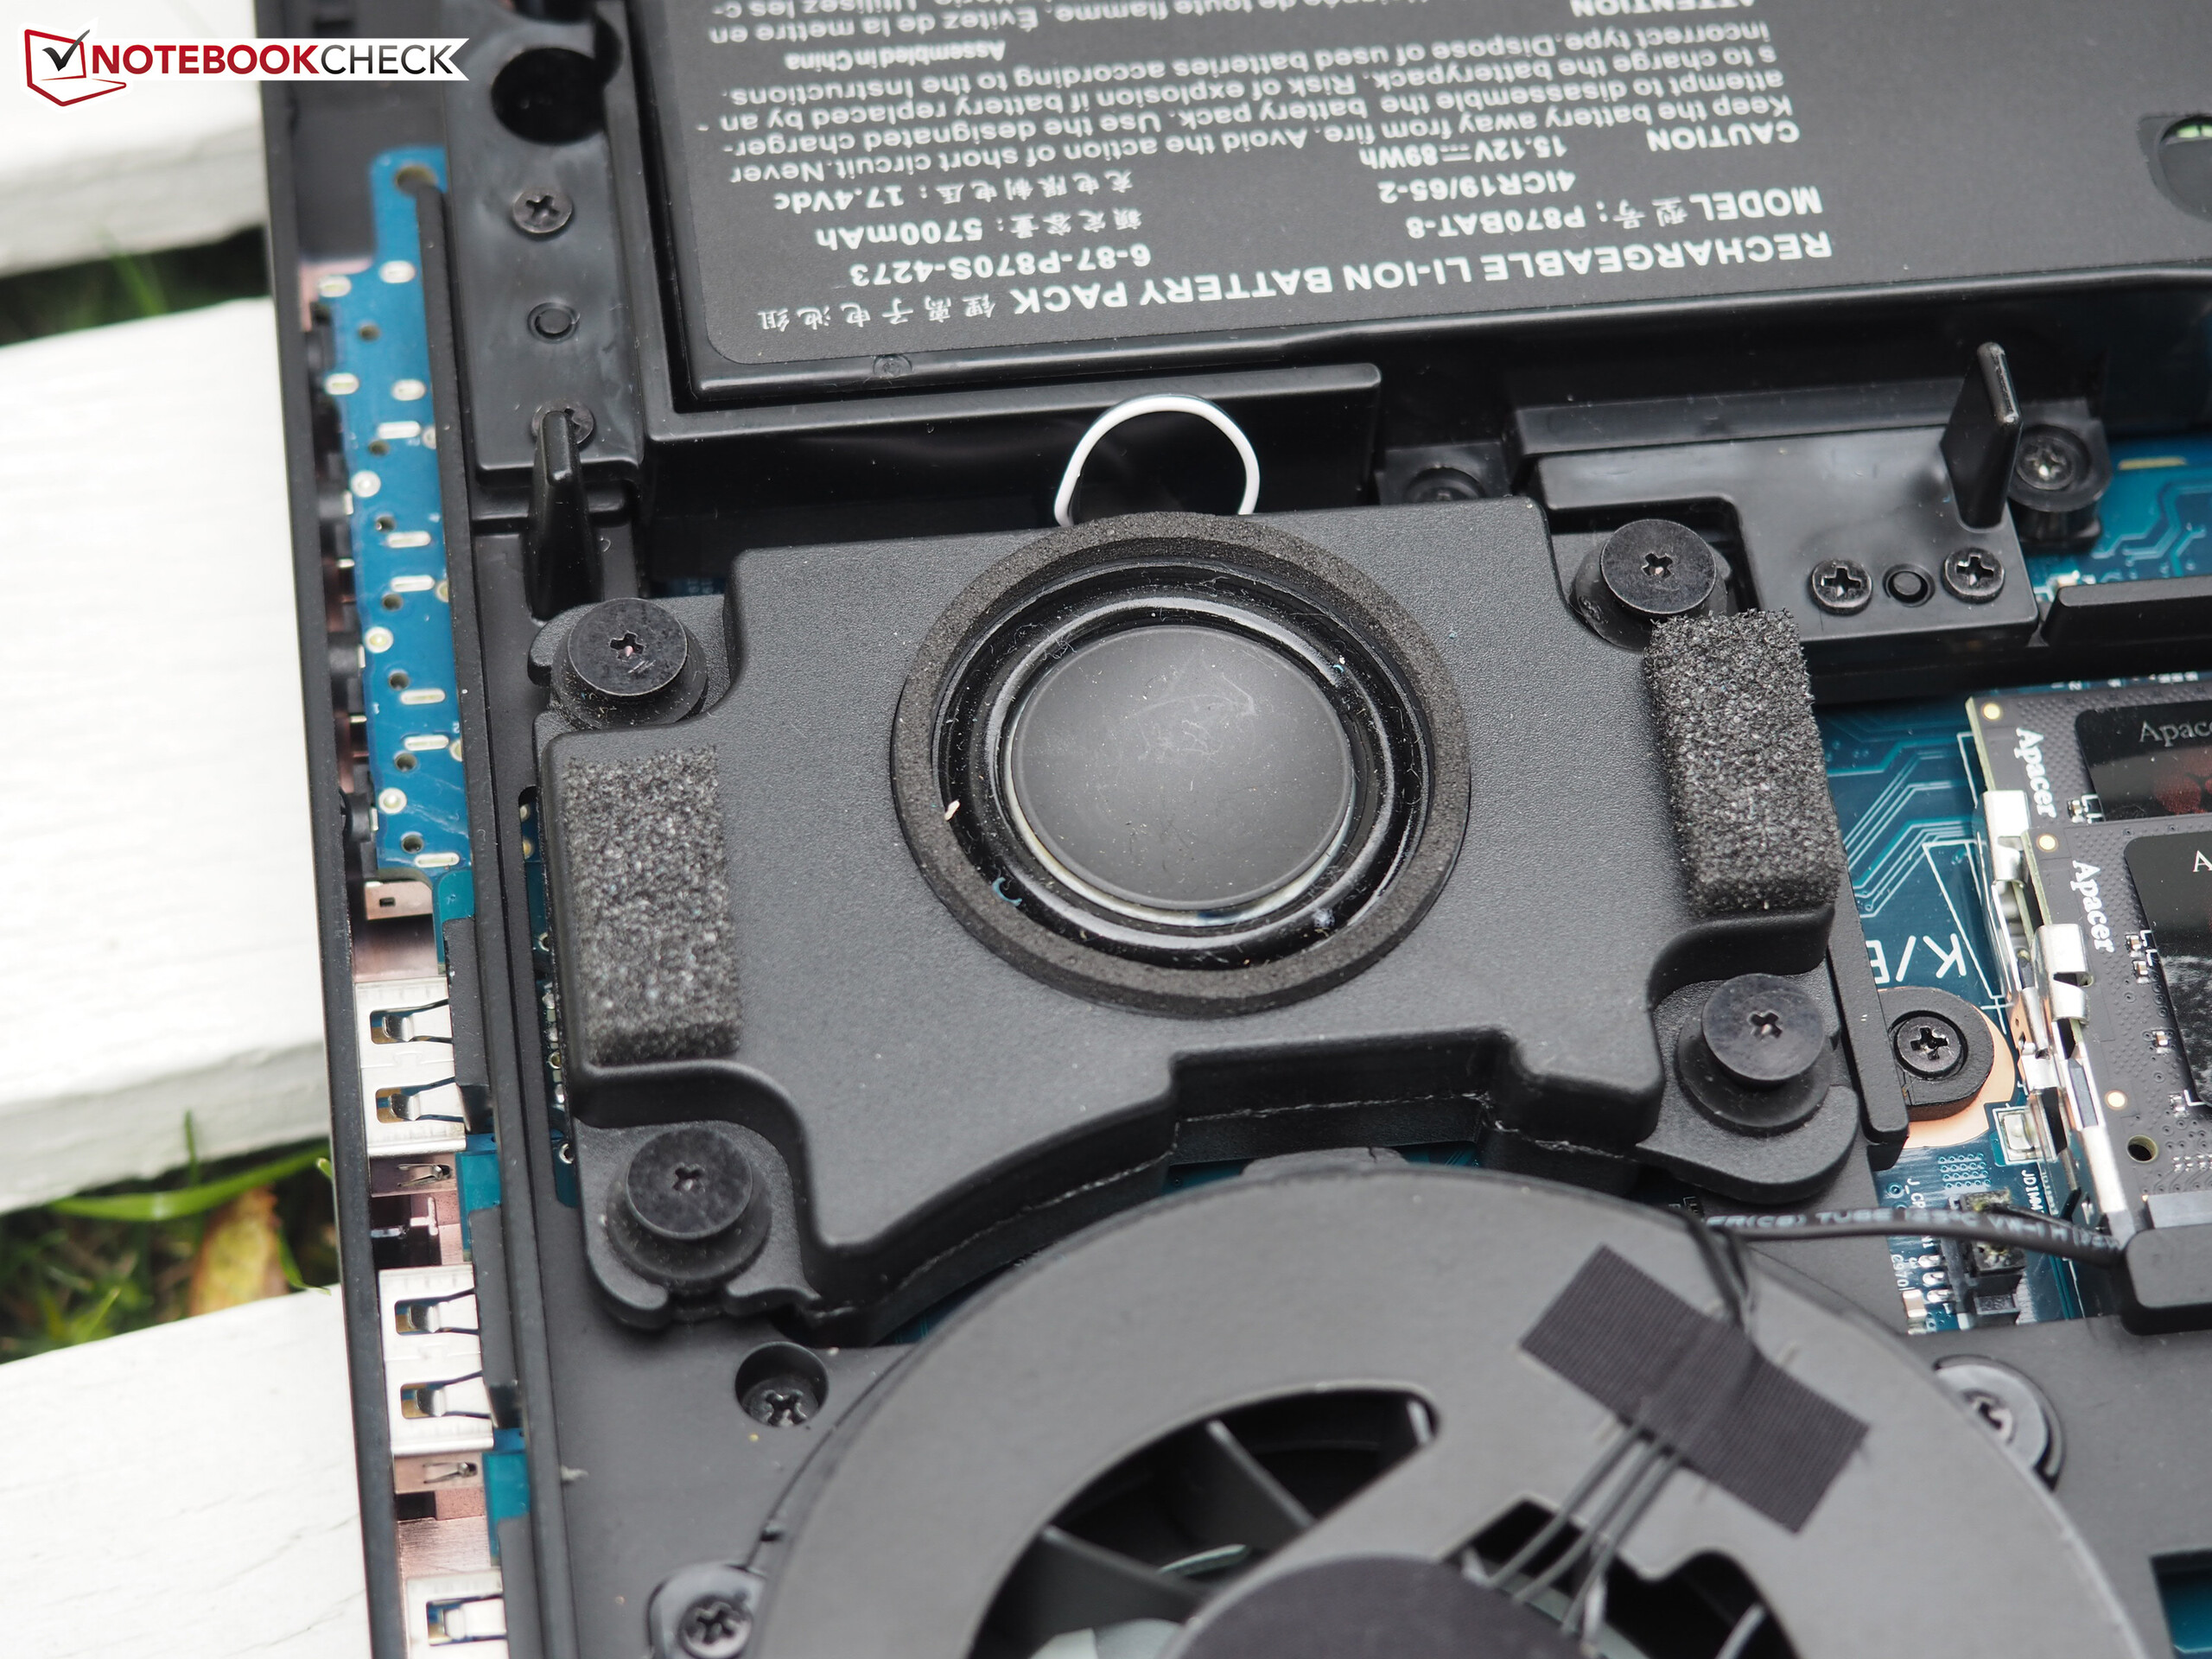
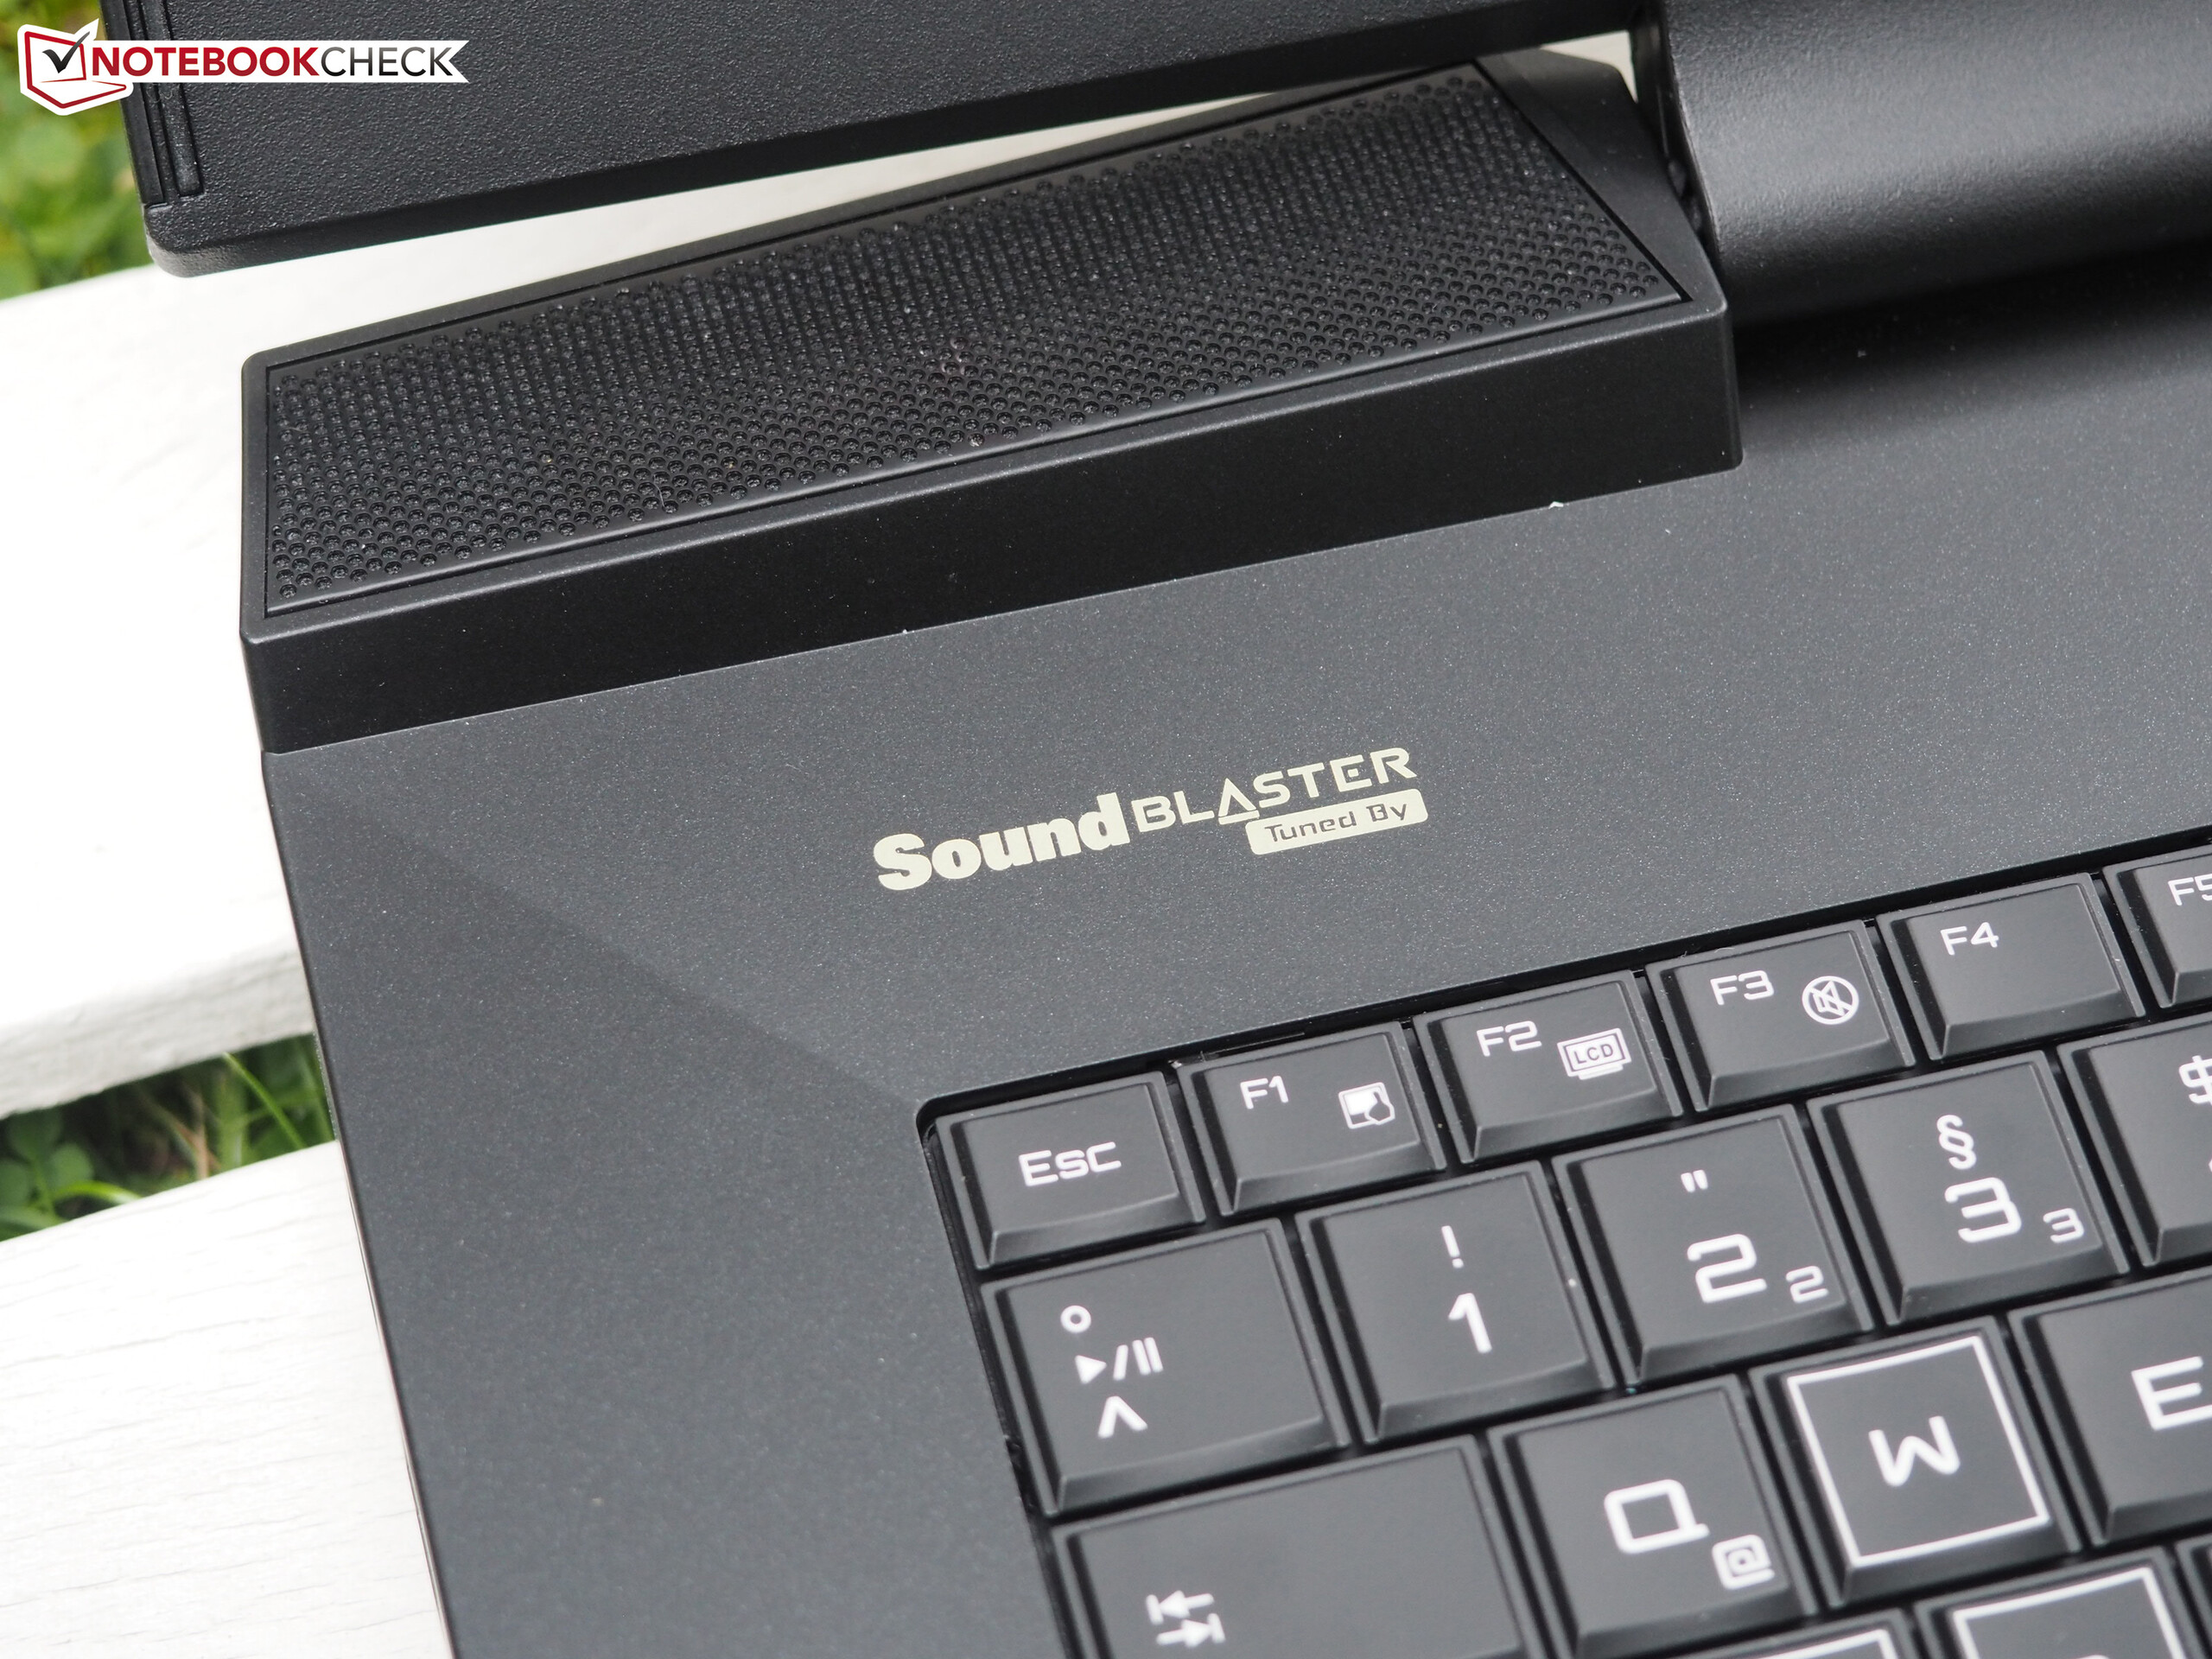
如果你对机身的品质十分重视的话,它应该不会让你失望。它在工艺质量和输入设备方面都十分优秀。同时你还可以得到优秀的扬声器和个性化设置。这台桌面式笔记本的软件功能也十分方便。用户可以在控制中心软件中手动控制风扇和性能指数。
长话短说:XMG U727对预算充足、希望体验极致性能和最新科技又讨厌台式机的骨灰级游戏玩家来说是个不错的选择。对于其他用户来说我们依然推荐搭配淡显卡的普通游戏本。
注:本文是基于完整评测的缩减版本,阅读完整的英文评测,请点击这里。
Schenker XMG U727
- 12/31/2016 v6 (old)
Florian Glaser
Price comparison