微星 GT73VR 6RE Titan 笔记本电脑简短评测
| SD Card Reader | |
| average JPG Copy Test (av. of 3 runs) | |
| Asus GX700 | |
| Schenker XMG U726 | |
| MSI GT73VR-6RE16SR451 | |
| MSI GT72VR 6RE-015US | |
| Asus G752VS-XB78K | |
| maximum AS SSD Seq Read Test (1GB) | |
| Asus GX700 | |
| Schenker XMG U726 | |
| MSI GT73VR-6RE16SR451 | |
| MSI GT72VR 6RE-015US | |
| Asus G752VS-XB78K | |
| Networking | |
| iperf Server (receive) TCP 1 m | |
| MSI GT73VR-6RE16SR451 | |
| Asus G752VS-XB78K | |
| iperf Client (transmit) TCP 1 m | |
| MSI GT73VR-6RE16SR451 | |
| Asus G752VS-XB78K | |
| |||||||||||||||||||||||||
Brightness Distribution: 89 %
Center on Battery: 314 cd/m²
Contrast: 1365:1 (Black: 0.23 cd/m²)
ΔE ColorChecker Calman: 9.74 | ∀{0.5-29.43 Ø4.71}
ΔE Greyscale Calman: 9.58 | ∀{0.09-98 Ø4.96}
100% sRGB (Argyll 1.6.3 3D)
76% AdobeRGB 1998 (Argyll 1.6.3 3D)
84.9% AdobeRGB 1998 (Argyll 3D)
100% sRGB (Argyll 3D)
91.2% Display P3 (Argyll 3D)
Gamma: 2.5
CCT: 11854 K
| MSI GT73VR-6RE16SR451 N173HHE-G32 (CMN1747), 1920x1080 | Asus G752VS-XB78K LG Philips LP173WF4-SPF3 (LGD04E8), 1920x1080 | MSI GT72VR 6RE-015US LG Philips LGD046E, 1920x1080 | Asus GX700 LP173WF4-SPF3 (LGD04E8), 1920x1080 | Schenker XMG U726 AU B173ZAN01.0 (AUO109B), 3840x2160 | |
|---|---|---|---|---|---|
| Display | -23% | -21% | -23% | 4% | |
| Display P3 Coverage (%) | 91.2 | 66.9 -27% | 68.3 -25% | 66.7 -27% | 87 -5% |
| sRGB Coverage (%) | 100 | 85.2 -15% | 86.7 -13% | 84.9 -15% | 100 0% |
| AdobeRGB 1998 Coverage (%) | 84.9 | 62.3 -27% | 63.4 -25% | 62.1 -27% | 98.9 16% |
| Response Times | -135% | -152% | -133% | ||
| Response Time Grey 50% / Grey 80% * (ms) | 26 ? | 38 ? -46% | 34.4 ? -32% | 37 ? -42% | |
| Response Time Black / White * (ms) | 6.8 ? | 22 ? -224% | 25.2 ? -271% | 22 ? -224% | |
| PWM Frequency (Hz) | |||||
| Screen | 10% | 10% | -2% | 12% | |
| Brightness middle (cd/m²) | 314 | 328 4% | 348.7 11% | 332 6% | 330 5% |
| Brightness (cd/m²) | 294 | 317 8% | 327 11% | 319 9% | 327 11% |
| Brightness Distribution (%) | 89 | 88 -1% | 89 0% | 93 4% | 86 -3% |
| Black Level * (cd/m²) | 0.23 | 0.3 -30% | 0.323 -40% | 0.34 -48% | 0.38 -65% |
| Contrast (:1) | 1365 | 1093 -20% | 1080 -21% | 976 -28% | 868 -36% |
| Colorchecker dE 2000 * | 9.74 | 3.74 62% | 4.09 58% | 5.35 45% | 3 69% |
| Colorchecker dE 2000 max. * | 15.71 | 8.97 43% | 9.02 43% | 5.3 66% | |
| Greyscale dE 2000 * | 9.58 | 2.67 72% | 2.14 78% | 6.45 33% | 3.81 60% |
| Gamma | 2.5 88% | 2.41 91% | 2.25 98% | 2.34 94% | 2.52 87% |
| CCT | 11854 55% | 6861 95% | 6885 94% | 7048 92% | 6306 103% |
| Color Space (Percent of AdobeRGB 1998) (%) | 76 | 56 -26% | 56.9 -25% | 56 -26% | 88 16% |
| Color Space (Percent of sRGB) (%) | 100 | 85 -15% | 86.5 -13% | 85 -15% | 100 0% |
| Total Average (Program / Settings) | -49% /
-16% | -54% /
-18% | -53% /
-25% | 8% /
10% |
* ... smaller is better
Display Response Times
| ↔ Response Time Black to White | ||
|---|---|---|
| 6.8 ms ... rise ↗ and fall ↘ combined | ↗ 4.2 ms rise | 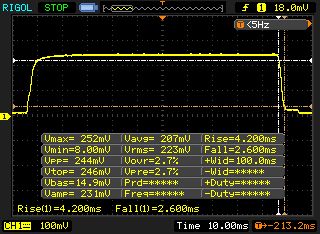 |
| ↘ 2.6 ms fall | ||
| The screen shows very fast response rates in our tests and should be very well suited for fast-paced gaming. In comparison, all tested devices range from 0.1 (minimum) to 240 (maximum) ms. » 21 % of all devices are better. This means that the measured response time is better than the average of all tested devices (19.8 ms). | ||
| ↔ Response Time 50% Grey to 80% Grey | ||
| 26 ms ... rise ↗ and fall ↘ combined | ↗ 12 ms rise | 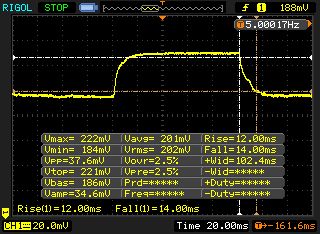 |
| ↘ 14 ms fall | ||
| The screen shows relatively slow response rates in our tests and may be too slow for gamers. In comparison, all tested devices range from 0.165 (minimum) to 636 (maximum) ms. » 36 % of all devices are better. This means that the measured response time is better than the average of all tested devices (30.9 ms). | ||
Screen Flickering / PWM (Pulse-Width Modulation)
| Screen flickering / PWM not detected |  | ||
In comparison: 52 % of all tested devices do not use PWM to dim the display. If PWM was detected, an average of 7748 (minimum: 5 - maximum: 343500) Hz was measured. | |||
| Cinebench R15 - CPU Multi 64Bit | |
| Asus GX700 | |
| MSI GT73VR-6RE16SR451 | |
| Schenker XMG U726 | |
| Asus G752VS-XB78K | |
| MSI GT72VR 6RE-015US | |
| Cinebench R11.5 - CPU Multi 64Bit | |
| Asus GX700 | |
| MSI GT73VR-6RE16SR451 | |
| Schenker XMG U726 | |
| Asus G752VS-XB78K | |
| MSI GT72VR 6RE-015US | |
| PCMark 7 Score | 7024 points | |
| PCMark 8 Home Score Accelerated v2 | 5034 points | |
| PCMark 8 Work Score Accelerated v2 | 5186 points | |
Help | ||
| PCMark 7 - Score | |
| Asus GX700 | |
| Schenker XMG U726 | |
| MSI GT73VR-6RE16SR451 | |
| Asus G752VS-XB78K | |
| PCMark 8 | |
| Home Score Accelerated v2 | |
| Asus GX700 | |
| Asus G752VS-XB78K | |
| MSI GT73VR-6RE16SR451 | |
| MSI GT72VR 6RE-015US | |
| Schenker XMG U726 | |
| Work Score Accelerated v2 | |
| Asus GX700 | |
| Asus G752VS-XB78K | |
| MSI GT73VR-6RE16SR451 | |
| MSI GT72VR 6RE-015US | |
| Schenker XMG U726 | |
| MSI GT73VR-6RE16SR451 2x Samsung SM951 MZVPV256HDGL (RAID 0) | Asus G752VS-XB78K Toshiba NVMe THNSN5512GPU7 | MSI GT72VR 6RE-015US SanDisk SD8SNAT256G1122 | Asus GX700 2x Samsung SM951 MZVPV512HDGL (RAID 0) | Schenker XMG U726 Samsung SM951 MZHPV512HDGL m.2 PCI-e | |
|---|---|---|---|---|---|
| AS SSD | -67% | 3% | -28% | ||
| Seq Read (MB/s) | 2804 | 507 -82% | 2964 6% | 1943 -31% | |
| Seq Write (MB/s) | 2190 | 322.1 -85% | 2525 15% | 1500 -32% | |
| 4K Read (MB/s) | 47.36 | 21.41 -55% | 46.43 -2% | 40.45 -15% | |
| 4K Write (MB/s) | 130 | 84.1 -35% | 119.6 -8% | 103.6 -20% | |
| Score Total (Points) | 3445 | 688 -80% | 3655 6% | 1930 -44% |

| 3DMark 11 Performance | 17829 points | |
| 3DMark Ice Storm Standard Score | 166114 points | |
| 3DMark Cloud Gate Standard Score | 29897 points | |
| 3DMark Fire Strike Score | 13974 points | |
| 3DMark Time Spy Score | 5420 points | |
Help | ||
| 3DMark 11 - 1280x720 Performance GPU | |
| MSI GT73VR-6RE16SR451 | |
| Asus G752VS-XB78K | |
| Asus GX700 | |
| Schenker XMG U726 | |
| MSI GT72VR 6RE-015US | |
| 3DMark | |
| 1920x1080 Fire Strike Graphics | |
| MSI GT73VR-6RE16SR451 | |
| MSI GT72VR 6RE-015US | |
| Asus G752VS-XB78K | |
| Asus GX700 | |
| Schenker XMG U726 | |
| 3840x2160 Fire Strike Ultra Graphics | |
| MSI GT73VR-6RE16SR451 | |
| Asus G752VS-XB78K | |
| MSI GT72VR 6RE-015US | |
| Asus GX700 | |
| Schenker XMG U726 | |
| Unigine Heaven 4.0 - Extreme Preset DX11 | |
| MSI GT73VR-6RE16SR451 | |
| Asus G752VS-XB78K | |
| Schenker XMG U726 | |
| Asus GX700 | |
| Overwatch | |
| 3840x2160 High (Render Scale 100 %) AA:SM AF:4x | |
| Asus G800VI Prototype | |
| MSI GT73VR-6RE16SR451 | |
| MSI GT62VR-6RE16H21 | |
| Asus GX800 Prototype | |
| Schenker XMG P507 | |
| 1920x1080 Epic (Render Scale 100 %) AA:SM AF:16x | |
| Asus G800VI Prototype | |
| MSI GT73VR-6RE16SR451 | |
| MSI GT62VR-6RE16H21 | |
| Asus GX800 Prototype | |
| Schenker XMG P507 | |
| The Division | |
| 3840x2160 High Preset AF:8x | |
| Asus G800VI Prototype | |
| MSI GT73VR-6RE16SR451 | |
| MSI GT62VR-6RE16H21 | |
| Asus GX800 Prototype | |
| Schenker XMG P507 | |
| 1920x1080 Ultra Preset AF:16x | |
| Asus G800VI Prototype | |
| MSI GT73VR-6RE16SR451 | |
| MSI GT62VR-6RE16H21 | |
| Asus GX800 Prototype | |
| Schenker XMG P507 | |
| Far Cry Primal | |
| 3840x2160 High Preset AA:SM | |
| Asus G800VI Prototype | |
| MSI GT73VR-6RE16SR451 | |
| MSI GT62VR-6RE16H21 | |
| Asus GX800 Prototype | |
| Schenker XMG P507 | |
| 1920x1080 Ultra Preset AA:SM | |
| Asus G800VI Prototype | |
| MSI GT73VR-6RE16SR451 | |
| MSI GT62VR-6RE16H21 | |
| Asus GX800 Prototype | |
| Schenker XMG P507 | |
| Rainbow Six Siege | |
| 3840x2160 High Preset AA:T AF:4x | |
| Asus G800VI Prototype | |
| MSI GT73VR-6RE16SR451 | |
| MSI GT62VR-6RE16H21 | |
| Schenker XMG P507 | |
| 1920x1080 Ultra Preset AA:T AF:16x | |
| Asus G800VI Prototype | |
| MSI GT73VR-6RE16SR451 | |
| MSI GT62VR-6RE16H21 | |
| Schenker XMG P507 | |
| Assassin's Creed Syndicate | |
| 3840x2160 High Preset AA:FX | |
| Asus G800VI Prototype | |
| MSI GT73VR-6RE16SR451 | |
| MSI GT62VR-6RE16H21 | |
| Schenker XMG U716 | |
| Schenker XMG P507 | |
| 1920x1080 Ultra High Preset AA:4x MSAA + FX | |
| Asus G800VI Prototype | |
| MSI GT73VR-6RE16SR451 | |
| MSI GT62VR-6RE16H21 | |
| Schenker XMG U716 | |
| Schenker XMG P507 | |
| Anno 2205 | |
| 3840x2160 High Preset AA:4x | |
| Asus G800VI Prototype | |
| MSI GT73VR-6RE16SR451 | |
| MSI GT62VR-6RE16H21 | |
| Schenker XMG U716 | |
| Schenker XMG P507 | |
| 1920x1080 Ultra High Preset AA:8x | |
| Asus G800VI Prototype | |
| MSI GT73VR-6RE16SR451 | |
| MSI GT62VR-6RE16H21 | |
| Schenker XMG U716 | |
| Schenker XMG P507 | |
| low | med. | high | ultra | 4K | |
|---|---|---|---|---|---|
| Anno 2205 (2015) | 102 | 47.6 | 52.8 | ||
| Assassin's Creed Syndicate (2015) | 79.5 | 47.9 | 38.4 | ||
| Rainbow Six Siege (2015) | 201 | 173 | 66.1 | ||
| Far Cry Primal (2016) | 104 | 89 | 39 | ||
| The Division (2016) | 102 | 81 | 40 | ||
| Overwatch (2016) | 251 | 157 | 83.8 |
Noise level
| Idle |
| 32 / 33 / 35 dB(A) |
| Load |
| 35 / 49 dB(A) |
 | ||
30 dB silent 40 dB(A) audible 50 dB(A) loud |
||
min: | ||
| MSI GT73VR-6RE16SR451 GeForce GTX 1070 Mobile, 6820HK | Asus G752VS-XB78K GeForce GTX 1070 Mobile, 6820HK | MSI GT72VR 6RE-015US GeForce GTX 1070 Mobile, 6700HQ | Asus GX700 GeForce GTX 980 (Laptop), 6820HK | Schenker XMG U726 GeForce GTX 980 (Laptop), 6700 | |
|---|---|---|---|---|---|
| Noise | 0% | -1% | -12% | -4% | |
| off / environment * (dB) | 30 | 30 -0% | 28.9 4% | ||
| Idle Minimum * (dB) | 32 | 31 3% | 32.4 -1% | 33 -3% | 33 -3% |
| Idle Average * (dB) | 33 | 32 3% | 32.4 2% | 35 -6% | 34 -3% |
| Idle Maximum * (dB) | 35 | 33 6% | 32.4 7% | 42 -20% | 35 -0% |
| Load Average * (dB) | 35 | 40 -14% | 39.4 -13% | 46 -31% | 42 -20% |
| Load Maximum * (dB) | 49 | 47 4% | 52 -6% | 48 2% | 46 6% |
* ... smaller is better
(±) The maximum temperature on the upper side is 44.9 °C / 113 F, compared to the average of 40.4 °C / 105 F, ranging from 21.2 to 68.8 °C for the class Gaming.
(-) The bottom heats up to a maximum of 51.2 °C / 124 F, compared to the average of 43.2 °C / 110 F
(+) In idle usage, the average temperature for the upper side is 31.2 °C / 88 F, compared to the device average of 33.9 °C / 93 F.
(+) The palmrests and touchpad are cooler than skin temperature with a maximum of 31.1 °C / 88 F and are therefore cool to the touch.
(-) The average temperature of the palmrest area of similar devices was 28.8 °C / 83.8 F (-2.3 °C / -4.2 F).
| MSI GT73VR-6RE16SR451 GeForce GTX 1070 Mobile, 6820HK | Asus G752VS-XB78K GeForce GTX 1070 Mobile, 6820HK | MSI GT72VR 6RE-015US GeForce GTX 1070 Mobile, 6700HQ | Asus GX700 GeForce GTX 980 (Laptop), 6820HK | Schenker XMG U726 GeForce GTX 980 (Laptop), 6700 | |
|---|---|---|---|---|---|
| Heat | 10% | 7% | -3% | -13% | |
| Maximum Upper Side * (°C) | 44.9 | 42.9 4% | 40.6 10% | 48.7 -8% | 46.9 -4% |
| Maximum Bottom * (°C) | 51.2 | 41.5 19% | 59.4 -16% | 61 -19% | |
| Idle Upper Side * (°C) | 32.7 | 31.6 3% | 28.2 14% | 32 2% | 36.3 -11% |
| Idle Bottom * (°C) | 34.2 | 29.5 14% | 27.8 19% | 40.8 -19% |
* ... smaller is better
MSI GT73VR-6RE16SR451 audio analysis
(+) | speakers can play relatively loud (82 dB)
Bass 100 - 315 Hz
(±) | reduced bass - on average 6.2% lower than median
(+) | bass is linear (6.4% delta to prev. frequency)
Mids 400 - 2000 Hz
(+) | balanced mids - only 1.6% away from median
(+) | mids are linear (5.3% delta to prev. frequency)
Highs 2 - 16 kHz
(±) | higher highs - on average 6.6% higher than median
(+) | highs are linear (6.8% delta to prev. frequency)
Overall 100 - 16.000 Hz
(+) | overall sound is linear (13.8% difference to median)
Compared to same class
» 21% of all tested devices in this class were better, 7% similar, 71% worse
» The best had a delta of 6%, average was 18%, worst was 132%
Compared to all devices tested
» 15% of all tested devices were better, 4% similar, 81% worse
» The best had a delta of 4%, average was 23%, worst was 134%
Asus G752VS-XB78K audio analysis
(±) | speaker loudness is average but good (76 dB)
Bass 100 - 315 Hz
(±) | reduced bass - on average 9.6% lower than median
(±) | linearity of bass is average (10.7% delta to prev. frequency)
Mids 400 - 2000 Hz
(+) | balanced mids - only 4.7% away from median
(±) | linearity of mids is average (10.3% delta to prev. frequency)
Highs 2 - 16 kHz
(±) | reduced highs - on average 8.3% lower than median
(±) | linearity of highs is average (9.7% delta to prev. frequency)
Overall 100 - 16.000 Hz
(±) | linearity of overall sound is average (22.4% difference to median)
Compared to same class
» 80% of all tested devices in this class were better, 6% similar, 14% worse
» The best had a delta of 6%, average was 18%, worst was 132%
Compared to all devices tested
» 66% of all tested devices were better, 6% similar, 29% worse
» The best had a delta of 4%, average was 23%, worst was 134%
| Off / Standby | |
| Idle | |
| Load |
|
Key:
min: | |
| MSI GT73VR-6RE16SR451 GeForce GTX 1070 Mobile, 6820HK | Asus G752VS-XB78K GeForce GTX 1070 Mobile, 6820HK | MSI GT72VR 6RE-015US GeForce GTX 1070 Mobile, 6700HQ | Asus GX700 GeForce GTX 980 (Laptop), 6820HK | Schenker XMG U726 GeForce GTX 980 (Laptop), 6700 | |
|---|---|---|---|---|---|
| Power Consumption | 12% | 7% | -34% | -30% | |
| Idle Minimum * (Watt) | 31 | 24 23% | 22.3 28% | 40 -29% | 36 -16% |
| Idle Average * (Watt) | 35 | 31 11% | 27.3 22% | 45 -29% | 45 -29% |
| Idle Maximum * (Watt) | 40 | 36 10% | 30 25% | 51 -27% | 53 -33% |
| Load Average * (Watt) | 106 | 94 11% | 152.2 -44% | 149 -41% | 139 -31% |
| Load Maximum * (Watt) | 218 | 204 6% | 204.2 6% | 313 -44% | 306 -40% |
* ... smaller is better
| MSI GT73VR-6RE16SR451 75.2 Wh | Asus G752VS-XB78K 90 Wh | MSI GT72VR 6RE-015US 83 Wh | Asus GX700 93 Wh | Schenker XMG U726 89 Wh | |
|---|---|---|---|---|---|
| Battery runtime | 9% | 13% | -2% | -5% | |
| Reader / Idle (h) | 4.8 | 5.2 8% | 5.4 13% | 3.4 -29% | 2.8 -42% |
| WiFi v1.3 (h) | 3.4 | 3.5 3% | 3.7 9% | ||
| Load (h) | 1.2 | 1.4 17% | 1.4 17% | 1.5 25% | 1.6 33% |
| H.264 (h) | 3.1 | 2.3 | |||
| Gaming (h) | 1.1 |
Pros
Cons
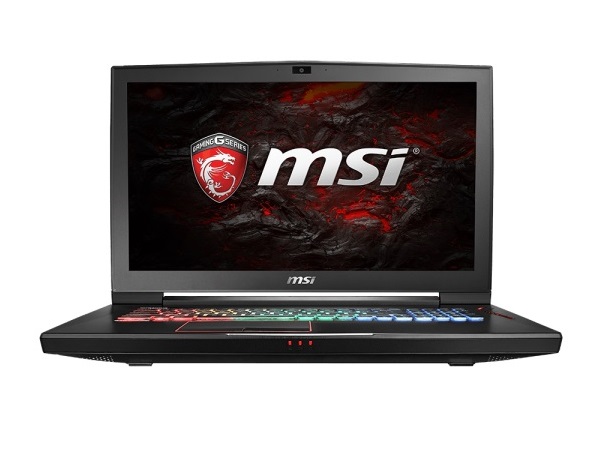
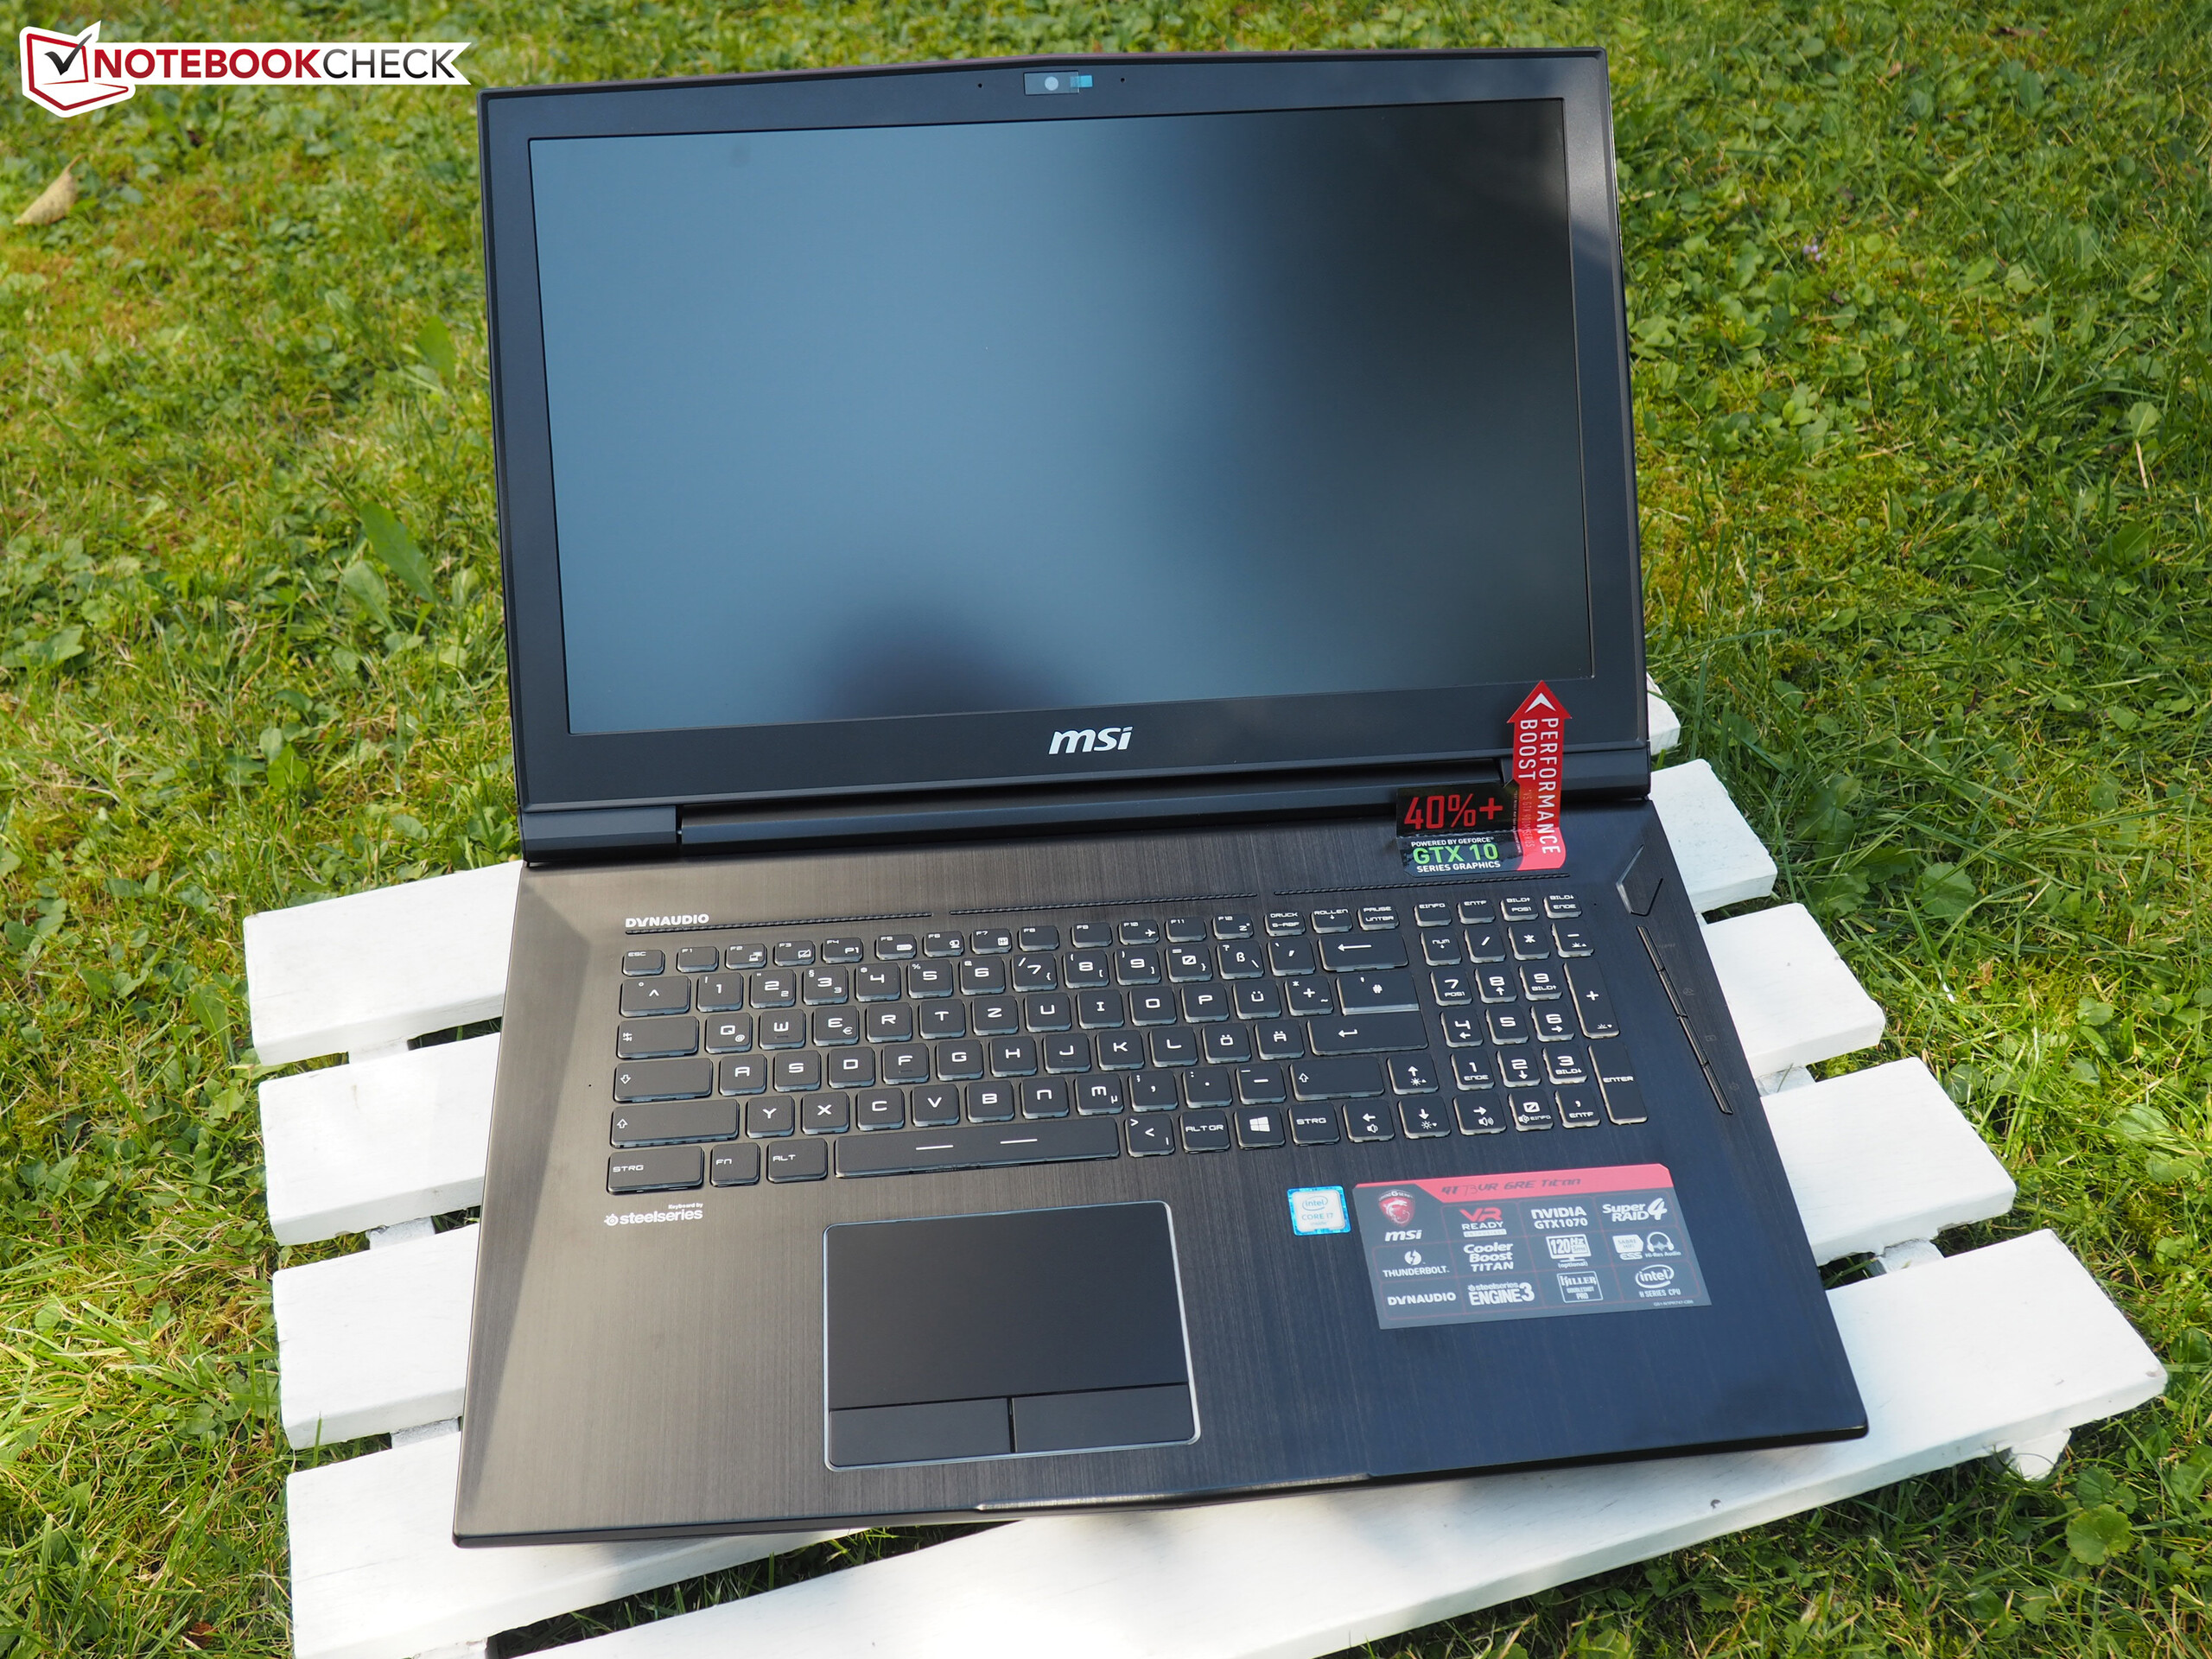
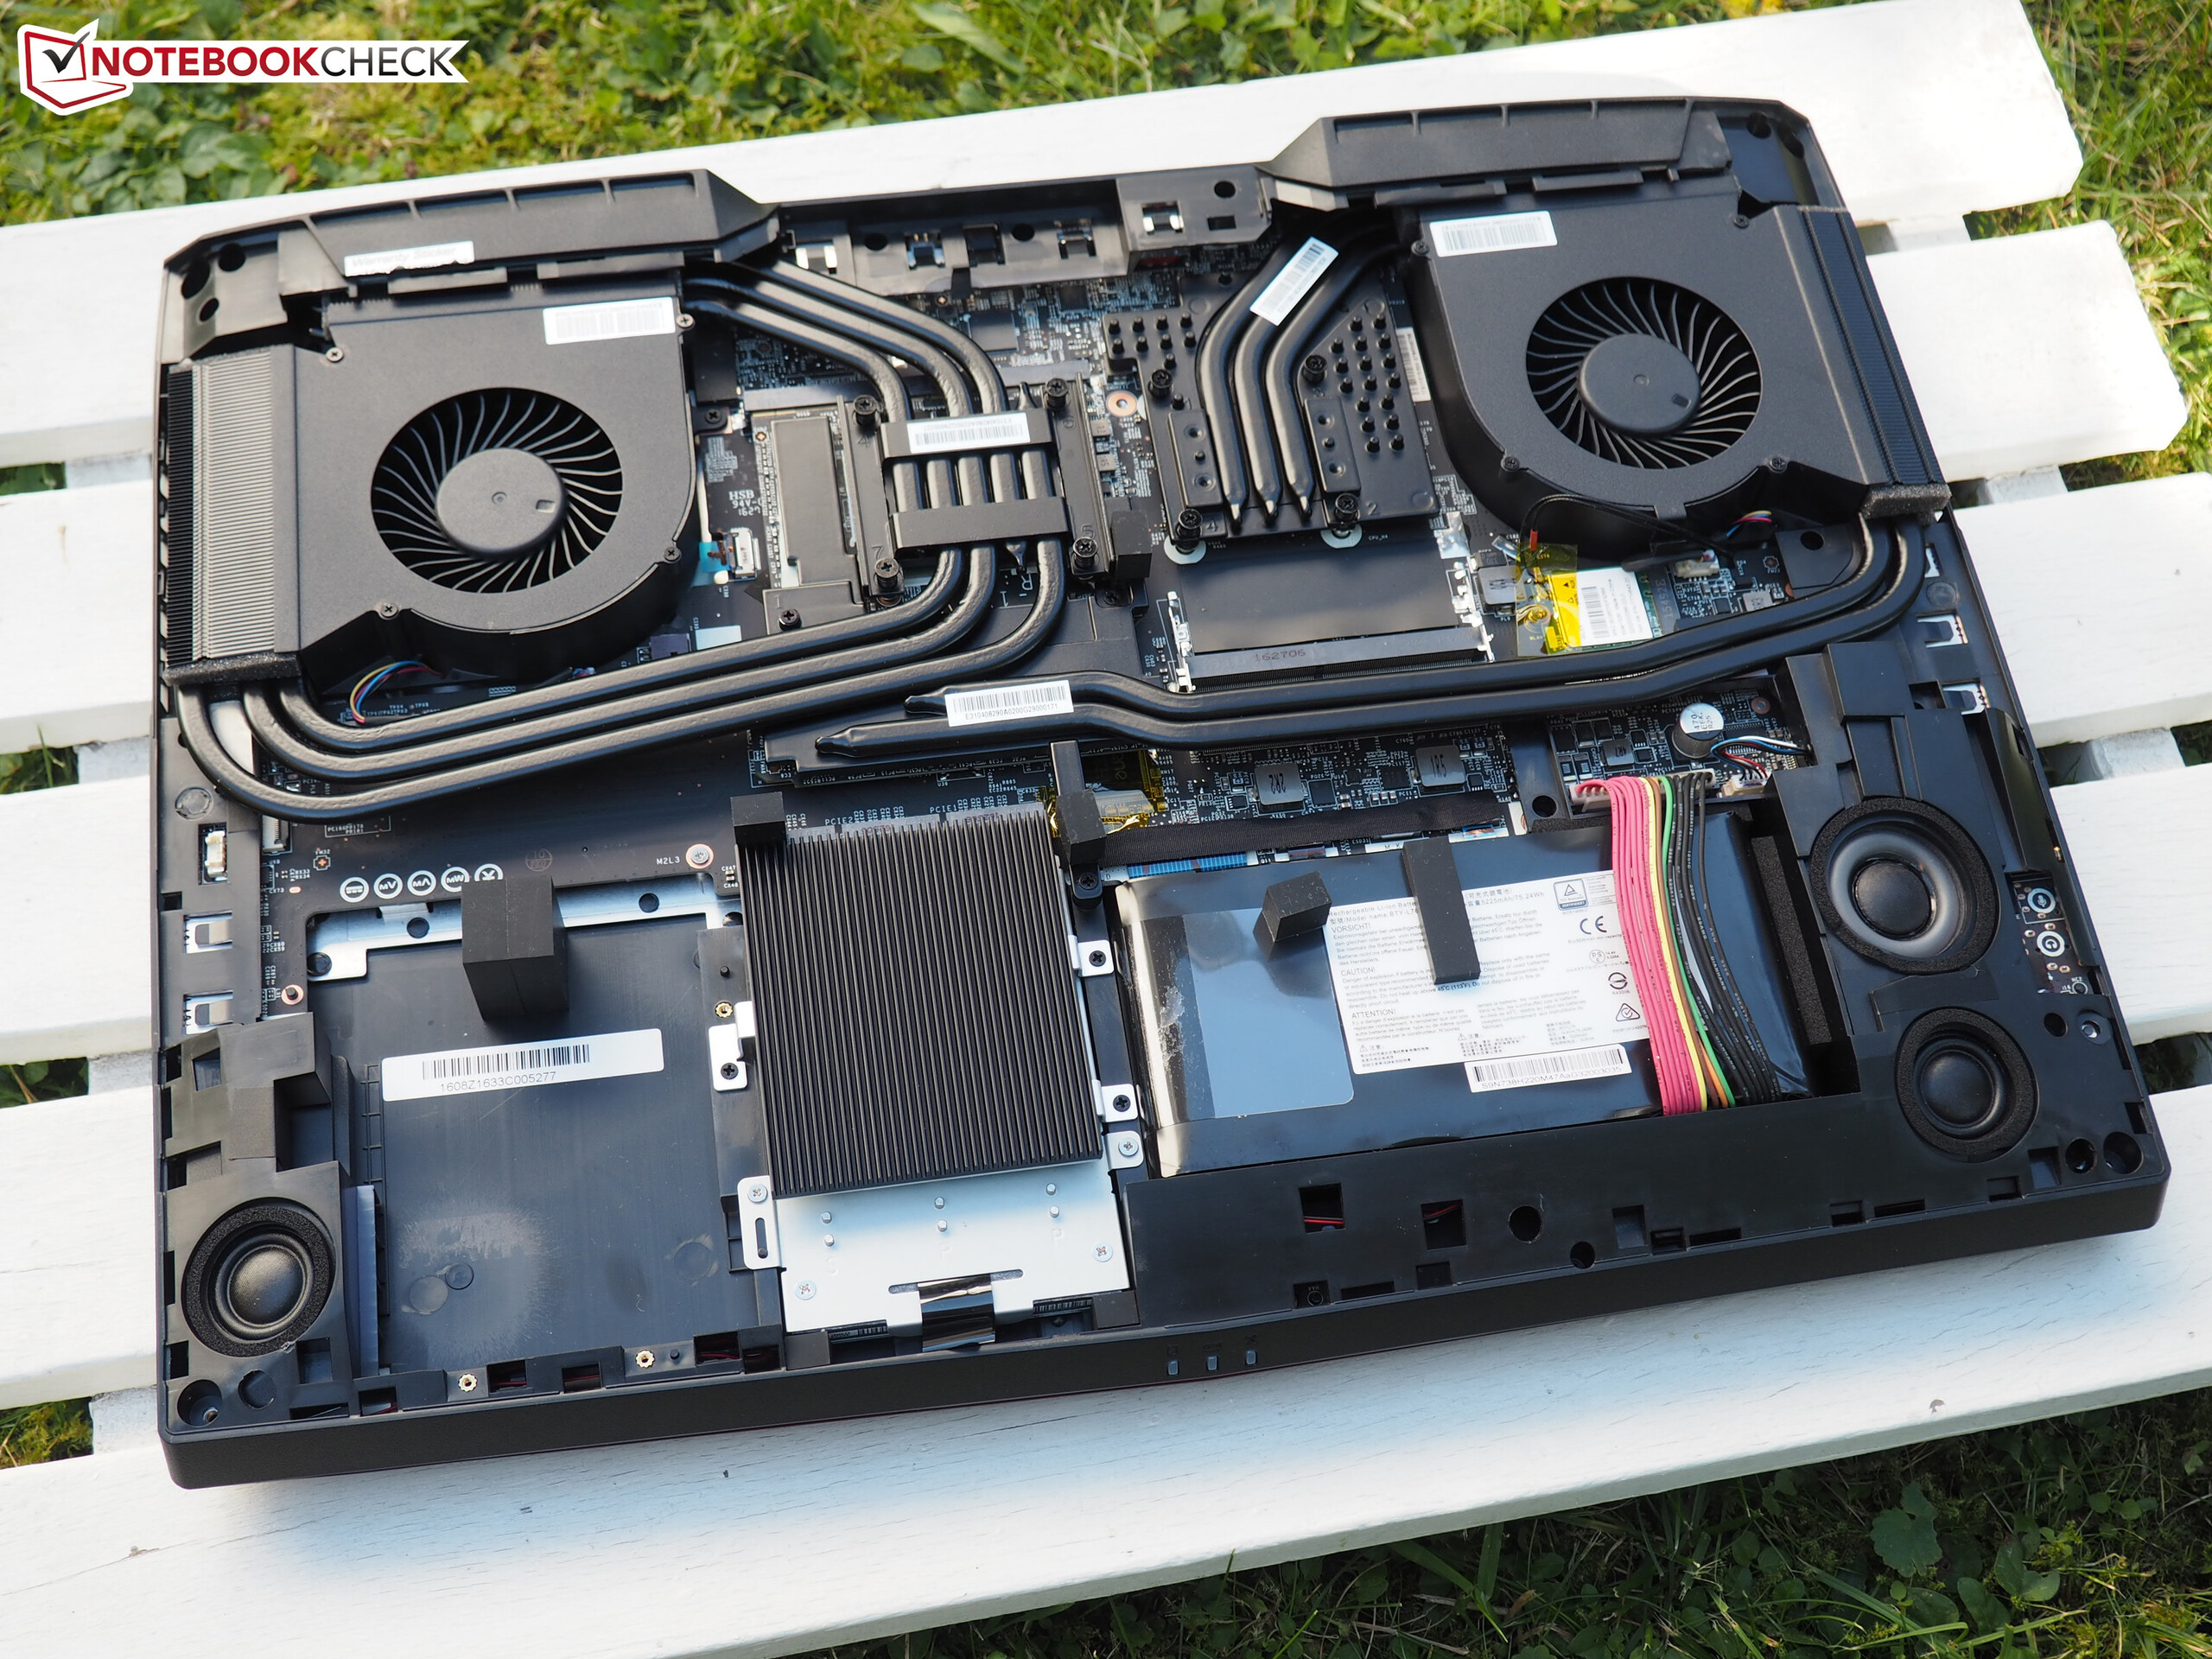
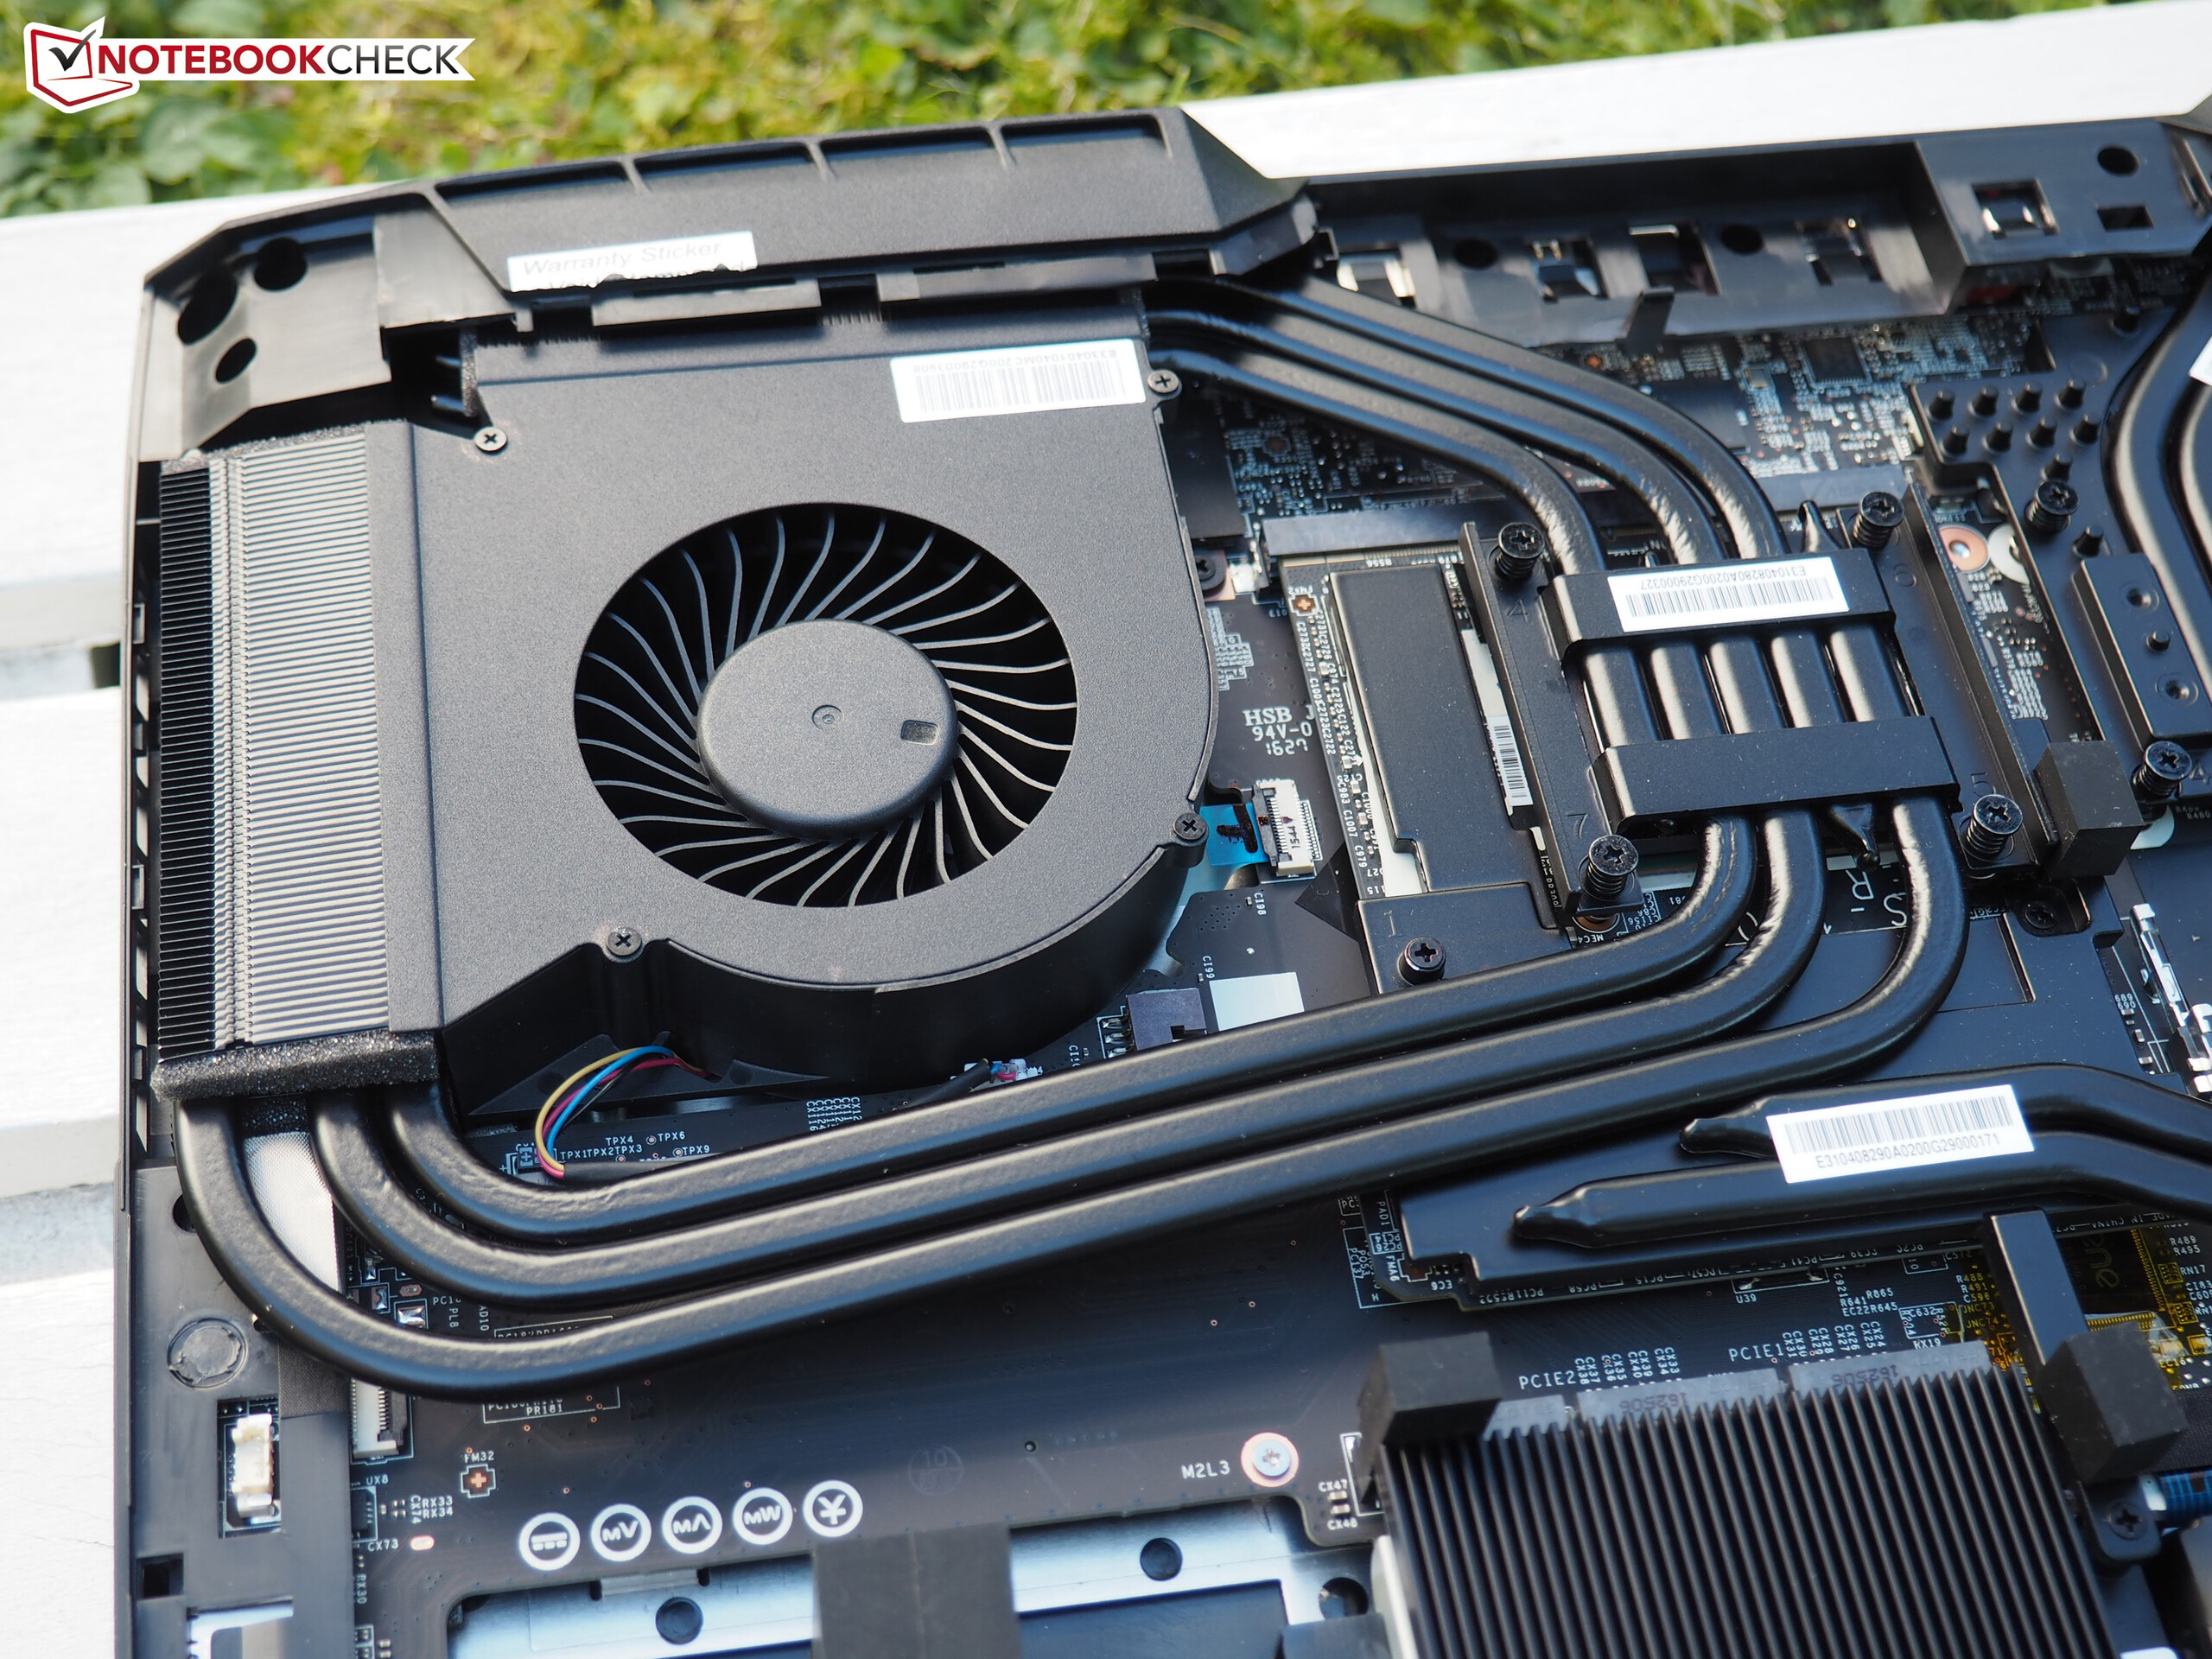
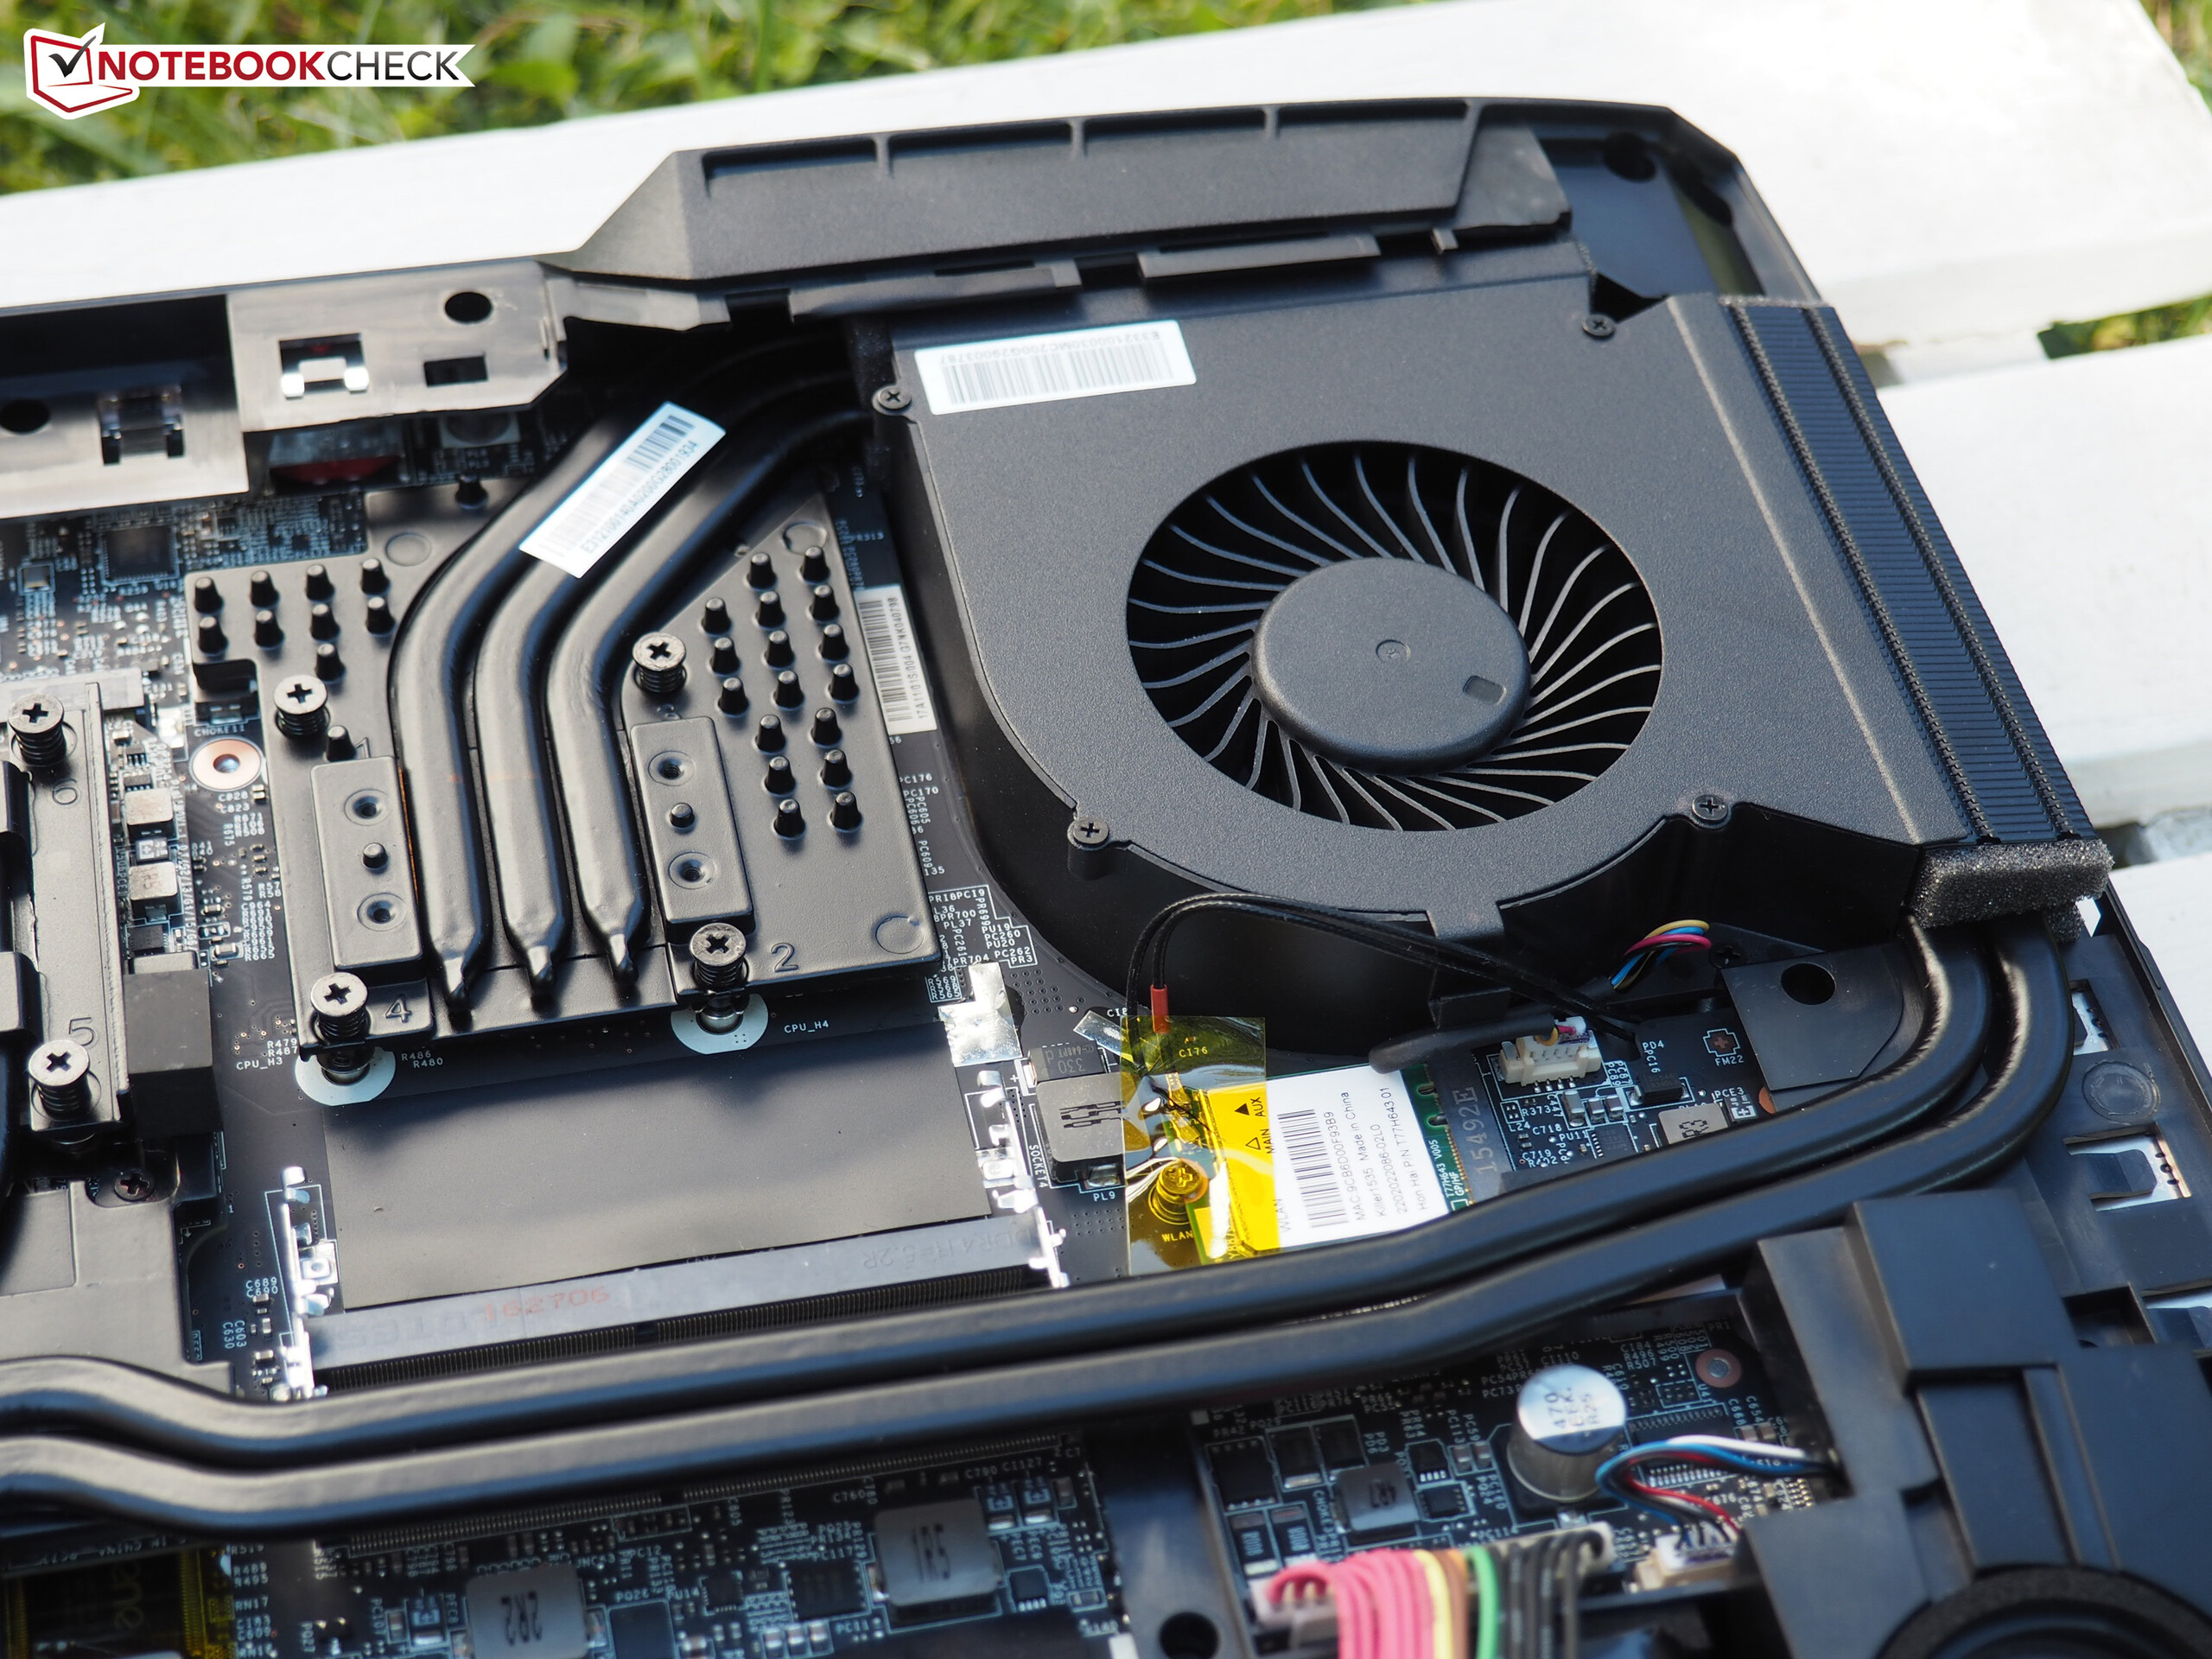
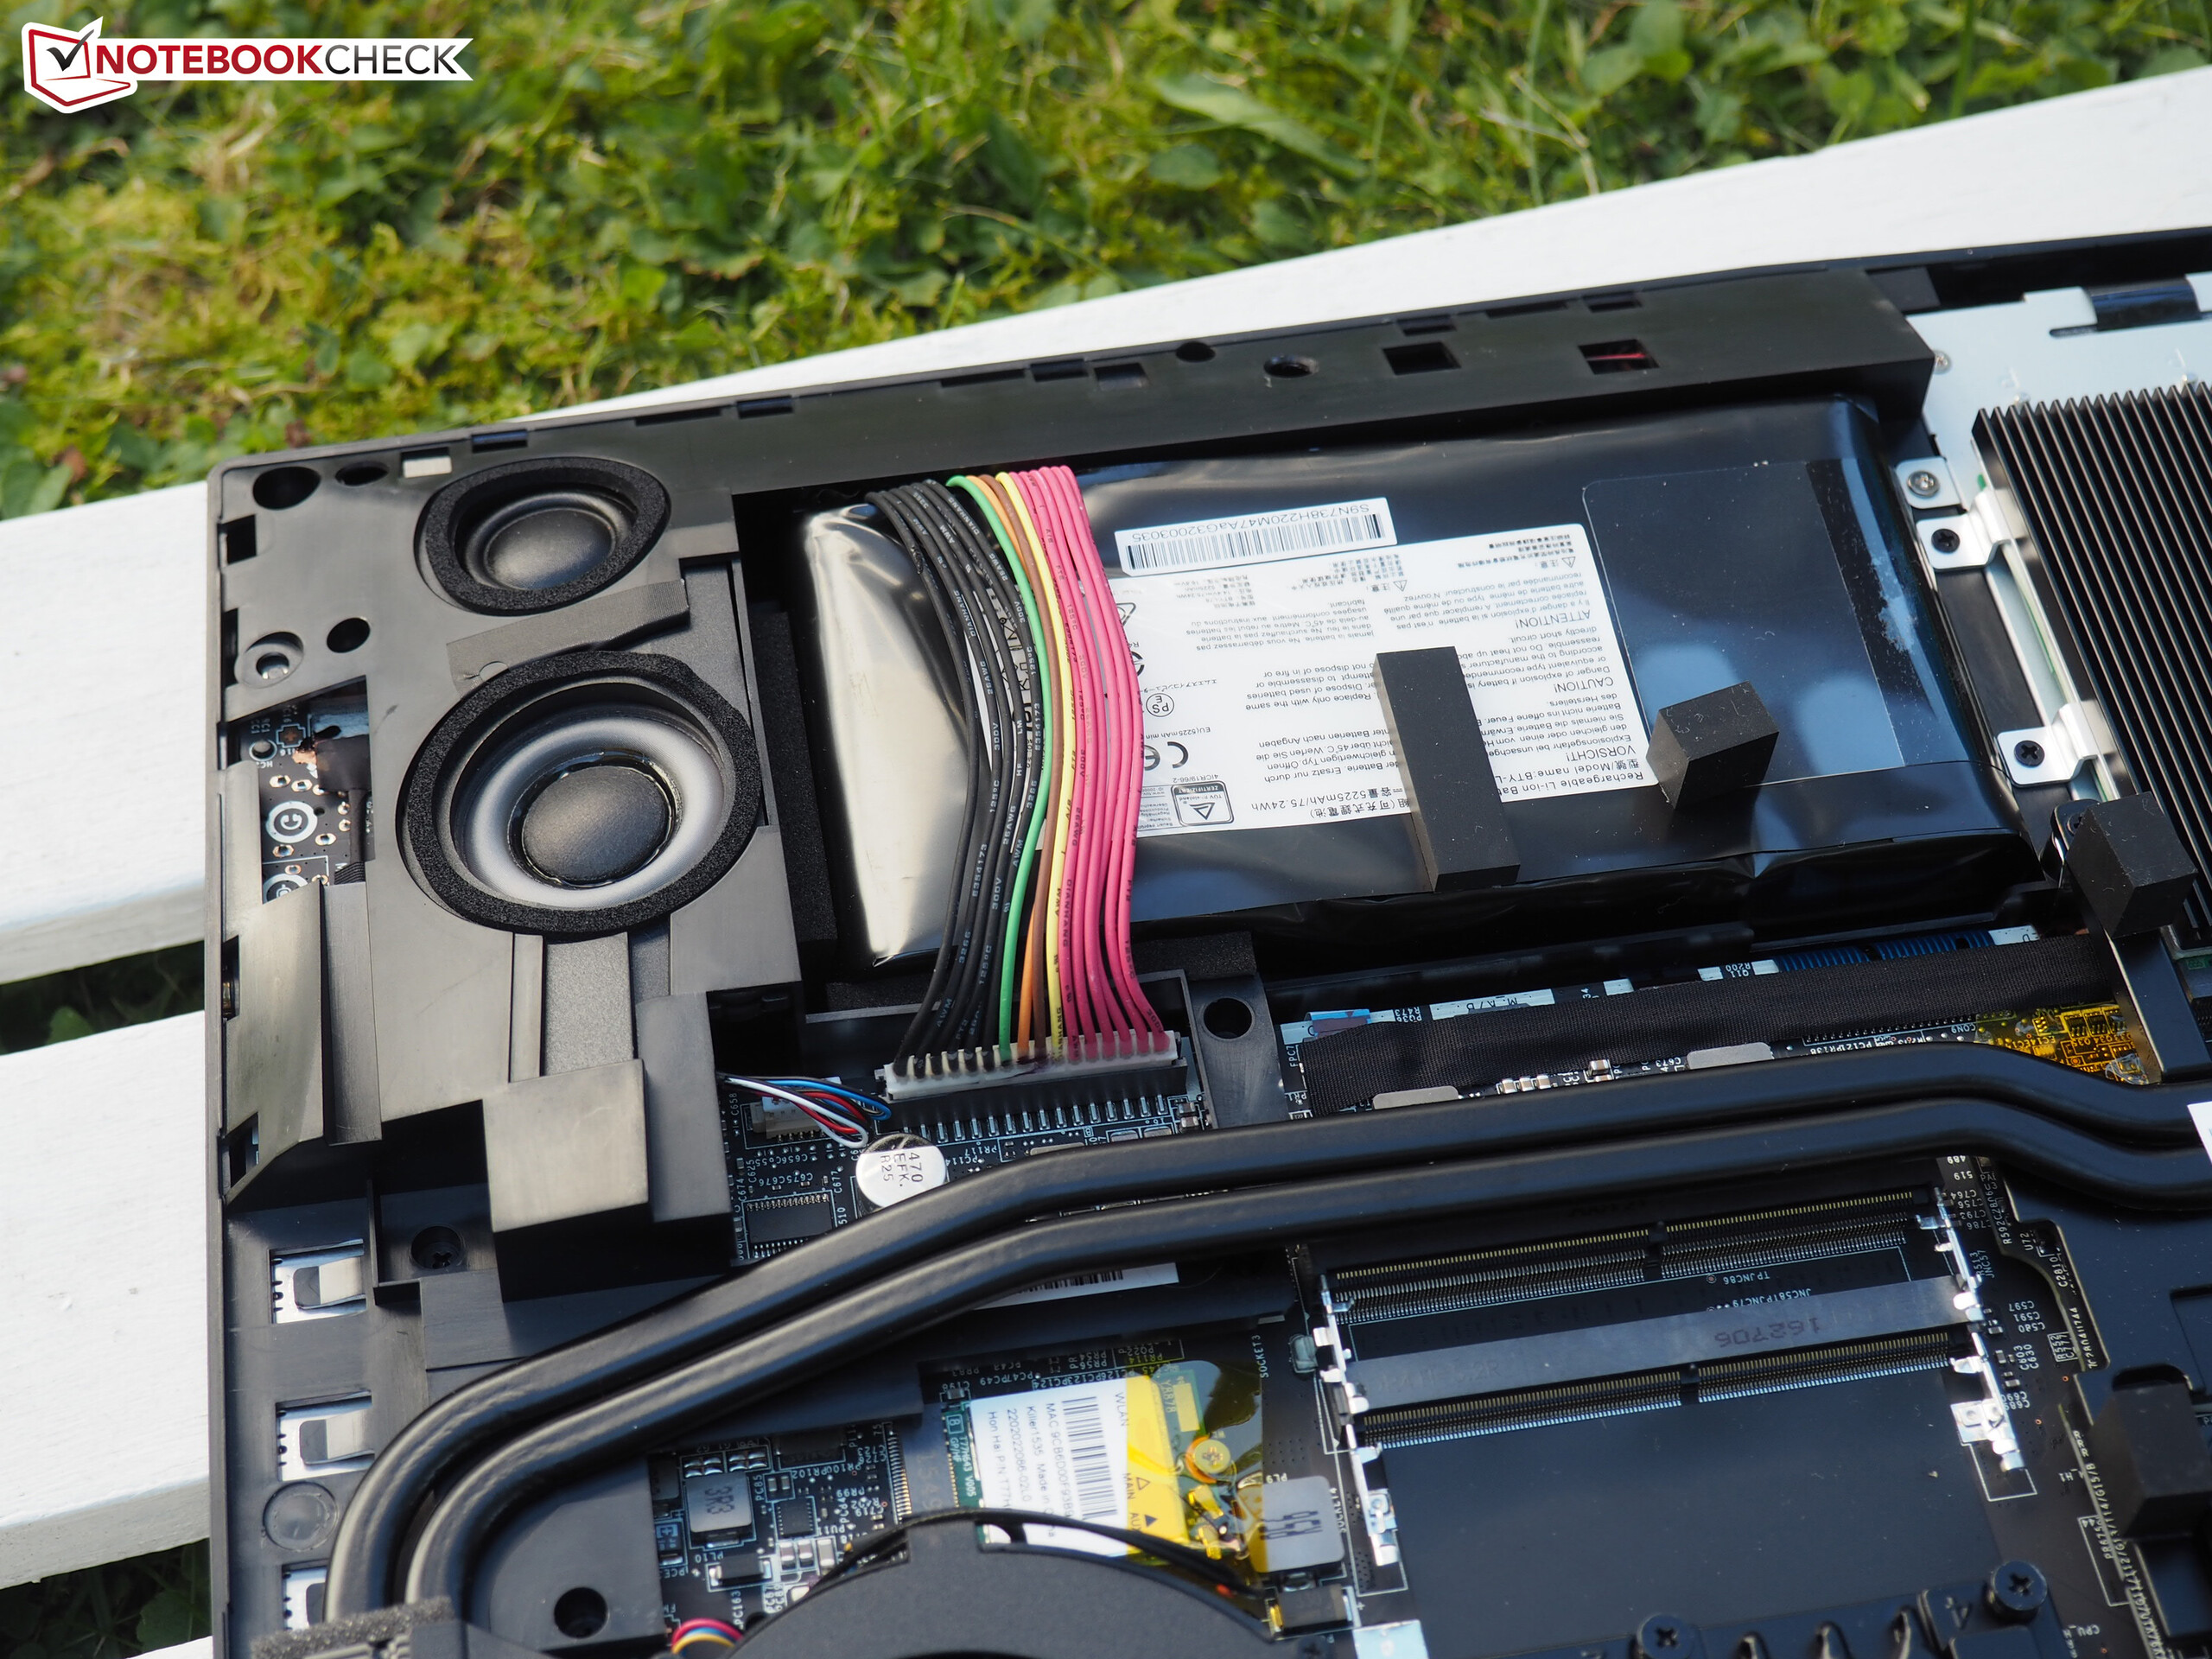
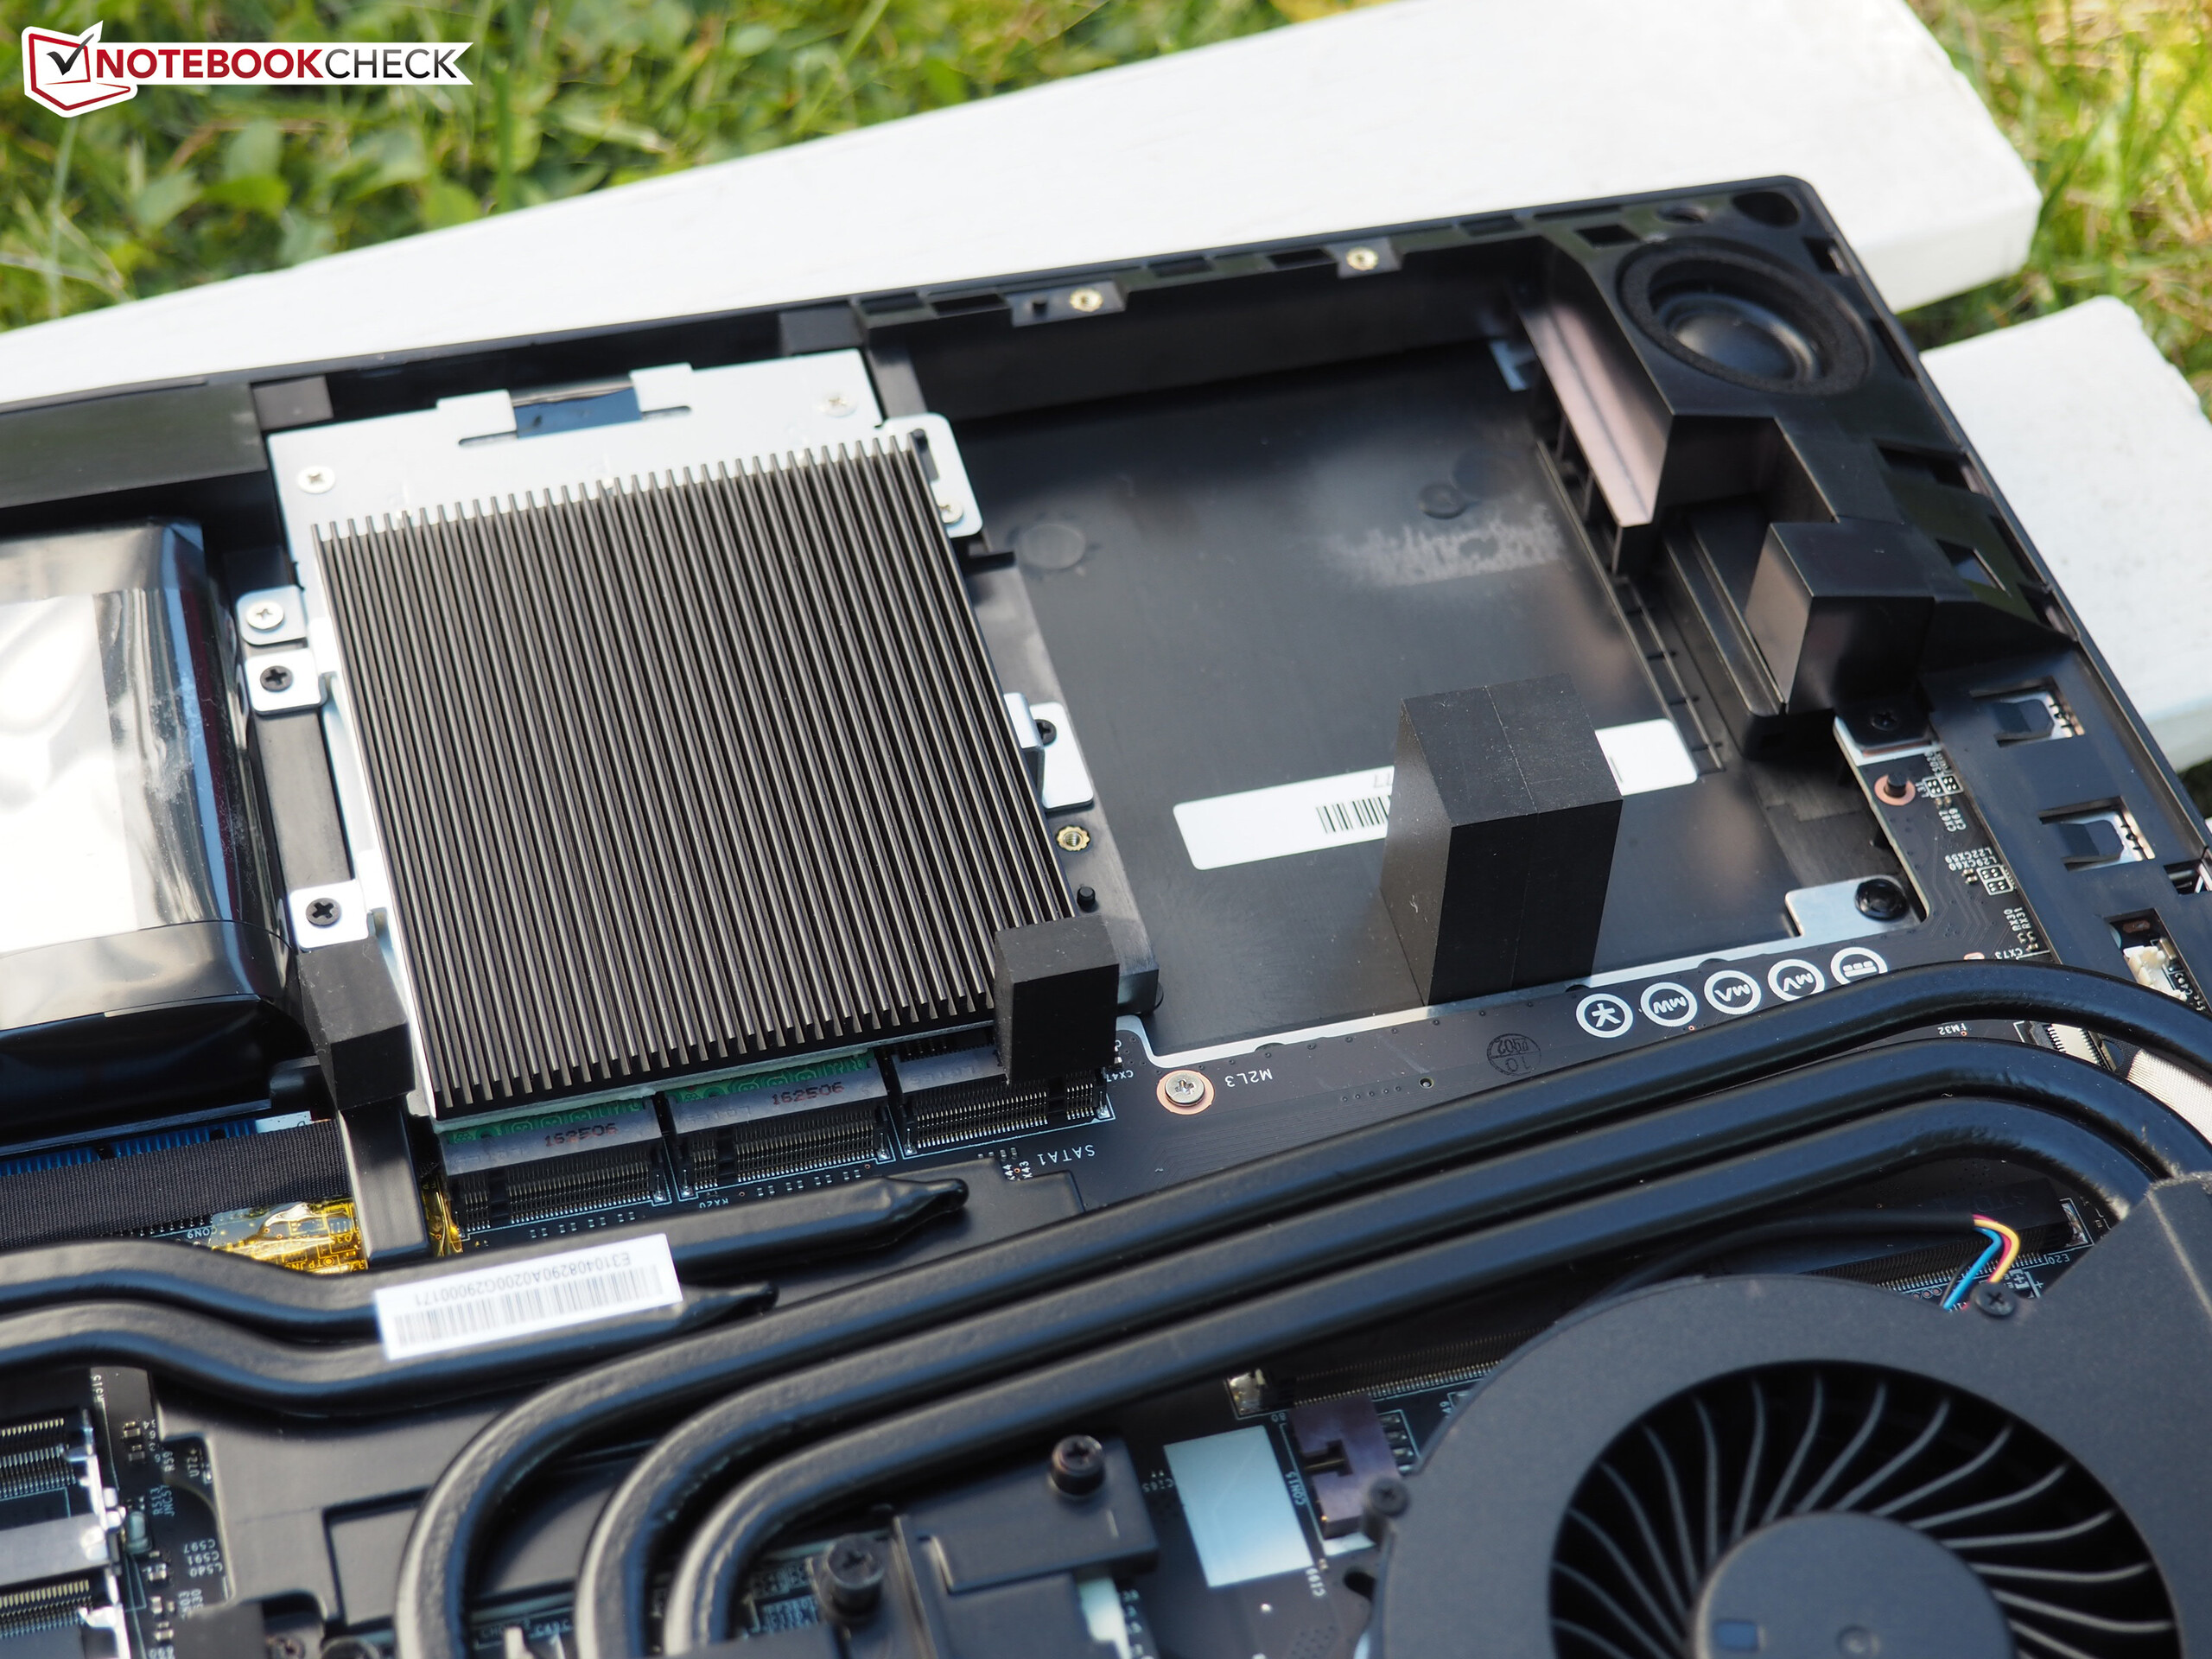
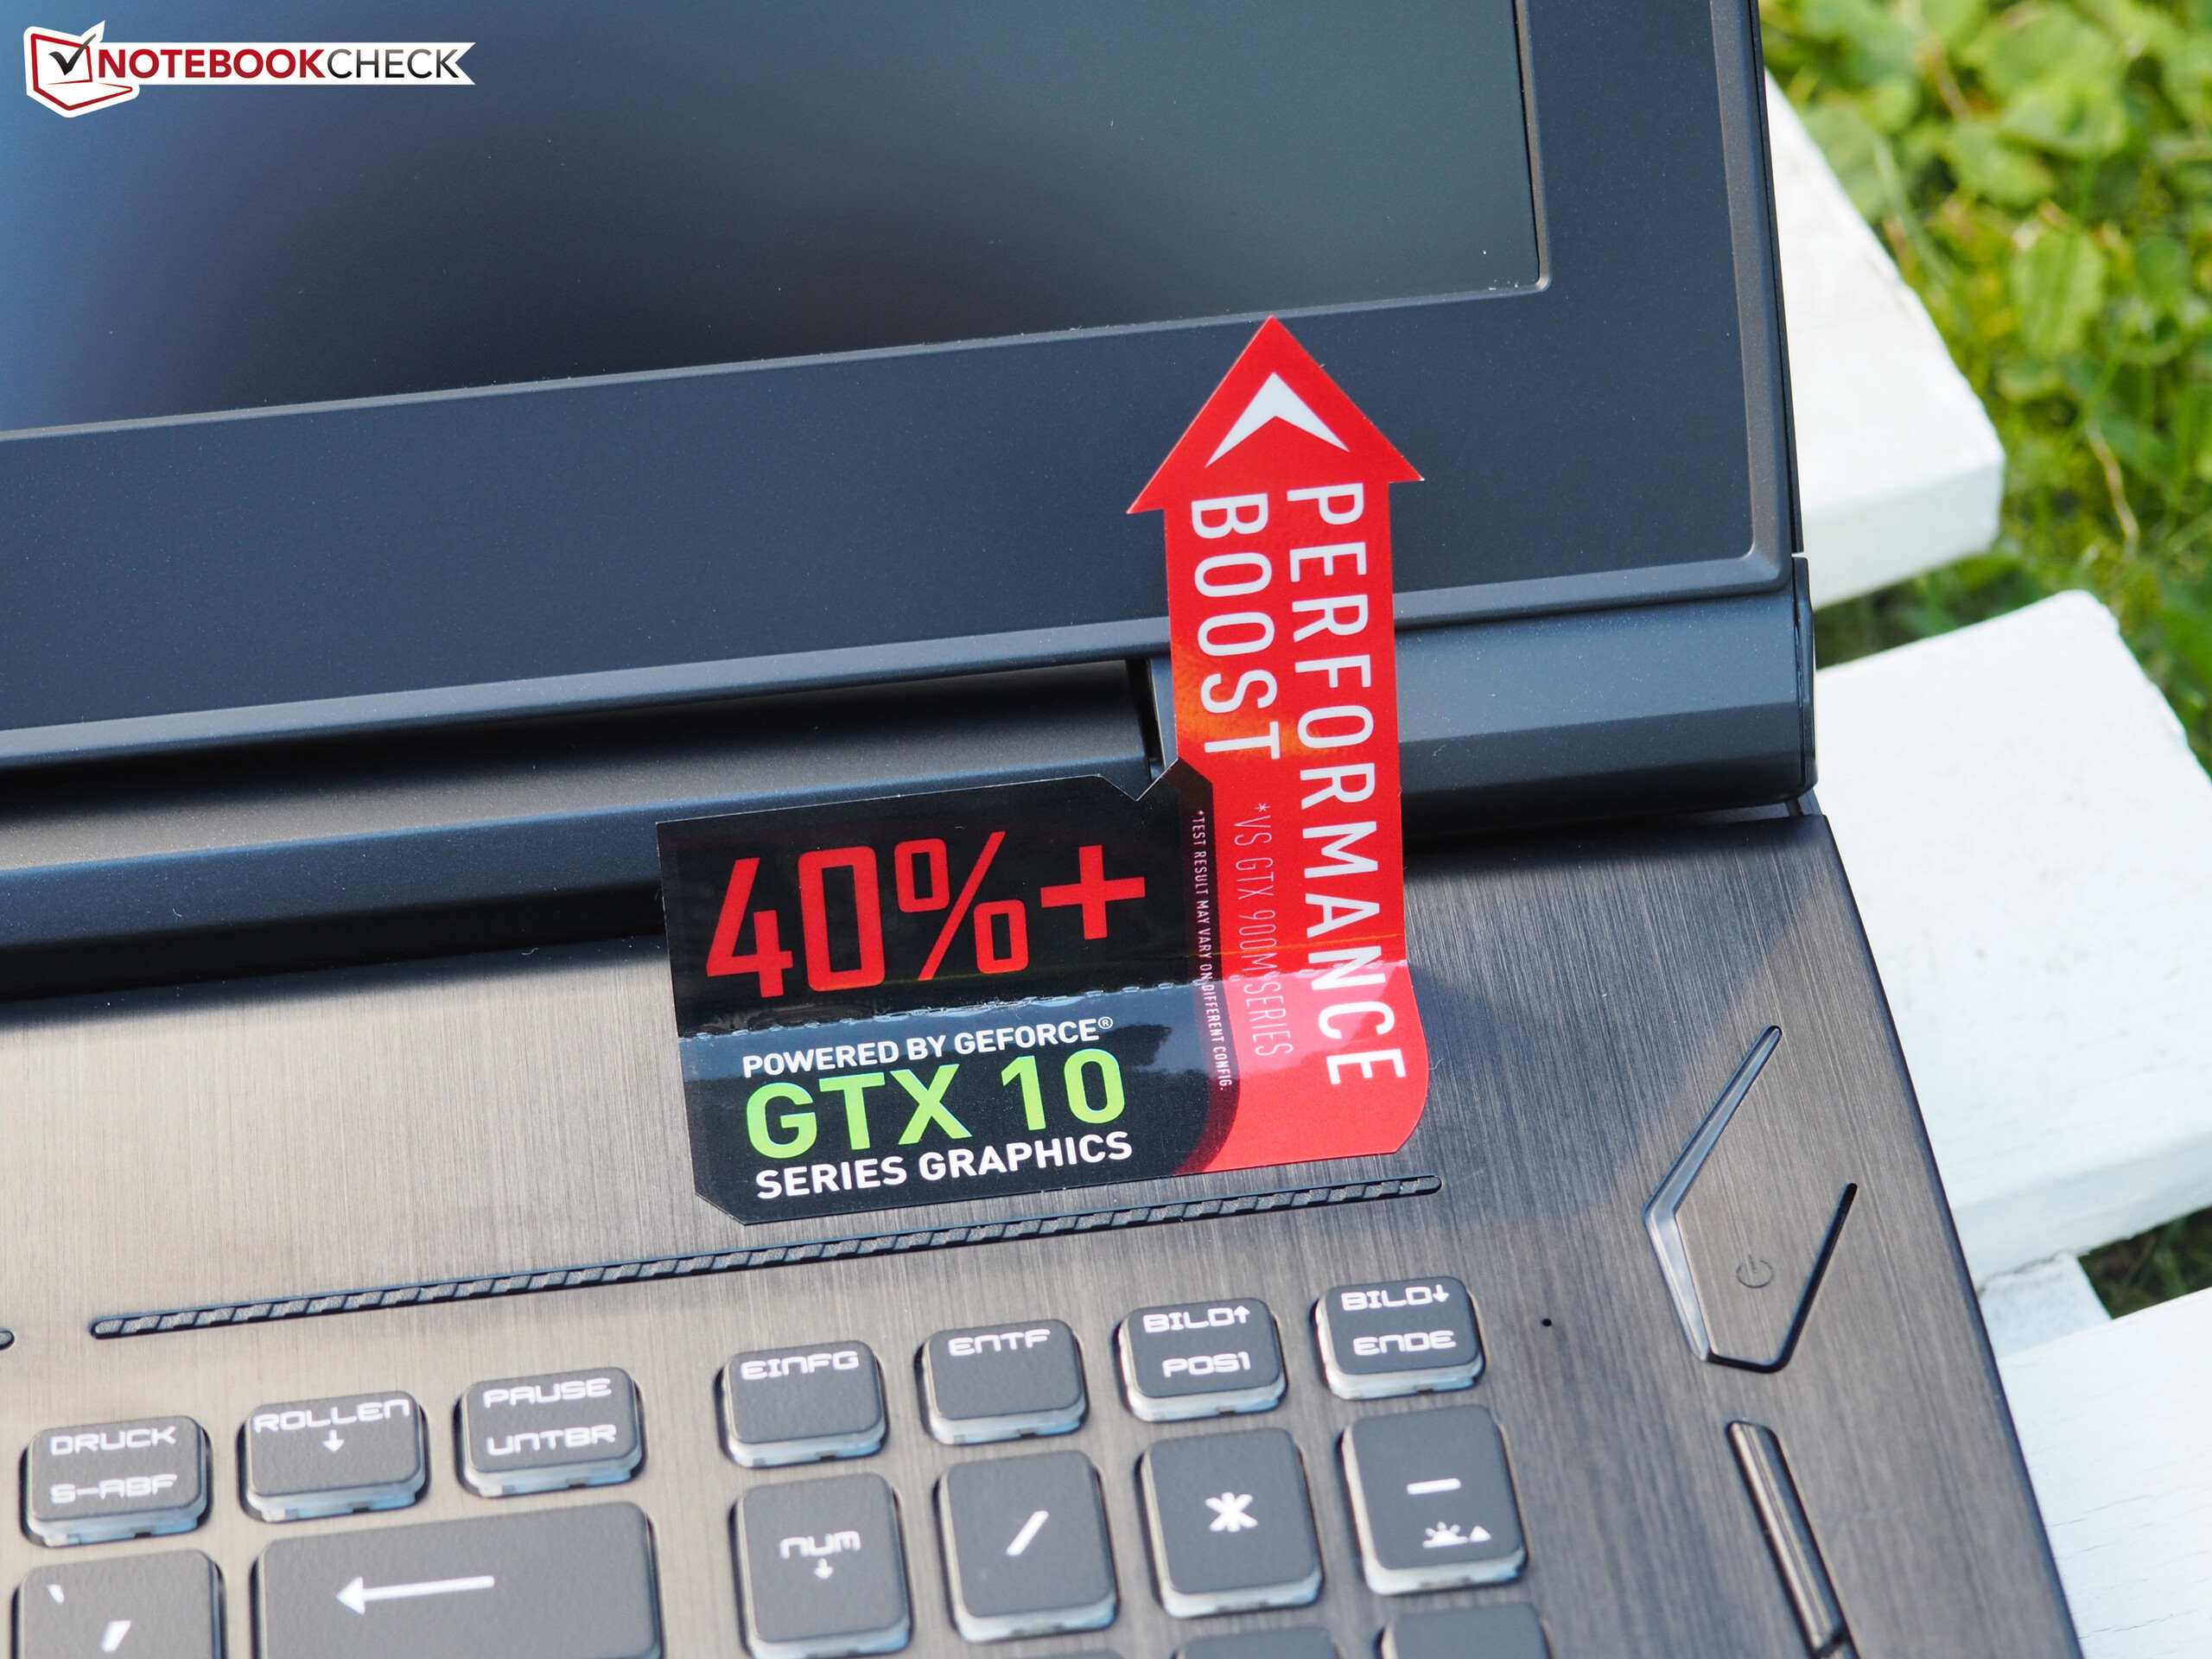
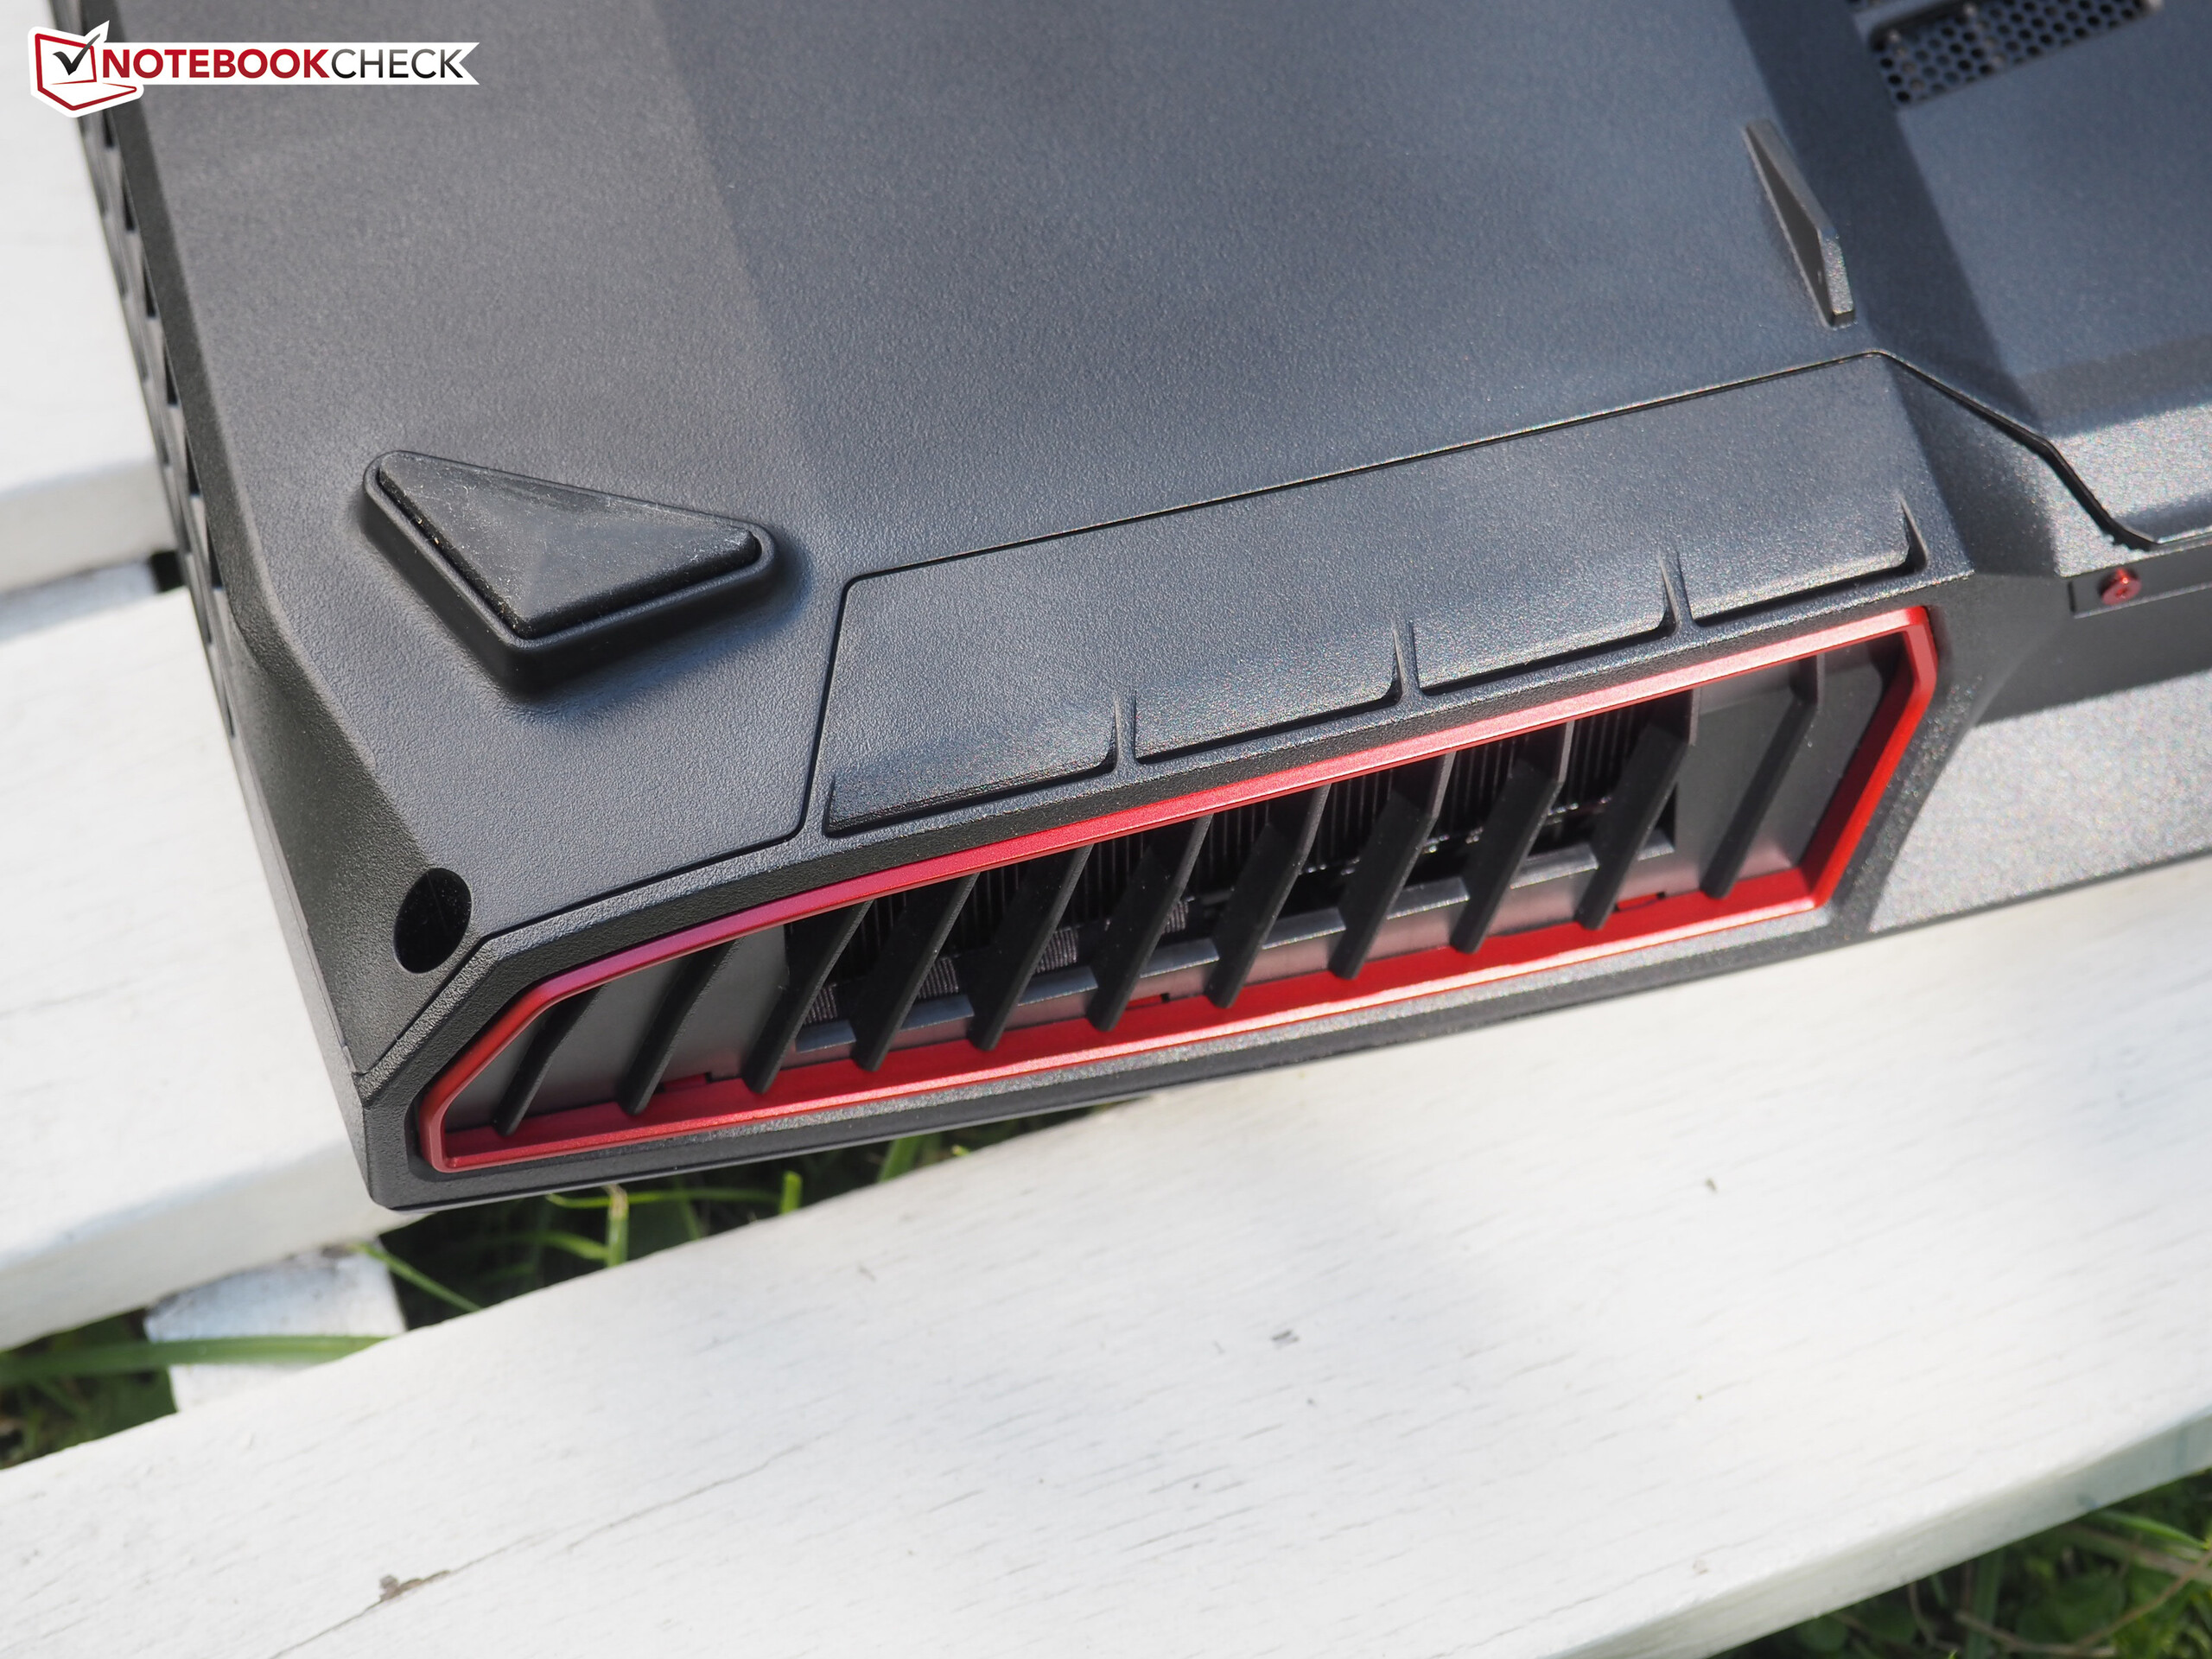
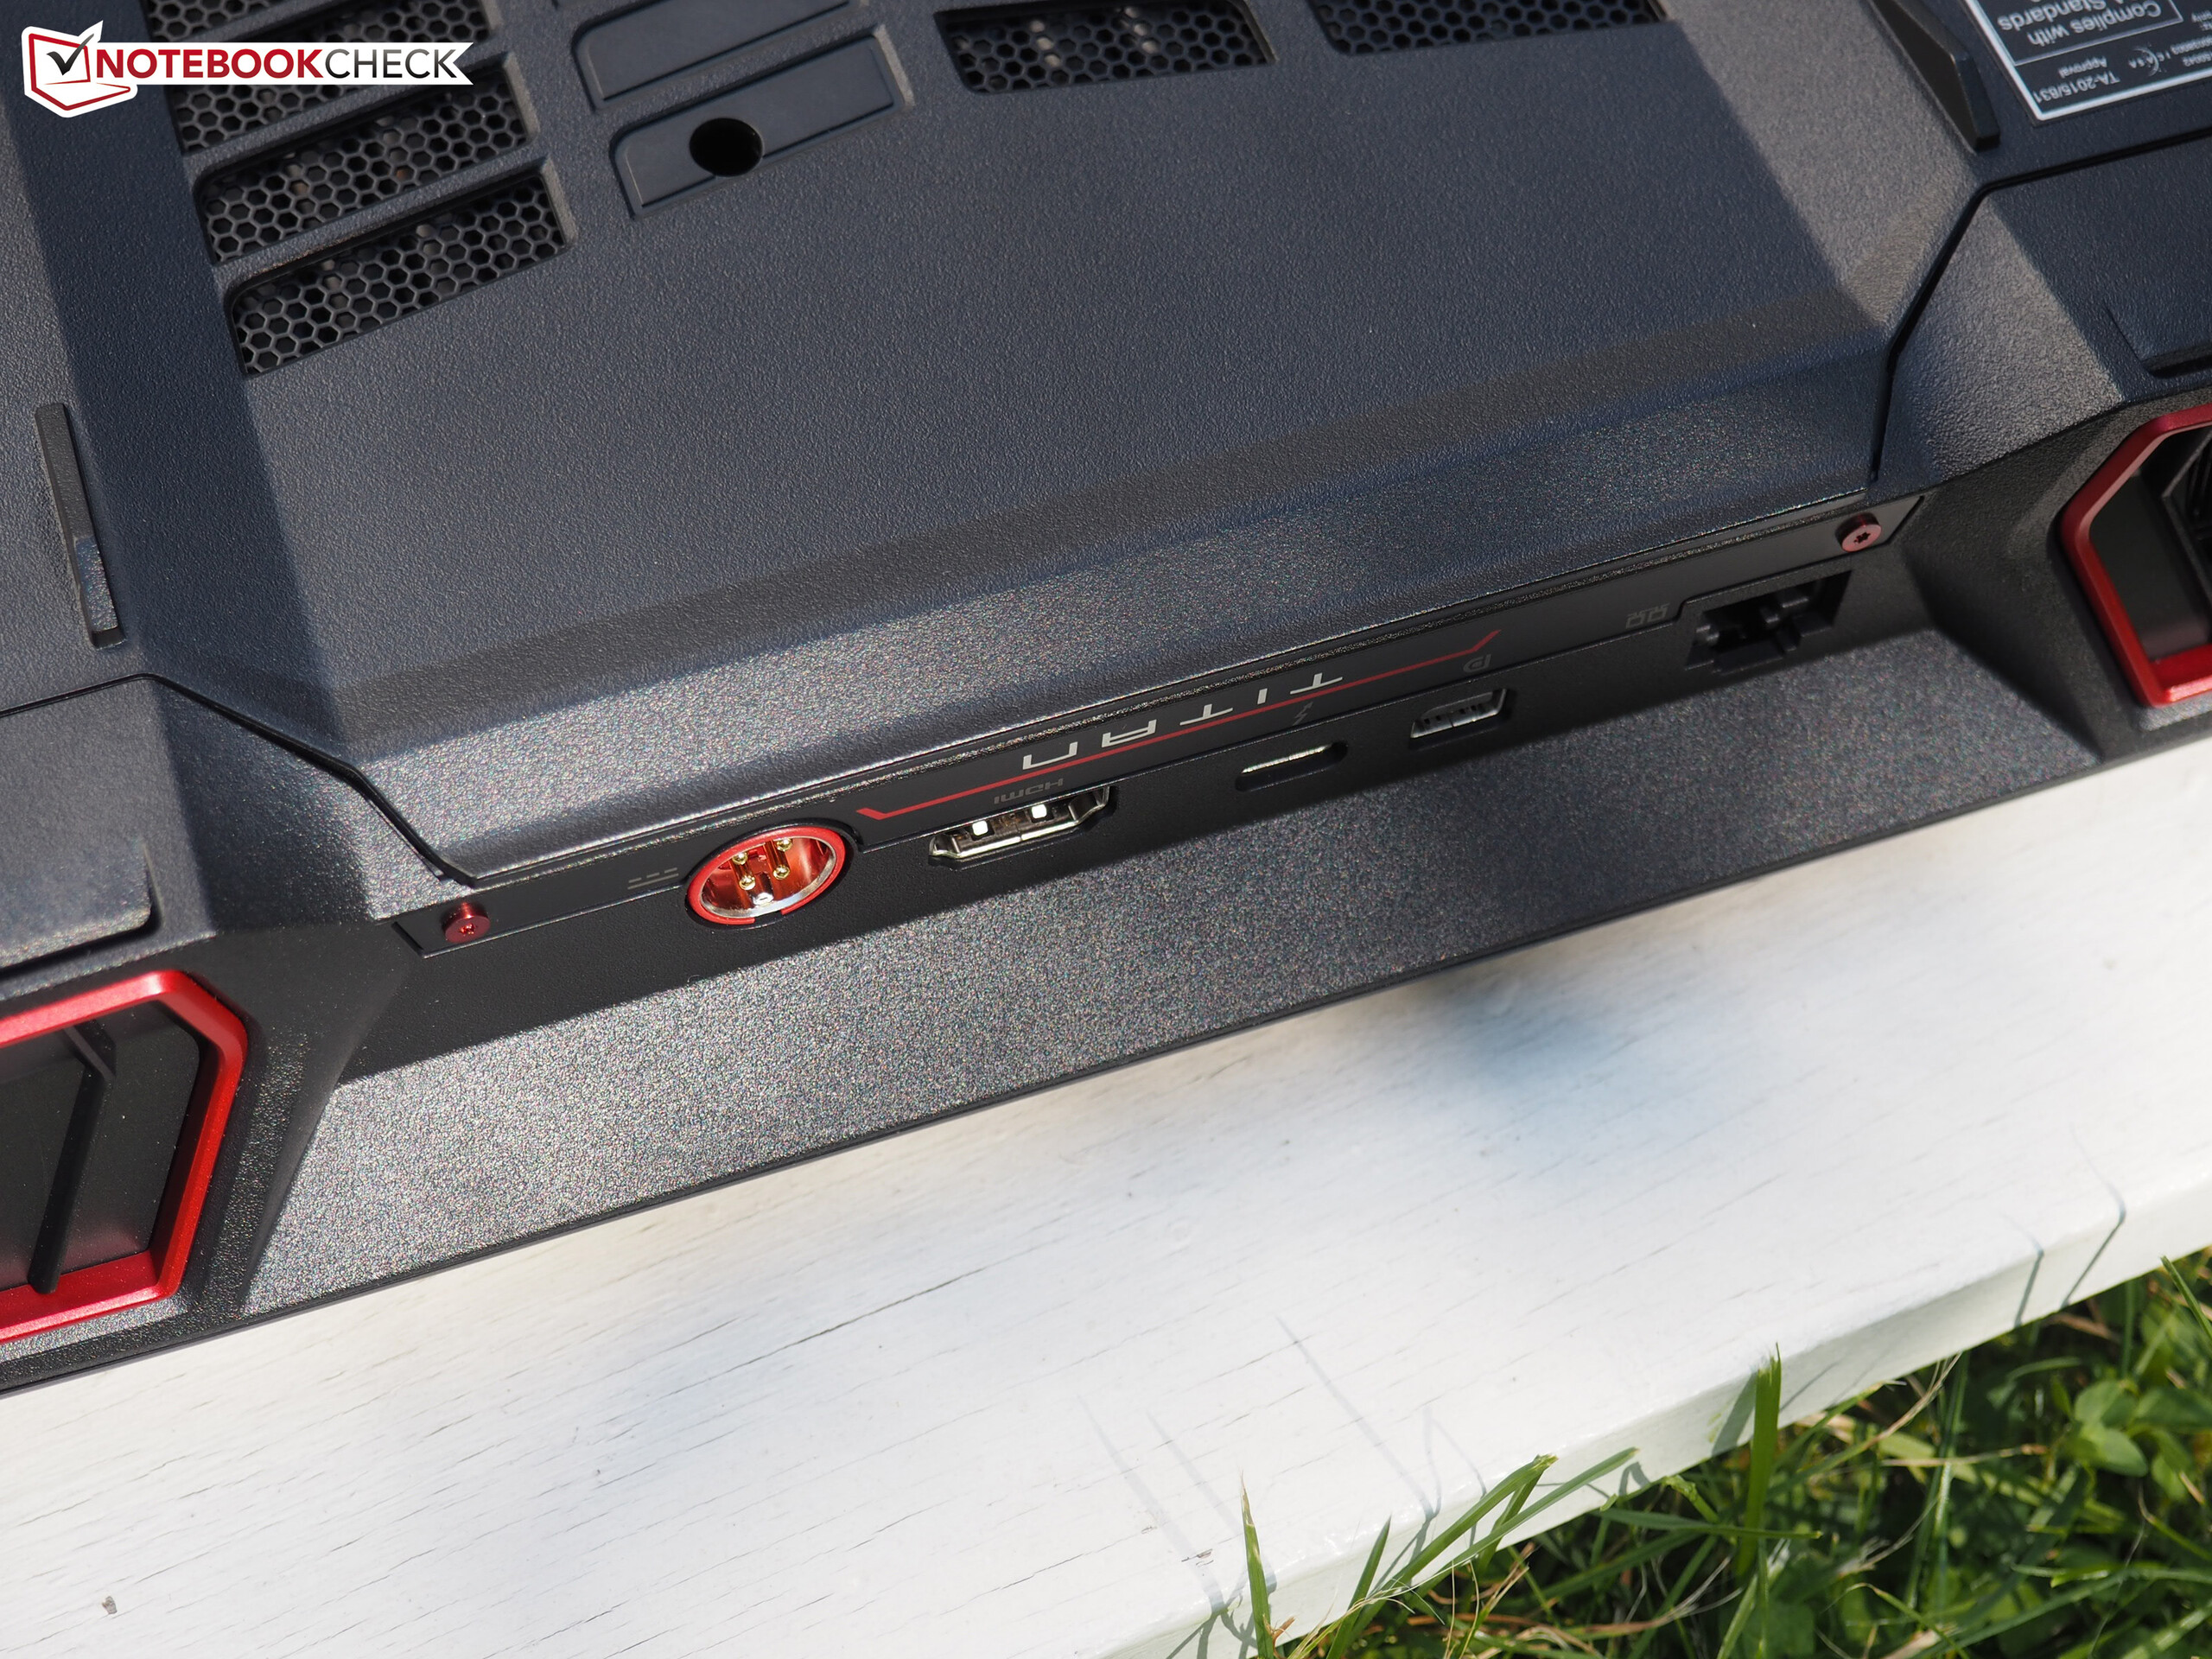
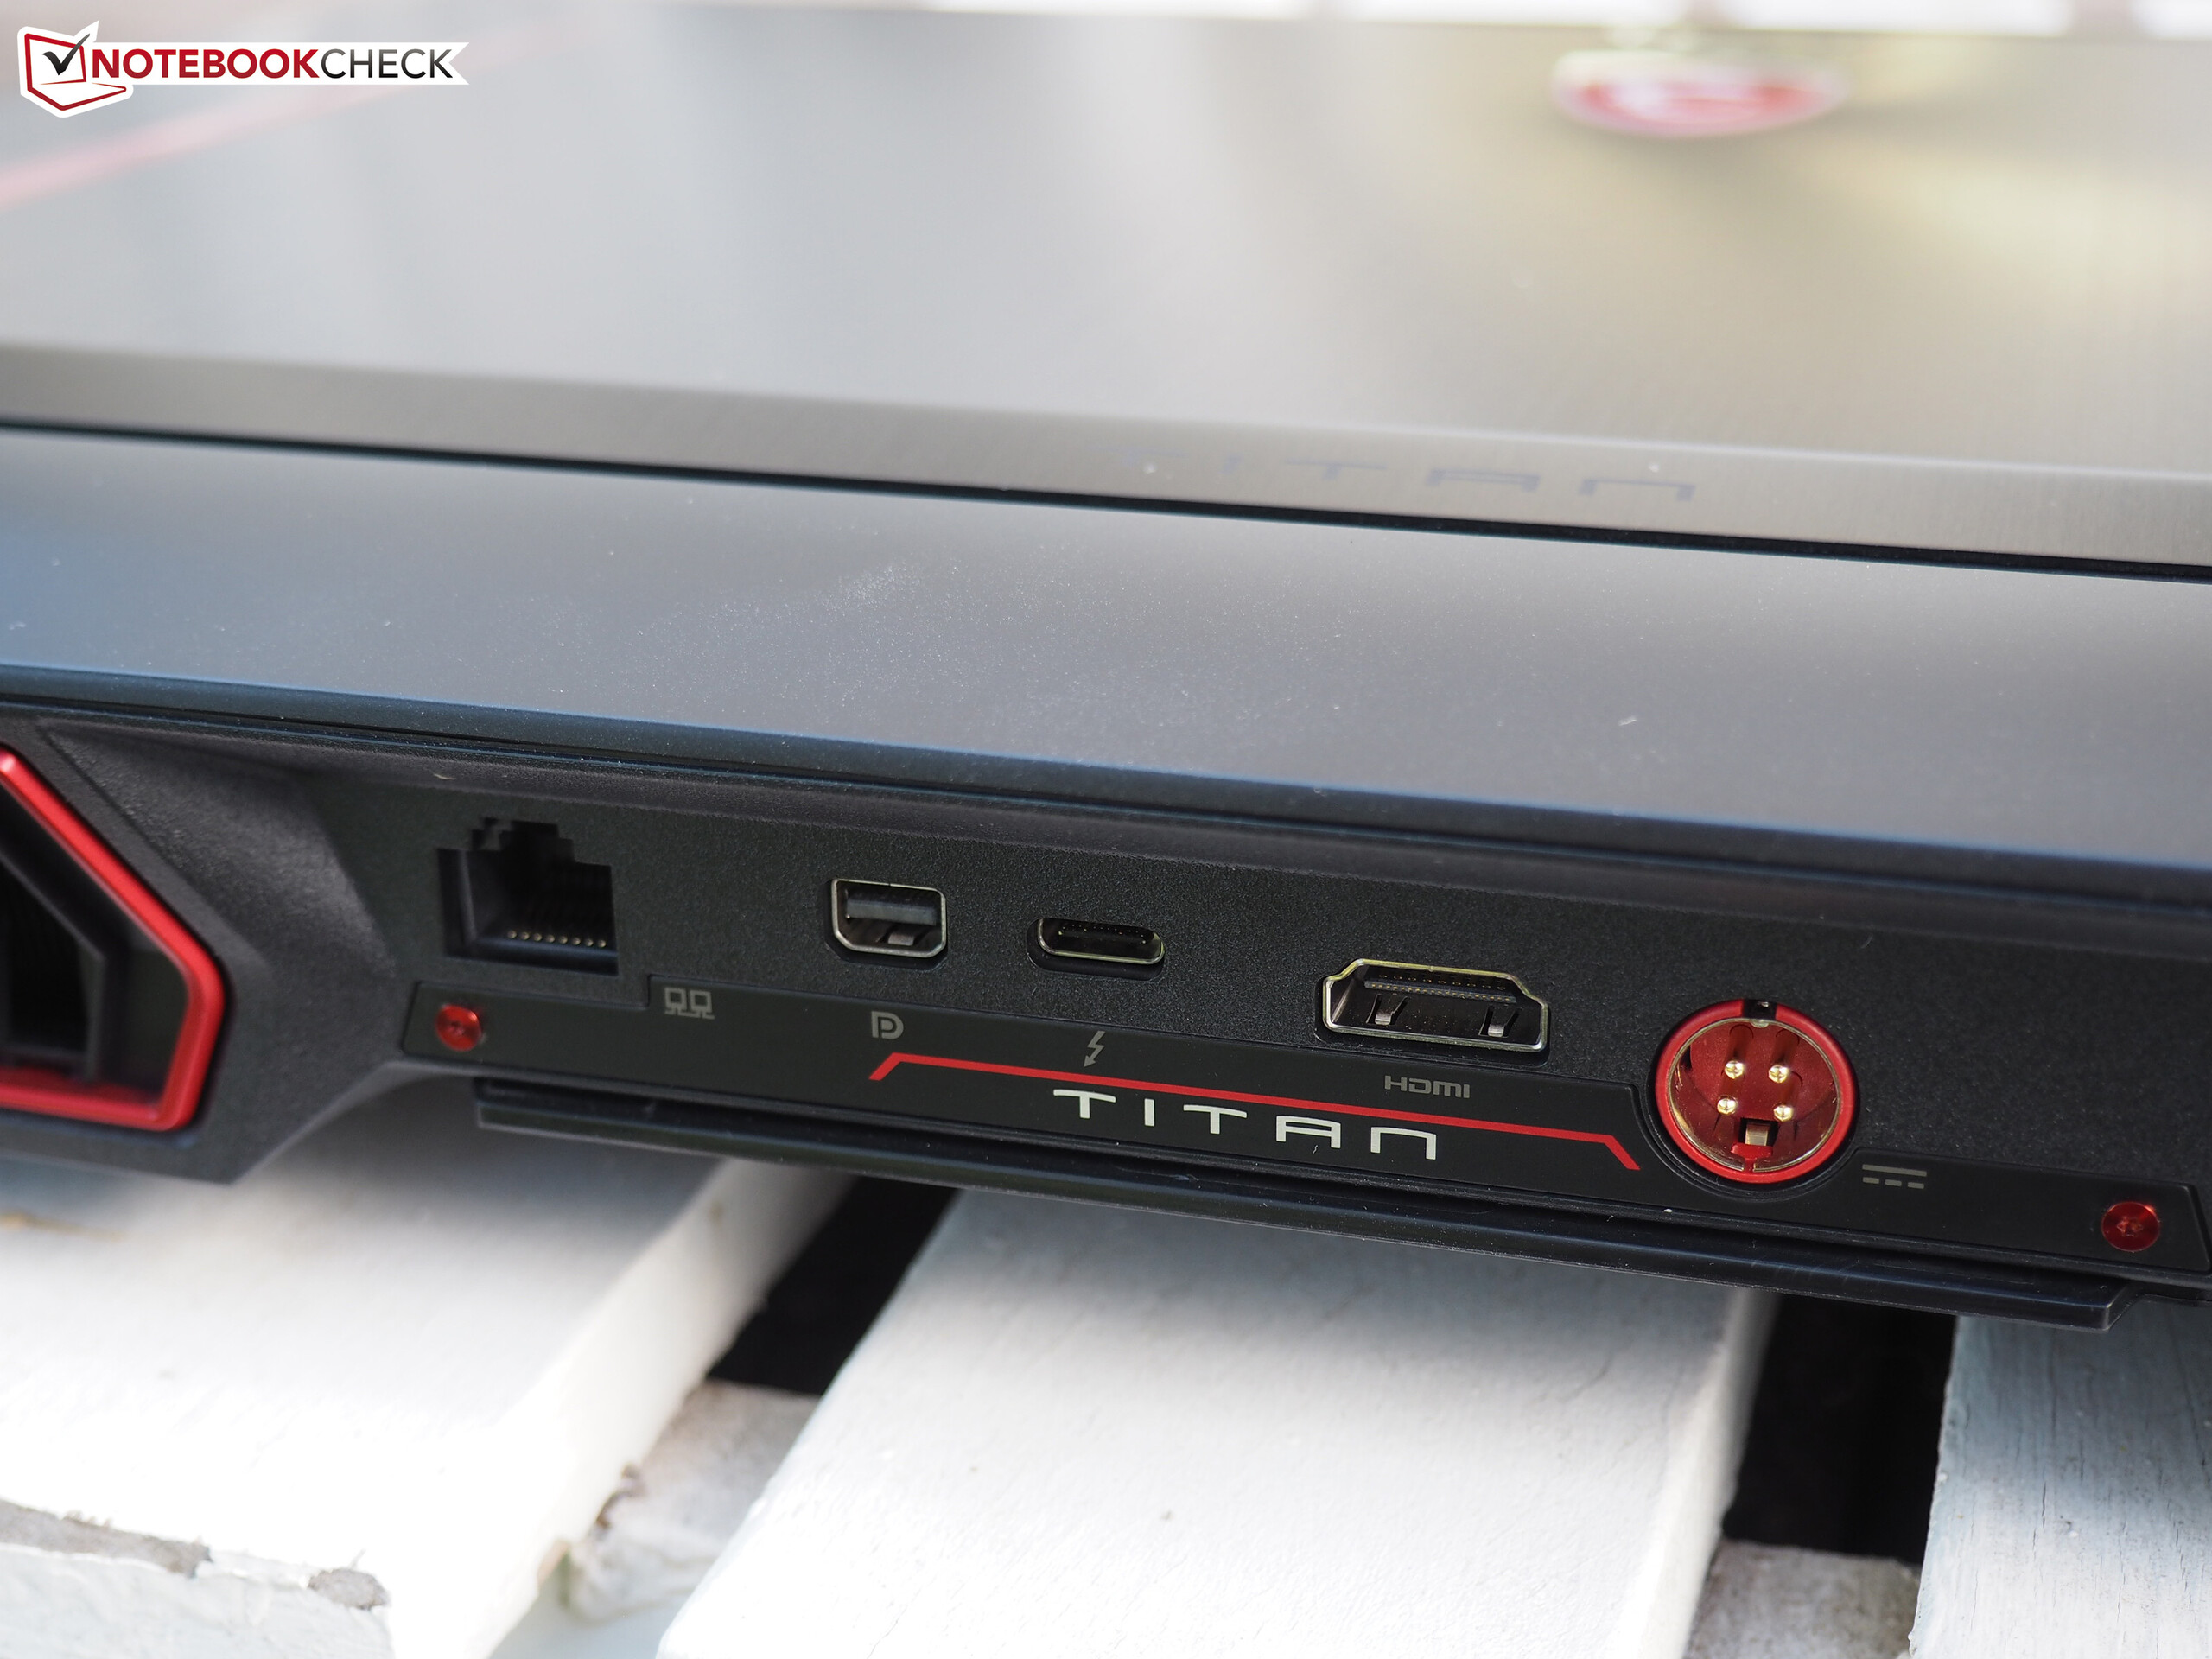
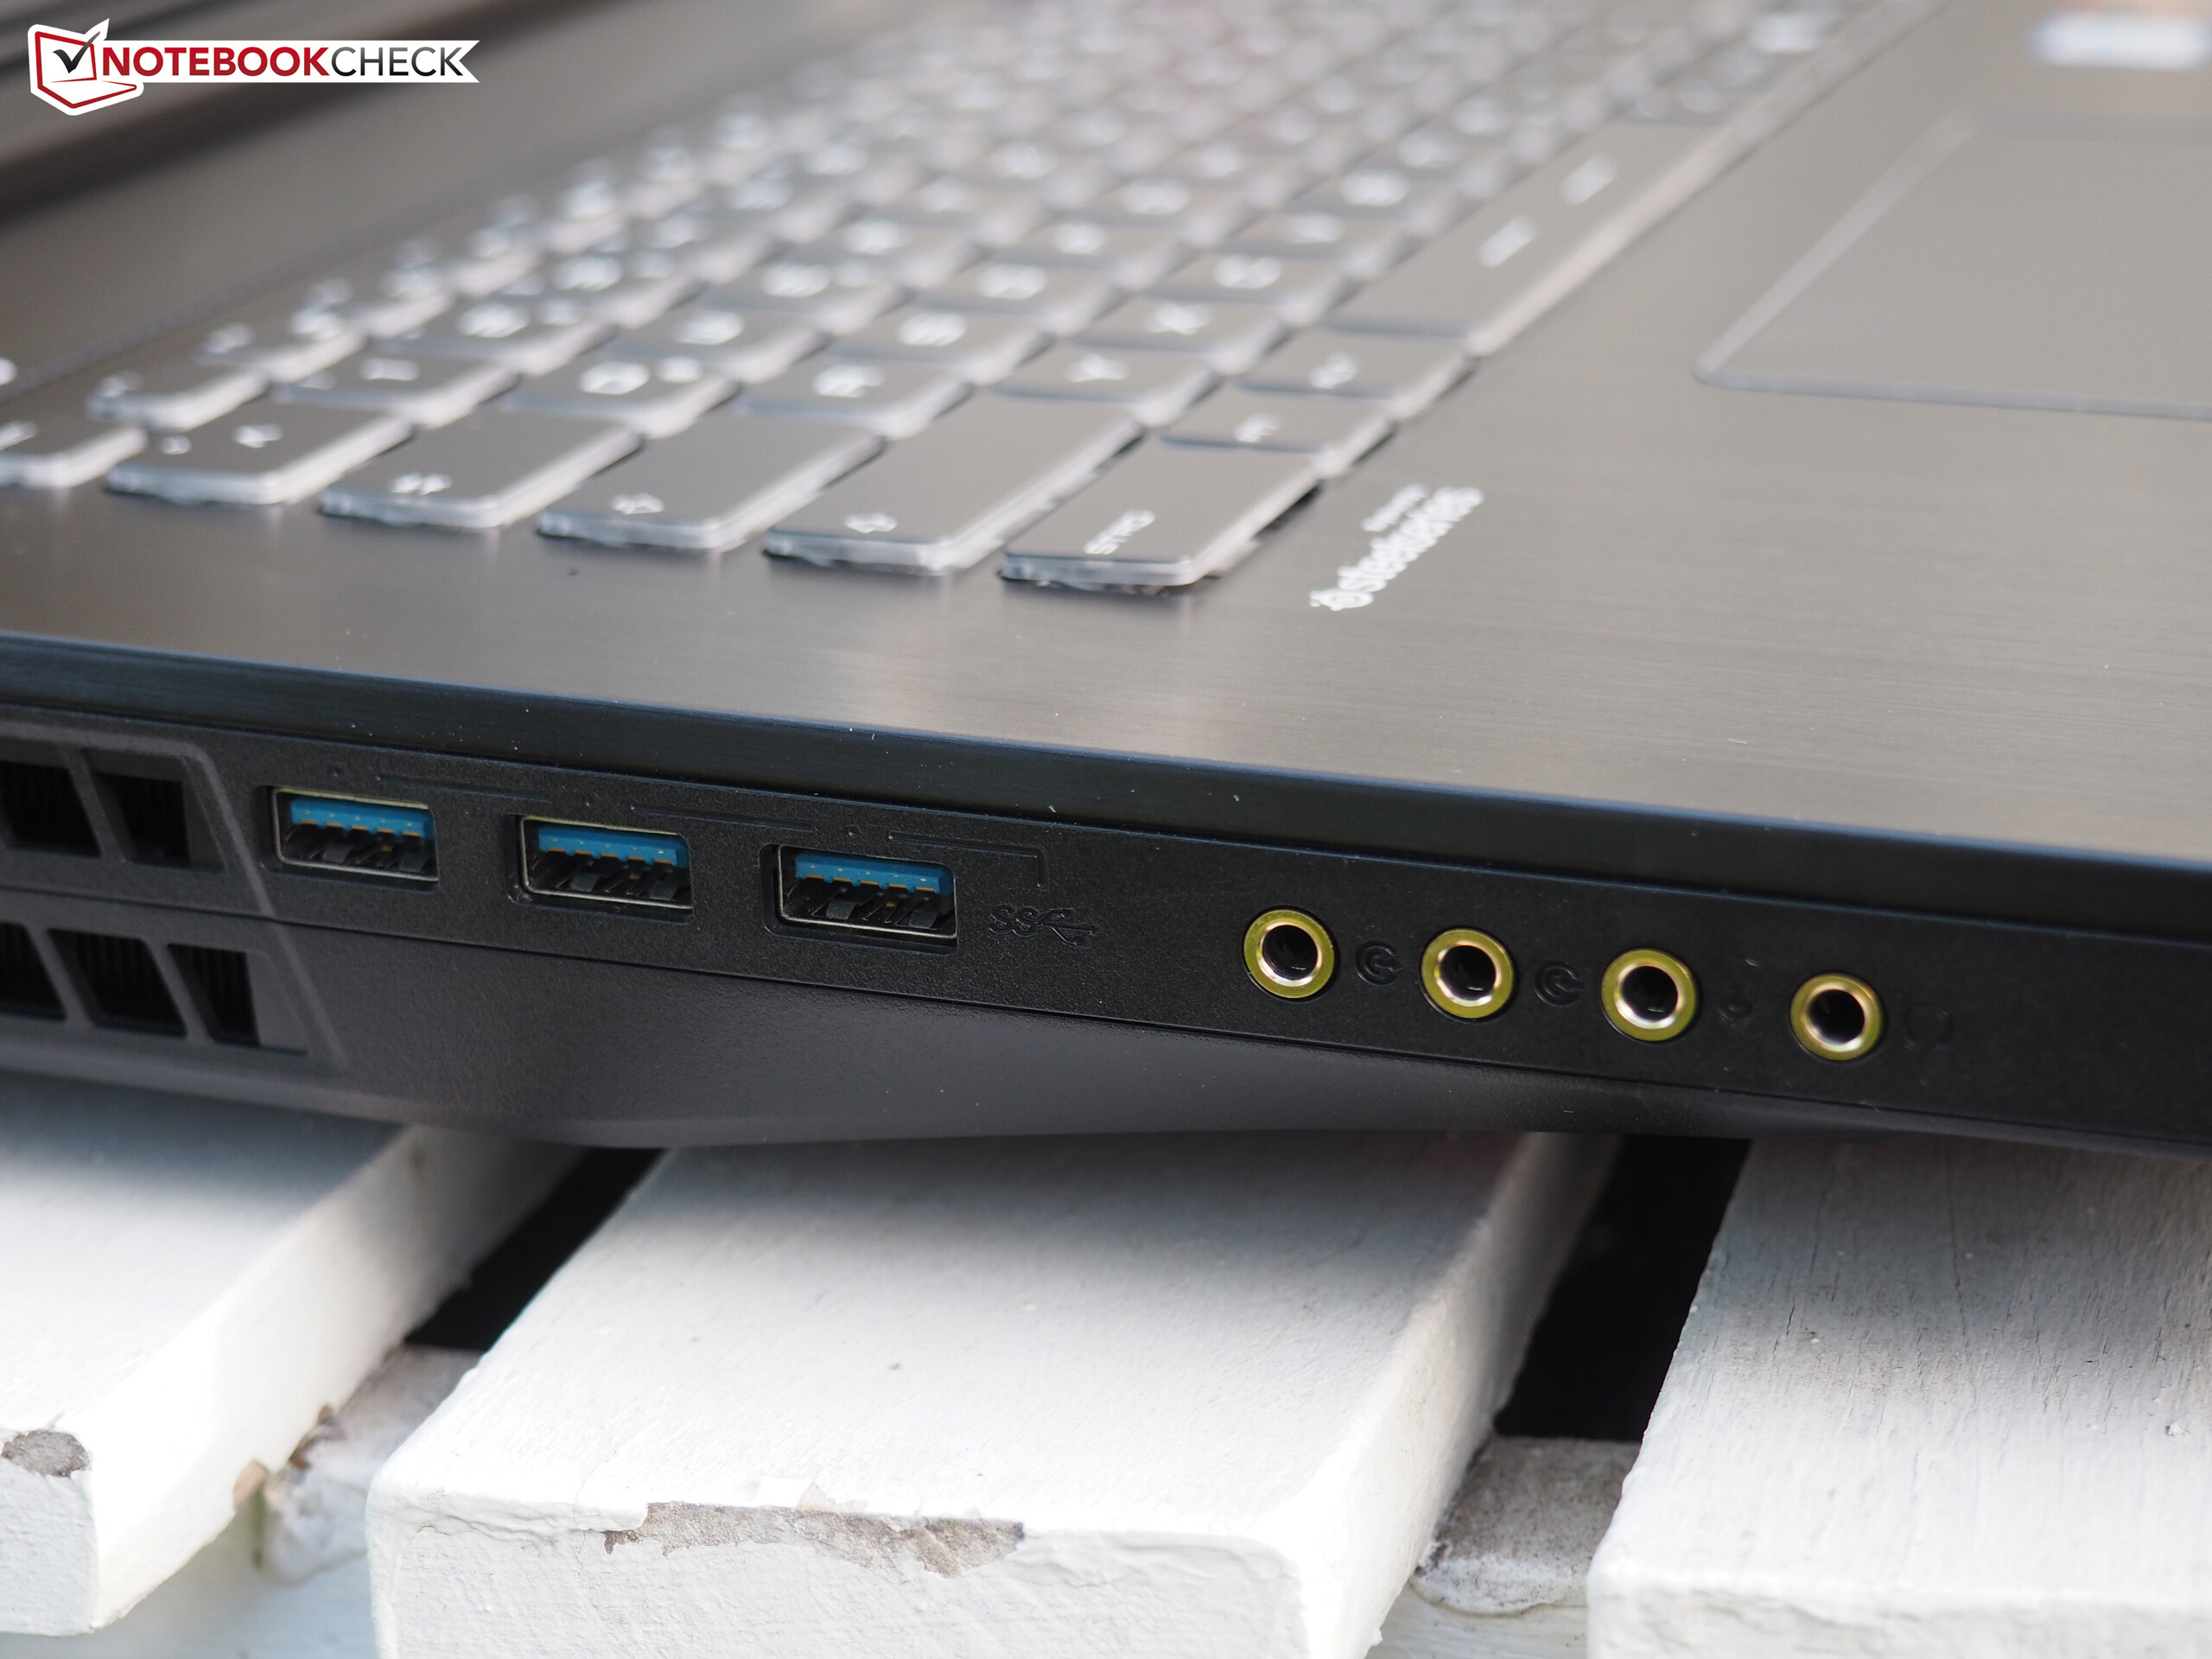
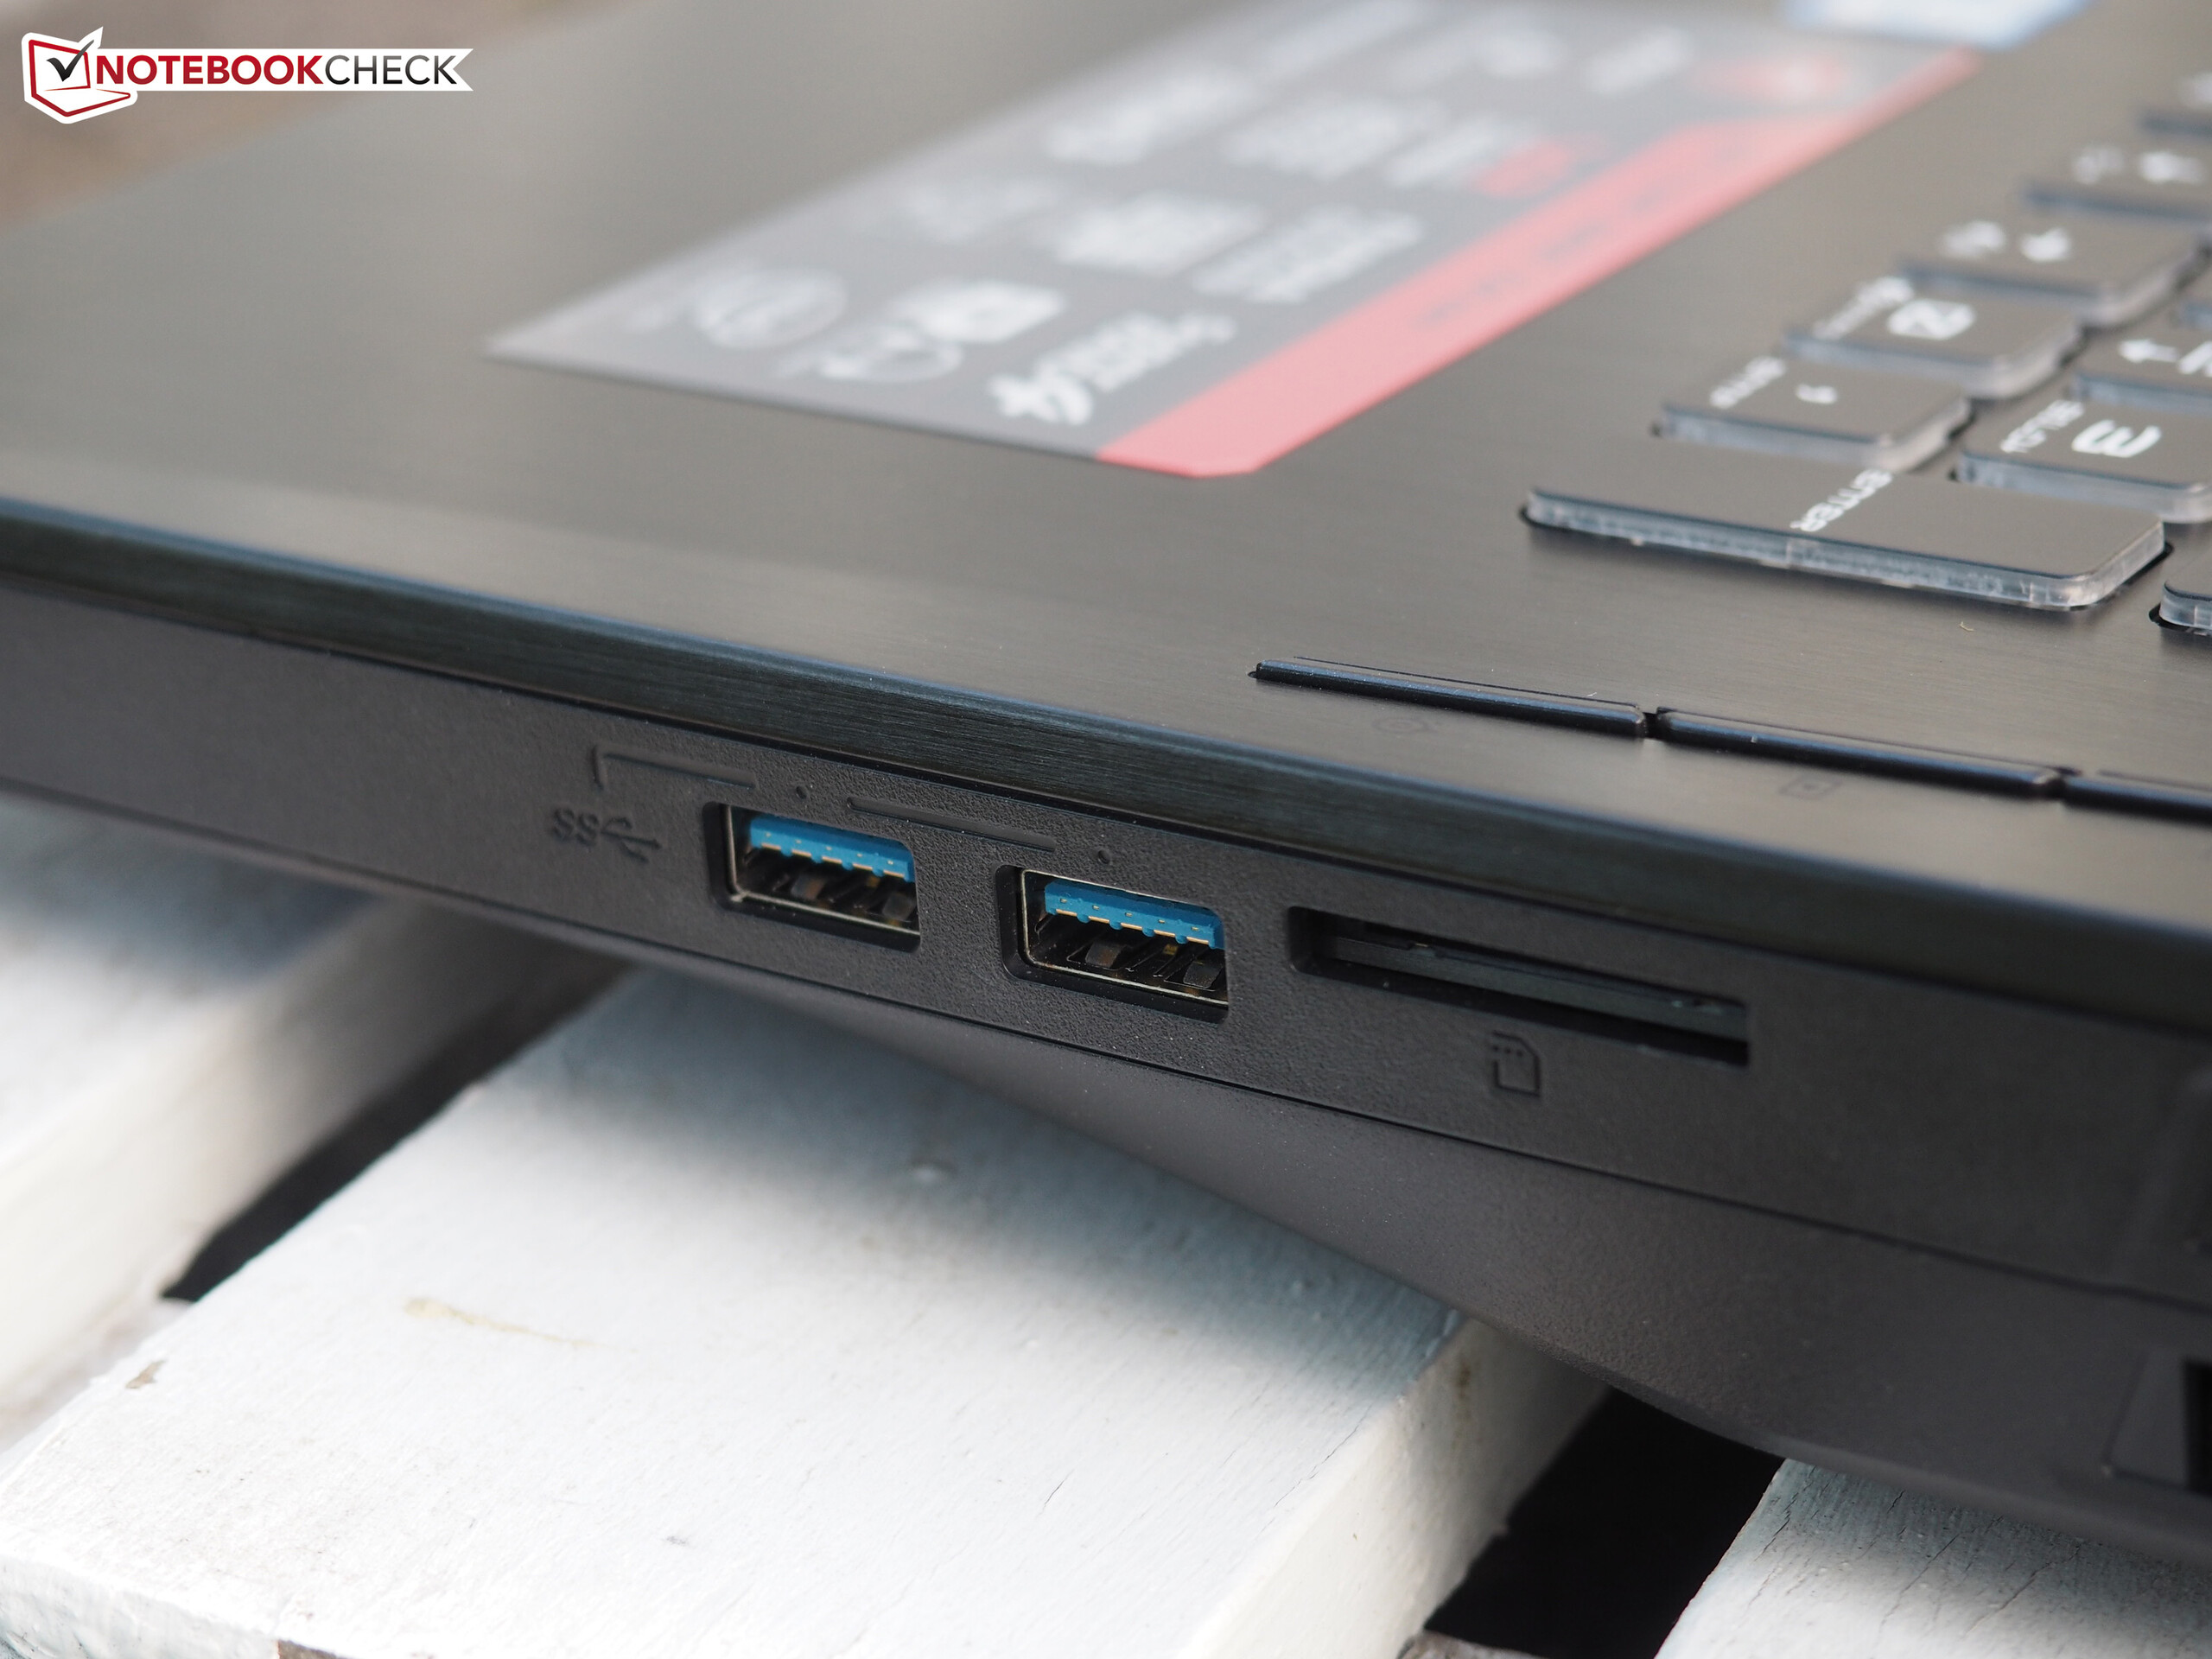
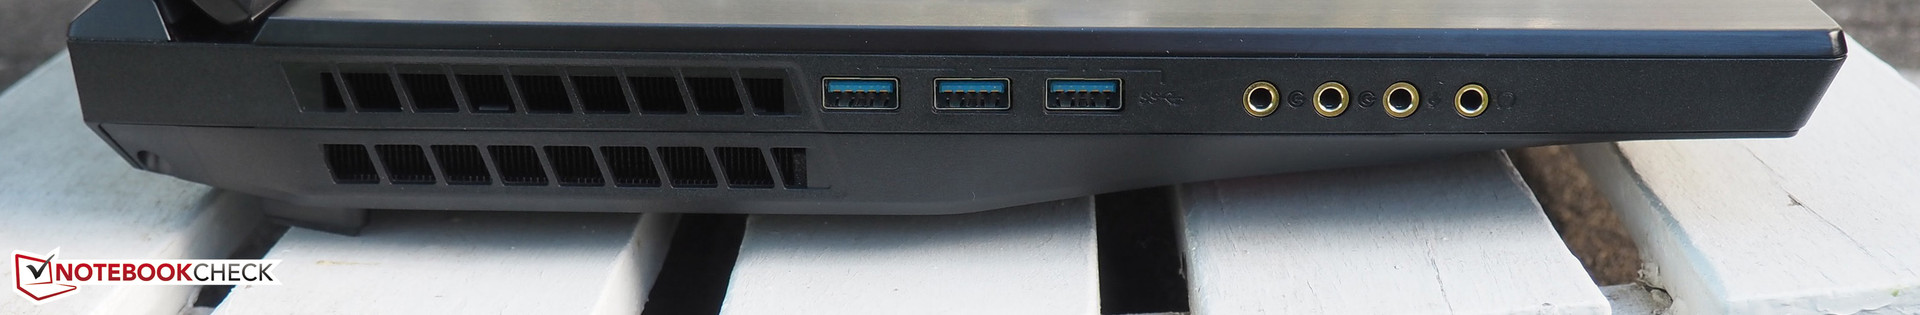
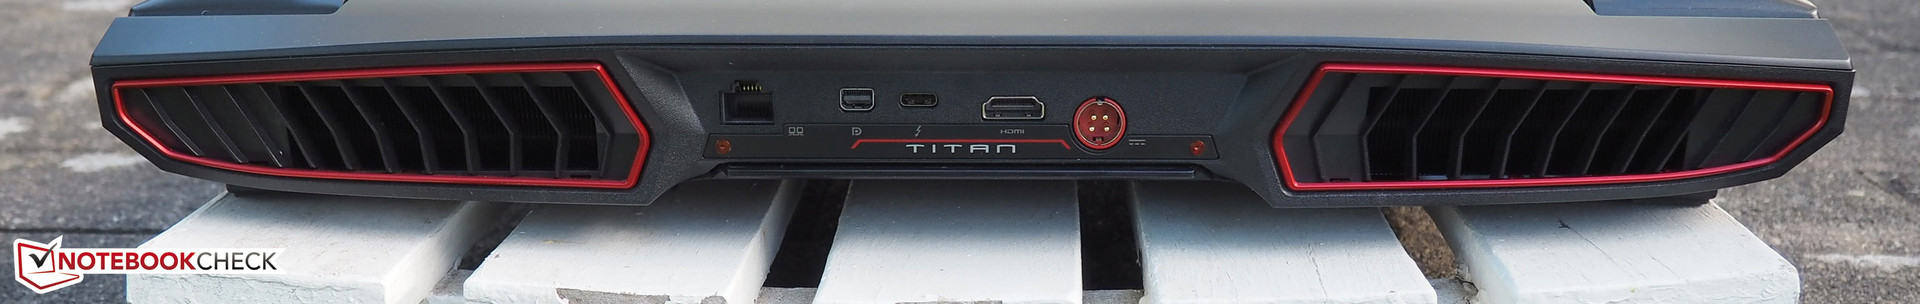
如果你不介意笨重机身的话,GT73VR是一台机器强劲的桌面替代设备,它充分利用了自身的空间。提供了丰富的功能(可选的SLI和最多四块硬盘)和冷却系统(10根散热管)。
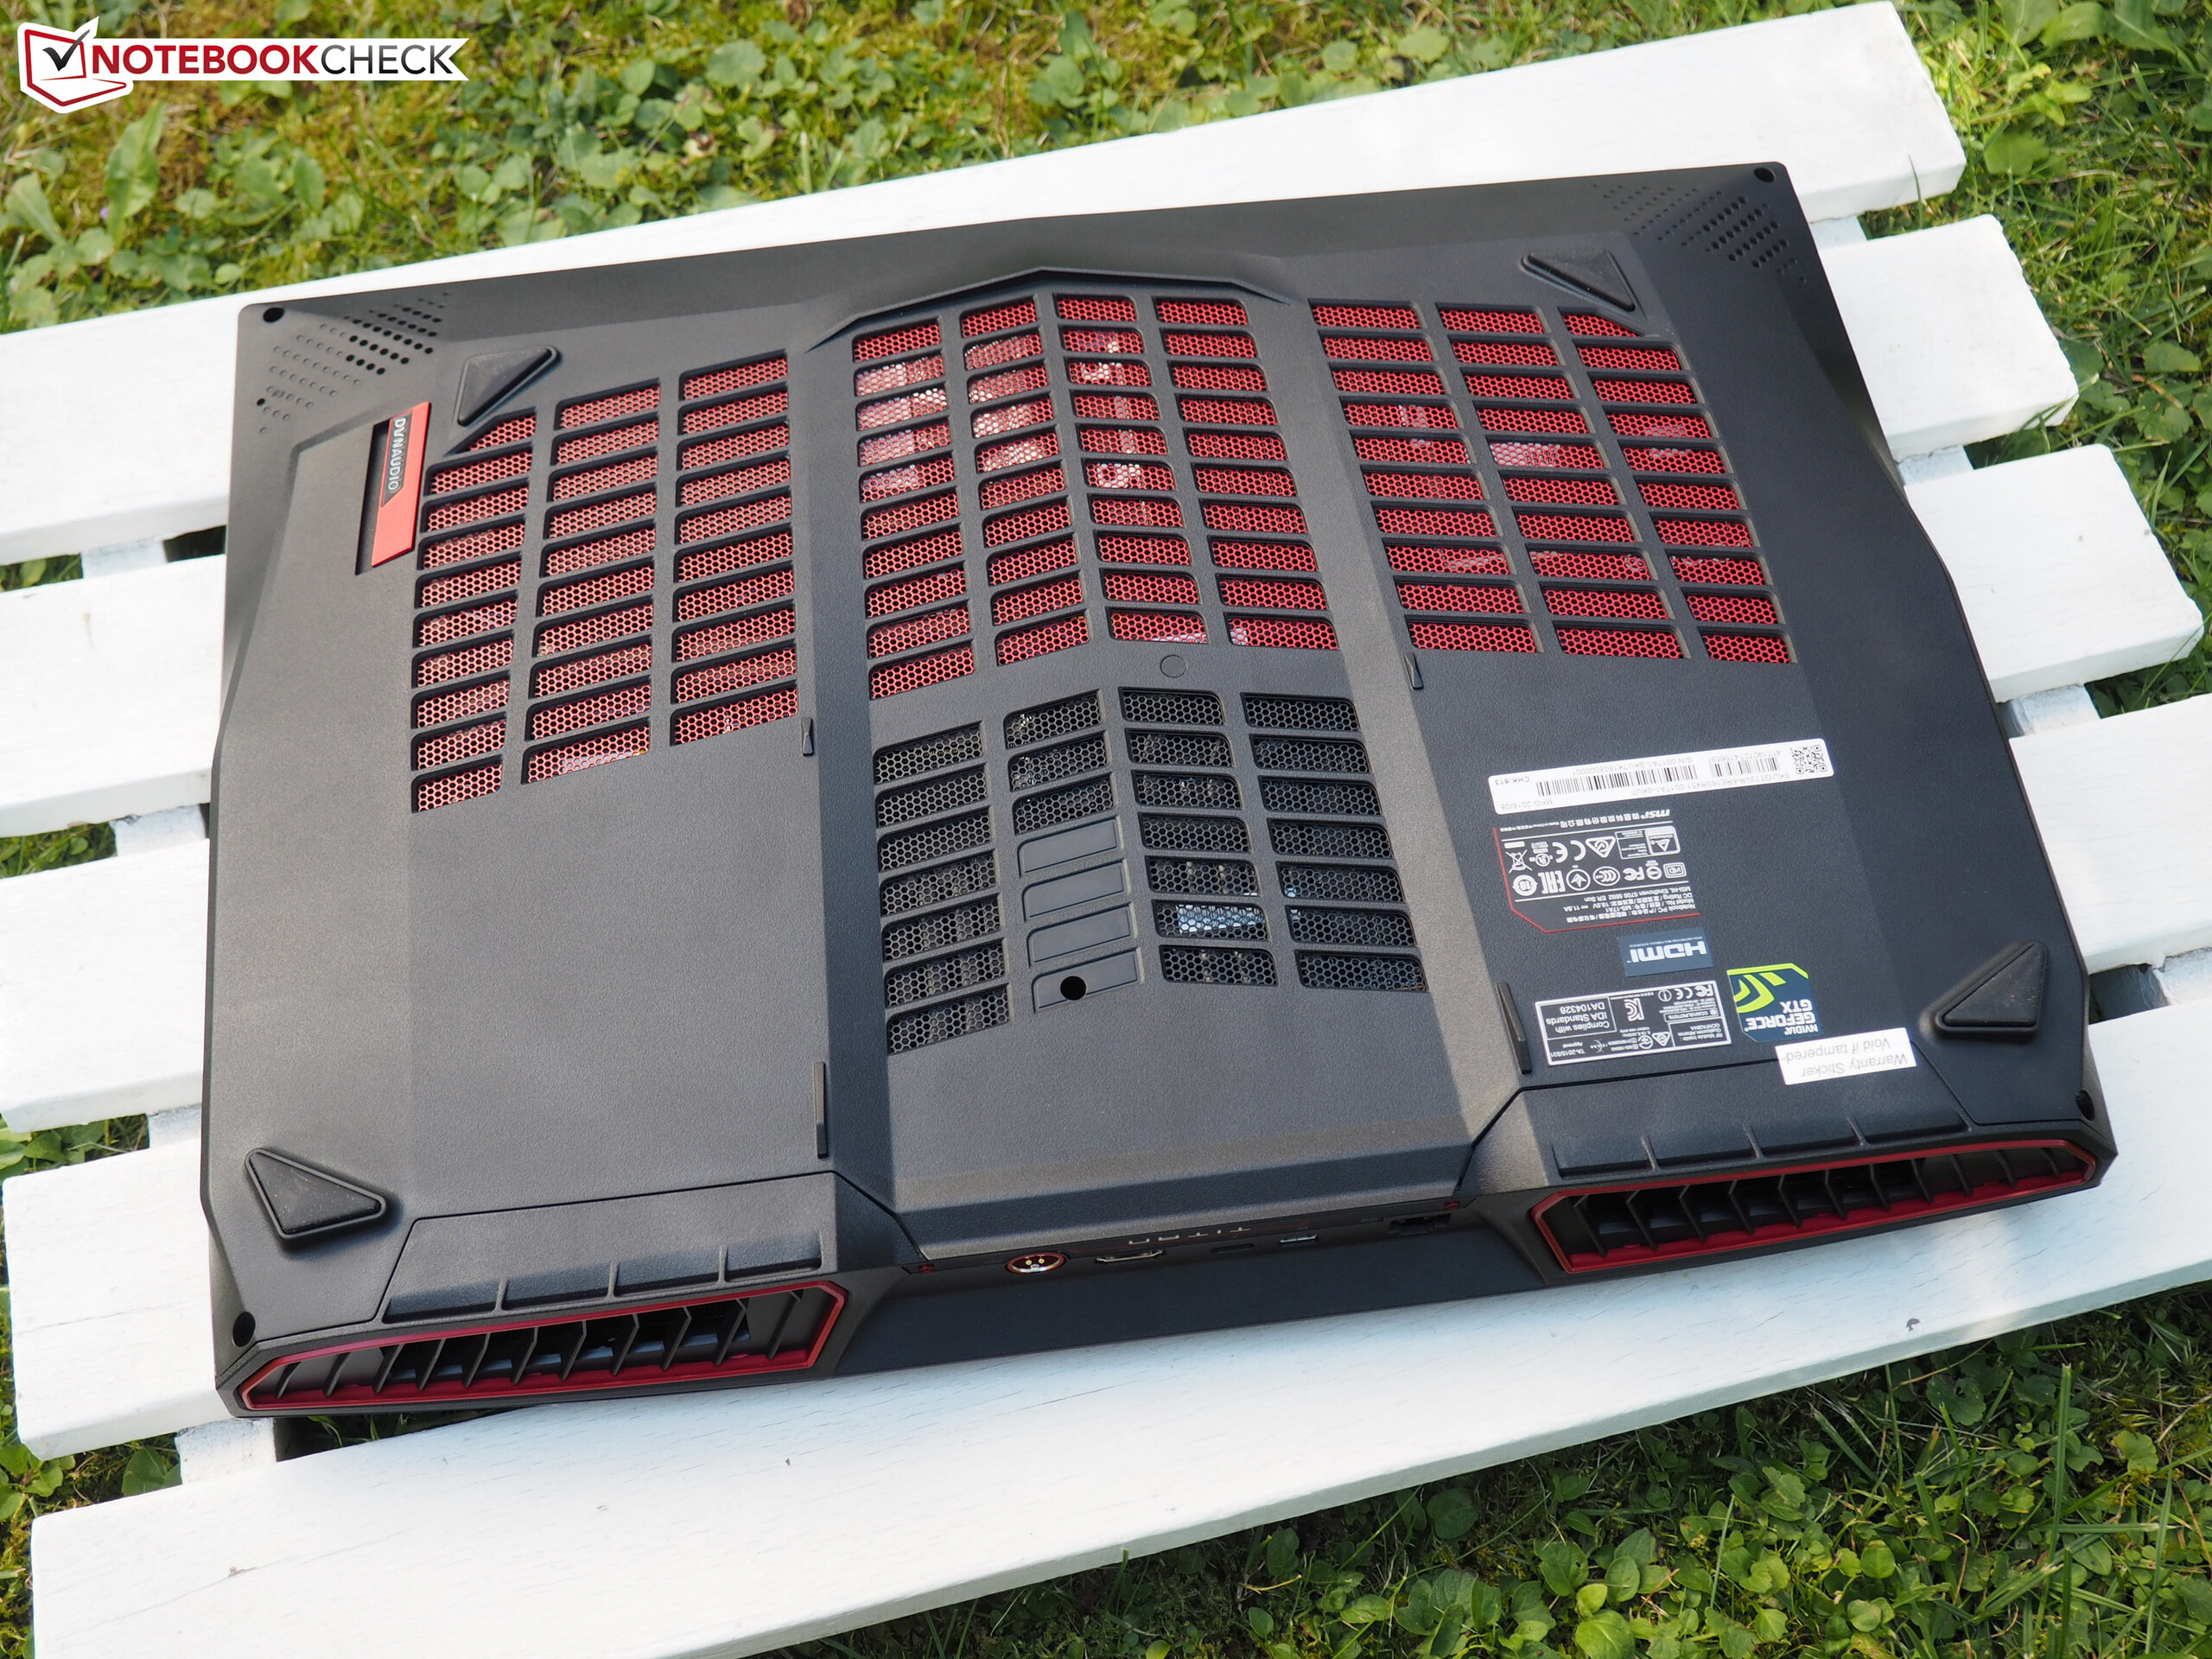
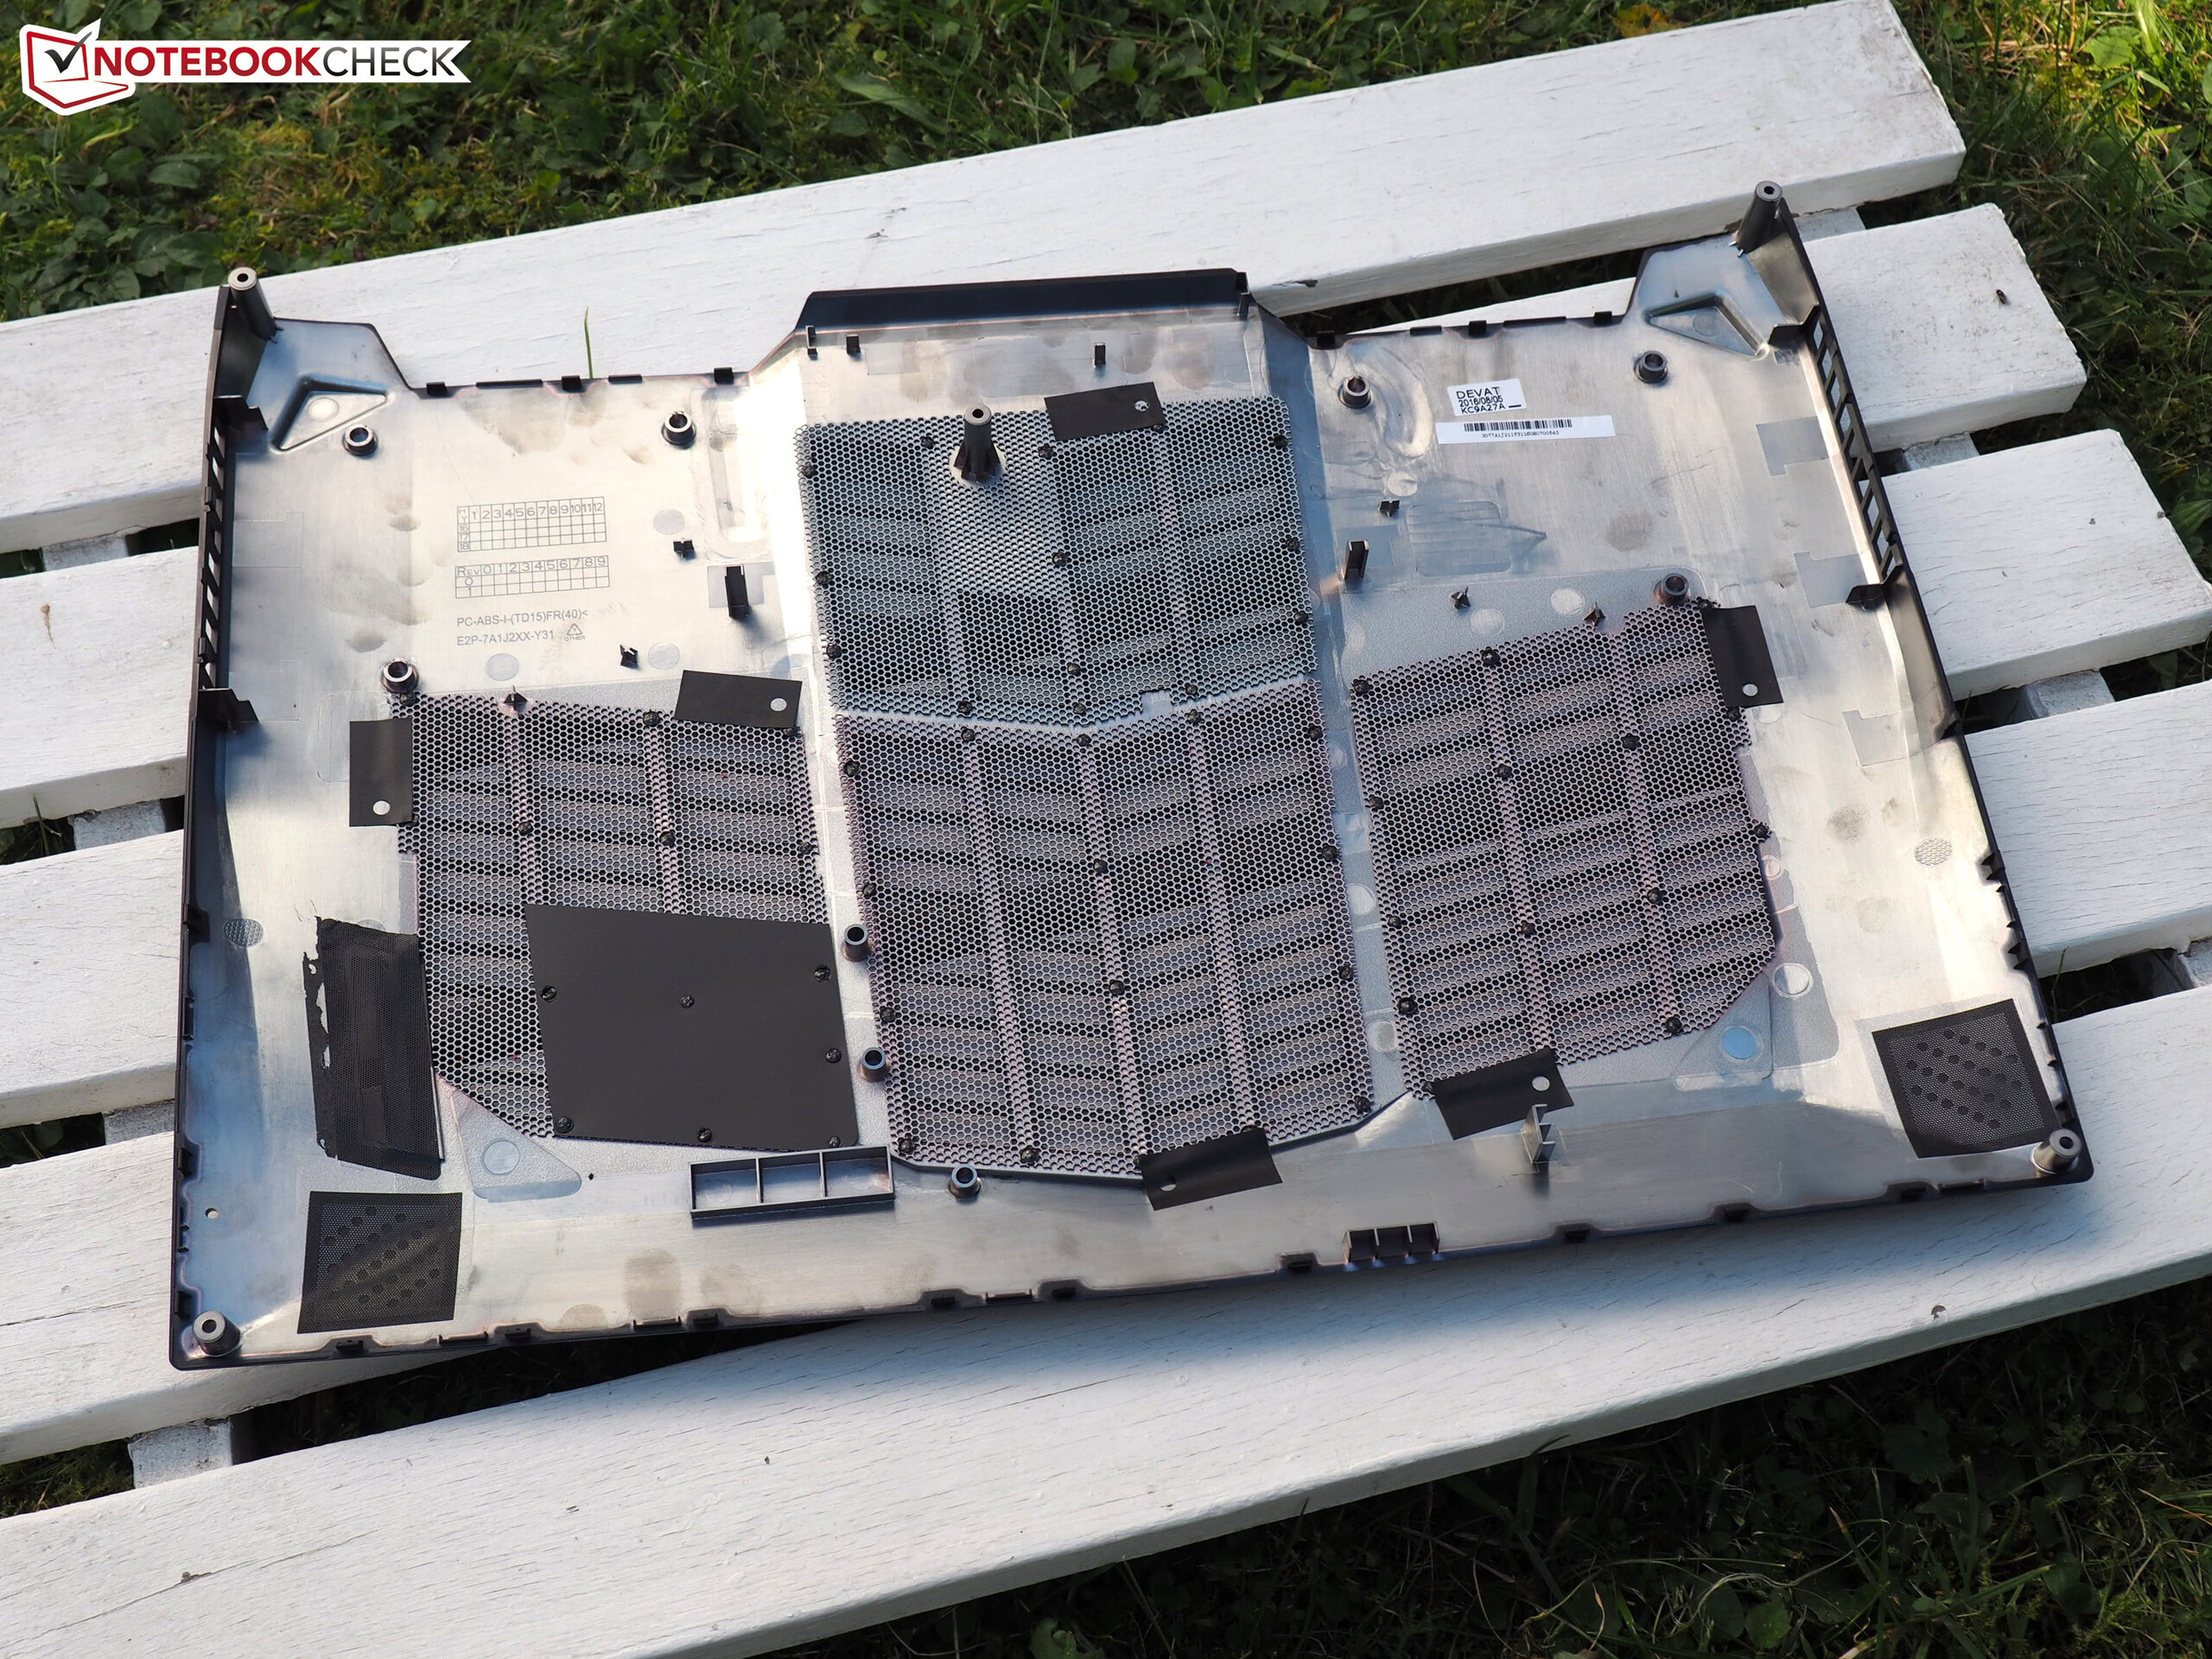
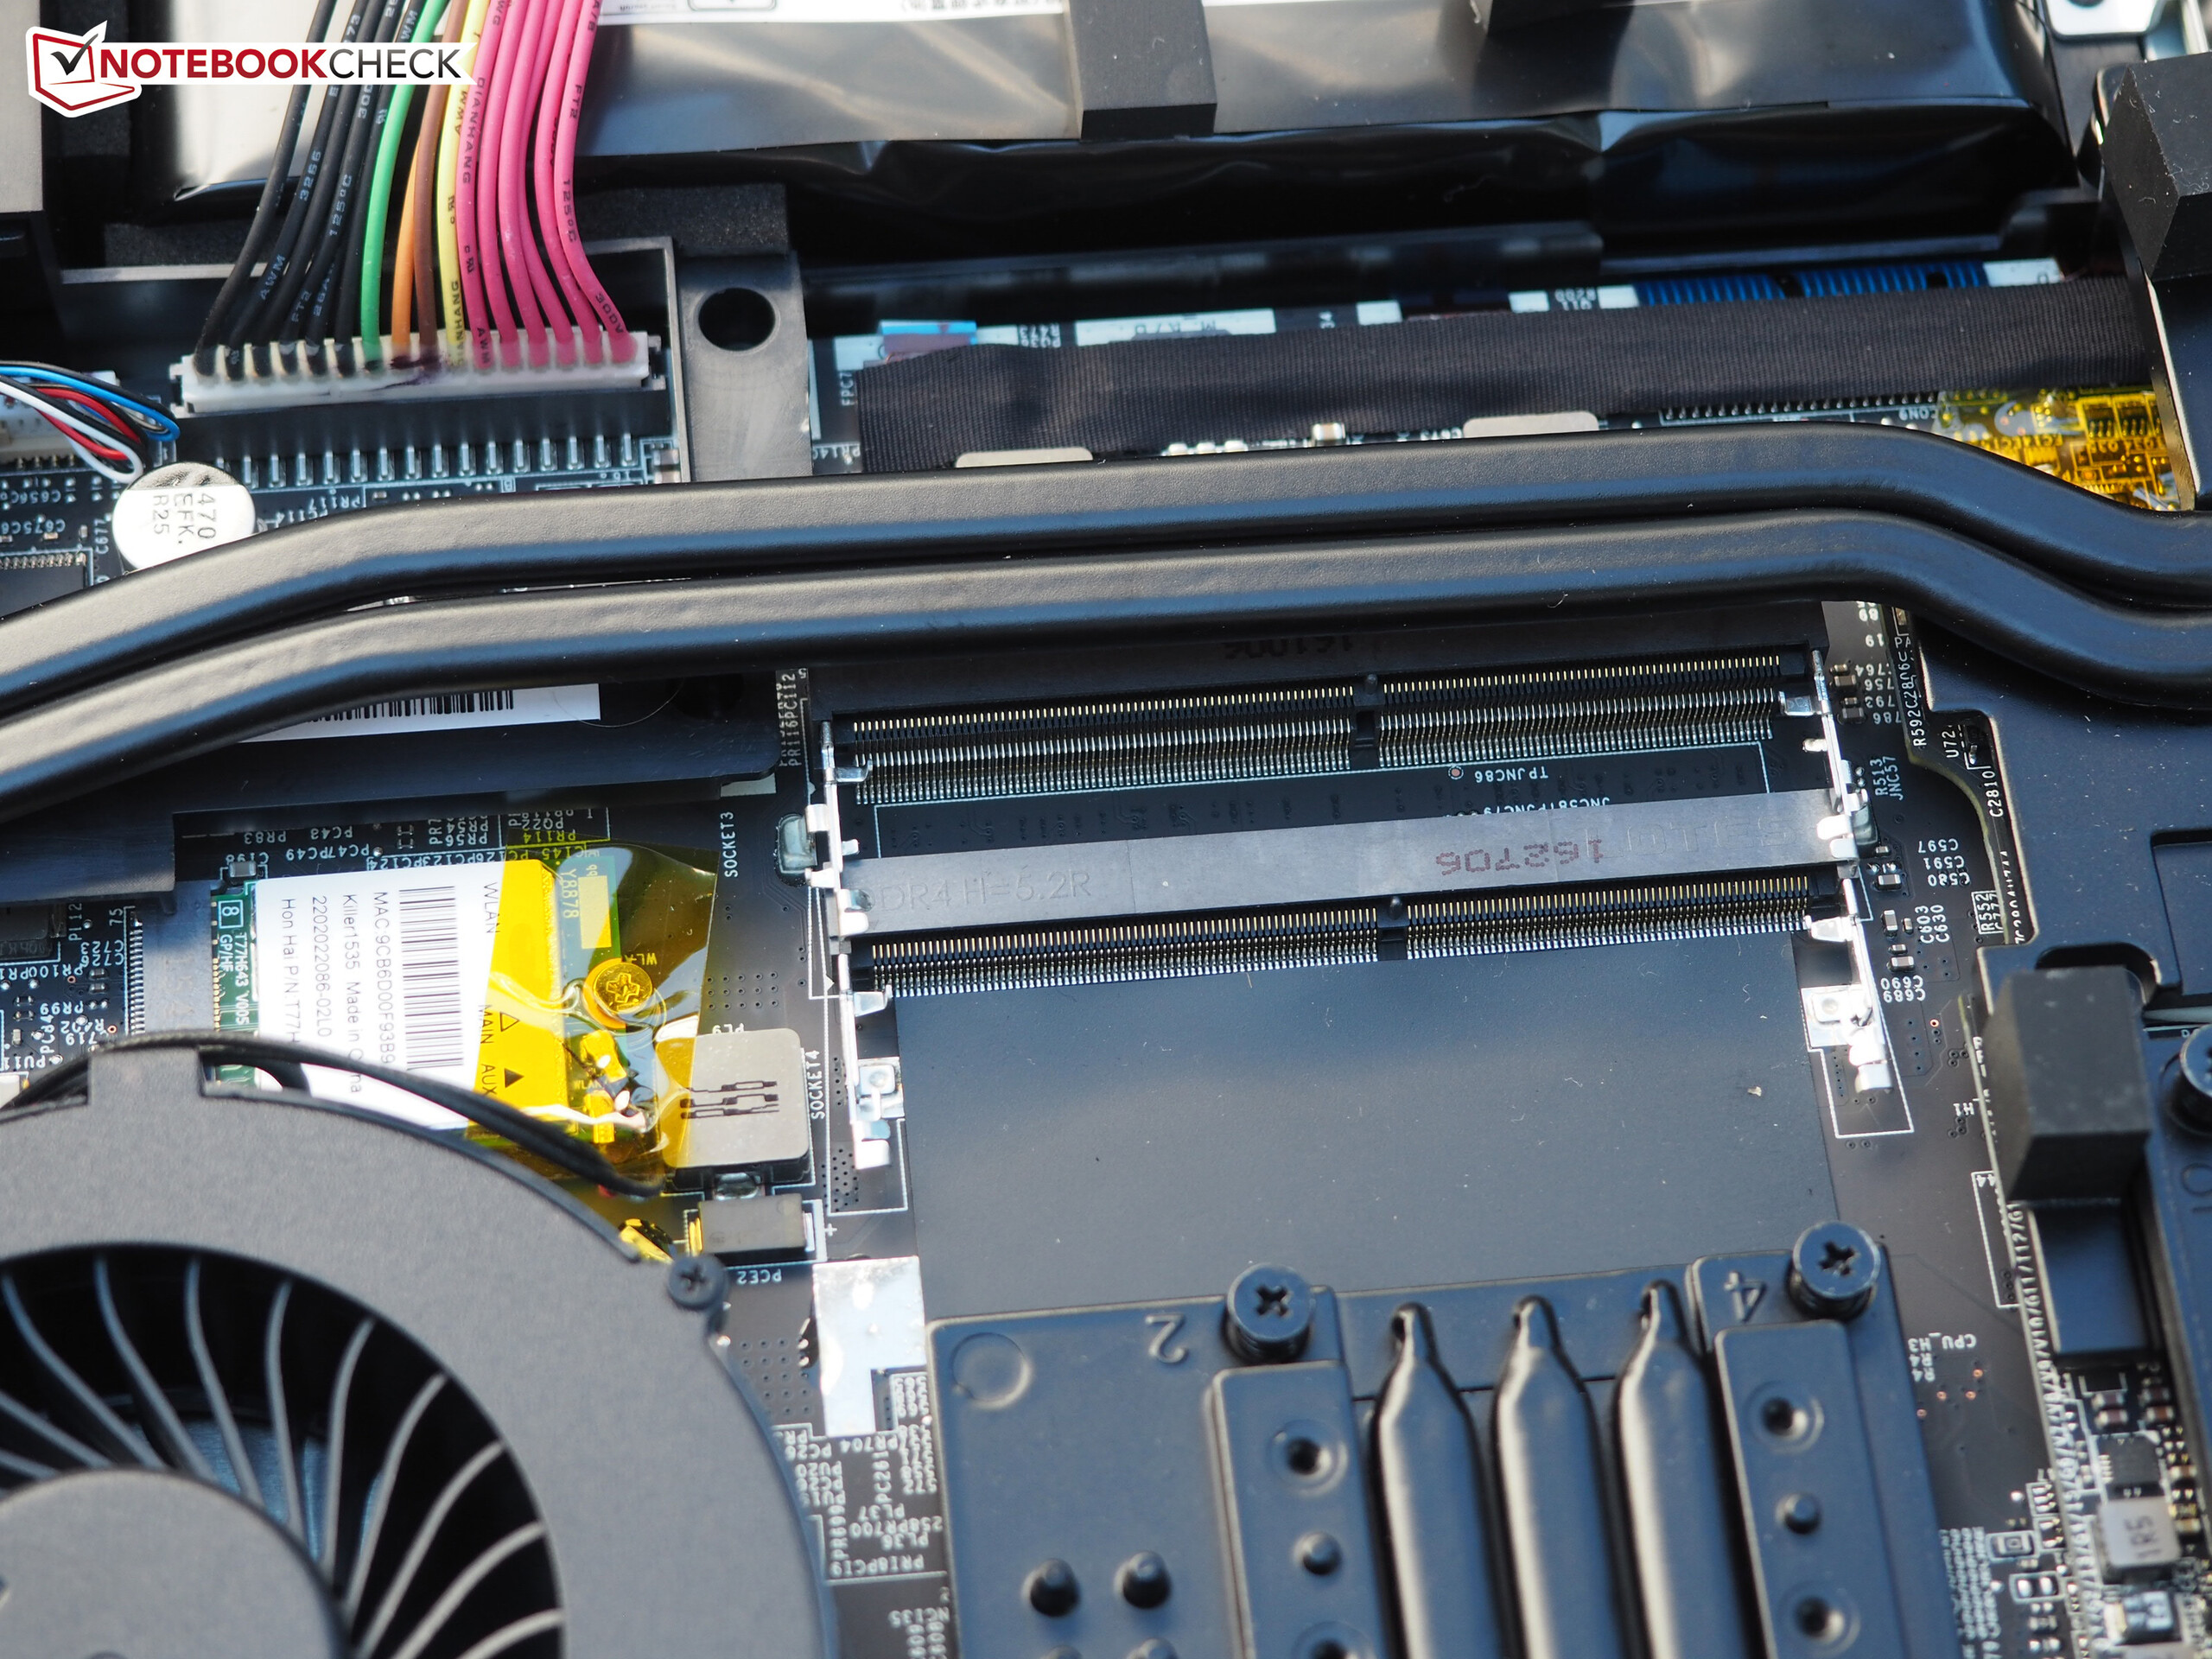
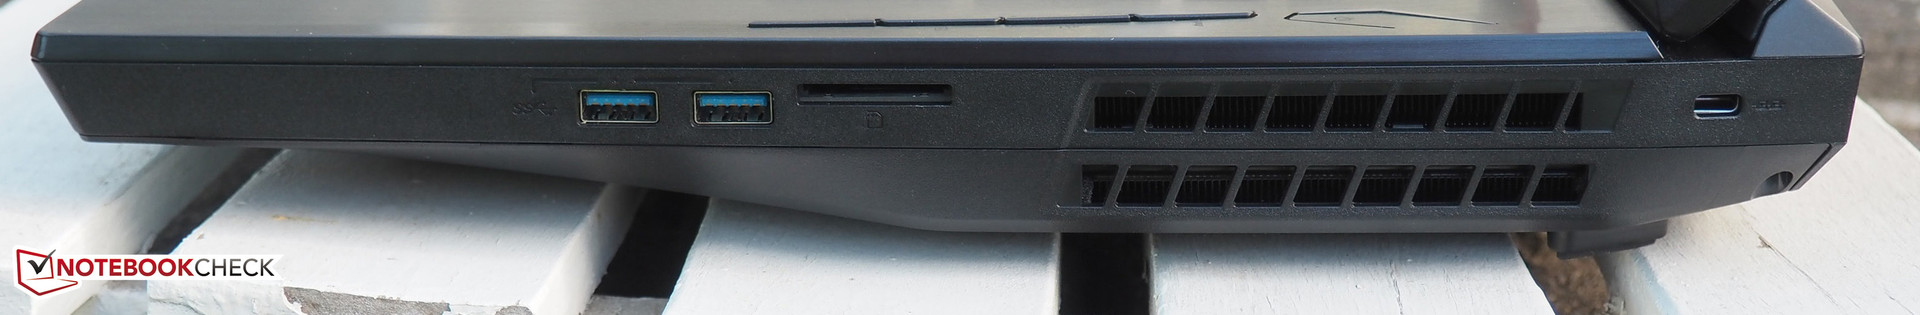
结合十分易于维护的MXM接口显卡,这台17寸设备可以方便地升级或清洁,在这个方面它可以轻松击败同类机型(特别是华硕 G752VS,普通用户无法接触到散热风扇)。
它的另外一个优势在于噪音控制。GT73VR几乎不会在实际使用中发出很大的噪音,甚至是在处理器显卡超频模式下。它的温度也可以在游戏中保持在合理的范围中。
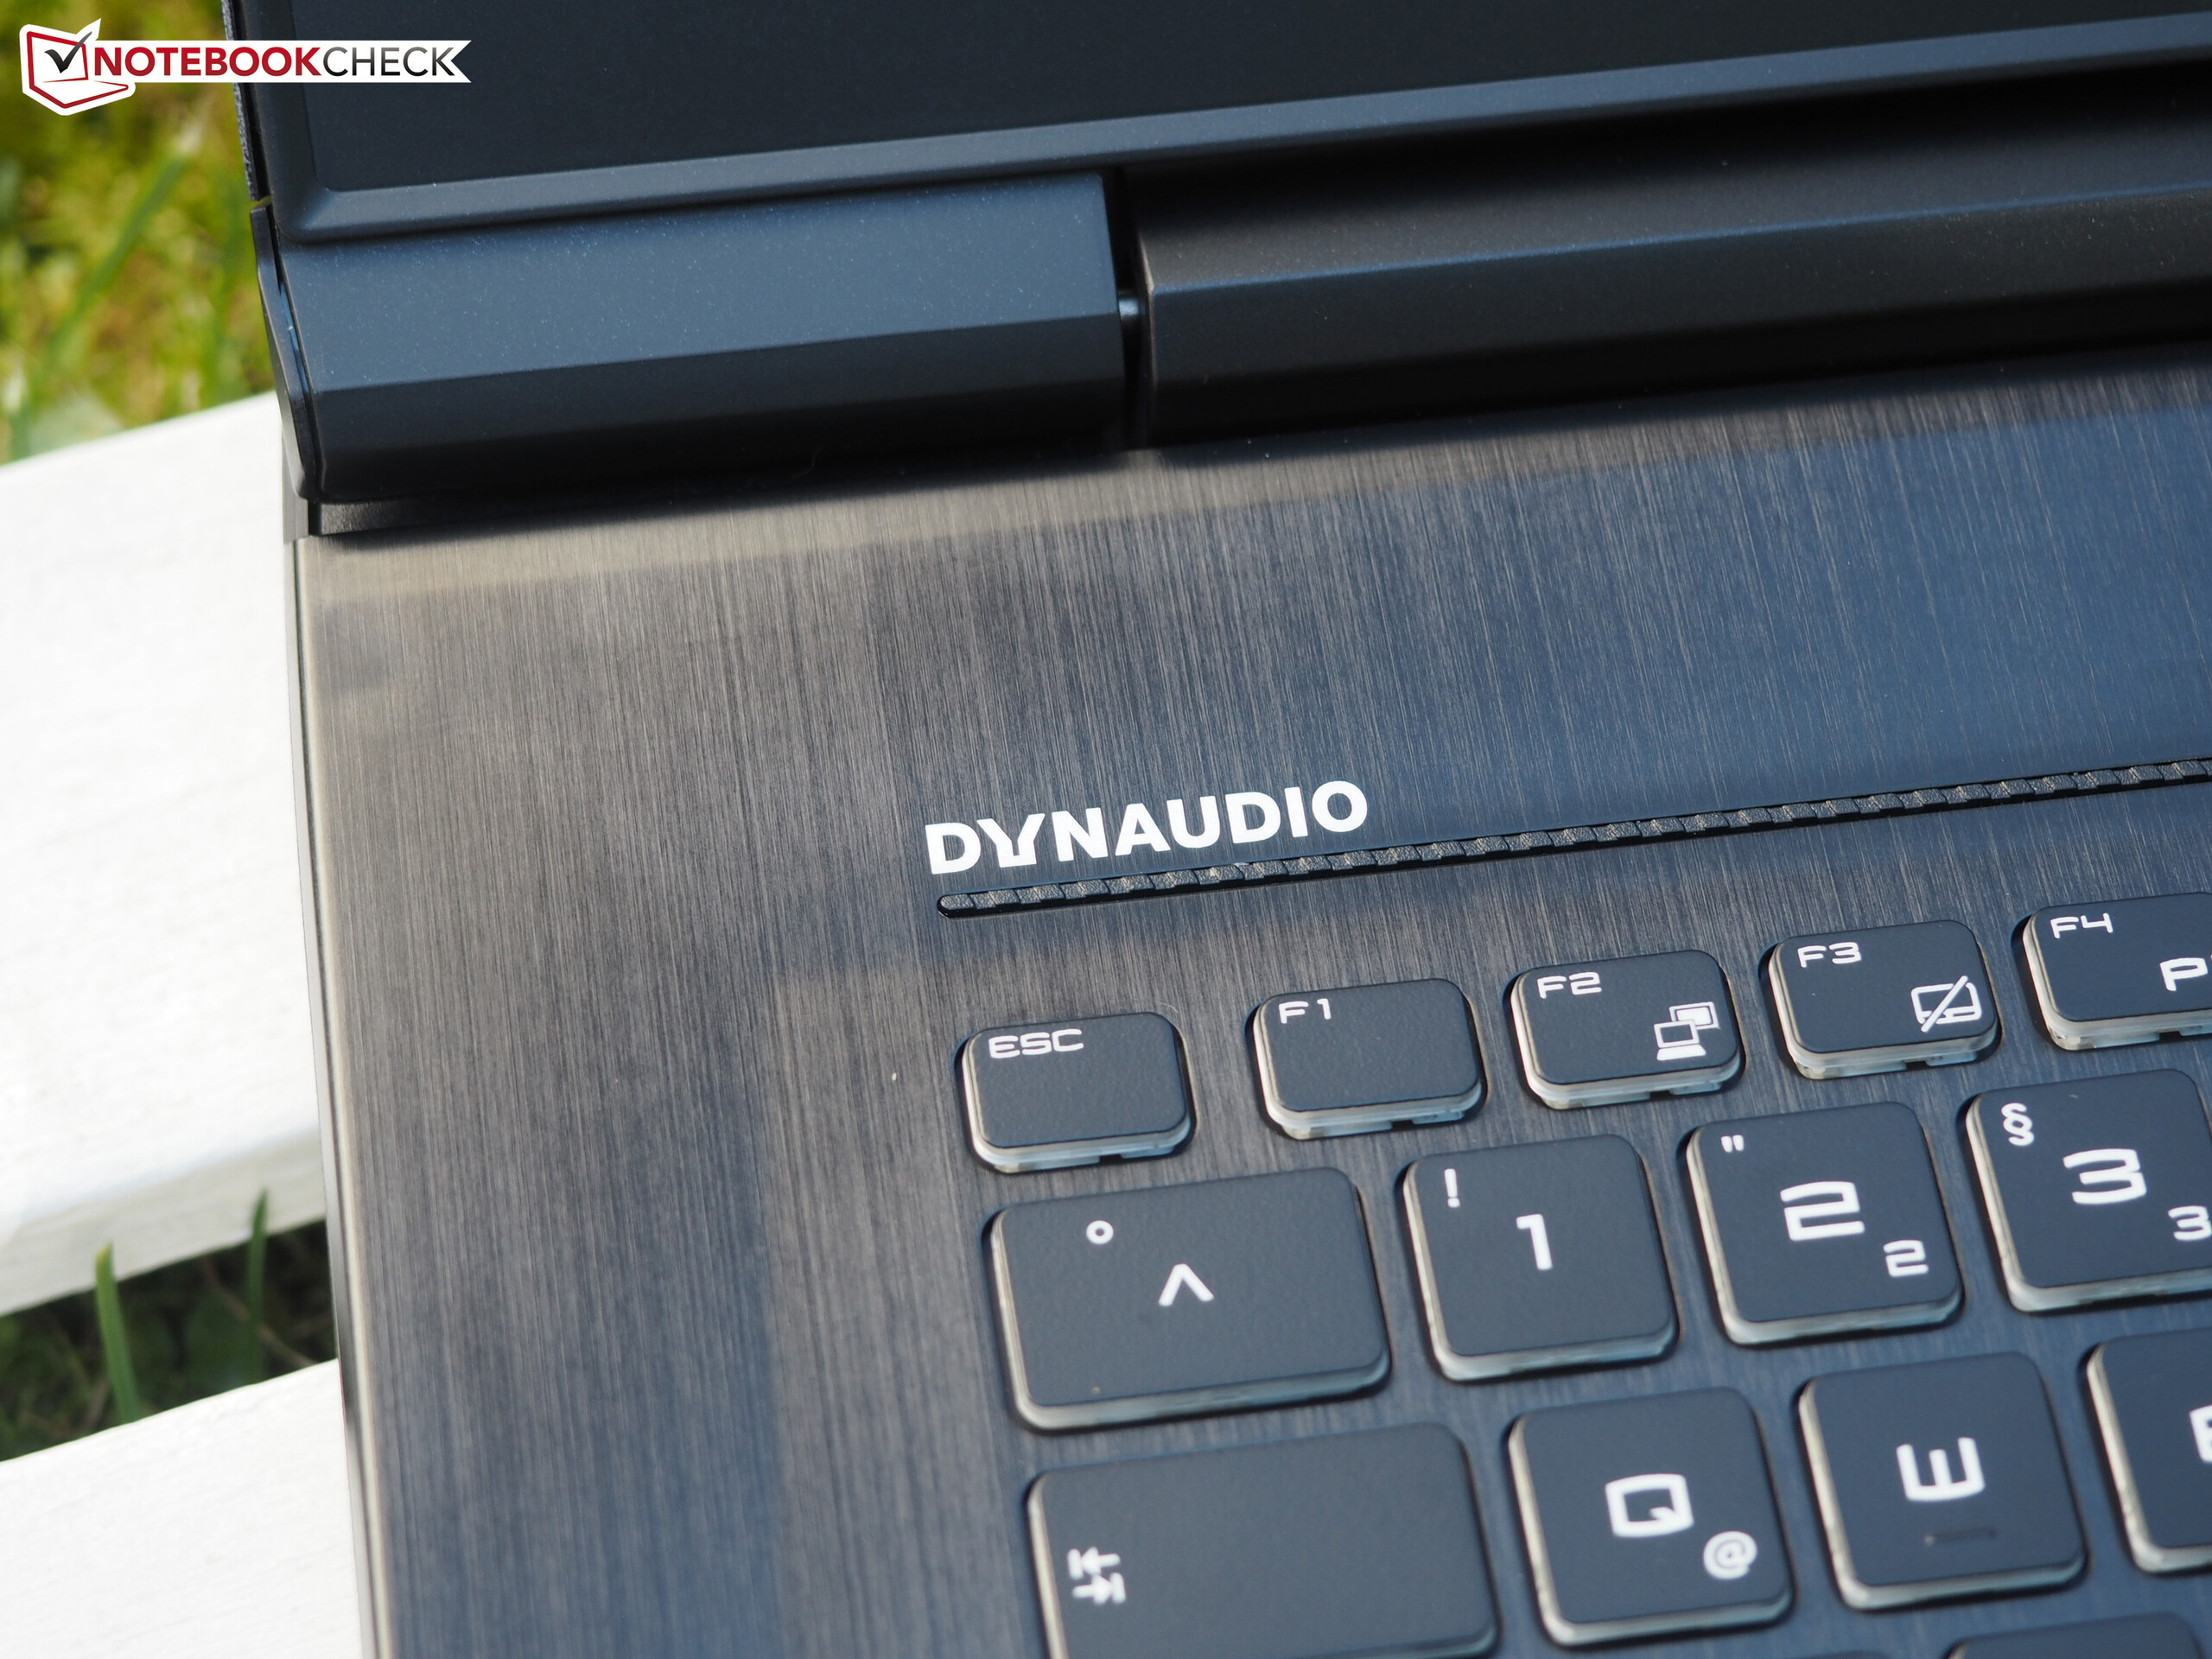
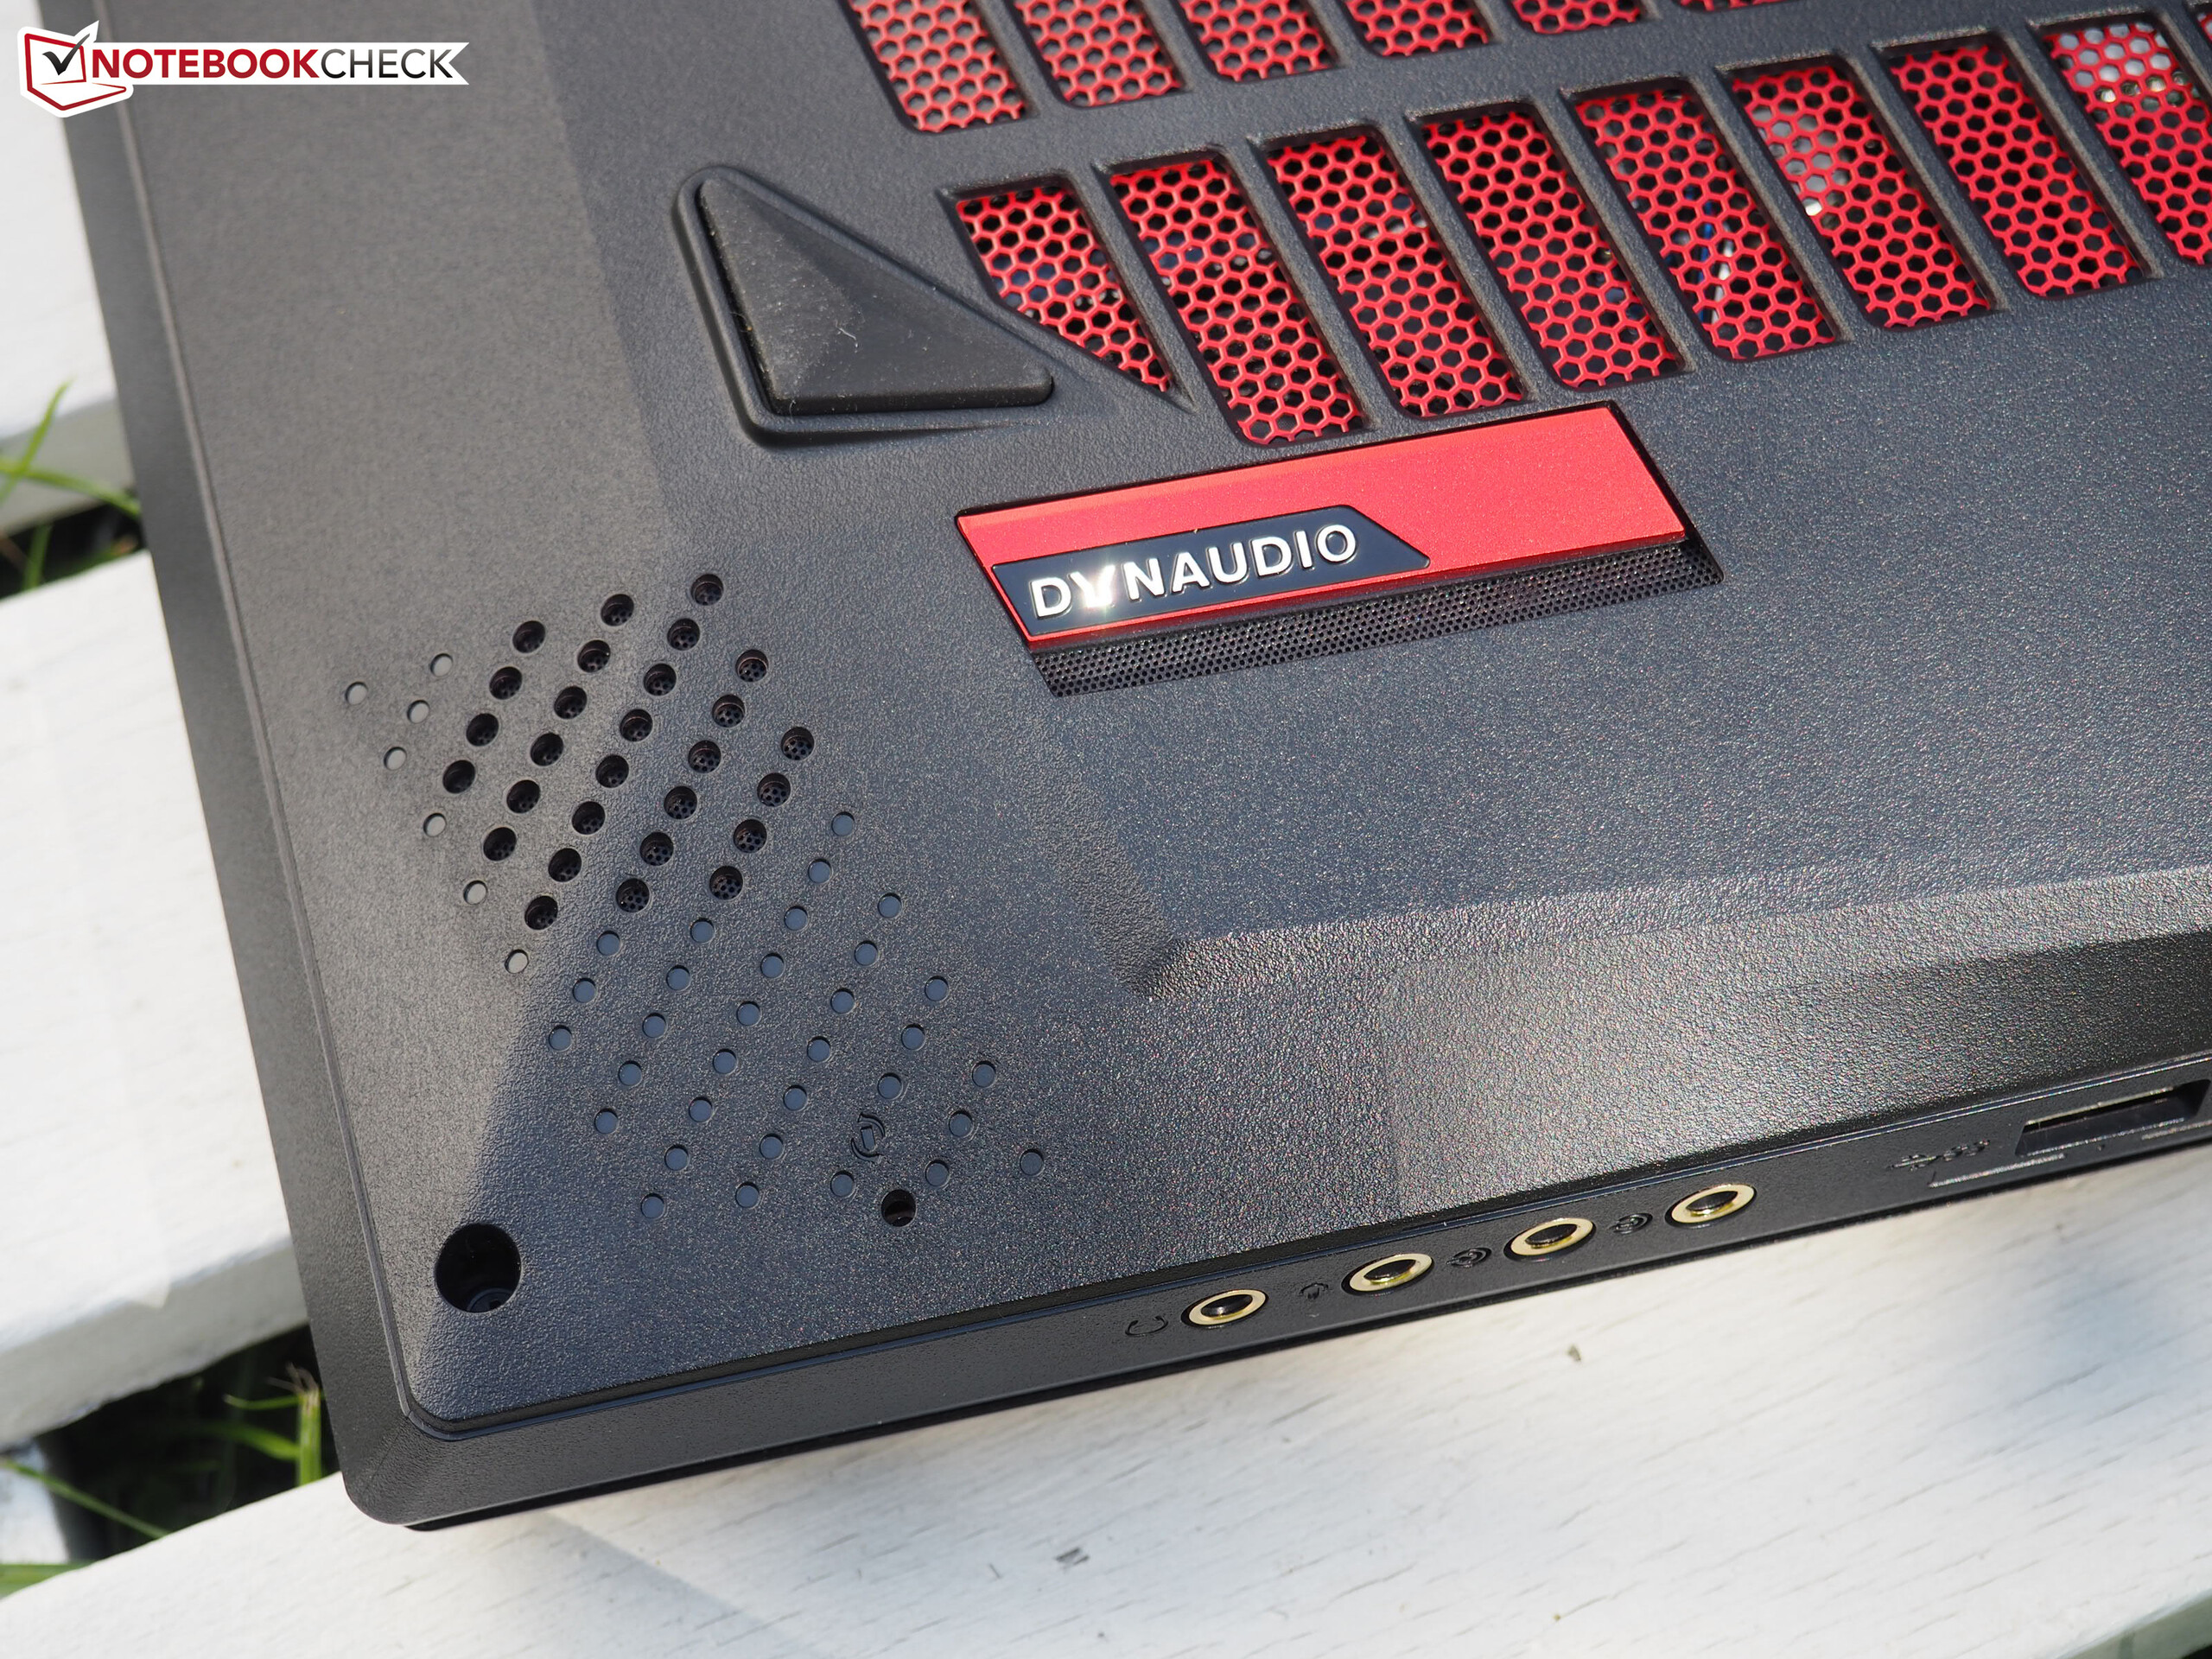
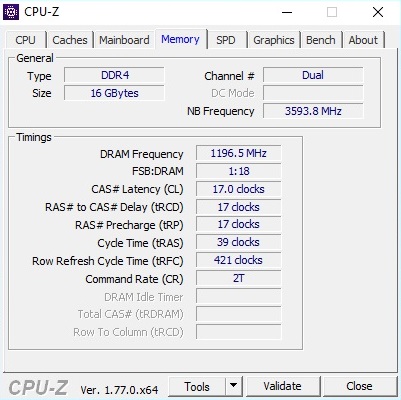
它的显示和音响效果也十分不错。除了较低的色彩准确度(偏蓝),它的全高清屏幕十分优秀。屏幕面板的刷新率目前还没有进入评分系统,所以我们额外为它增加了一分。结合120赫兹刷新率和英伟达G-Sync技术,它可以带来更加顺畅的显示效果。
由于这些优势,尽管重量较高、电池续航一般,GT73VR仍然在我们的游戏排行榜中占据了榜首宝座。不过这台游戏本的售价较为高昂。
注:本文是基于完整评测的缩减版本,阅读完整的英文评测,请点击这里。
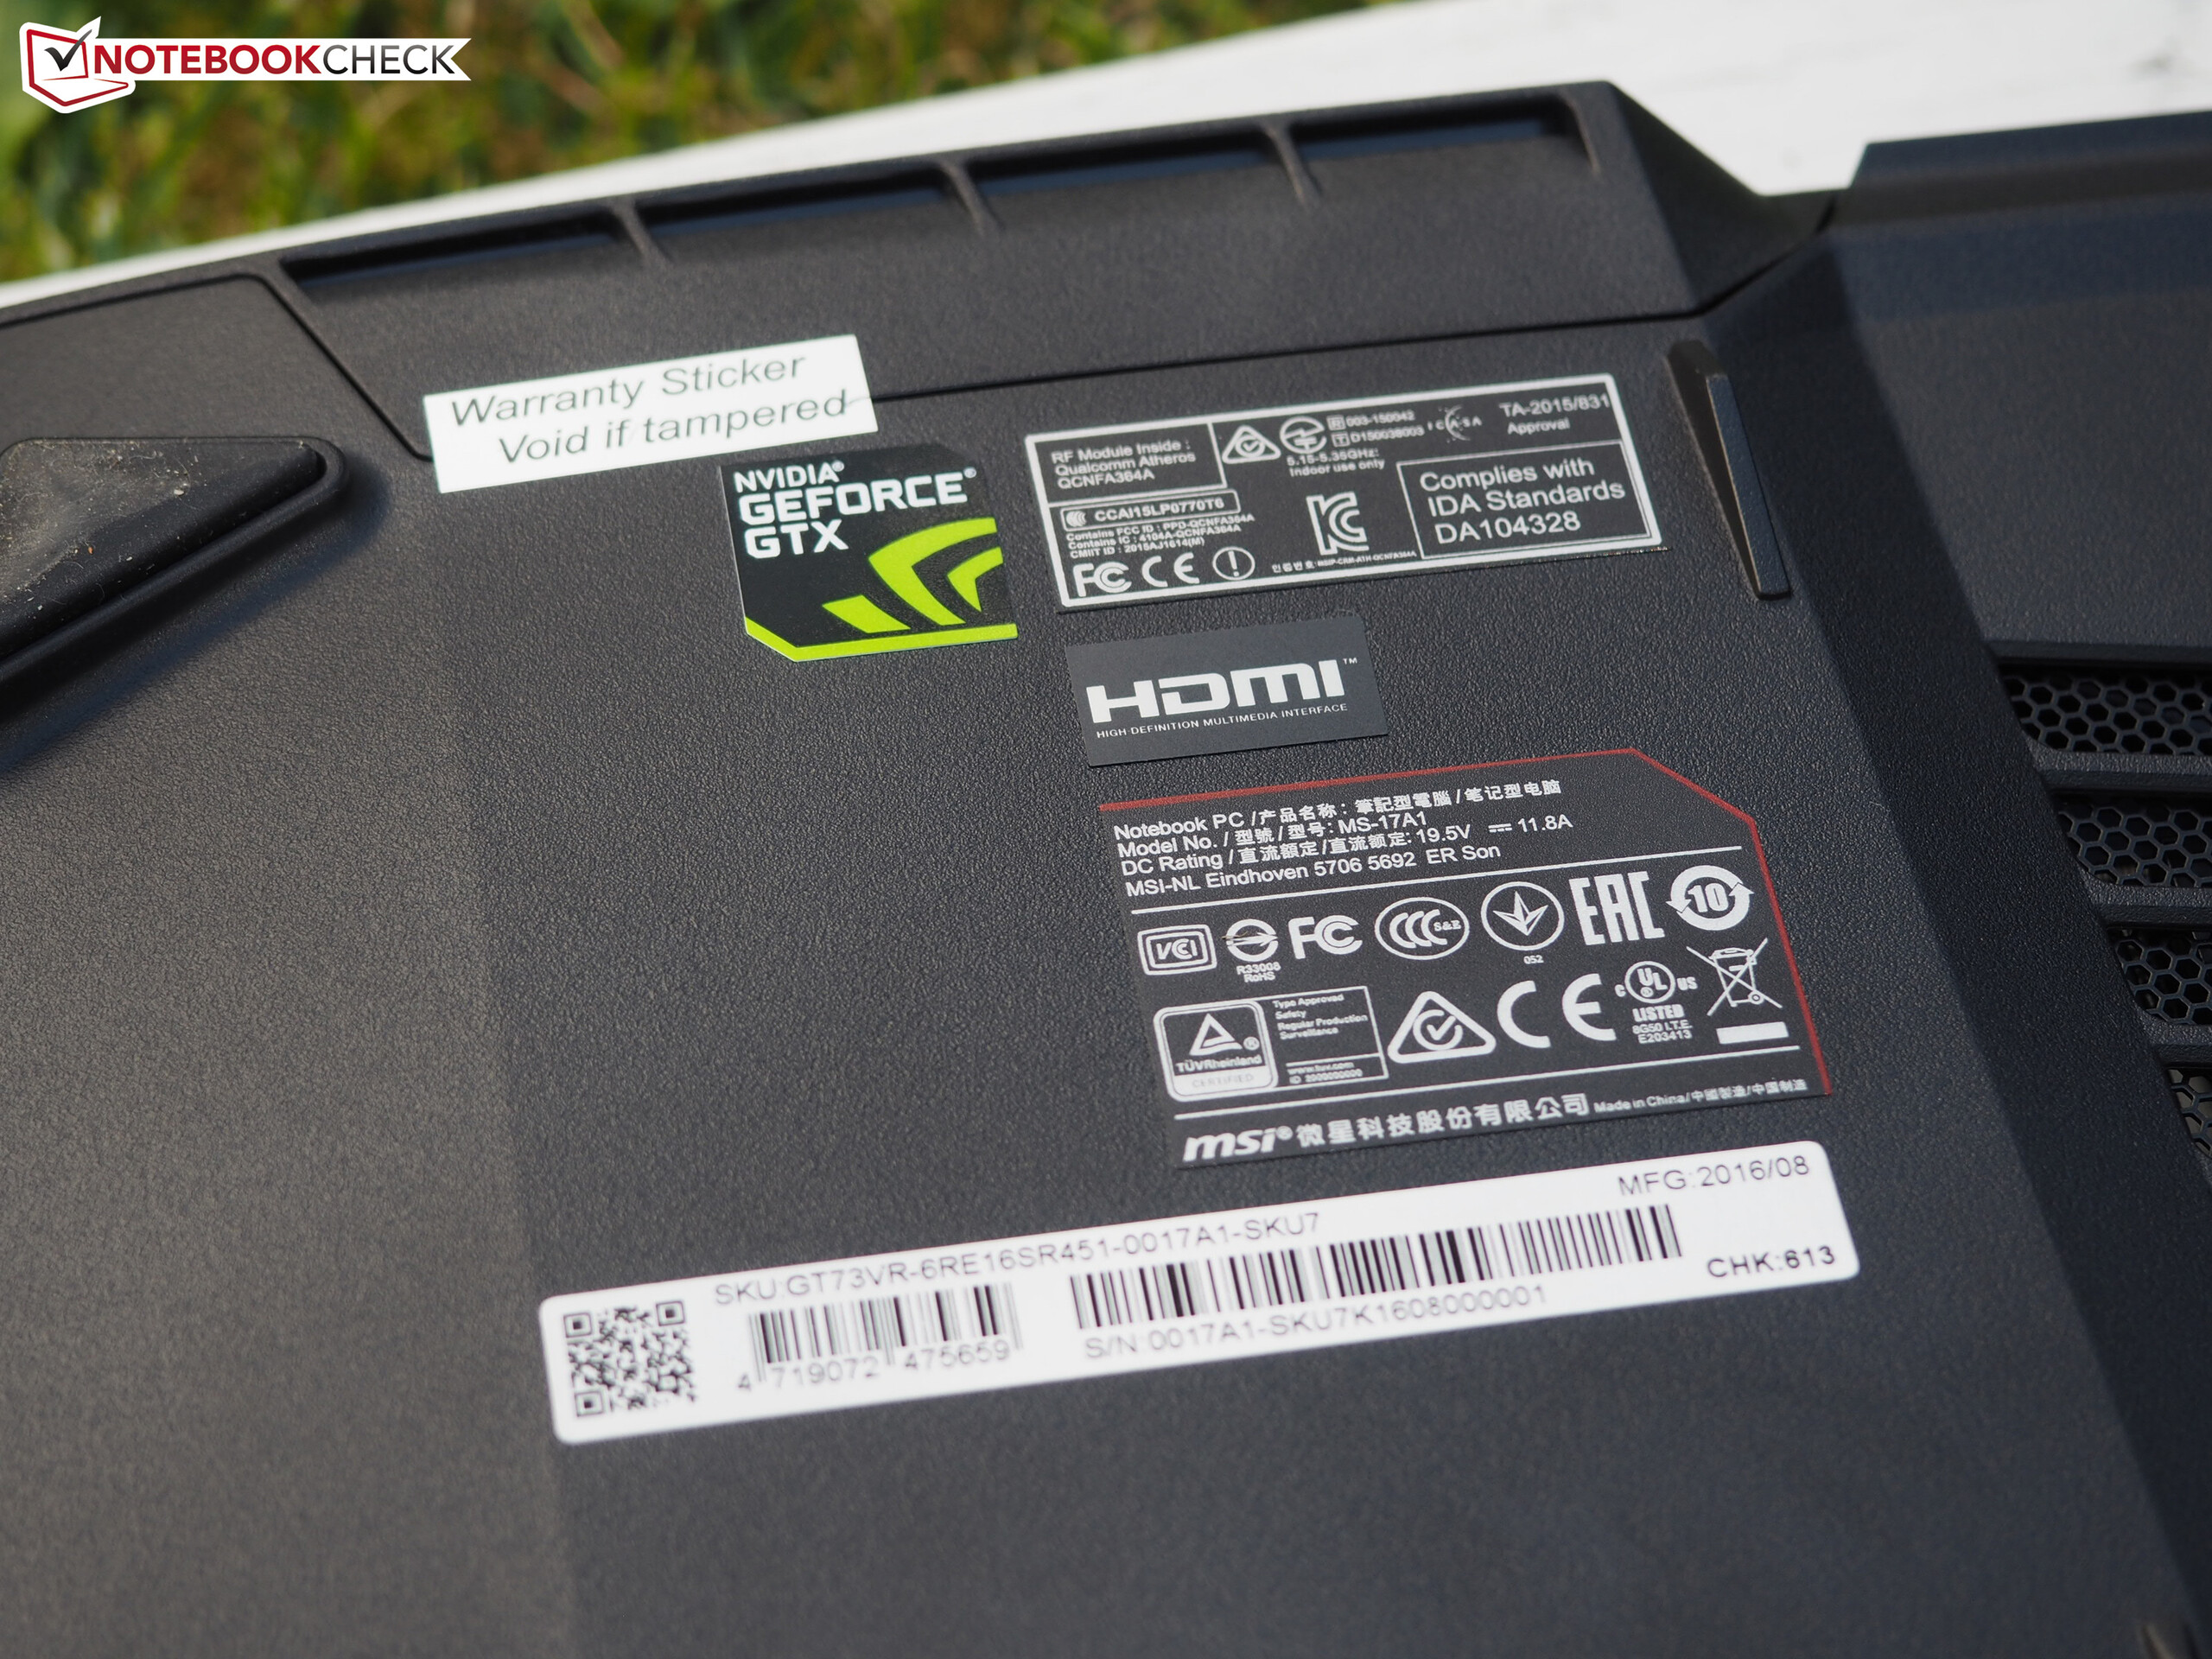
MSI GT73VR-6RE16SR451
- 12/18/2016 v6 (old)
Florian Glaser
Price comparison