Blackview Tab 10平板电脑评测:Android 11,仅售190美元
黑视Tab 10是一款超预算的Android 11平板电脑,运行在低端八核联发科MT8768 SoC上。不可否认的是,其低于200美元的价格对那些只想用简单的Andoid平板电脑进行基本浏览和收发电子邮件的用户来说是很有吸引力的。Tab 10绝对有一些令人惊讶的优点,但缺点也很难忽视。
见官方产品页面关于Blackview Tab 10的完整规格列表。Tab 10的直接竞争对手包括其他非常便宜的Android 平板电脑,如 全视通iPlay 20, 联想Tab M10系列,或Medion LifeTab系列.
更多关于Blackview的评论。
potential competitors in comparison
Rating | Date | Model | Weight | Height | Size | Resolution | Price |
|---|---|---|---|---|---|---|---|
| 74.3 % v7 (old) | 09 / 2021 | Blackview Tab 10 Helio MT8768, PowerVR GE8320 | 523 g | 8.4 mm | 10.10" | 1920x1080 | |
| 88.4 % v7 (old) | 09 / 2021 | Huawei MatePad 11 2021 SD 865, Adreno 650 | 485 g | 7.25 mm | 10.95" | 2560x1600 | |
| 77.1 % v7 (old) | Alcatel 3T 10 4G 2020 Helio MT8766B, PowerVR GE8300 | 462 g | 9.35 mm | 10.10" | 1280x800 | ||
| 78.4 % v7 (old) | Medion LifeTab E10802 Helio MT8768, PowerVR GE8320 | 503 g | 8.6 mm | 10.00" | 1920x1200 | ||
| 78 % v7 (old) | Allview iPlay 20 SC9863A, GE8322 / IMG8322 | 444 g | 7.95 mm | 10.10" | 1920x1200 | ||
| 90.7 % v7 (old) | 10 / 2020 | Apple iPad Air 4 2020 A14, A14 Bionic GPU | 458 g | 6.1 mm | 10.90" | 2360x1640 |
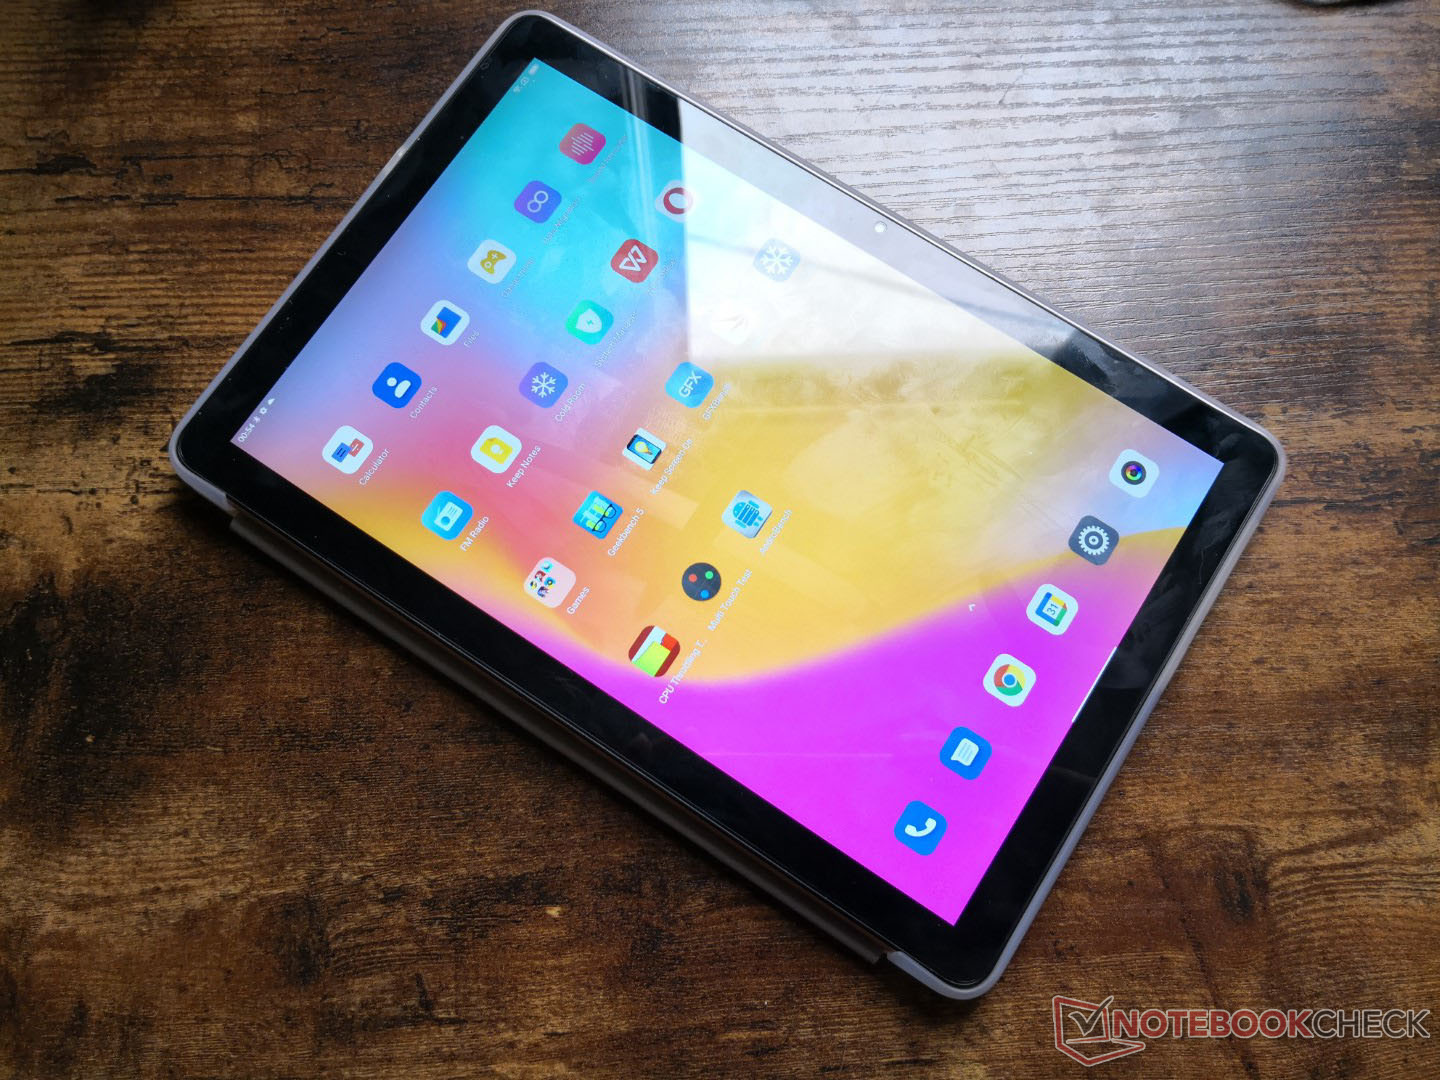
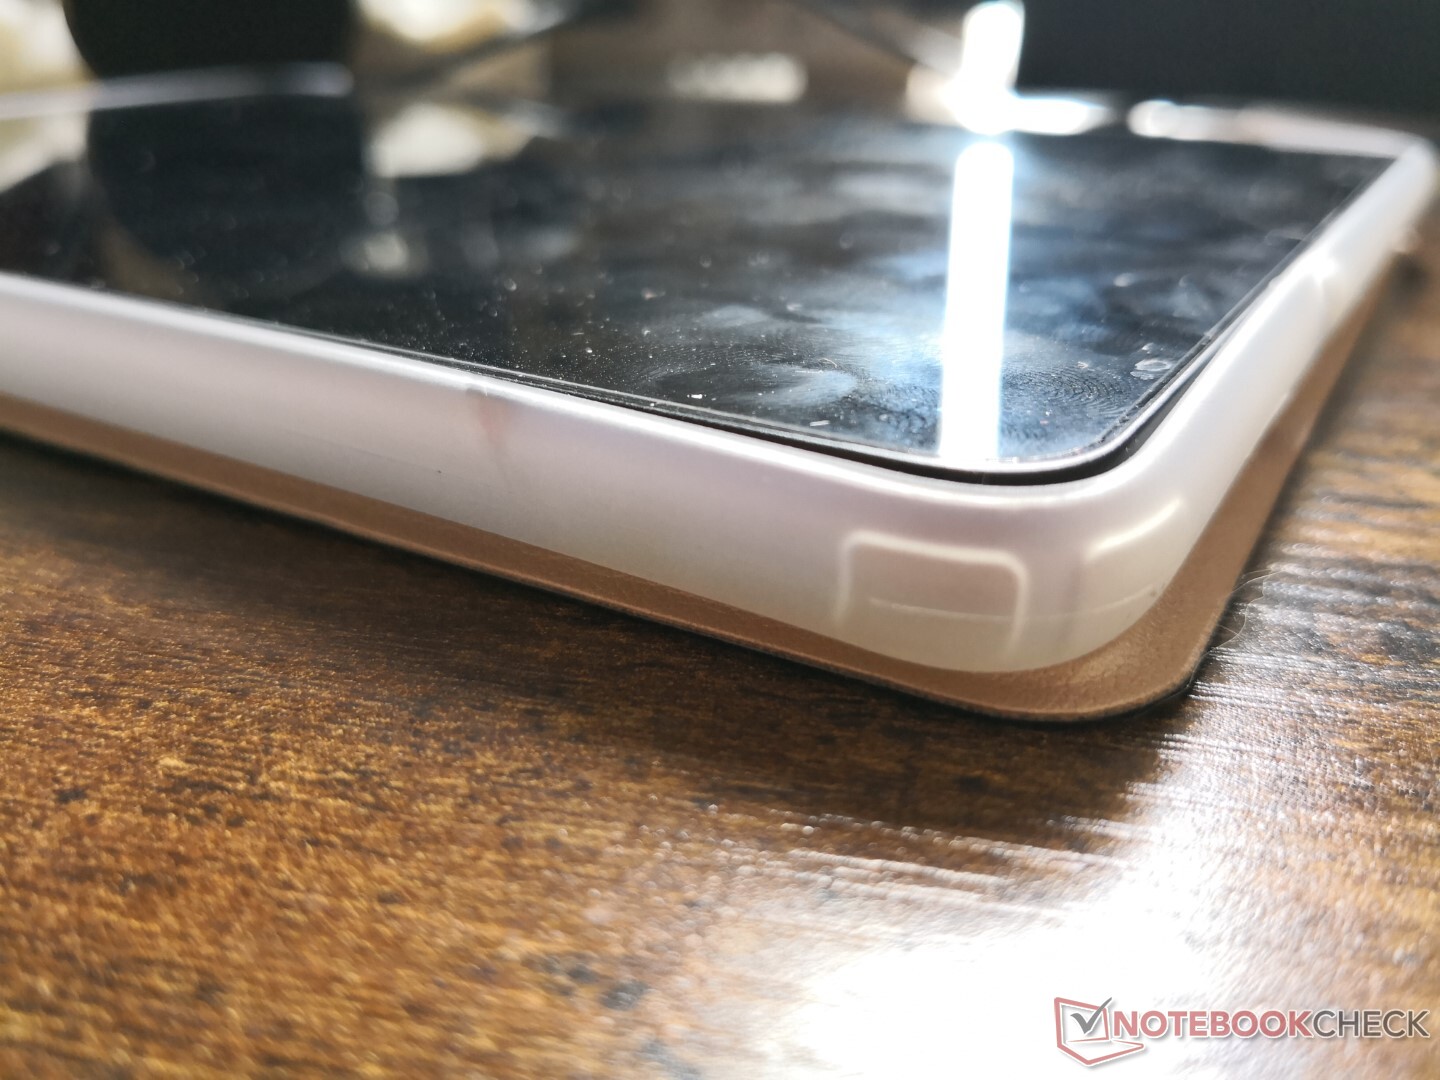
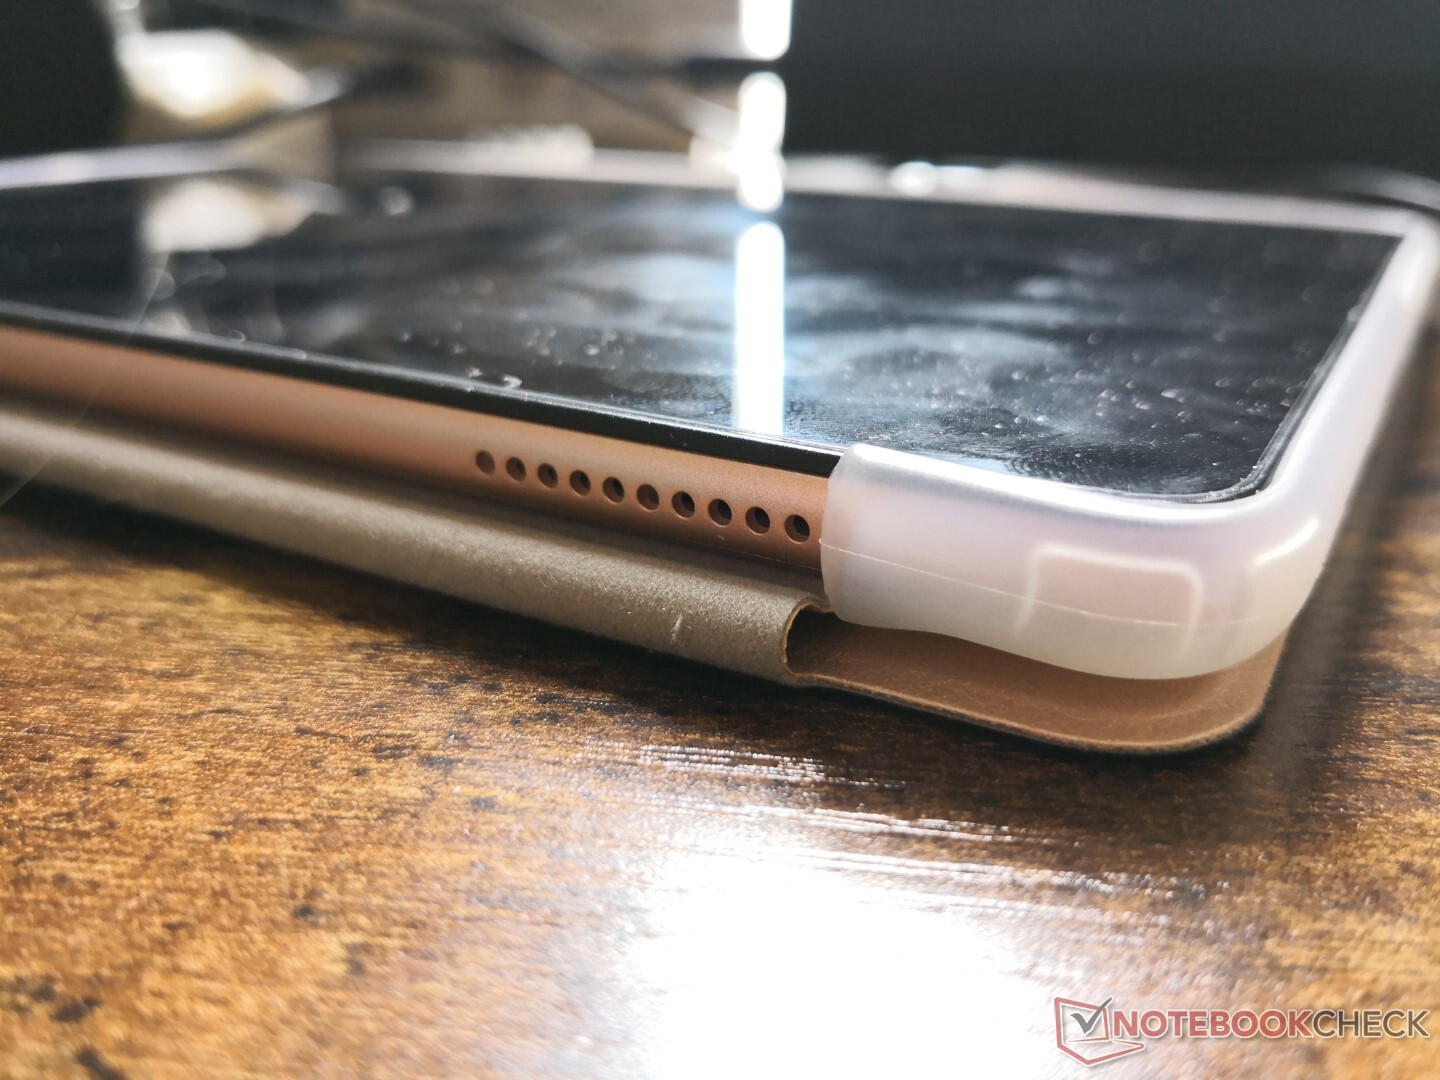
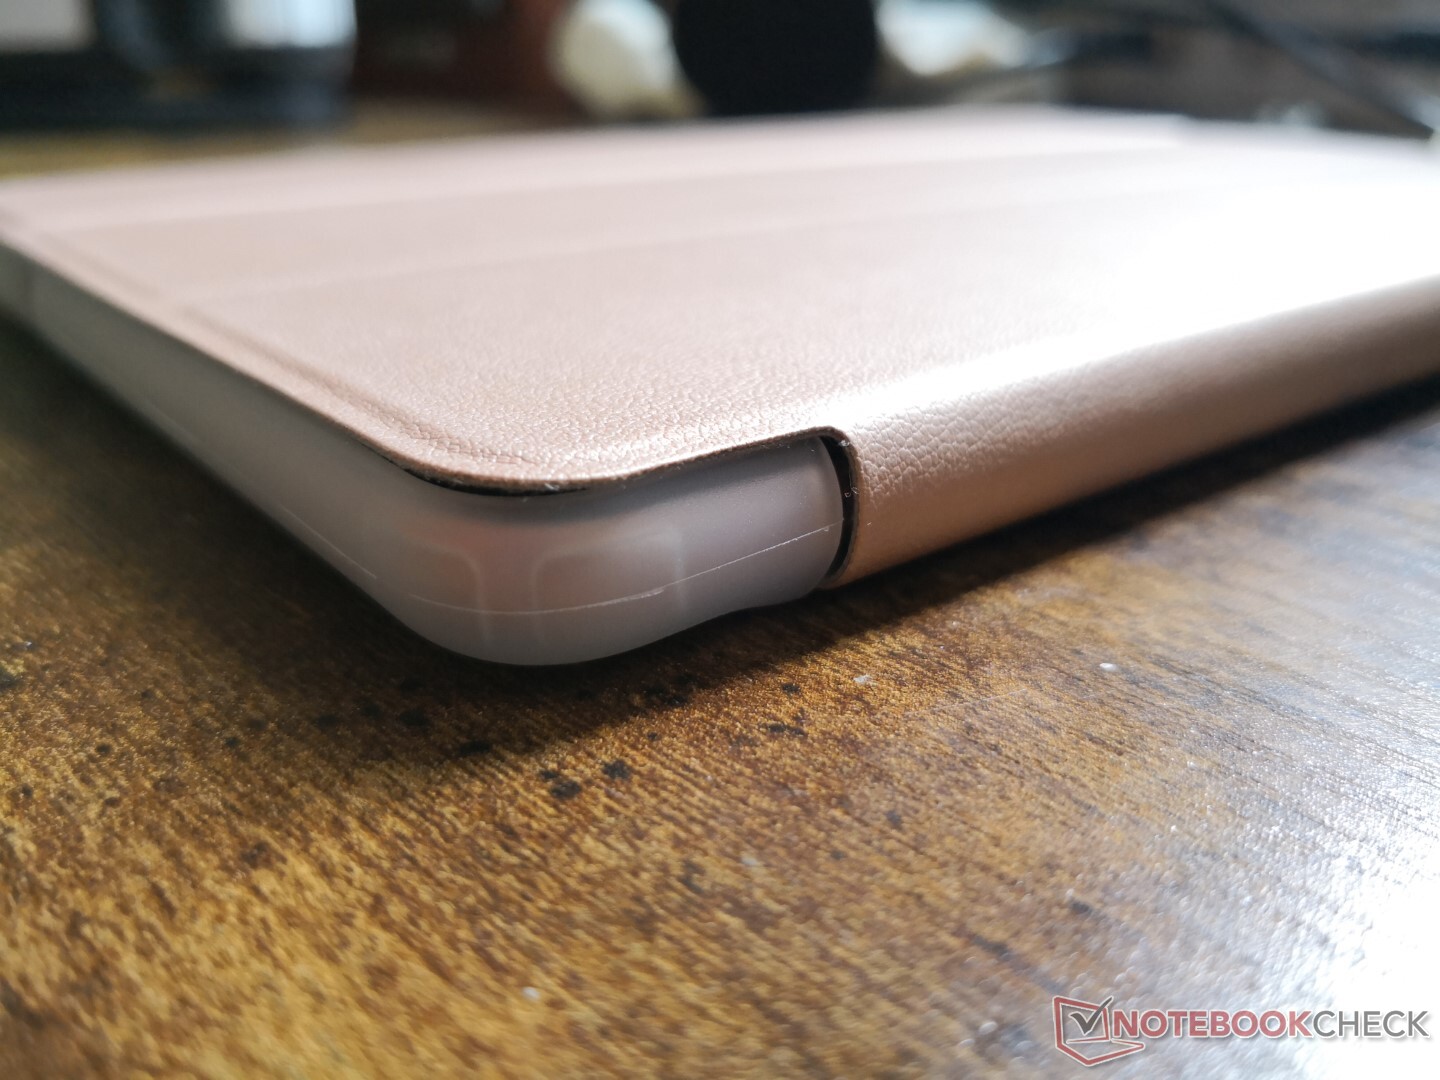
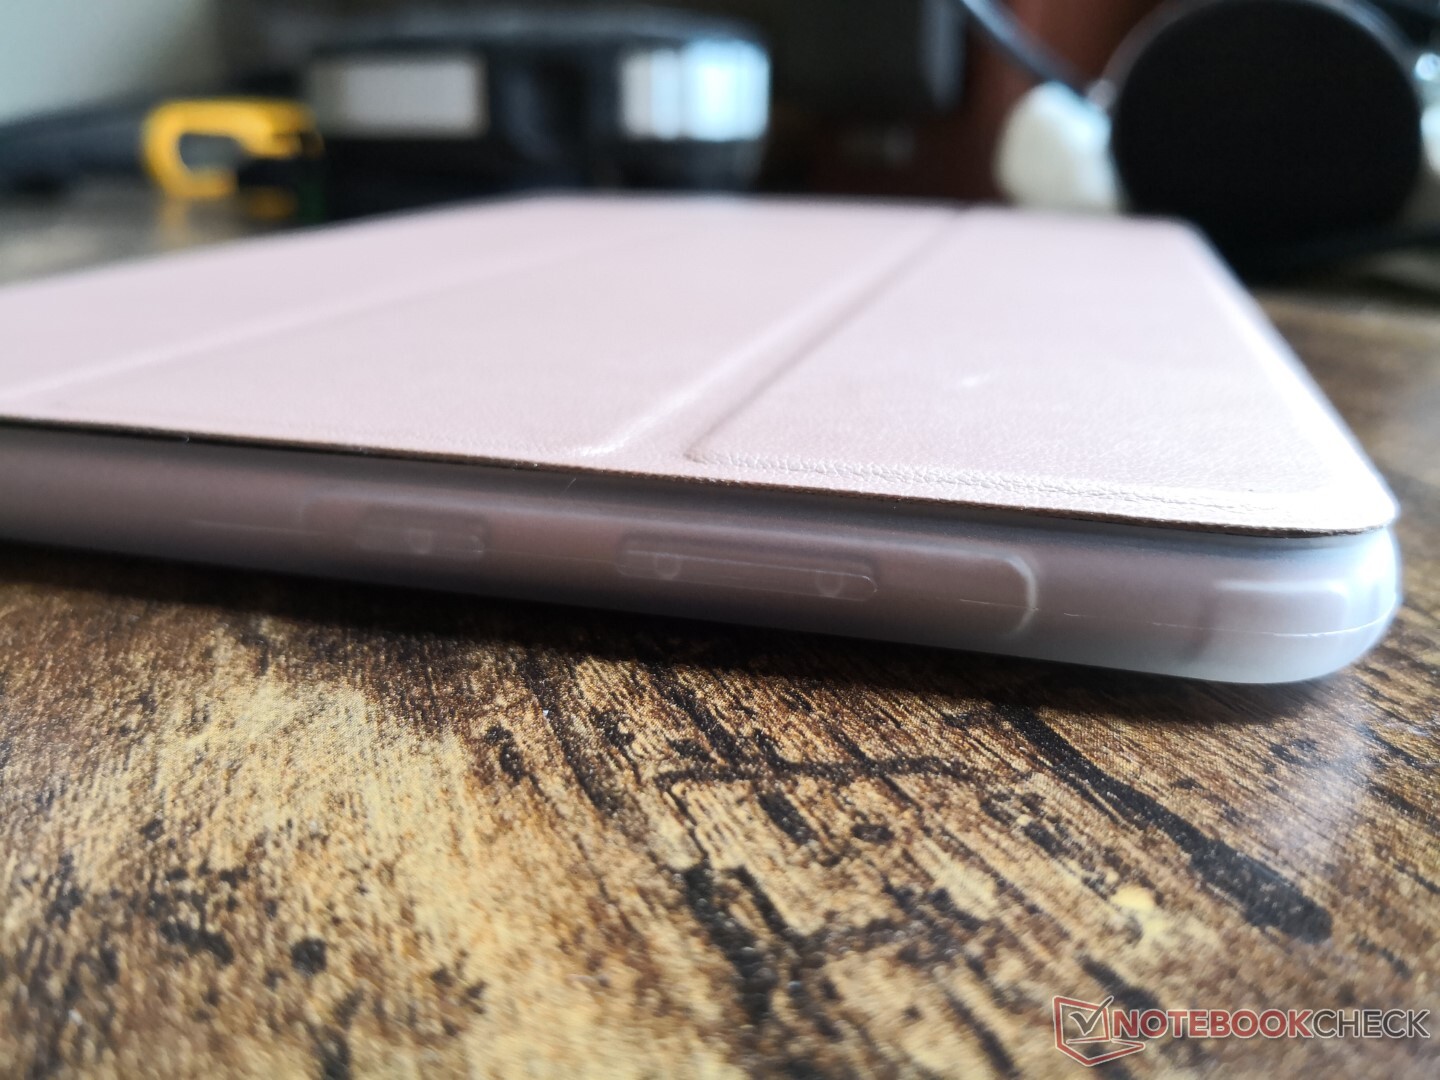
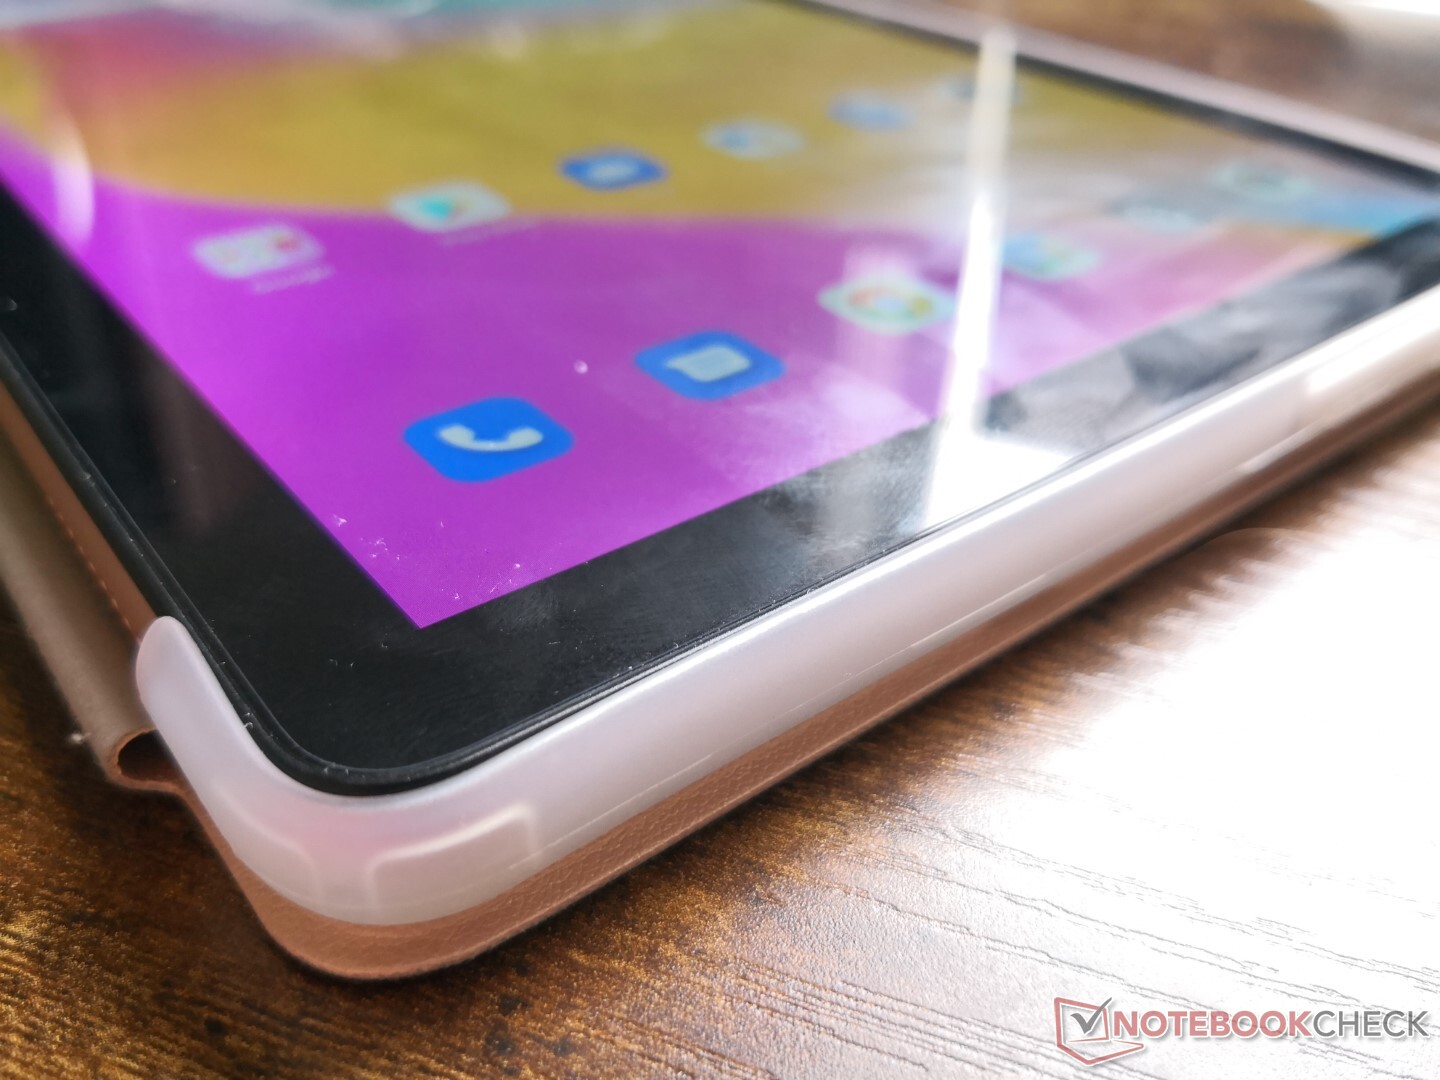
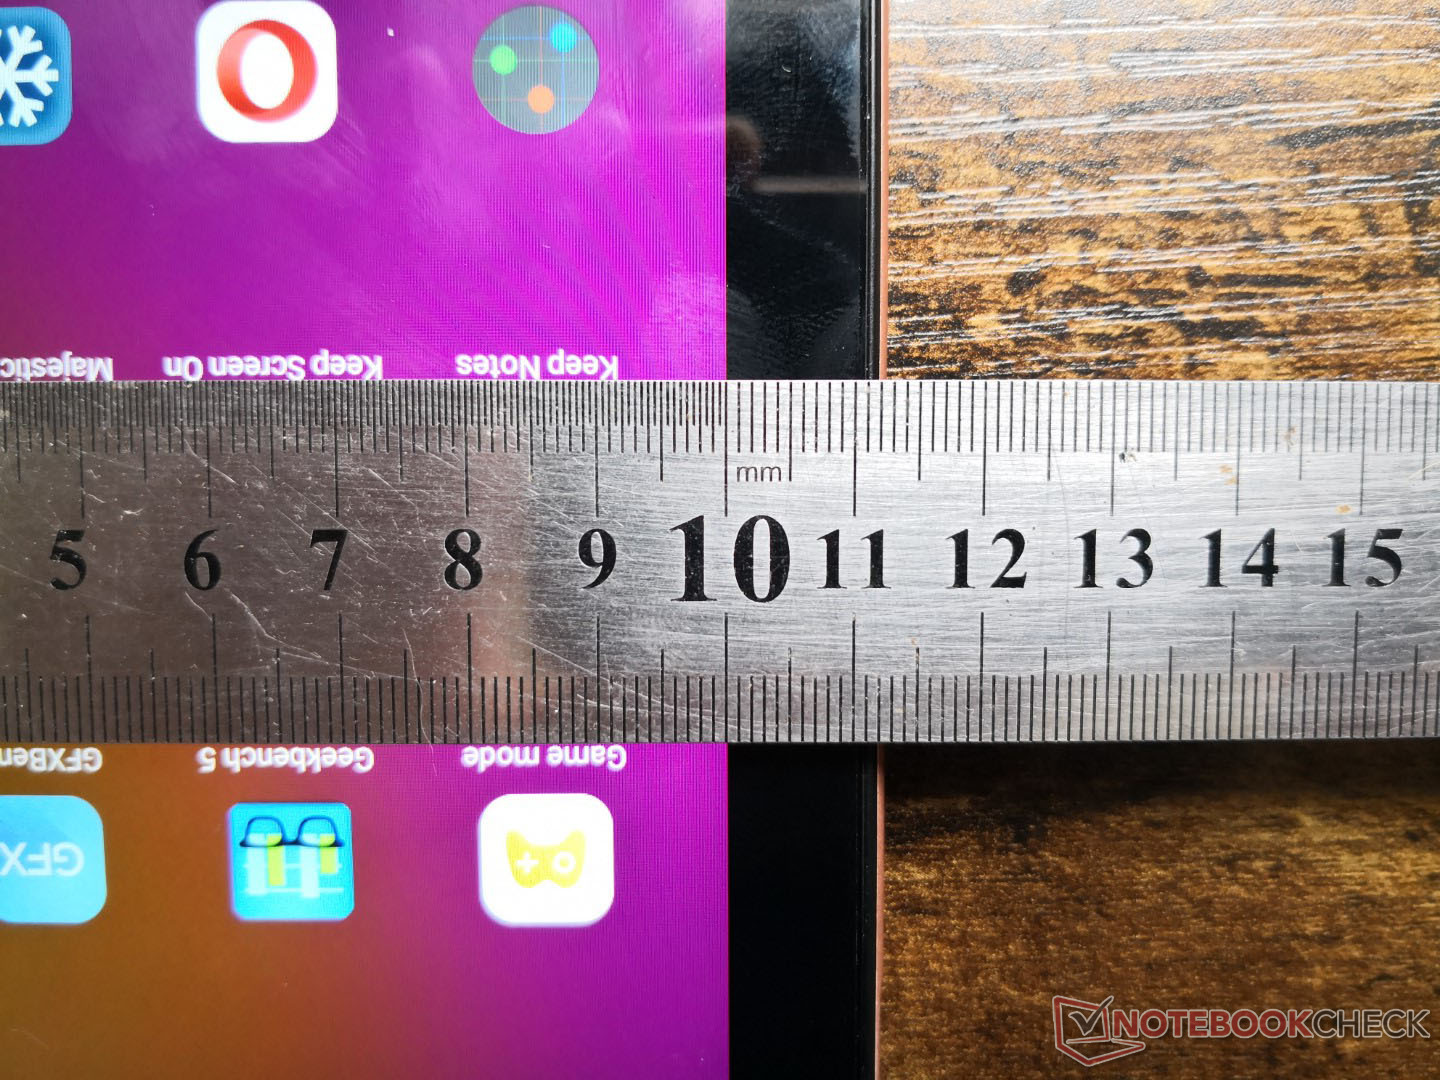
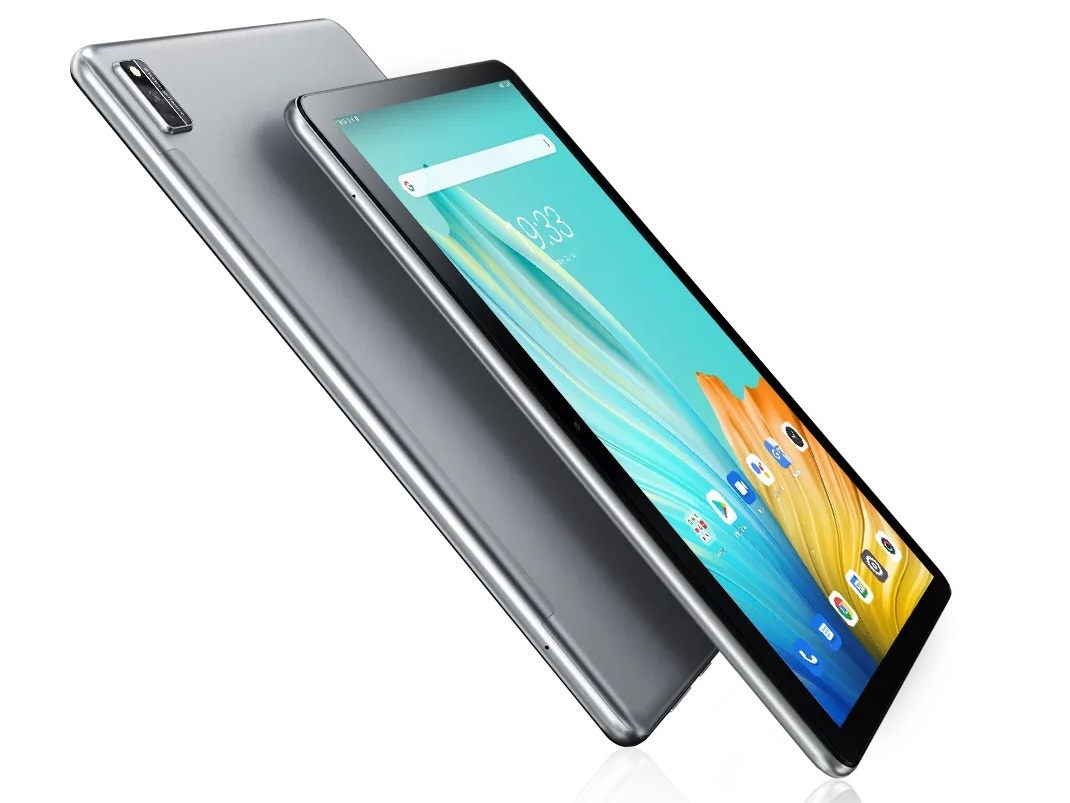
案例 - 坚实,但巨大
这款箱子很结实,感觉比便宜的价格所显示的质量要高。它的金属背板和玻璃正面可以防止扭曲、嘎吱声和凹陷。
值得注意的是,这款平板电脑在其尺寸级别中是比较重的。我们自己的秤显示594克,不包括可拆卸的盖子,明显比制造商声称的523克要重得多。
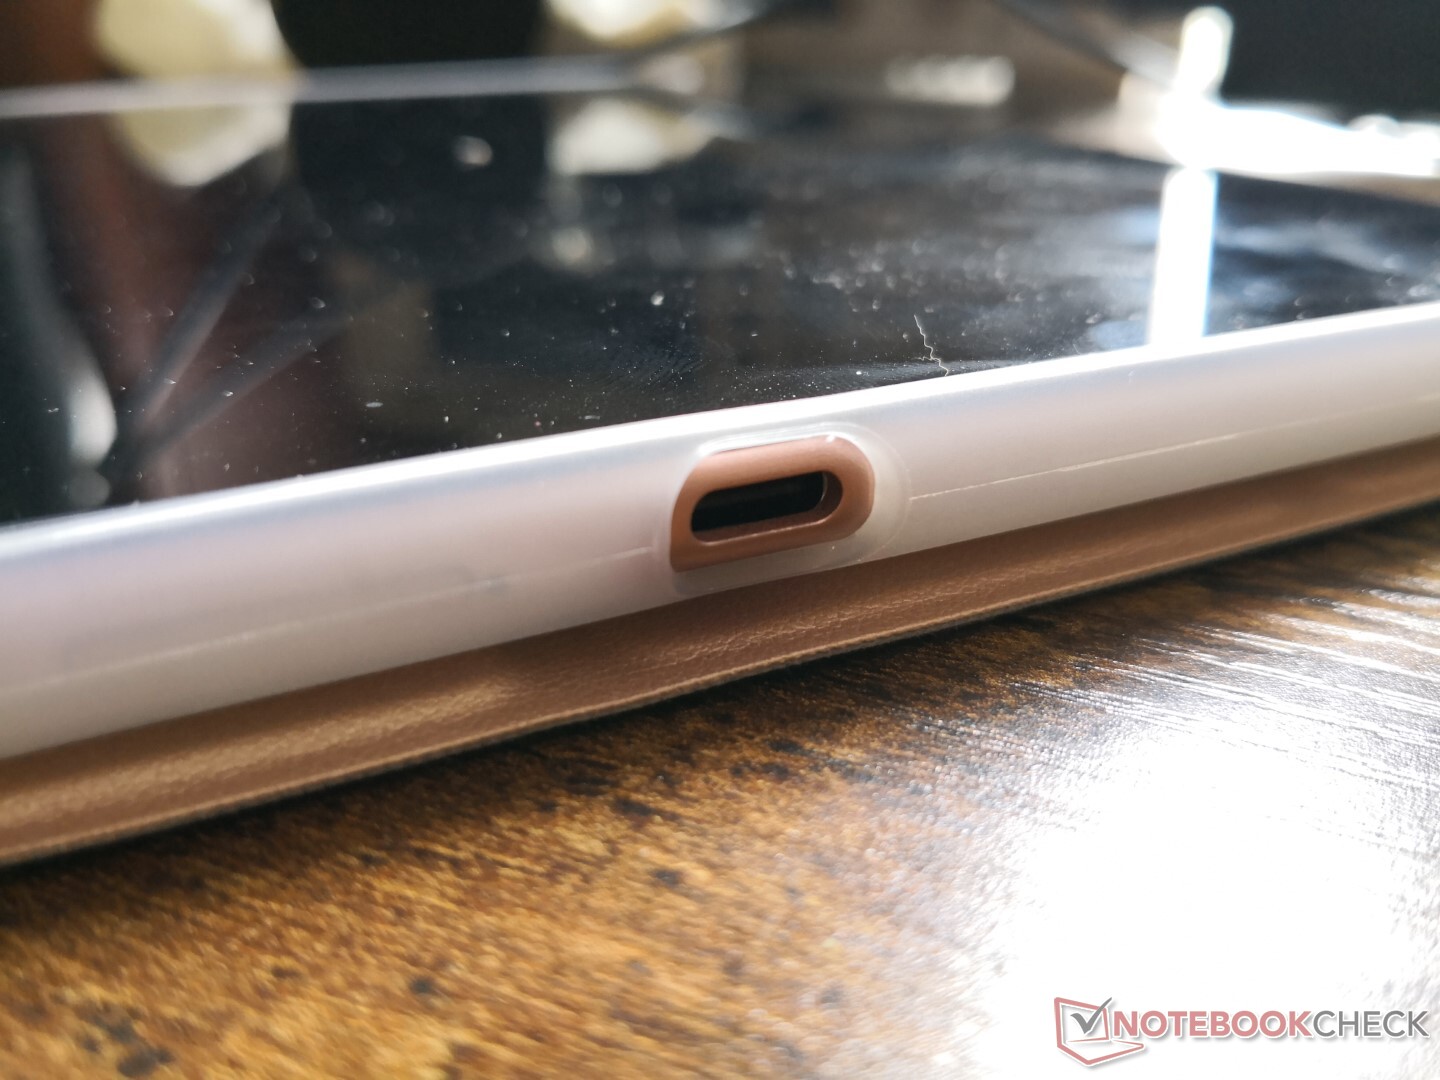
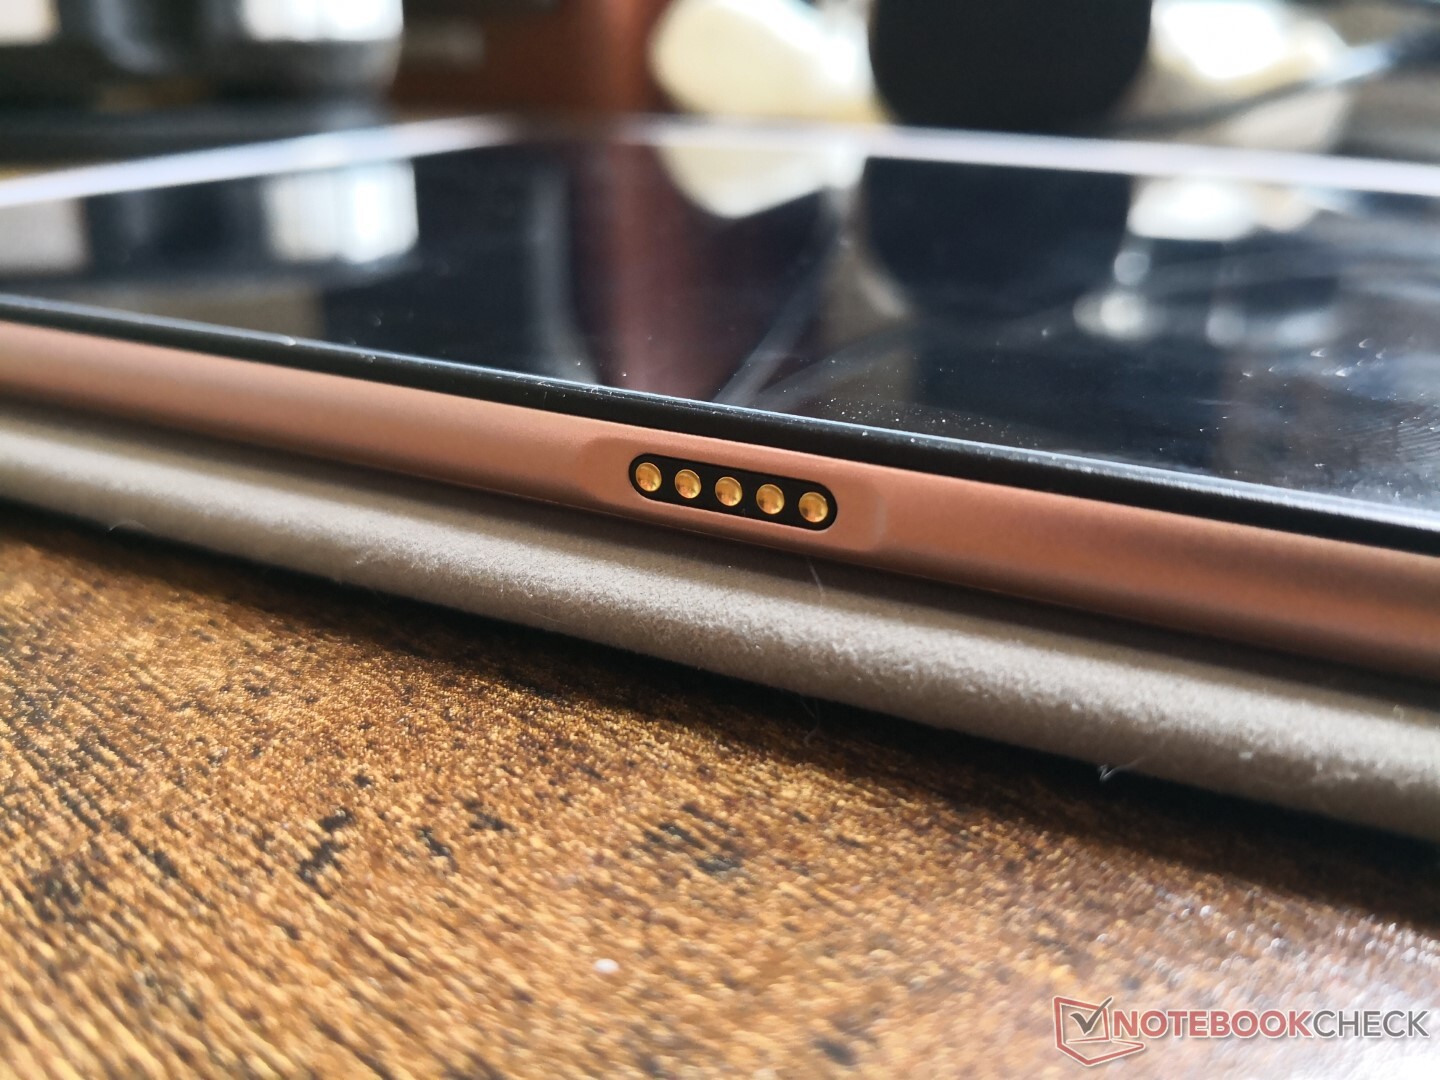
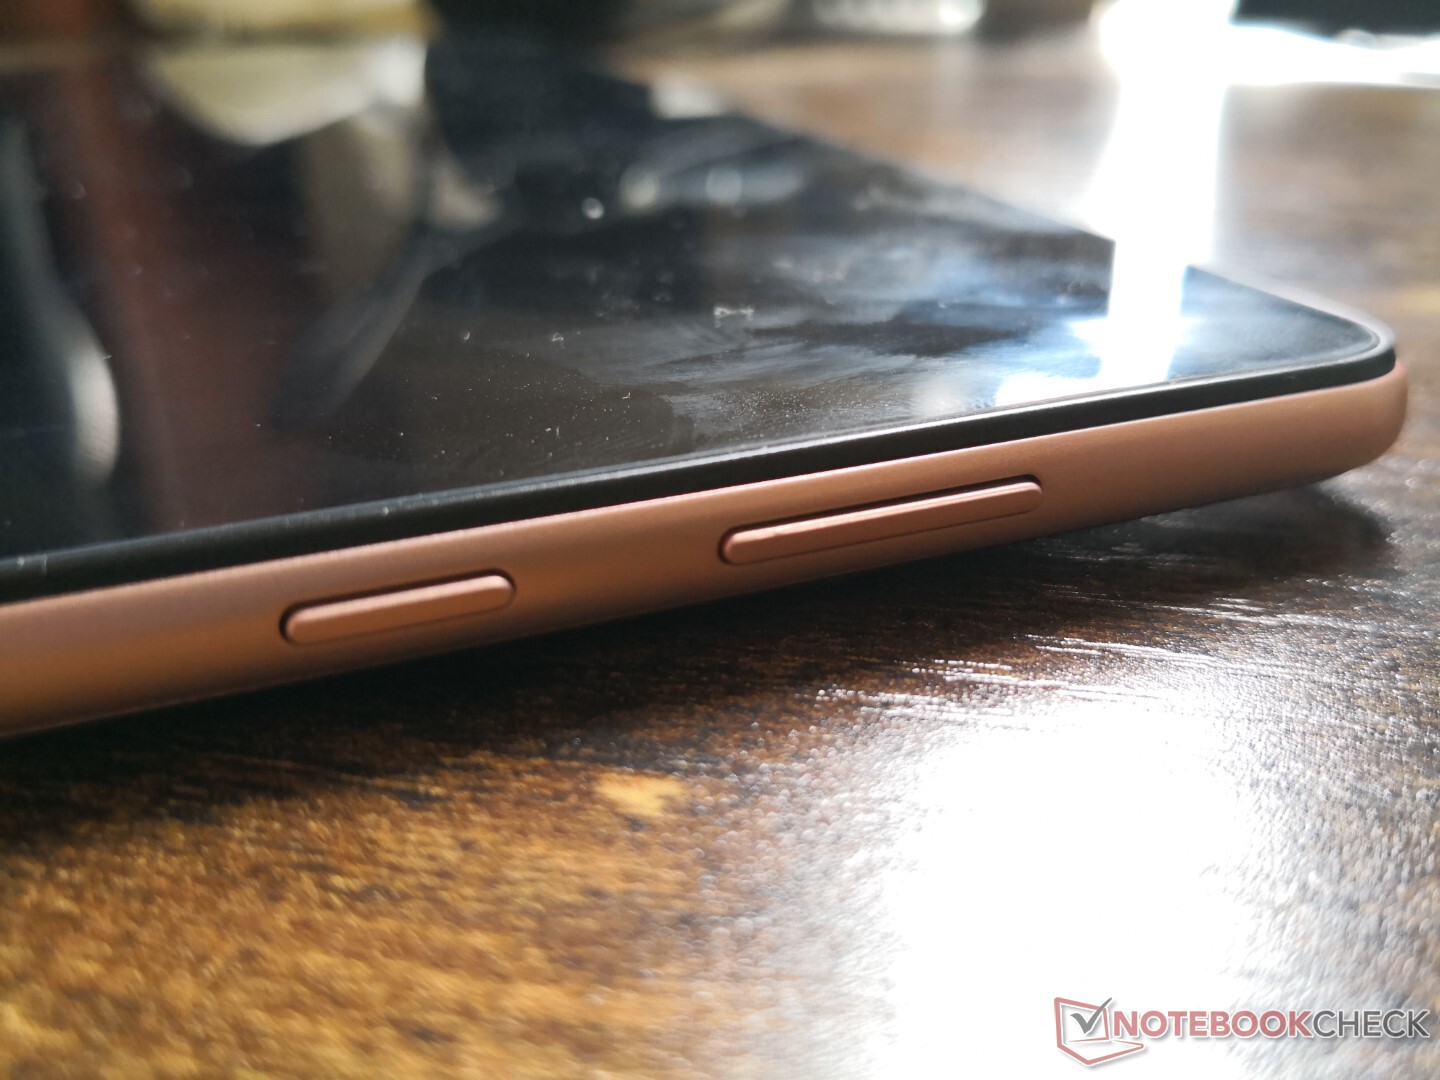
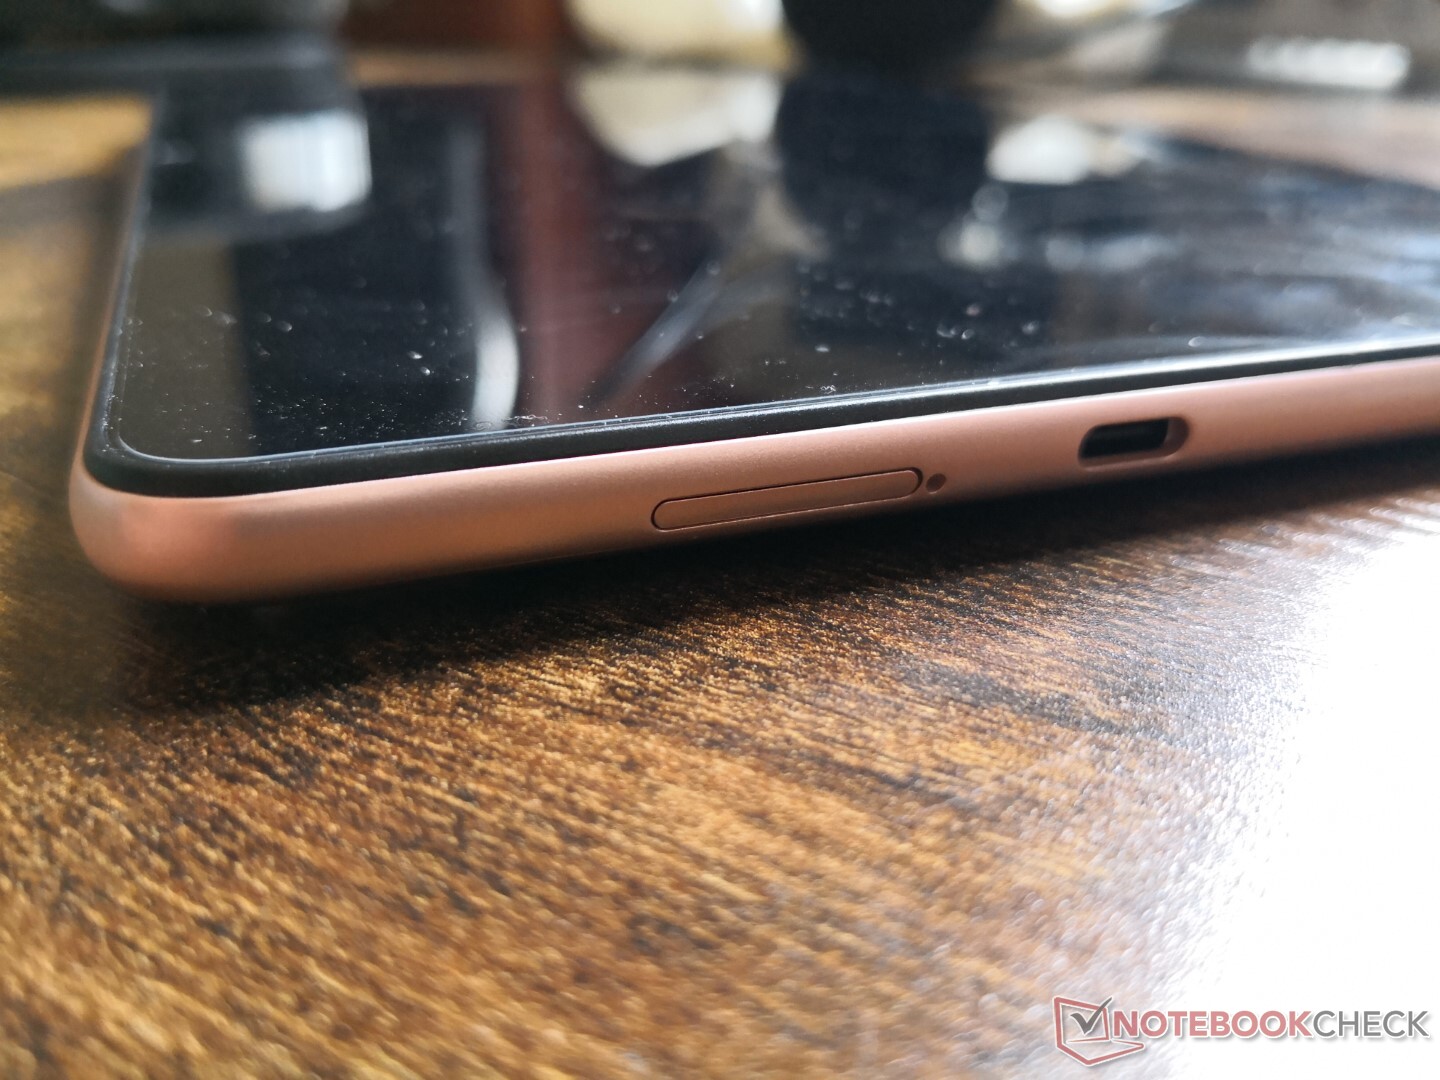
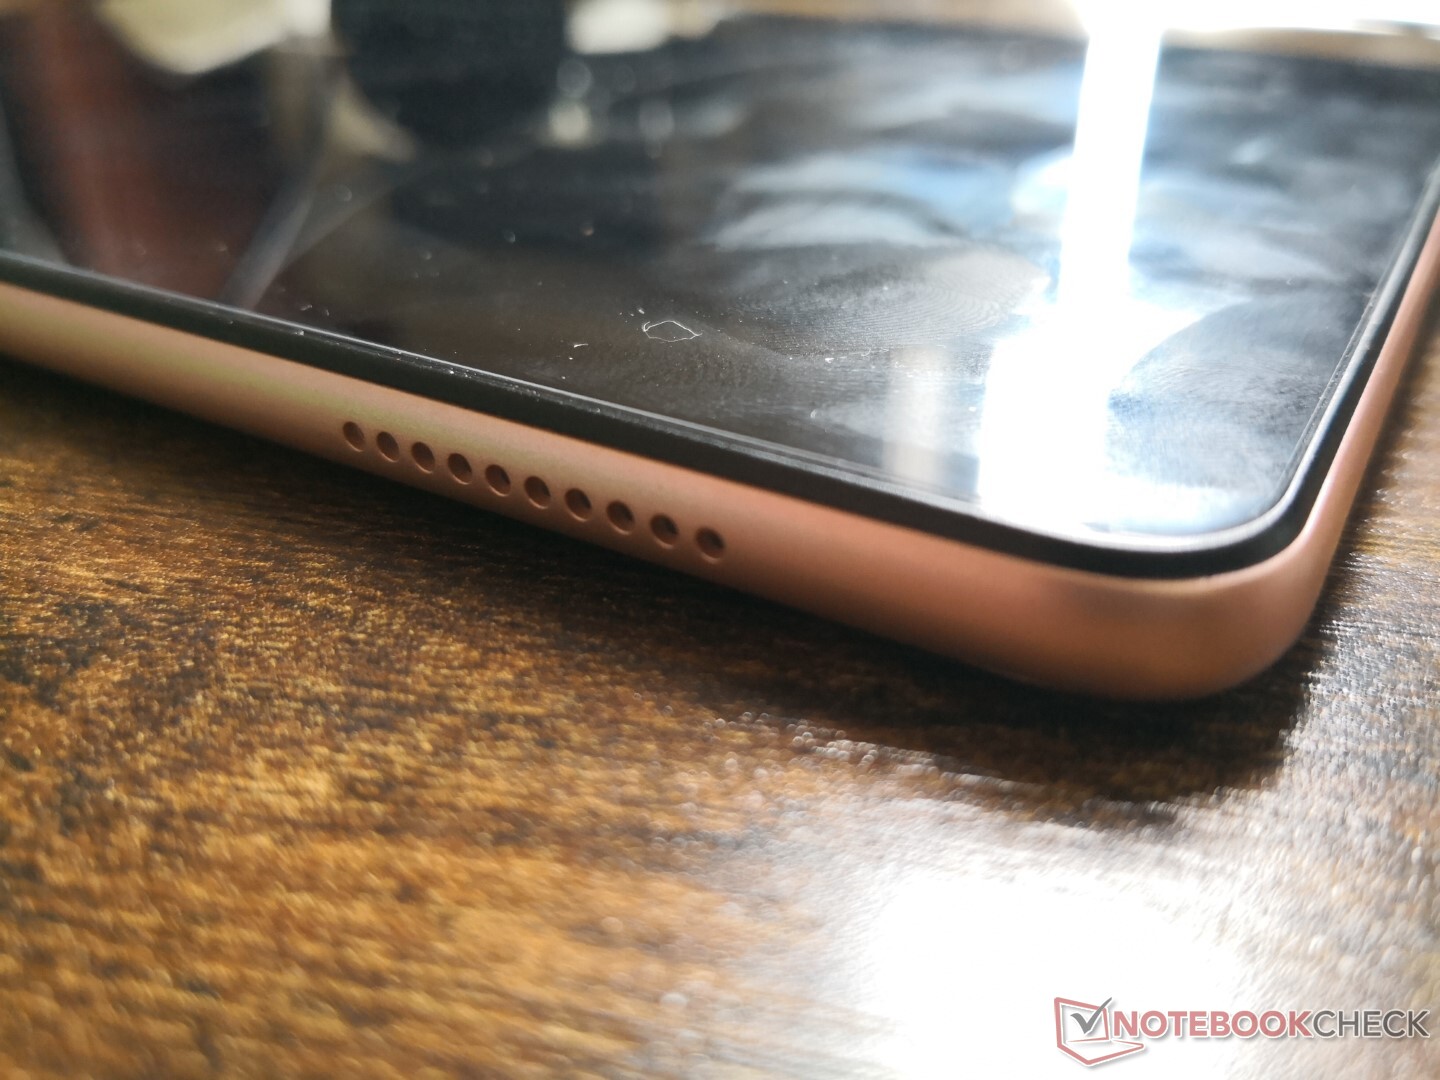
连接性
这款平板电脑集成了USB-C、MicroSD和一个Nano-SIM插槽。USB-C端口用于数据和充电,不支持视频输出。
沟通
传输速率在300Mbps的范围内达到最大值,可实现稳定的视频流。Wi-Fi 6不被支持。
我们将T-Mobile Nano-SIM卡插入平板电脑,只收到边缘网络速度。用户要在购买前,检查该平板电脑是否与当地频段兼容。是否与他们当地的频段兼容。
| Networking | |
| iperf3 transmit AX12 | |
| Huawei MatePad 11 2021 | |
| Apple iPad Air 4 2020 | |
| Medion LifeTab E10802 | |
| Blackview Tab 10 | |
| Alcatel 3T 10 4G 2020 | |
| Allview iPlay 20 | |
| iperf3 receive AX12 | |
| Huawei MatePad 11 2021 | |
| Apple iPad Air 4 2020 | |
| Blackview Tab 10 | |
| Alcatel 3T 10 4G 2020 | |
| Medion LifeTab E10802 | |
| Allview iPlay 20 | |
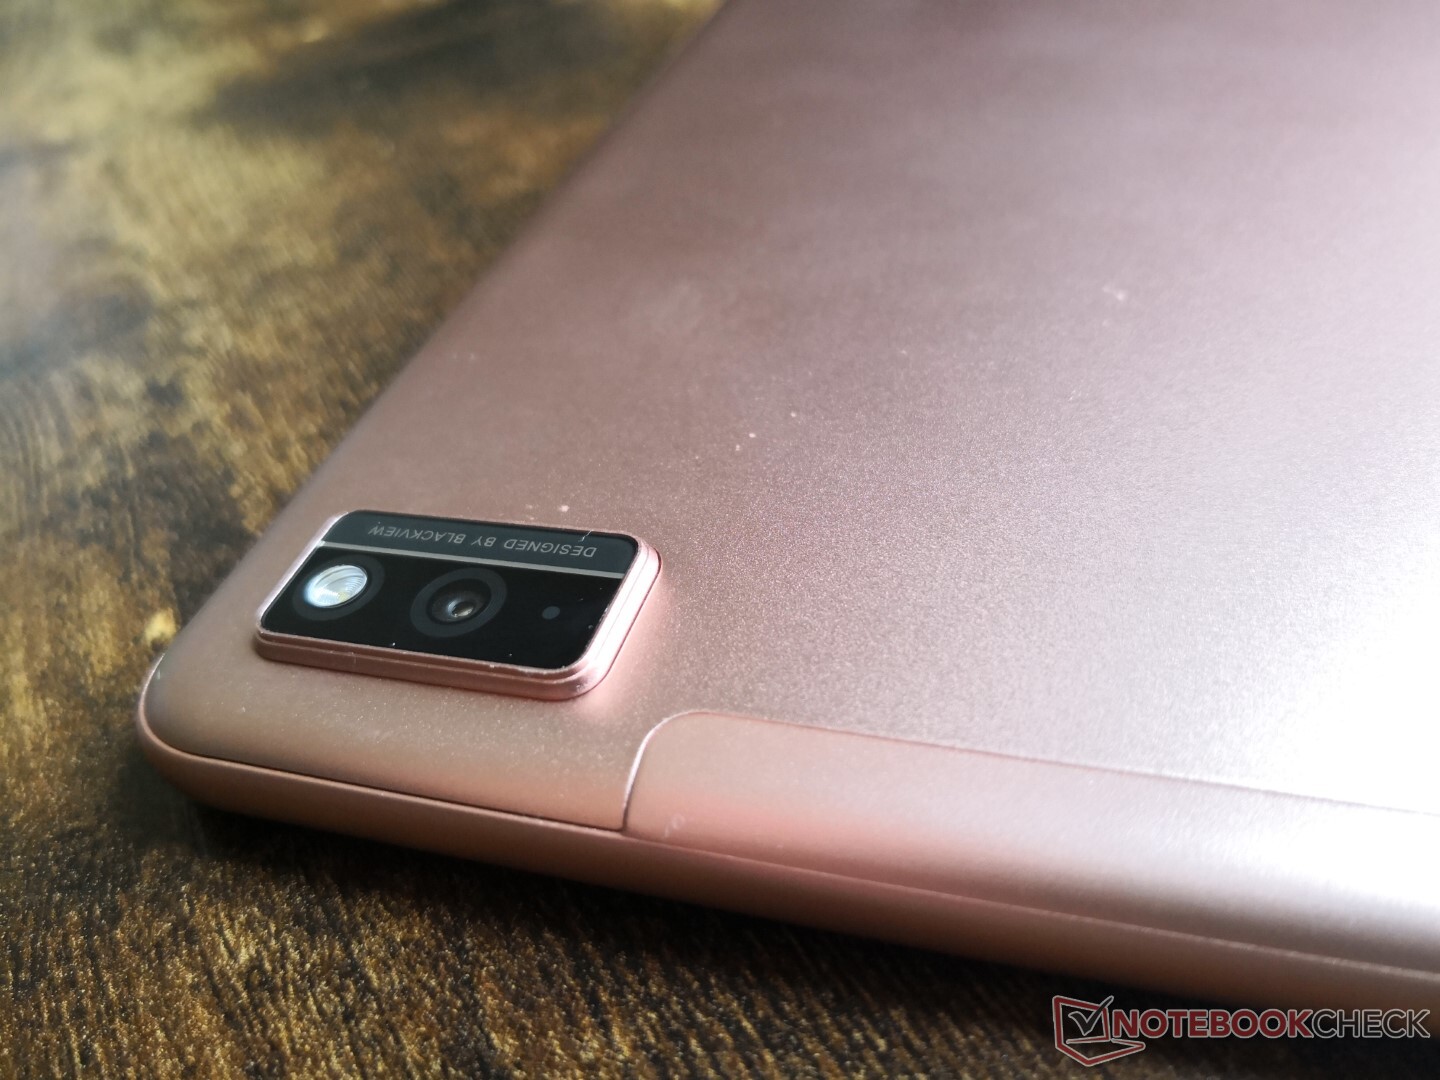
网络摄像头
相机质量比预期的价格更清晰。然而,颜色是不对的,而且温度过高。


配件和保修
零售包装盒包括一个USB-C转USB-A适配器、USB-C耳塞、说明书、18W交流适配器、USB-C转USB-A电缆和可拆卸的对开盒。标准的一年有限制造商保修适用,但对于海外买家来说,要求上述保修可能比较困难。
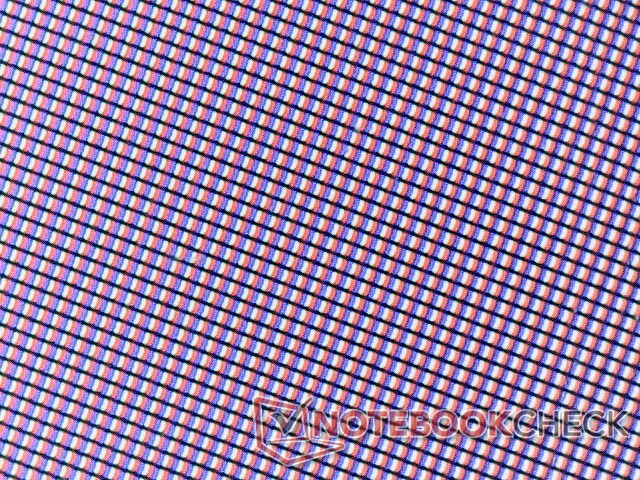
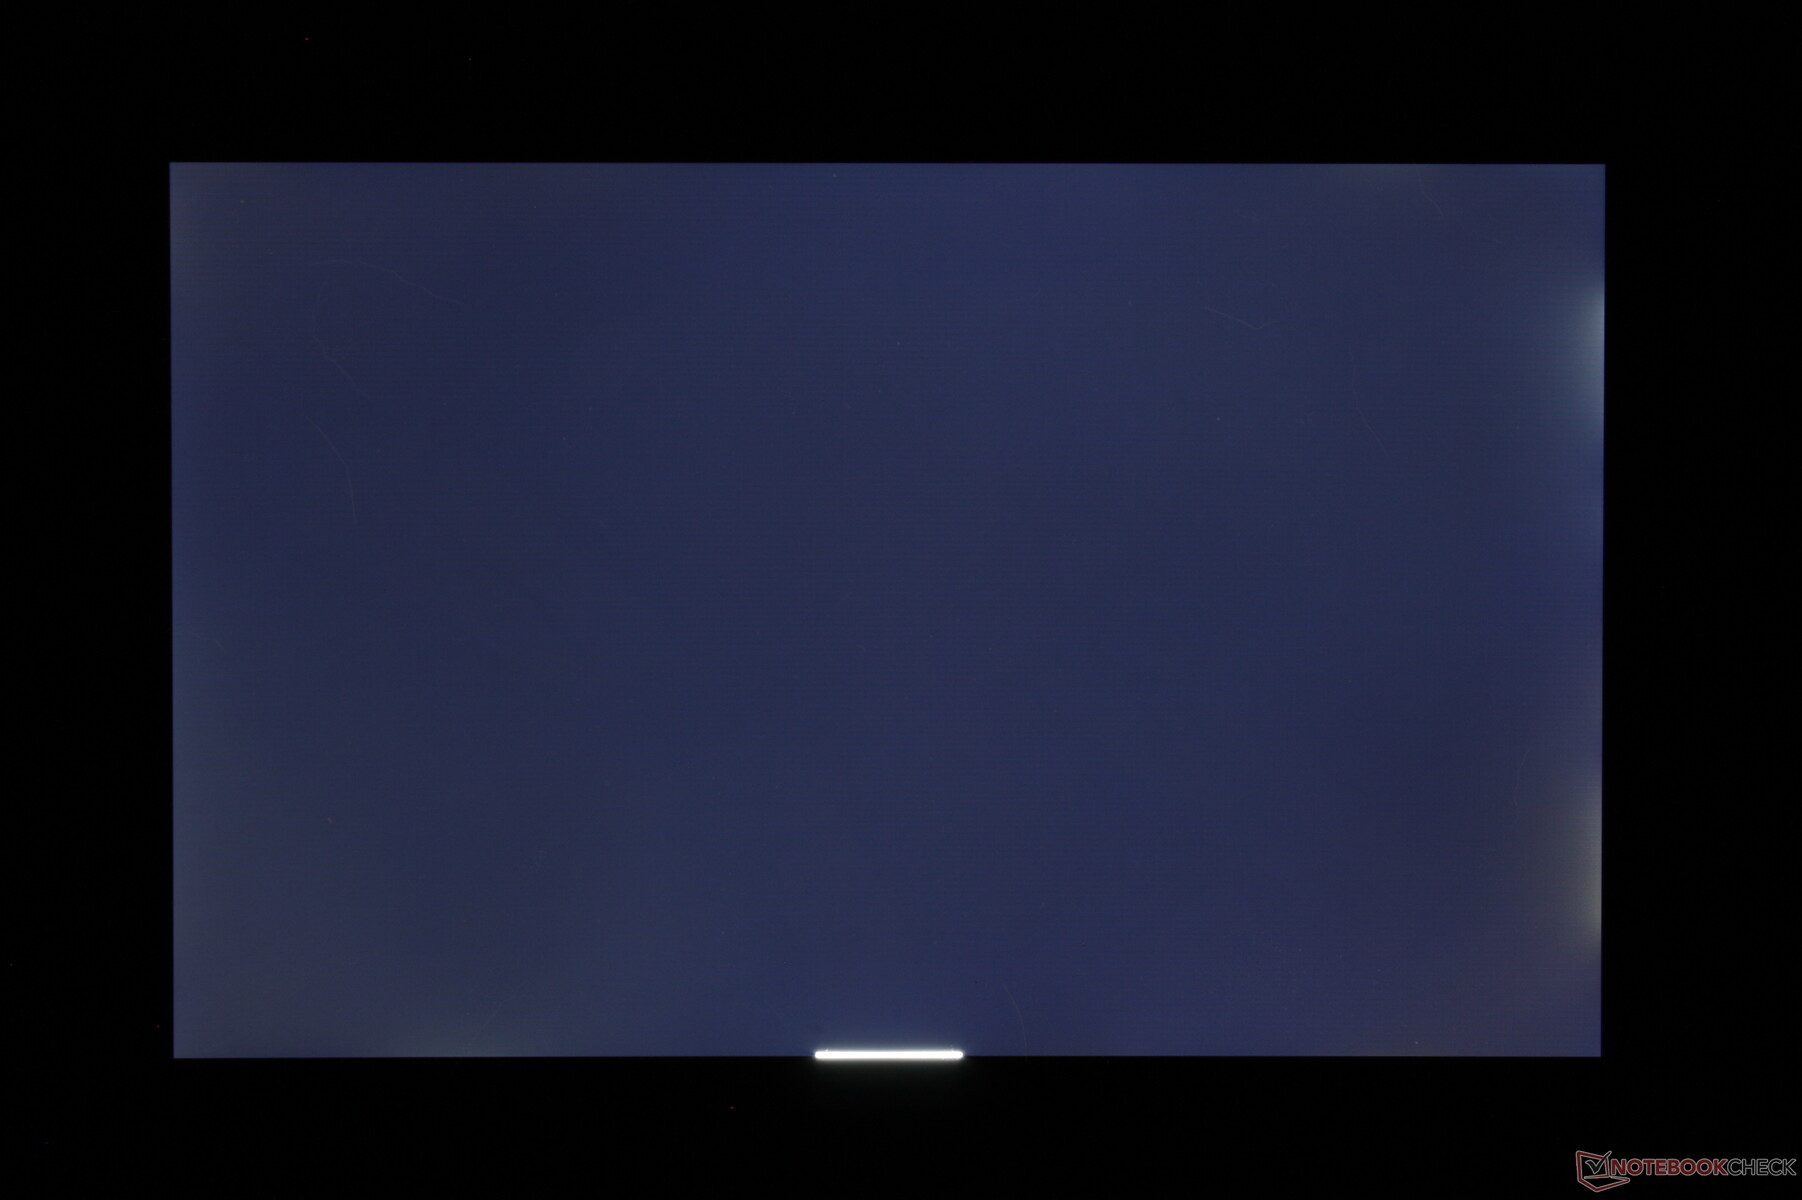
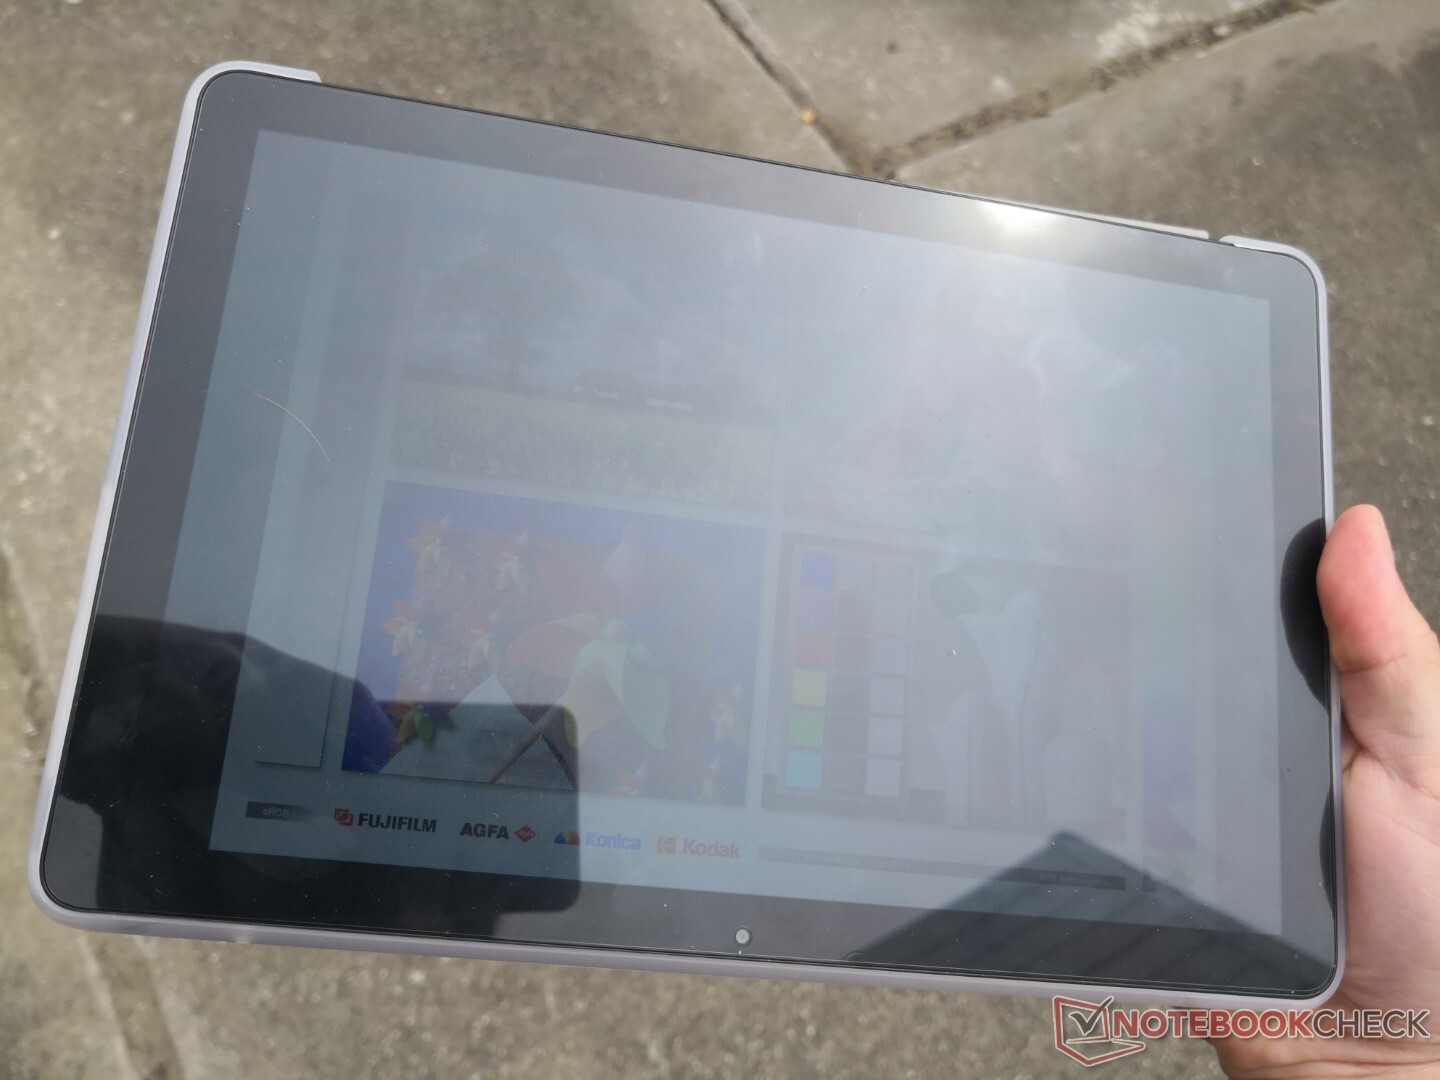
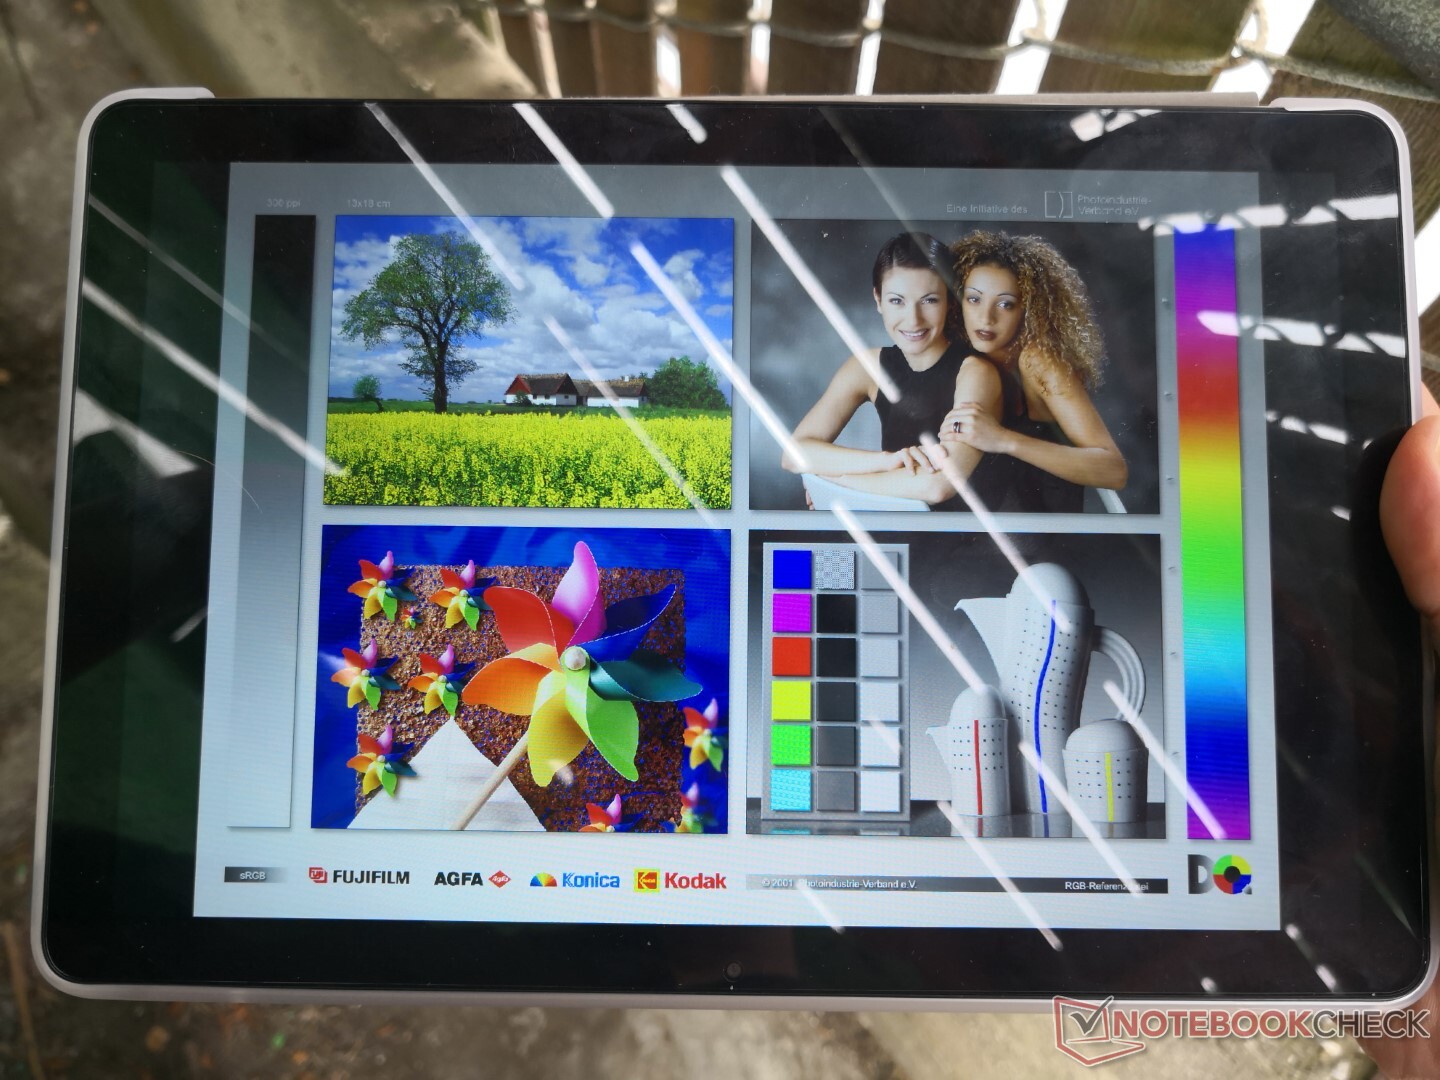
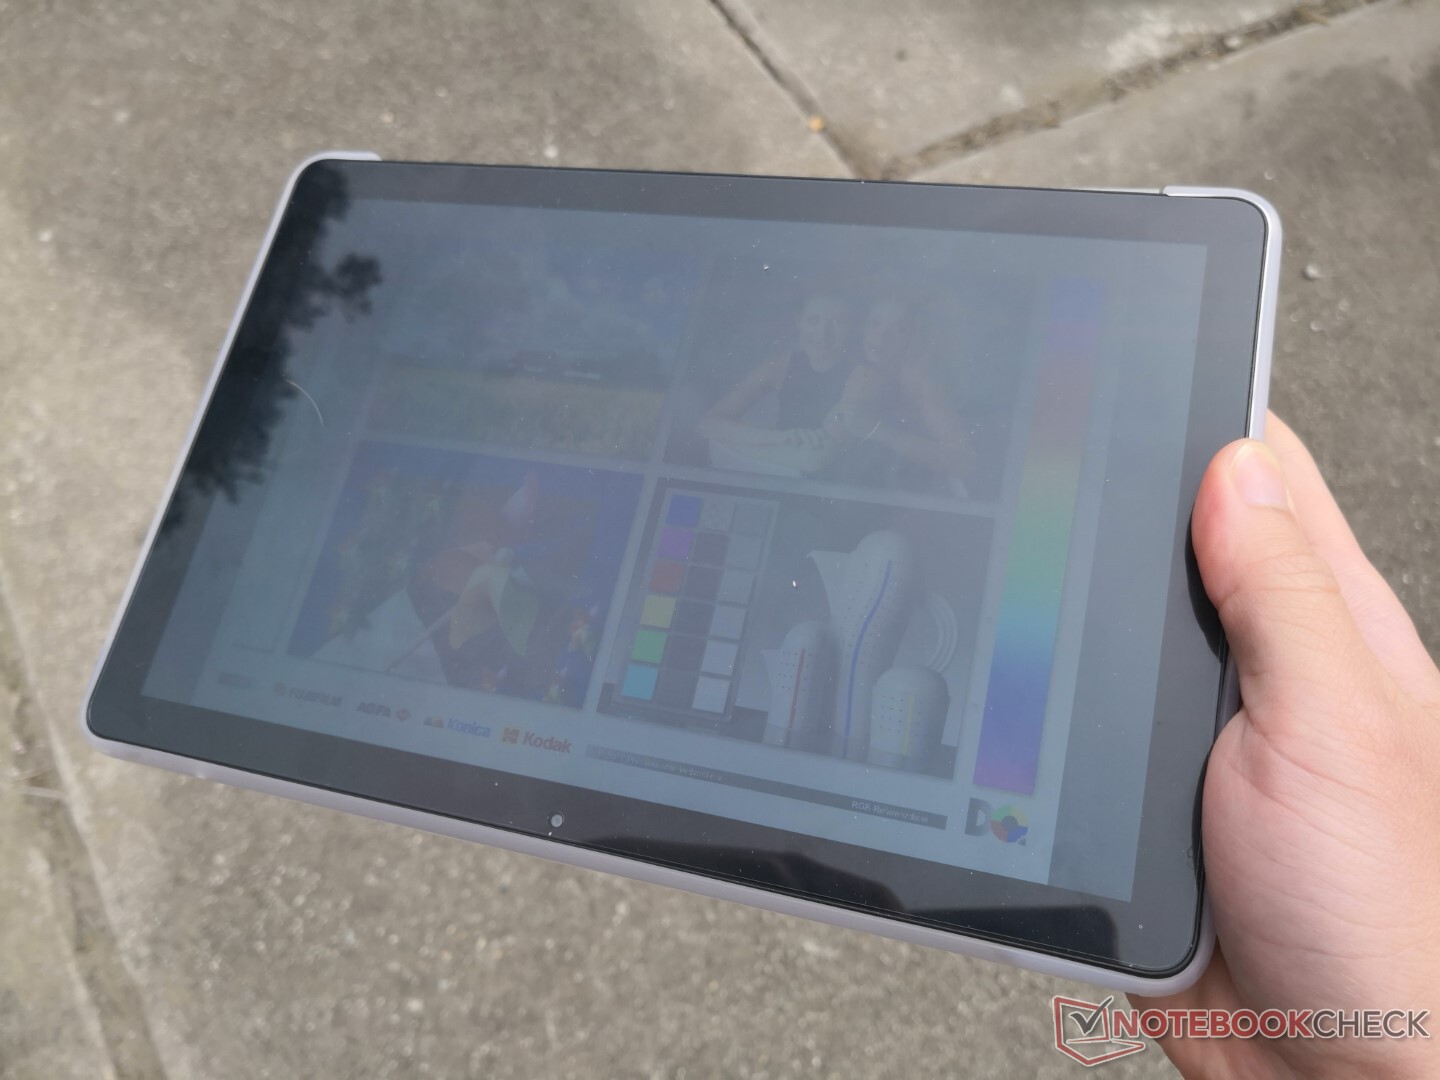
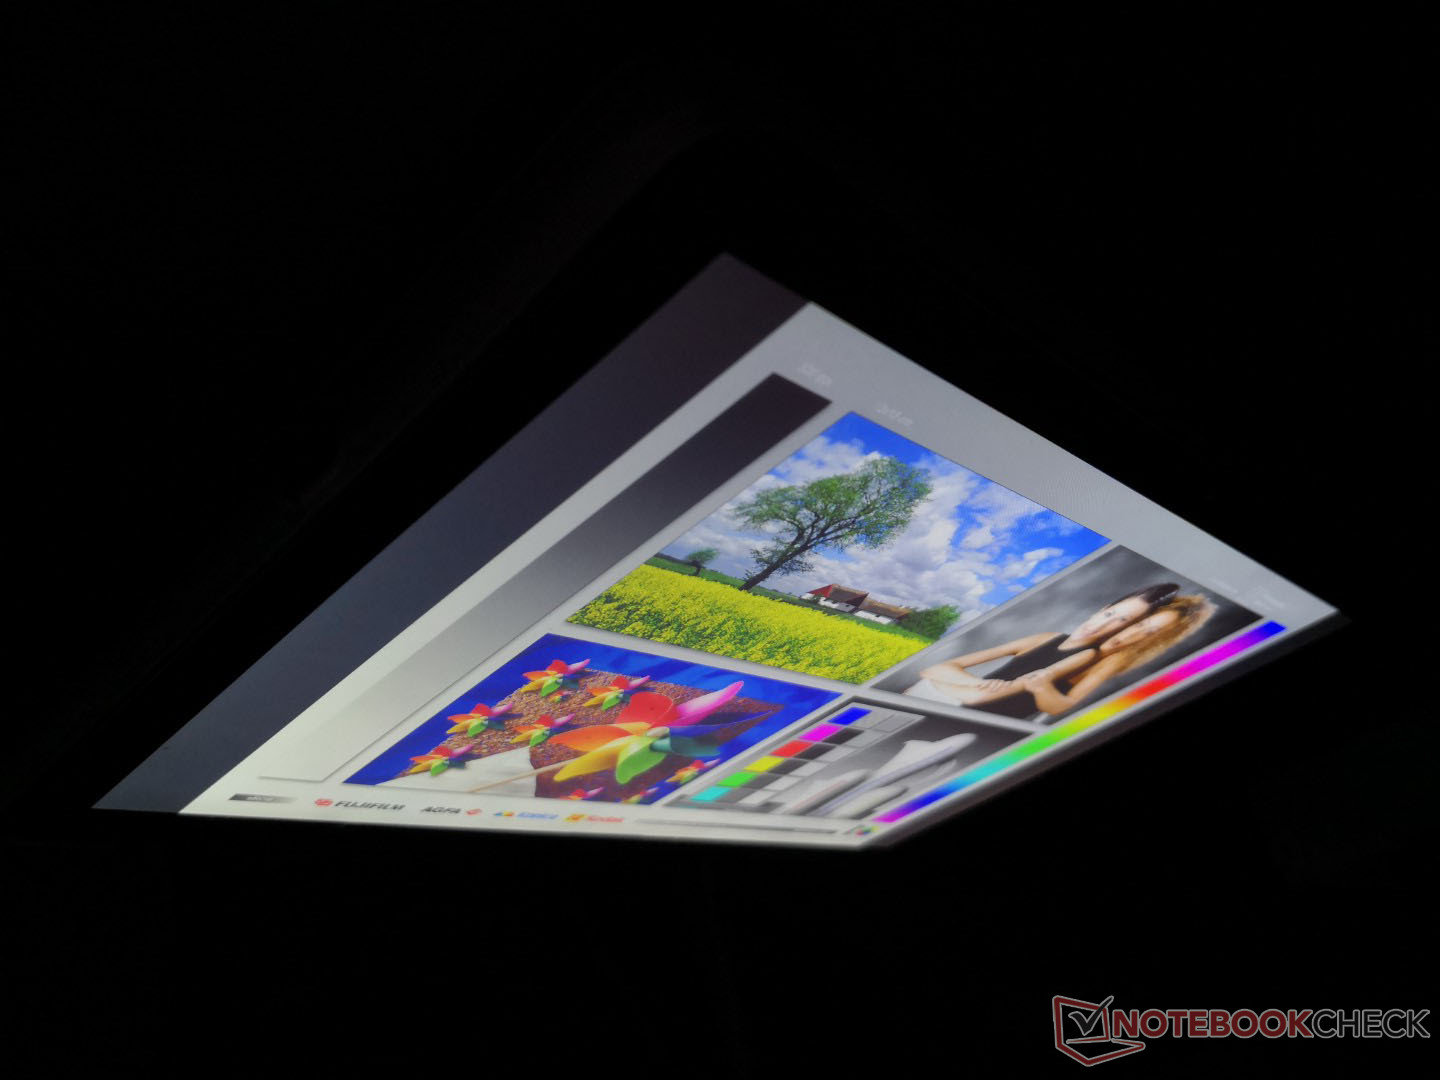
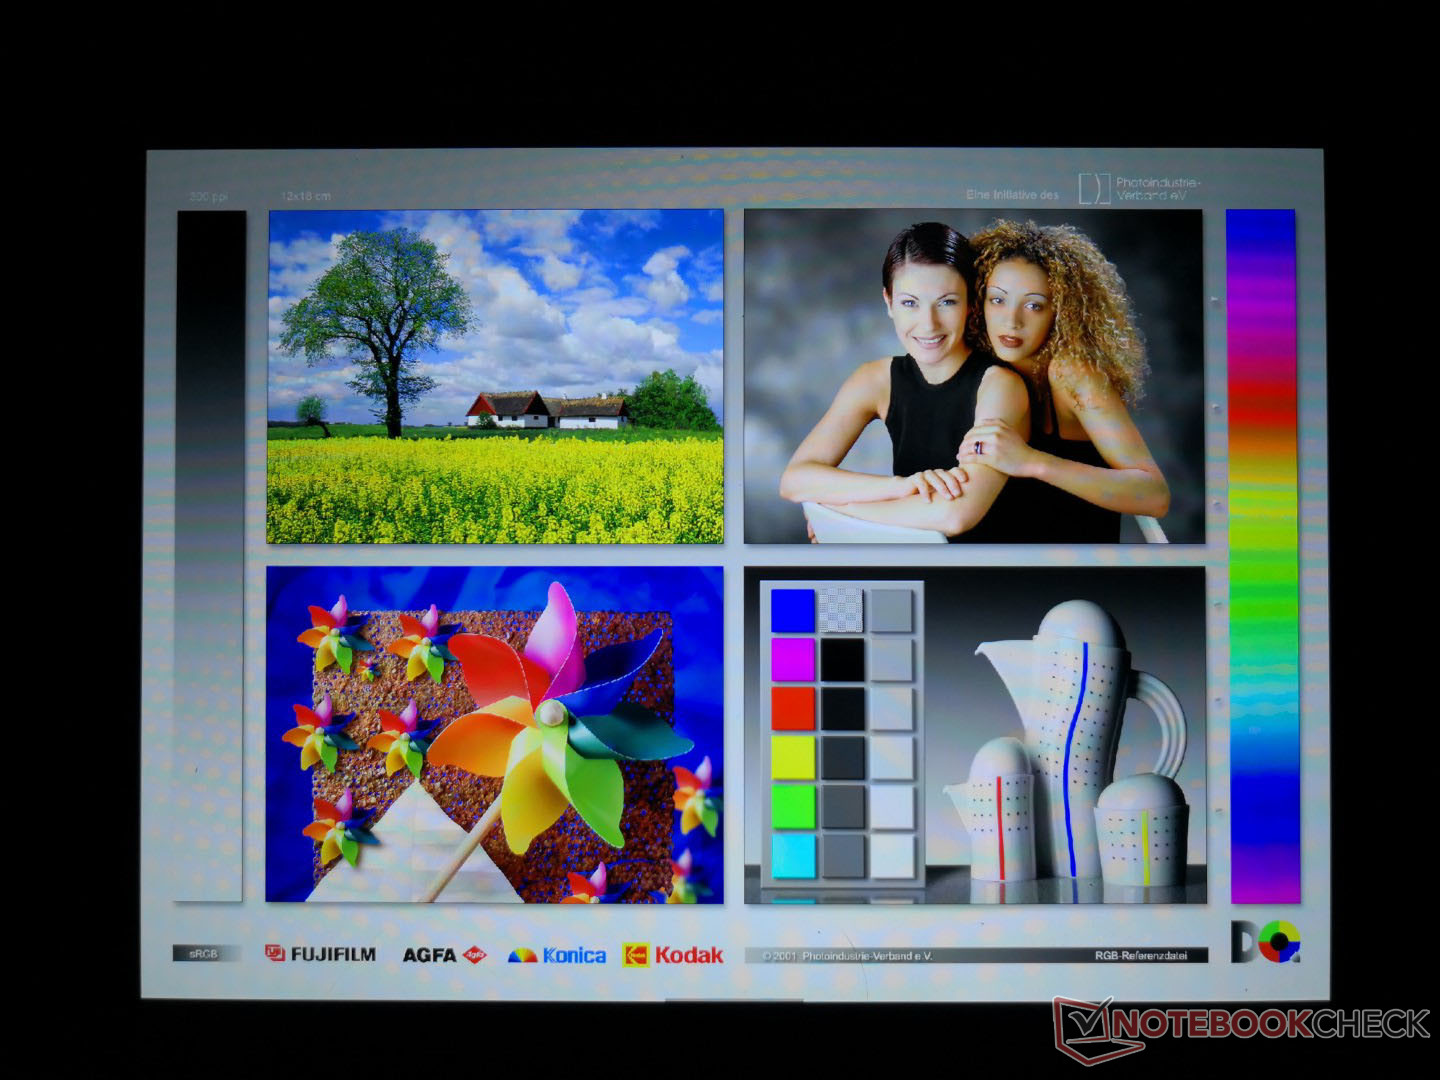
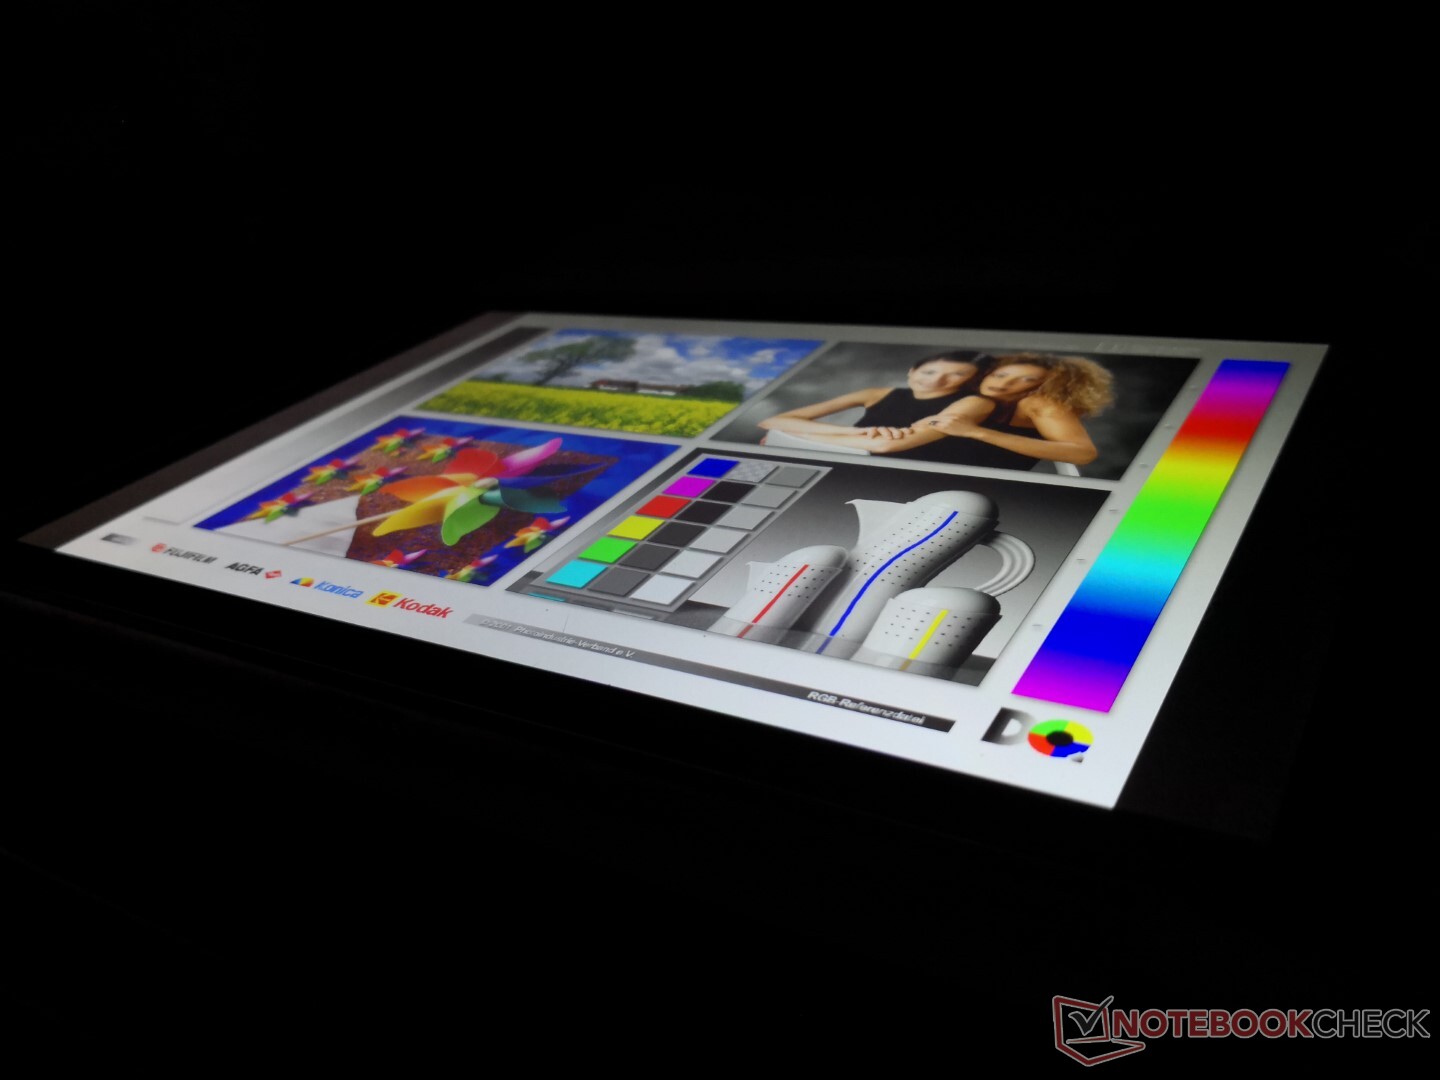
显示屏 - 比预期的更亮
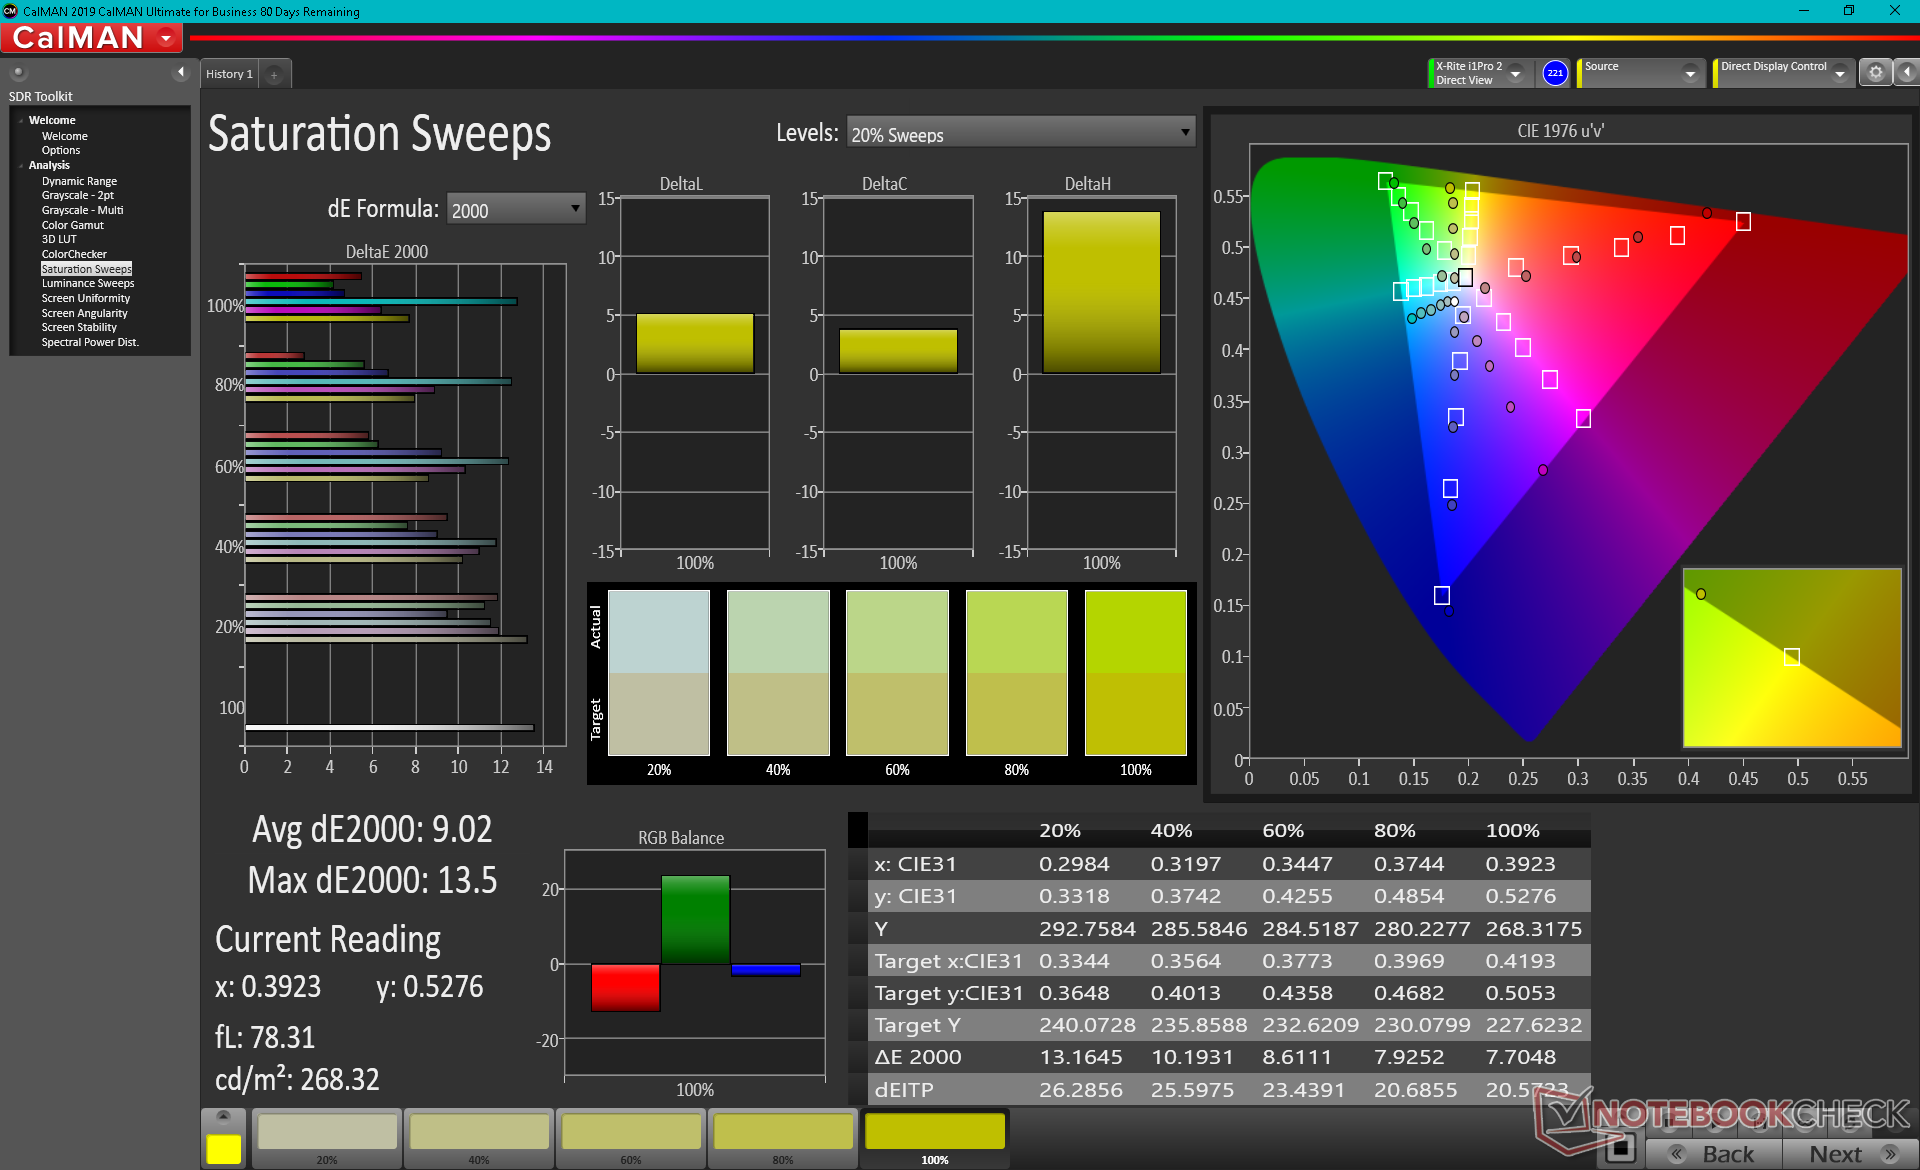
该显示屏最好的一点是它的亮度相对较高,接近500尼特,而联想M10等竞争机型的亮度为300至350尼特。否则,从其黑白响应时间、对比度、色彩,甚至是多点触控能力来看,几乎所有其他方面都是平均水平。该面板难以识别2个手指以上的多点触摸输入,与Allview iPlay 20等其他廉价平板电脑相比,其有限的色域是立即可以看到的。
| |||||||||||||||||||||||||
Brightness Distribution: 89 %
Center on Battery: 467 cd/m²
Contrast: 708:1 (Black: 0.66 cd/m²)
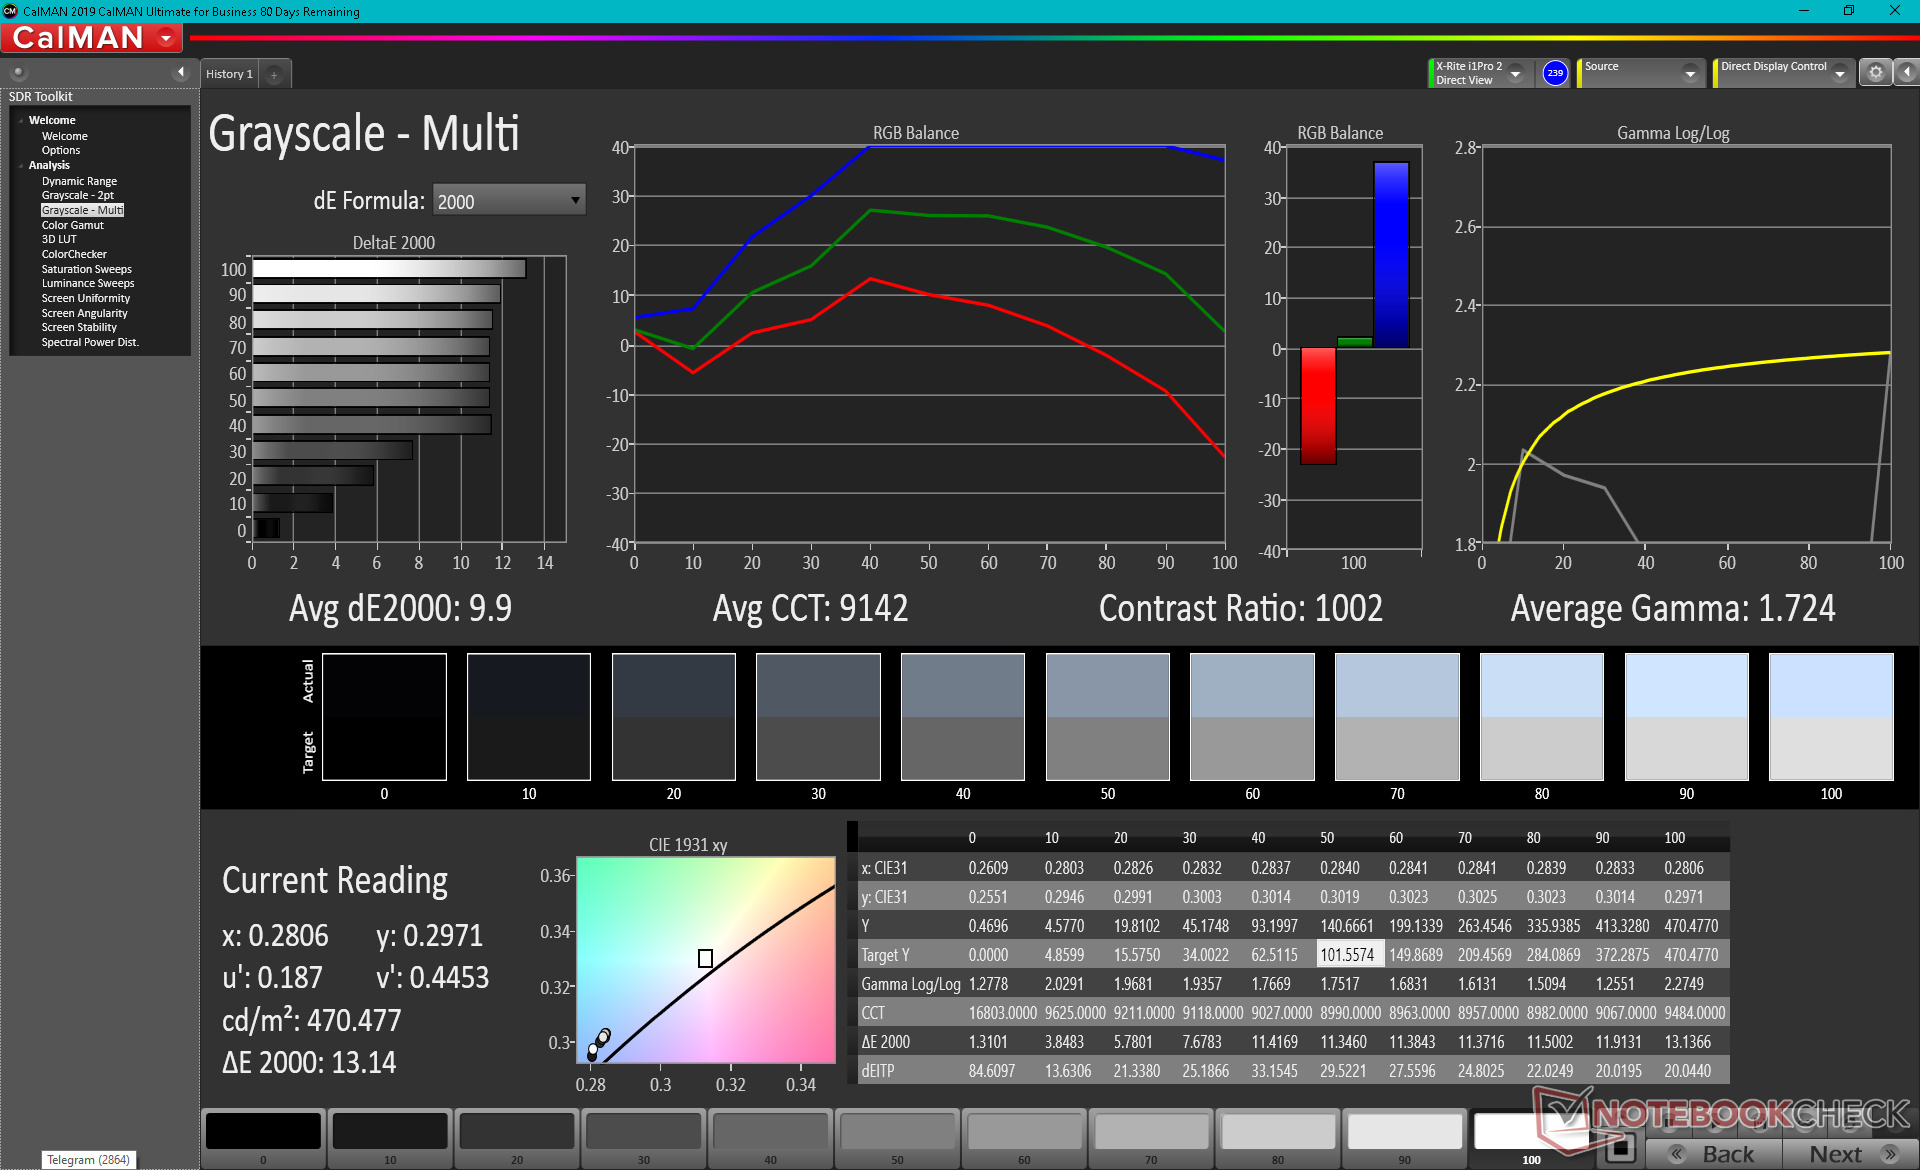
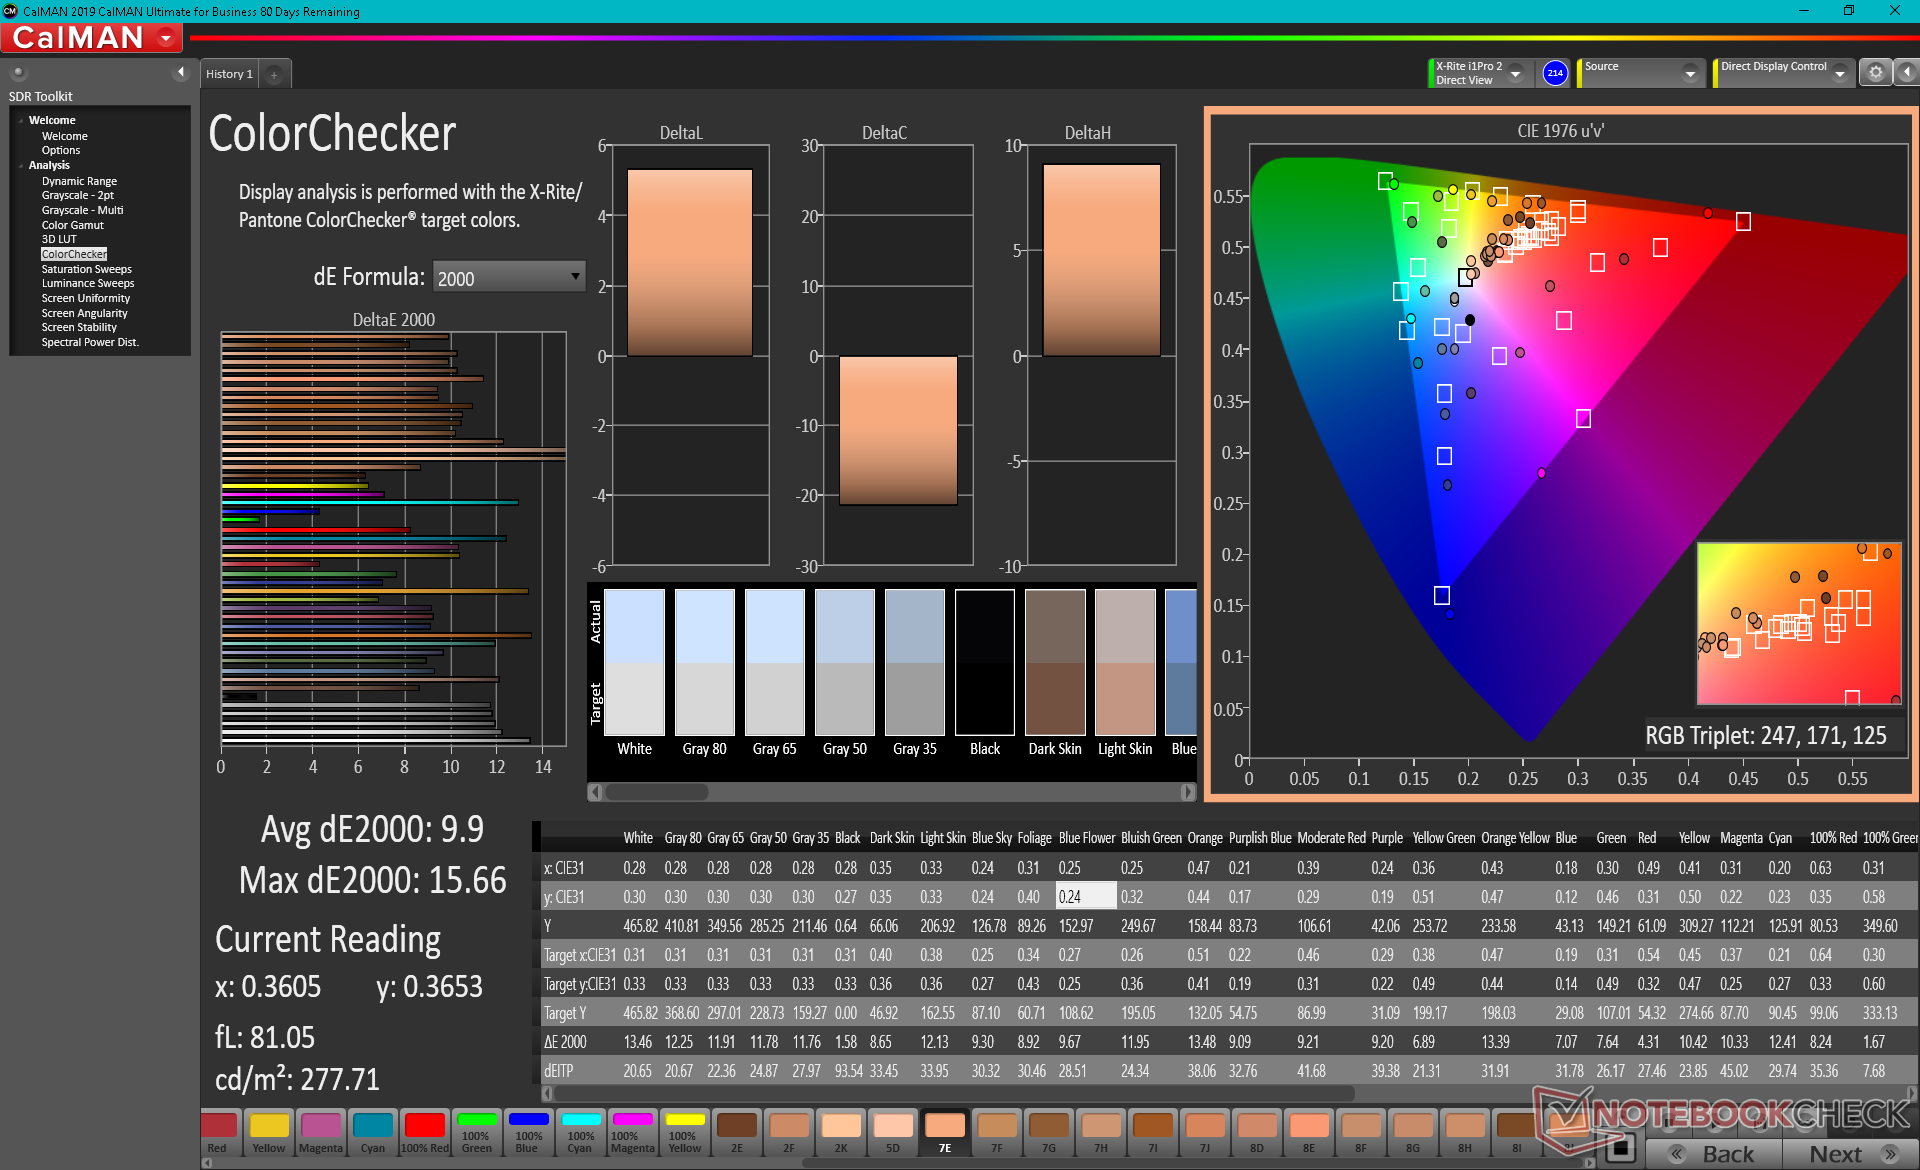
ΔE ColorChecker Calman: 9.9 | ∀{0.5-29.43 Ø4.71}
ΔE Greyscale Calman: 9.9 | ∀{0.09-98 Ø4.96}
Gamma: 1.72
CCT: 9142 K
| Blackview Tab 10 IPS, 10.1", 1920x1080 | Huawei MatePad 11 2021 IPS, 11", 2560x1600 | Alcatel 3T 10 4G 2020 IPS, 10.1", 1280x800 | Medion LifeTab E10802 IPS, 10", 1920x1200 | Allview iPlay 20 IPS, 10.1", 1920x1200 | Apple iPad Air 4 2020 IPS, 10.9", 2360x1640 | |
|---|---|---|---|---|---|---|
| Response Times | 28% | -37% | -85% | 4% | -16% | |
| Response Time Grey 50% / Grey 80% * (ms) | 35.2 ? | 30.4 ? 14% | 50.4 ? -43% | 71.2 -102% | 29.6 ? 16% | 46.8 ? -33% |
| Response Time Black / White * (ms) | 26 ? | 15.2 ? 42% | 34 ? -31% | 43.6 ? -68% | 28 ? -8% | 25.6 ? 2% |
| PWM Frequency (Hz) | ||||||
| Screen | 17% | 46% | 11% | 27% | 49% | |
| Brightness middle (cd/m²) | 467 | 550 18% | 375 -20% | 335 -28% | 396 -15% | 509 9% |
| Brightness (cd/m²) | 445 | 515 16% | 362 -19% | 319 -28% | 389 -13% | 486 9% |
| Brightness Distribution (%) | 89 | 90 1% | 87 -2% | 85 -4% | 90 1% | 93 4% |
| Black Level * (cd/m²) | 0.66 | 0.96 -45% | 0.17 74% | 0.29 56% | 0.44 33% | 0.39 41% |
| Contrast (:1) | 708 | 573 -19% | 2206 212% | 1155 63% | 900 27% | 1305 84% |
| Colorchecker dE 2000 * | 9.9 | 3.3 67% | 5.6 43% | 7.6 23% | 2.39 76% | 1.3 87% |
| Colorchecker dE 2000 max. * | 15.66 | 7.9 50% | 10.6 32% | 14.1 10% | 7.81 50% | 2.8 82% |
| Greyscale dE 2000 * | 9.9 | 4.9 51% | 5 49% | 10 -1% | 4.7 53% | 2.2 78% |
| Gamma | 1.72 128% | 2.24 98% | 2.17 101% | 2.44 90% | 2.24 98% | 2.21 100% |
| CCT | 9142 71% | 7288 89% | 7667 85% | 10228 64% | 7326 89% | 6833 95% |
| Color Space (Percent of AdobeRGB 1998) (%) | 99.3 | |||||
| Total Average (Program / Settings) | 23% /
20% | 5% /
30% | -37% /
-8% | 16% /
22% | 17% /
36% |
* ... smaller is better
色温太冷了,这是大多数经济型显示器的典型特征。因此,平均灰度和彩色DeltaE值非常高,几乎都是10。
Display Response Times
| ↔ Response Time Black to White | ||
|---|---|---|
| 26 ms ... rise ↗ and fall ↘ combined | ↗ 12 ms rise | 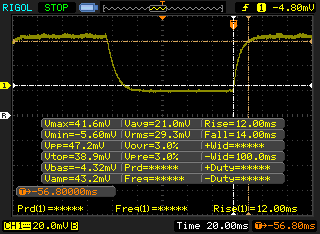 |
| ↘ 14 ms fall | ||
| The screen shows relatively slow response rates in our tests and may be too slow for gamers. In comparison, all tested devices range from 0.1 (minimum) to 240 (maximum) ms. » 63 % of all devices are better. This means that the measured response time is worse than the average of all tested devices (19.8 ms). | ||
| ↔ Response Time 50% Grey to 80% Grey | ||
| 35.2 ms ... rise ↗ and fall ↘ combined | ↗ 18 ms rise | 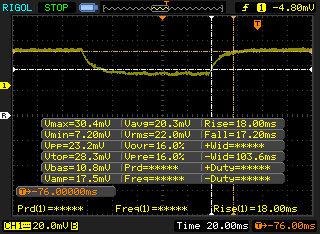 |
| ↘ 17.2 ms fall | ||
| The screen shows slow response rates in our tests and will be unsatisfactory for gamers. In comparison, all tested devices range from 0.165 (minimum) to 636 (maximum) ms. » 49 % of all devices are better. This means that the measured response time is worse than the average of all tested devices (31 ms). | ||
Screen Flickering / PWM (Pulse-Width Modulation)
| Screen flickering / PWM not detected | 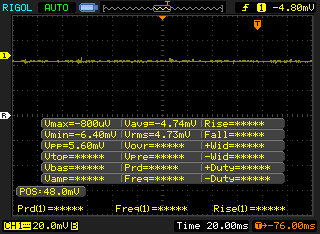 | ||
In comparison: 52 % of all tested devices do not use PWM to dim the display. If PWM was detected, an average of 7757 (minimum: 5 - maximum: 343500) Hz was measured. | |||
业绩 - 蜗牛的步伐
由于慢速的联发科SoC,整体性能远不流畅。简单的动作,如浏览网页或在主屏幕上导航,会导致频繁的跳帧,错过输入,明显的延迟,以及加载时间,所有这些加起来有时会让人感到沮丧。游戏性能同样令人失望,即使是预装的Asphalt Nitro游戏也很难保持20至30帧。
PCMark for Android: Work 3.x
GFXBench: on screen Aztec Ruins High Tier Onscreen | 2560x1440 Aztec Ruins High Tier Offscreen | on screen Aztec Ruins Normal Tier Onscreen | 1920x1080 Aztec Ruins Normal Tier Offscreen
3DMark: 2560x1440 Sling Shot Extreme (ES 3.1) Unlimited Physics | 2560x1440 Sling Shot Extreme (ES 3.1) Unlimited Graphics | 2560x1440 Sling Shot Extreme (ES 3.1) Unlimited
WebXPRT 3: Overall
| Geekbench 5.5 / Single-Core | |
| Apple iPad Air 4 2020 | |
| Huawei MatePad 11 2021 | |
| Huawei MatePad 10.4 | |
| Samsung Galaxy Tab S6 Lite | |
| Samsung Galaxy Tab A7 10.4 (2020) | |
| Amazon Fire HD 10 Plus 2021 | |
| Medion LifeTab E10802 | |
| Average Mediatek MT8768 (135 - 179, n=4) | |
| Allview iPlay 20 | |
| Blackview Tab 10 | |
| Alcatel 3T 10 4G 2020 | |
| Geekbench 5.5 / Multi-Core | |
| Apple iPad Air 4 2020 | |
| Huawei MatePad 11 2021 | |
| Huawei MatePad 10.4 | |
| Samsung Galaxy Tab A7 10.4 (2020) | |
| Amazon Fire HD 10 Plus 2021 | |
| Samsung Galaxy Tab S6 Lite | |
| Allview iPlay 20 | |
| Medion LifeTab E10802 | |
| Blackview Tab 10 | |
| Average Mediatek MT8768 (498 - 1003, n=4) | |
| Alcatel 3T 10 4G 2020 | |
| PCMark for Android / Work 3.x | |
| Huawei MatePad 11 2021 | |
| Amazon Fire HD 10 Plus 2021 | |
| Average Mediatek MT8768 (4564 - 5866, n=2) | |
| Blackview Tab 10 | |
| GFXBench / Aztec Ruins High Tier Onscreen | |
| Apple iPad Air 4 2020 | |
| Huawei MatePad 11 2021 | |
| Huawei MatePad 10.4 | |
| Samsung Galaxy Tab S6 Lite | |
| Samsung Galaxy Tab A7 10.4 (2020) | |
| Amazon Fire HD 10 2019 | |
| Amazon Fire HD 10 Plus 2021 | |
| Average Mediatek MT8768 (2.2 - 5.2, n=4) | |
| Alcatel 3T 10 4G 2020 | |
| Medion LifeTab E10802 | |
| Blackview Tab 10 | |
| Allview iPlay 20 | |
| GFXBench / Aztec Ruins High Tier Offscreen | |
| Apple iPad Air 4 2020 | |
| Huawei MatePad 11 2021 | |
| Huawei MatePad 10.4 | |
| Samsung Galaxy Tab S6 Lite | |
| Samsung Galaxy Tab A7 10.4 (2020) | |
| Amazon Fire HD 10 2019 | |
| Amazon Fire HD 10 Plus 2021 | |
| Average Mediatek MT8768 (1.4 - 1.5, n=4) | |
| Medion LifeTab E10802 | |
| Blackview Tab 10 | |
| Allview iPlay 20 | |
| Alcatel 3T 10 4G 2020 | |
| GFXBench / Aztec Ruins Normal Tier Onscreen | |
| Apple iPad Air 4 2020 | |
| Huawei MatePad 11 2021 | |
| Huawei MatePad 10.4 | |
| Samsung Galaxy Tab S6 Lite | |
| Samsung Galaxy Tab A7 10.4 (2020) | |
| Amazon Fire HD 10 2019 | |
| Amazon Fire HD 10 Plus 2021 | |
| Average Mediatek MT8768 (3.6 - 8.2, n=4) | |
| Alcatel 3T 10 4G 2020 | |
| Medion LifeTab E10802 | |
| Blackview Tab 10 | |
| Allview iPlay 20 | |
| GFXBench / Aztec Ruins Normal Tier Offscreen | |
| Apple iPad Air 4 2020 | |
| Huawei MatePad 11 2021 | |
| Huawei MatePad 10.4 | |
| Samsung Galaxy Tab S6 Lite | |
| Samsung Galaxy Tab A7 10.4 (2020) | |
| Amazon Fire HD 10 Plus 2021 | |
| Amazon Fire HD 10 2019 | |
| Average Mediatek MT8768 (3.9 - 4.2, n=4) | |
| Medion LifeTab E10802 | |
| Blackview Tab 10 | |
| Allview iPlay 20 | |
| Alcatel 3T 10 4G 2020 | |
| 3DMark / Sling Shot Extreme (ES 3.1) Unlimited Physics | |
| Huawei MatePad 11 2021 | |
| Huawei MatePad 10.4 | |
| Amazon Fire HD 10 2019 | |
| Apple iPad Air 4 2020 | |
| Amazon Fire HD 10 Plus 2021 | |
| Samsung Galaxy Tab A7 10.4 (2020) | |
| Samsung Galaxy Tab S6 Lite | |
| Alldocube Alldocube X | |
| Lenovo Tab M10 | |
| Average Mediatek MT8768 (957 - 2101, n=4) | |
| Allview iPlay 20 | |
| Blackview Tab 10 | |
| Medion LifeTab E10802 | |
| Alcatel 3T 10 4G 2020 | |
| 3DMark / Sling Shot Extreme (ES 3.1) Unlimited Graphics | |
| Apple iPad Air 4 2020 | |
| Huawei MatePad 11 2021 | |
| Huawei MatePad 10.4 | |
| Samsung Galaxy Tab S6 Lite | |
| Samsung Galaxy Tab A7 10.4 (2020) | |
| Amazon Fire HD 10 2019 | |
| Amazon Fire HD 10 Plus 2021 | |
| Alldocube Alldocube X | |
| Average Mediatek MT8768 (396 - 487, n=4) | |
| Blackview Tab 10 | |
| Lenovo Tab M10 | |
| Allview iPlay 20 | |
| Medion LifeTab E10802 | |
| Alcatel 3T 10 4G 2020 | |
| 3DMark / Sling Shot Extreme (ES 3.1) Unlimited | |
| Huawei MatePad 11 2021 | |
| Apple iPad Air 4 2020 | |
| Huawei MatePad 10.4 | |
| Samsung Galaxy Tab S6 Lite | |
| Samsung Galaxy Tab A7 10.4 (2020) | |
| Amazon Fire HD 10 2019 | |
| Amazon Fire HD 10 Plus 2021 | |
| Alldocube Alldocube X | |
| Average Mediatek MT8768 (455 - 581, n=4) | |
| Lenovo Tab M10 | |
| Blackview Tab 10 | |
| Allview iPlay 20 | |
| Medion LifeTab E10802 | |
| Alcatel 3T 10 4G 2020 | |
| WebXPRT 3 / Overall | |
| Apple iPad Air 4 2020 | |
| Huawei MatePad 11 2021 | |
| Huawei MatePad 10.4 | |
| Samsung Galaxy Tab S6 Lite | |
| Amazon Fire HD 10 2019 | |
| Samsung Galaxy Tab A7 10.4 (2020) | |
| Amazon Fire HD 10 Plus 2021 | |
| Lenovo Tab M10 | |
| Blackview Tab 10 | |
| Average Mediatek MT8768 (24 - 39, n=4) | |
| Allview iPlay 20 | |
| Alcatel 3T 10 4G 2020 | |
| Medion LifeTab E10802 | |
PCMark for Android: Work 3.x
GFXBench: on screen Aztec Ruins High Tier Onscreen | 2560x1440 Aztec Ruins High Tier Offscreen | on screen Aztec Ruins Normal Tier Onscreen | 1920x1080 Aztec Ruins Normal Tier Offscreen
3DMark: 2560x1440 Sling Shot Extreme (ES 3.1) Unlimited Physics | 2560x1440 Sling Shot Extreme (ES 3.1) Unlimited Graphics | 2560x1440 Sling Shot Extreme (ES 3.1) Unlimited
WebXPRT 3: Overall
存储设备
传输速度还不错,但在处理4K大小的文件时,传输速度就开始慢下来了。
存储可以通过集成的MicroSD读卡器扩展。从我们的UHS-II测试卡中复制价值1GB的图片到平板电脑需要20秒左右。
| Blackview Tab 10 64 GB eMMC Flash | Huawei MatePad 11 2021 128 GB UFS 3.1 Flash | Alcatel 3T 10 4G 2020 32 GB eMMC Flash | Medion LifeTab E10802 64 GB eMMC Flash | Allview iPlay 20 64 GB eMMC Flash | Lenovo Tab M10 16 GB eMMC Flash | |
|---|---|---|---|---|---|---|
| AndroBench 3-5 | 901% | 11% | -6% | -27% | 8% | |
| Random Write 4KB (MB/s) | 9.4 | 217.5 2214% | 13.54 44% | 10.32 10% | 4.27 -55% | 11.32 20% |
| Random Read 4KB (MB/s) | 31.37 | 190.7 508% | 36.01 15% | 27.36 -13% | 25.43 -19% | 52.5 67% |
| Sequential Write 256KB (MB/s) | 135.3 | 708 423% | 104 -23% | 101.2 -25% | 160.3 18% | 52.6 -61% |
| Sequential Read 256KB (MB/s) | 263.6 | 1468 457% | 287.3 9% | 274.7 4% | 123.3 -53% | 279.9 6% |
| Sequential Write 256KB SDCard (MB/s) | 63 | 61.1 | 62.9 | 61.2 | ||
| Sequential Read 256KB SDCard (MB/s) | 83.7 | 80.7 | 81.7 | 83.5 |
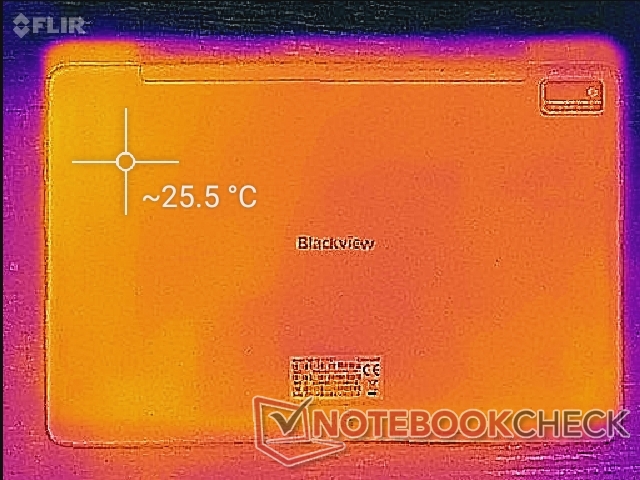
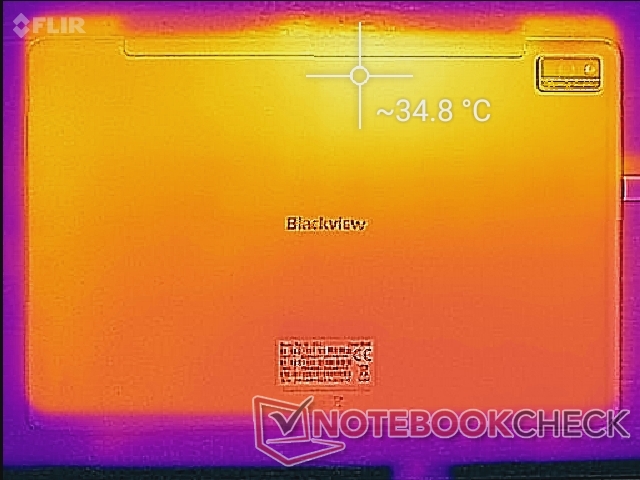
Emissions
温度
沿着离USB-C端口最远的边缘,表面温度最热。当长时间处于高负荷状态时,前面和后面的热点可以达到40℃和35℃。
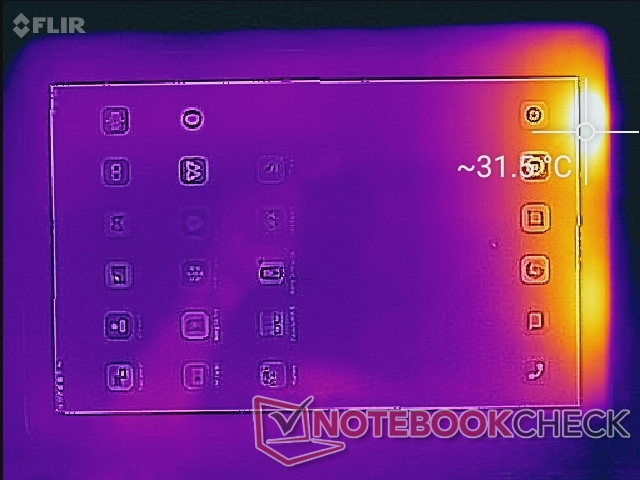
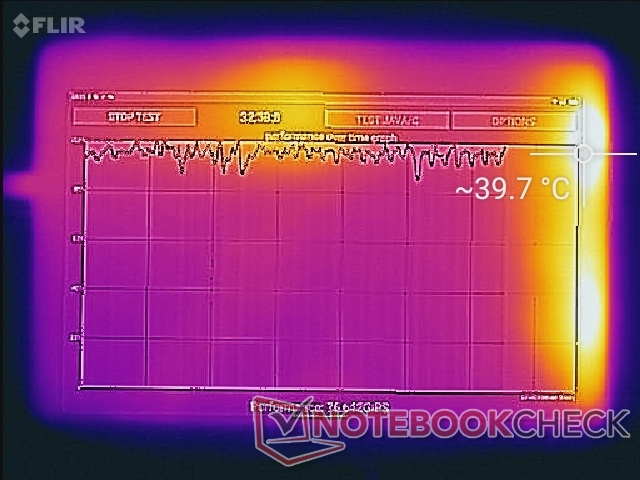
(±) The maximum temperature on the upper side is 40.6 °C / 105 F, compared to the average of 33.7 °C / 93 F, ranging from 20.7 to 53.2 °C for the class Tablet.
(+) The bottom heats up to a maximum of 34.8 °C / 95 F, compared to the average of 33.2 °C / 92 F
(+) In idle usage, the average temperature for the upper side is 25.4 °C / 78 F, compared to the device average of 30 °C / 86 F.
发言人

Blackview Tab 10 audio analysis
(+) | speakers can play relatively loud (91.1 dB)
Bass 100 - 315 Hz
(-) | nearly no bass - on average 25.4% lower than median
(+) | bass is linear (5.5% delta to prev. frequency)
Mids 400 - 2000 Hz
(±) | reduced mids - on average 6.7% lower than median
(+) | mids are linear (5.3% delta to prev. frequency)
Highs 2 - 16 kHz
(±) | higher highs - on average 7.4% higher than median
(+) | highs are linear (3.6% delta to prev. frequency)
Overall 100 - 16.000 Hz
(±) | linearity of overall sound is average (19.6% difference to median)
Compared to same class
» 55% of all tested devices in this class were better, 7% similar, 38% worse
» The best had a delta of 7%, average was 20%, worst was 129%
Compared to all devices tested
» 49% of all tested devices were better, 7% similar, 44% worse
» The best had a delta of 4%, average was 23%, worst was 134%
Apple MacBook 12 (Early 2016) 1.1 GHz audio analysis
(+) | speakers can play relatively loud (83.6 dB)
Bass 100 - 315 Hz
(±) | reduced bass - on average 11.3% lower than median
(±) | linearity of bass is average (14.2% delta to prev. frequency)
Mids 400 - 2000 Hz
(+) | balanced mids - only 2.4% away from median
(+) | mids are linear (5.5% delta to prev. frequency)
Highs 2 - 16 kHz
(+) | balanced highs - only 2% away from median
(+) | highs are linear (4.5% delta to prev. frequency)
Overall 100 - 16.000 Hz
(+) | overall sound is linear (10.2% difference to median)
Compared to same class
» 7% of all tested devices in this class were better, 2% similar, 90% worse
» The best had a delta of 5%, average was 18%, worst was 53%
Compared to all devices tested
» 5% of all tested devices were better, 1% similar, 94% worse
» The best had a delta of 4%, average was 23%, worst was 134%
Energy Management
消耗功率
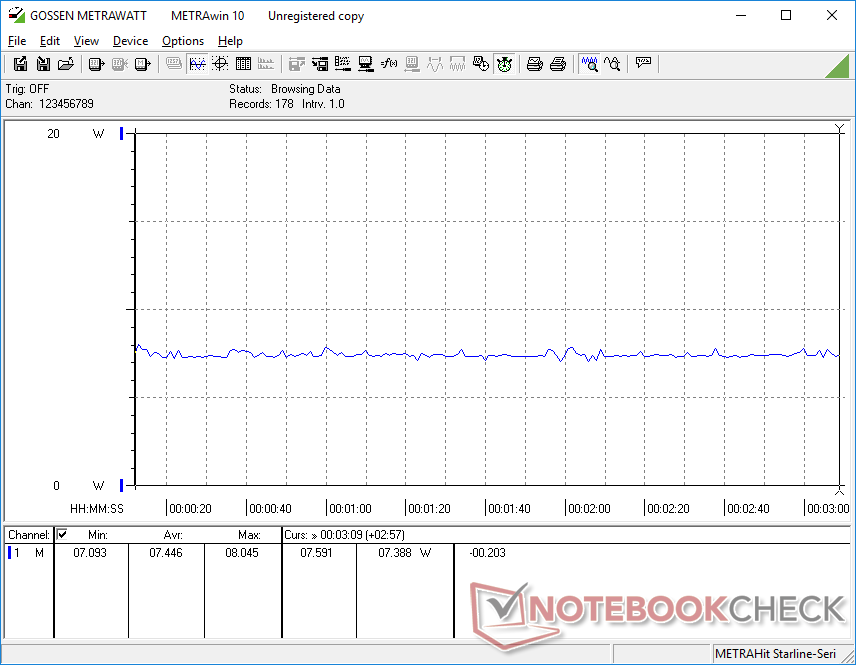
根据亮度水平,在主屏幕上空转消耗2瓦至6瓦。在运行CPU节流测试应用程序时,我们能够记录到最大功耗只有8W。
| Off / Standby | |
| Idle | |
| Load |
|
Key:
min: | |
| Blackview Tab 10 Helio MT8768, PowerVR GE8320, 64 GB eMMC Flash, IPS, 1920x1080, 10.1" | Huawei MatePad 11 2021 SD 865, Adreno 650, 128 GB UFS 3.1 Flash, IPS, 2560x1600, 11" | Alcatel 3T 10 4G 2020 Helio MT8766B, PowerVR GE8300, 32 GB eMMC Flash, IPS, 1280x800, 10.1" | Medion LifeTab E10802 Helio MT8768, PowerVR GE8320, 64 GB eMMC Flash, IPS, 1920x1200, 10" | Allview iPlay 20 SC9863A, GE8322 / IMG8322, 64 GB eMMC Flash, IPS, 1920x1200, 10.1" | Apple iPad Air 4 2020 A14, A14 Bionic GPU, 256 GB NVMe, IPS, 2360x1640, 10.9" | |
|---|---|---|---|---|---|---|
| Power Consumption | 6% | 54% | 32% | -98% | -19% | |
| Idle Minimum * (Watt) | 2 | 1.33 33% | 0.82 59% | 1.25 37% | 7.4 -270% | 1.3 35% |
| Idle Average * (Watt) | 6 | 5.37 10% | 2.73 54% | 3.79 37% | 10.9 -82% | 7.89 -32% |
| Idle Maximum * (Watt) | 6.1 | 5.41 11% | 2.74 55% | 3.82 37% | 11 -80% | 7.91 -30% |
| Load Average * (Watt) | 6.8 | 6.87 -1% | 3.08 55% | 4.99 27% | 7.7 -13% | 9.28 -36% |
| Load Maximum * (Watt) | 8.1 | 10.08 -24% | 4.41 46% | 6.33 22% | 11.9 -47% | 10.78 -33% |
* ... smaller is better
电池寿命--适合一天的时间
运行时间长可能是由于上述的低功耗。我们能够从内部7480毫安时的电池中挤出近13小时的实际无线网络使用时间。
| Blackview Tab 10 Helio MT8768, PowerVR GE8320, Wh | Huawei MatePad 11 2021 SD 865, Adreno 650, Wh | Alcatel 3T 10 4G 2020 Helio MT8766B, PowerVR GE8300, Wh | Medion LifeTab E10802 Helio MT8768, PowerVR GE8320, 22.8 Wh | Allview iPlay 20 SC9863A, GE8322 / IMG8322, Wh | Apple iPad Air 4 2020 A14, A14 Bionic GPU, 28.6 Wh | |
|---|---|---|---|---|---|---|
| Battery runtime | 8% | 19% | -5% | -38% | -9% | |
| WiFi v1.3 (h) | 12.9 | 13.9 8% | 15.3 19% | 12.2 -5% | 8 -38% | 11.7 -9% |
| Reader / Idle (h) | 32.9 | 34 | ||||
| Load (h) | 3.9 | 6.5 |
Pros
Cons
结论 - 廉价、明亮、沉重和缓慢
Blackview Tab 10在几个方面表现出色,而在其他许多方面却掉链子。我们喜欢它明亮的触摸屏,它比许多其他预算Android ,如阿尔卡特3T 10 4G或 联想Tab M10以提高户外能见度。我们也很欣赏强大的底盘设计,感觉比眼前的竞争对手更坚韧、更持久。假设在明亮的条件下,相机质量对于这个价格来说也是不错的。
缺点太明显,无法忽视。如果你打算每天使用这款平板电脑进行网络浏览或文字处理,那么它的性能是非常缓慢的,以至于让人感到沮丧。缺乏外部显示器支持或更深的颜色也是明显的,尽管考虑到价格更容易被原谅。用户可能想考虑三星Galaxy Tab A7 10.4它配备了明显更快的Snapdragon处理器,可以获得更流畅的体验,但代价是更脆弱的结构。
价格和可用性
Blackview Tab 10可直接从Blackview购买,价格为189美元。.另外,该型号在亚马逊上也有,售价219美元。.
Blackview Tab 10
- 09/14/2021 v7 (old)
Allen Ngo
Price comparison

