惠普 250 G5 SP X0N33EA 笔记本电脑简短评测


| SD Card Reader | |
| average JPG Copy Test (av. of 3 runs) | |
| Dell Latitude 15 E5570 | |
| HP 250 G5 SP X0N33EA | |
| Acer Extensa 2520-59CD | |
| maximum AS SSD Seq Read Test (1GB) | |
| Acer Extensa 2520-59CD | |
| Networking | |
| iperf Server (receive) TCP 1 m | |
| HP ProBook 650 G2 V1A44ET (jseb) | |
| Dell Latitude 14 3470 | |
| HP 250 G5 SP X0N33EA (jseb) | |
| Chiligreen Mobilitas SF2600 | |
| iperf Client (transmit) TCP 1 m | |
| Acer Extensa 2520-59CD | |
| Dell Latitude 14 3470 | |
| Chiligreen Mobilitas SF2600 | |
| HP 250 G5 SP X0N33EA (jseb) | |
| HP ProBook 650 G2 V1A44ET (jseb) | |
| |||||||||||||||||||||||||
Brightness Distribution: 85 %
Center on Battery: 222 cd/m²
Contrast: 562:1 (Black: 0.39 cd/m²)
ΔE ColorChecker Calman: 12.67 | ∀{0.5-29.43 Ø4.71}
ΔE Greyscale Calman: 13.82 | ∀{0.09-98 Ø4.96}
55% sRGB (Argyll 1.6.3 3D)
35% AdobeRGB 1998 (Argyll 1.6.3 3D)
37.72% AdobeRGB 1998 (Argyll 3D)
55% sRGB (Argyll 3D)
36.51% Display P3 (Argyll 3D)
Gamma: 2.63
CCT: 15633 K
| HP 250 G5 SP X0N33EA AU Optronics AUO38ED, , 1920x1080, 15.6" | Acer Extensa 2520-59CD ChiMei N156BGE-E32, , 1366x768, 15.6" | Dell Latitude 15-3570 LG Philips LGD04AF / 156WHU, , 1366x768, 15.6" | Lenovo ThinkPad L560-20F10026GE LG LP156WF6-SPK1, , 1920x1080, 15.6" | |
|---|---|---|---|---|
| Display | 12% | 11% | 7% | |
| Display P3 Coverage (%) | 36.51 | 40.71 12% | 40.61 11% | 39 7% |
| sRGB Coverage (%) | 55 | 61.1 11% | 61.1 11% | 58.3 6% |
| AdobeRGB 1998 Coverage (%) | 37.72 | 42.07 12% | 41.96 11% | 40.33 7% |
| Response Times | -36% | -31% | -13% | |
| Response Time Grey 50% / Grey 80% * (ms) | 40 ? | 52 ? -30% | 37 ? 7% | 39.2 ? 2% |
| Response Time Black / White * (ms) | 22 ? | 31 ? -41% | 37 ? -68% | 28 ? -27% |
| PWM Frequency (Hz) | 1000 | |||
| Screen | 3% | -8% | 23% | |
| Brightness middle (cd/m²) | 219 | 211 -4% | 202 -8% | 262 20% |
| Brightness (cd/m²) | 222 | 200 -10% | 211 -5% | 250 13% |
| Brightness Distribution (%) | 85 | 83 -2% | 88 4% | 92 8% |
| Black Level * (cd/m²) | 0.39 | 0.43 -10% | 0.62 -59% | 0.29 26% |
| Contrast (:1) | 562 | 491 -13% | 326 -42% | 903 61% |
| Colorchecker dE 2000 * | 12.67 | 10.53 17% | 12.35 3% | 8.49 33% |
| Colorchecker dE 2000 max. * | 20.99 | 17.79 15% | 19.9 5% | 17.99 14% |
| Greyscale dE 2000 * | 13.82 | 11.85 14% | 13.46 3% | 8.11 41% |
| Gamma | 2.63 84% | 2.25 98% | 2.44 90% | 2.37 93% |
| CCT | 15633 42% | 13758 47% | 15217 43% | 6300 103% |
| Color Space (Percent of AdobeRGB 1998) (%) | 35 | 39 11% | 39 11% | 37.07 6% |
| Color Space (Percent of sRGB) (%) | 55 | 61 11% | 61 11% | 57.94 5% |
| Total Average (Program / Settings) | -7% /
-0% | -9% /
-7% | 6% /
15% |
* ... smaller is better
Display Response Times
| ↔ Response Time Black to White | ||
|---|---|---|
| 22 ms ... rise ↗ and fall ↘ combined | ↗ 6 ms rise | 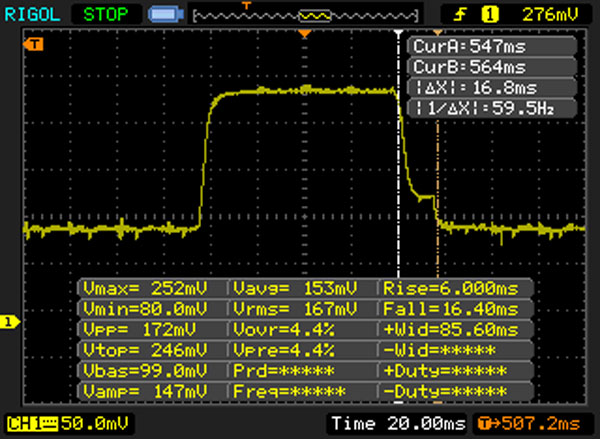 |
| ↘ 16 ms fall | ||
| The screen shows good response rates in our tests, but may be too slow for competitive gamers. In comparison, all tested devices range from 0.1 (minimum) to 240 (maximum) ms. » 49 % of all devices are better. This means that the measured response time is worse than the average of all tested devices (19.8 ms). | ||
| ↔ Response Time 50% Grey to 80% Grey | ||
| 40 ms ... rise ↗ and fall ↘ combined | ↗ 20 ms rise | 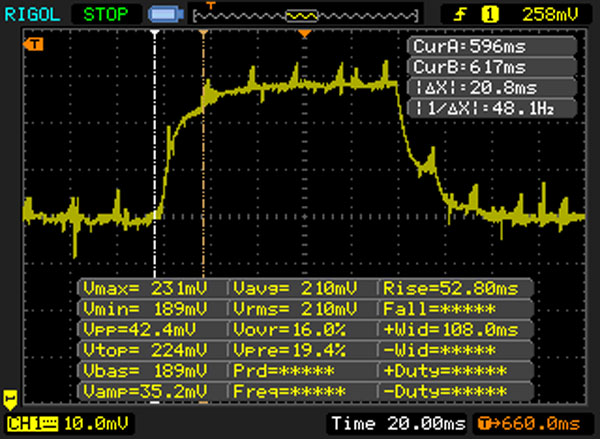 |
| ↘ 20 ms fall | ||
| The screen shows slow response rates in our tests and will be unsatisfactory for gamers. In comparison, all tested devices range from 0.165 (minimum) to 636 (maximum) ms. » 61 % of all devices are better. This means that the measured response time is worse than the average of all tested devices (31 ms). | ||
Screen Flickering / PWM (Pulse-Width Modulation)
| Screen flickering / PWM not detected | ||
In comparison: 52 % of all tested devices do not use PWM to dim the display. If PWM was detected, an average of 7754 (minimum: 5 - maximum: 343500) Hz was measured. | ||
| PCMark 8 | |
| Home Score Accelerated v2 | |
| Dell Latitude 15-3570 | |
| HP 250 G5 SP X0N33EA | |
| Lenovo ThinkPad L560-20F10026GE | |
| Acer Extensa 2520-59CD | |
| Work Score Accelerated v2 | |
| Dell Latitude 15-3570 | |
| HP 250 G5 SP X0N33EA | |
| Lenovo ThinkPad L560-20F10026GE | |
| PCMark 7 Score | 4213 points | |
| PCMark 8 Home Score Accelerated v2 | 3317 points | |
| PCMark 8 Creative Score Accelerated v2 | 3605 points | |
| PCMark 8 Work Score Accelerated v2 | 4343 points | |
Help | ||
| HP 250 G5 SP X0N33EA SanDisk Z400s SD8SNAT-256G | Acer Extensa 2520-59CD Toshiba MQ01ABF050 | Dell Latitude 15-3570 Samsung CM871 MZNLF128HCHP | Lenovo ThinkPad L560-20F10026GE WDC Slim WD10SPCX-21KHST0 | |
|---|---|---|---|---|
| CrystalDiskMark 3.0 | -90% | -42% | -89% | |
| Read Seq (MB/s) | 509 | 104.7 -79% | 453.2 -11% | 113.6 -78% |
| Write Seq (MB/s) | 322.1 | 95.7 -70% | 137.7 -57% | 111.7 -65% |
| Read 512 (MB/s) | 321.2 | 33 -90% | 308.5 -4% | 39.65 -88% |
| Write 512 (MB/s) | 289.4 | 38.3 -87% | 134.1 -54% | 55.3 -81% |
| Read 4k (MB/s) | 20.99 | 0.375 -98% | 19.06 -9% | 0.488 -98% |
| Write 4k (MB/s) | 88 | 0.782 -99% | 21.31 -76% | 1.022 -99% |
| Read 4k QD32 (MB/s) | 141.3 | 0.675 -100% | 93.5 -34% | 1.367 -99% |
| Write 4k QD32 (MB/s) | 228.5 | 0.769 -100% | 23.3 -90% | 1.036 -100% |

| 3DMark 11 - 1280x720 Performance GPU | |
| Lenovo IdeaPad 300-17ISK 80QH001EGE | |
| Acer TravelMate P658-M-537B | |
| Dell Latitude 15-3570 | |
| HP 250 G5 SP X0N33EA | |
| Lenovo ThinkPad L560-20F10026GE | |
| Acer Extensa 2520-59CD | |
| 3DMark | |
| 1280x720 Cloud Gate Standard Graphics | |
| Acer TravelMate P658-M-537B | |
| HP 250 G5 SP X0N33EA | |
| Lenovo ThinkPad L560-20F10026GE | |
| Dell Latitude 15-3570 | |
| Lenovo IdeaPad 300-17ISK 80QH001EGE | |
| 1920x1080 Fire Strike Graphics | |
| Lenovo IdeaPad 300-17ISK 80QH001EGE | |
| Lenovo ThinkPad L560-20F10026GE | |
| 3DMark 11 Performance | 1393 points | |
| 3DMark Ice Storm Standard Score | 45395 points | |
| 3DMark Cloud Gate Standard Score | 5123 points | |
Help | ||
| BioShock Infinite - 1280x720 Very Low Preset | |
| Lenovo IdeaPad 300-17ISK 80QH001EGE | |
| HP 250 G5 SP X0N33EA | |
| Dell Latitude 15-3570 | |
| Lenovo ThinkPad L560-20F10026GE | |
| Acer Extensa 2520-59CD | |
| low | med. | high | ultra | |
|---|---|---|---|---|
| BioShock Infinite (2013) | 42.6 | 5.5 | ||
| Battlefield 4 (2013) | 30.6 | 22 | 14.5 | 4.8 |
| Rise of the Tomb Raider (2016) | 65.7 | 34.1 | 19.7 | 9.3 |
Noise level
| Idle |
| 34.5 / 34.5 / 34.5 dB(A) |
| DVD |
| 37.3 / dB(A) |
| Load |
| 39 / 38.3 dB(A) |
 | ||
30 dB silent 40 dB(A) audible 50 dB(A) loud |
||
min: | ||
(+) The maximum temperature on the upper side is 31.1 °C / 88 F, compared to the average of 34.3 °C / 94 F, ranging from 21.2 to 62.5 °C for the class Office.
(+) The bottom heats up to a maximum of 31.8 °C / 89 F, compared to the average of 36.8 °C / 98 F
(+) In idle usage, the average temperature for the upper side is 21.6 °C / 71 F, compared to the device average of 29.5 °C / 85 F.
(+) The palmrests and touchpad are cooler than skin temperature with a maximum of 27.8 °C / 82 F and are therefore cool to the touch.
(±) The average temperature of the palmrest area of similar devices was 27.5 °C / 81.5 F (-0.3 °C / -0.5 F).
HP 250 G5 SP X0N33EA audio analysis
(±) | speaker loudness is average but good (75 dB)
Bass 100 - 315 Hz
(-) | nearly no bass - on average 18.3% lower than median
(+) | bass is linear (5.5% delta to prev. frequency)
Mids 400 - 2000 Hz
(+) | balanced mids - only 4.2% away from median
(+) | mids are linear (6.9% delta to prev. frequency)
Highs 2 - 16 kHz
(+) | balanced highs - only 3.5% away from median
(+) | highs are linear (5.1% delta to prev. frequency)
Overall 100 - 16.000 Hz
(±) | linearity of overall sound is average (16.1% difference to median)
Compared to same class
» 19% of all tested devices in this class were better, 6% similar, 75% worse
» The best had a delta of 7%, average was 21%, worst was 53%
Compared to all devices tested
» 26% of all tested devices were better, 5% similar, 69% worse
» The best had a delta of 4%, average was 23%, worst was 134%
Apple MacBook 12 (Early 2016) 1.1 GHz audio analysis
(+) | speakers can play relatively loud (83.6 dB)
Bass 100 - 315 Hz
(±) | reduced bass - on average 11.3% lower than median
(±) | linearity of bass is average (14.2% delta to prev. frequency)
Mids 400 - 2000 Hz
(+) | balanced mids - only 2.4% away from median
(+) | mids are linear (5.5% delta to prev. frequency)
Highs 2 - 16 kHz
(+) | balanced highs - only 2% away from median
(+) | highs are linear (4.5% delta to prev. frequency)
Overall 100 - 16.000 Hz
(+) | overall sound is linear (10.2% difference to median)
Compared to same class
» 7% of all tested devices in this class were better, 2% similar, 90% worse
» The best had a delta of 5%, average was 18%, worst was 53%
Compared to all devices tested
» 5% of all tested devices were better, 1% similar, 94% worse
» The best had a delta of 4%, average was 23%, worst was 134%
| Off / Standby | |
| Idle | |
| Load |
|
Key:
min: | |
| HP 250 G5 SP X0N33EA 6200U, HD Graphics 520, SanDisk Z400s SD8SNAT-256G, TN, 1920x1080, 15.6" | Acer Extensa 2520-59CD 6200U, HD Graphics 520, Toshiba MQ01ABF050, TN LED, 1366x768, 15.6" | Dell Latitude 15-3570 6200U, HD Graphics 520, Samsung CM871 MZNLF128HCHP, TN LED, 1366x768, 15.6" | Lenovo ThinkPad L560-20F10026GE 6200U, HD Graphics 520, WDC Slim WD10SPCX-21KHST0, AH-IPS, 1920x1080, 15.6" | |
|---|---|---|---|---|
| Power Consumption | -57% | -14% | -26% | |
| Idle Minimum * (Watt) | 3.6 | 5.8 -61% | 4.9 -36% | 5 -39% |
| Idle Average * (Watt) | 6 | 12.6 -110% | 7.2 -20% | 7.9 -32% |
| Idle Maximum * (Watt) | 6.4 | 12.8 -100% | 7.5 -17% | 8.6 -34% |
| Load Average * (Watt) | 26 | 27.6 -6% | 25.4 2% | 27.5 -6% |
| Load Maximum * (Watt) | 28.1 | 30 -7% | 28 -0% | 33.7 -20% |
* ... smaller is better
| HP 250 G5 SP X0N33EA 6200U, HD Graphics 520, 41 Wh | Acer Extensa 2520-59CD 6200U, HD Graphics 520, 37 Wh | Dell Latitude 15-3570 6200U, HD Graphics 520, 65 Wh | Lenovo ThinkPad L560-20F10026GE 6200U, HD Graphics 520, 48 Wh | |
|---|---|---|---|---|
| Battery runtime | -9% | 53% | 4% | |
| Reader / Idle (h) | 10.6 | 17.1 61% | 11.6 9% | |
| H.264 (h) | 5.2 | 4.6 -12% | ||
| WiFi v1.3 (h) | 5.8 | 5.3 -9% | 9 55% | 6.8 17% |
| Load (h) | 1.8 | 2.6 44% | 1.8 0% |
Pros
Cons
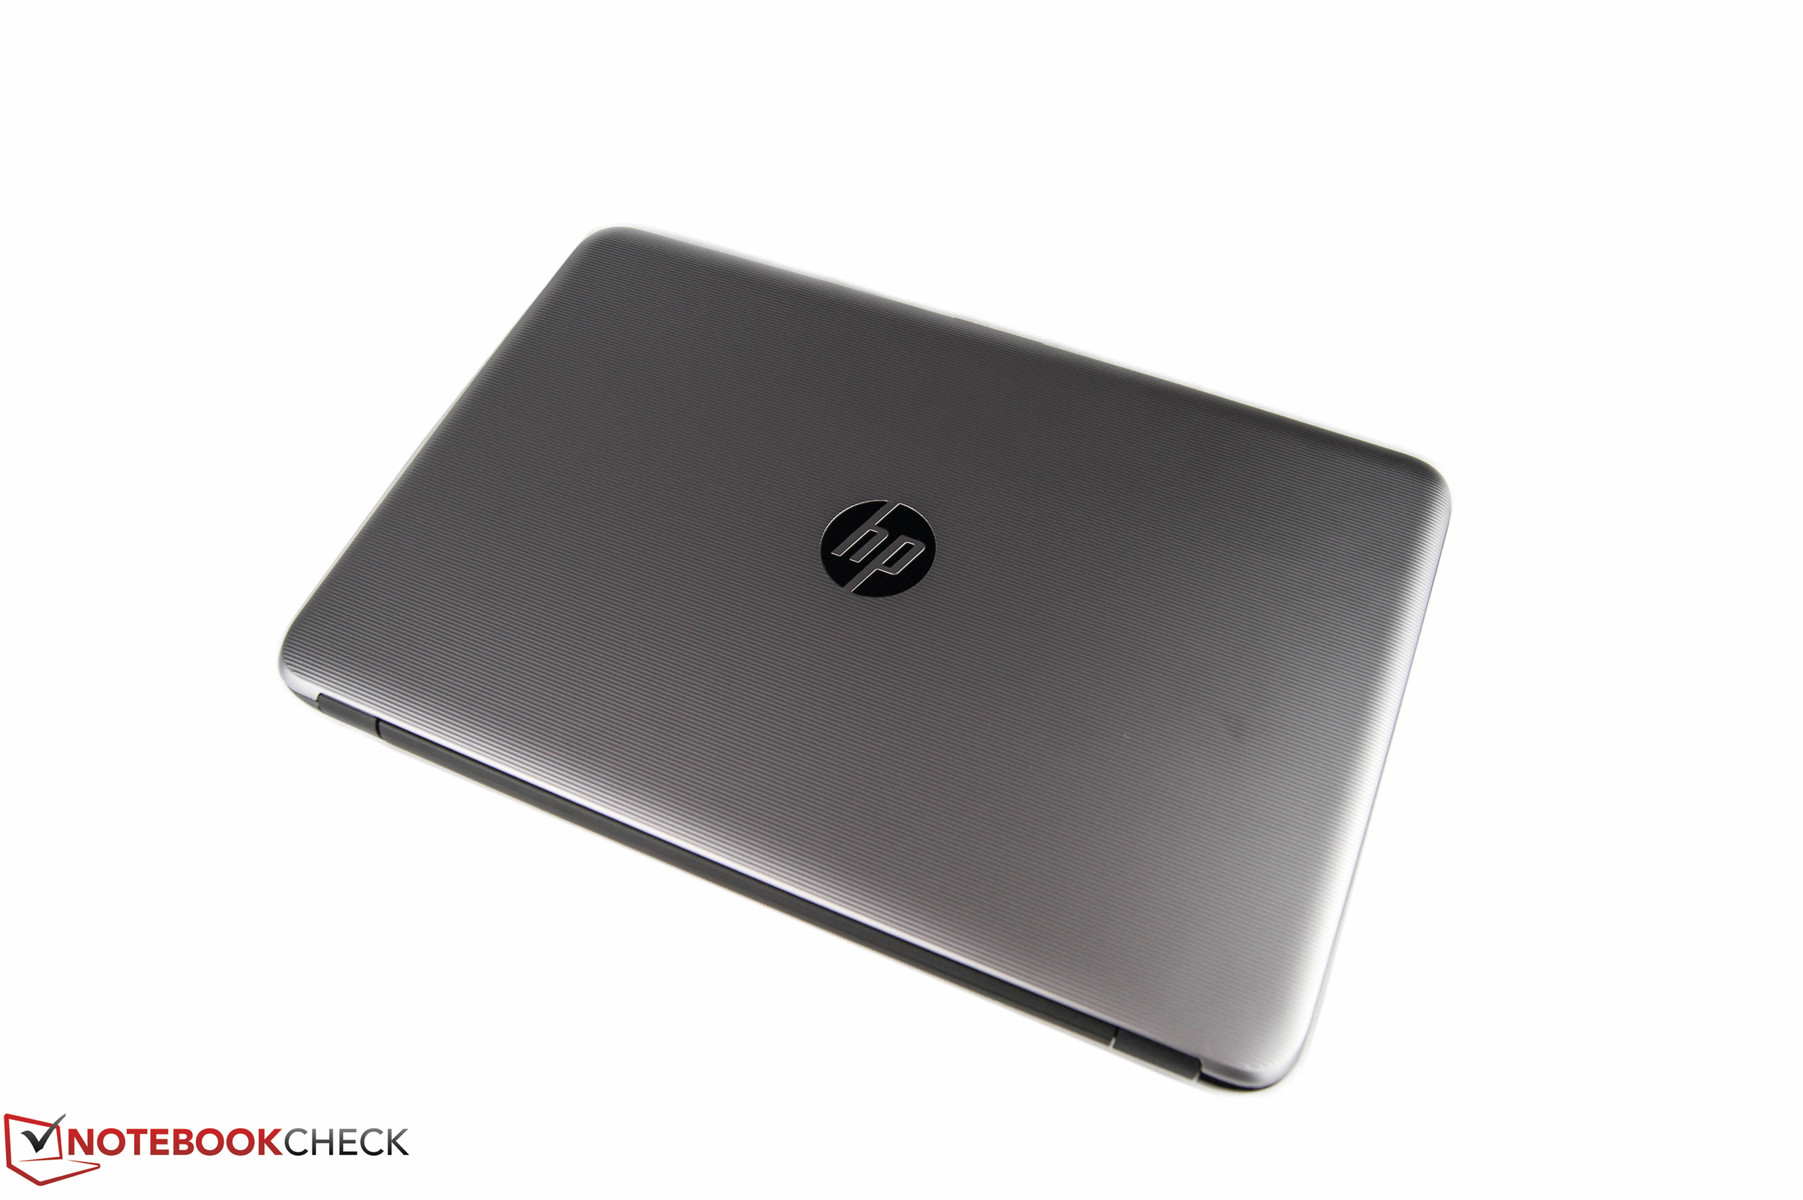
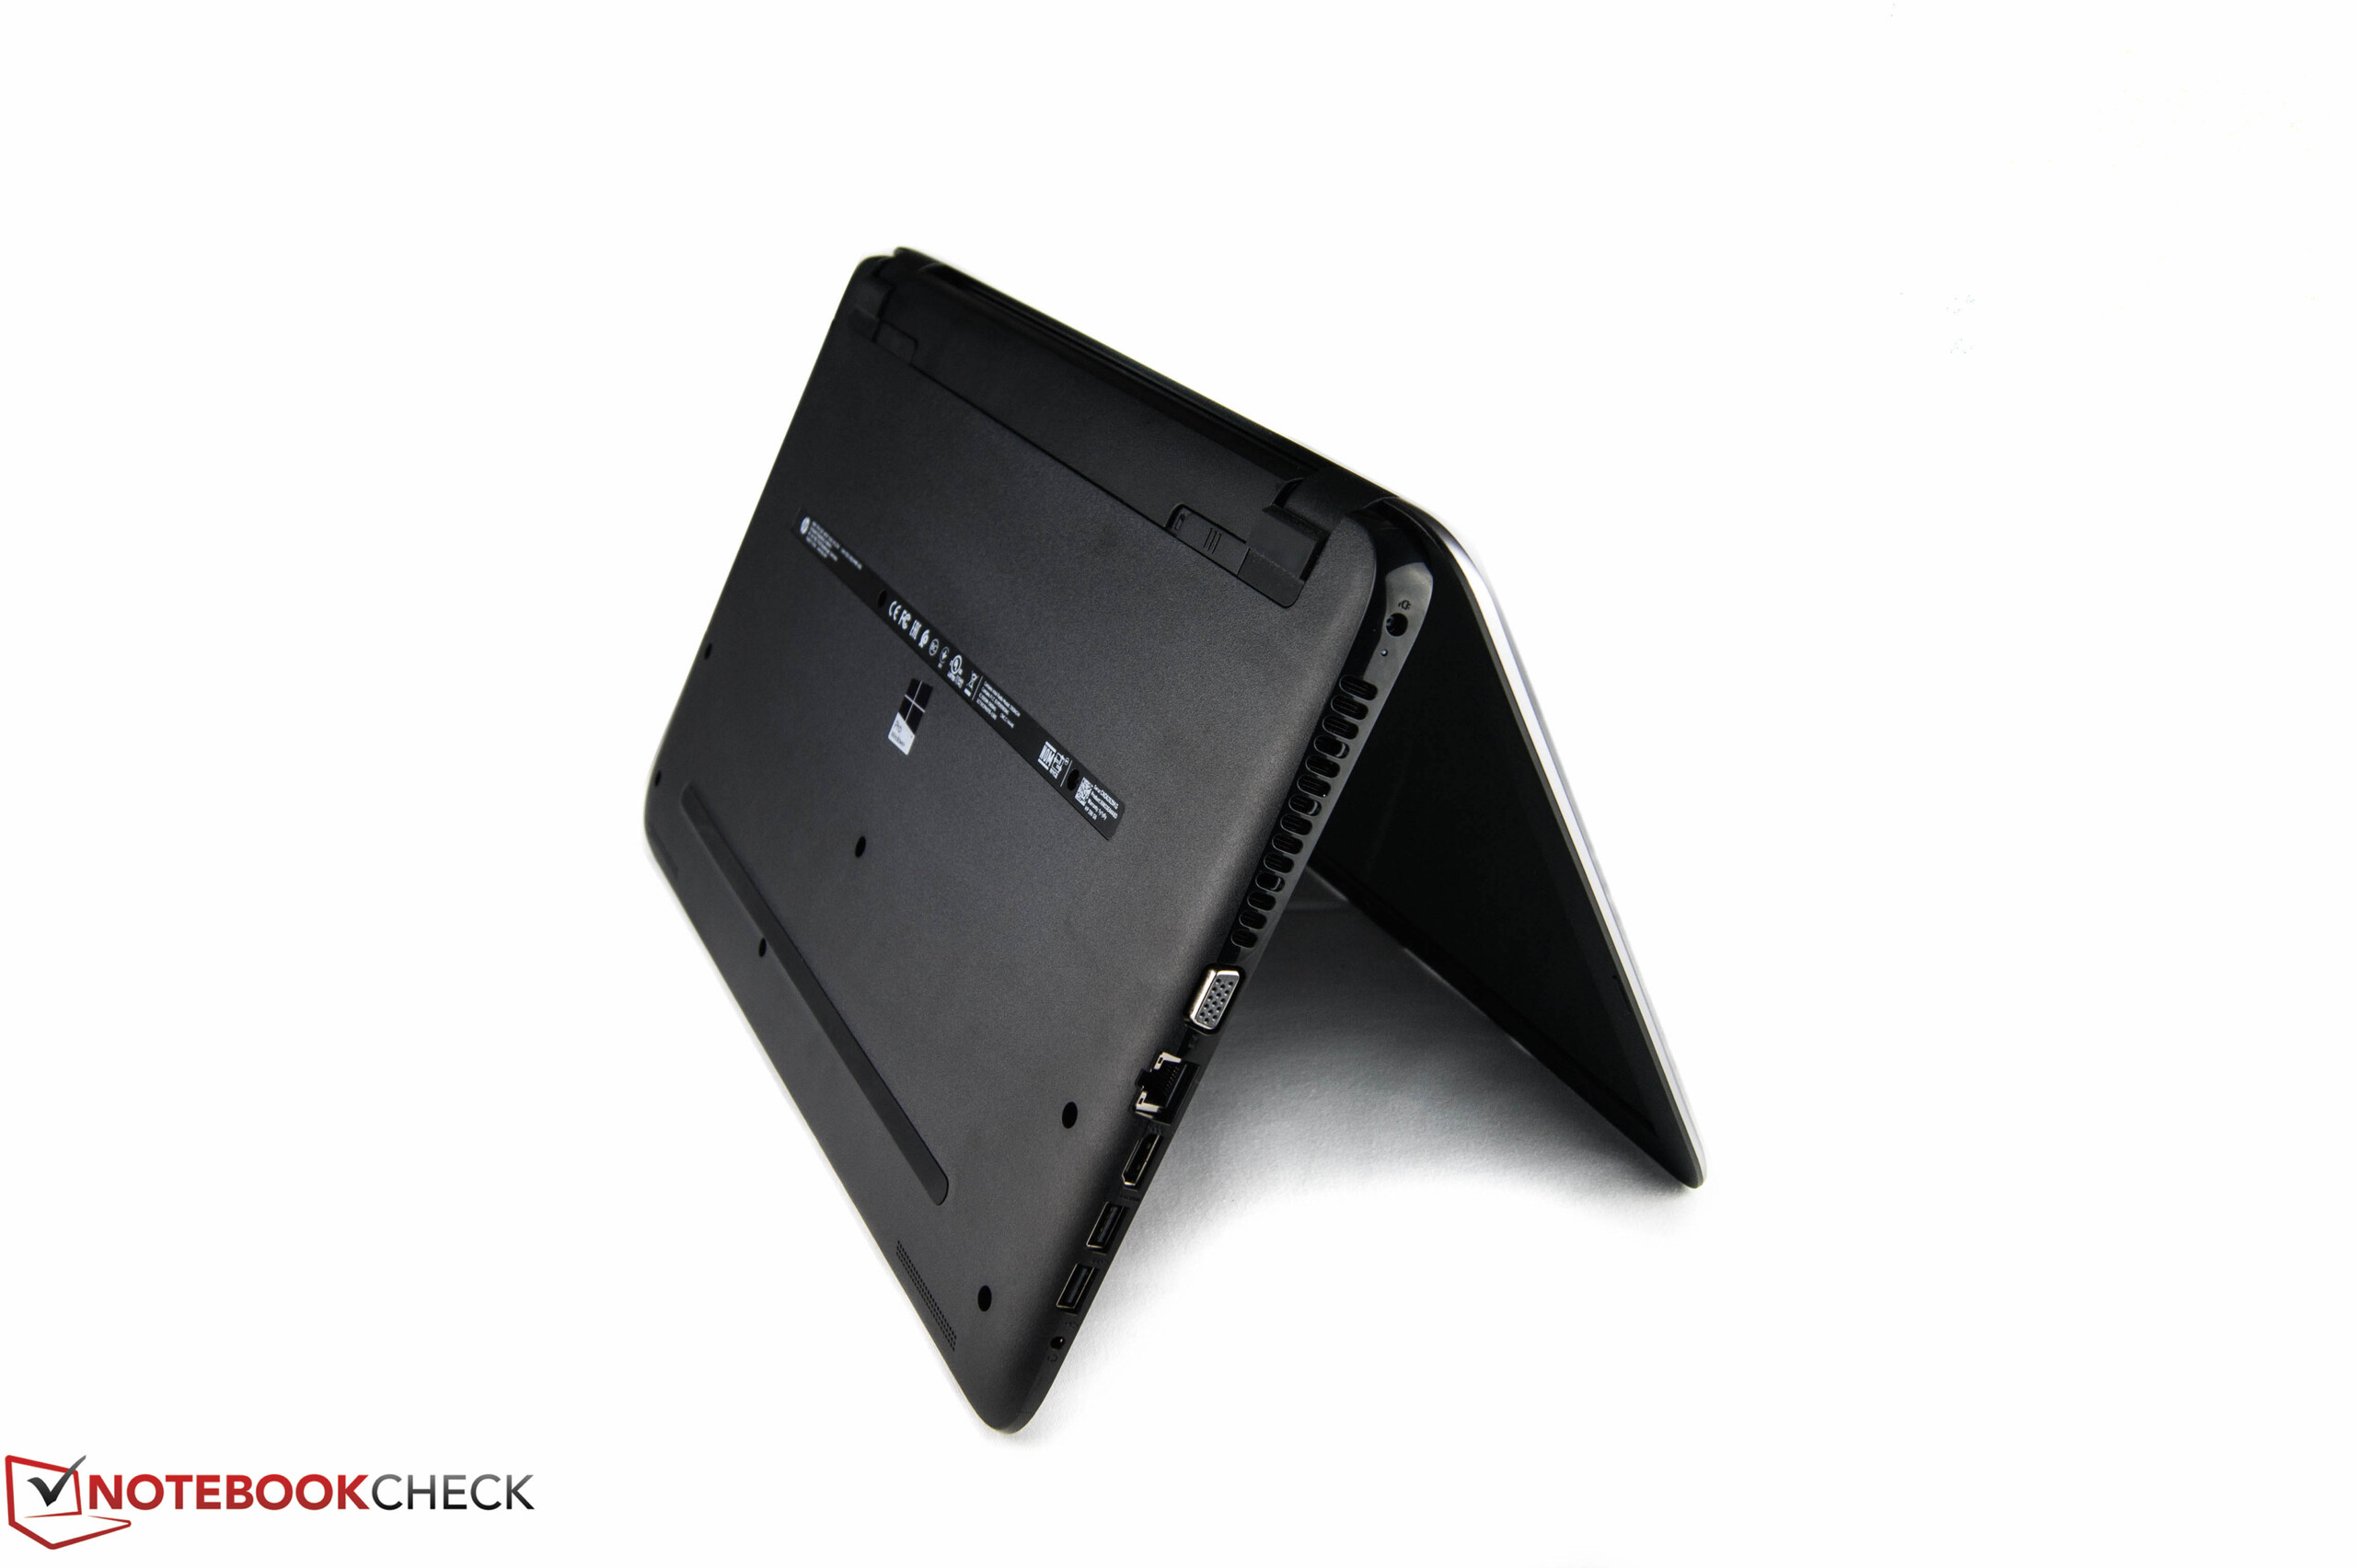
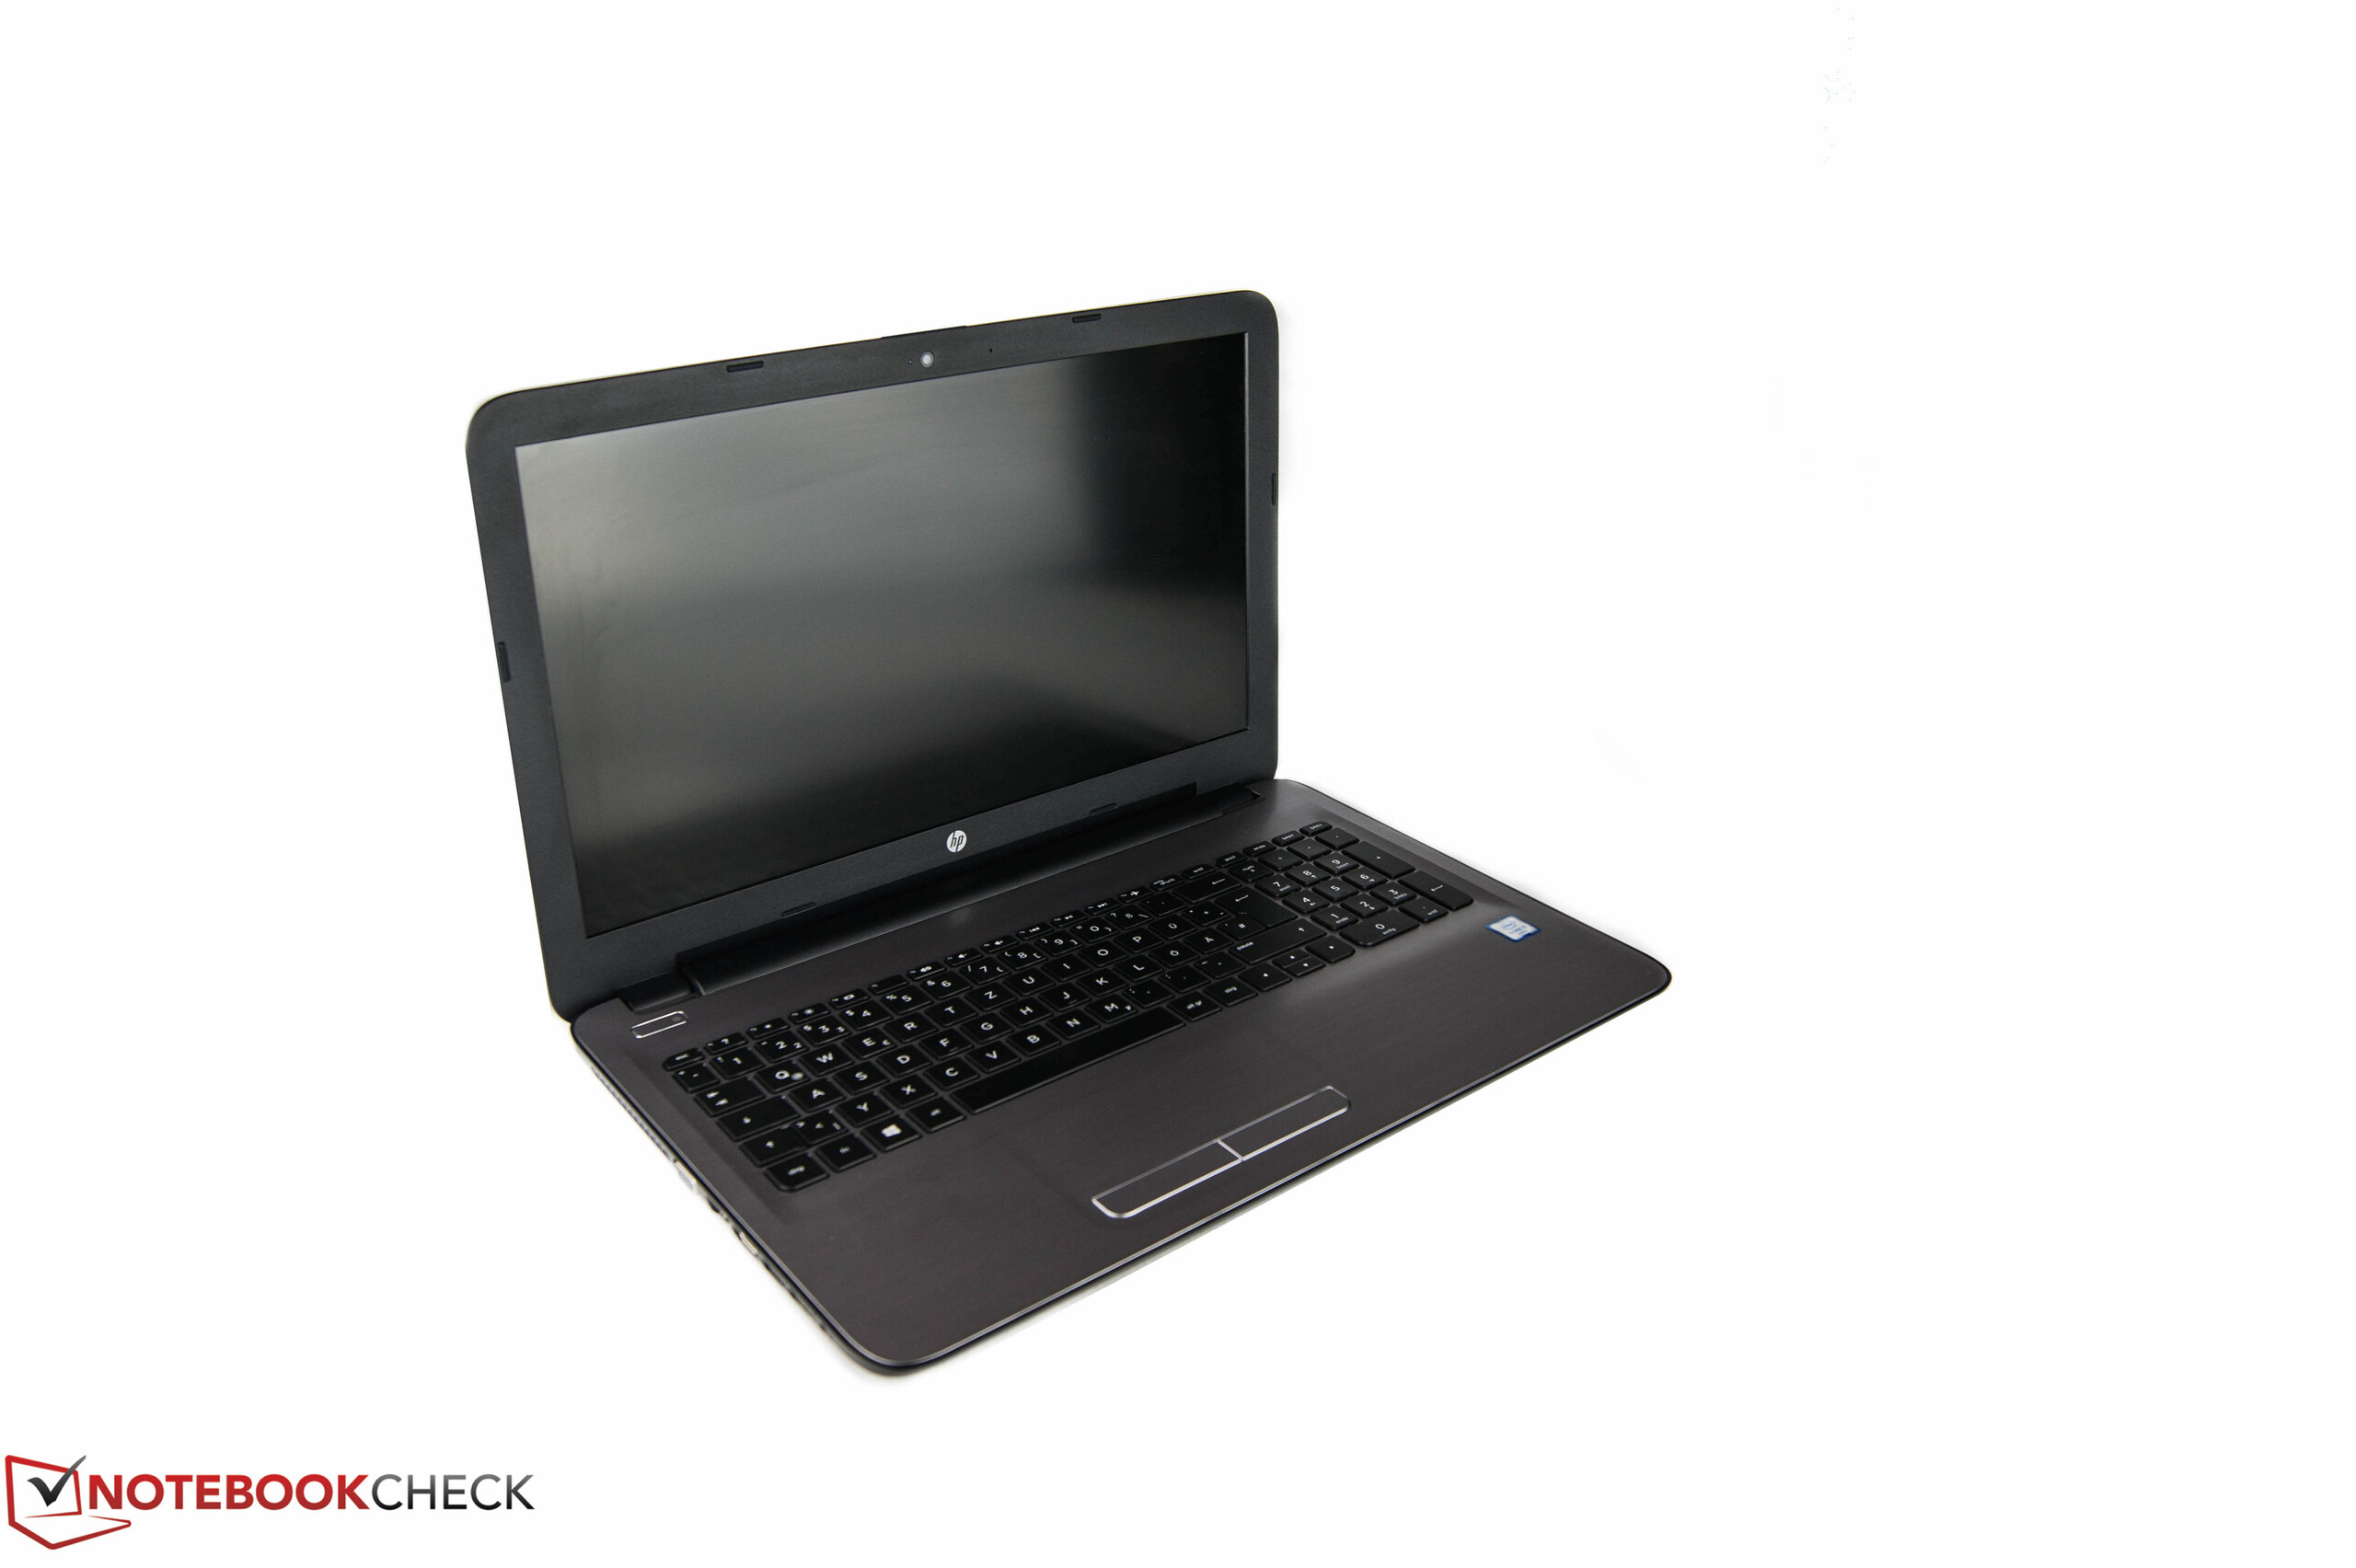
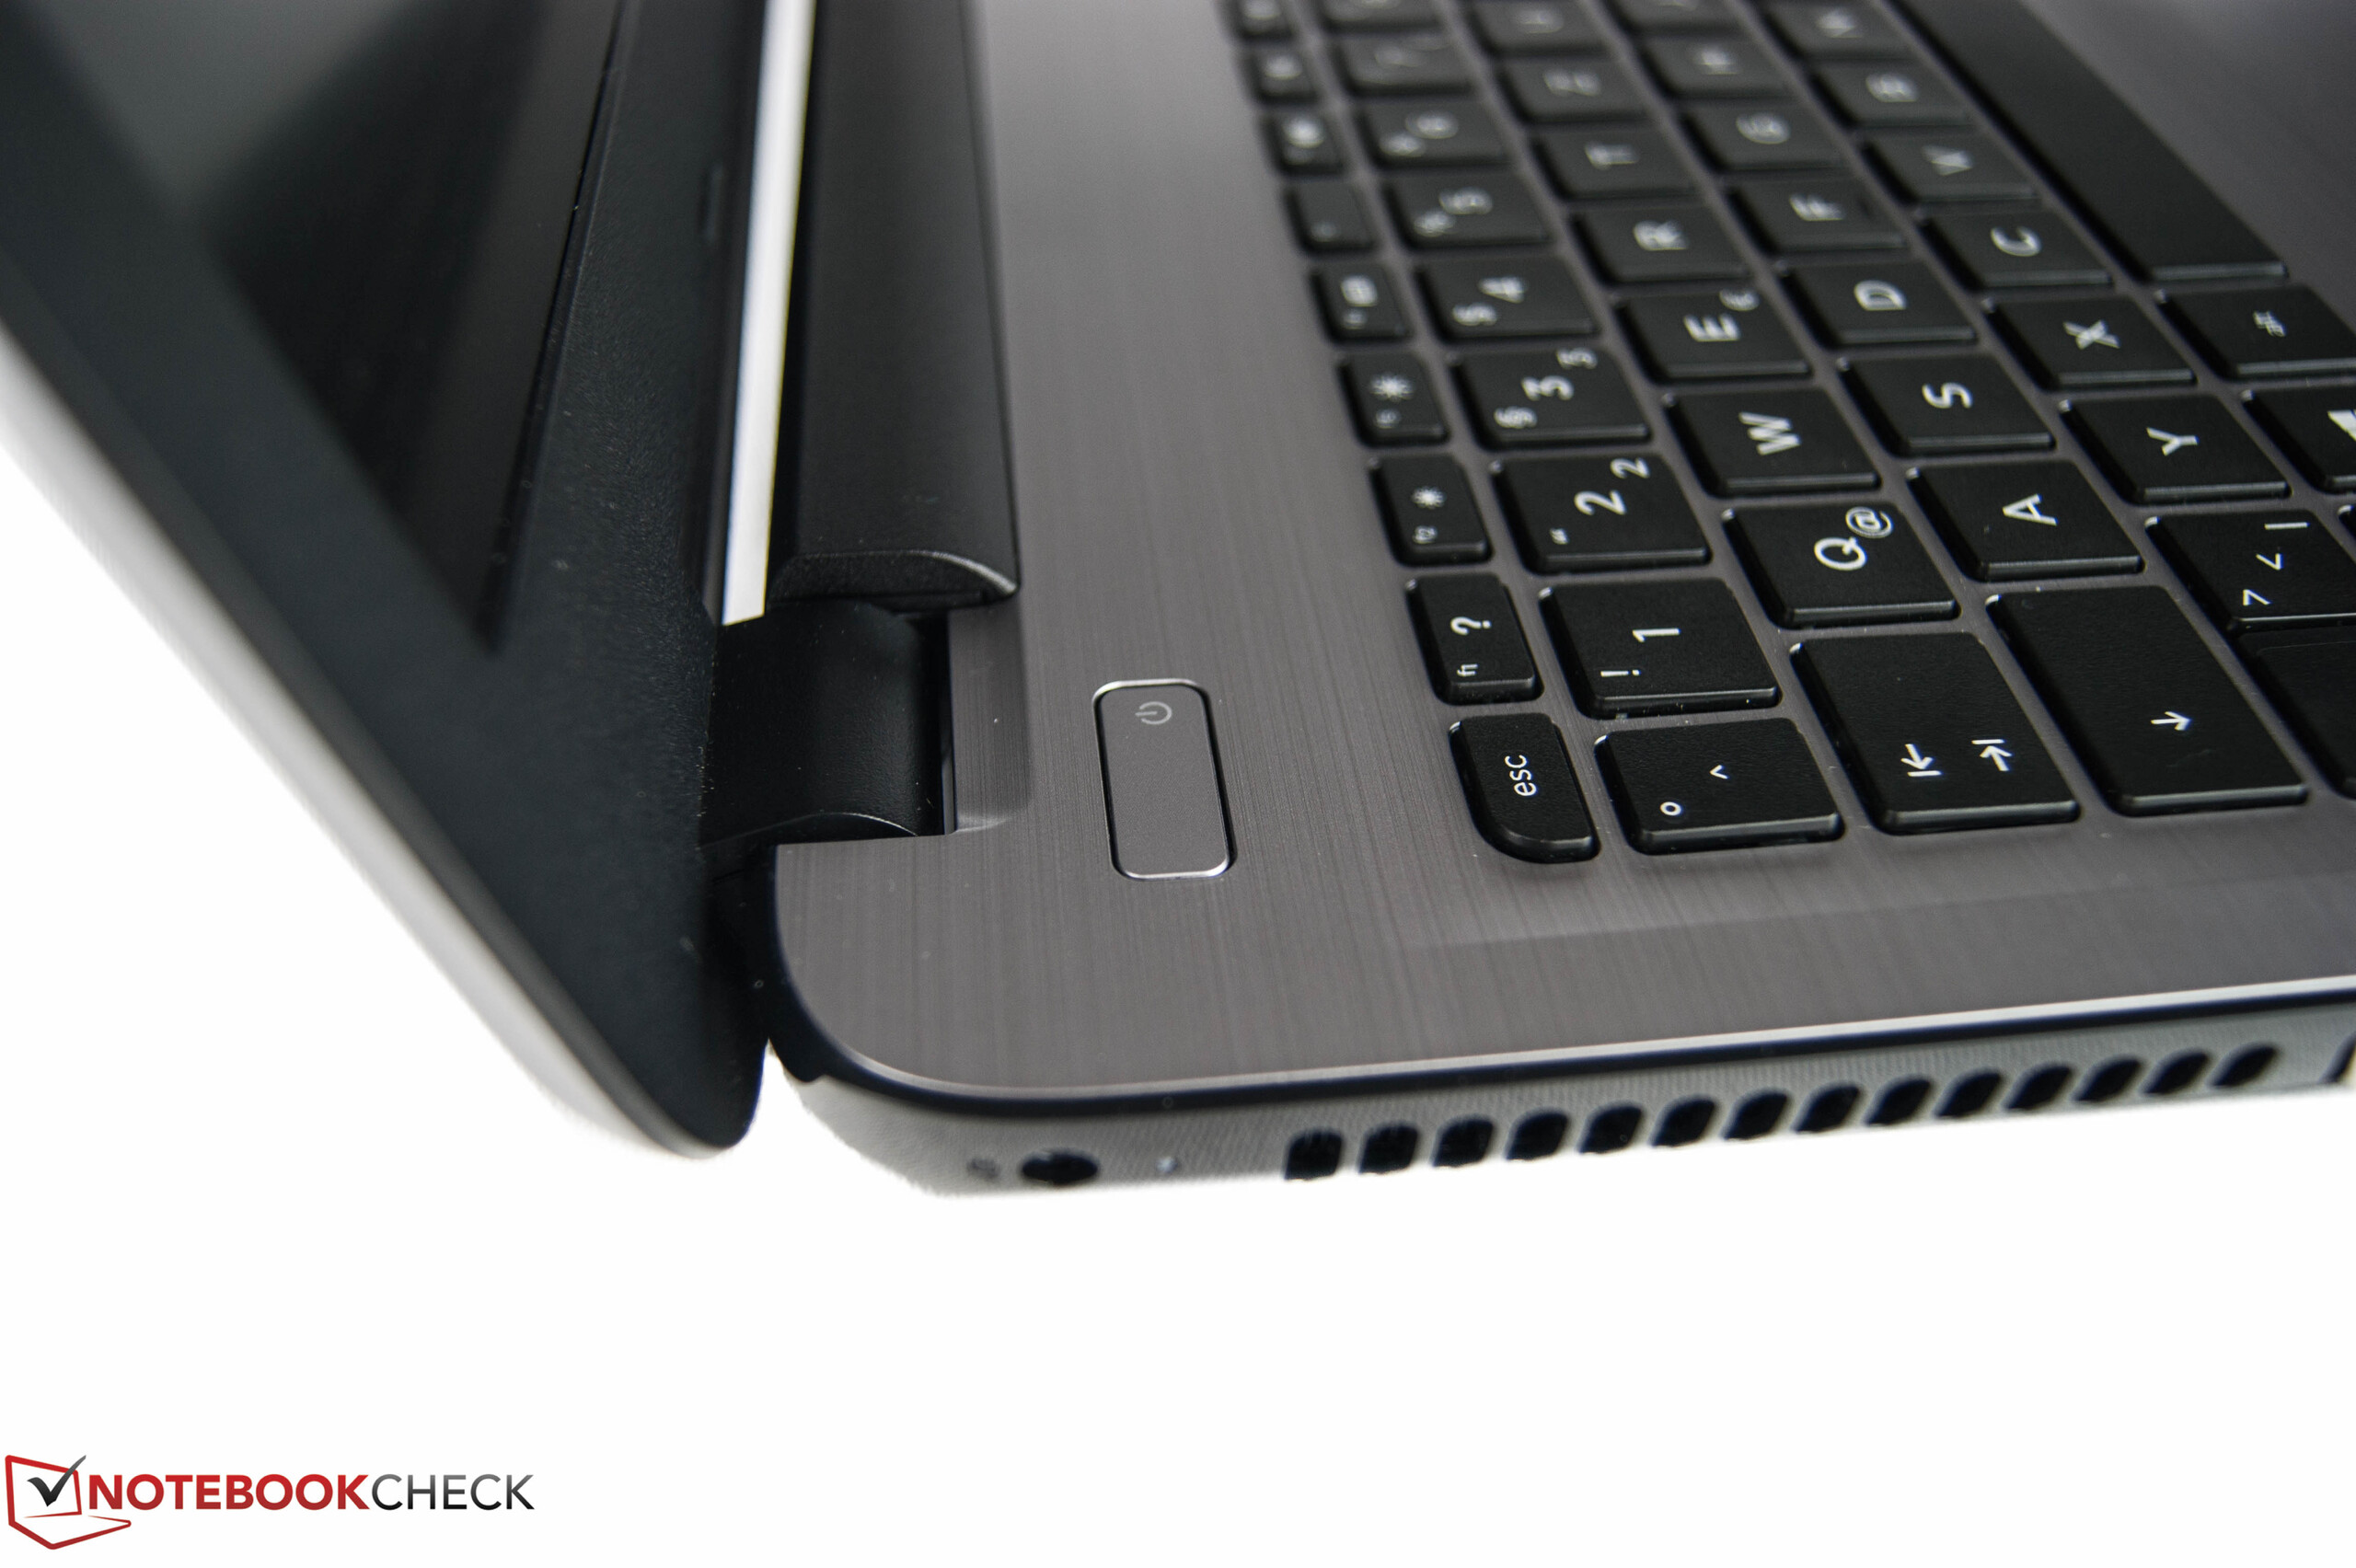
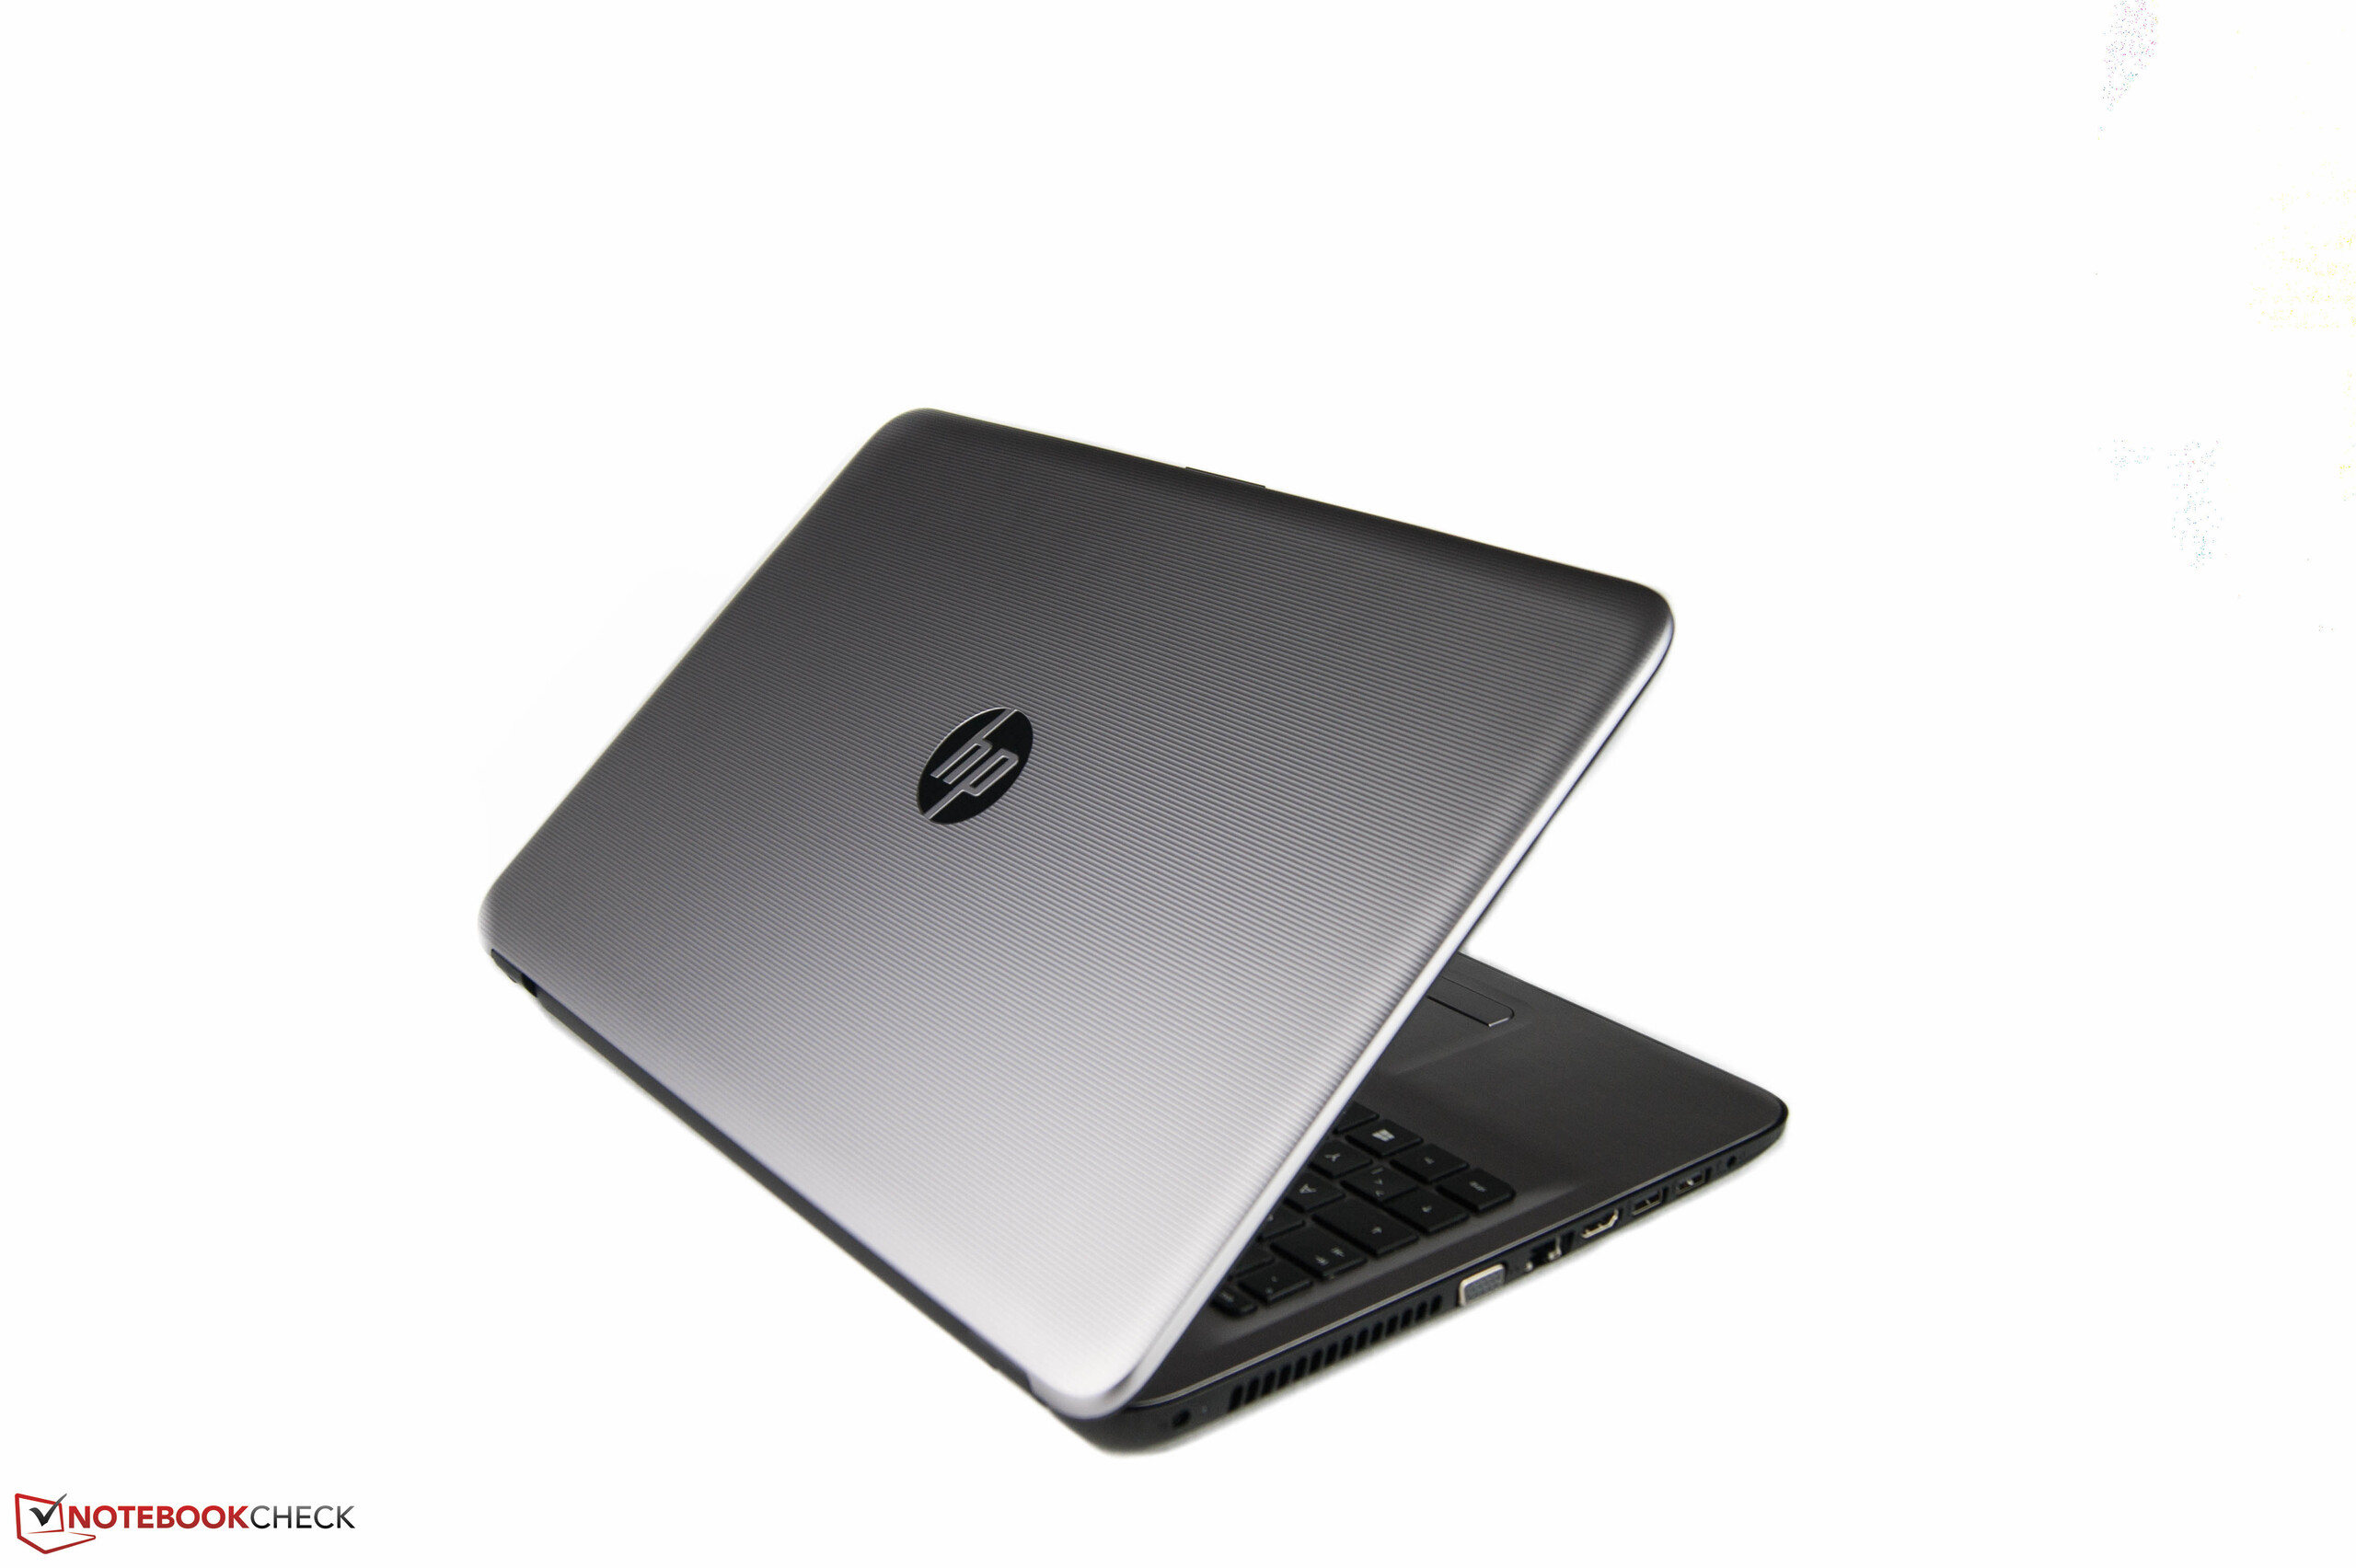
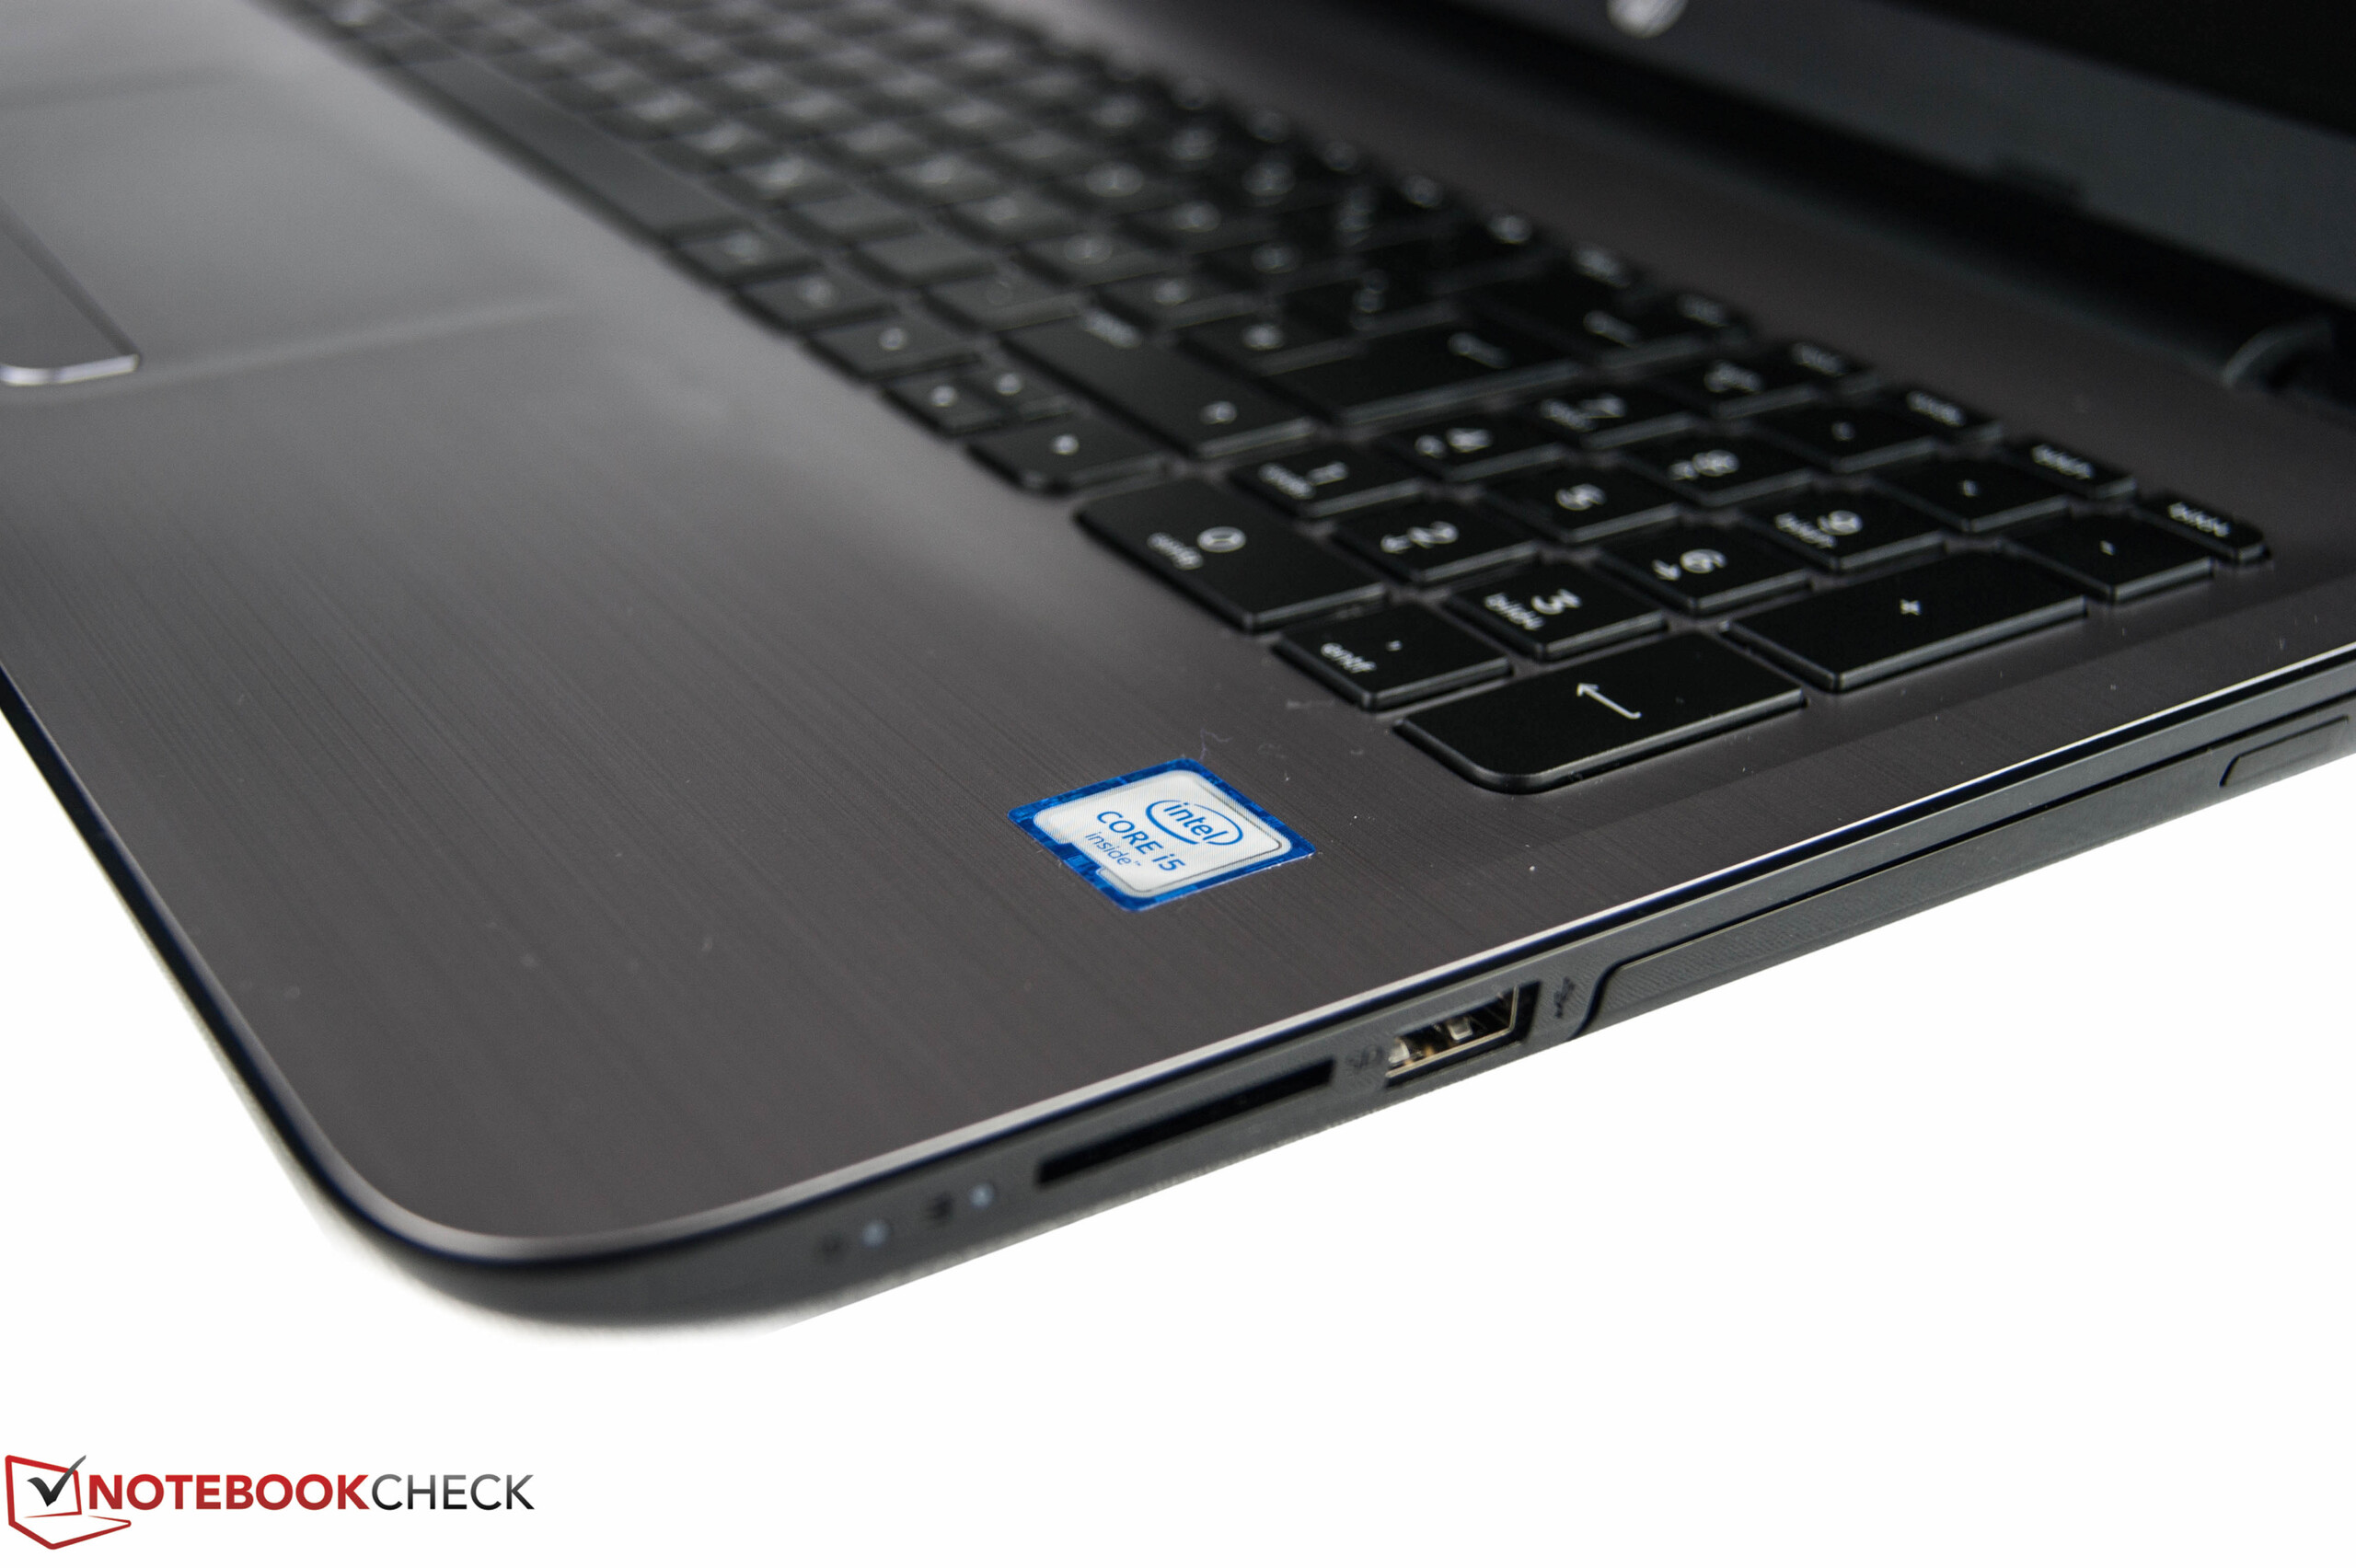
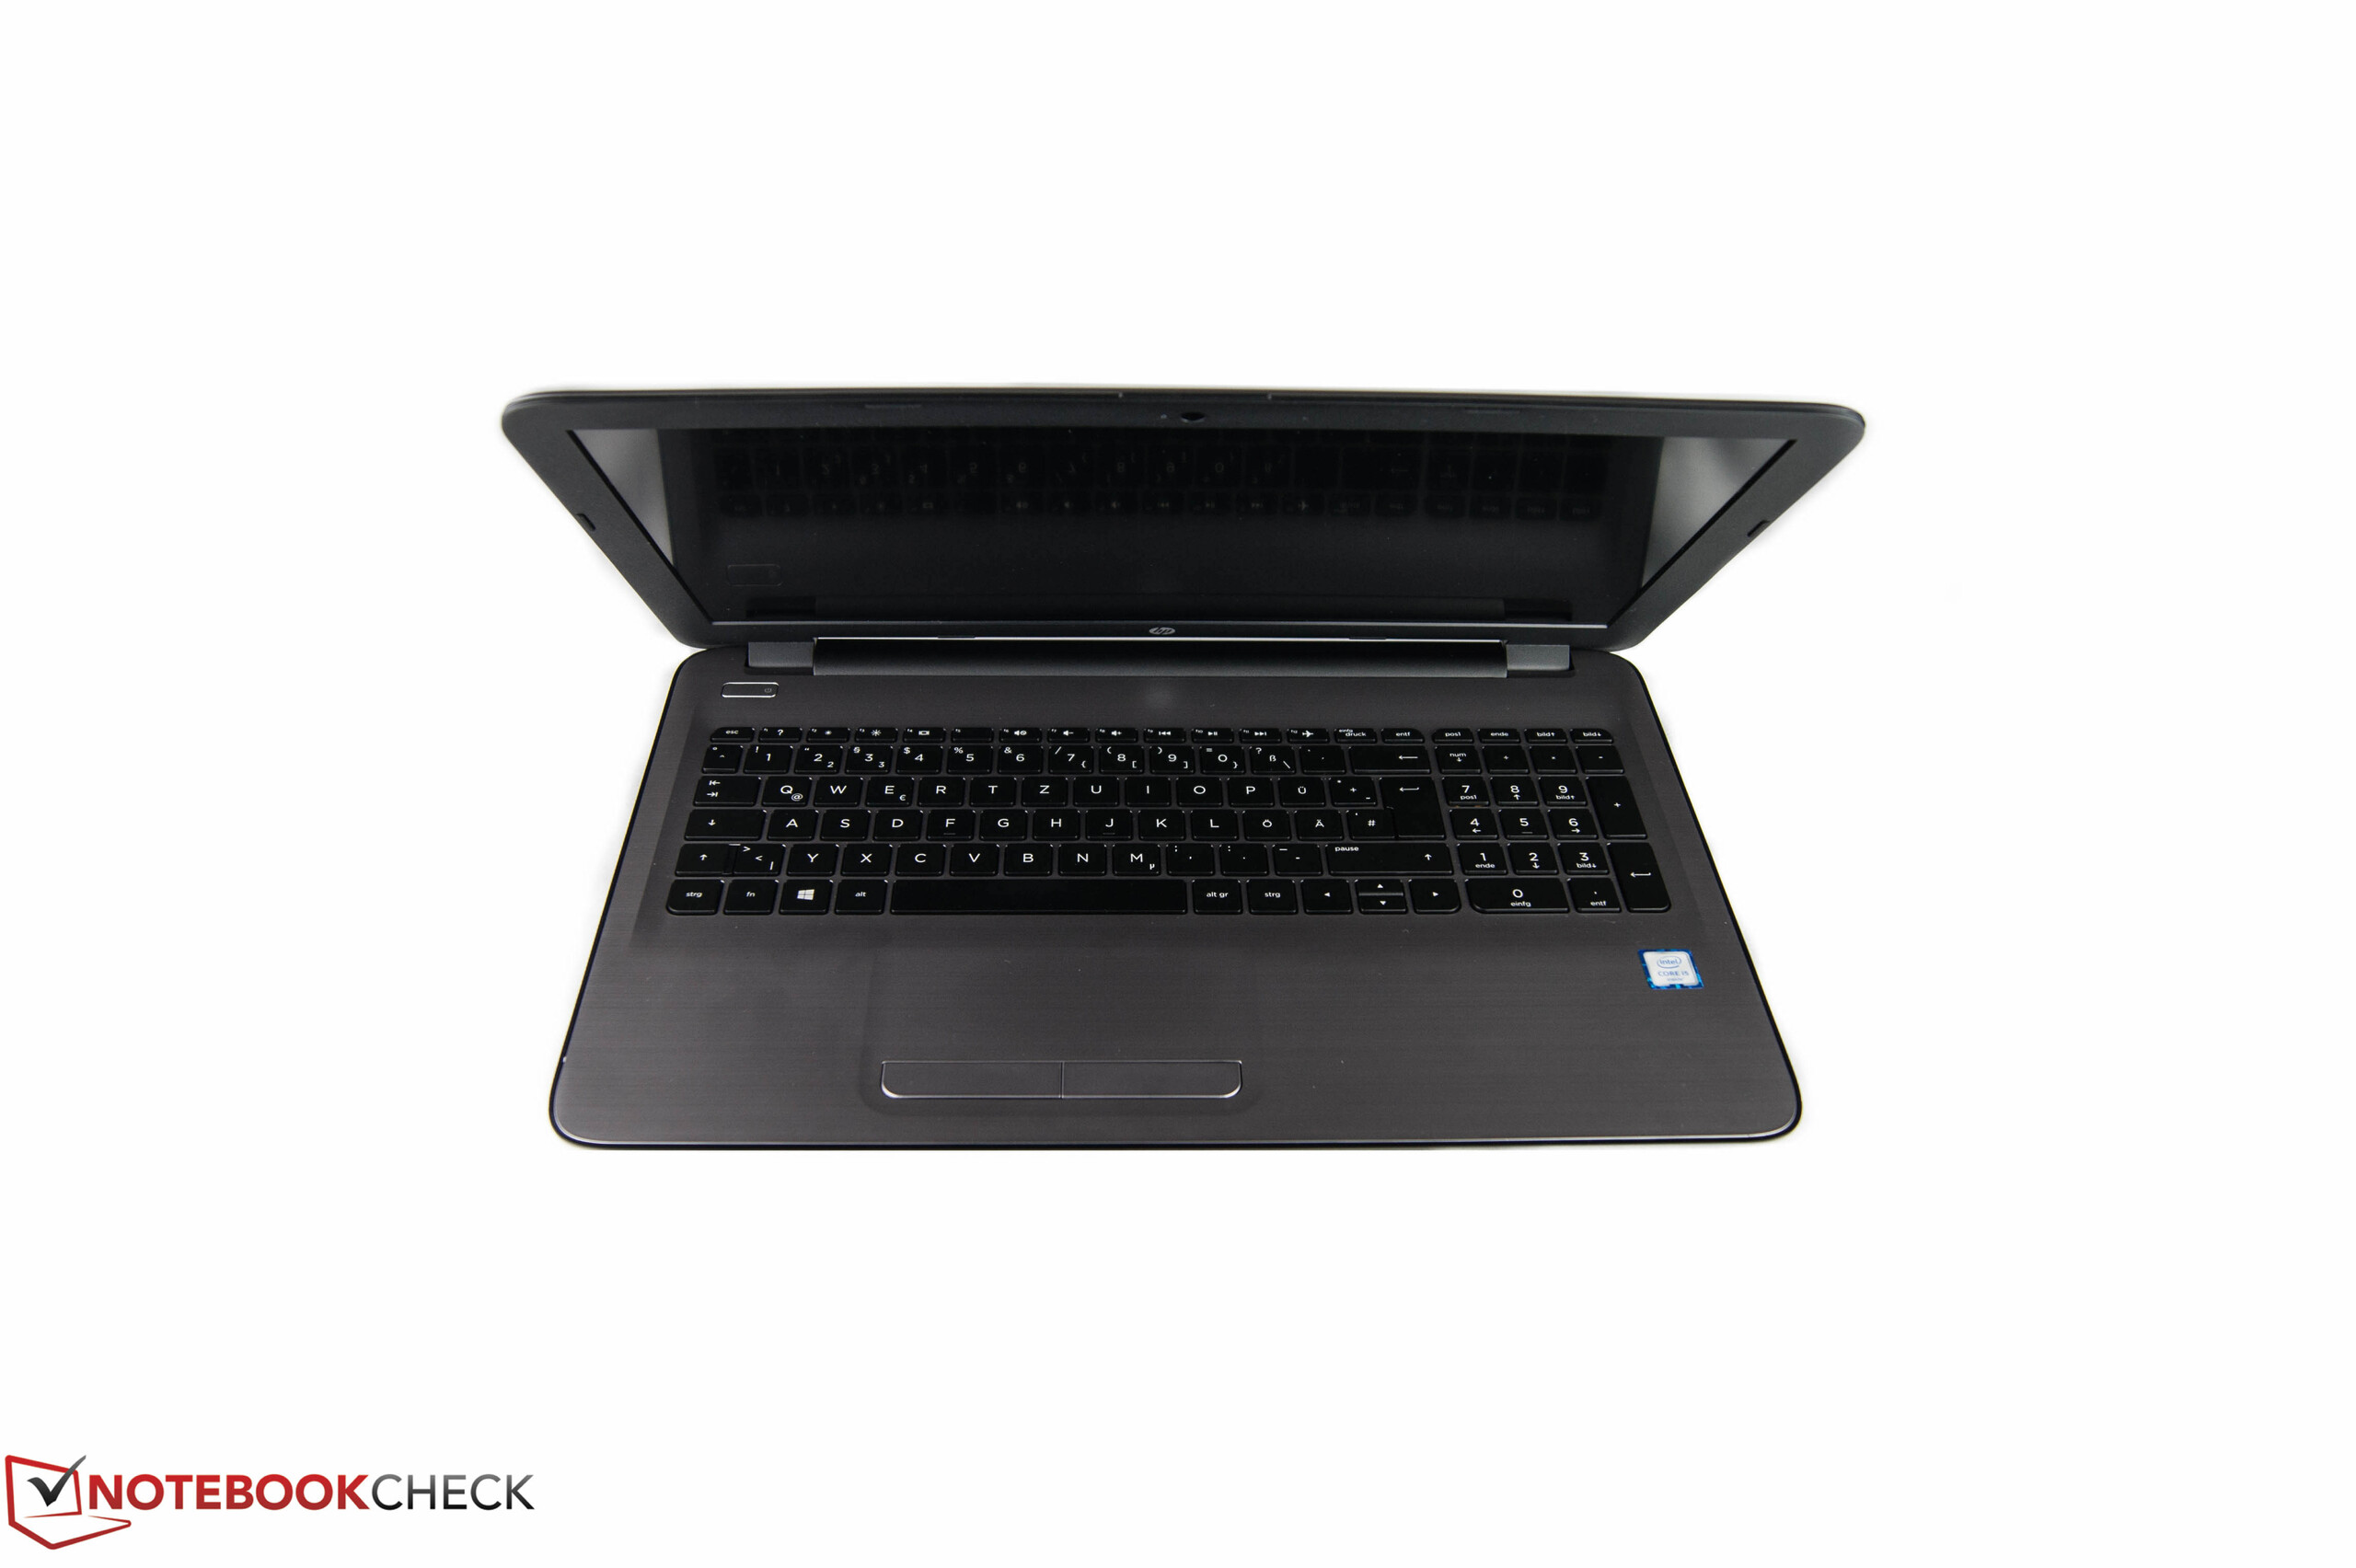
惠普带来了一台低价位的用于处理日常办公任务的多面手,特别是在大学使用或者作为入门级商务本。多亏了众多可供选择的产品,你可以在各价位上找到合适你的产品。消费者在这个价位上应该期待些什么?它的外壳设计简单而且几乎全由塑料构成。但至少,厂商尝试着使它拥有高端的外观,使它看起来像铝制外壳。输入设备对于一般的办公工作来说是足够了而且达到了这个价位的标准线。我们期待在下一代上能够有更长的键程和不那么软的输入体验。附带,触摸板上的按键应该更安静一些。
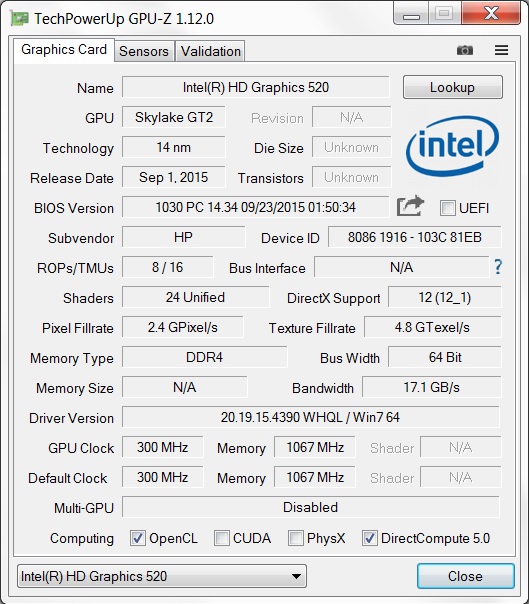
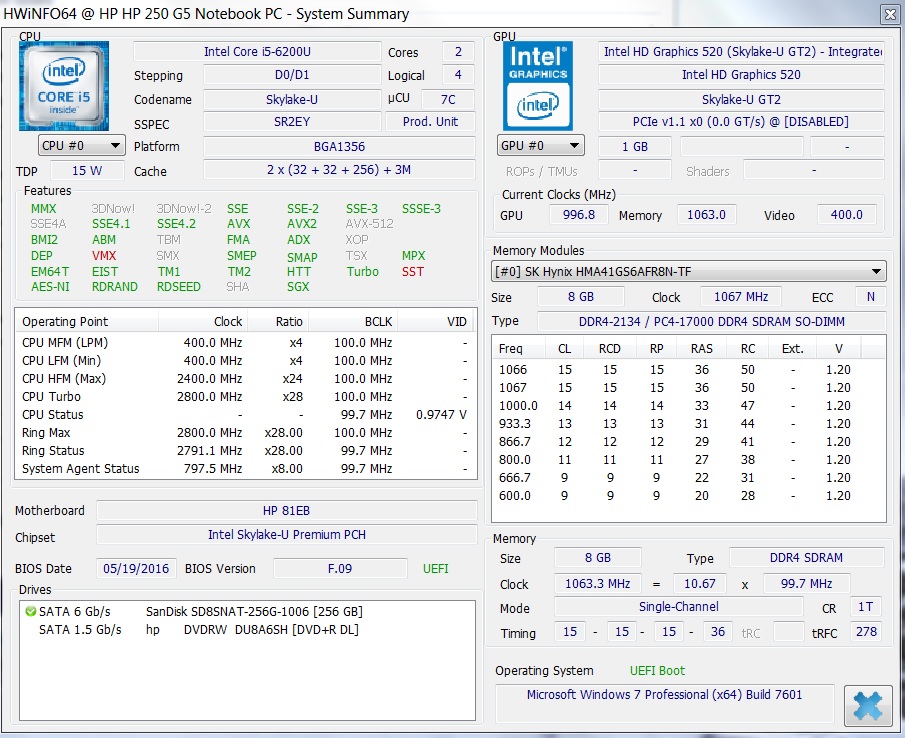
本代新增了最新的全高清屏幕。但不幸的是,它明显偏蓝而且亮度不足。我们认为惠普 250 G5的性能表现是值得称赞的。所搭载的固态硬盘和Core i5处理器使得工作变得十分愉快。只有一点是不幸的,自行升级有些困难。另一个优点是它较低的工作温度,但风扇控制应该得到改善。
总体上来说惠普在提供了一款平衡的五代机型。
对于那些十分看重续航能力的人来说可以阅读我们的戴尔 Latitude 3570 评测。如果看中高品质的IPS屏幕可以考虑购买联想 ThinkPad L560。
注:本文是基于完整评测的缩减版本,阅读完整的英文评测,请点击这里。
HP 250 G5 SP X0N33EA
- 10/26/2016 v5.1 (old)
Nino Ricchizzi