




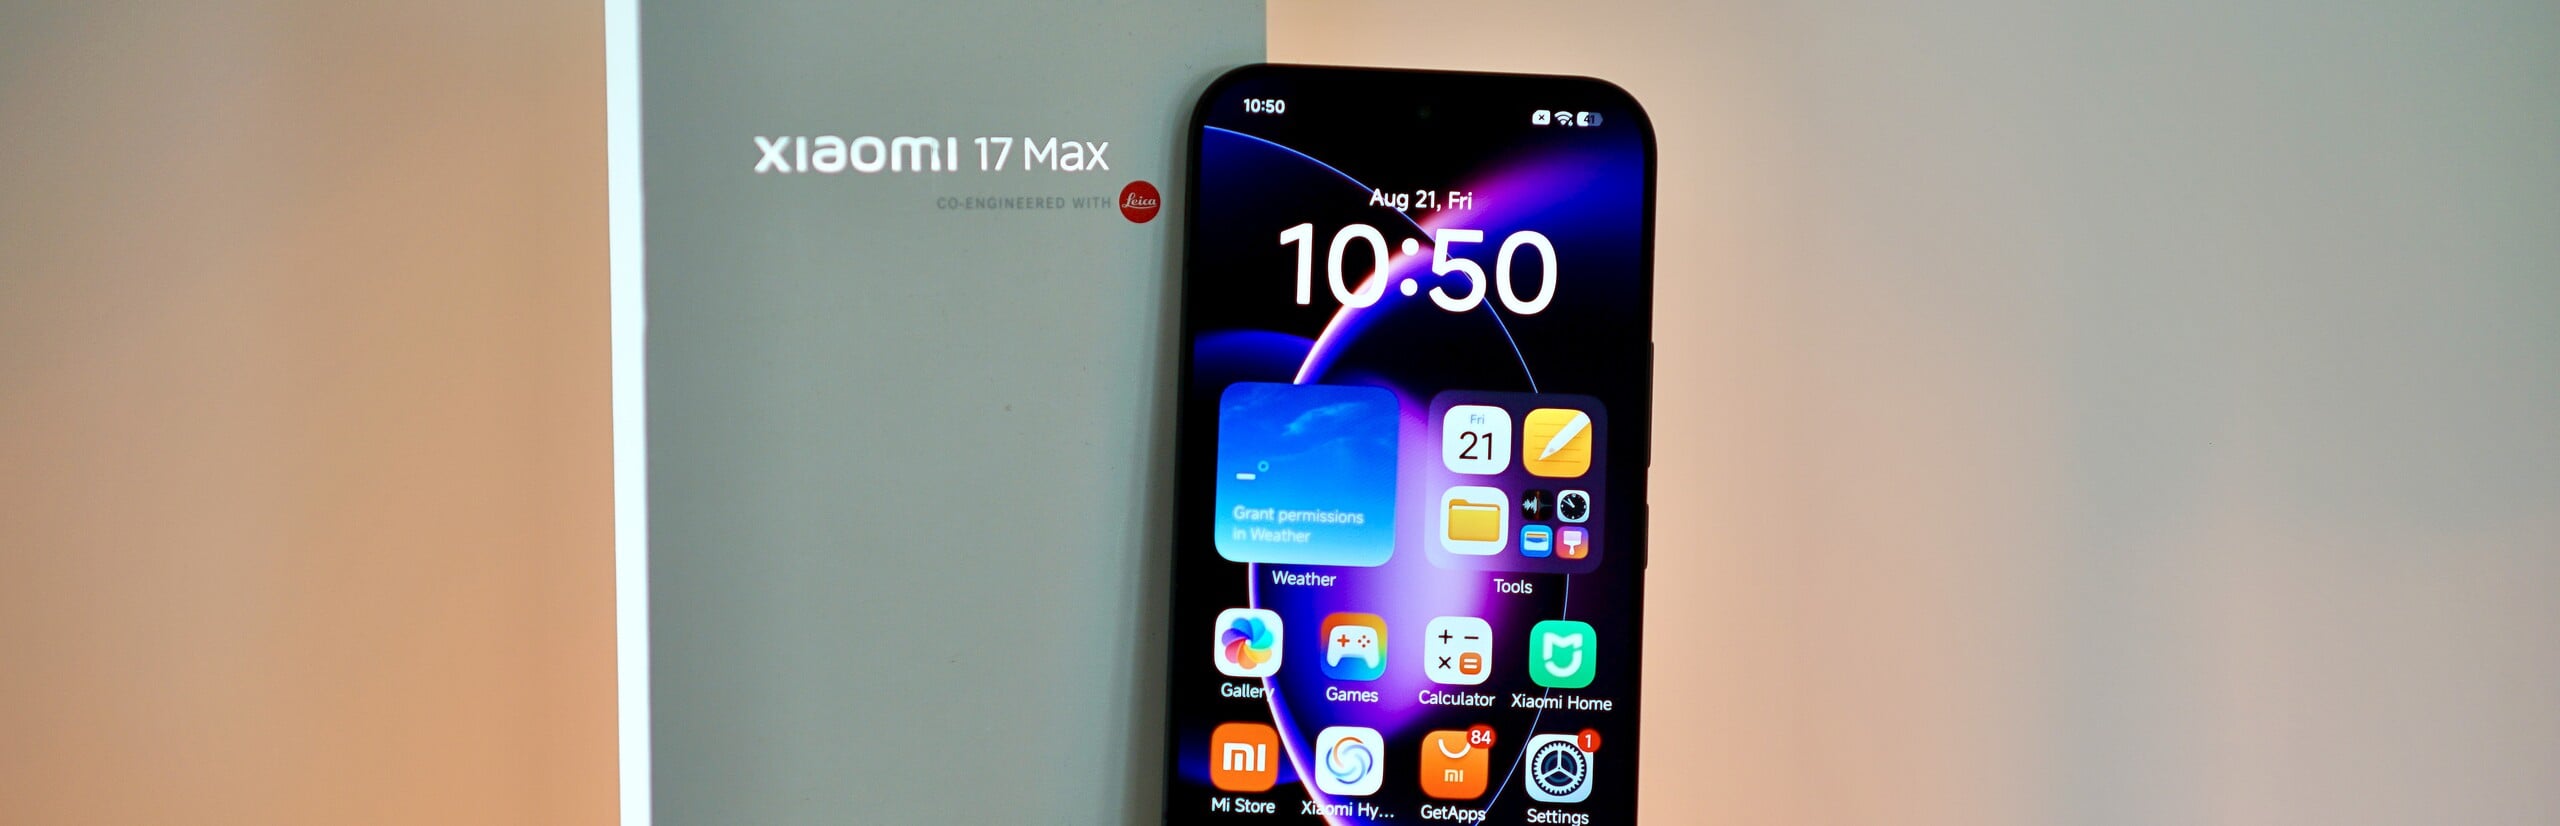
小米17 Max评测
小米17 Max是本已出色的小米17系列中一款引人注目的新成员:它配备了比小米17更大的屏幕、更大的电池容量,以及更出色的摄像头。 由于该机型从中国进口,价格非常实惠,但您需要接受一些不足之处,例如不支持 eSIM、不支持 Android Auto,以及用户界面仅提供英语这一种西方语言。
小米17 Max是一款品质极佳的手机,其屏幕边框几乎不可见,配备了经徕卡优化的出色摄像头系统,变焦性能出色,且电池续航能力轻松超越大多数其他顶级手机。
不过,你需要考虑机身重量会稍重一些,而且带有PWM闪烁现象的AMOLED屏幕可能会让对闪烁敏感的用户感到不适。
但总体而言,如果你正在寻找大屏幕、强劲性能和长续航的智能手机,小米17 Max是一款性价比极高的优秀机型。
Pros
Cons
价格与供货情况

小米17 Max目前仅可作为中国进口机购买;例如,在TradingShenzhen上的起售价约为770美元。
该设备预计不会在中国以外地区正式发布。

- $1,339.50XIAOMI 17 Ultra Ai 5G (Compatible with Tmobile Mint Tello & Global) (512GB + 16GB) NFC Global ROM Unlocked 200MP Triple Pro Leica Cam eSIM 6.9" 144Mhz Model 25128PNA1C Liberado (White.)
- $1,309.50XIAOMI 17 Ultra Ai 5G (Compatible with Tmobile Mint Tello & Global) (512GB + 16GB) NFC Global ROM Unlocked 200MP Triple Pro Leica Cam eSIM 6.9" 144Mhz Model 25128PNA1C Liberado (Black)
- $779.50XIAOMI 17T PRO Ai 5G (Compatible with Tmobile Mint Tello & Global) (512GB + 12GB) NFC Global ROM Unlocked 50MP Triple Pro Leica Cam eSIM 6.83" 144Mhz Model 2602EPTC0G Liberado (Black)
规格
案例与特点——质量极高
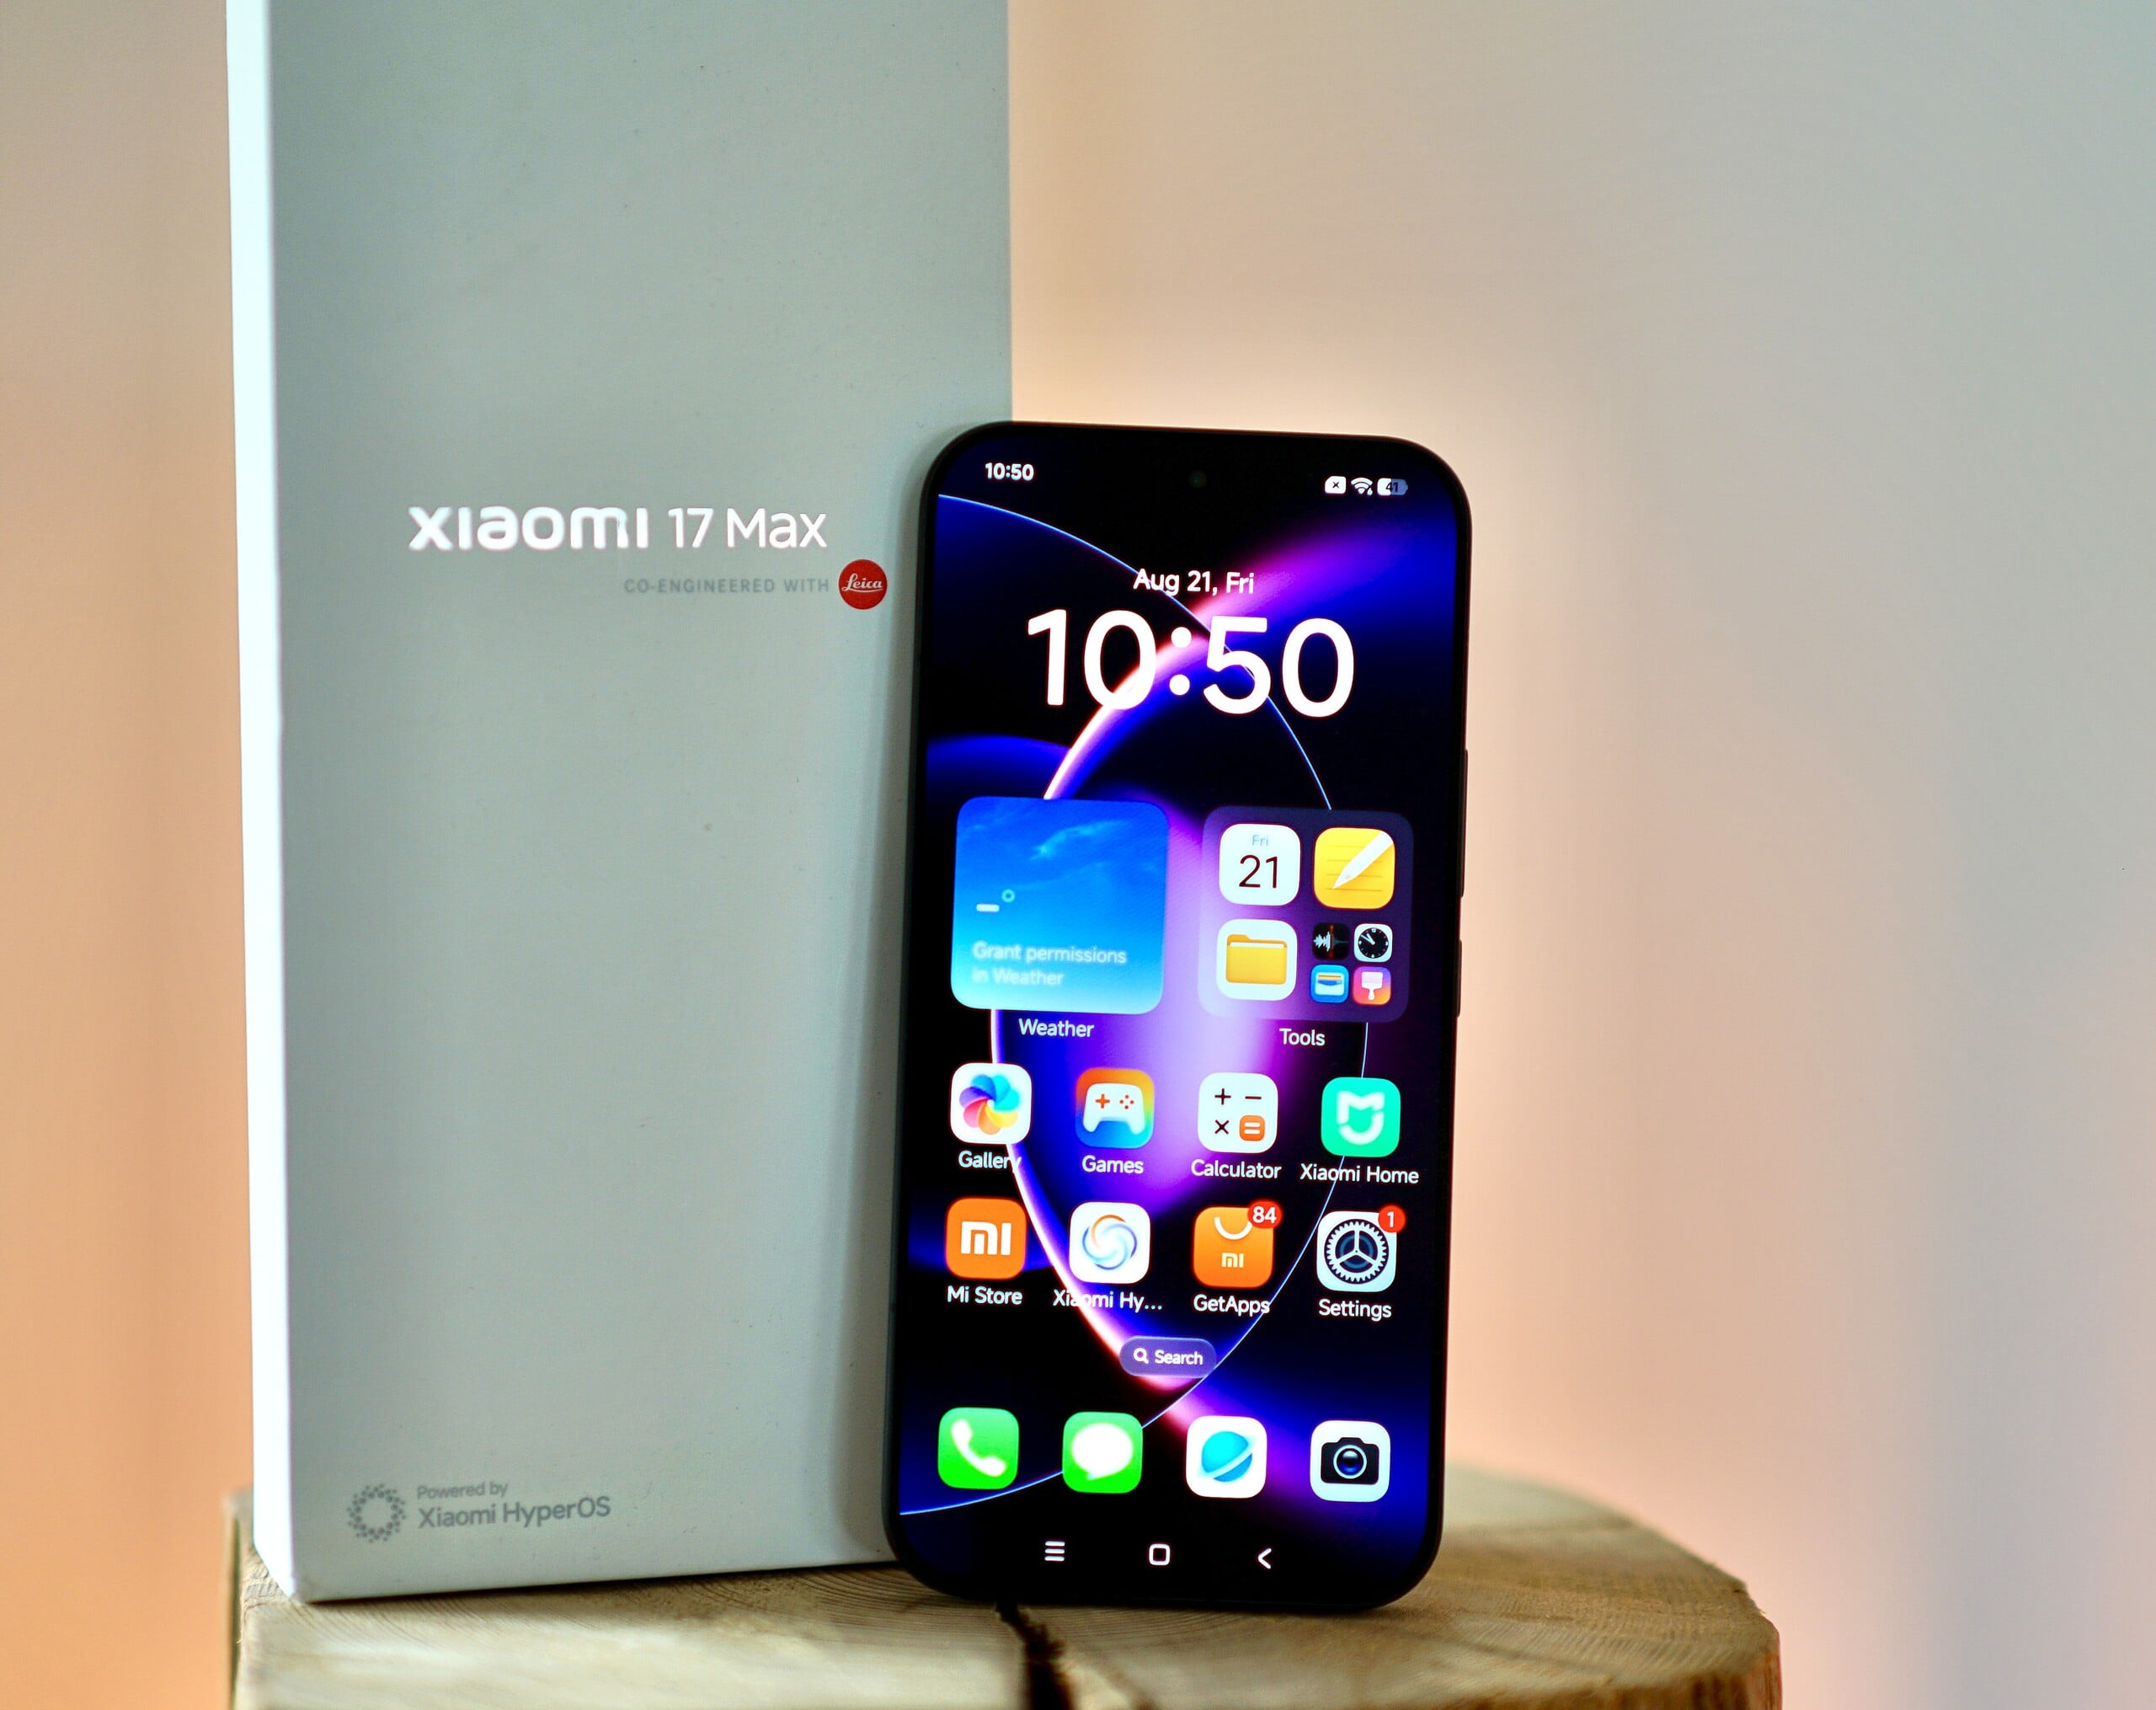
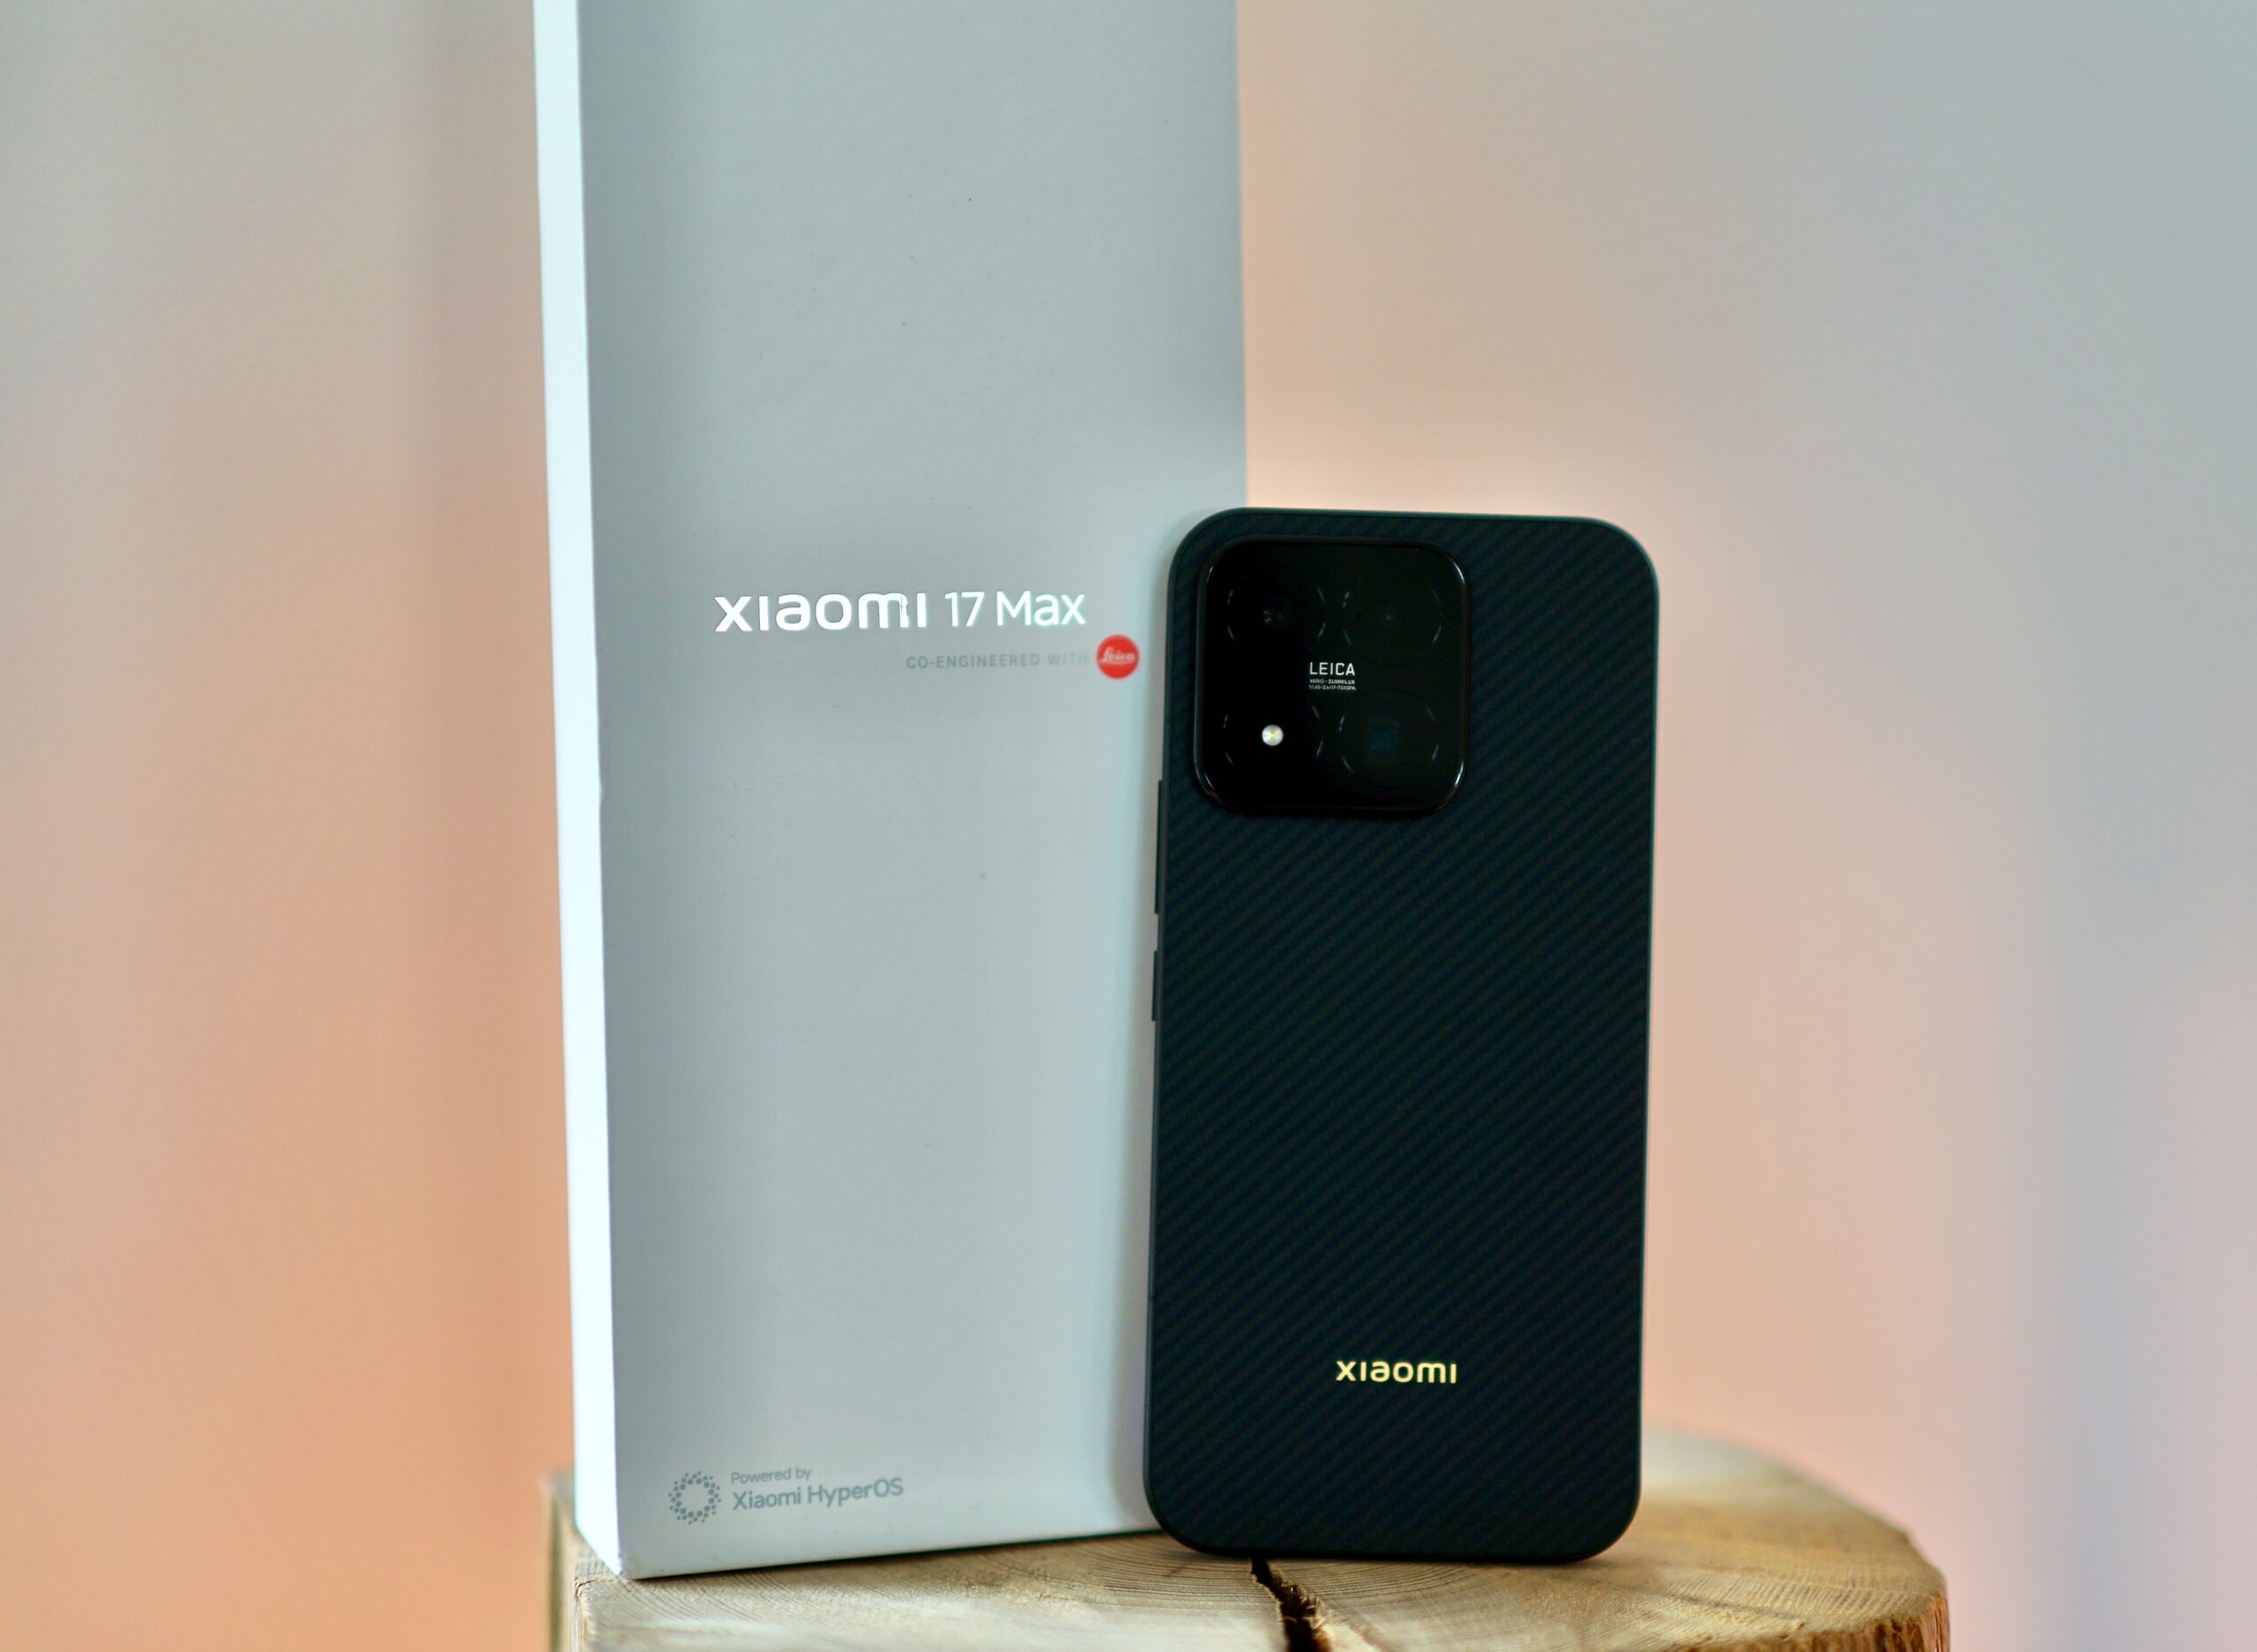
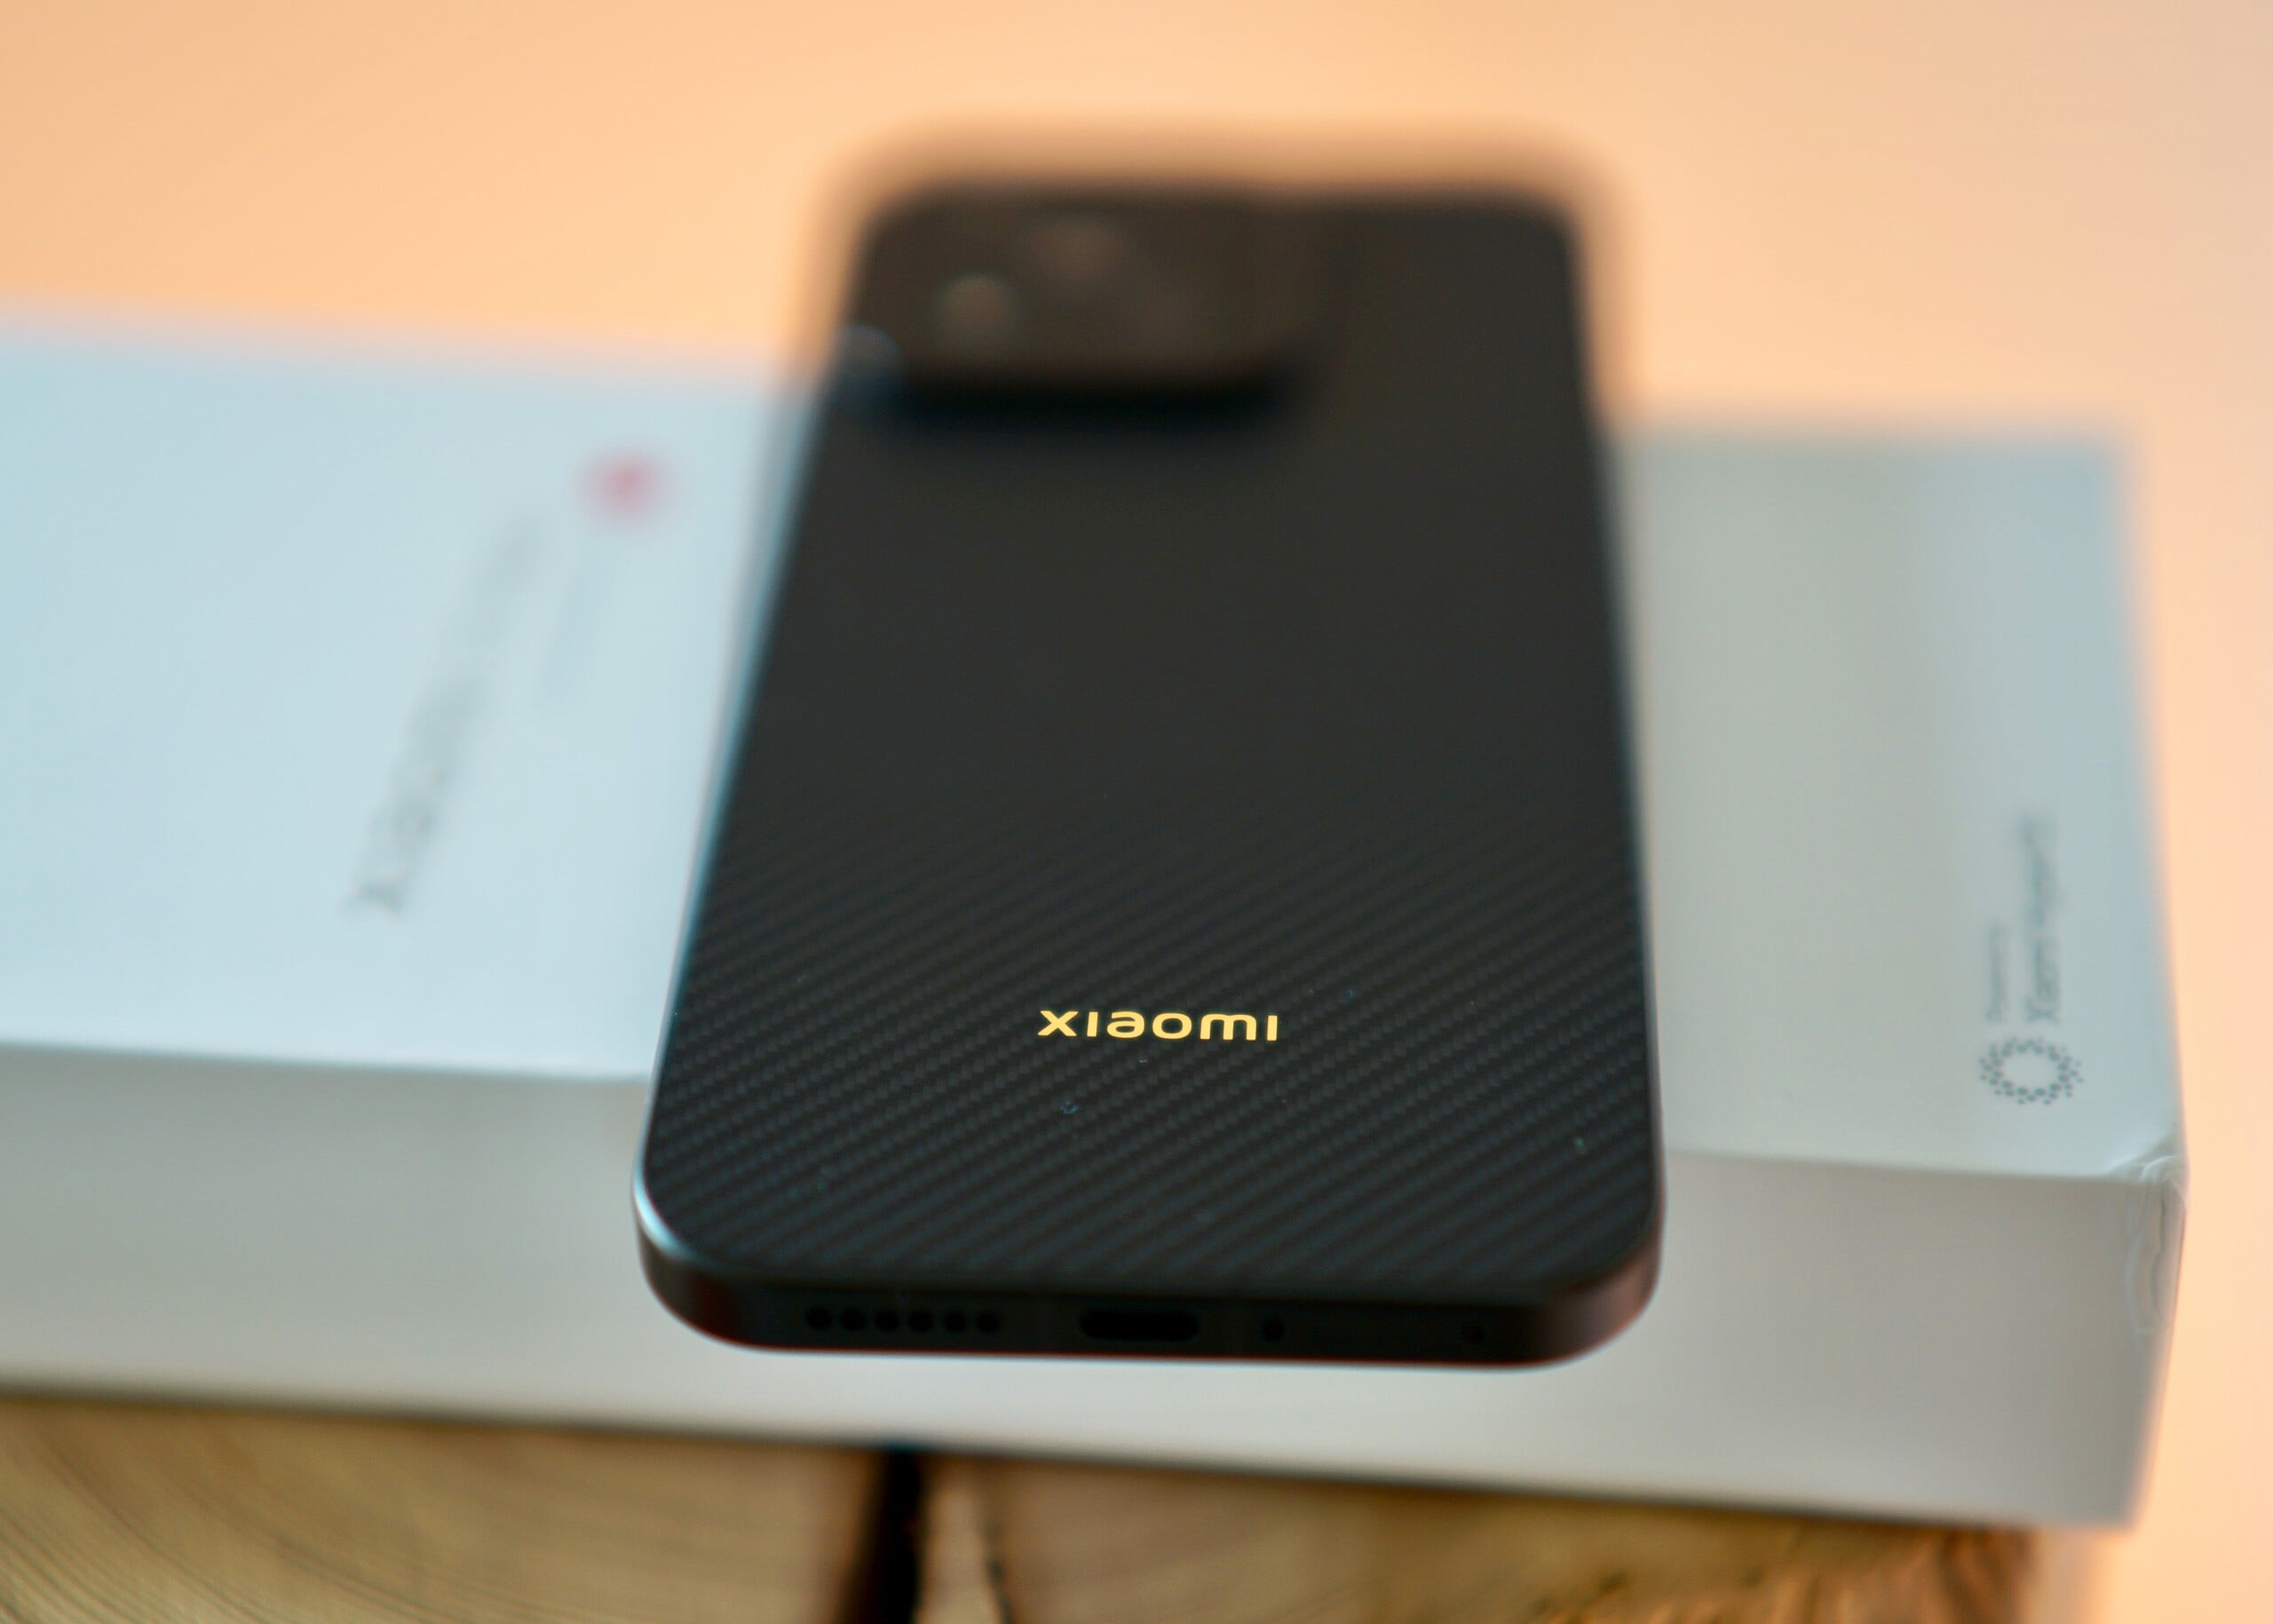
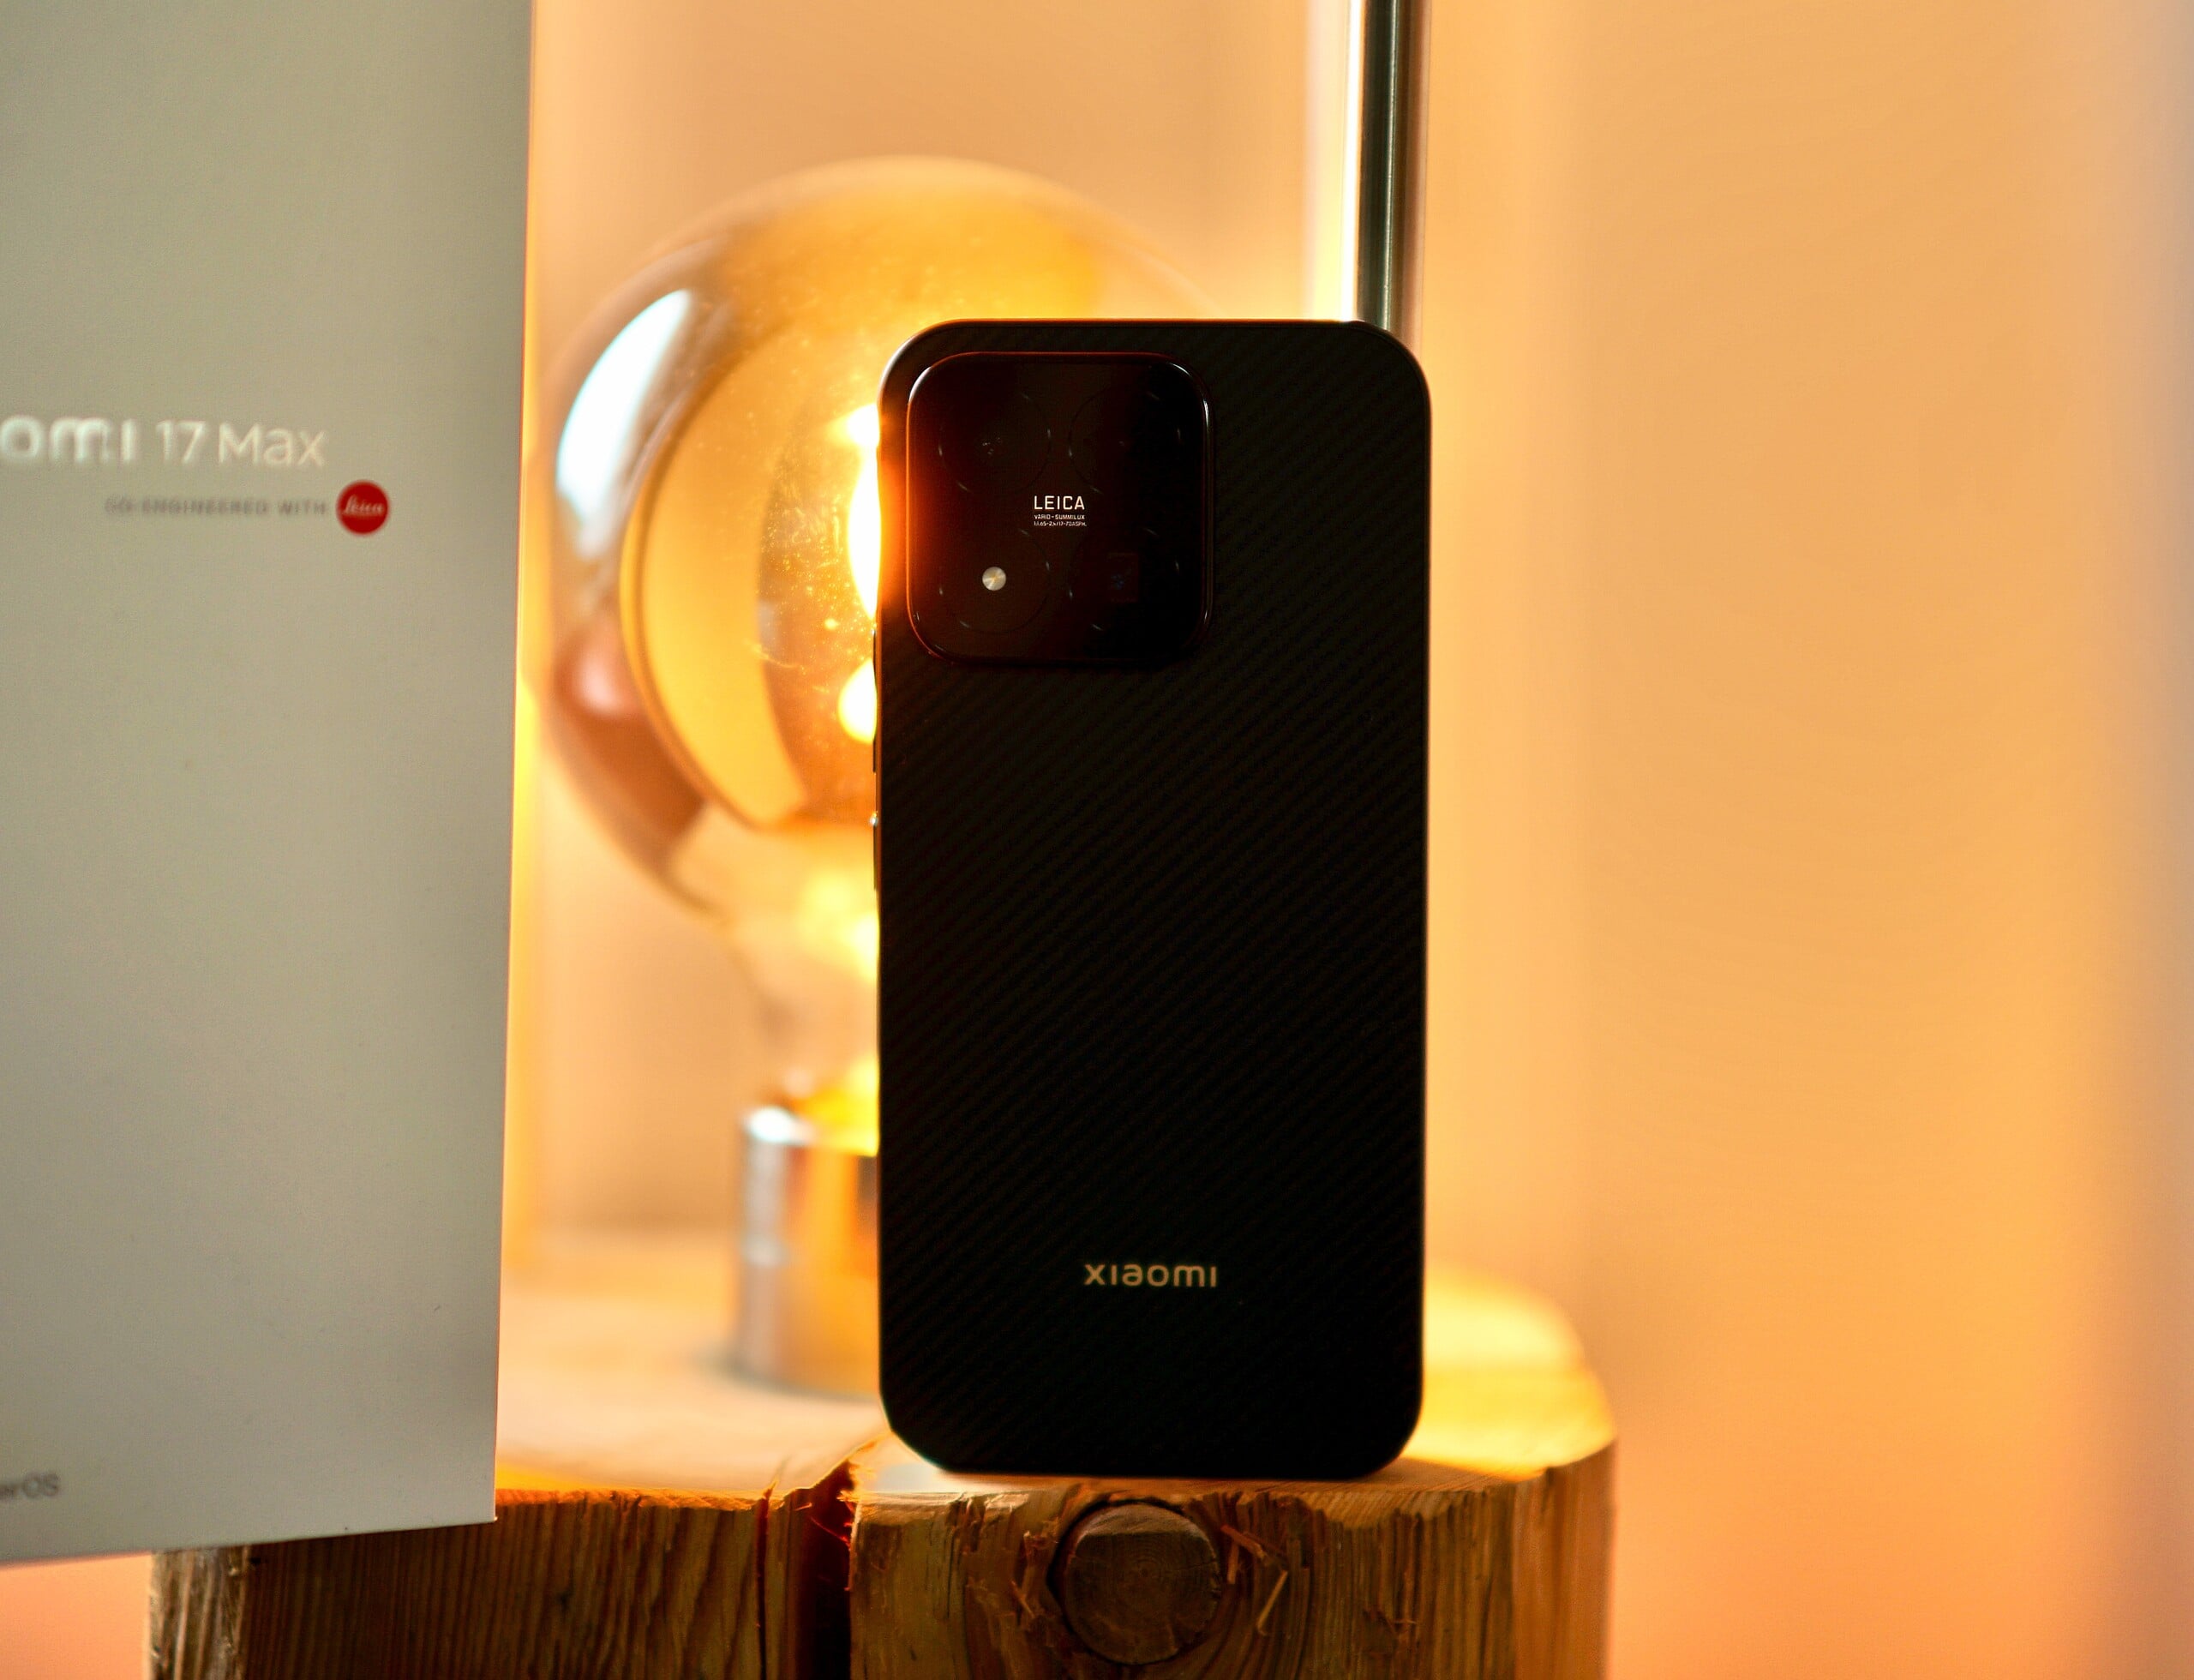
小米17 Max提供三种不同配色:白色、碳纤维纹理黑色和浅蓝色。 每款机型的后盖均采用玻璃材质,与机身颜色相配的边框则由铝合金制成。
做工堪称一流;手机手感极具高端质感,不同材质之间的衔接非常精准。正面屏幕周围的边框几乎难以察觉,赋予手机极具现代感的外观。
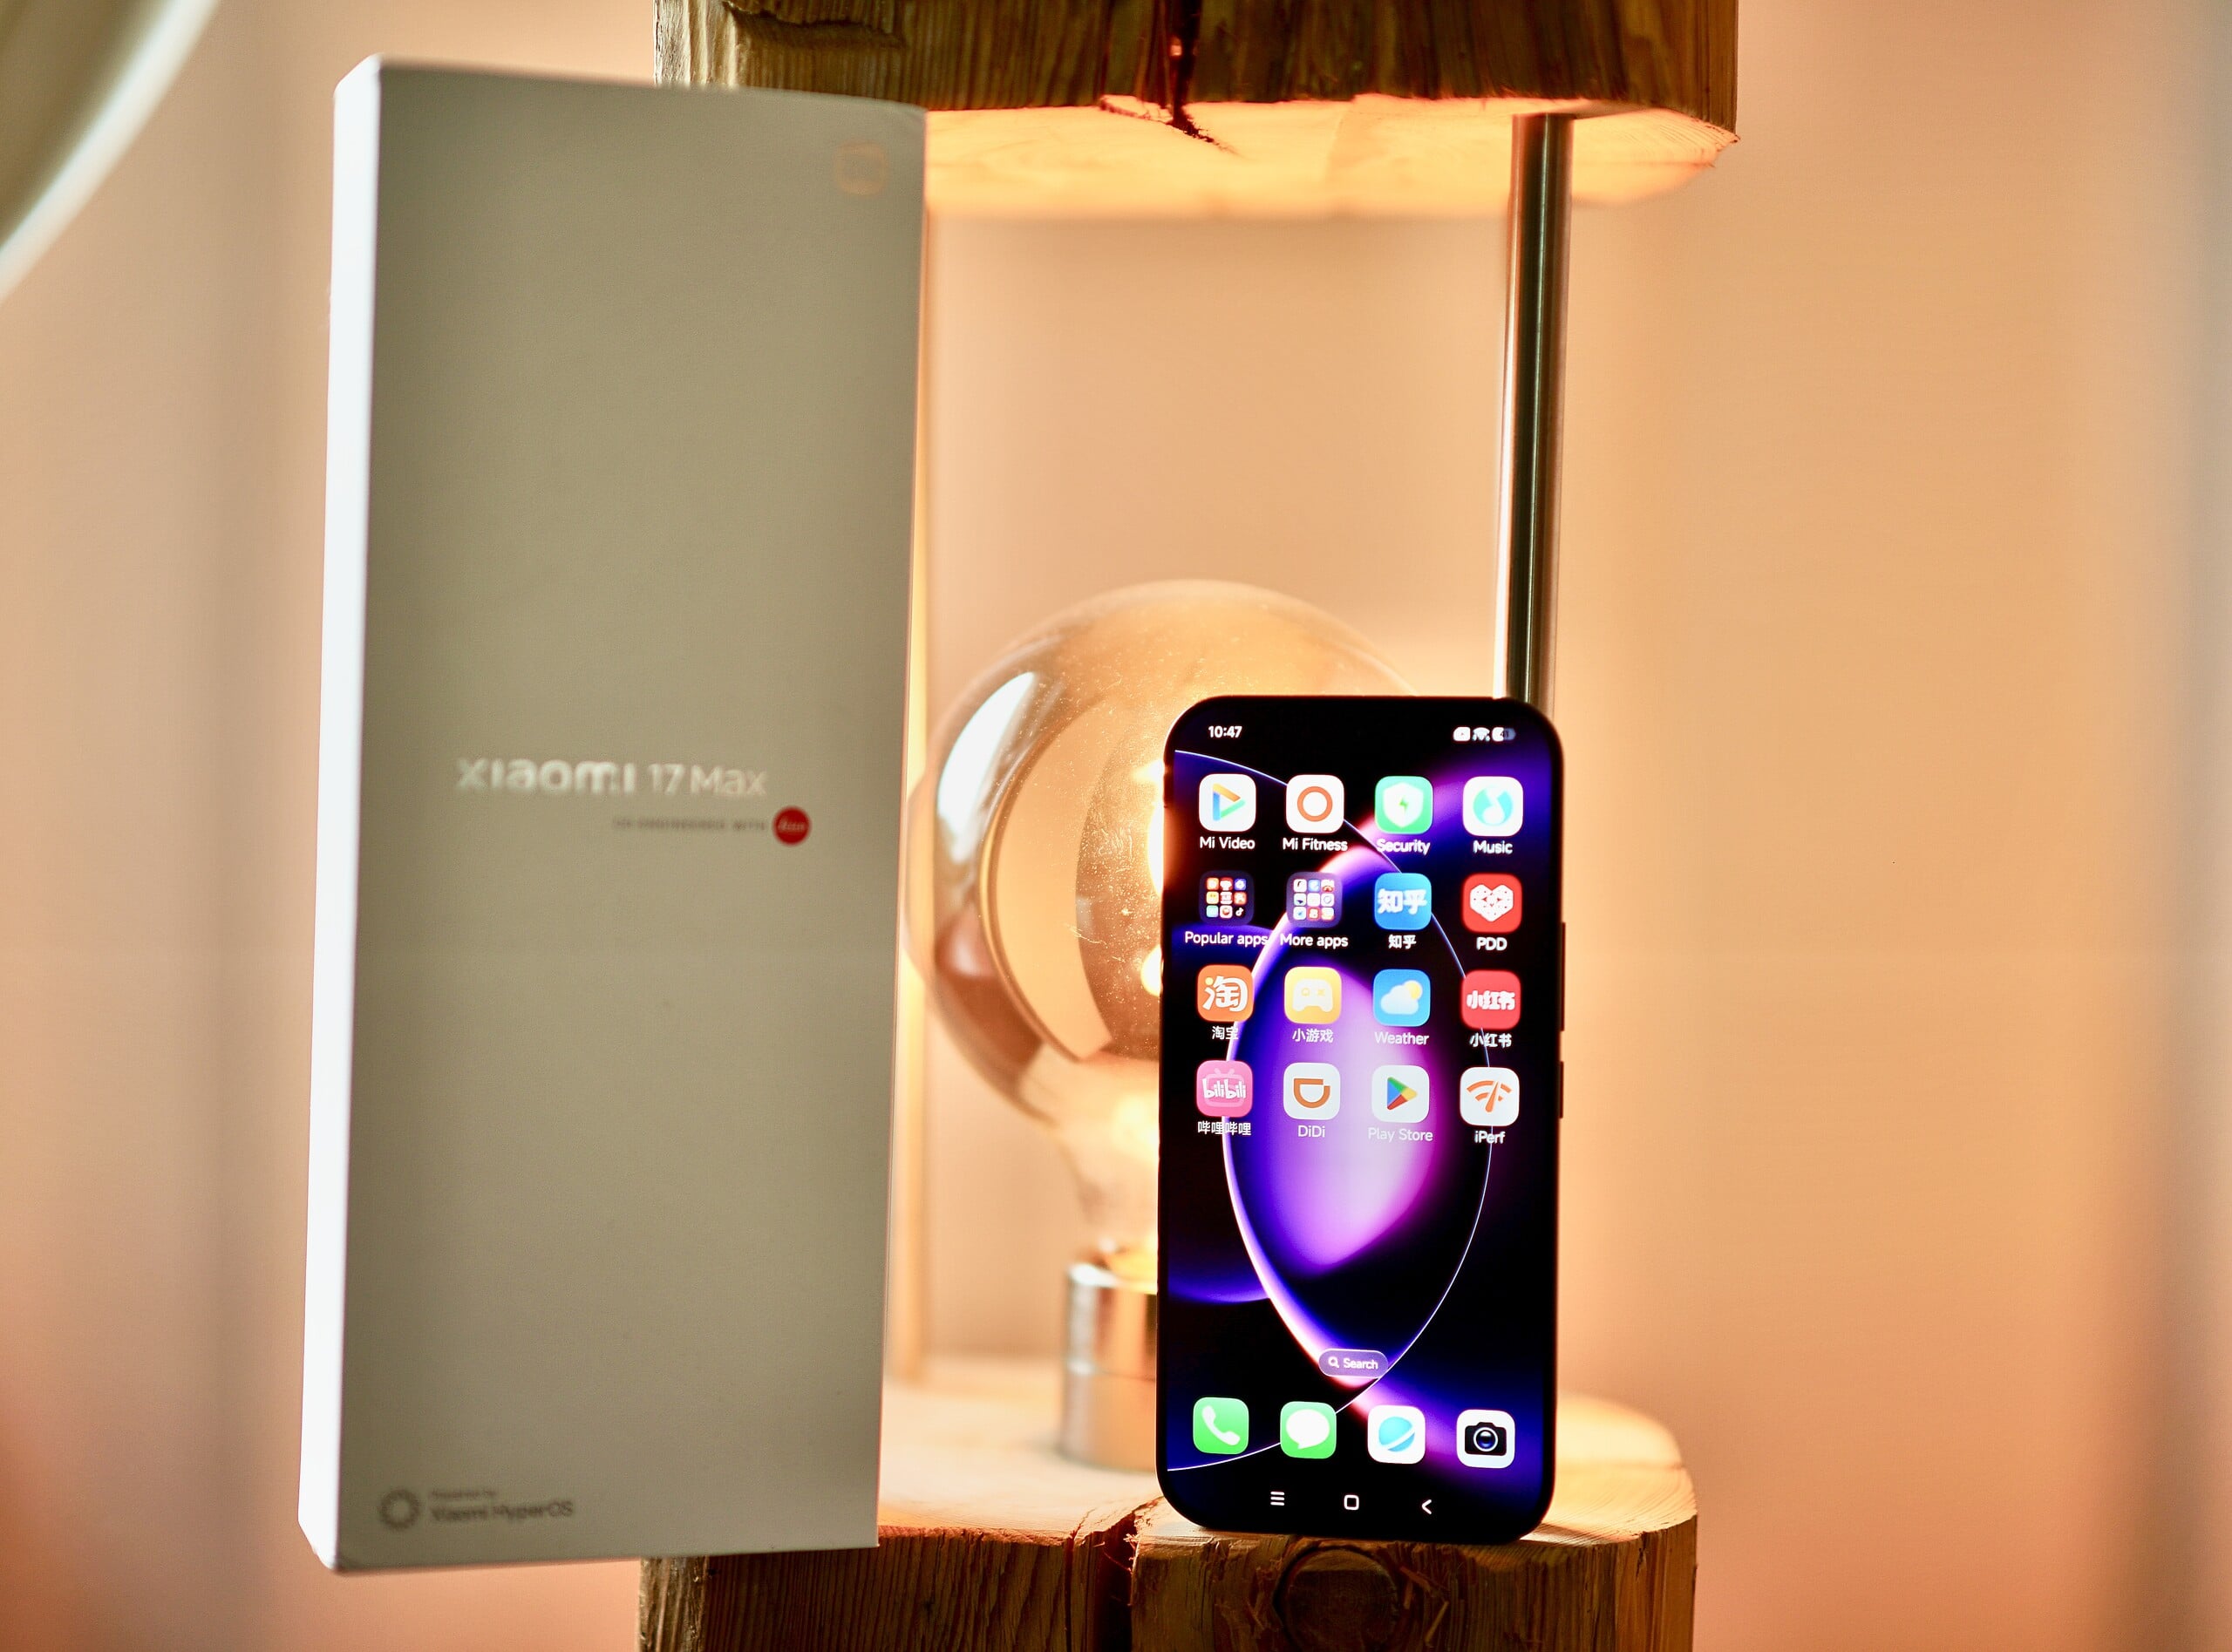
用户可选择12 GB运行内存搭配256 GB存储空间,或16 GB运行内存搭配512 GB存储空间;两者价格相差约100欧元。遗憾的是,该机型不支持eSIM,且与小米17不同,也没有红外传感器。
通信与运营——可靠的移动通信
得益于对 WiFi 7 的支持,Wi-Fi 传输速率可达到极高水平;在我们使用华硕 RT-BE96U 参考路由器进行的测试中,测得最高速率高达 3,200 Mbit/s。这不仅完全满足千兆互联网连接的需求,即使在高速家庭网络中也能提供良好的数据传输速率。
它支持您所需的所有5G和4G频段,因此您可以使用小米17 Max在全球范围内畅享移动互联网。在我们的测试中,信号接收效果非常出色,即使在信号较差的环境下也是如此。
120Hz 显示屏可实现精准的边缘触控,并对输入操作响应极快。超声波指纹传感器内置于屏幕中,位置设计合理,经过一次设置后,响应速度极快。前置摄像头还支持 2D 人脸识别,其可靠性同样出色。
| Networking | |
| Xiaomi 17 Max | |
| iperf3 transmit Wi-Fi6/7 RT-BE96U | |
| iperf3 receive Wi-Fi6/7 RT-BE96U | |
| Xiaomi 17 | |
| iperf3 transmit AXE11000 6GHz | |
| iperf3 receive AXE11000 6GHz | |
| Samsung Galaxy S26 Ultra | |
| iperf3 transmit AXE11000 | |
| iperf3 receive AXE11000 | |
| iperf3 transmit AXE11000 6GHz | |
| iperf3 receive AXE11000 6GHz | |
| iperf3 transmit Wi-Fi6/7 RT-BE96U | |
| iperf3 receive Wi-Fi6/7 RT-BE96U | |
| OnePlus 15 | |
| iperf3 transmit AXE11000 6GHz | |
| iperf3 receive AXE11000 6GHz | |
| Apple iPhone 17 Pro Max | |
| iperf3 transmit AXE11000 | |
| iperf3 receive AXE11000 | |
| iperf3 transmit AXE11000 6GHz | |
| iperf3 receive AXE11000 6GHz | |
| Average 802.11 a/b/g/n/ac/ax/be | |
| iperf3 transmit AXE11000 | |
| iperf3 receive AXE11000 | |
| iperf3 transmit AXE11000 6GHz | |
| iperf3 receive AXE11000 6GHz | |
| iperf3 transmit Wi-Fi6/7 RT-BE96U | |
| iperf3 receive Wi-Fi6/7 RT-BE96U | |
| Average of class Smartphone | |
| iperf3 transmit AXE11000 | |
| iperf3 receive AXE11000 | |
| iperf3 transmit AXE11000 6GHz | |
| iperf3 receive AXE11000 6GHz | |
| iperf3 transmit Wi-Fi6/7 RT-BE96U | |
| iperf3 receive Wi-Fi6/7 RT-BE96U | |
软件与可持续发展——更新内容不明确
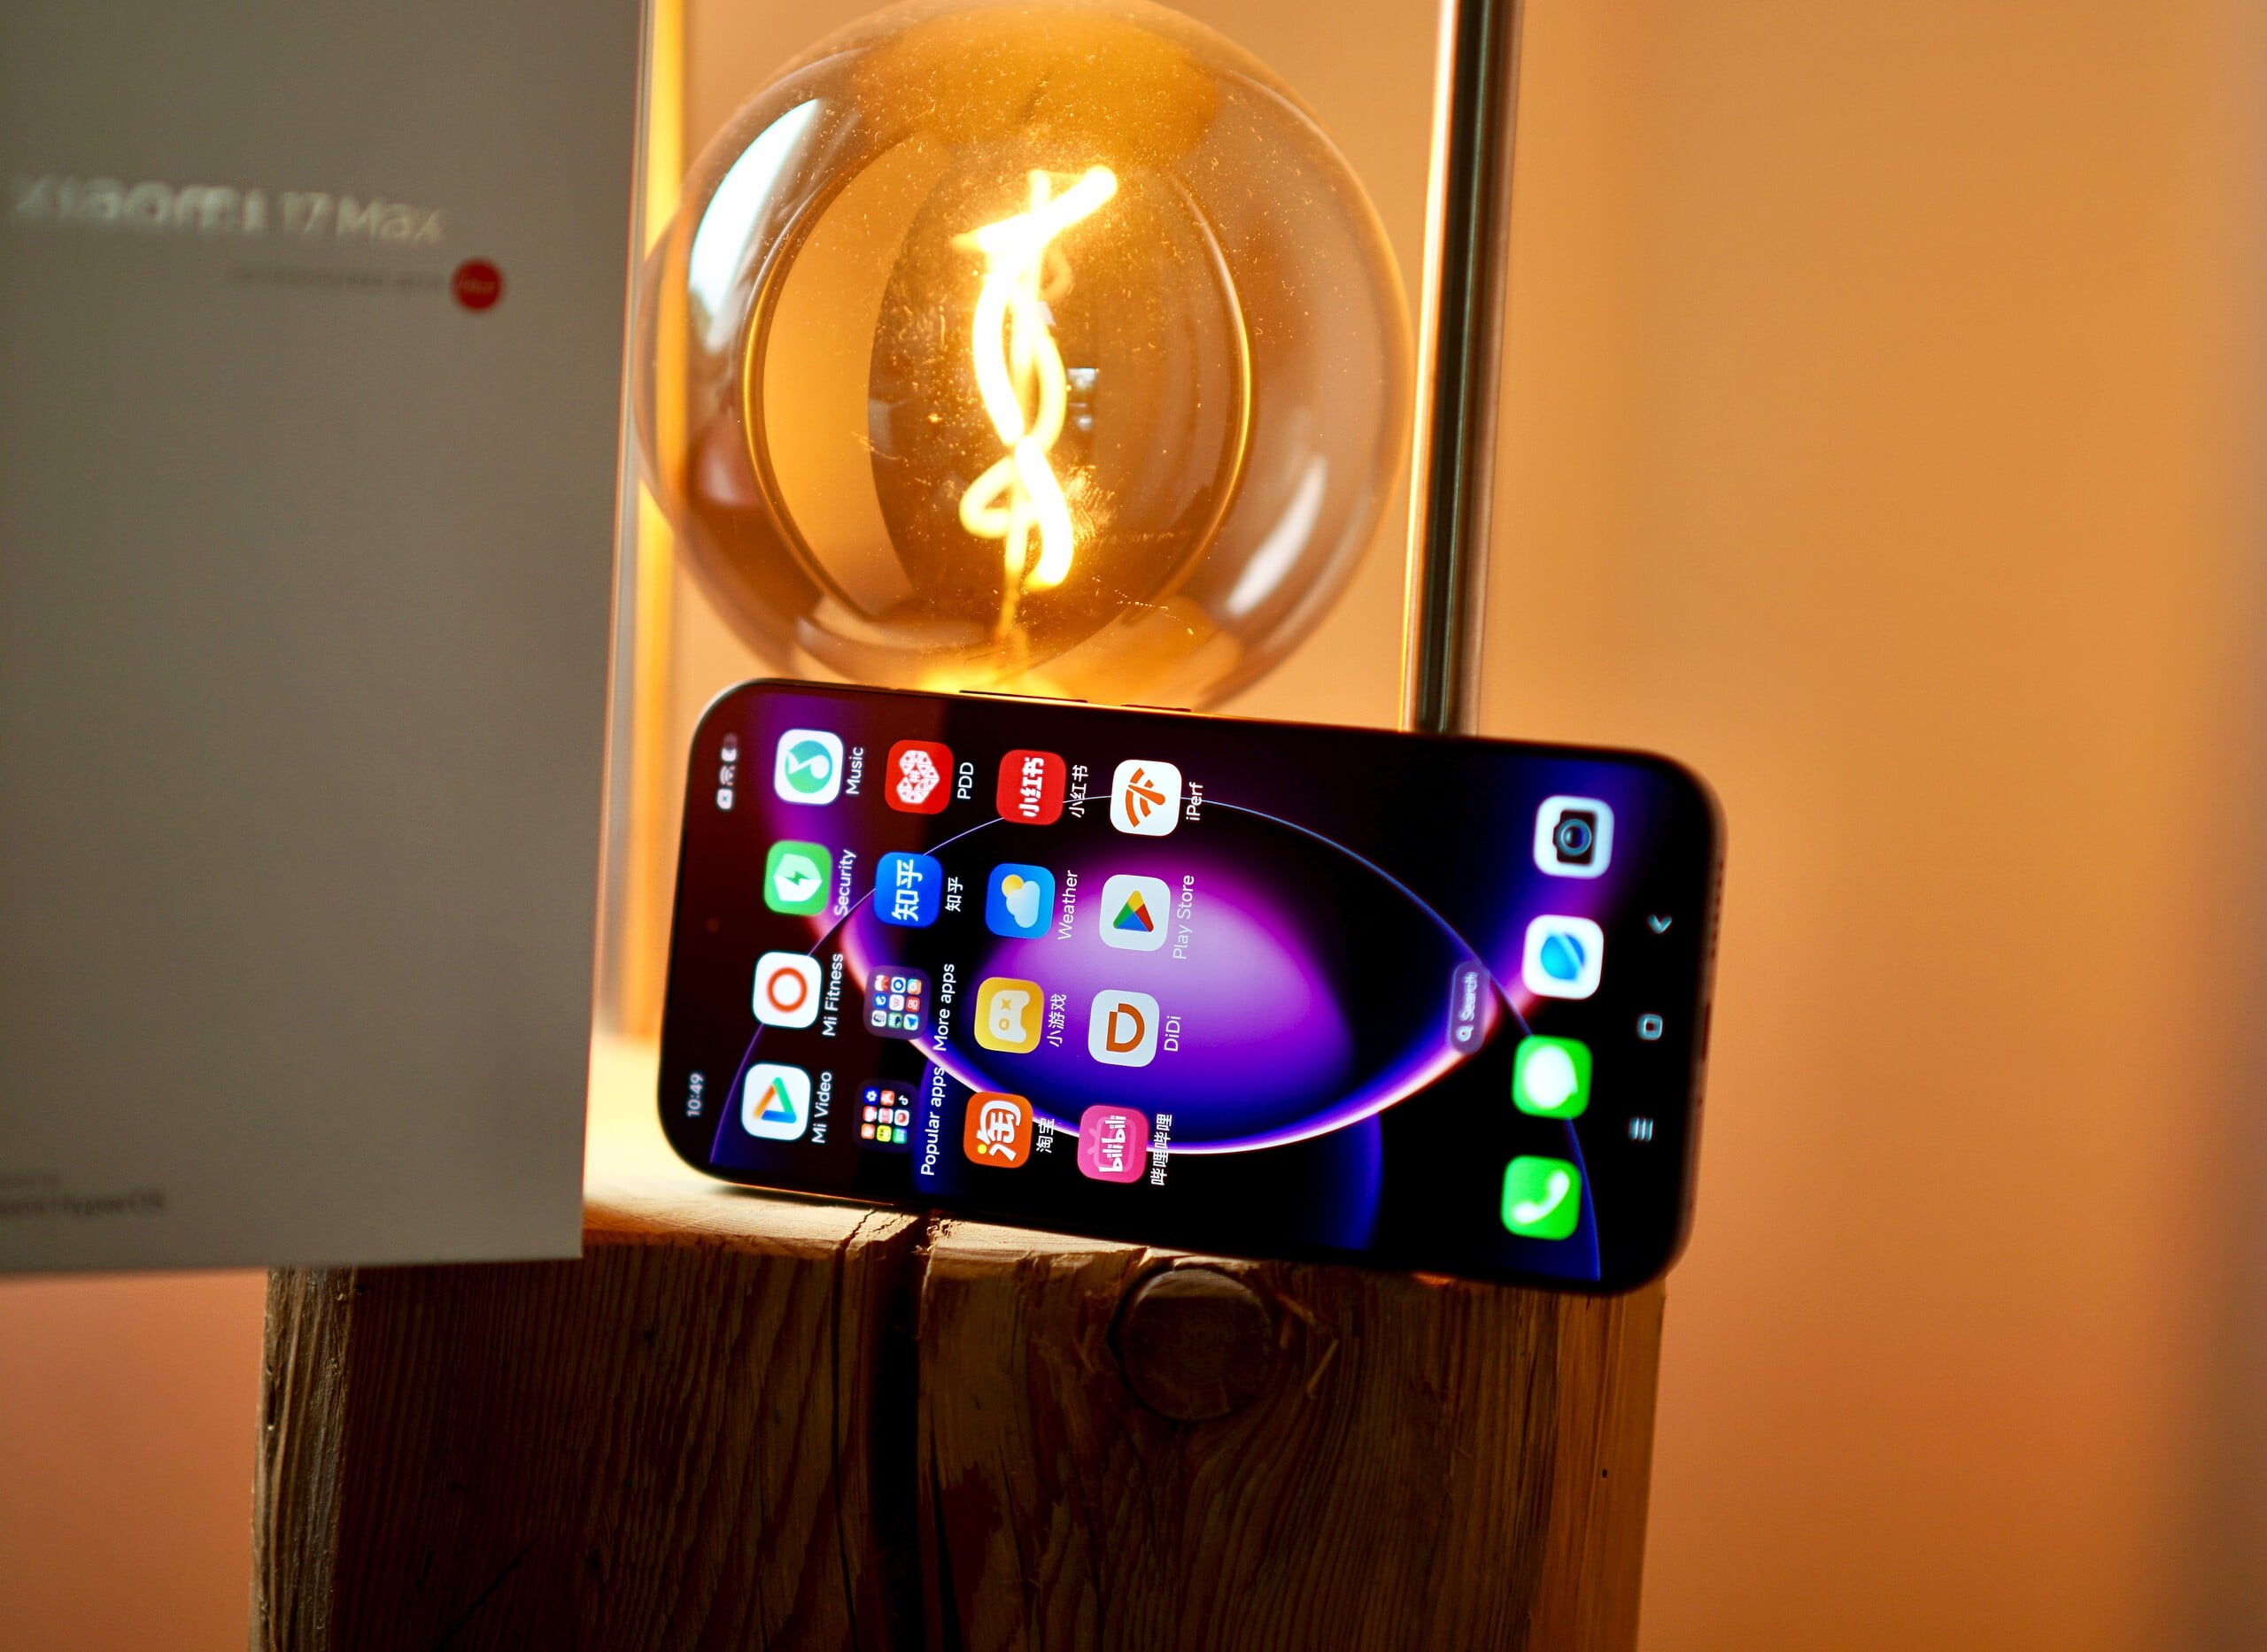
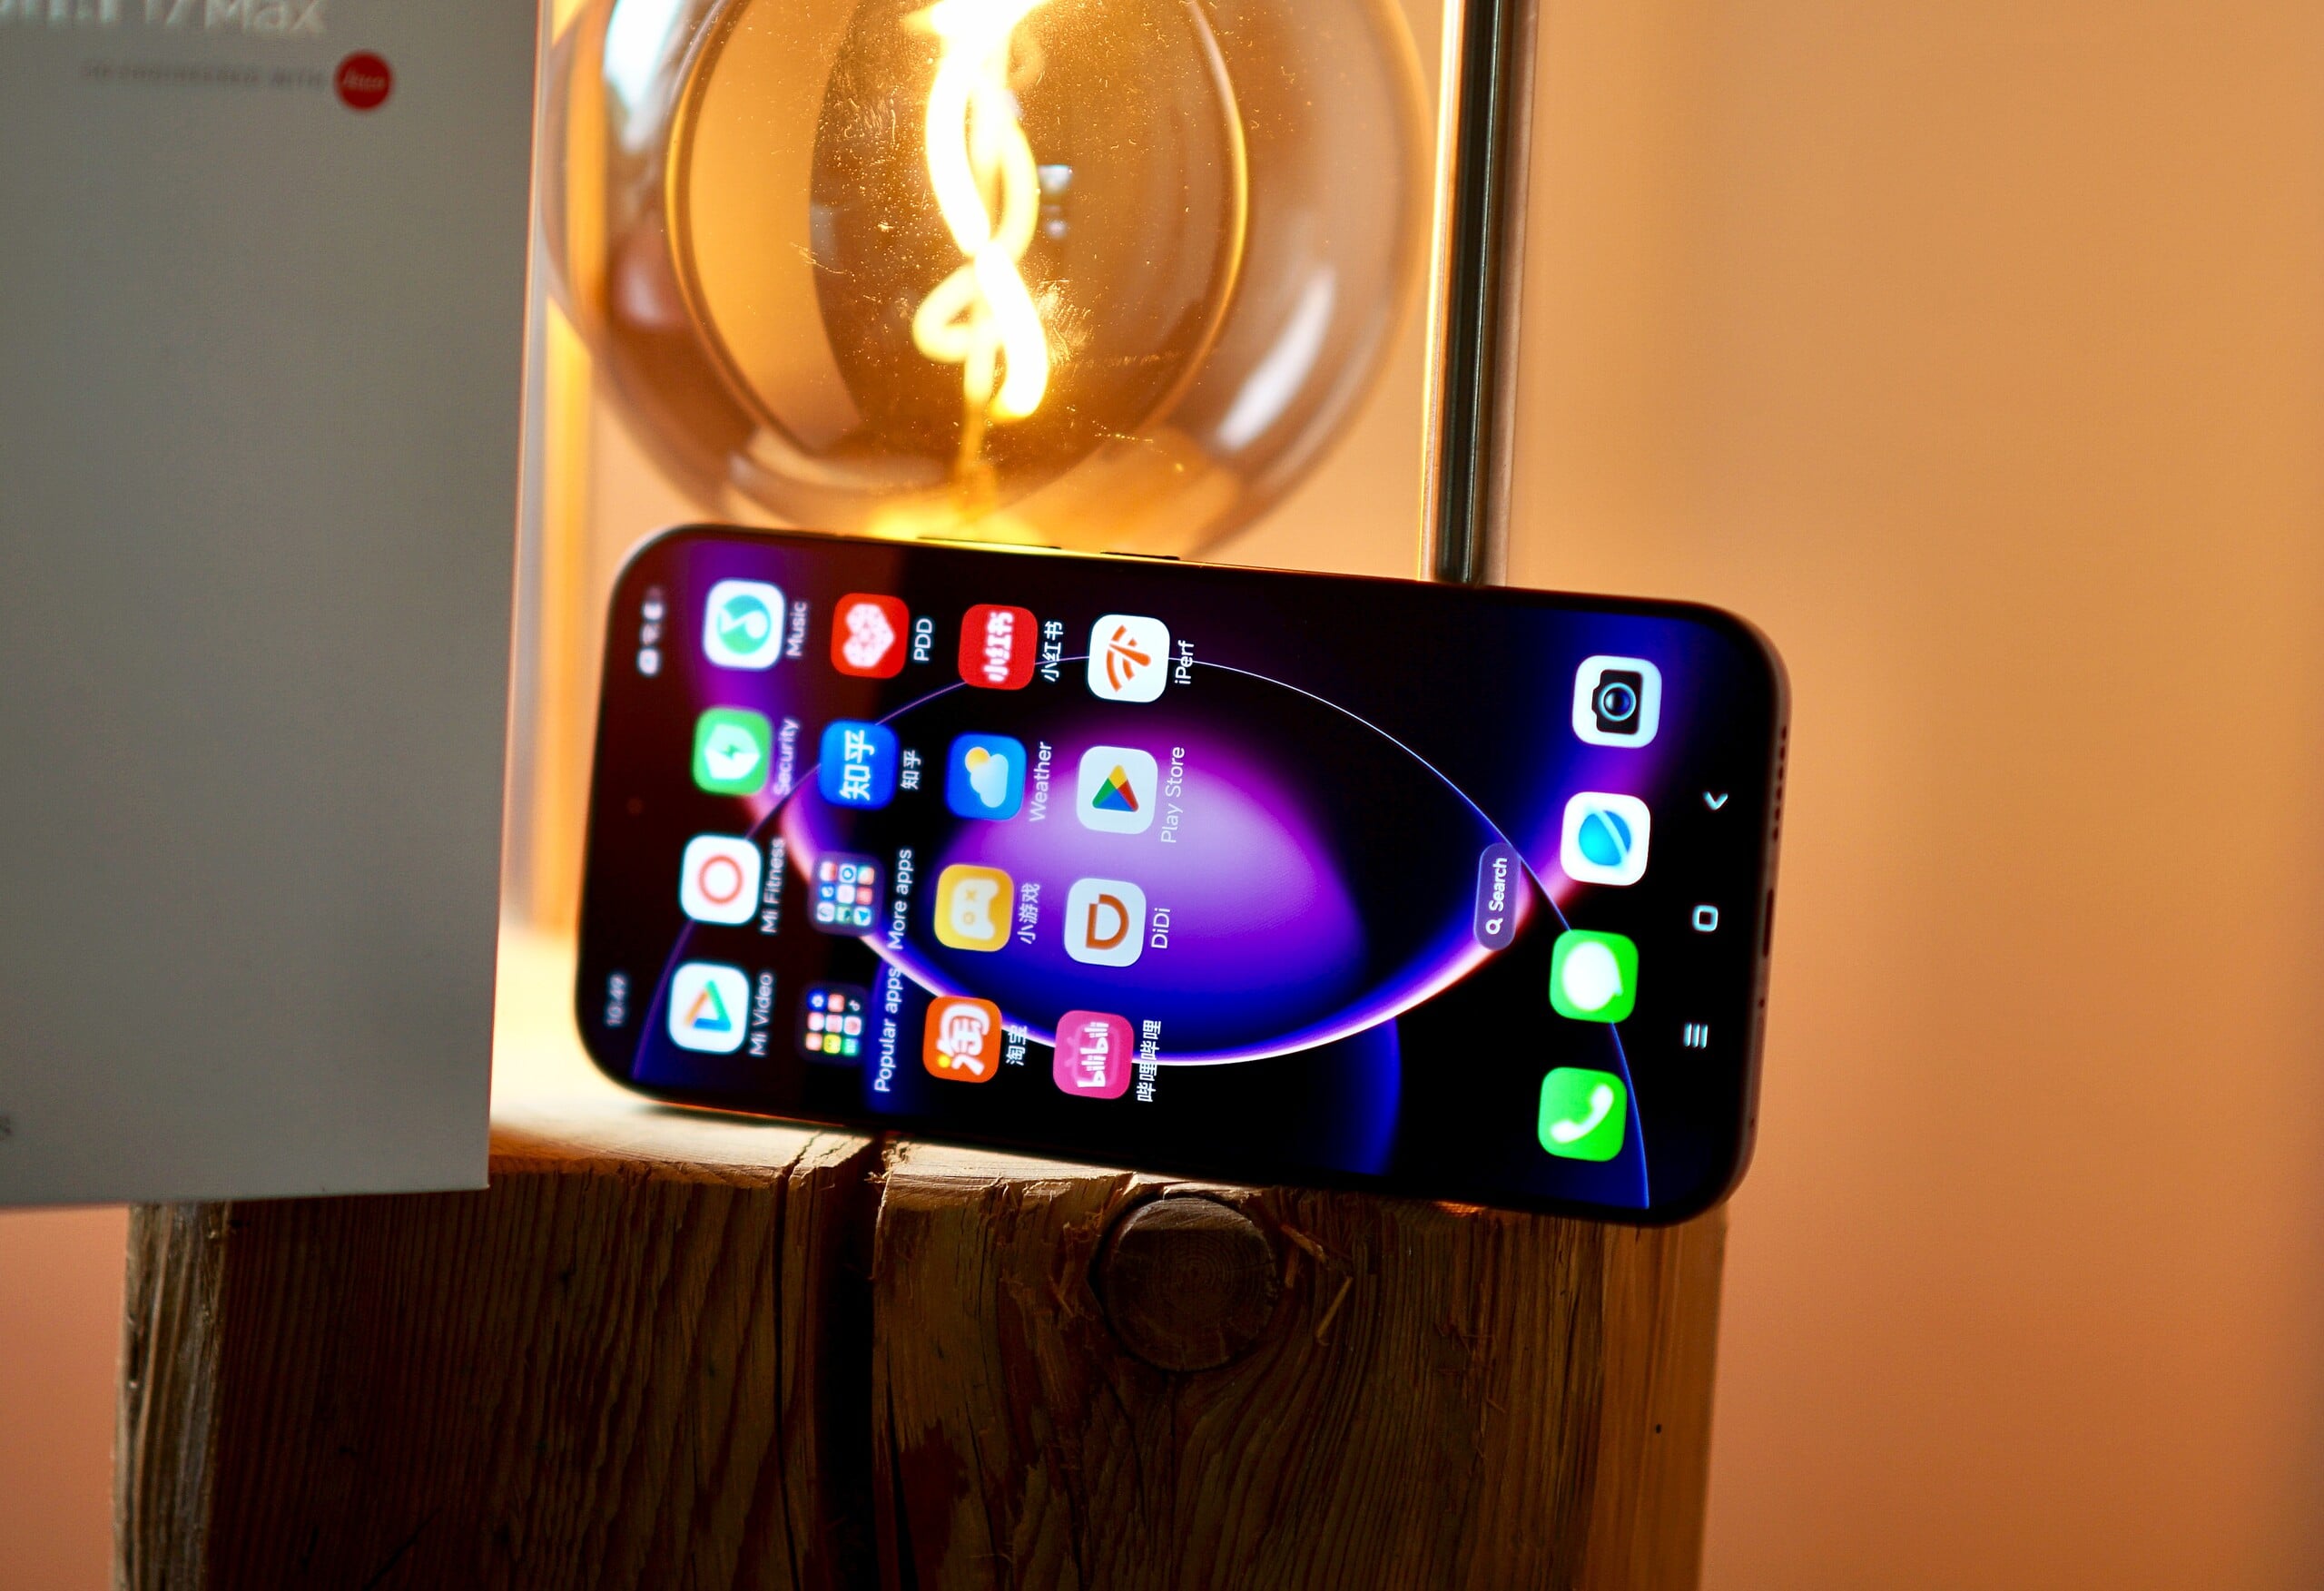
设备预装了 Android 16 系统,其上运行的是小米自主研发的用户界面 HyperOS 3,该系统在许多方面与原生 Android 有所不同。除英语外,不支持其他任何西方语言,但可以非常轻松地安装 Google Play 商店。
小米尚未正式公布系统更新的提供时长。根据以往机型的经验,我们预计安全更新将持续约 4 至 5 年。
包装基本不含塑料,但除此之外,没有关于可持续性的相关信息。
相机——2亿像素主摄像头

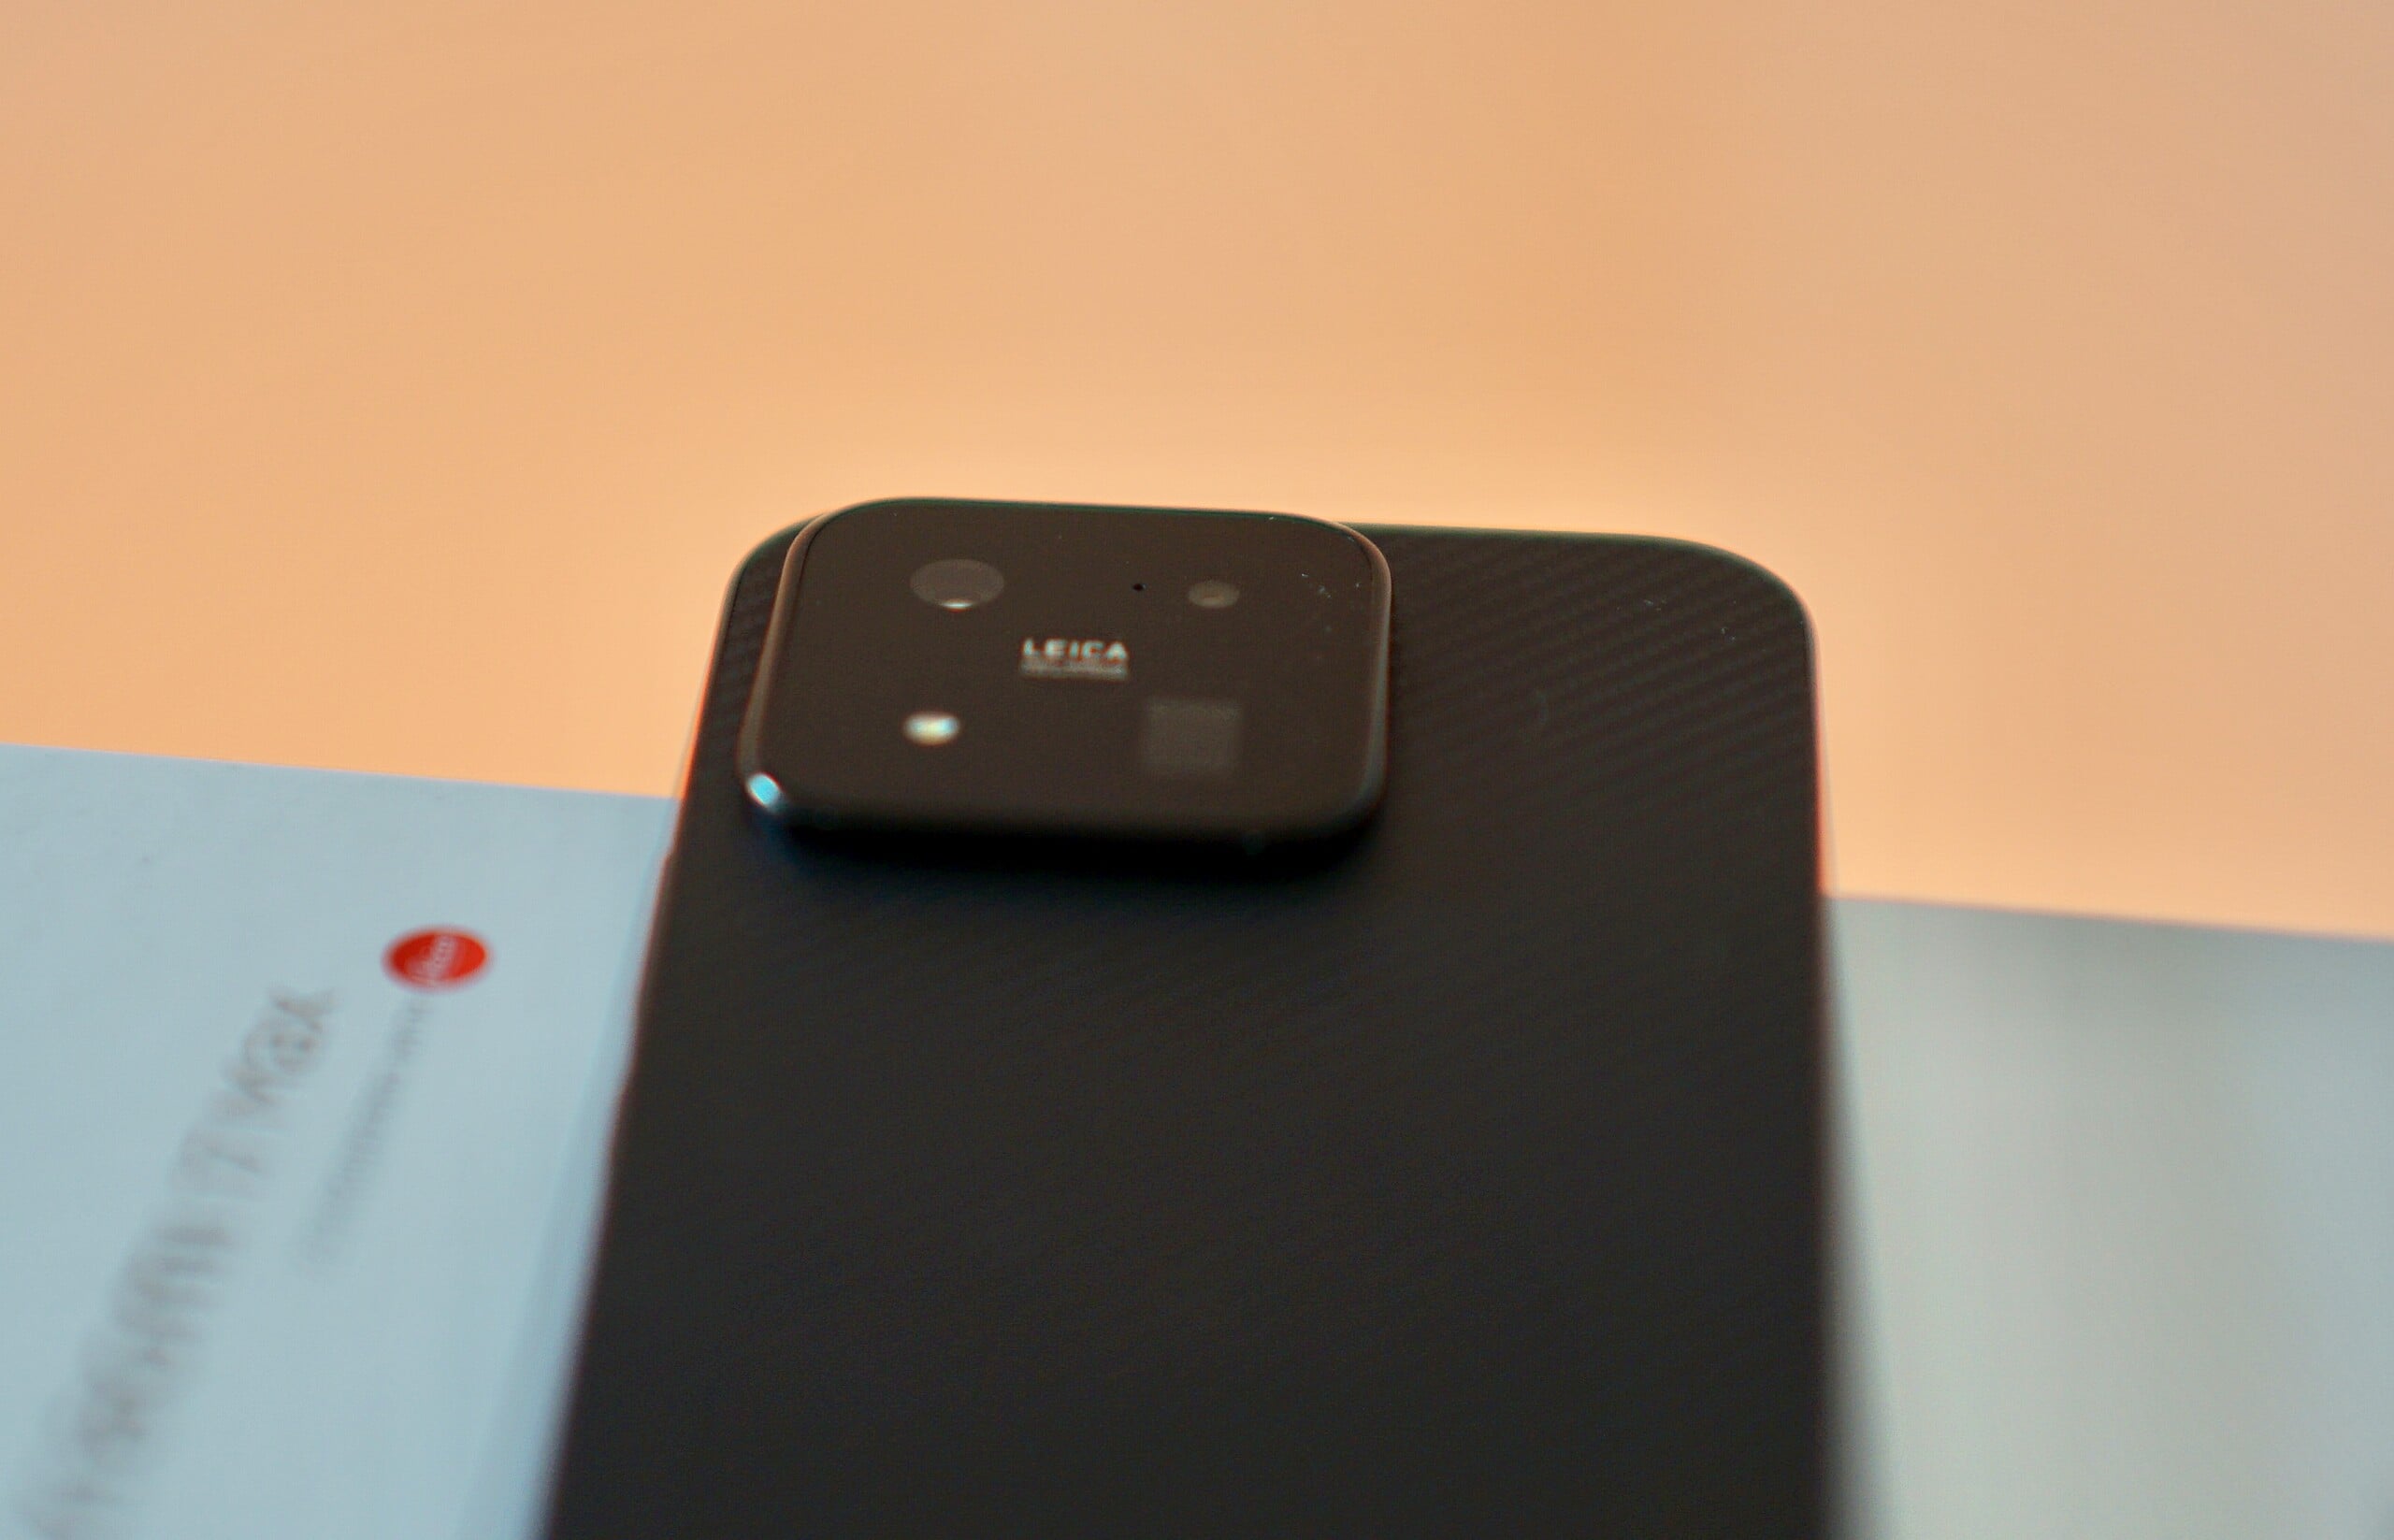
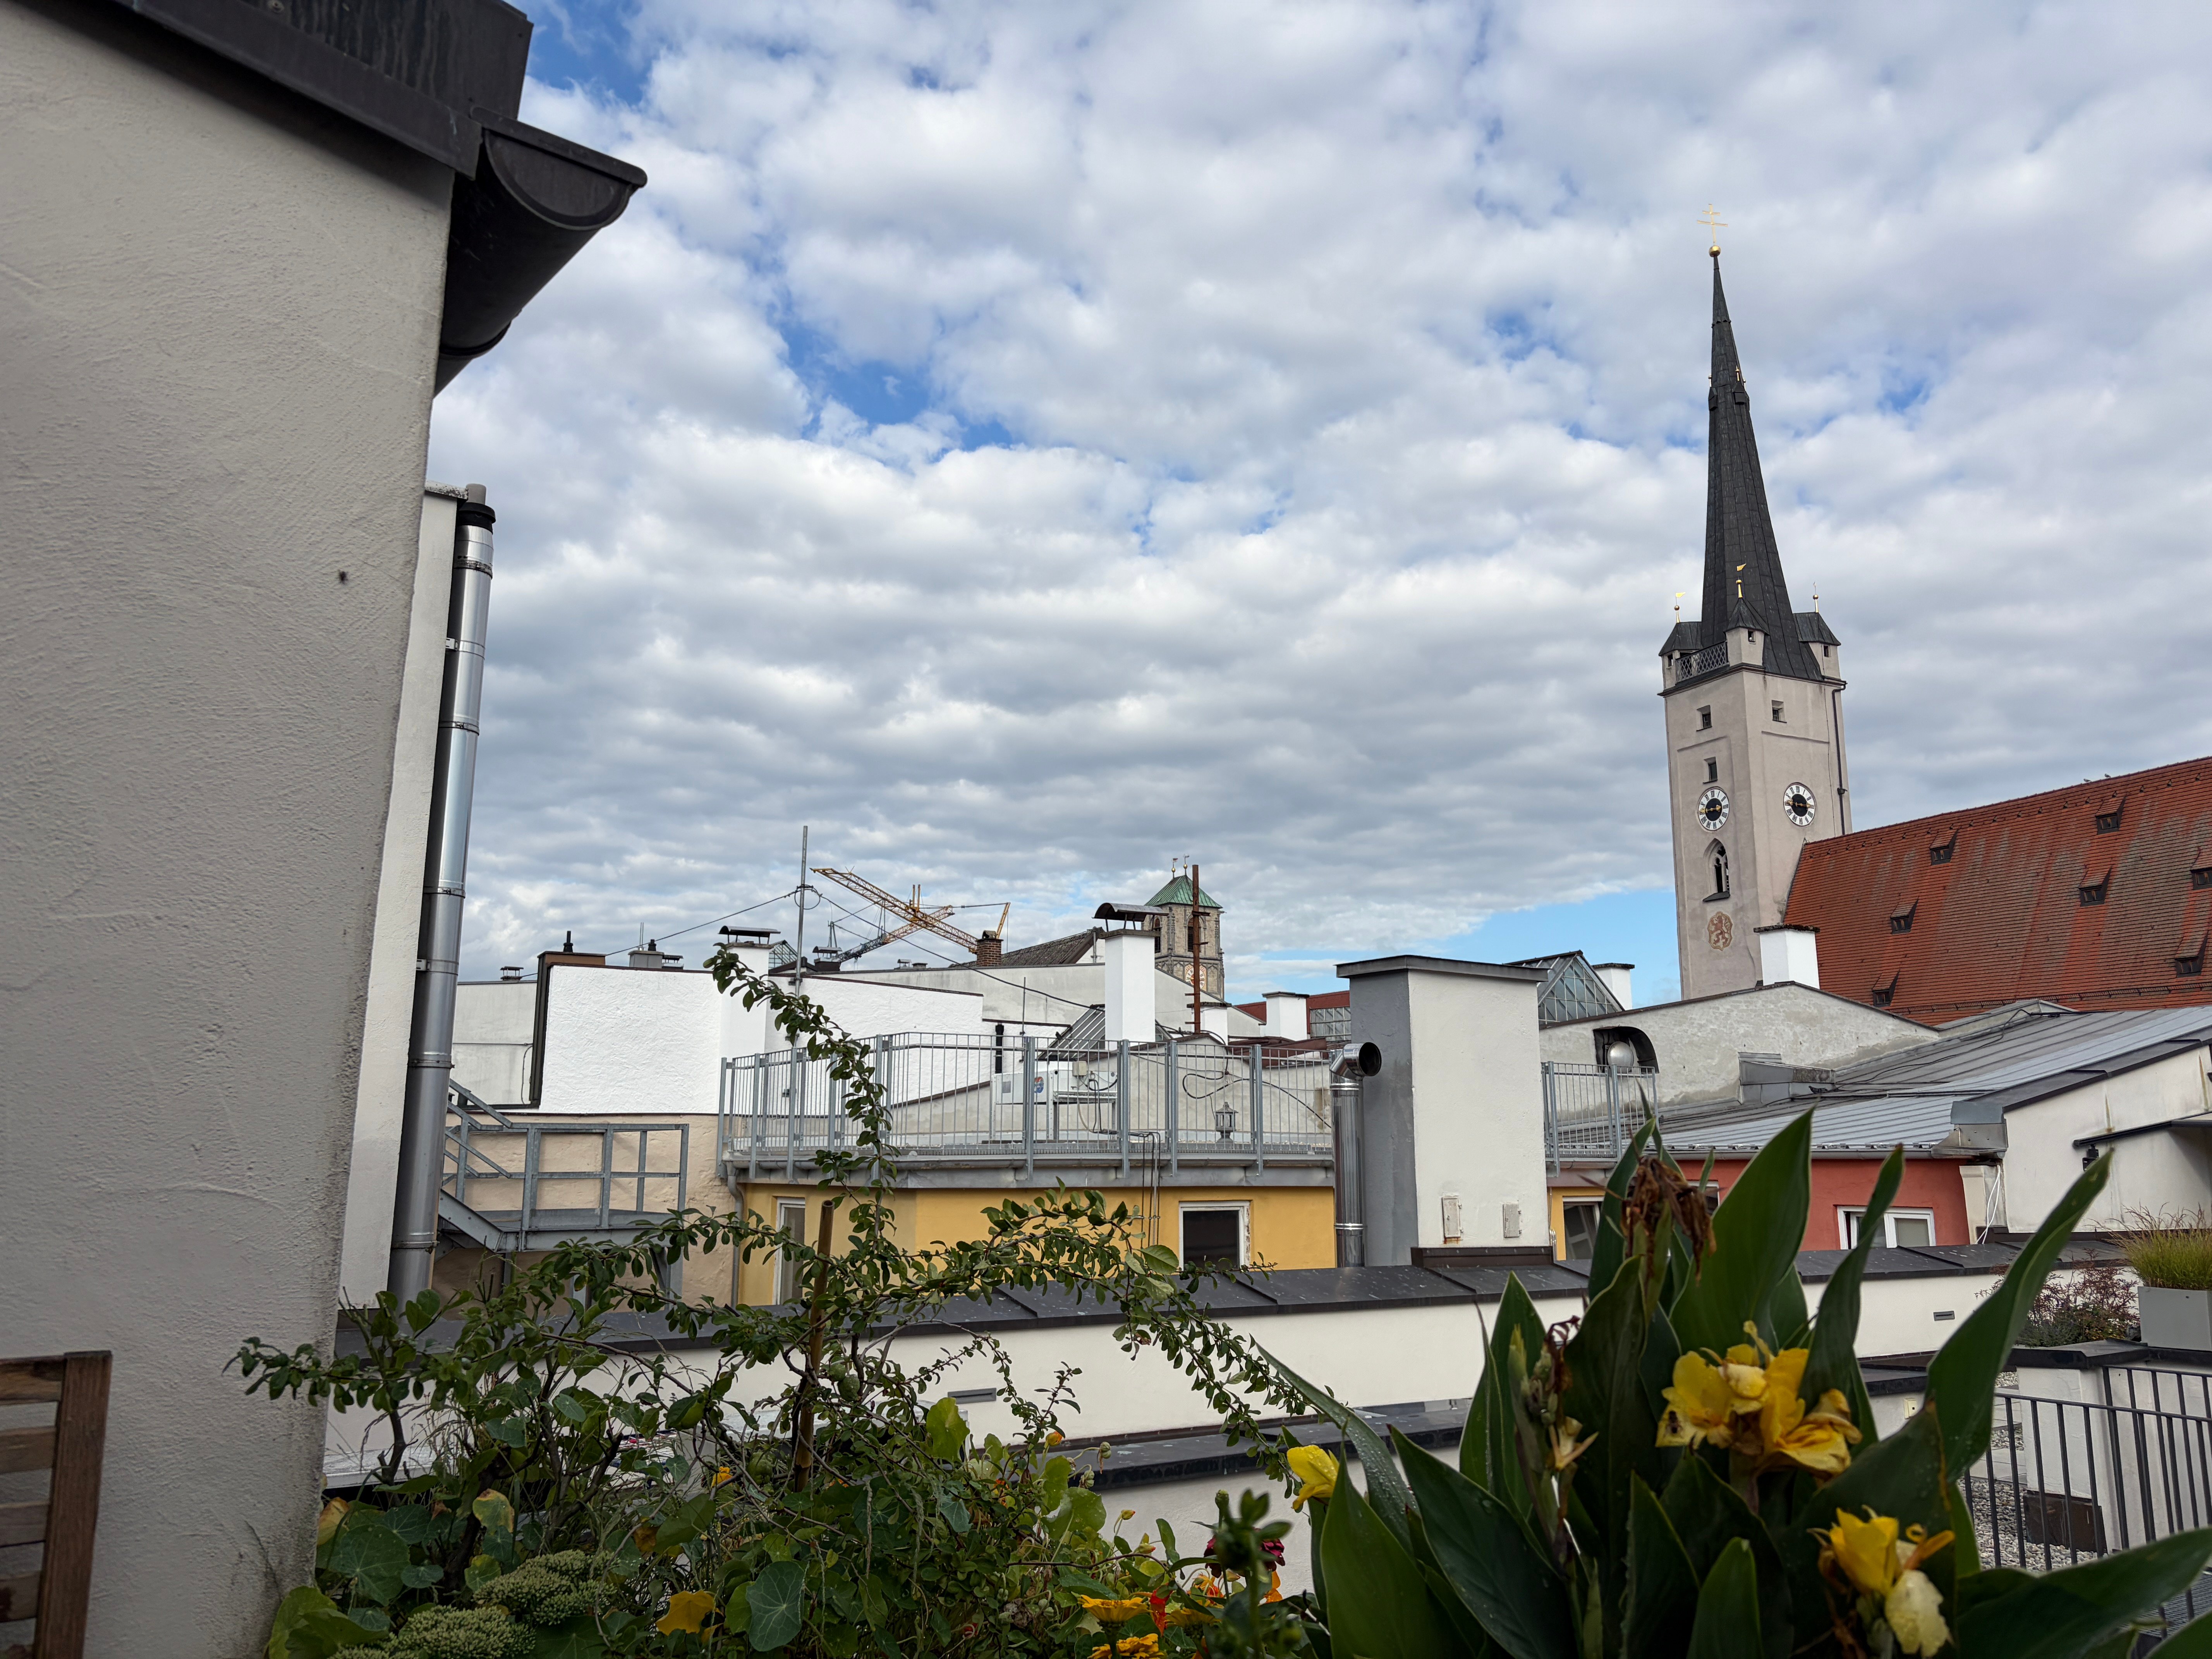
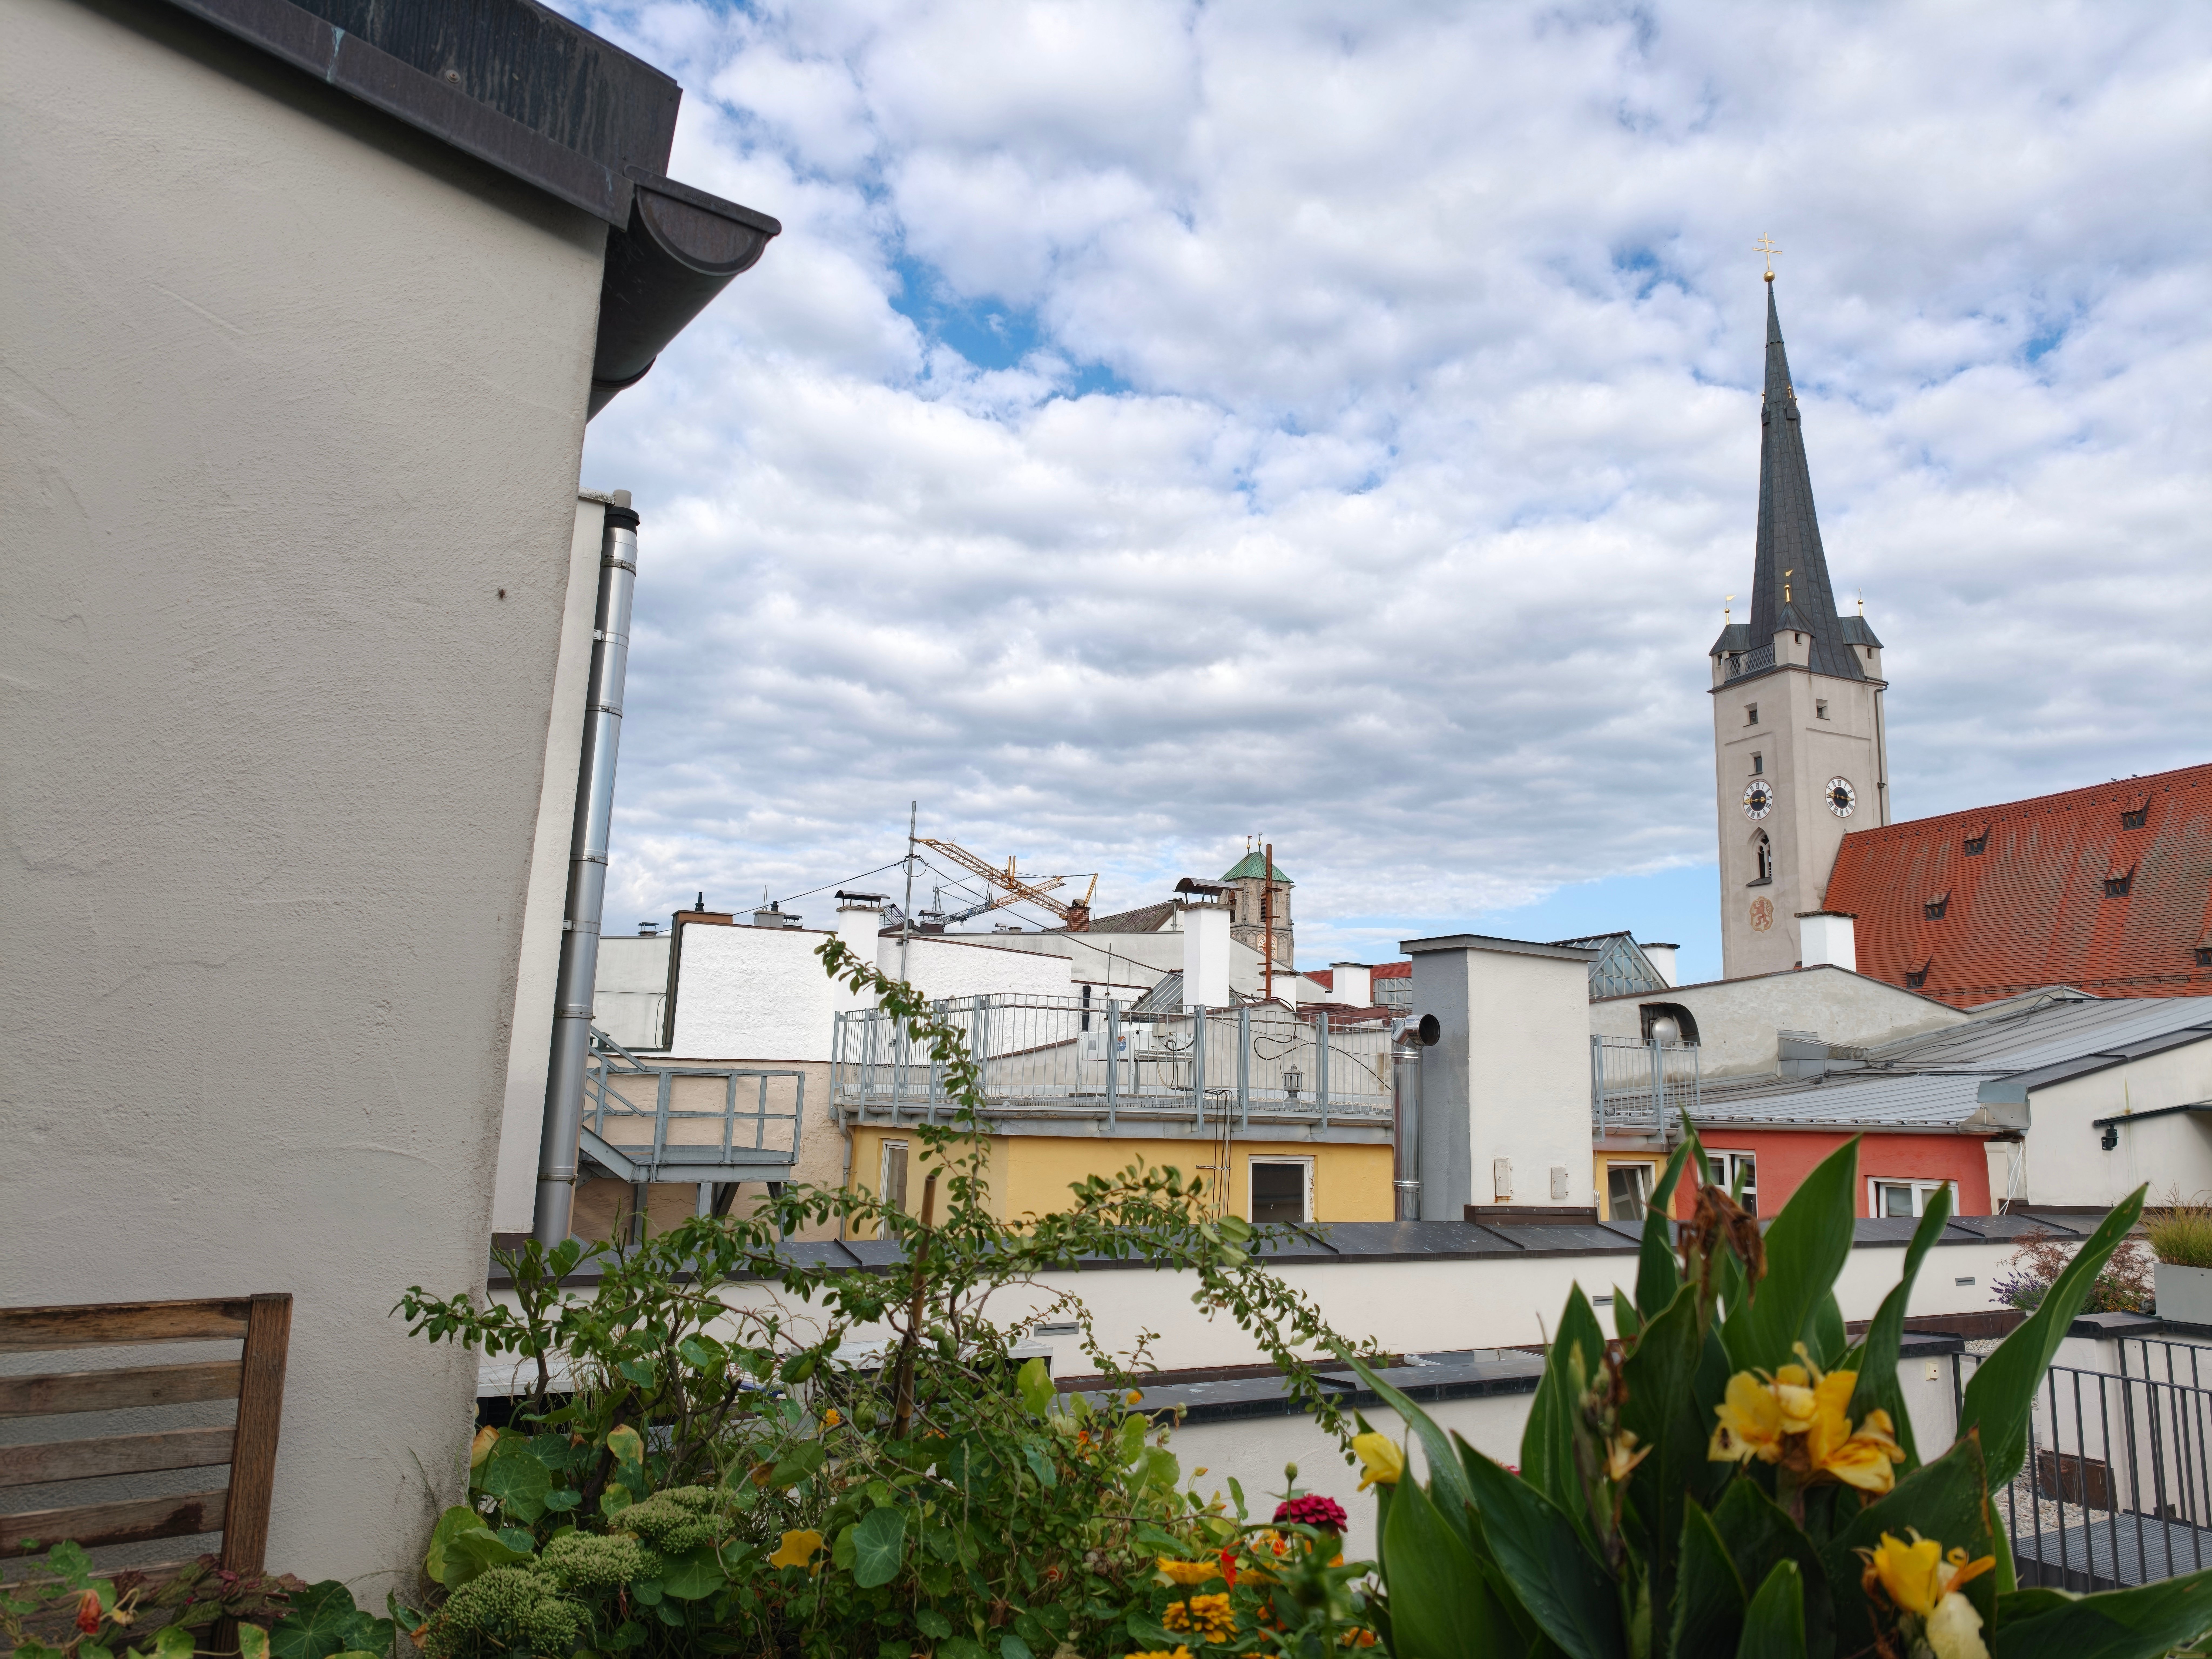
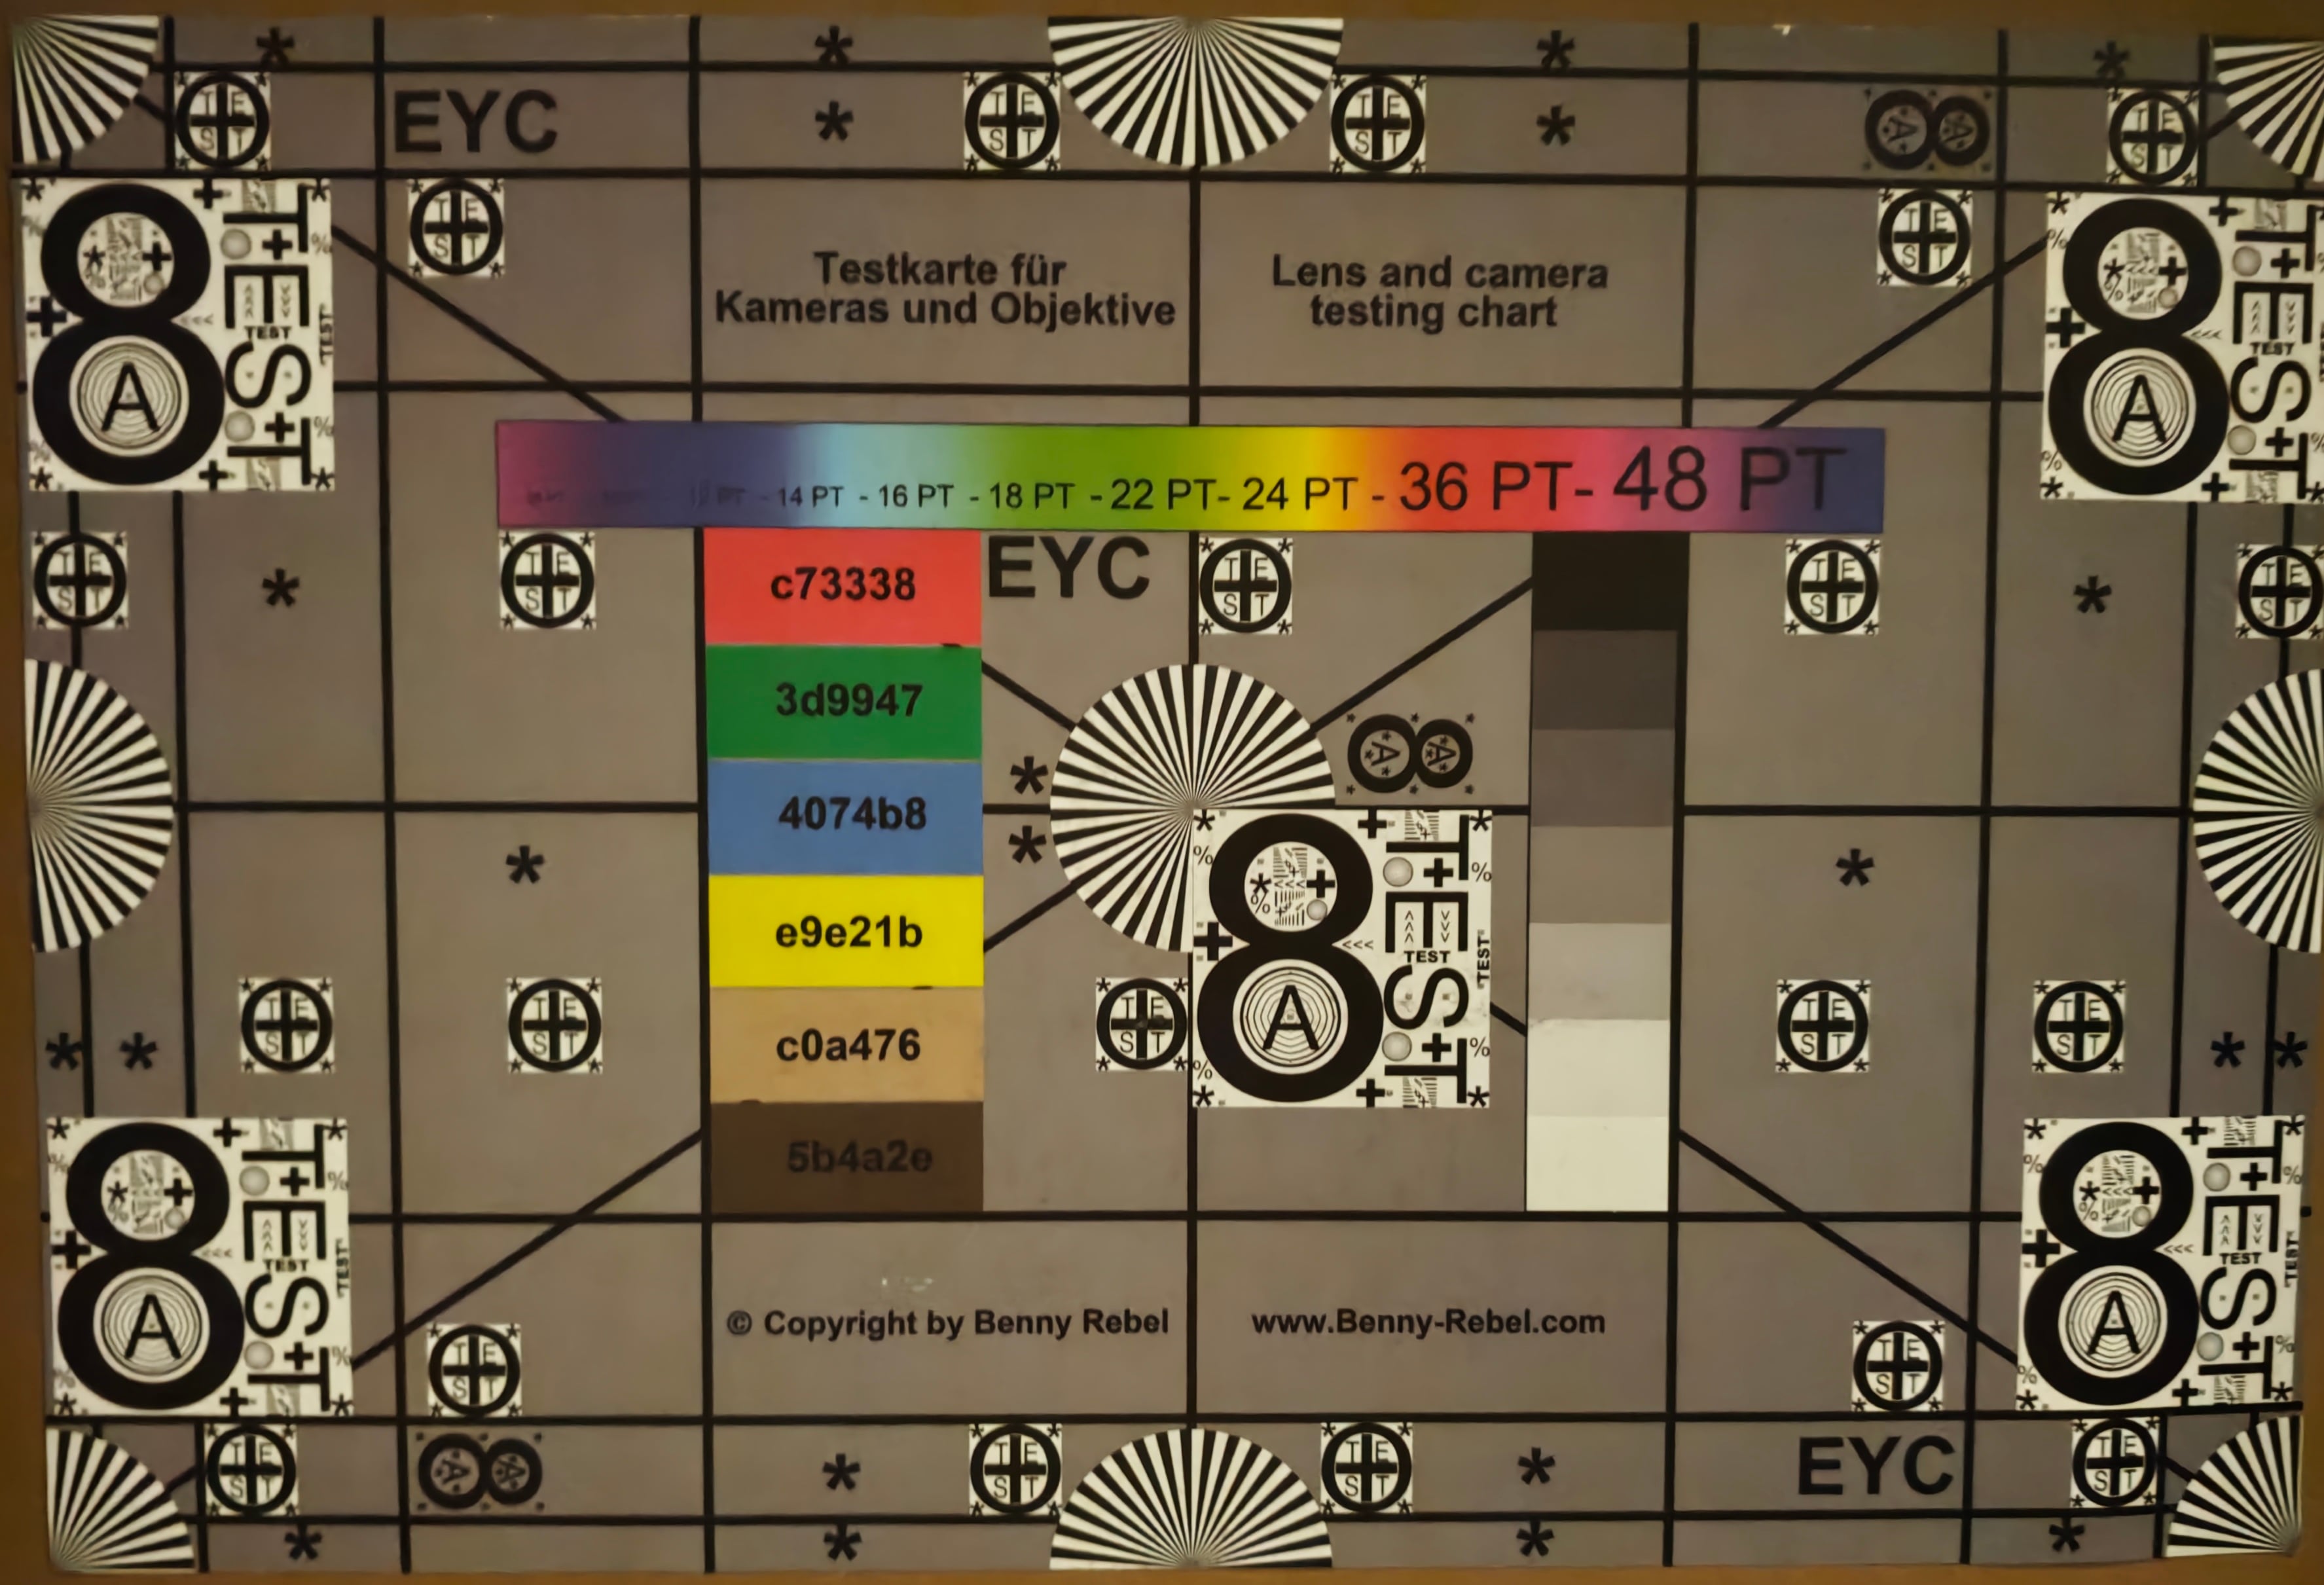
凭借2亿像素的摄像头,小米17 Max在像素数量上甚至超越了小米17 Pro Max。主摄像头搭载徕卡品牌,不仅能拍摄出精美的照片,细节表现也极为精准。
此外,它还配备了一颗支持3倍光学变焦的5000万像素长焦镜头。在最高10倍放大倍率下,它能拍出不错的照片;超过这个倍率后,AI优化的效果就非常明显了。
机身还配备了一颗5000万像素广角镜头;它拍摄的快照效果相当不错,能保留相当丰富的细节。
前置摄像头为3200万像素,自拍效果同样非常出色。
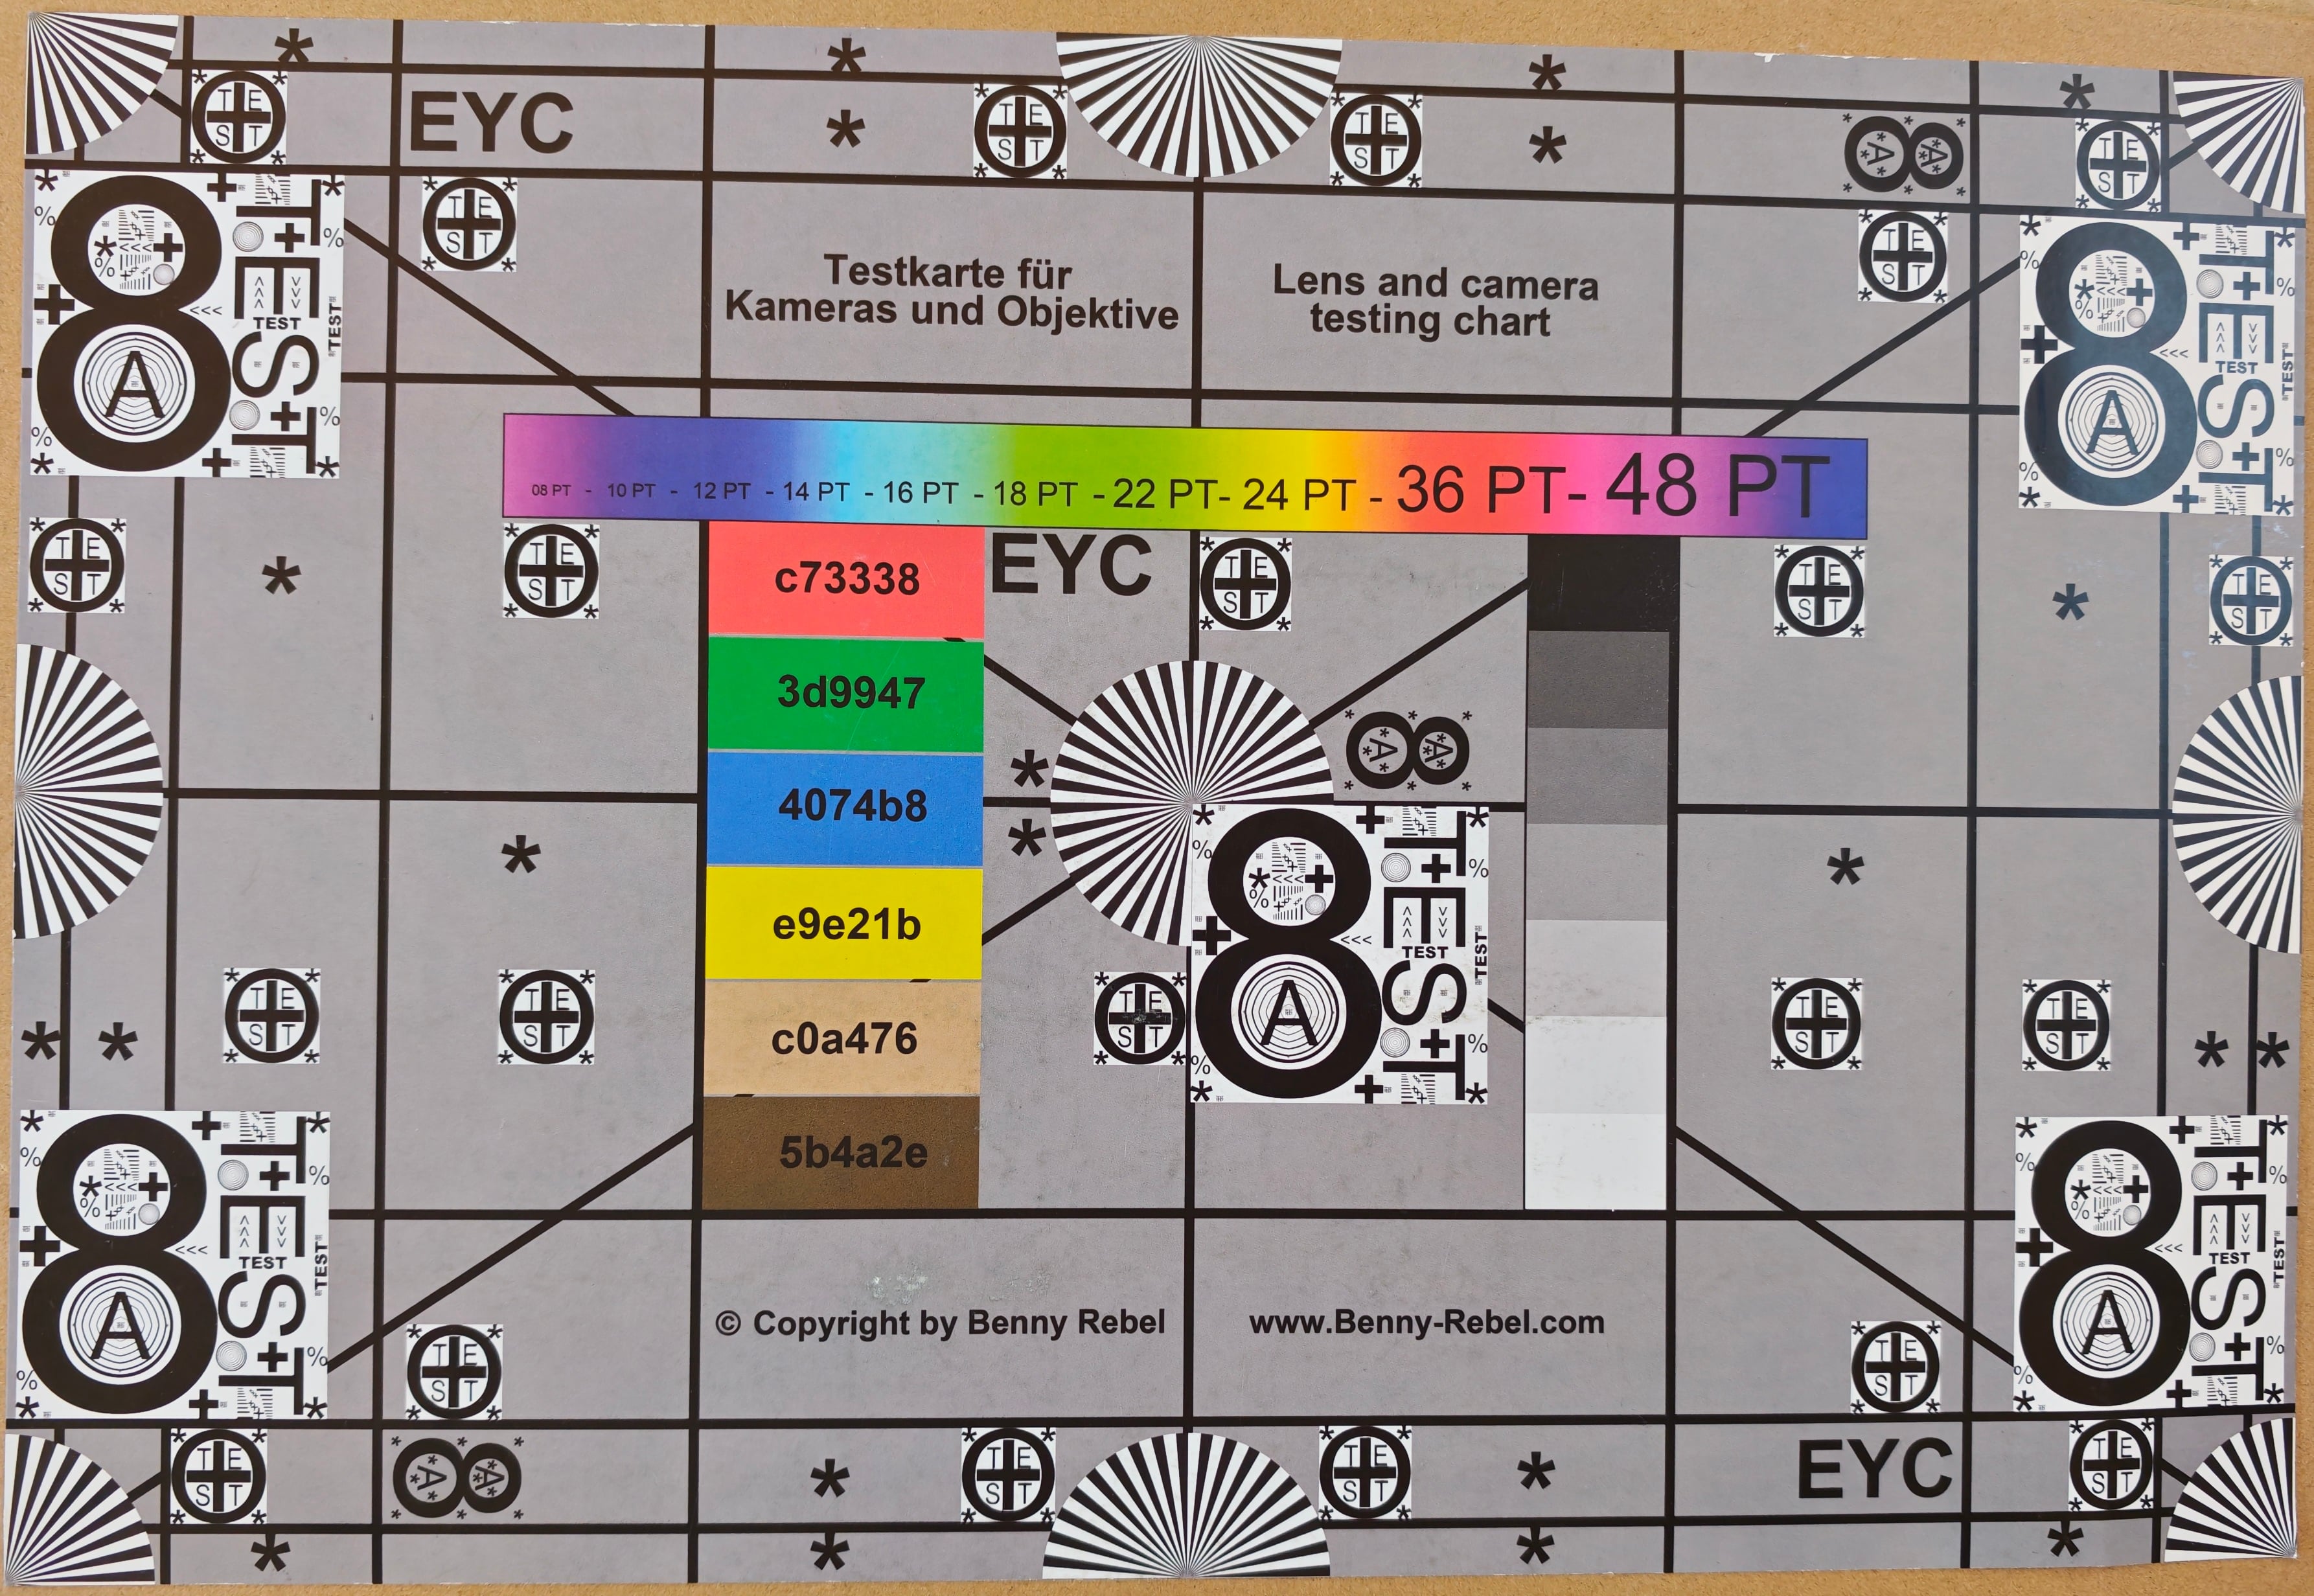
Image comparison
Choose a scene and navigate within the first image. One click changes the position on touchscreens. One click on the zoomed-in image opens the original in a new window. The first image shows the scaled photograph of the test device.
PlantSurroundingLow LightUltra wide angle


















显示屏——非常明亮的OLED
这款6.9英寸AMOLED屏幕刷新率最高可达120 Hz,日常使用时亮度超过1,000尼特,在显示较小区域或HDR内容时亮度会显著提升。尽管分辨率不如其他高端手机高,但其显示画质依然出色。
这款手机在调节亮度时会产生PWM闪烁现象,对此敏感的用户在购买前应先试用屏幕。
| |||||||||||||||||||||||||
Center on Battery: 1055 cd/m²
Contrast: ∞:1 (Black: 0 cd/m²)
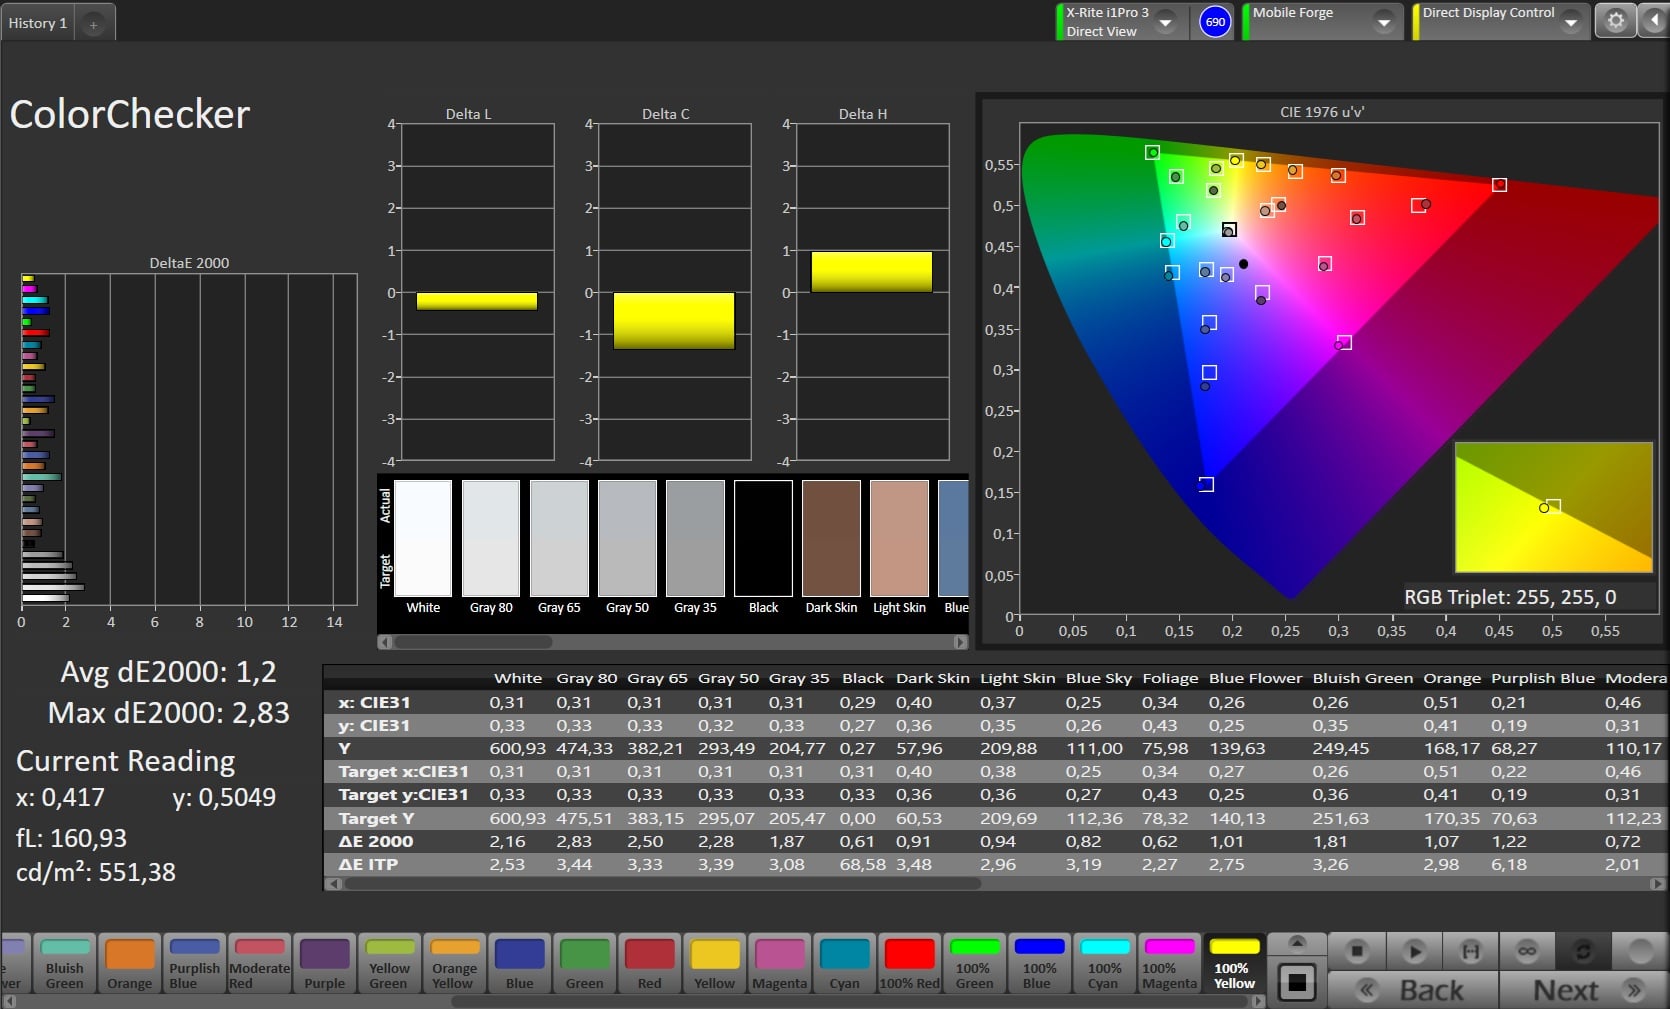
ΔE ColorChecker Calman: 1.2 | ∀{0.5-29.43 Ø4.69}
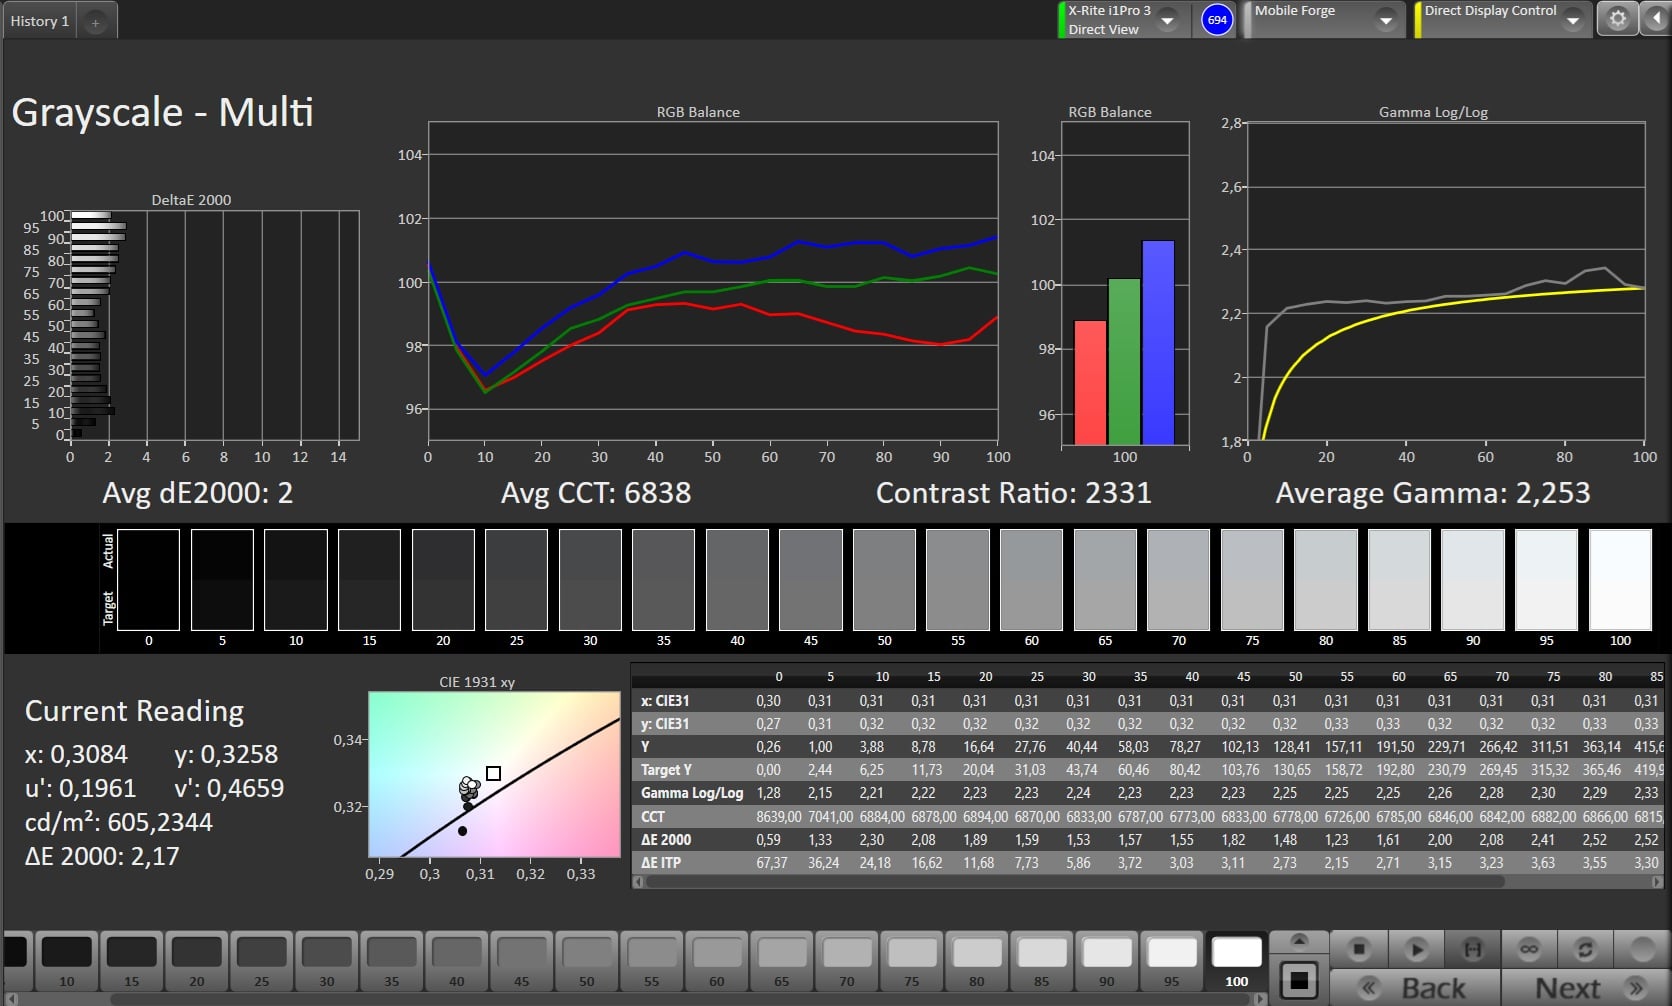
ΔE Greyscale Calman: 2 | ∀{0.09-98 Ø4.94}
99.8% sRGB (Calman 2D)
Gamma: 2.253
CCT: 6838 K
| Xiaomi 17 Max AMOLED, 2608x1200, 6.9" | Xiaomi 17 LTPO AMOLED , 2656x1220, 6.3" | Samsung Galaxy S26 Ultra Dynamic AMOLED 2X, 3120x1440, 6.9" | OnePlus 15 AMOLED, 2772x1272, 6.8" | Apple iPhone 17 Pro Max OLED, 2868x1320, 6.9" | |
|---|---|---|---|---|---|
| Display | -5% | ||||
| APL18 Peak Brightness (cd/m²) | 2987 | 2713 -9% | |||
| HDR Peak Brightness (cd/m²) | 3002 | 2975 -1% | |||
| Response Times | 15% | 1% | -93% | 14% | |
| Response Time Grey 50% / Grey 80% * (ms) | 1.4 ? | 0.4 ? 71% | 0.84 ? 40% | 3 ? -114% | 0.6 ? 57% |
| Response Time Black / White * (ms) | 1.3 ? | 0.6 ? 54% | 1.25 ? 4% | 2.8 ? -115% | 0.6 ? 54% |
| PWM Frequency (Hz) | 119.7 | 120 | 240 | 120 | 240 |
| PWM Amplitude * (%) | 10 | 18 -80% | 13.99 -40% | 15 -50% | 17 -70% |
| Screen | -19% | -25% | 4% | -4% | |
| Brightness middle (cd/m²) | 1055 | 1030 -2% | 1339 27% | 1114 6% | 1054 0% |
| Black Level * (cd/m²) | |||||
| Colorchecker dE 2000 * | 1.2 | 1.44 -20% | 2.5 -108% | 1.33 -11% | 1.57 -31% |
| Colorchecker dE 2000 max. * | 2.83 | 3.68 -30% | 3.8 -34% | 2.42 14% | 2.8 1% |
| Greyscale dE 2000 * | 2 | 2.5 -25% | 1.7 15% | 1.9 5% | 1.7 15% |
| Gamma | 2.253 98% | 2.274 97% | 2.05 107% | 2.273 97% | 2.32 95% |
| CCT | 6838 95% | 6868 95% | 6498 100% | 6708 97% | 6993 93% |
| Brightness (cd/m²) | 1021 | 1381 | 1109 | 1059 | |
| Brightness Distribution (%) | 98 | 94 | 97 | 93 | |
| Total Average (Program / Settings) | -2% /
-5% | -10% /
-12% | -45% /
-38% | 5% /
4% |
* ... smaller is better
Screen Flickering / PWM (Pulse-Width Modulation)
| Screen flickering / PWM detected | 119.7 Hz Amplitude: 10 % | 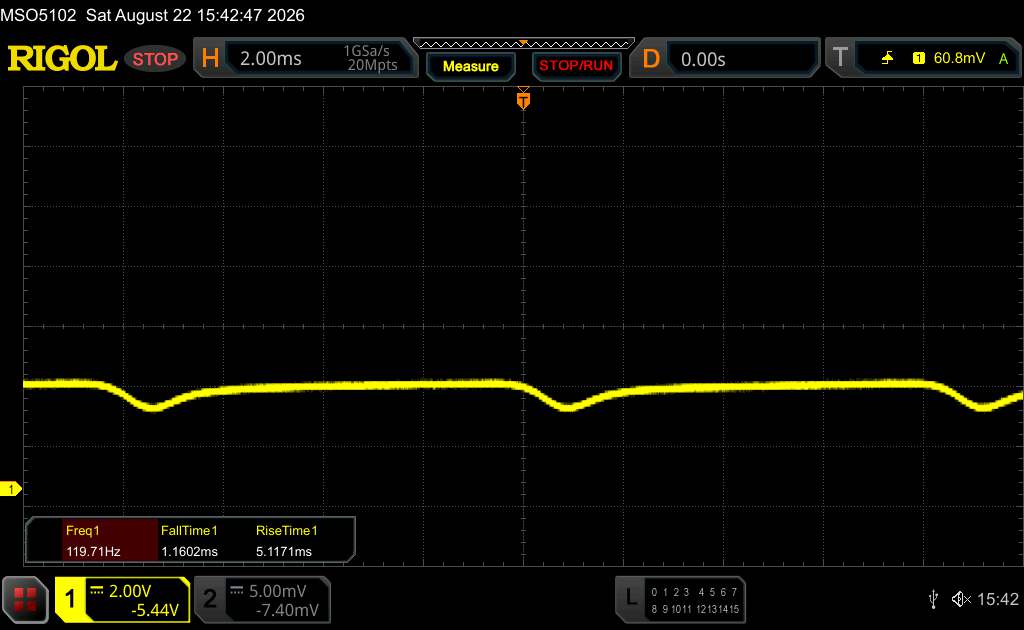 | |
The display backlight flickers at 119.7 Hz (worst case, e.g., utilizing PWM) . The frequency of 119.7 Hz is very low, so the flickering may cause eyestrain and headaches after extended use. In comparison: 52 % of all tested devices do not use PWM to dim the display. If PWM was detected, an average of 7611 (minimum: 5 - maximum: 343500) Hz was measured. | |||
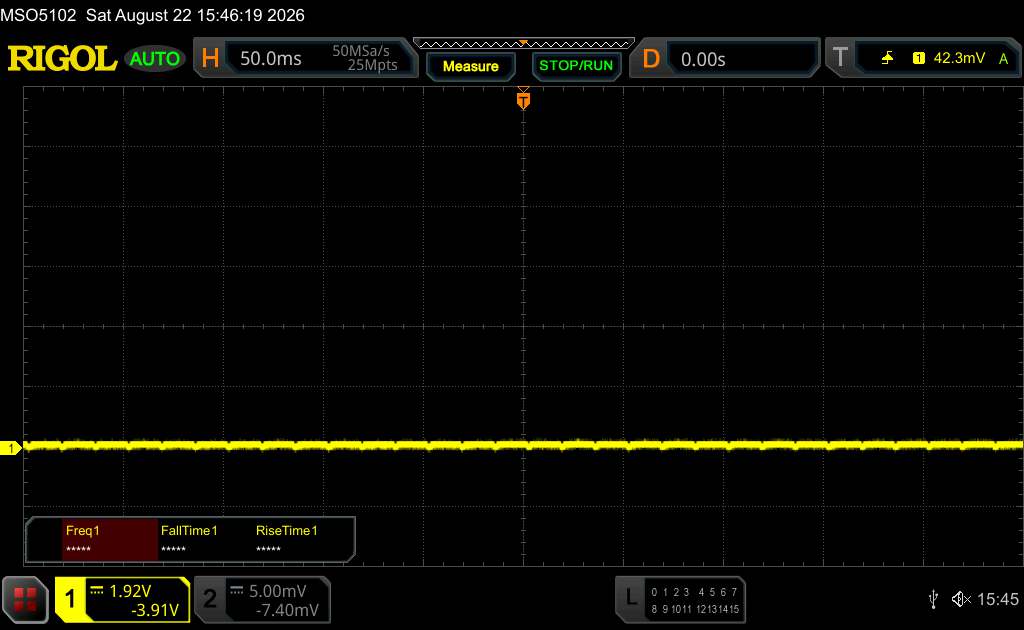
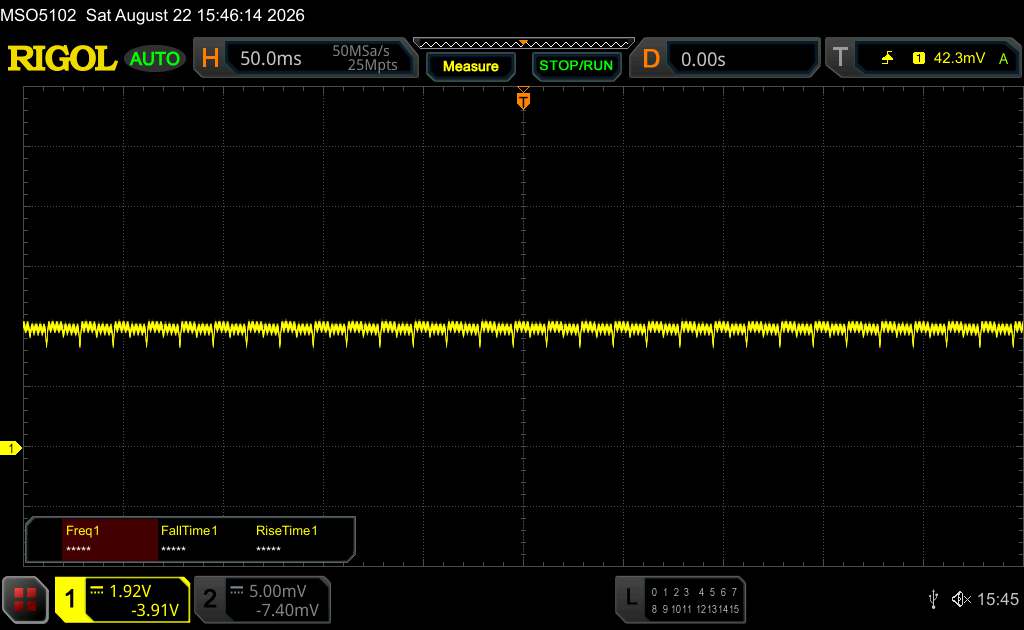
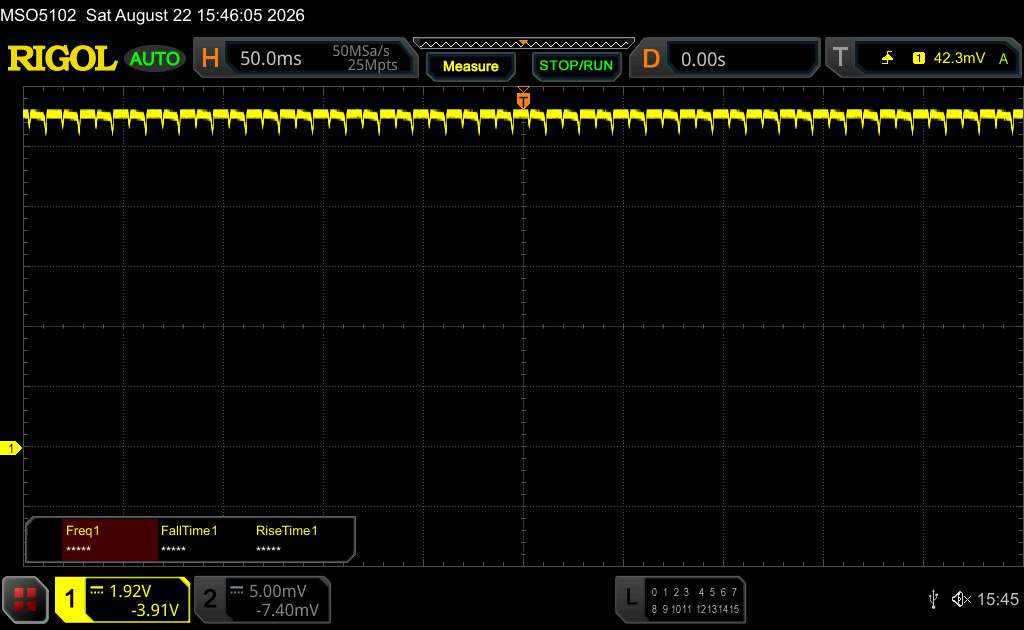
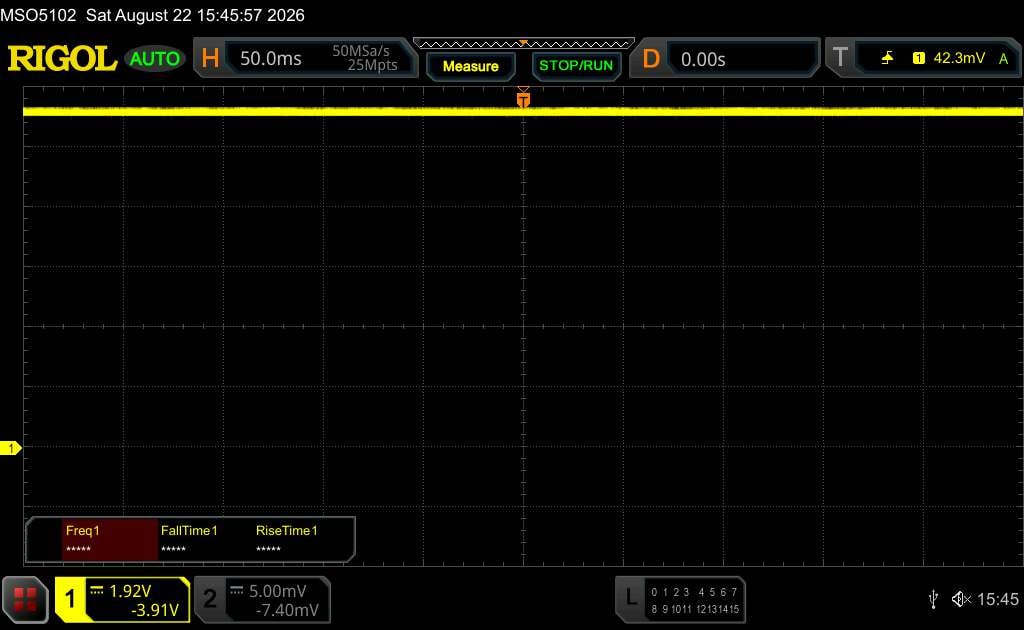
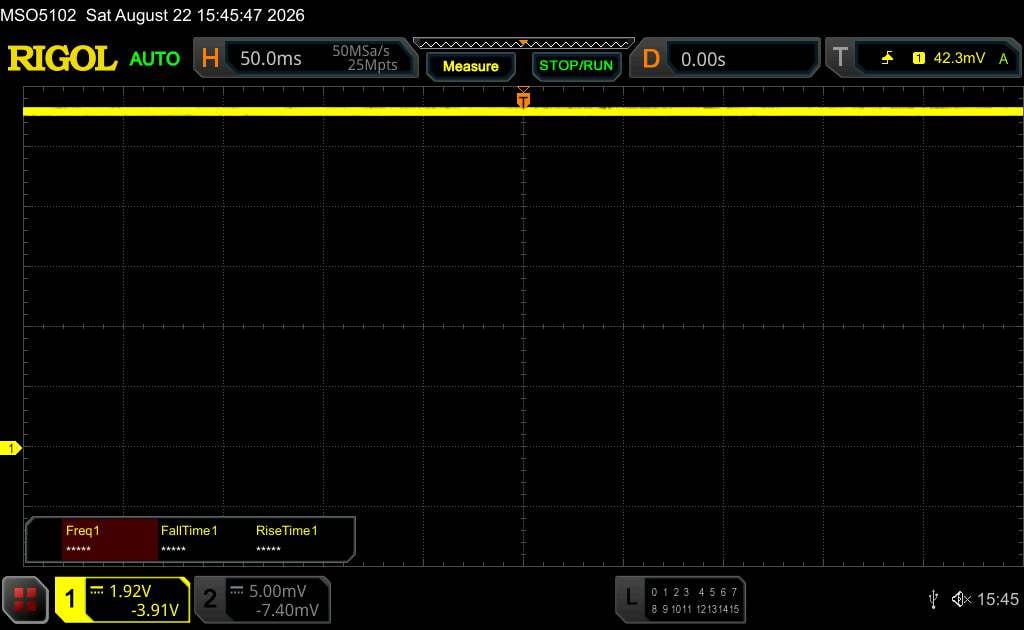
在固定缩放级别下、不同亮度设置下的测量数据序列(尽管在最低亮度下振幅曲线看起来呈平坦状,但这只是由于比例缩放所致。信息框中显示的是最低亮度下振幅的放大图。)
Display Response Times
| ↔ Response Time Black to White | ||
|---|---|---|
| 1.3 ms ... rise ↗ and fall ↘ combined | ↗ 0.6 ms rise | 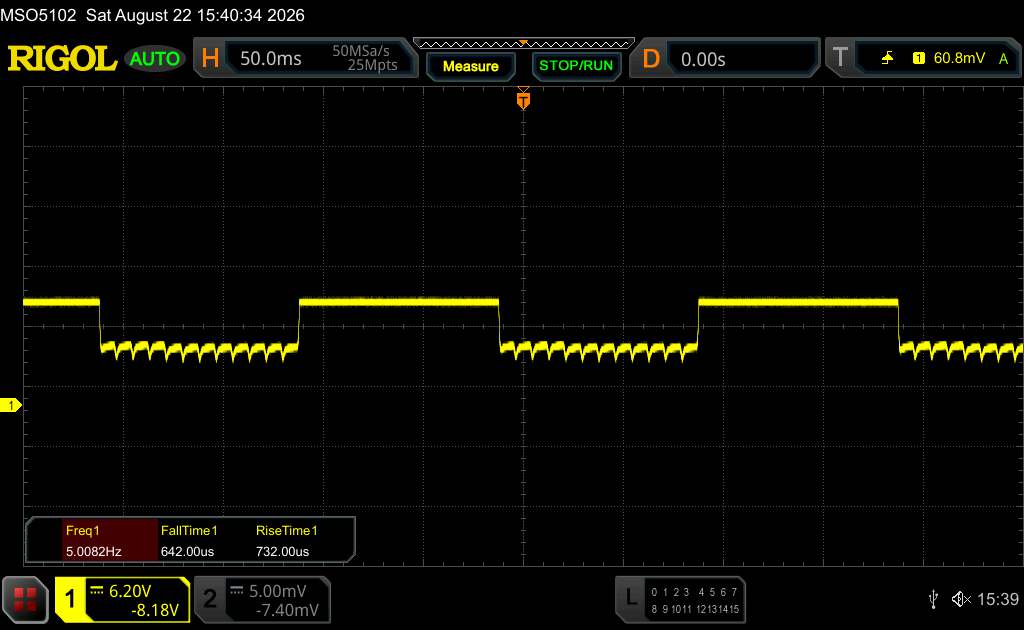 |
| ↘ 0.7 ms fall | ||
| The screen shows very fast response rates in our tests and should be very well suited for fast-paced gaming. In comparison, all tested devices range from 0.1 (minimum) to 240 (maximum) ms. » 8 % of all devices are better. This means that the measured response time is better than the average of all tested devices (19.7 ms). | ||
| ↔ Response Time 50% Grey to 80% Grey | ||
| 1.4 ms ... rise ↗ and fall ↘ combined | ↗ 0.7 ms rise | 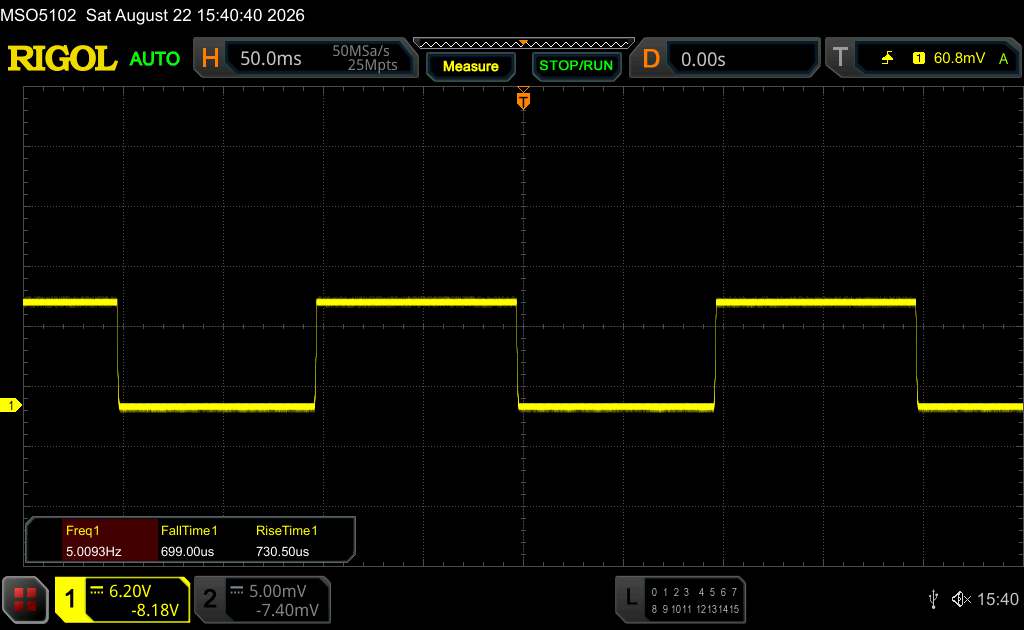 |
| ↘ 0.7 ms fall | ||
| The screen shows very fast response rates in our tests and should be very well suited for fast-paced gaming. In comparison, all tested devices range from 0.13 (minimum) to 636 (maximum) ms. » 7 % of all devices are better. This means that the measured response time is better than the average of all tested devices (30.7 ms). | ||
性能、排放和电池续航——几乎没有任何产品能与之匹敌
高通骁龙 8 Elite Gen 5 是目前市面上速度最快的智能手机 SoC 之一,因此在我们的基准测试中取得了高分。几乎在所有情况下都能保证绝对流畅的性能。
不过,在长时间高负载运行时,手机会变得相当烫手,而且在 3DMark 压力测试中也会出现明显的降频现象。
底部边缘的扬声器与听筒相配合,可实现立体声效果。音质有时中频略显深沉,非常适合播放流行音乐。不过,扬声器的音量并不算大。
支持蓝牙 6.0 进行无线音频传输,并兼容多种主流音频编解码器。
8,000-mAh 电池是小米 17 Max 的突出亮点;其容量超过了该系列中的任何其他机型。因此,这款智能手机在我们的 Wi-Fi 测试中实现了超过 33 小时的惊人续航时间也就不足为奇了。几乎没有其他顶级手机能与之匹敌。
| Xiaomi 17 Max | Xiaomi 17 | Samsung Galaxy S26 Ultra | OnePlus 15 | Apple iPhone 17 Pro Max | Average 512 GB UFS 4.1 Flash | Average of class Smartphone | |
|---|---|---|---|---|---|---|---|
| AndroBench 3-5 | -0% | -32% | -19% | -15% | -42% | ||
| Sequential Read 256KB (MB/s) | 3938.47 | 3943.44 0% | 3626.09 -8% | 3962.2 1% | 3616 ? -8% | 2278 ? -42% | |
| Sequential Write 256KB (MB/s) | 3802.01 | 3784.97 0% | 1658.91 -56% | 3741.2 -2% | 3225 ? -15% | 1971 ? -48% | |
| Random Read 4KB (MB/s) | 488.65 | 487.69 0% | 513.44 5% | 352.6 -28% | 414 ? -15% | 317 ? -35% | |
| Random Write 4KB (MB/s) | 647.54 | 643.31 -1% | 207.16 -68% | 334.4 -48% | 498 ? -23% | 362 ? -44% |
(-) The maximum temperature on the upper side is 46.4 °C / 116 F, compared to the average of 35.4 °C / 96 F, ranging from 21.9 to 247 °C for the class Smartphone.
(-) The bottom heats up to a maximum of 50.4 °C / 123 F, compared to the average of 34.1 °C / 93 F
3DMark 压力测试
| 3DMark | |
| Wild Life Stress Test Stability | |
| Apple iPhone 17 Pro Max | |
| Xiaomi 17 | |
| OnePlus 15 | |
| Samsung Galaxy S26 Ultra | |
| Xiaomi 17 Max | |
| Wild Life Extreme Stress Test | |
| Xiaomi 17 | |
| Apple iPhone 17 Pro Max | |
| Samsung Galaxy S26 Ultra | |
| OnePlus 15 | |
| Xiaomi 17 Max | |
| Solar Bay Stress Test Stability | |
| Xiaomi 17 | |
| Apple iPhone 17 Pro Max | |
| Samsung Galaxy S26 Ultra | |
| Xiaomi 17 Max | |
| Solar Bay Extreme Stress Test Stability | |
| Samsung Galaxy S26 Ultra | |
| Xiaomi 17 | |
| Apple iPhone 17 Pro Max | |
| Steel Nomad Light Stress Test Stability | |
| Xiaomi 17 | |
| Apple iPhone 17 Pro Max | |
| Samsung Galaxy S26 Ultra | |
Xiaomi 17 Max audio analysis
(±) | speaker loudness is average but good (81.1 dB)
Bass 100 - 315 Hz
(-) | nearly no bass - on average 62.8% lower than median
(+) | bass is linear (0% delta to prev. frequency)
Mids 400 - 2000 Hz
(-) | nearly no mids - on average 62.8% lower than median
(+) | mids are linear (0% delta to prev. frequency)
Highs 2 - 16 kHz
(-) | nearly no highs - on average 62.8% lower than median
(+) | highs are linear (0% delta to prev. frequency)
Overall 100 - 16.000 Hz
(-) | overall sound is not linear (135.5% difference to median)
Compared to same class
» 100% of all tested devices in this class were better, 0% similar, 0% worse
» The best had a delta of 11%, average was 34%, worst was 136%
Compared to all devices tested
» 100% of all tested devices were better, 0% similar, 0% worse
» The best had a delta of 4%, average was 23%, worst was 136%
Samsung Galaxy S26 Ultra audio analysis
(+) | speakers can play relatively loud (92 dB)
Bass 100 - 315 Hz
(-) | nearly no bass - on average 22.6% lower than median
(+) | bass is linear (5.2% delta to prev. frequency)
Mids 400 - 2000 Hz
(+) | balanced mids - only 4.9% away from median
(+) | mids are linear (4.8% delta to prev. frequency)
Highs 2 - 16 kHz
(+) | balanced highs - only 3.4% away from median
(+) | highs are linear (1.8% delta to prev. frequency)
Overall 100 - 16.000 Hz
(±) | linearity of overall sound is average (15.9% difference to median)
Compared to same class
» 5% of all tested devices in this class were better, 5% similar, 90% worse
» The best had a delta of 11%, average was 34%, worst was 136%
Compared to all devices tested
» 25% of all tested devices were better, 5% similar, 70% worse
» The best had a delta of 4%, average was 23%, worst was 136%
| Off / Standby |   0.1 / 0.2 Watt 0.1 / 0.2 Watt |
| Idle |  0.8 / 1.3 / 1.8 Watt 0.8 / 1.3 / 1.8 Watt |
    
| |
Key:
min: ,
med: ,
max: Metrahit Energy | |
| Xiaomi 17 Max 8000 mAh | Xiaomi 17 7000 mAh | Samsung Galaxy S26 Ultra 5000 mAh | OnePlus 15 7300 mAh | Apple iPhone 17 Pro Max 4823 mAh | Average Qualcomm Snapdragon 8 Elite Gen 5 | Average of class Smartphone | |
|---|---|---|---|---|---|---|---|
| Power Consumption | 4% | 22% | -19% | 12% | -1% | -7% | |
| Idle Minimum * (Watt) | 0.8 | 0.7 13% | 0.56 30% | 1.2 -50% | 0.6 25% | 0.882 ? -10% | 0.901 ? -13% |
| Idle Average * (Watt) | 1.3 | 1.4 -8% | 1.18 9% | 1.4 -8% | 1.3 -0% | 1.373 ? -6% | 1.483 ? -14% |
| Idle Maximum * (Watt) | 1.8 | 1.7 6% | 1.33 26% | 1.8 -0% | 1.6 11% | 1.586 ? 12% | 1.677 ? 7% |
| Load Average * (Watt) | 5.9 | 14.91 | 6.7 | 4.1 | 8.01 ? | 6.82 ? | |
| Load Maximum * (Watt) | 11.7 | 16.58 | 12.3 | 11.5 | 11.4 ? | 10.8 ? |
* ... smaller is better
| Xiaomi 17 Max 8000 mAh | Xiaomi 17 7000 mAh | Samsung Galaxy S26 Ultra 5000 mAh | OnePlus 15 7300 mAh | Apple iPhone 17 Pro Max 4823 mAh | |
|---|---|---|---|---|---|
| Battery runtime | -5% | -32% | -9% | -14% | |
| Reader / Idle (h) | 75.1 | 72.7 -3% | 50.9 -32% | 66.4 -12% | |
| WiFi v1.3 (h) | 33.4 | 30.9 -7% | 17.9 -46% | 30.7 -8% | 28.6 -14% |
| Load (h) | 4.5 | 4.3 -4% | 3.7 -18% | 4.2 -7% | |
| H.264 (h) | 36.1 | 30.9 | 36.5 |
Notebookcheck 综合评分
对于想要更大屏幕、更长续航、强劲性能和出色拍照体验的用户来说,小米17 Max是一款出色的智能手机。
然而,在西方国家,由于从中国进口的限制,您需要注意以下事项。
Xiaomi 17 Max
- 08/26/2026 v8
Florian Schmitt
 Total Sustainability Score:
 可能替代方案的比较
Image | Model / Review | Price | Weight | Drive | Display |
|---|---|---|---|---|---|
1. 88.1%  | Xiaomi 17 Max Qualcomm Snapdragon 8 Elite Gen 5 ⎘ Qualcomm Adreno 840 ⎘ 16 GB Memory, 512 GB UFS 4.x | Amazon: 1. $1,339.50 XIAOMI 17 Ultra Ai 5G (Compa... 2. $1,309.50 XIAOMI 17 Ultra Ai 5G (Compa... 3. $779.50 XIAOMI 17T PRO Ai 5G (Compat... List Price: 730€ | 225 g | 512 GB UFS 4.1 Flash | 6.90" 2608x1200 416 PPI AMOLED |
2. 89.2%  | Xiaomi 17 Qualcomm Snapdragon 8 Elite Gen 5 ⎘ Qualcomm Adreno 840 ⎘ 12 GB Memory, 512 GB UFS 4.x | List Price: 650€ | 191 g | 512 GB UFS 4.1 Flash | 6.30" 2656x1220 464 PPI LTPO AMOLED |
3. 89.8%  | Samsung Galaxy S26 Ultra Qualcomm Snapdragon 8 Elite Gen 5 for Galaxy ⎘ Qualcomm Adreno 840 ⎘ 12 GB Memory, 256 GB UFS 4.x | List Price: 1449€ | 214 g | 256 GB UFS 4.0 Flash | 6.90" 3120x1440 498 PPI Dynamic AMOLED 2X |
4. 87.1%  | OnePlus 15 Qualcomm Snapdragon 8 Elite Gen 5 ⎘ Qualcomm Adreno 840 ⎘ 16 GB Memory, 512 GB UFS 4.x | Amazon: List Price: 999€ | 215 g | 512 GB UFS 4.1 Flash | 6.78" 2772x1272 450 PPI AMOLED |
5. 89.2%  | Apple iPhone 17 Pro Max Apple A19 Pro ⎘ Apple A19 Pro 6-Core GPU ⎘ 12 GB Memory, 256 GB NVMe | List Price: 1449 Euro | 233 g | 256 GB NVMe | 6.90" 2868x1320 460 PPI OLED |
Transparency
The selection of devices to be reviewed is made by our editorial team. The test sample was provided to the author as a loan by the manufacturer or retailer for the purpose of this review. The lender had no influence on this review, nor did the manufacturer receive a copy of this review before publication. There was no obligation to publish this review. As an independent media company, Notebookcheck is not subjected to the authority of manufacturers, retailers or publishers.
This is how Notebookcheck is testing
Every year, Notebookcheck independently reviews hundreds of laptops and smartphones using standardized procedures to ensure that all results are comparable. We have continuously developed our test methods for around 20 years and set industry standards in the process. In our test labs, high-quality measuring equipment is utilized by experienced technicians and editors. These tests involve a multi-stage validation process. Our complex rating system is based on hundreds of well-founded measurements and benchmarks, which maintains objectivity. Further information on our test methods can be found here.
 Add as a preferred source on Google