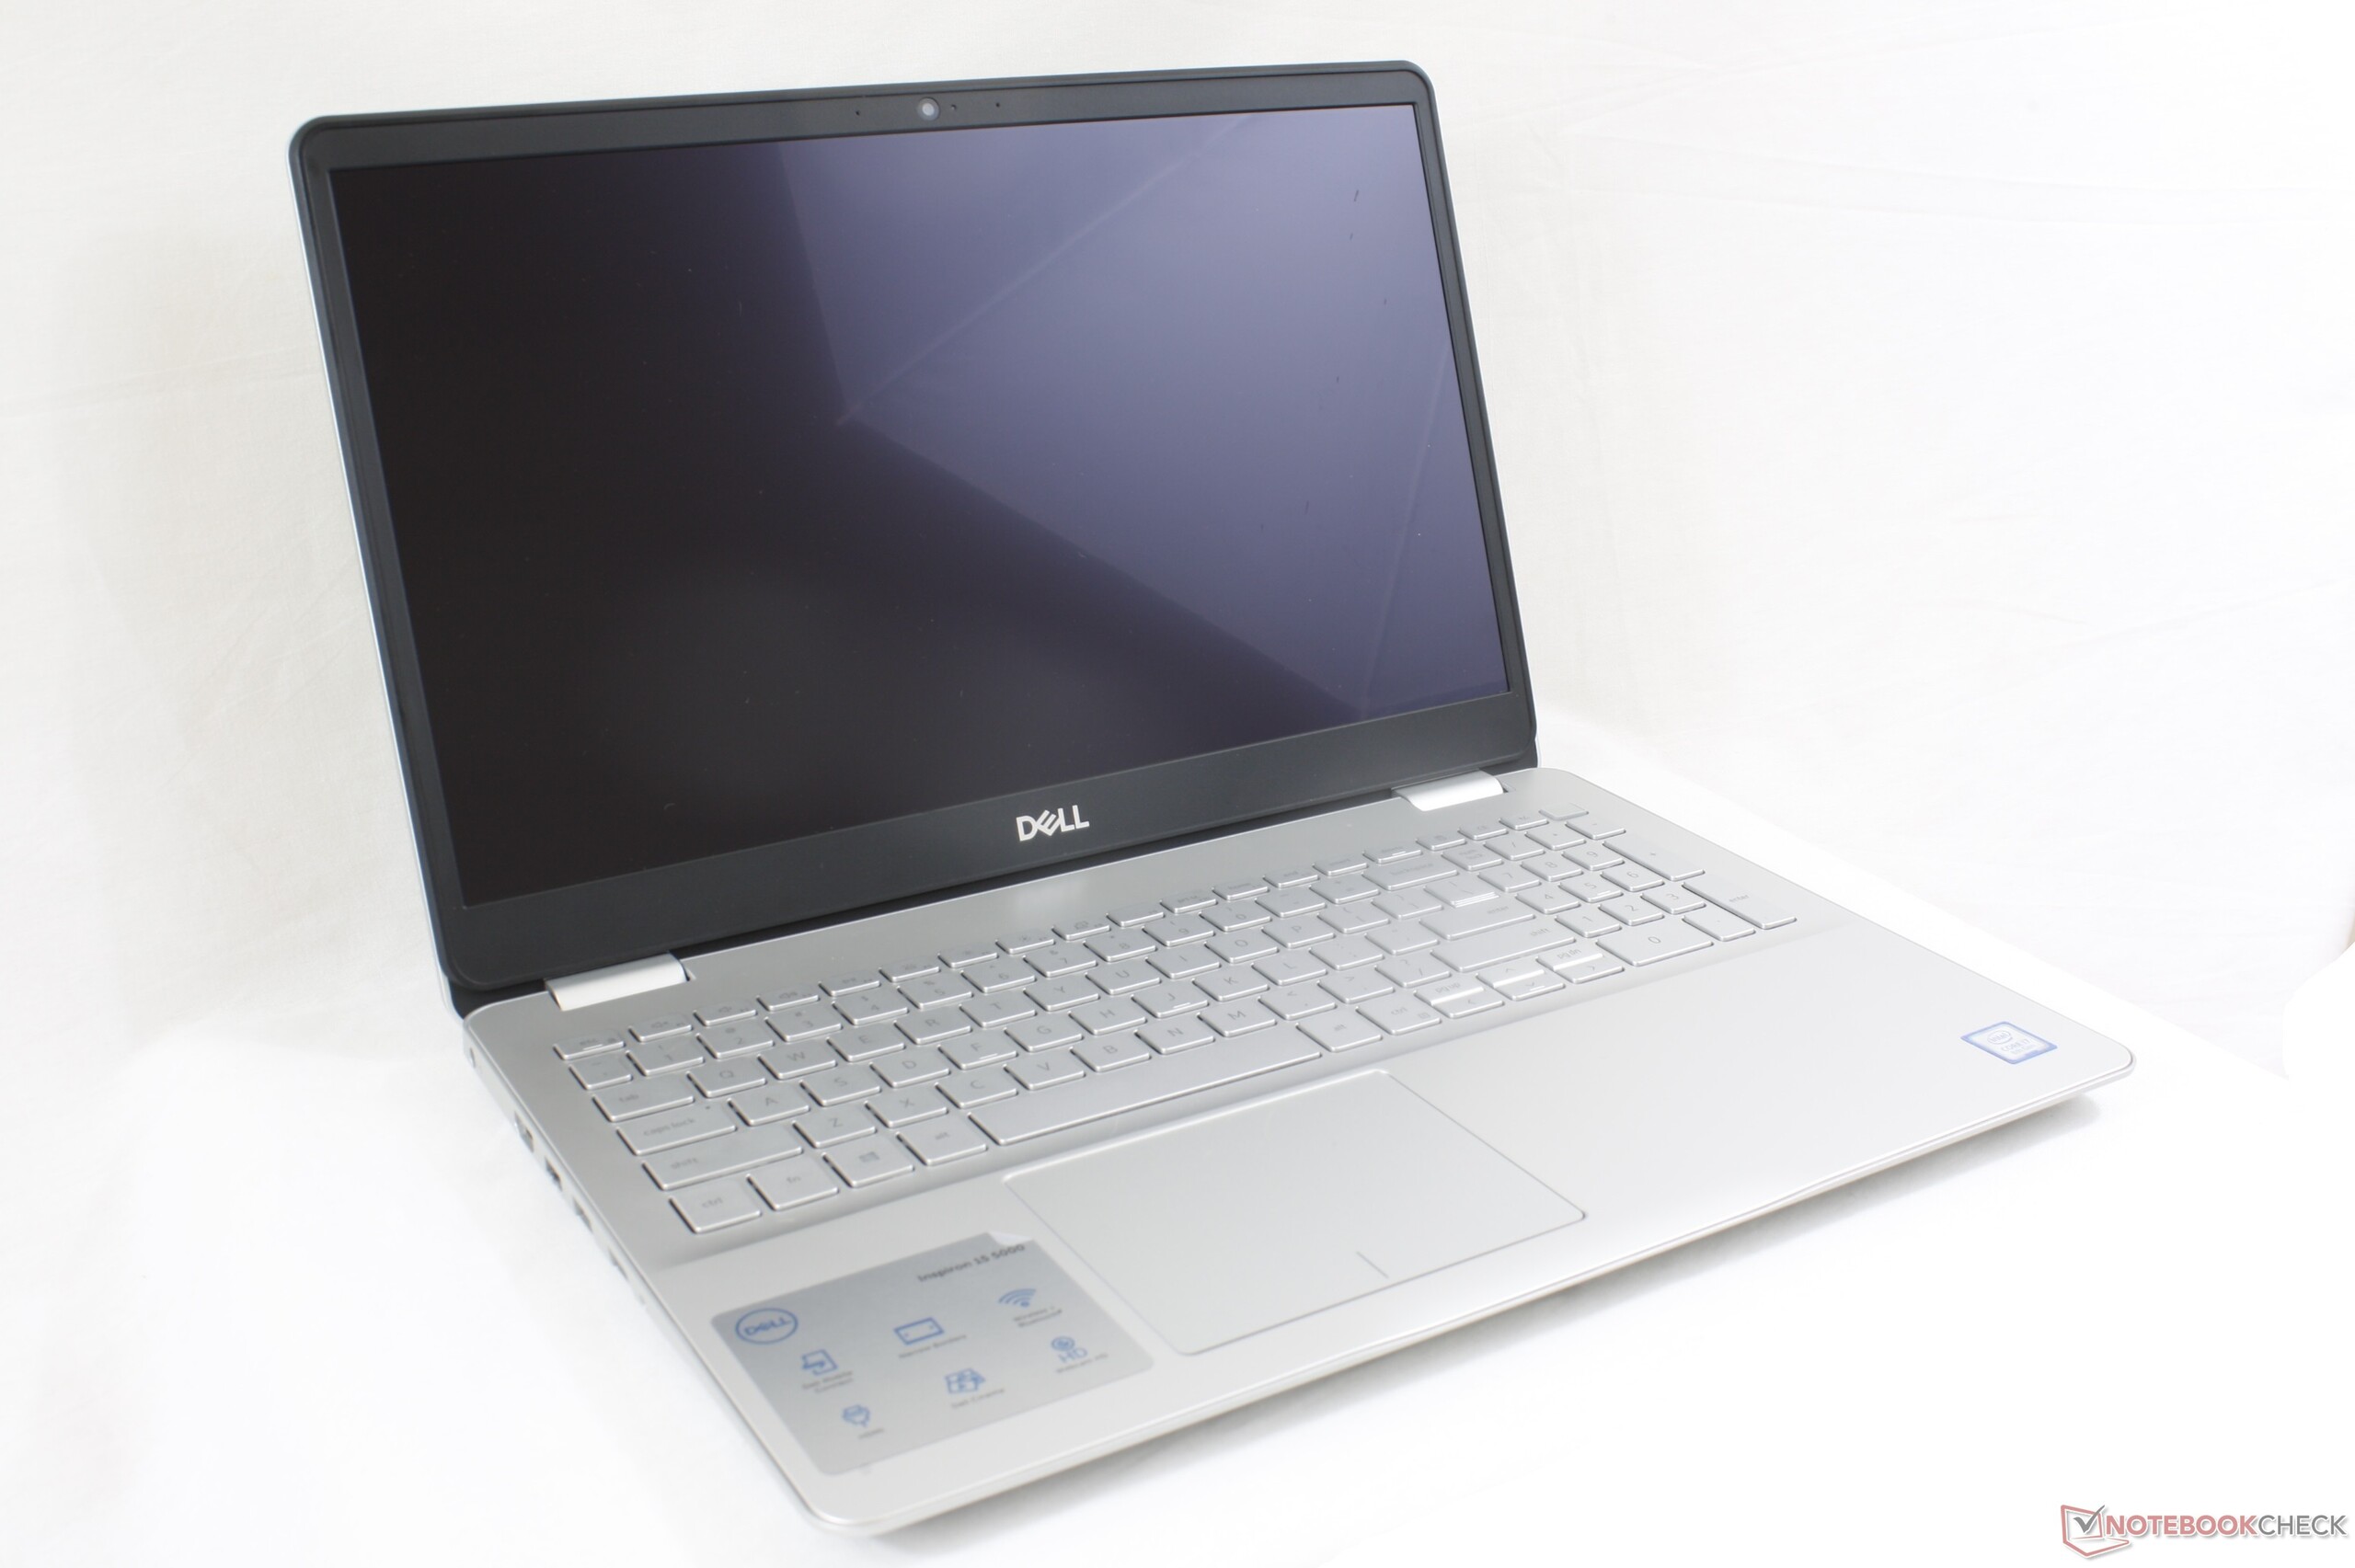
戴尔灵越15 5000 5584(i7-8565U)笔记本电脑评测
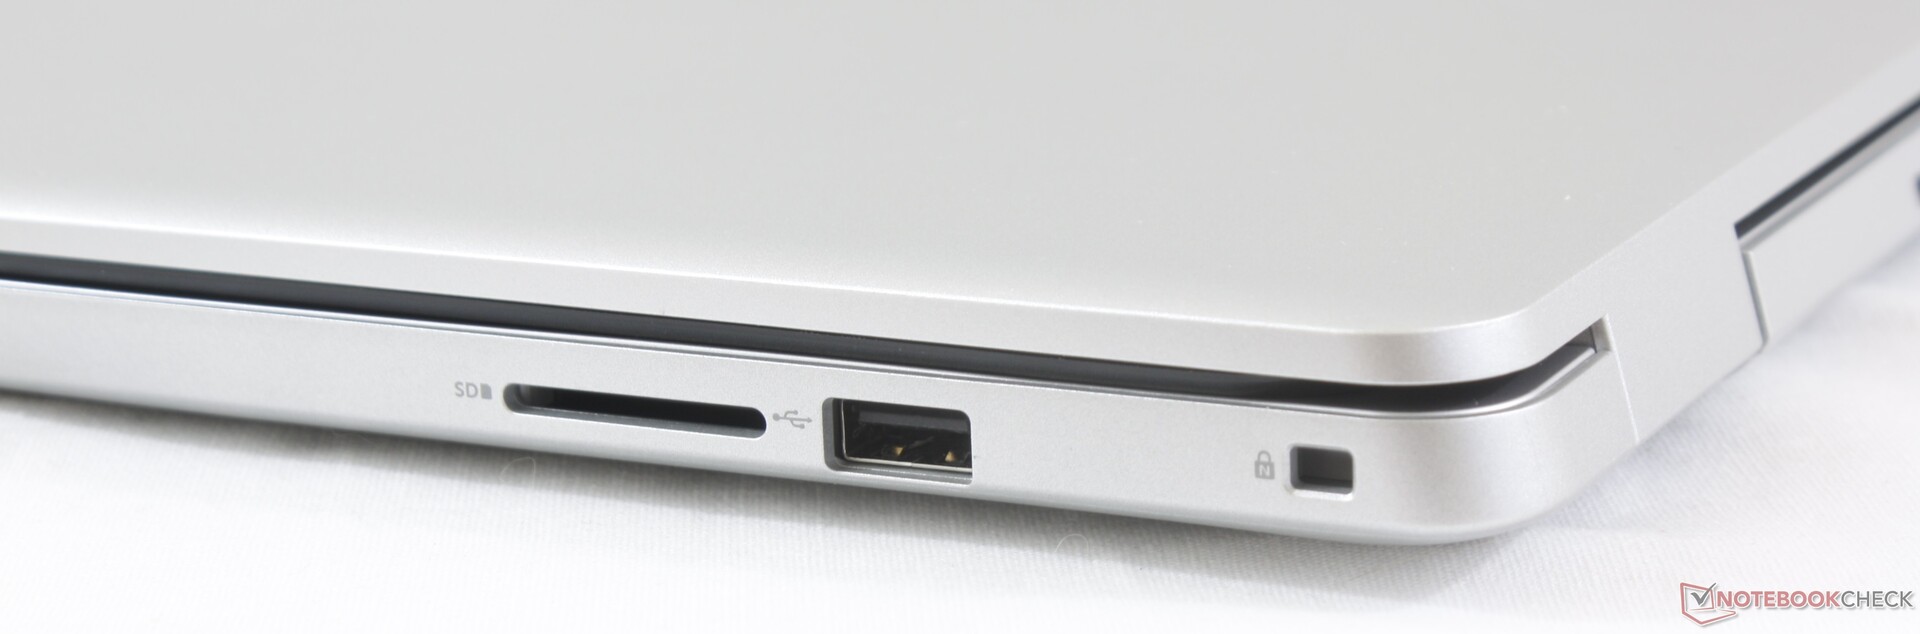
| SD Card Reader | |
| average JPG Copy Test (av. of 3 runs) | |
| Dell XPS 15 9570 i7 UHD (Toshiba Exceria Pro SDXC 64 GB UHS-II) | |
| Acer Aspire 5 A515-52G-723L (Toshiba Exceria Pro SDXC 64 GB UHS-II) | |
| HP Pavilion 15-cs2019ng (Toshiba Exceria Pro SDXC 64 GB UHS-II) | |
| Dell Inspiron 15 5575-98MH4 (Toshiba Exceria Pro SDXC 64 GB UHS-II) | |
| Dell Inspiron 15 5000 5584 (Toshiba Exceria Pro SDXC 64 GB UHS-II) | |
| maximum AS SSD Seq Read Test (1GB) | |
| Dell XPS 15 9570 i7 UHD (Toshiba Exceria Pro SDXC 64 GB UHS-II) | |
| Acer Aspire 5 A515-52G-723L (Toshiba Exceria Pro SDXC 64 GB UHS-II) | |
| Dell Inspiron 15 5575-98MH4 (Toshiba Exceria Pro SDXC 64 GB UHS-II) | |
| HP Pavilion 15-cs2019ng (Toshiba Exceria Pro SDXC 64 GB UHS-II) | |
| Dell Inspiron 15 5000 5584 (Toshiba Exceria Pro SDXC 64 GB UHS-II) | |
| Networking | |
| iperf3 transmit AX12 | |
| Acer Aspire 5 A515-52G-723L | |
| Dell XPS 15 9570 i7 UHD | |
| HP Pavilion 15-cs2019ng | |
| Dell Inspiron 15 5575-98MH4 | |
| Dell Inspiron 15 5000 5584 | |
| iperf3 receive AX12 | |
| HP Pavilion 15-cs2019ng | |
| Dell XPS 15 9570 i7 UHD | |
| Acer Aspire 5 A515-52G-723L | |
| Dell Inspiron 15 5575-98MH4 | |
| Dell Inspiron 15 5000 5584 | |
| |||||||||||||||||||||||||
Brightness Distribution: 92 %
Center on Battery: 227 cd/m²
Contrast: 1081:1 (Black: 0.21 cd/m²)
ΔE ColorChecker Calman: 6.55 | ∀{0.5-29.43 Ø4.71}
calibrated: 4.61
ΔE Greyscale Calman: 5.2 | ∀{0.09-98 Ø4.96}
58.2% sRGB (Argyll 1.6.3 3D)
37% AdobeRGB 1998 (Argyll 1.6.3 3D)
40.48% AdobeRGB 1998 (Argyll 3D)
58.8% sRGB (Argyll 3D)
39.17% Display P3 (Argyll 3D)
Gamma: 2.66
CCT: 6434 K
| Dell Inspiron 15 5000 5584 AU Optronics AUO22ED, B156HAK, IPS, 15.6", 1920x1080 | Dell XPS 15 9570 i7 UHD LQ156D1, IPS, 15.6", 3840x2160 | HP Pavilion 15-cs2019ng BOE080D, IPS, 15.6", 1920x1080 | Acer Aspire 5 A515-52G-723L BOE NV156FHM-N48, IPS, 15.6", 1920x1080 | Lenovo Yoga 730-15IKB BOE HF NV156QUM-N51, IPS, 15.6", 3840x2160 | Dell Inspiron 15 5575-98MH4 Innolux JMC9X 156BGA, TN LED, 15.6", 1366x768 | |
|---|---|---|---|---|---|---|
| Display | 89% | 60% | 1% | 64% | 2% | |
| Display P3 Coverage (%) | 39.17 | 79.1 102% | 67.2 72% | 40.02 2% | 68.7 75% | 40.02 2% |
| sRGB Coverage (%) | 58.8 | 98.8 68% | 88.1 50% | 58.5 -1% | 90 53% | 59.8 2% |
| AdobeRGB 1998 Coverage (%) | 40.48 | 79.2 96% | 64.4 59% | 41.34 2% | 65.8 63% | 41.37 2% |
| Response Times | -3% | 7% | -3% | 22% | 8% | |
| Response Time Grey 50% / Grey 80% * (ms) | 48.8 ? | 46.4 ? 5% | 43 ? 12% | 45 ? 8% | 34 ? 30% | 50 ? -2% |
| Response Time Black / White * (ms) | 29.2 ? | 32 ? -10% | 29 ? 1% | 33 ? -13% | 25 ? 14% | 24 ? 18% |
| PWM Frequency (Hz) | 980 ? | 208 ? | 250 ? | 961 ? | 250 ? | |
| Screen | 44% | 26% | 13% | 20% | -34% | |
| Brightness middle (cd/m²) | 227 | 494 118% | 320 41% | 278 22% | 309 36% | 197 -13% |
| Brightness (cd/m²) | 230 | 457 99% | 293 27% | 271 18% | 299 30% | 195 -15% |
| Brightness Distribution (%) | 92 | 88 -4% | 86 -7% | 89 -3% | 84 -9% | 78 -15% |
| Black Level * (cd/m²) | 0.21 | 0.34 -62% | 0.26 -24% | 0.26 -24% | 0.29 -38% | 0.43 -105% |
| Contrast (:1) | 1081 | 1453 34% | 1231 14% | 1069 -1% | 1066 -1% | 458 -58% |
| Colorchecker dE 2000 * | 6.55 | 5.2 21% | 4.5 31% | 4.73 28% | 3.9 40% | 10.35 -58% |
| Colorchecker dE 2000 max. * | 23.45 | 17.5 25% | 8.81 62% | 8.38 64% | 7.5 68% | 16.02 32% |
| Colorchecker dE 2000 calibrated * | 4.61 | 5.17 -12% | ||||
| Greyscale dE 2000 * | 5.2 | 2.7 48% | 4.71 9% | 2.59 50% | 4.58 12% | 11.25 -116% |
| Gamma | 2.66 83% | 2.1 105% | 2.45 90% | 2.38 92% | 2.43 91% | 2.08 106% |
| CCT | 6434 101% | 7038 92% | 7085 92% | 6160 106% | 7344 89% | 11592 56% |
| Color Space (Percent of AdobeRGB 1998) (%) | 37 | 71.2 92% | 58 57% | 36 -3% | 39 5% | 38 3% |
| Color Space (Percent of sRGB) (%) | 58.2 | 98.8 70% | 88 51% | 58 0% | 90 55% | 60 3% |
| Total Average (Program / Settings) | 43% /
47% | 31% /
30% | 4% /
9% | 35% /
29% | -8% /
-21% |
* ... smaller is better
Display Response Times
| ↔ Response Time Black to White | ||
|---|---|---|
| 29.2 ms ... rise ↗ and fall ↘ combined | ↗ 15.6 ms rise | 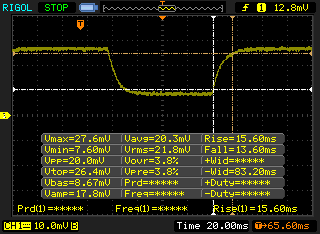 |
| ↘ 13.6 ms fall | ||
| The screen shows relatively slow response rates in our tests and may be too slow for gamers. In comparison, all tested devices range from 0.1 (minimum) to 240 (maximum) ms. » 78 % of all devices are better. This means that the measured response time is worse than the average of all tested devices (19.8 ms). | ||
| ↔ Response Time 50% Grey to 80% Grey | ||
| 48.8 ms ... rise ↗ and fall ↘ combined | ↗ 25.6 ms rise | 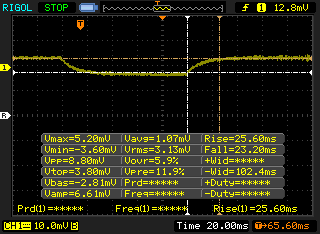 |
| ↘ 23.2 ms fall | ||
| The screen shows slow response rates in our tests and will be unsatisfactory for gamers. In comparison, all tested devices range from 0.165 (minimum) to 636 (maximum) ms. » 84 % of all devices are better. This means that the measured response time is worse than the average of all tested devices (31 ms). | ||
Screen Flickering / PWM (Pulse-Width Modulation)
| Screen flickering / PWM not detected | 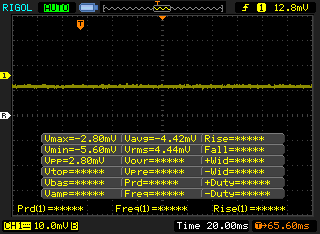 | ||
In comparison: 52 % of all tested devices do not use PWM to dim the display. If PWM was detected, an average of 7757 (minimum: 5 - maximum: 343500) Hz was measured. | |||
| Cinebench R11.5 | |
| CPU Single 64Bit | |
| Average Intel Core i7-8565U (0.65 - 2.16, n=11) | |
| Acer Swift 3 SF314-55-31N8 | |
| CPU Multi 64Bit | |
| Average Intel Core i7-8565U (4.09 - 7.4, n=11) | |
| Acer Swift 3 SF314-55-31N8 | |
| Cinebench R10 | |
| Rendering Multiple CPUs 32Bit | |
| Dell G5 15 5590 | |
| Average Intel Core i7-8565U (13806 - 23118, n=16) | |
| Acer Swift 3 SF314-55-31N8 | |
| Rendering Single 32Bit | |
| Average Intel Core i7-8565U (2682 - 8906, n=16) | |
| Dell G5 15 5590 | |
| Acer Swift 3 SF314-55-31N8 | |
| wPrime 2.10 - 1024m | |
| Acer Swift 3 SF314-55-31N8 | |
| Average Intel Core i7-8565U (263 - 420, n=7) | |
* ... smaller is better
| PCMark 8 | |
| Home Score Accelerated v2 | |
| Acer Aspire 5 A515-52G-723L | |
| Dell XPS 15 9570 i7 UHD | |
| HP Pavilion 15-cs2019ng | |
| Average Intel Core i7-8565U, Intel UHD Graphics 620 (2577 - 4179, n=20) | |
| Lenovo Yoga 730-15IKB | |
| Dell Inspiron 15 5000 5584 | |
| Dell Inspiron 15 5575-98MH4 | |
| Work Score Accelerated v2 | |
| Acer Aspire 5 A515-52G-723L | |
| HP Pavilion 15-cs2019ng | |
| Average Intel Core i7-8565U, Intel UHD Graphics 620 (3596 - 5189, n=19) | |
| Dell Inspiron 15 5000 5584 | |
| Dell XPS 15 9570 i7 UHD | |
| Lenovo Yoga 730-15IKB | |
| PCMark 8 Home Score Accelerated v2 | 3386 points | |
| PCMark 8 Work Score Accelerated v2 | 4540 points | |
| PCMark 10 Score | 4060 points | |
Help | ||
| Dell Inspiron 15 5000 5584 Toshiba BG3 KBG30ZMS512G | HP Pavilion 15-cs2019ng Toshiba KBG30ZMV256G | Acer Aspire 5 A515-52G-723L WDC PC SN520 SDAPNUW-512G | Lenovo Yoga 730-15IKB SK Hynix PC401 512GB M.2 (HFS512GD9TNG) | Dell XPS 15 9570 Core i9 UHD Samsung SSD PM981 MZVLB1T0HALR | |
|---|---|---|---|---|---|
| AS SSD | -69% | 47% | 16% | 92% | |
| Seq Read (MB/s) | 1115 | 1153 3% | 1557 40% | 2158 94% | 1320 18% |
| Seq Write (MB/s) | 841 | 736 -12% | 1237 47% | 680 -19% | 1500 78% |
| 4K Read (MB/s) | 46.39 | 46.51 0% | 42.56 -8% | 44.74 -4% | 30.73 -34% |
| 4K Write (MB/s) | 87.6 | 114.1 30% | 127.2 45% | 123 40% | 94.4 8% |
| 4K-64 Read (MB/s) | 904 | 618 -32% | 1034 14% | 623 -31% | 1453 61% |
| 4K-64 Write (MB/s) | 326.5 | 461.4 41% | 1186 263% | 486 49% | 1815 456% |
| Access Time Read * (ms) | 0.048 | 0.421 -777% | 0.077 -60% | 0.044 8% | 0.061 -27% |
| Access Time Write * (ms) | 0.24 | 0.233 3% | 0.028 88% | 0.051 79% | 0.044 82% |
| Score Read (Points) | 1062 | 780 -27% | 1233 16% | 884 -17% | 1616 52% |
| Score Write (Points) | 498 | 649 30% | 1437 189% | 677 36% | 2059 313% |
| Score Total (Points) | 2100 | 1822 -13% | 3291 57% | 1951 -7% | 4507 115% |
| Copy ISO MB/s (MB/s) | 1090 | 1313 20% | 1641 51% | 2577 136% | |
| Copy Program MB/s (MB/s) | 618 | 334.6 -46% | 390 -37% | 515 -17% | |
| Copy Game MB/s (MB/s) | 750 | 684 -9% | 574 -23% | 1120 49% |
* ... smaller is better

| 3DMark 11 | |
| 1280x720 Performance GPU | |
| Dell XPS 15 9570 Core i9 UHD | |
| Lenovo Yoga 730-15IKB | |
| Dell Inspiron 17-7786 | |
| HP Pavilion 15-cs2019ng | |
| Dell Latitude 14 5495 | |
| Dell Vostro 15-5568 | |
| Dell XPS 13 9360 FHD i7 Iris | |
| Dell Inspiron 15 5000 5584 | |
| Average Intel UHD Graphics 620 (1144 - 3432, n=244) | |
| 1280x720 Performance Combined | |
| Dell XPS 15 9570 Core i9 UHD | |
| Lenovo Yoga 730-15IKB | |
| HP Pavilion 15-cs2019ng | |
| Dell Inspiron 17-7786 | |
| Dell Vostro 15-5568 | |
| Dell Latitude 14 5495 | |
| Dell XPS 13 9360 FHD i7 Iris | |
| Average Intel UHD Graphics 620 (927 - 2505, n=244) | |
| Dell Inspiron 15 5000 5584 | |
| 3DMark - 1280x720 Cloud Gate Standard Graphics | |
| Dell XPS 15 9570 Core i9 UHD | |
| Lenovo Yoga 730-15IKB | |
| HP Pavilion 15-cs2019ng | |
| Dell Inspiron 17-7786 | |
| Dell Vostro 15-5568 | |
| Dell XPS 13 9360 FHD i7 Iris | |
| Dell Latitude 14 5495 | |
| Dell Inspiron 15 5000 5584 | |
| Average Intel UHD Graphics 620 (6205 - 16400, n=225) | |
| Dell Inspiron 15 5575-98MH4 | |
| 3DMark 11 Performance | 1993 points | |
| 3DMark Cloud Gate Standard Score | 8174 points | |
| 3DMark Fire Strike Score | 1077 points | |
Help | ||
| Dell Inspiron 15 5000 5584 UHD Graphics 620, i7-8565U, Toshiba BG3 KBG30ZMS512G | HP Pavilion 15-cs2019ng GeForce MX250, i5-8265U, Toshiba KBG30ZMV256G | Acer Aspire 5 A515-52G-723L GeForce MX250, i7-8565U, WDC PC SN520 SDAPNUW-512G | Dell XPS 15 9570 Core i9 UHD GeForce GTX 1050 Ti Max-Q, i9-8950HK, Samsung SSD PM981 MZVLB1T0HALR | Dell Inspiron 15 5575-98MH4 Vega 3, R3 2200U, Seagate Mobile HDD 1TB ST1000LM035 | LG Gram 17Z990-R.AAS7U1 UHD Graphics 620, i7-8565U, Samsung SSD PM871b MZNLN256HAJQ | |
|---|---|---|---|---|---|---|
| Noise | -18% | -13% | -10% | -11% | -4% | |
| off / environment * (dB) | 28.4 | 30.5 -7% | 29.9 -5% | 28.2 1% | 30.4 -7% | 28.1 1% |
| Idle Minimum * (dB) | 28.4 | 31.5 -11% | 29.9 -5% | 28.5 -0% | 31.4 -11% | 28.1 1% |
| Idle Average * (dB) | 28.4 | 31.5 -11% | 29.9 -5% | 28.6 -1% | 31.4 -11% | 28.1 1% |
| Idle Maximum * (dB) | 28.4 | 31.5 -11% | 29.9 -5% | 28.8 -1% | 31.6 -11% | 28.1 1% |
| Load Average * (dB) | 28.9 | 42.5 -47% | 41.7 -44% | 36.2 -25% | 31.9 -10% | 35 -21% |
| Load Maximum * (dB) | 36 | 42.5 -18% | 41.7 -16% | 47.6 -32% | 40.9 -14% | 37.4 -4% |
| Witcher 3 ultra * (dB) | 47.6 |
* ... smaller is better
Noise level
| Idle |
| 28.4 / 28.4 / 28.4 dB(A) |
| Load |
| 28.9 / 36 dB(A) |
 | ||
30 dB silent 40 dB(A) audible 50 dB(A) loud |
||
min: | ||
(±) The maximum temperature on the upper side is 40.8 °C / 105 F, compared to the average of 36.8 °C / 98 F, ranging from 21 to 71 °C for the class Multimedia.
(-) The bottom heats up to a maximum of 47.4 °C / 117 F, compared to the average of 39.1 °C / 102 F
(+) In idle usage, the average temperature for the upper side is 26.4 °C / 80 F, compared to the device average of 31.3 °C / 88 F.
(+) The palmrests and touchpad are cooler than skin temperature with a maximum of 25.4 °C / 77.7 F and are therefore cool to the touch.
(+) The average temperature of the palmrest area of similar devices was 28.7 °C / 83.7 F (+3.3 °C / 6 F).
Dell Inspiron 15 5000 5584 audio analysis
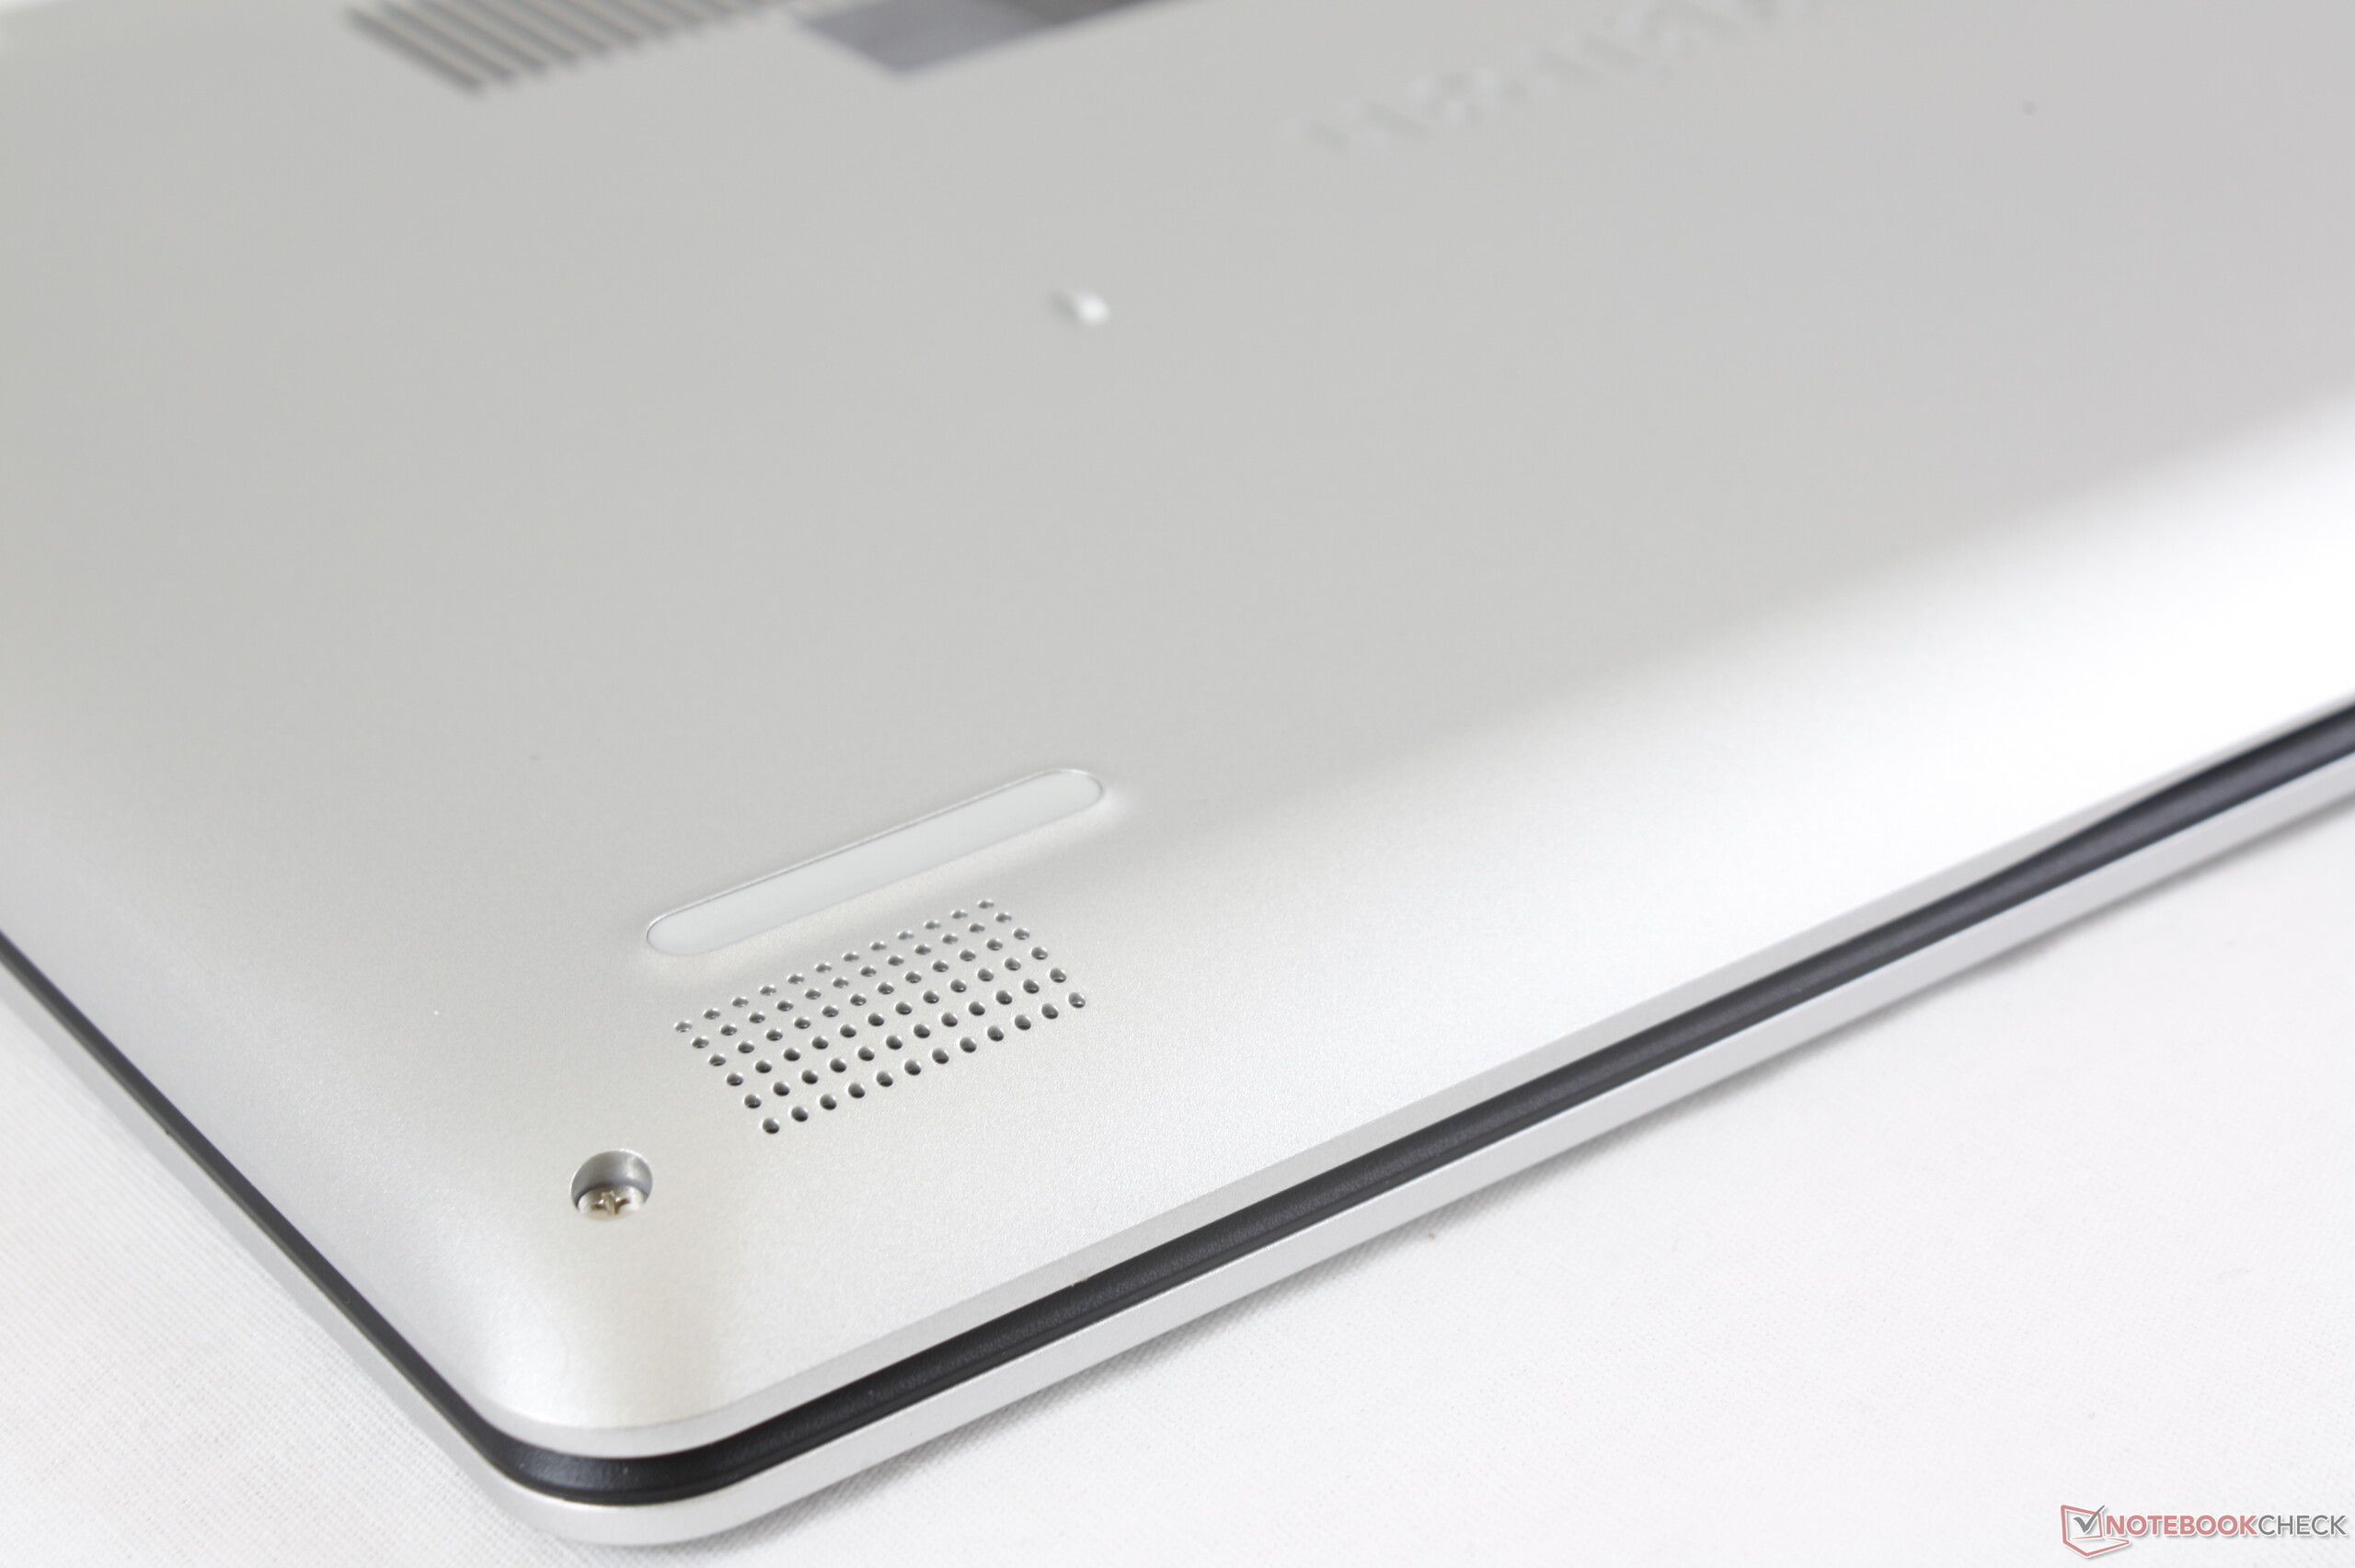
(+) | speakers can play relatively loud (85.4 dB)
Bass 100 - 315 Hz
(-) | nearly no bass - on average 18.1% lower than median
(±) | linearity of bass is average (14.1% delta to prev. frequency)
Mids 400 - 2000 Hz
(+) | balanced mids - only 2.6% away from median
(±) | linearity of mids is average (7.6% delta to prev. frequency)
Highs 2 - 16 kHz
(+) | balanced highs - only 4.3% away from median
(+) | highs are linear (6.8% delta to prev. frequency)
Overall 100 - 16.000 Hz
(±) | linearity of overall sound is average (18.2% difference to median)
Compared to same class
» 54% of all tested devices in this class were better, 7% similar, 38% worse
» The best had a delta of 5%, average was 17%, worst was 45%
Compared to all devices tested
» 39% of all tested devices were better, 8% similar, 53% worse
» The best had a delta of 4%, average was 23%, worst was 134%
Apple MacBook 12 (Early 2016) 1.1 GHz audio analysis
(+) | speakers can play relatively loud (83.6 dB)
Bass 100 - 315 Hz
(±) | reduced bass - on average 11.3% lower than median
(±) | linearity of bass is average (14.2% delta to prev. frequency)
Mids 400 - 2000 Hz
(+) | balanced mids - only 2.4% away from median
(+) | mids are linear (5.5% delta to prev. frequency)
Highs 2 - 16 kHz
(+) | balanced highs - only 2% away from median
(+) | highs are linear (4.5% delta to prev. frequency)
Overall 100 - 16.000 Hz
(+) | overall sound is linear (10.2% difference to median)
Compared to same class
» 7% of all tested devices in this class were better, 2% similar, 90% worse
» The best had a delta of 5%, average was 18%, worst was 53%
Compared to all devices tested
» 5% of all tested devices were better, 1% similar, 94% worse
» The best had a delta of 4%, average was 23%, worst was 134%
| Off / Standby | |
| Idle | |
| Load |
|
Key:
min: | |
| Dell Inspiron 15 5000 5584 i7-8565U, UHD Graphics 620, Toshiba BG3 KBG30ZMS512G, IPS, 1920x1080, 15.6" | HP Pavilion 15-cs2019ng i5-8265U, GeForce MX250, Toshiba KBG30ZMV256G, IPS, 1920x1080, 15.6" | Acer Aspire 5 A515-52G-723L i7-8565U, GeForce MX250, WDC PC SN520 SDAPNUW-512G, IPS, 1920x1080, 15.6" | Lenovo Yoga 730-15IKB i5-8550U, GeForce GTX 1050 Mobile, SK Hynix PC401 512GB M.2 (HFS512GD9TNG), IPS, 3840x2160, 15.6" | Dell XPS 15 9570 Core i9 UHD i9-8950HK, GeForce GTX 1050 Ti Max-Q, Samsung SSD PM981 MZVLB1T0HALR, IPS, 3840x2160, 15.6" | Dell XPS 15 9570 i7 UHD i7-8750H, GeForce GTX 1050 Ti Max-Q, Toshiba XG5 KXG50ZNV512G, IPS, 3840x2160, 15.6" | |
|---|---|---|---|---|---|---|
| Power Consumption | -20% | -22% | -42% | -119% | -141% | |
| Idle Minimum * (Watt) | 3.6 | 4.9 -36% | 4.4 -22% | 4.8 -33% | 7.1 -97% | 9.48 -163% |
| Idle Average * (Watt) | 7.4 | 7.9 -7% | 6.9 7% | 10.1 -36% | 13.6 -84% | 16.1 -118% |
| Idle Maximum * (Watt) | 8.3 | 10.1 -22% | 9.9 -19% | 10.7 -29% | 14.1 -70% | 16.9 -104% |
| Load Average * (Watt) | 38 | 60 -58% | 55 -45% | 44 -16% | 103.9 -173% | 90.8 -139% |
| Load Maximum * (Watt) | 47.9 | 38 21% | 63.4 -32% | 94.7 -98% | 130.9 -173% | 134.4 -181% |
| Witcher 3 ultra * (Watt) | 103 |
* ... smaller is better
| Dell Inspiron 15 5000 5584 i7-8565U, UHD Graphics 620, 42 Wh | HP Pavilion 15-cs2019ng i5-8265U, GeForce MX250, 41 Wh | Acer Aspire 5 A515-52G-723L i7-8565U, GeForce MX250, 48 Wh | Lenovo Yoga 730-15IKB i5-8550U, GeForce GTX 1050 Mobile, 51.5 Wh | Dell XPS 15 9570 Core i9 UHD i9-8950HK, GeForce GTX 1050 Ti Max-Q, 97 Wh | Acer Swift 5 SF515-51T-76B6 i7-8565U, UHD Graphics 620, 53.9 Wh | |
|---|---|---|---|---|---|---|
| Battery runtime | -2% | 45% | 5% | 40% | 66% | |
| Reader / Idle (h) | 15.3 | 8 -48% | 12.9 -16% | 11.6 -24% | 15 -2% | 16.2 6% |
| WiFi v1.3 (h) | 3.5 | 5 43% | 6.9 97% | 6.2 77% | 8.6 146% | 7.2 106% |
| Load (h) | 1.3 | 1.3 0% | 2 54% | 0.8 -38% | 1 -23% | 2.4 85% |
Pros
Cons
我们欣赏Inspiron 15 5584提高了所有廉价笔记本电脑应具备的标准。SSD,1080p IPS显示屏和窄边框设计应该是2019年发布的任何多媒体笔记本电脑的最低标准,因此很高兴看到戴尔跳过默认HDD和768p面板。
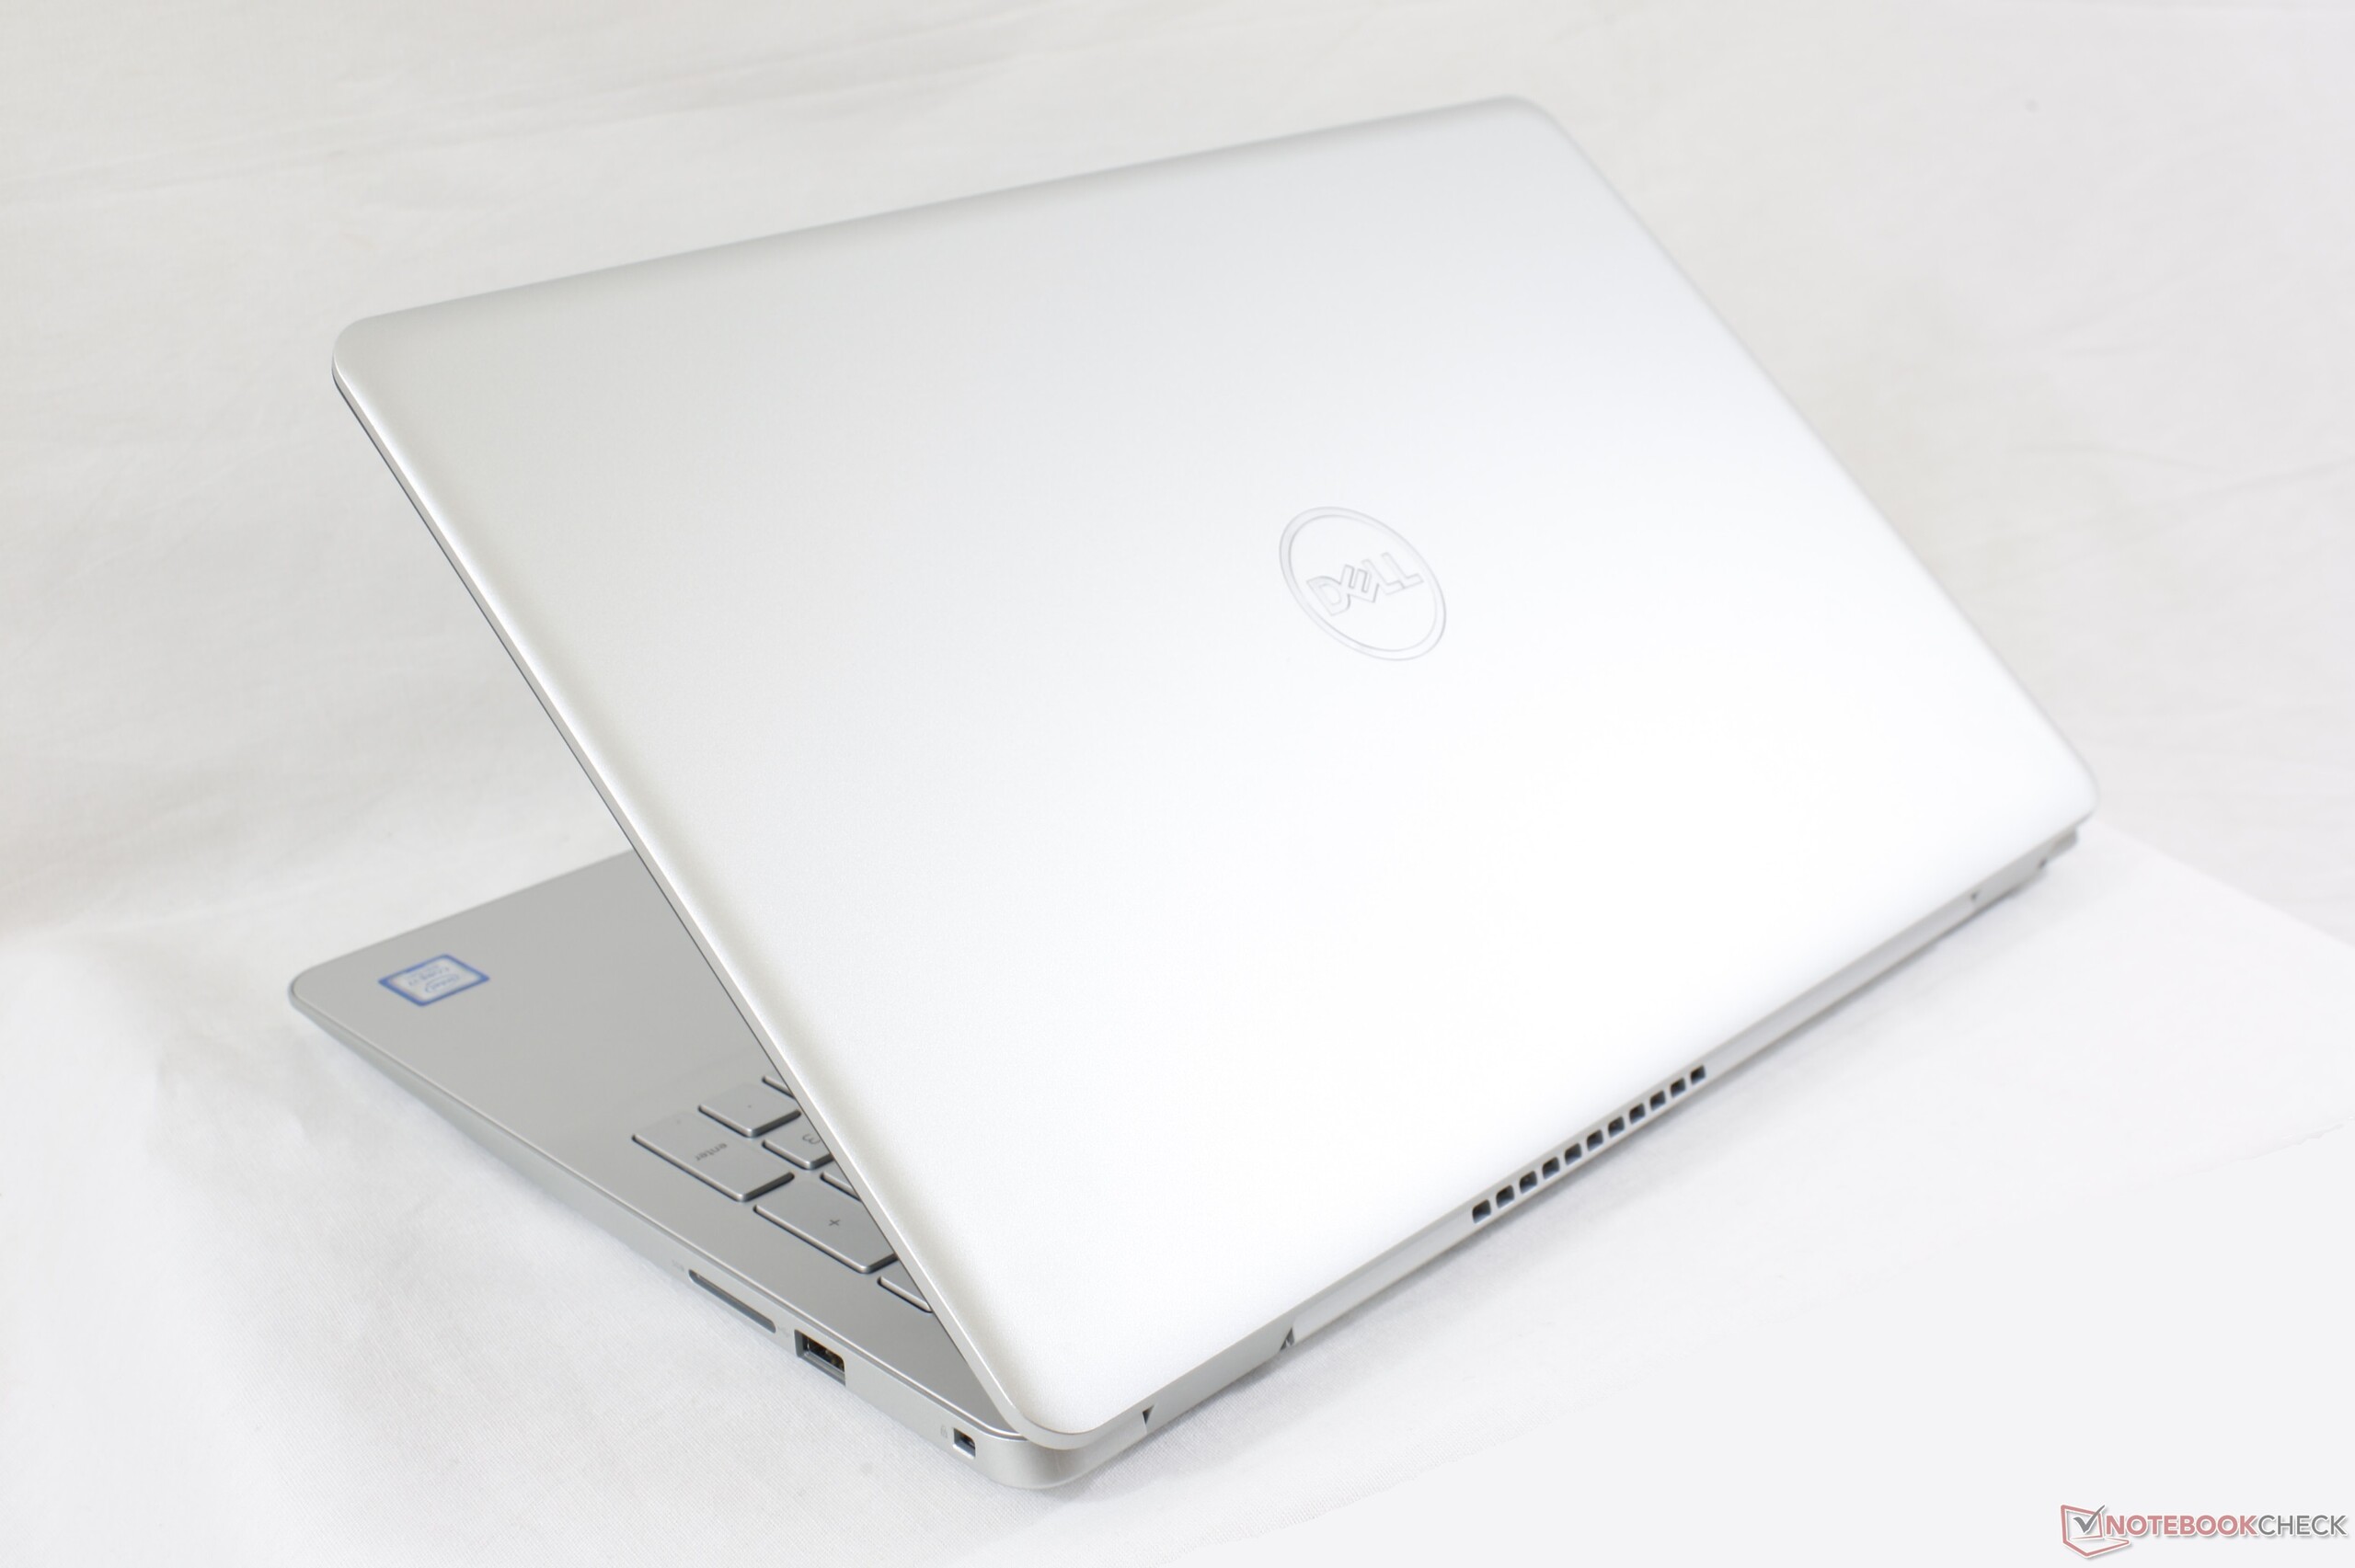
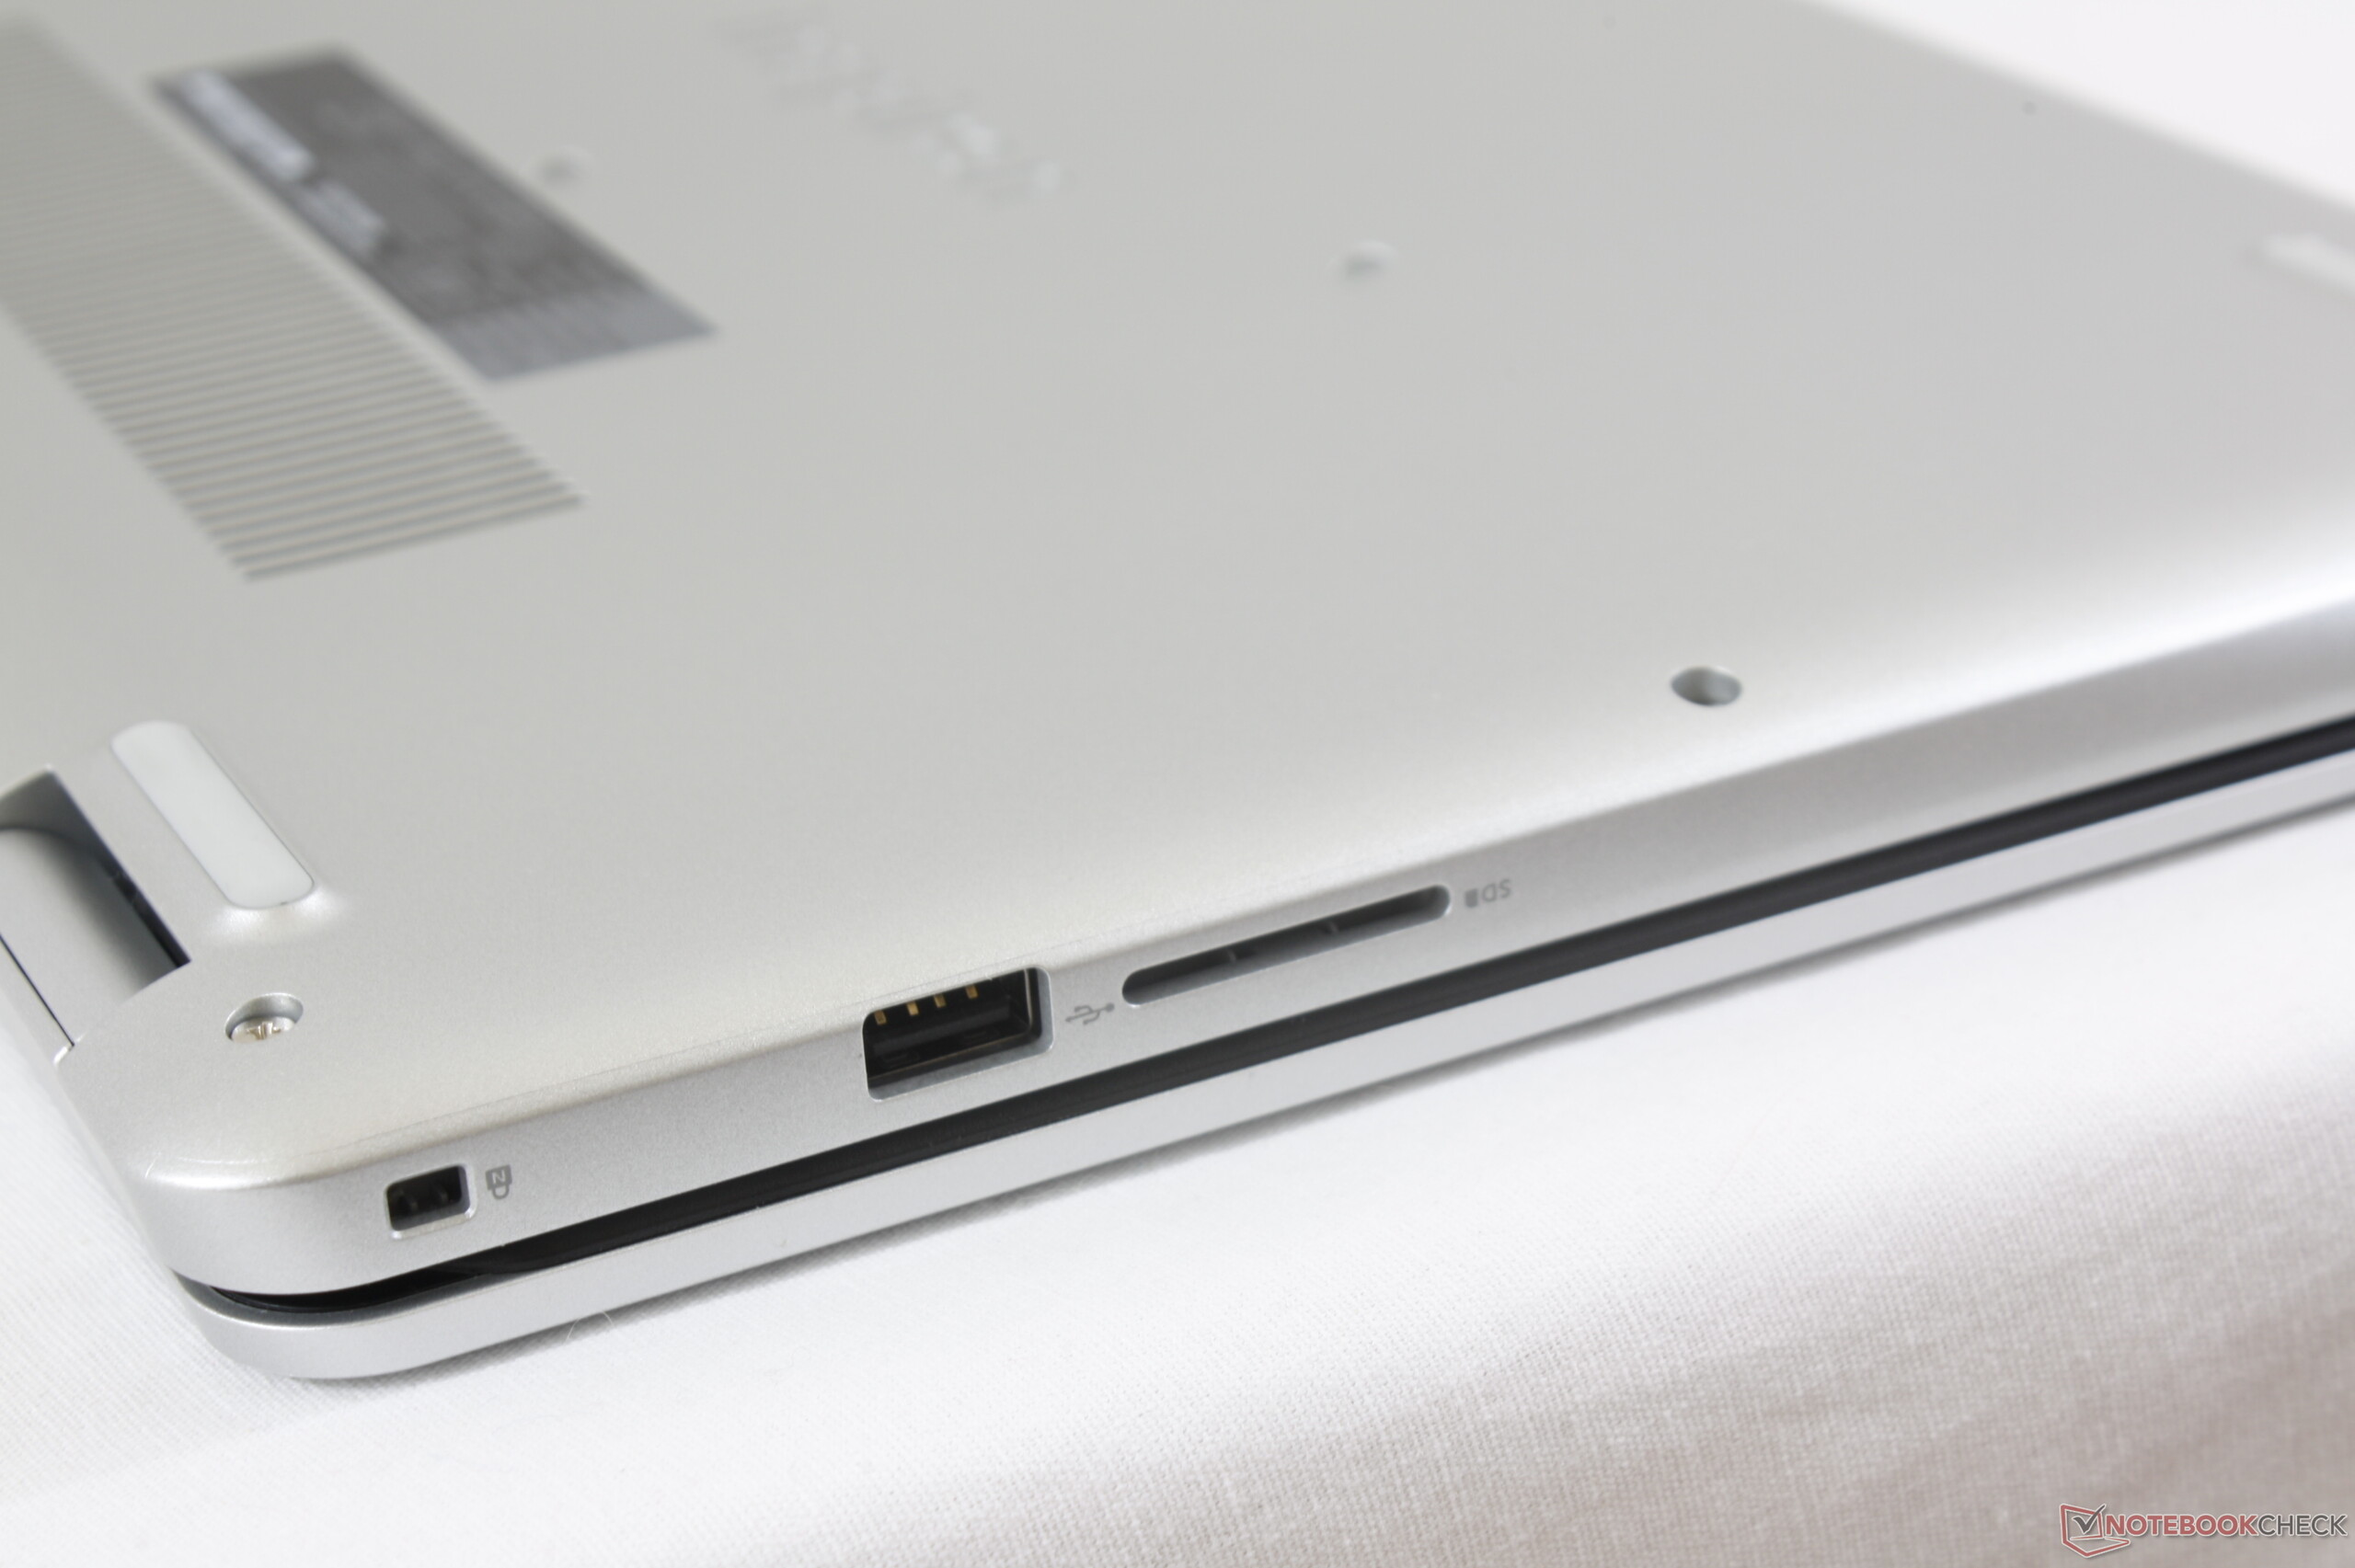
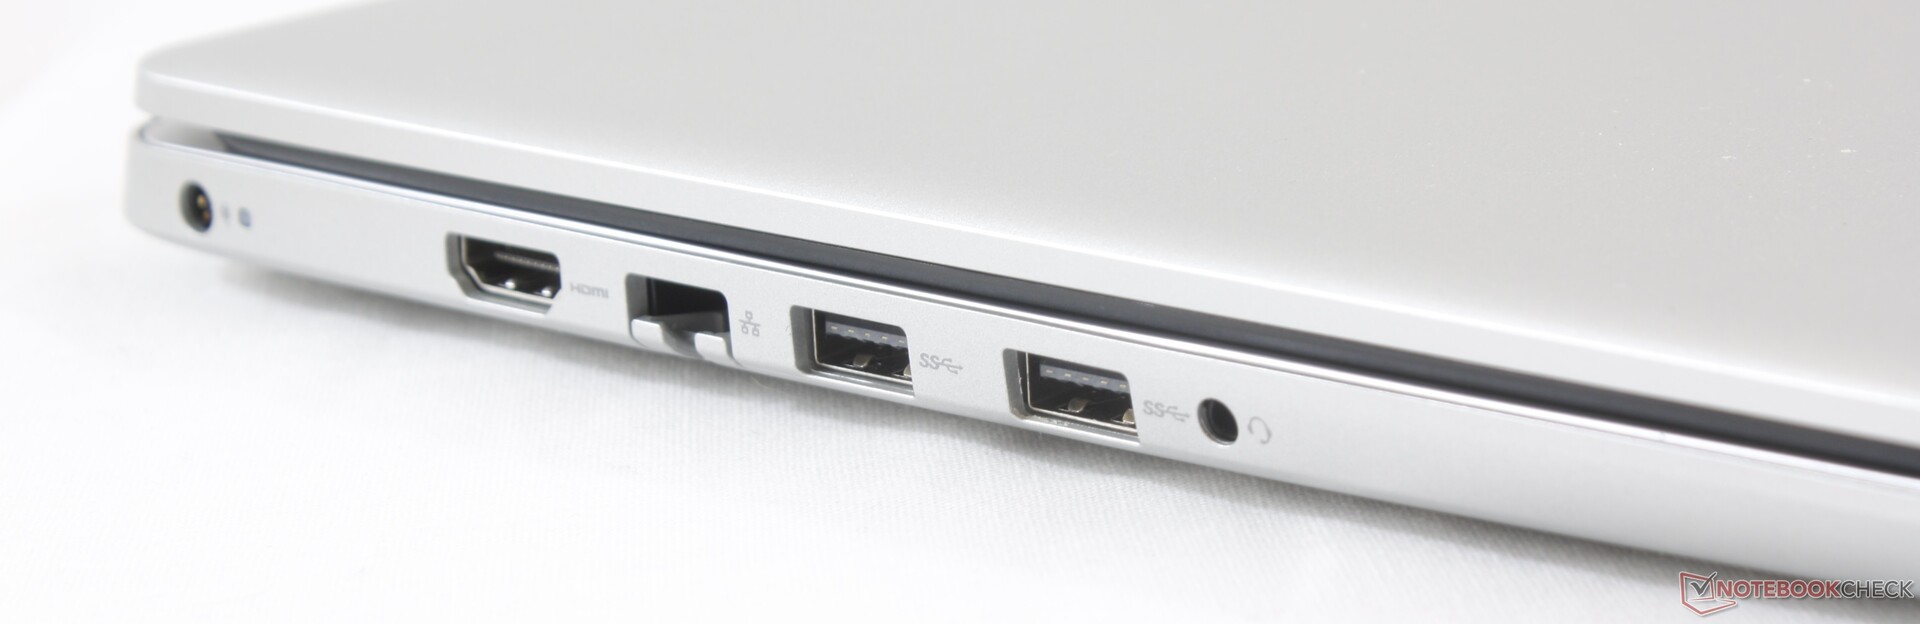
要记住一些缺点。除了可选的USB Type-C端口外,该系统对于旅行者来说是一个糟糕的选择,因为它的显示屏较暗,触控板手感极差,续航时间短,并且比Pavilion 15和Aspire 5的机身更厚。这是更像是一台适合在室内使用的笔记本电脑。与此同时,休闲游戏玩家将不得不寻找其他地方或考虑AMD Ryzen SKU,因为该系统不提供独立的GPU,这与前面提到的HP或Acer型号不同。我们希望未来的版本能够用USB Type-C同时做到传输数据和充电,改善键盘的点击反馈,并增加小键盘和方向键的大小,这也不会影响该系列的诱人价格。
适用于家庭影音娱乐或文字处理的经济实惠的解决方案。我们建议购买Core i5-8265U SKU而不是i7-8565U SKU,因为Core i7的性能优势并不明显。节省的资金可以用在额外的RAM或存储上。
Dell Inspiron 15 5000 5584
- 05/25/2019 v6 (old)
Allen Ngo
Price comparison

