宏碁蜂鸟5 SF515-51T(i7-8565U, SSD, FHD)笔记本电脑评测
| Networking | |
| iperf3 transmit AX12 | |
| Acer Swift 5 SF515-51T-76B6 | |
| Asus ZenBook 14 UX433FA | |
| LG Gram 15Z980-B.AA78B | |
| Lenovo ThinkPad X1 Carbon G6-20KG0025UK | |
| iperf3 receive AX12 | |
| Acer Swift 5 SF515-51T-76B6 | |
| Asus ZenBook 14 UX433FA | |
| LG Gram 15Z980-B.AA78B | |
| Lenovo ThinkPad X1 Carbon G6-20KG0025UK | |
| |||||||||||||||||||||||||
Brightness Distribution: 87 %
Center on Battery: 336 cd/m²
Contrast: 1100:1 (Black: 0.31 cd/m²)
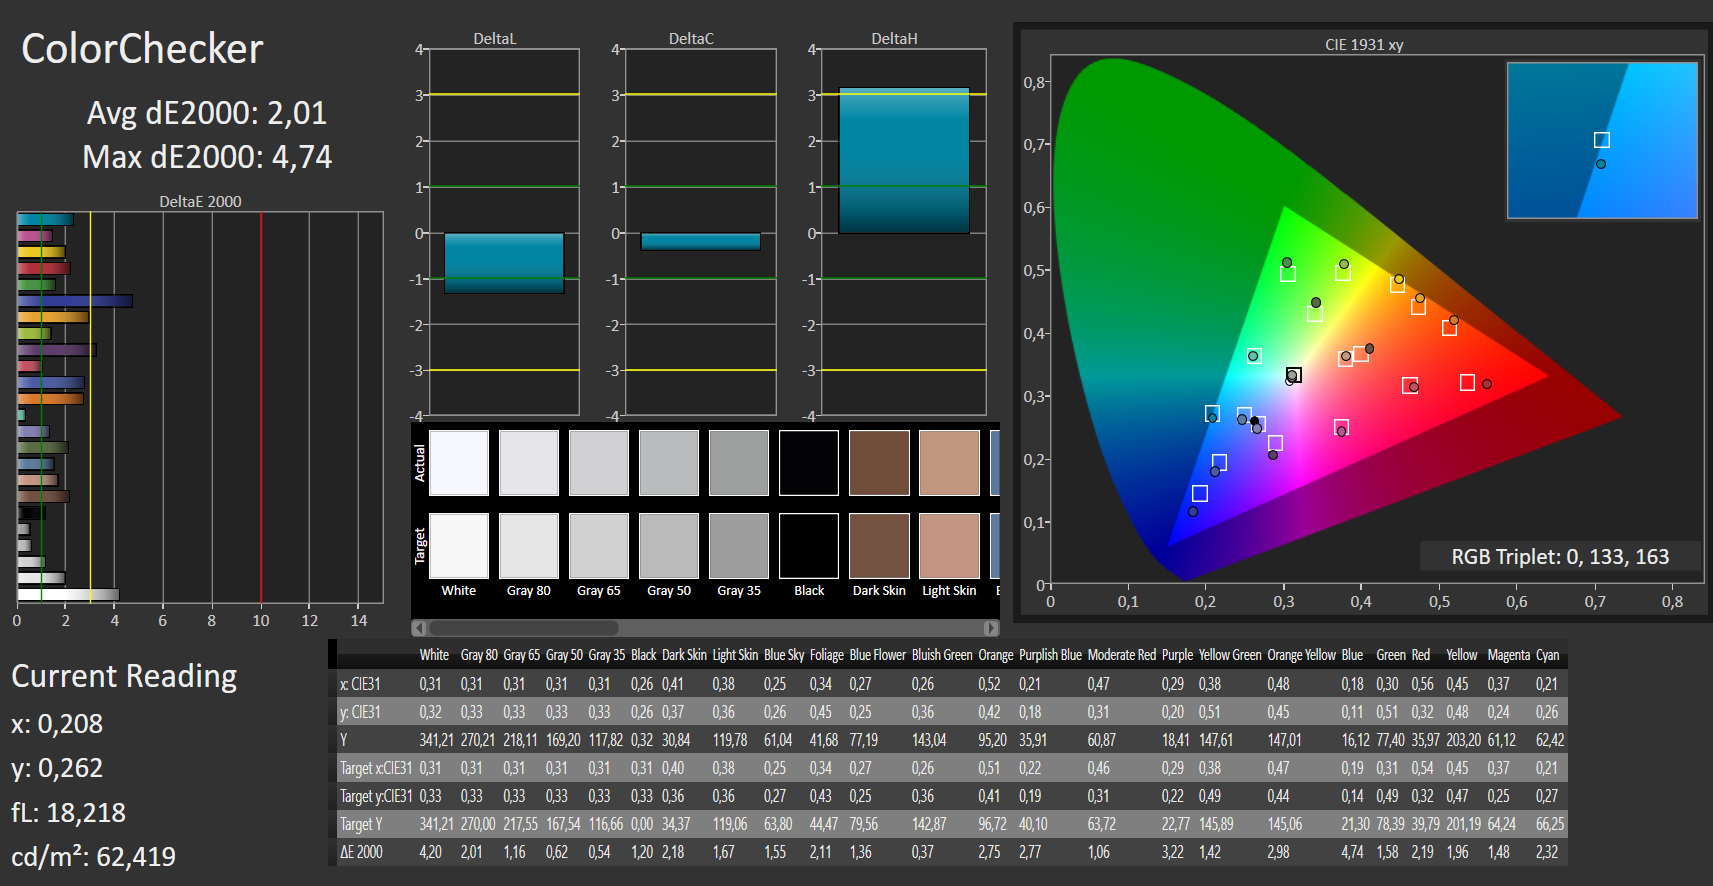
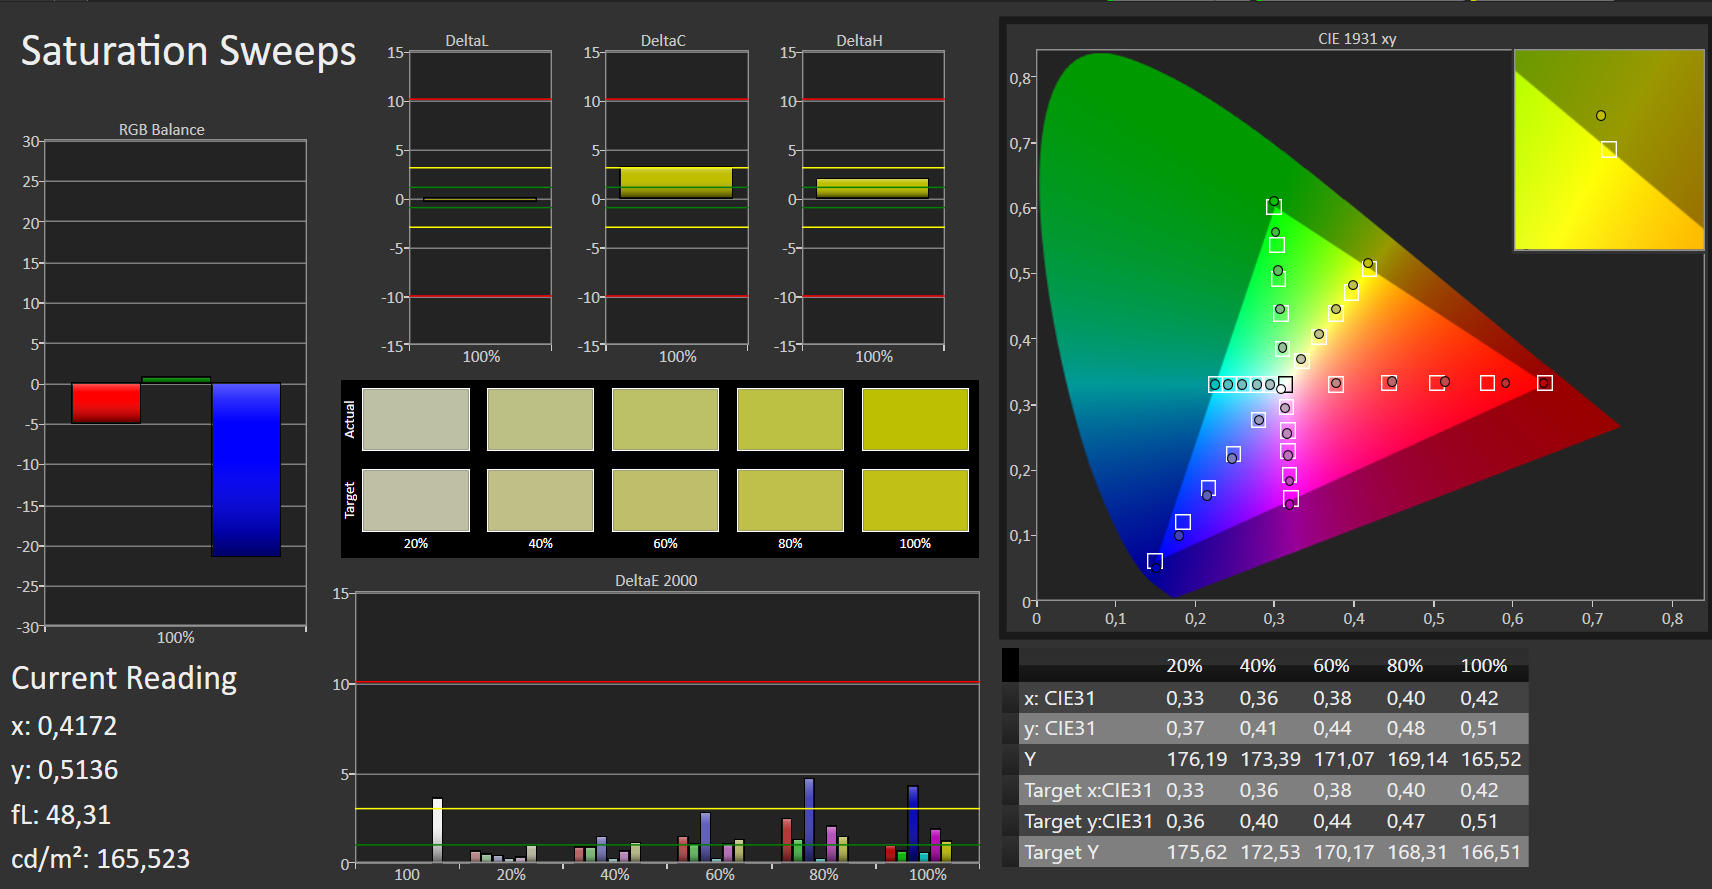
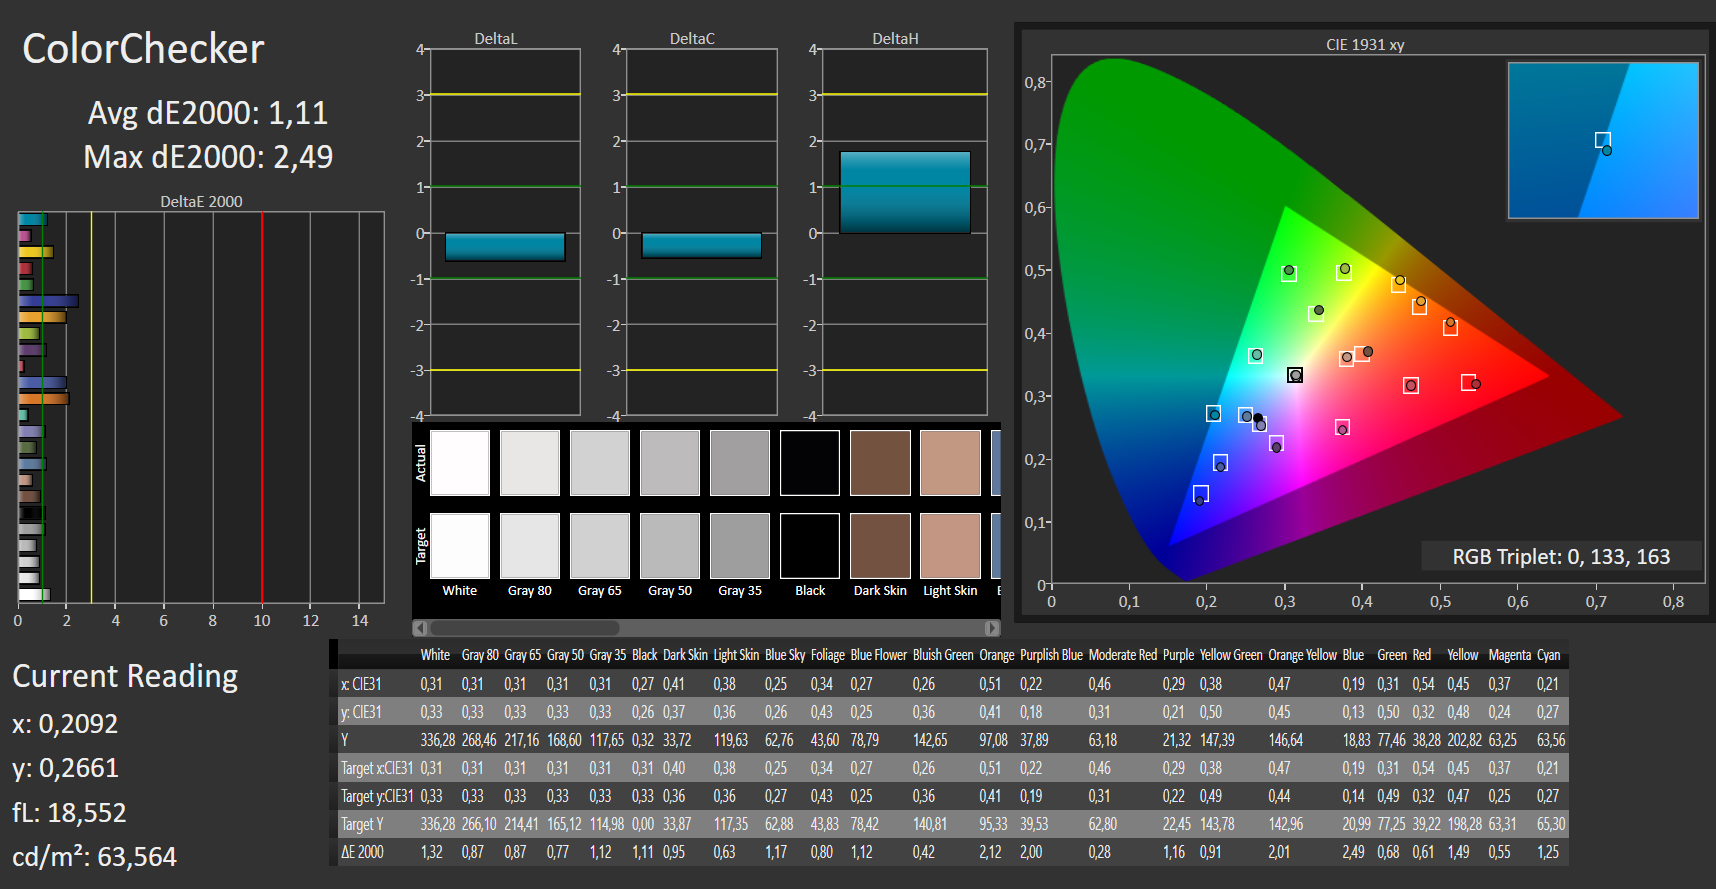
ΔE ColorChecker Calman: 2.01 | ∀{0.5-29.43 Ø4.73}
calibrated: 1.11
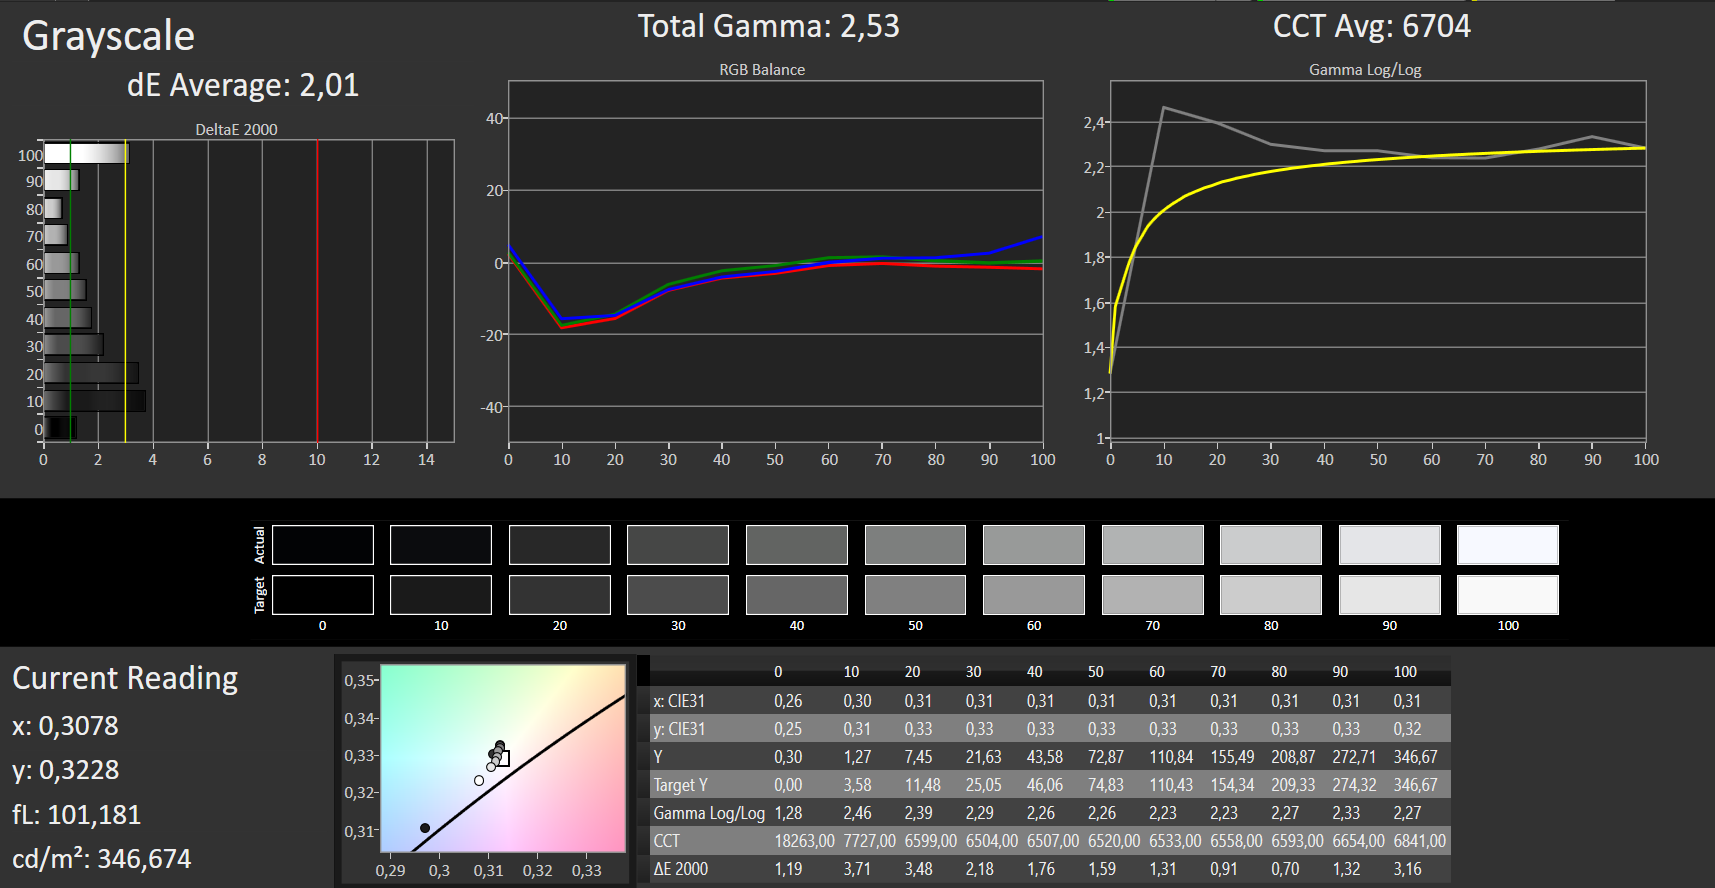
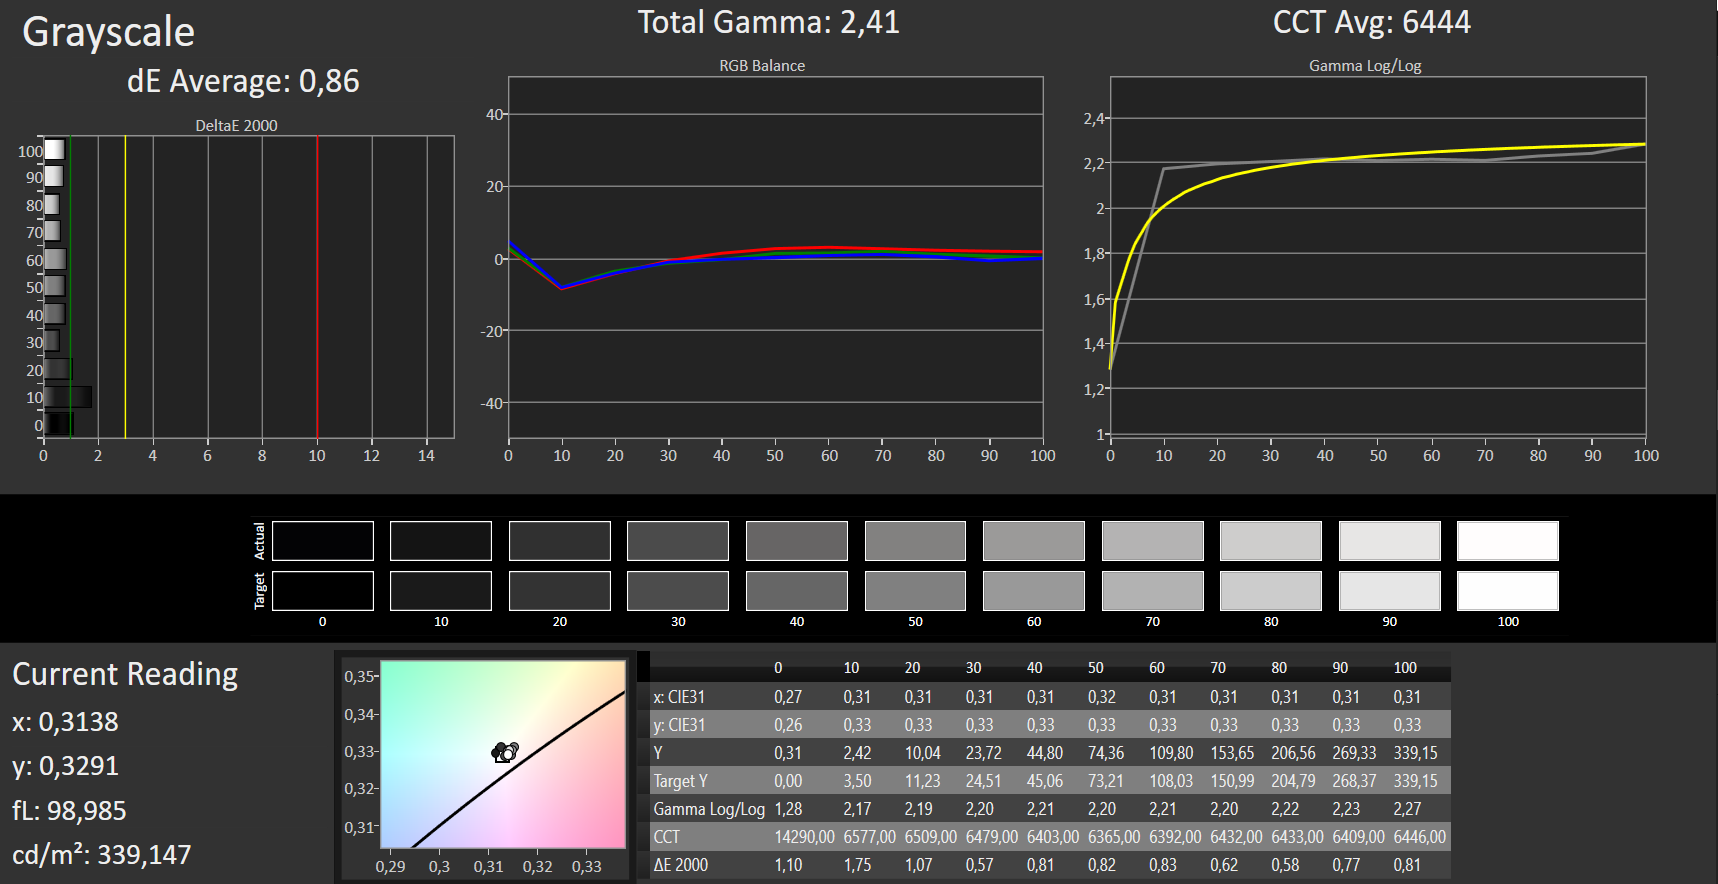
ΔE Greyscale Calman: 2.01 | ∀{0.09-98 Ø4.97}
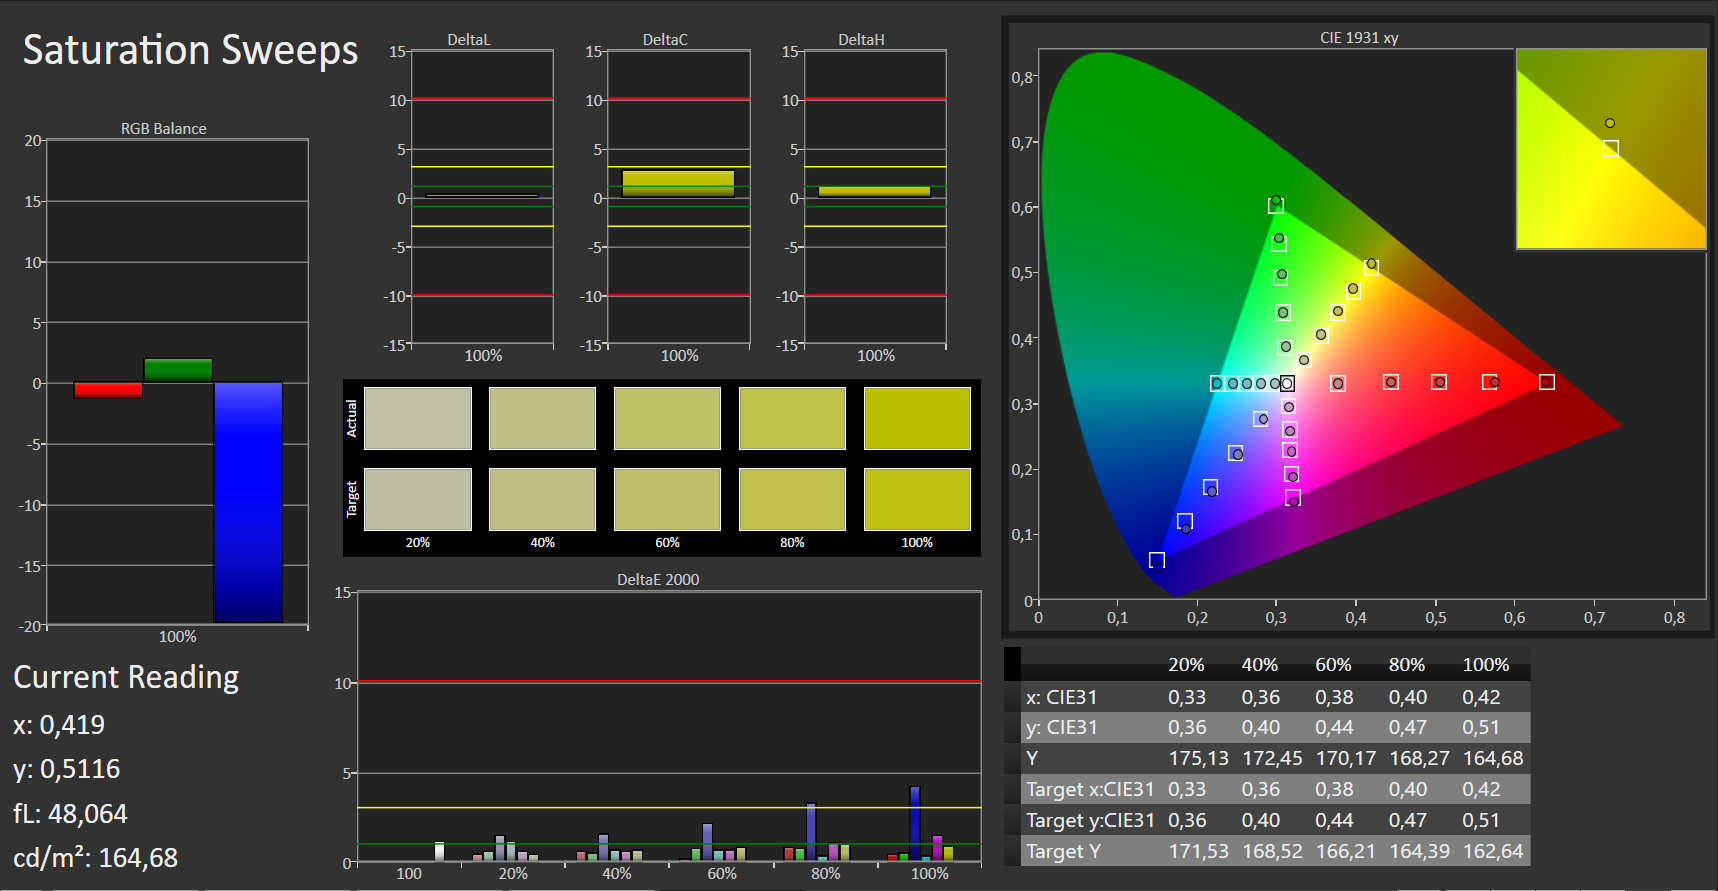
98% sRGB (Argyll 1.6.3 3D)
63% AdobeRGB 1998 (Argyll 1.6.3 3D)
67.8% AdobeRGB 1998 (Argyll 3D)
98% sRGB (Argyll 3D)
66.8% Display P3 (Argyll 3D)
Gamma: 2.52
CCT: 6704 K
| Acer Swift 5 SF515-51T-76B6 IPS, 1920x1080, 15.6" | Lenovo ThinkPad X1 Carbon G6-20KG0025UK IPS, 1920x1080, 14" | Asus ZenBook 14 UX433FA IPS, 1920x1080, 14" | LG Gram 15Z980-B.AA78B IPS LED, 1920x1080, 15.6" | |
|---|---|---|---|---|
| Display | 0% | -5% | -2% | |
| Display P3 Coverage (%) | 66.8 | 68.3 2% | 64.3 -4% | 65.3 -2% |
| sRGB Coverage (%) | 98 | 94.9 -3% | 89.7 -8% | 96.2 -2% |
| AdobeRGB 1998 Coverage (%) | 67.8 | 69.3 2% | 65.1 -4% | 66.3 -2% |
| Response Times | -3% | 0% | 8% | |
| Response Time Grey 50% / Grey 80% * (ms) | 38 ? | 40 ? -5% | 39.6 ? -4% | 34.3 ? 10% |
| Response Time Black / White * (ms) | 25 ? | 25 ? -0% | 24 ? 4% | 23.7 ? 5% |
| PWM Frequency (Hz) | ||||
| Screen | -0% | -80% | -18% | |
| Brightness middle (cd/m²) | 341 | 298 -13% | 332.8 -2% | 349 2% |
| Brightness (cd/m²) | 319 | 287 -10% | 310 -3% | 331 4% |
| Brightness Distribution (%) | 87 | 91 5% | 87 0% | 84 -3% |
| Black Level * (cd/m²) | 0.31 | 0.2 35% | 0.29 6% | 0.32 -3% |
| Contrast (:1) | 1100 | 1490 35% | 1148 4% | 1091 -1% |
| Colorchecker dE 2000 * | 2.01 | 2.19 -9% | 5.14 -156% | 3.1 -54% |
| Colorchecker dE 2000 max. * | 4.74 | 4.39 7% | 11.88 -151% | 6.6 -39% |
| Colorchecker dE 2000 calibrated * | 1.11 | 1.67 -50% | 3.61 -225% | 1.5 -35% |
| Greyscale dE 2000 * | 2.01 | 1.97 2% | 8.8 -338% | 3.3 -64% |
| Gamma | 2.52 87% | 2.43 91% | 2.33 94% | 2.16 102% |
| CCT | 6704 97% | 6571 99% | 8227 79% | 6973 93% |
| Color Space (Percent of AdobeRGB 1998) (%) | 63 | 62 -2% | 58.1 -8% | 61.46 -2% |
| Color Space (Percent of sRGB) (%) | 98 | 95 -3% | 89.2 -9% | 96.05 -2% |
| Total Average (Program / Settings) | -1% /
-0% | -28% /
-56% | -4% /
-12% |
* ... smaller is better
Screen Flickering / PWM (Pulse-Width Modulation)
| Screen flickering / PWM not detected | 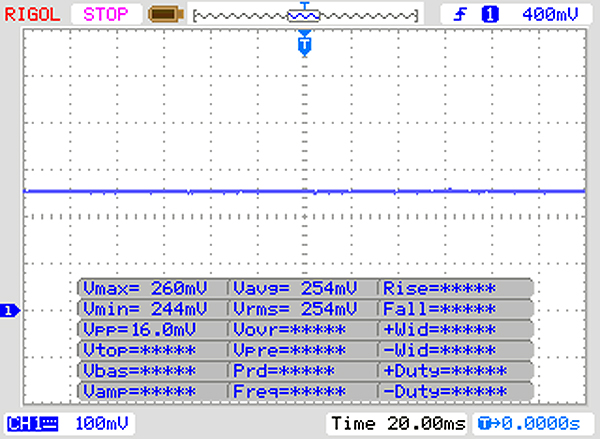 | ||
In comparison: 52 % of all tested devices do not use PWM to dim the display. If PWM was detected, an average of 7784 (minimum: 5 - maximum: 343500) Hz was measured. | |||
Display Response Times
| ↔ Response Time Black to White | ||
|---|---|---|
| 25 ms ... rise ↗ and fall ↘ combined | ↗ 14 ms rise | 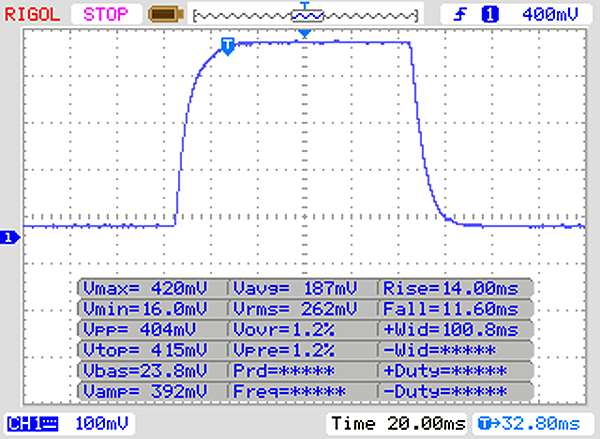 |
| ↘ 11 ms fall | ||
| The screen shows relatively slow response rates in our tests and may be too slow for gamers. In comparison, all tested devices range from 0.1 (minimum) to 240 (maximum) ms. » 59 % of all devices are better. This means that the measured response time is worse than the average of all tested devices (19.9 ms). | ||
| ↔ Response Time 50% Grey to 80% Grey | ||
| 38 ms ... rise ↗ and fall ↘ combined | ↗ 19 ms rise | 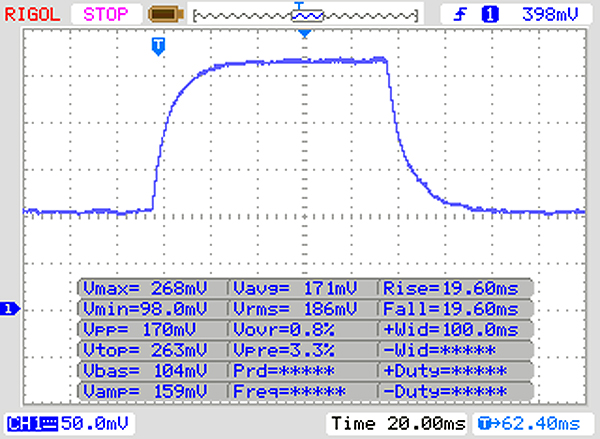 |
| ↘ 19 ms fall | ||
| The screen shows slow response rates in our tests and will be unsatisfactory for gamers. In comparison, all tested devices range from 0.165 (minimum) to 636 (maximum) ms. » 55 % of all devices are better. This means that the measured response time is worse than the average of all tested devices (31.1 ms). | ||
| Cinebench R15 | |
| CPU Single 64Bit | |
| Average of class Subnotebook (72.4 - 322, n=57, last 2 years) | |
| Acer Swift 5 SF515-51T-76B6 | |
| Average Intel Core i7-8565U (138.3 - 193, n=51) | |
| Asus ZenBook 14 UX433FA | |
| LG Gram 15Z980-B.AA78B | |
| Lenovo ThinkPad X1 Carbon G6-20KG0025UK | |
| CPU Multi 64Bit | |
| Average of class Subnotebook (327 - 3345, n=57, last 2 years) | |
| Lenovo ThinkPad X1 Carbon G6-20KG0025UK | |
| Asus ZenBook 14 UX433FA | |
| Average Intel Core i7-8565U (452 - 815, n=52) | |
| Acer Swift 5 SF515-51T-76B6 | |
| LG Gram 15Z980-B.AA78B | |
| Cinebench R10 | |
| Rendering Single 32Bit | |
| Average of class Subnotebook (2299 - 10697, n=13, last 2 years) | |
| Asus ZenBook 14 UX433FA | |
| Average Intel Core i7-8565U (2682 - 8906, n=16) | |
| Acer Swift 5 SF515-51T-76B6 | |
| Rendering Multiple CPUs 32Bit | |
| Average of class Subnotebook (14395 - 51868, n=13, last 2 years) | |
| Asus ZenBook 14 UX433FA | |
| Average Intel Core i7-8565U (13806 - 23118, n=16) | |
| Acer Swift 5 SF515-51T-76B6 | |
| Geekbench 3 | |
| 32 Bit Multi-Core Score | |
| Average of class Subnotebook (n=1last 2 years) | |
| Average Intel Core i7-8565U (10521 - 13703, n=12) | |
| Acer Swift 5 SF515-51T-76B6 | |
| 32 Bit Single-Core Score | |
| Average of class Subnotebook (n=1last 2 years) | |
| Acer Swift 5 SF515-51T-76B6 | |
| Average Intel Core i7-8565U (3340 - 4820, n=12) | |
| Geekbench 4.0 | |
| 64 Bit Multi-Core Score | |
| Average of class Subnotebook (n=1last 2 years) | |
| Average Intel Core i7-8565U (11576 - 14655, n=4) | |
| Acer Swift 5 SF515-51T-76B6 | |
| 64 Bit Single-Core Score | |
| Average of class Subnotebook (n=1last 2 years) | |
| Acer Swift 5 SF515-51T-76B6 | |
| Average Intel Core i7-8565U (4701 - 4791, n=3) | |
| Mozilla Kraken 1.1 - Total | |
| Average Intel Core i7-8565U (730 - 2622, n=43) | |
| Acer Swift 5 SF515-51T-76B6 (Edge 44) | |
| Asus ZenBook 14 UX433FA (Edge 42.17134.1.0) | |
| Average of class Subnotebook (234 - 1104, n=61, last 2 years) | |
| Octane V2 - Total Score | |
| Average of class Subnotebook (35801 - 142020, n=29, last 2 years) | |
| Asus ZenBook 14 UX433FA (Edge 42.17134.1.0) | |
| Acer Swift 5 SF515-51T-76B6 (Edge 44) | |
| Average Intel Core i7-8565U (13935 - 49795, n=42) | |
| JetStream 1.1 - 1.1 Total | |
| Average of class Subnotebook (215 - 476, n=2, last 2 years) | |
| Acer Swift 5 SF515-51T-76B6 (Edge 44) | |
| Asus ZenBook 14 UX433FA (Edge 42.17134.1.0) | |
| Average Intel Core i7-8565U (107.6 - 277, n=37) | |
* ... smaller is better
| PCMark 7 Score | 6240 points | |
| PCMark 8 Home Score Accelerated v2 | 4093 points | |
| PCMark 8 Creative Score Accelerated v2 | 5013 points | |
| PCMark 8 Work Score Accelerated v2 | 5181 points | |
| PCMark 10 Score | 4006 points | |
Help | ||
| PCMark 8 | |
| Home Score Accelerated v2 | |
| Acer Swift 5 SF515-51T-76B6 | |
| Lenovo ThinkPad X1 Carbon G6-20KG0025UK | |
| Average Intel Core i7-8565U, Intel UHD Graphics 620 (2577 - 4179, n=20) | |
| Asus ZenBook 14 UX433FA | |
| LG Gram 15Z980-B.AA78B | |
| Average of class Subnotebook (1739 - 1828, n=2, last 2 years) | |
| Work Score Accelerated v2 | |
| Acer Swift 5 SF515-51T-76B6 | |
| Asus ZenBook 14 UX433FA | |
| Average Intel Core i7-8565U, Intel UHD Graphics 620 (3596 - 5189, n=19) | |
| Lenovo ThinkPad X1 Carbon G6-20KG0025UK | |
| LG Gram 15Z980-B.AA78B | |
| Average of class Subnotebook (1609 - 1656, n=2, last 2 years) | |

| Acer Swift 5 SF515-51T-76B6 SK Hynix BC501 HFM512GDJTNG | Lenovo ThinkPad X1 Carbon G6-20KG0025UK Lenovo LENSE20256GMSP34MEAT2TA | LG Gram 15Z980-B.AA78B SK Hynix Canvas SC300 512GB M.2 (HFS512G39TNF) | Average SK Hynix BC501 HFM512GDJTNG | |
|---|---|---|---|---|
| CrystalDiskMark 3.0 | -20% | -51% | -16% | |
| Write 4k QD32 (MB/s) | 490.1 | 184.7 -62% | 224.2 -54% | 330 ? -33% |
| Read 4k QD32 (MB/s) | 571 | 306.1 -46% | 251.5 -56% | 353 ? -38% |
| Write 4k (MB/s) | 149.1 | 94.1 -37% | 71.1 -52% | 116.2 ? -22% |
| Read 4k (MB/s) | 48.68 | 34.87 -28% | 23.6 -52% | 43.6 ? -10% |
| Write 512 (MB/s) | 678 | 243.3 -64% | 413.8 -39% | 617 ? -9% |
| Read 512 (MB/s) | 875 | 1227 40% | 367 -58% | 824 ? -6% |
| Write Seq (MB/s) | 763 | 479 -37% | 446.7 -41% | 745 ? -2% |
| Read Seq (MB/s) | 1089 | 1880 73% | 488.2 -55% | 1011 ? -7% |
| 3DMark 06 Standard Score | 12132 points | |
| 3DMark 11 Performance | 2087 points | |
| 3DMark Cloud Gate Standard Score | 9036 points | |
| 3DMark Fire Strike Score | 1199 points | |
Help | ||
| 3DMark 11 - 1280x720 Performance GPU | |
| Average of class Subnotebook (995 - 18489, n=55, last 2 years) | |
| Asus ZenBook 14 UX433FA | |
| Lenovo ThinkPad X1 Carbon G6-20KG0025UK | |
| Acer Swift 5 SF515-51T-76B6 | |
| Average Intel UHD Graphics 620 (1144 - 3432, n=244) | |
| 3DMark | |
| 1280x720 Cloud Gate Standard Graphics | |
| Average of class Subnotebook (5577 - 61591, n=28, last 2 years) | |
| Asus ZenBook 14 UX433FA | |
| Acer Swift 5 SF515-51T-76B6 | |
| Lenovo ThinkPad X1 Carbon G6-20KG0025UK | |
| LG Gram 15Z980-B.AA78B | |
| Average Intel UHD Graphics 620 (6205 - 16400, n=225) | |
| 1920x1080 Fire Strike Graphics | |
| Average of class Subnotebook (832 - 16347, n=56, last 2 years) | |
| Acer Swift 5 SF515-51T-76B6 | |
| LG Gram 15Z980-B.AA78B | |
| Lenovo ThinkPad X1 Carbon G6-20KG0025UK | |
| Average Intel UHD Graphics 620 (557 - 2608, n=213) | |
| 2560x1440 Time Spy Graphics | |
| Average of class Subnotebook (804 - 6288, n=55, last 2 years) | |
| Asus ZenBook 14 UX433FA | |
| Average Intel UHD Graphics 620 (299 - 797, n=88) | |
| LG Gram 15Z980-B.AA78B | |
| low | med. | high | ultra | |
|---|---|---|---|---|
| Tomb Raider (2013) | 103.7 | 51.8 | 34.4 | 15.2 |
| BioShock Infinite (2013) | 76.5 | 39.9 | 33.5 | 9.4 |
| The Witcher 3 (2015) | 16.9 | 10.9 | 6.1 | 3.1 |
Noise level
| Idle |
| 30.5 / 30.5 / 30.9 dB(A) |
| Load |
| 34.9 / 35 dB(A) |
 | ||
30 dB silent 40 dB(A) audible 50 dB(A) loud |
||
min: | ||
| Acer Swift 5 SF515-51T-76B6 i7-8565U, UHD Graphics 620 | Lenovo ThinkPad X1 Carbon G6-20KG0025UK i5-8350U, UHD Graphics 620 | Asus ZenBook 14 UX433FA i7-8565U, UHD Graphics 620 | LG Gram 15Z980-B.AA78B i5-8550U, UHD Graphics 620 | Average Intel UHD Graphics 620 | Average of class Subnotebook | |
|---|---|---|---|---|---|---|
| Noise | 4% | 1% | 1% | 3% | 10% | |
| off / environment * (dB) | 30.5 | 30.25 1% | 28.8 6% | 29.7 3% | 29 ? 5% | 24.2 ? 21% |
| Idle Minimum * (dB) | 30.5 | 30.25 1% | 28.8 6% | 30.3 1% | 29.1 ? 5% | 24.3 ? 20% |
| Idle Average * (dB) | 30.5 | 30.25 1% | 28.8 6% | 30.3 1% | 29.1 ? 5% | 24.4 ? 20% |
| Idle Maximum * (dB) | 30.9 | 30.25 2% | 29.1 6% | 31.1 -1% | 29.7 ? 4% | 25 ? 19% |
| Load Average * (dB) | 34.9 | 31.3 10% | 36.1 -3% | 34.9 -0% | 33.5 ? 4% | 34.1 ? 2% |
| Load Maximum * (dB) | 35 | 31.3 11% | 41.2 -18% | 34.9 -0% | 36.1 ? -3% | 42 ? -20% |
* ... smaller is better
(±) The maximum temperature on the upper side is 44.4 °C / 112 F, compared to the average of 35.9 °C / 97 F, ranging from 21.4 to 59 °C for the class Subnotebook.
(-) The bottom heats up to a maximum of 45.7 °C / 114 F, compared to the average of 39.2 °C / 103 F
(+) In idle usage, the average temperature for the upper side is 24.1 °C / 75 F, compared to the device average of 30.8 °C / 87 F.
(±) The palmrests and touchpad can get very hot to the touch with a maximum of 38.9 °C / 102 F.
(-) The average temperature of the palmrest area of similar devices was 28.2 °C / 82.8 F (-10.7 °C / -19.2 F).
| Acer Swift 5 SF515-51T-76B6 i7-8565U, UHD Graphics 620 | Lenovo ThinkPad X1 Carbon G6-20KG0025UK i5-8350U, UHD Graphics 620 | Asus ZenBook 14 UX433FA i7-8565U, UHD Graphics 620 | LG Gram 15Z980-B.AA78B i5-8550U, UHD Graphics 620 | Average Intel UHD Graphics 620 | Average of class Subnotebook | |
|---|---|---|---|---|---|---|
| Heat | 0% | -9% | -1% | -1% | -1% | |
| Maximum Upper Side * (°C) | 44.4 | 40.7 8% | 42.4 5% | 43 3% | 41.1 ? 7% | 41.8 ? 6% |
| Maximum Bottom * (°C) | 45.7 | 41.6 9% | 45 2% | 41 10% | 44.3 ? 3% | 43.7 ? 4% |
| Idle Upper Side * (°C) | 25.4 | 28 -10% | 31 -22% | 28 -10% | 26.8 ? -6% | 26.9 ? -6% |
| Idle Bottom * (°C) | 25.8 | 27.4 -6% | 30.8 -19% | 27 -5% | 27.7 ? -7% | 27.5 ? -7% |
* ... smaller is better
Acer Swift 5 SF515-51T-76B6 audio analysis
(-) | not very loud speakers (62.4 dB)
Bass 100 - 315 Hz
(±) | reduced bass - on average 14.5% lower than median
(±) | linearity of bass is average (13.9% delta to prev. frequency)
Mids 400 - 2000 Hz
(±) | higher mids - on average 5.6% higher than median
(±) | linearity of mids is average (7.8% delta to prev. frequency)
Highs 2 - 16 kHz
(+) | balanced highs - only 1.9% away from median
(+) | highs are linear (6.1% delta to prev. frequency)
Overall 100 - 16.000 Hz
(±) | linearity of overall sound is average (23.5% difference to median)
Compared to same class
» 81% of all tested devices in this class were better, 3% similar, 16% worse
» The best had a delta of 5%, average was 18%, worst was 53%
Compared to all devices tested
» 70% of all tested devices were better, 6% similar, 24% worse
» The best had a delta of 4%, average was 24%, worst was 134%
LG Gram 15Z980-B.AA78B audio analysis
(+) | speakers can play relatively loud (82.2 dB)
Bass 100 - 315 Hz
(-) | nearly no bass - on average 24.1% lower than median
(±) | linearity of bass is average (12.3% delta to prev. frequency)
Mids 400 - 2000 Hz
(±) | higher mids - on average 5.4% higher than median
(+) | mids are linear (6.5% delta to prev. frequency)
Highs 2 - 16 kHz
(+) | balanced highs - only 1.1% away from median
(+) | highs are linear (3.7% delta to prev. frequency)
Overall 100 - 16.000 Hz
(±) | linearity of overall sound is average (19.3% difference to median)
Compared to same class
» 59% of all tested devices in this class were better, 7% similar, 34% worse
» The best had a delta of 5%, average was 18%, worst was 53%
Compared to all devices tested
» 47% of all tested devices were better, 8% similar, 46% worse
» The best had a delta of 4%, average was 24%, worst was 134%
| Off / Standby | |
| Idle | |
| Load |
|
Key:
min: | |
| Acer Swift 5 SF515-51T-76B6 i7-8565U, UHD Graphics 620 | Lenovo ThinkPad X1 Carbon G6-20KG0025UK i5-8350U, UHD Graphics 620 | Asus ZenBook 14 UX433FA i7-8565U, UHD Graphics 620 | LG Gram 15Z980-B.AA78B i5-8550U, UHD Graphics 620 | Average Intel UHD Graphics 620 | Average of class Subnotebook | |
|---|---|---|---|---|---|---|
| Power Consumption | 1% | -6% | -13% | -6% | -18% | |
| Idle Minimum * (Watt) | 3 | 4.7 -57% | 3.9 -30% | 3.7 -23% | 3.81 ? -27% | 3.82 ? -27% |
| Idle Average * (Watt) | 7.7 | 7.3 5% | 5.9 23% | 8.5 -10% | 6.94 ? 10% | 6.61 ? 14% |
| Idle Maximum * (Watt) | 11.6 | 9.4 19% | 8.8 24% | 10 14% | 8.75 ? 25% | 7.99 ? 31% |
| Load Average * (Watt) | 34 | 28 18% | 41.7 -23% | 36 -6% | 35 ? -3% | 41.9 ? -23% |
| Load Maximum * (Watt) | 35 | 28.2 19% | 44 -26% | 48.7 -39% | 47.5 ? -36% | 64.1 ? -83% |
* ... smaller is better
| Acer Swift 5 SF515-51T-76B6 i7-8565U, UHD Graphics 620, 53.9 Wh | LG Gram 15Z980-B.AA78B i5-8550U, UHD Graphics 620, 72 Wh | Lenovo ThinkPad X1 Carbon G6-20KG0025UK i5-8350U, UHD Graphics 620, 57 Wh | Asus ZenBook 14 UX433FA i7-8565U, UHD Graphics 620, 50 Wh | Average of class Subnotebook | |
|---|---|---|---|---|---|
| Battery runtime | 103% | 32% | 34% | 67% | |
| Reader / Idle (h) | 16.2 | 24.5 51% | 19.1 18% | 28.6 ? 77% | |
| H.264 (h) | 7.2 | 15.8 119% | 11 53% | 15.6 ? 117% | |
| WiFi v1.3 (h) | 7.2 | 13.4 86% | 10.4 44% | 10.5 46% | 14 ? 94% |
| Load (h) | 2.4 | 1.9 -21% | 3.3 38% | 1.946 ? -19% |
Pros
Cons
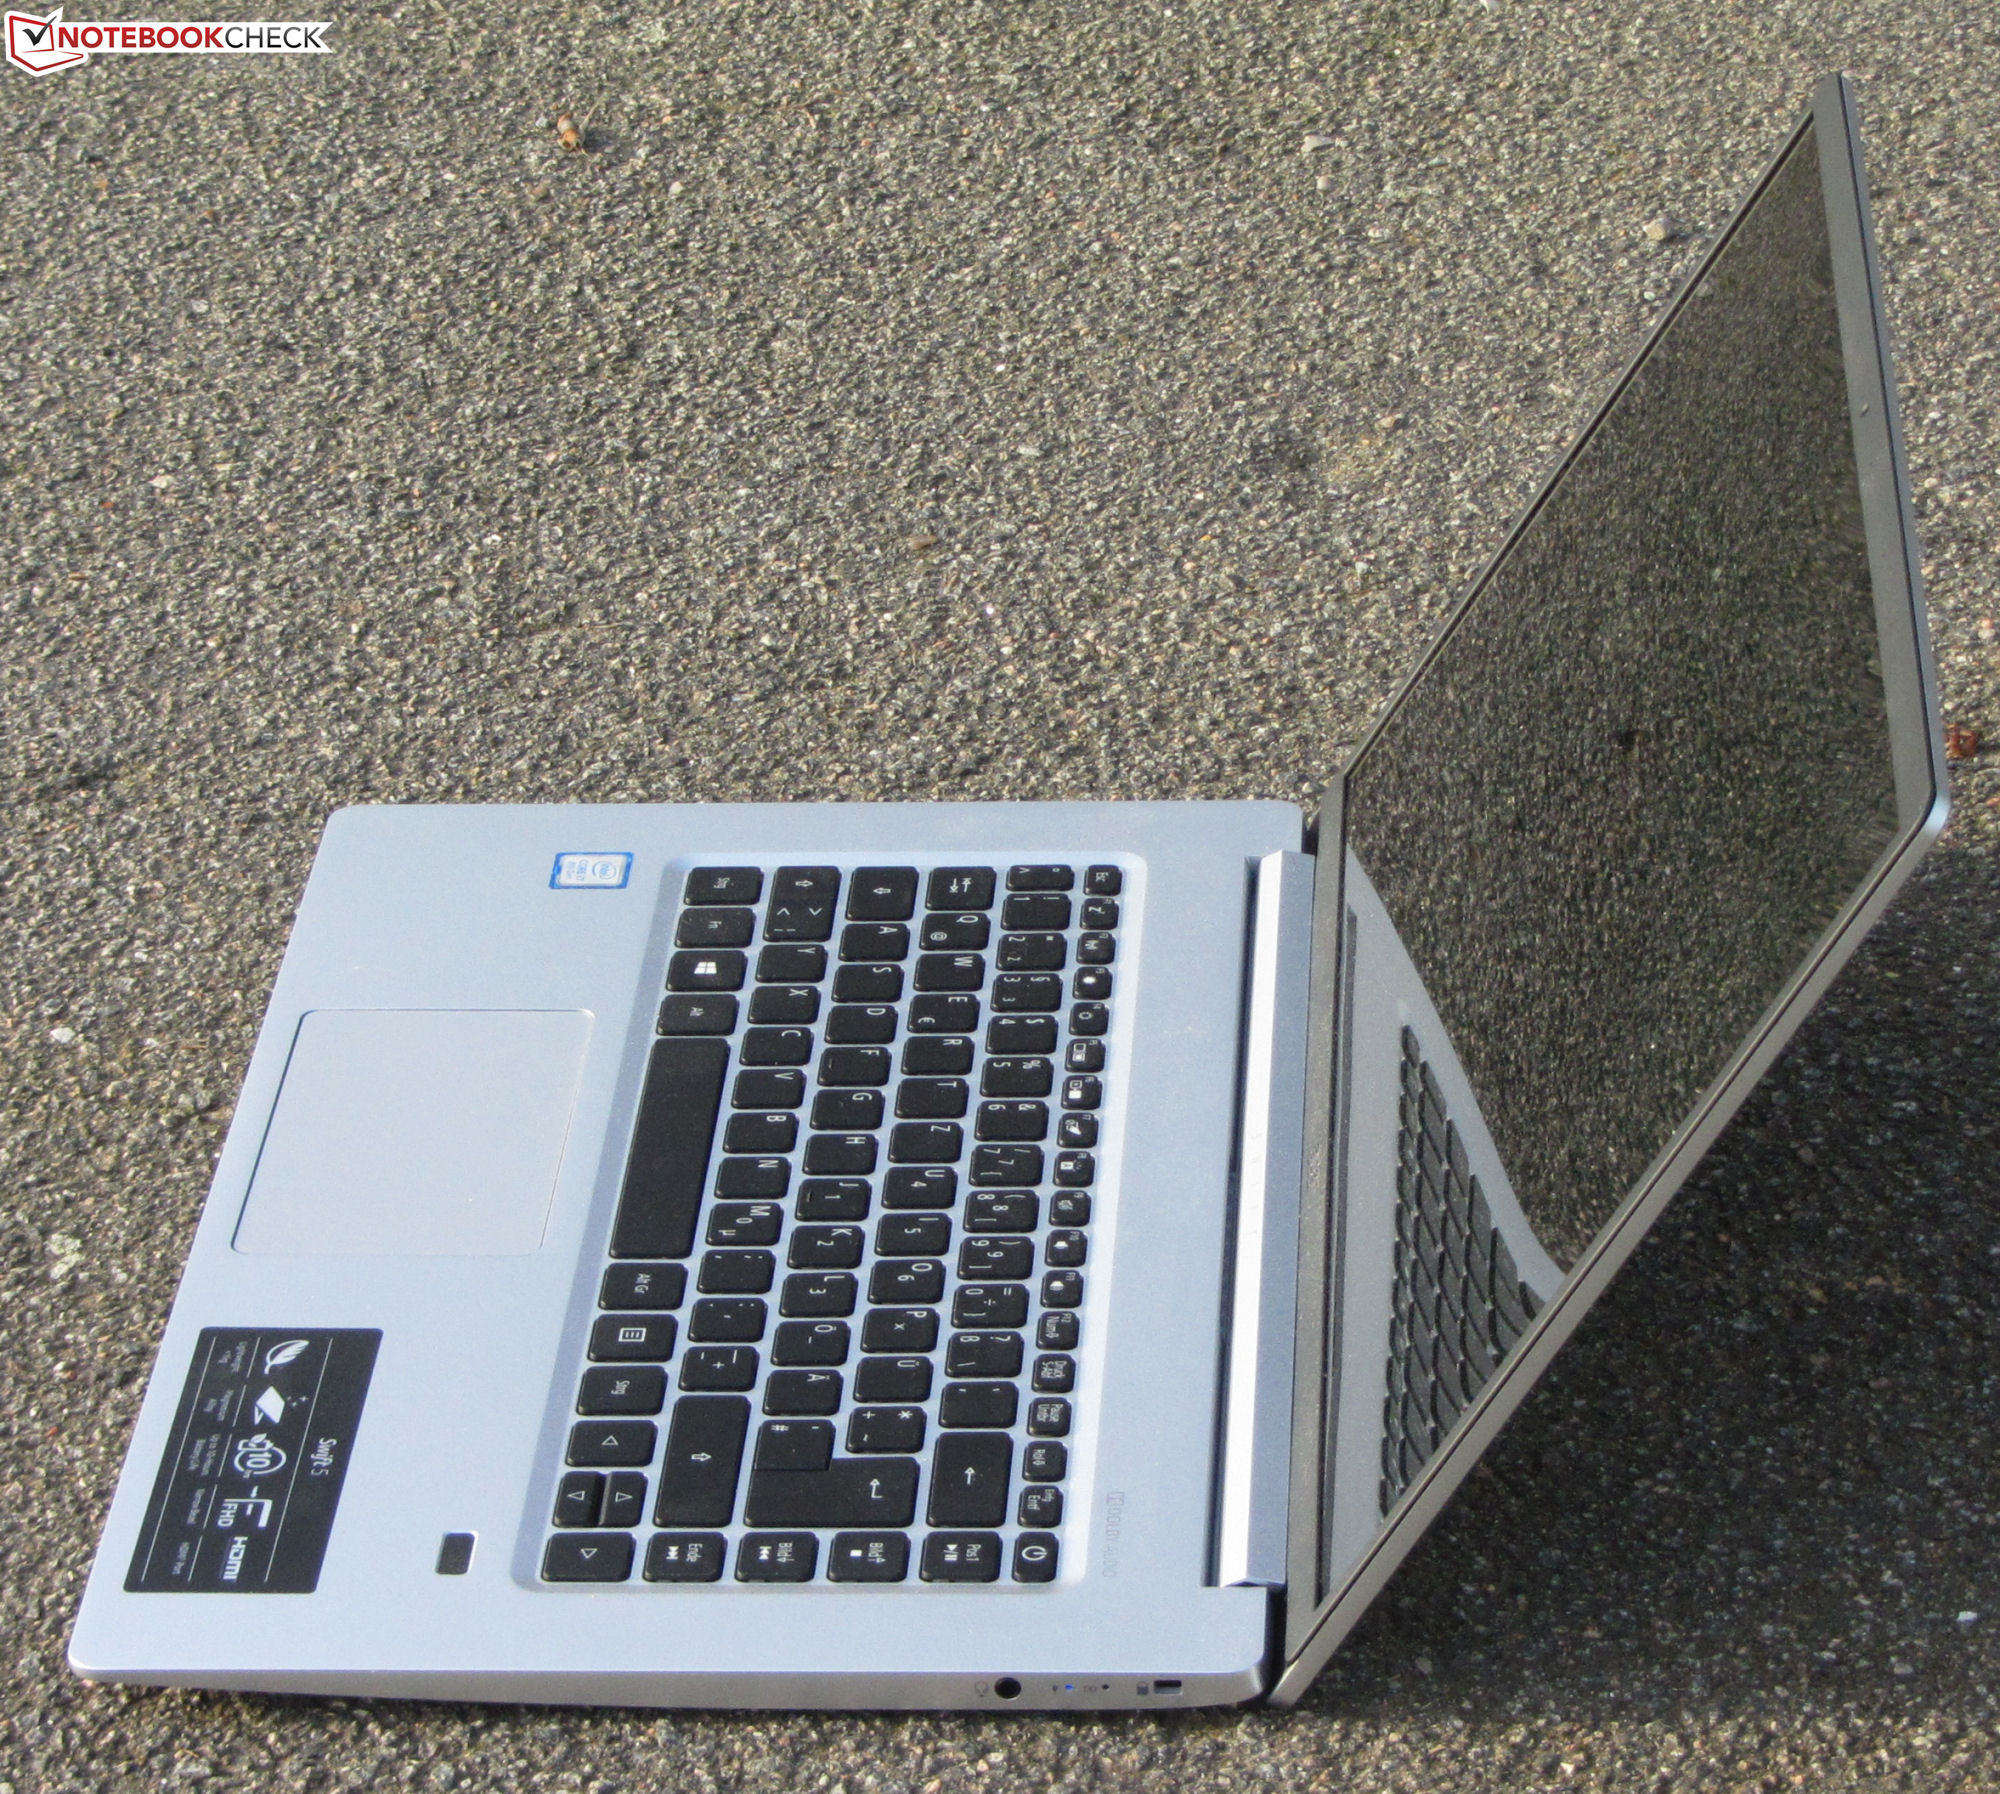
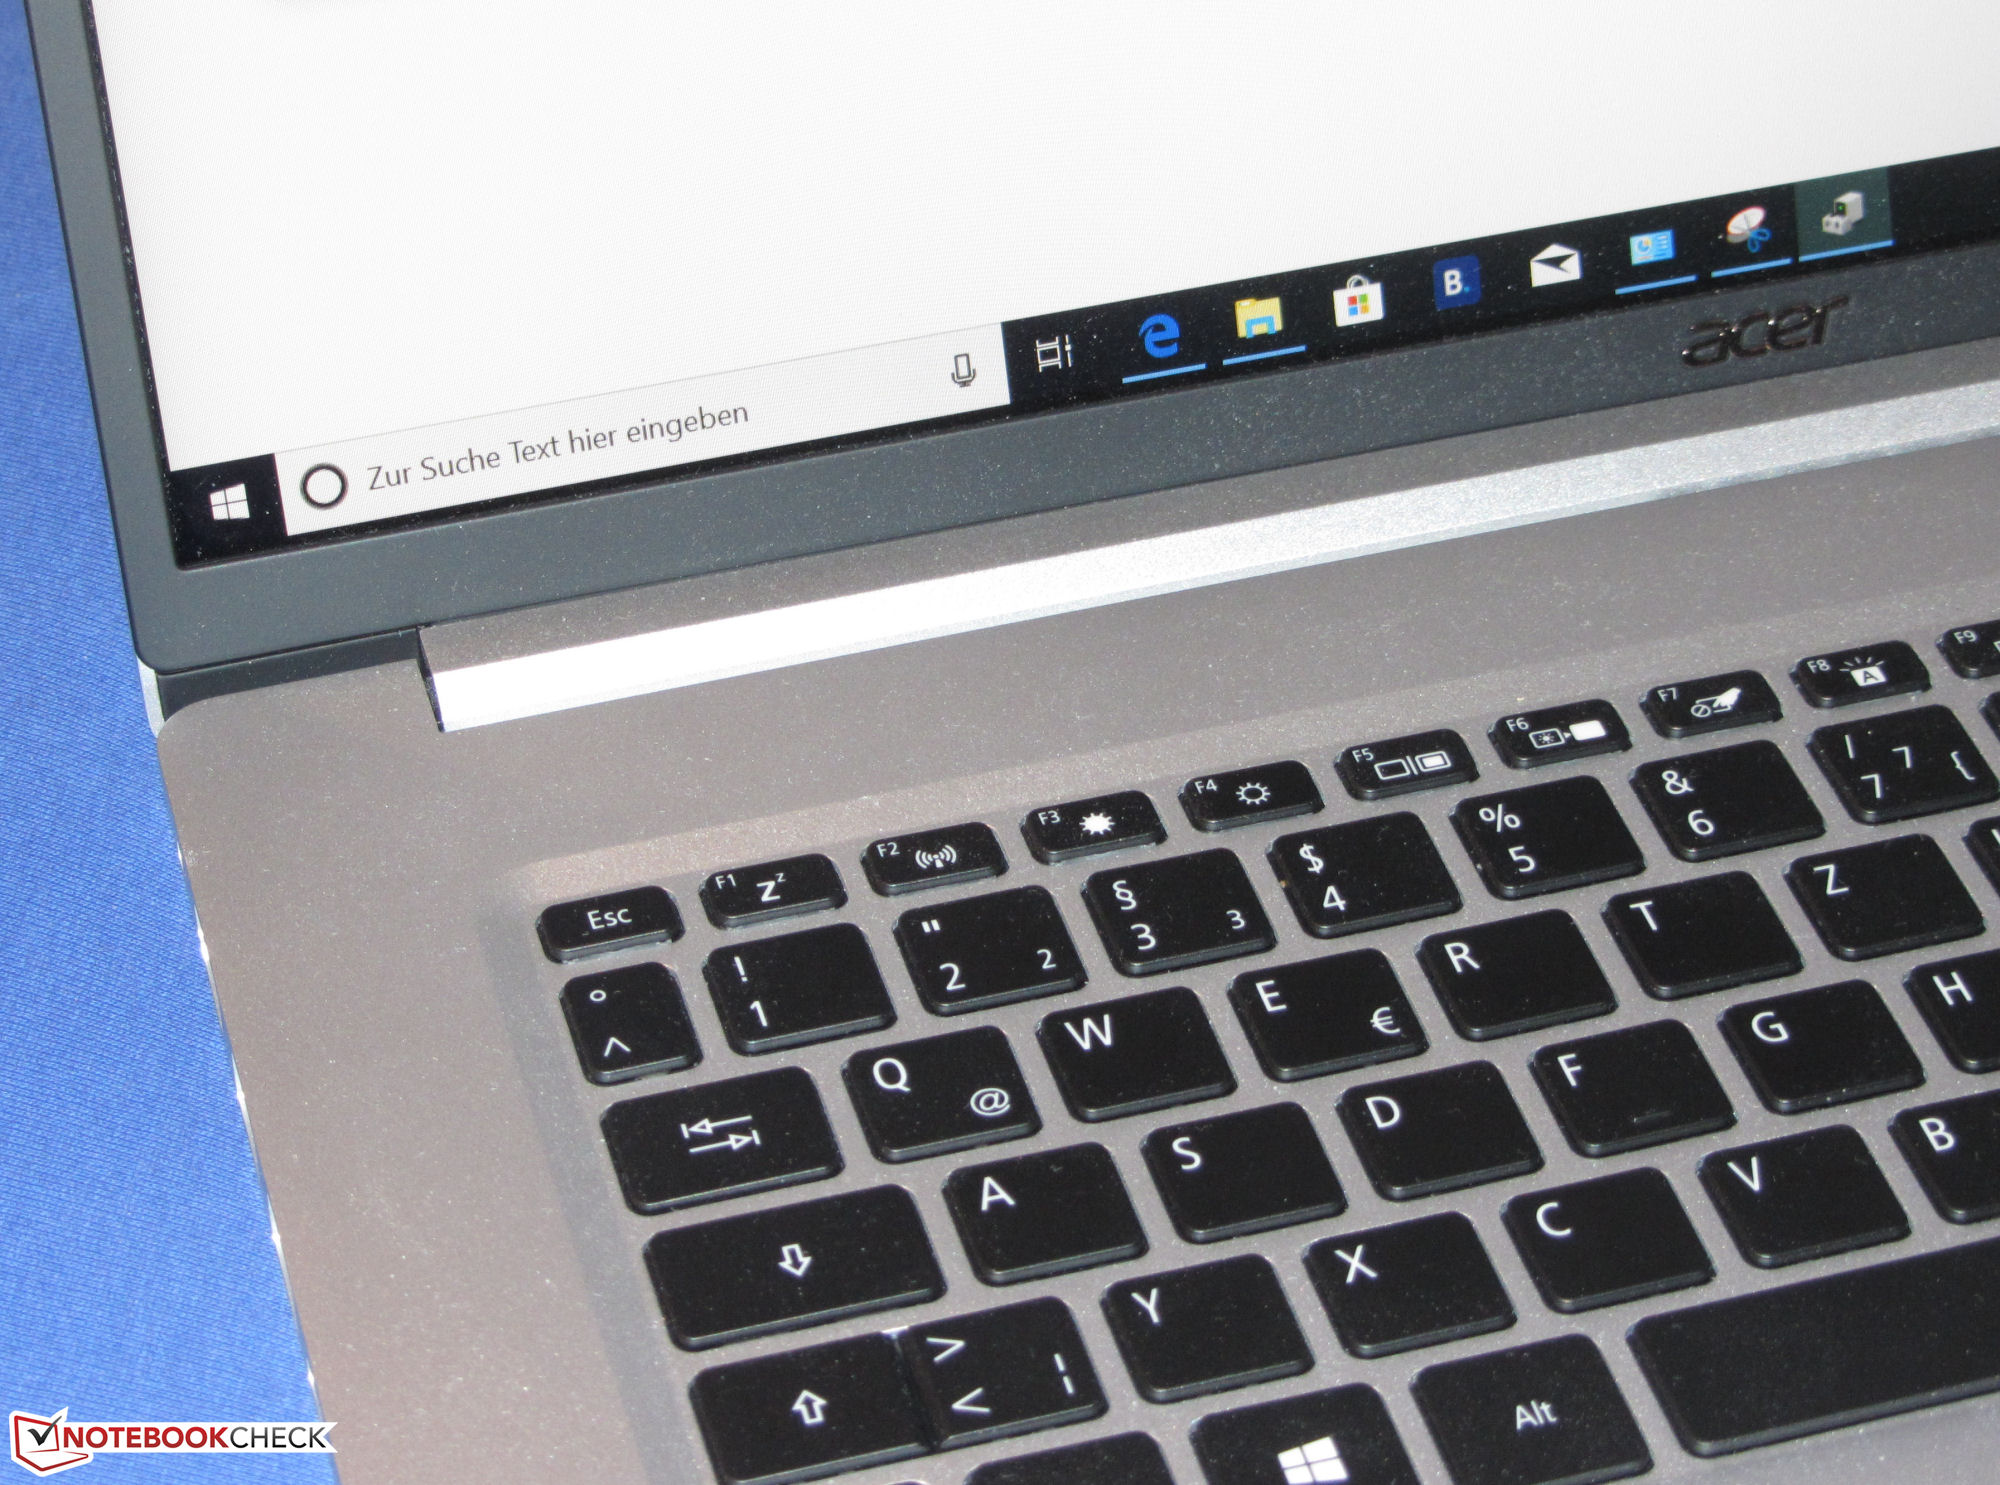
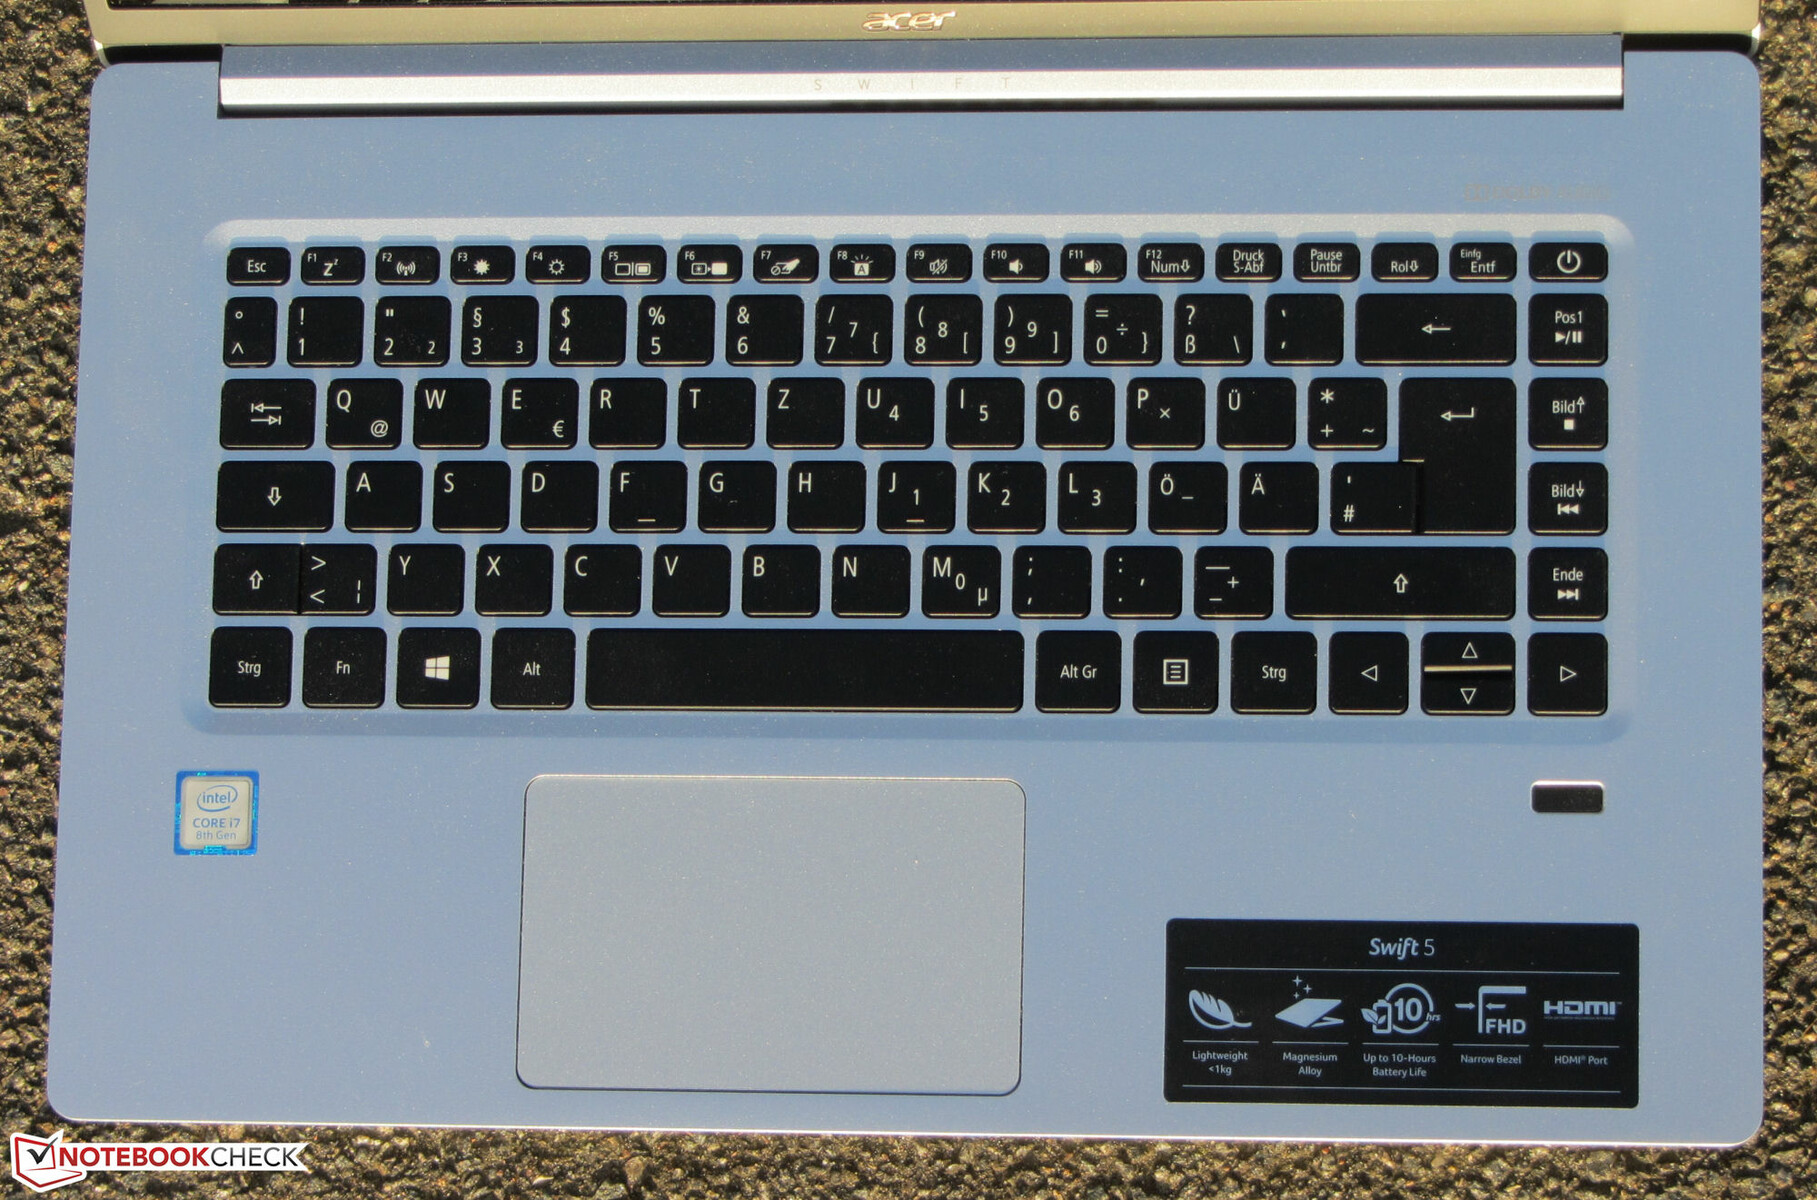
宏碁的Swift 5 SF515-51T是一款非常轻巧的笔记本电脑,专为哪些不想放弃大型15.6英寸显示屏但经常旅行的人而设计。
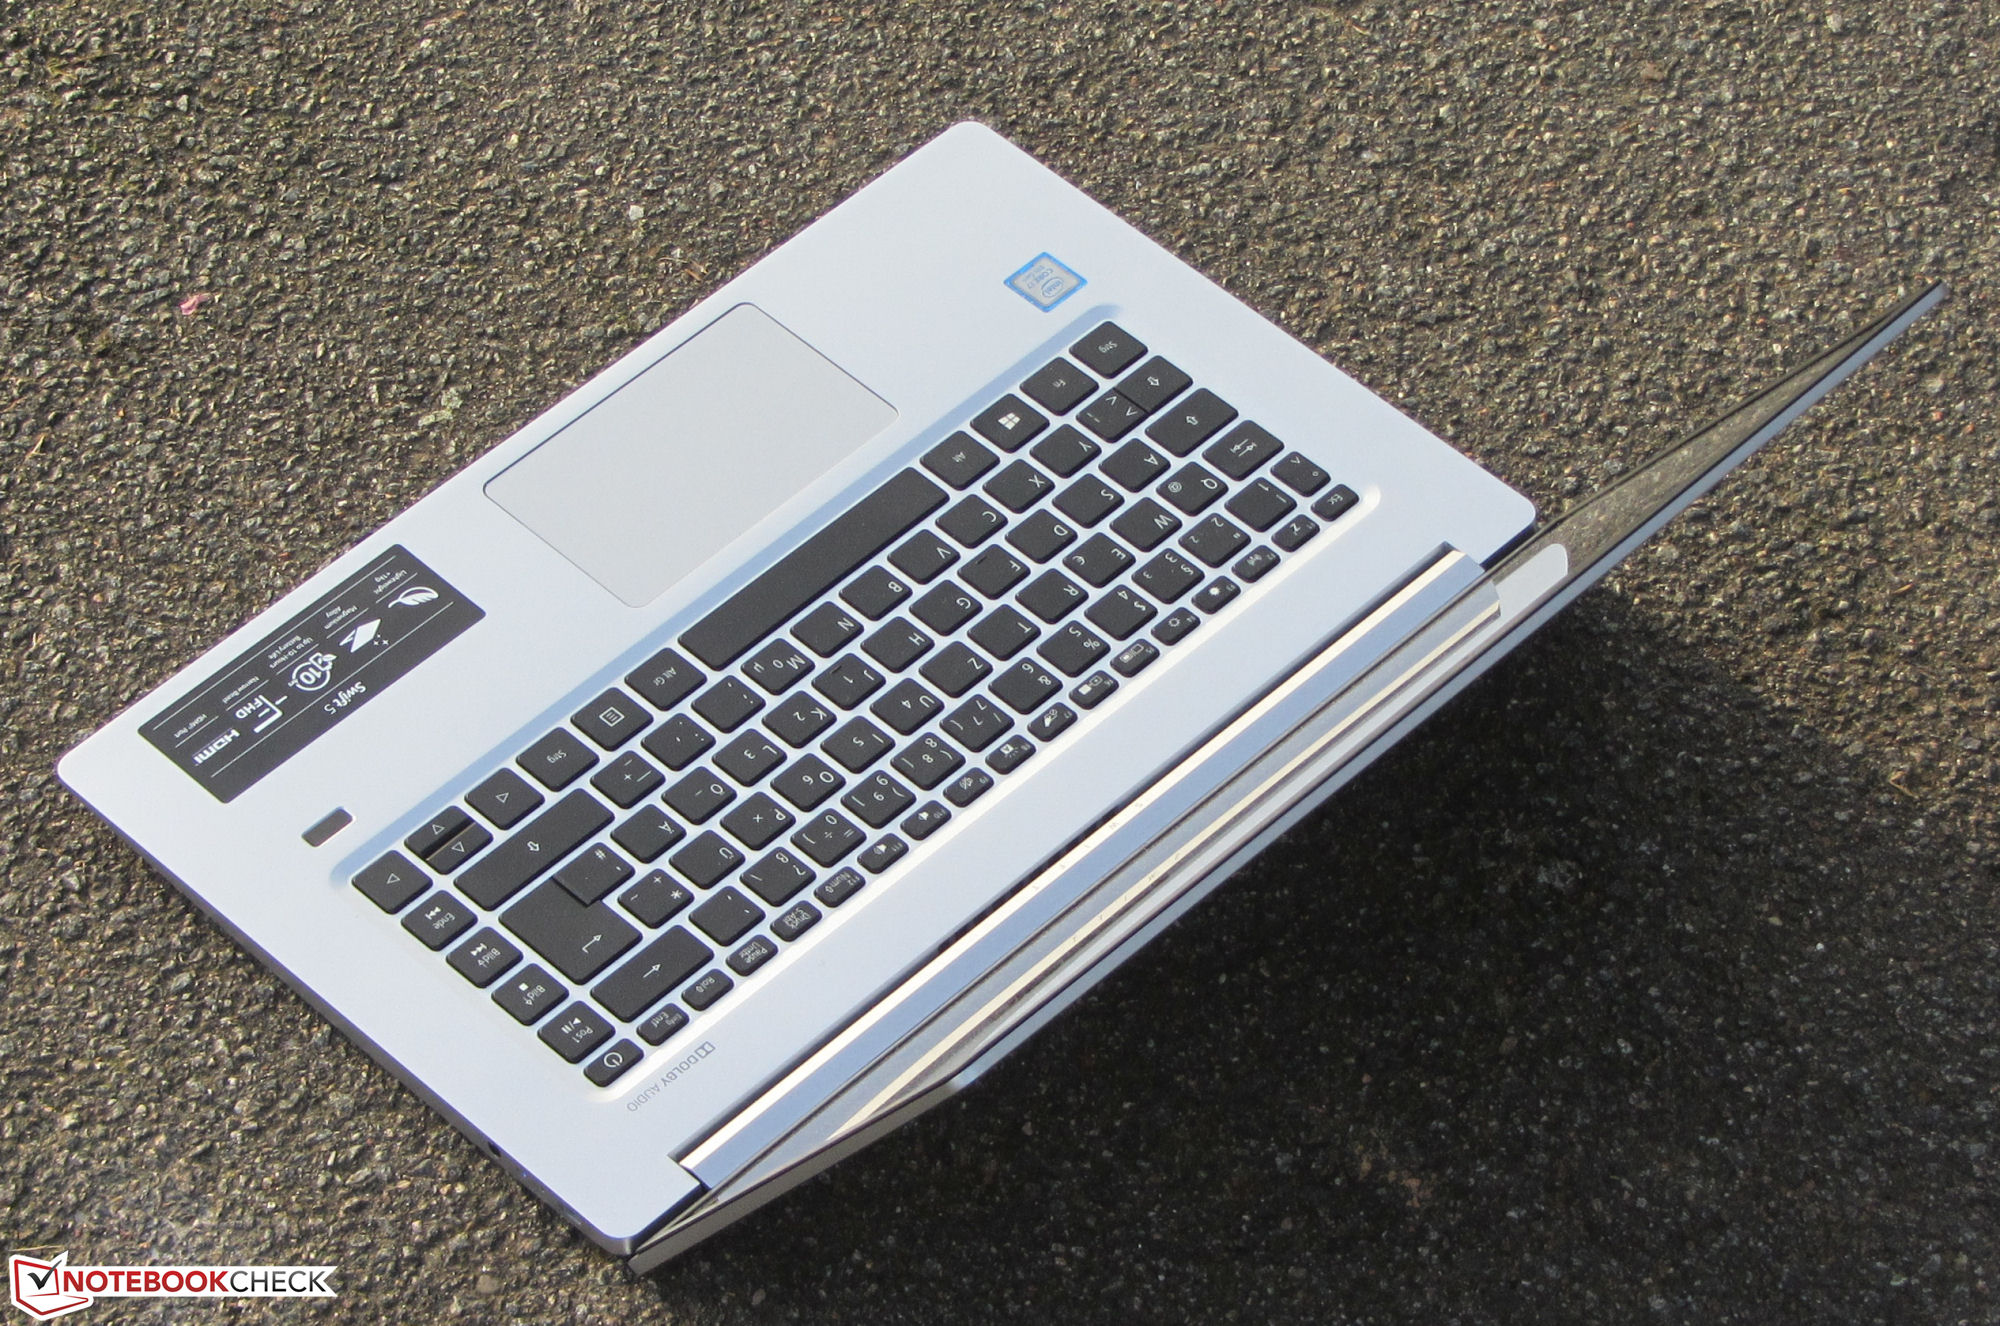
重量不到一公斤,这台电脑在你的包里几乎不会引人注意,也不会给你的肩膀造成负担!
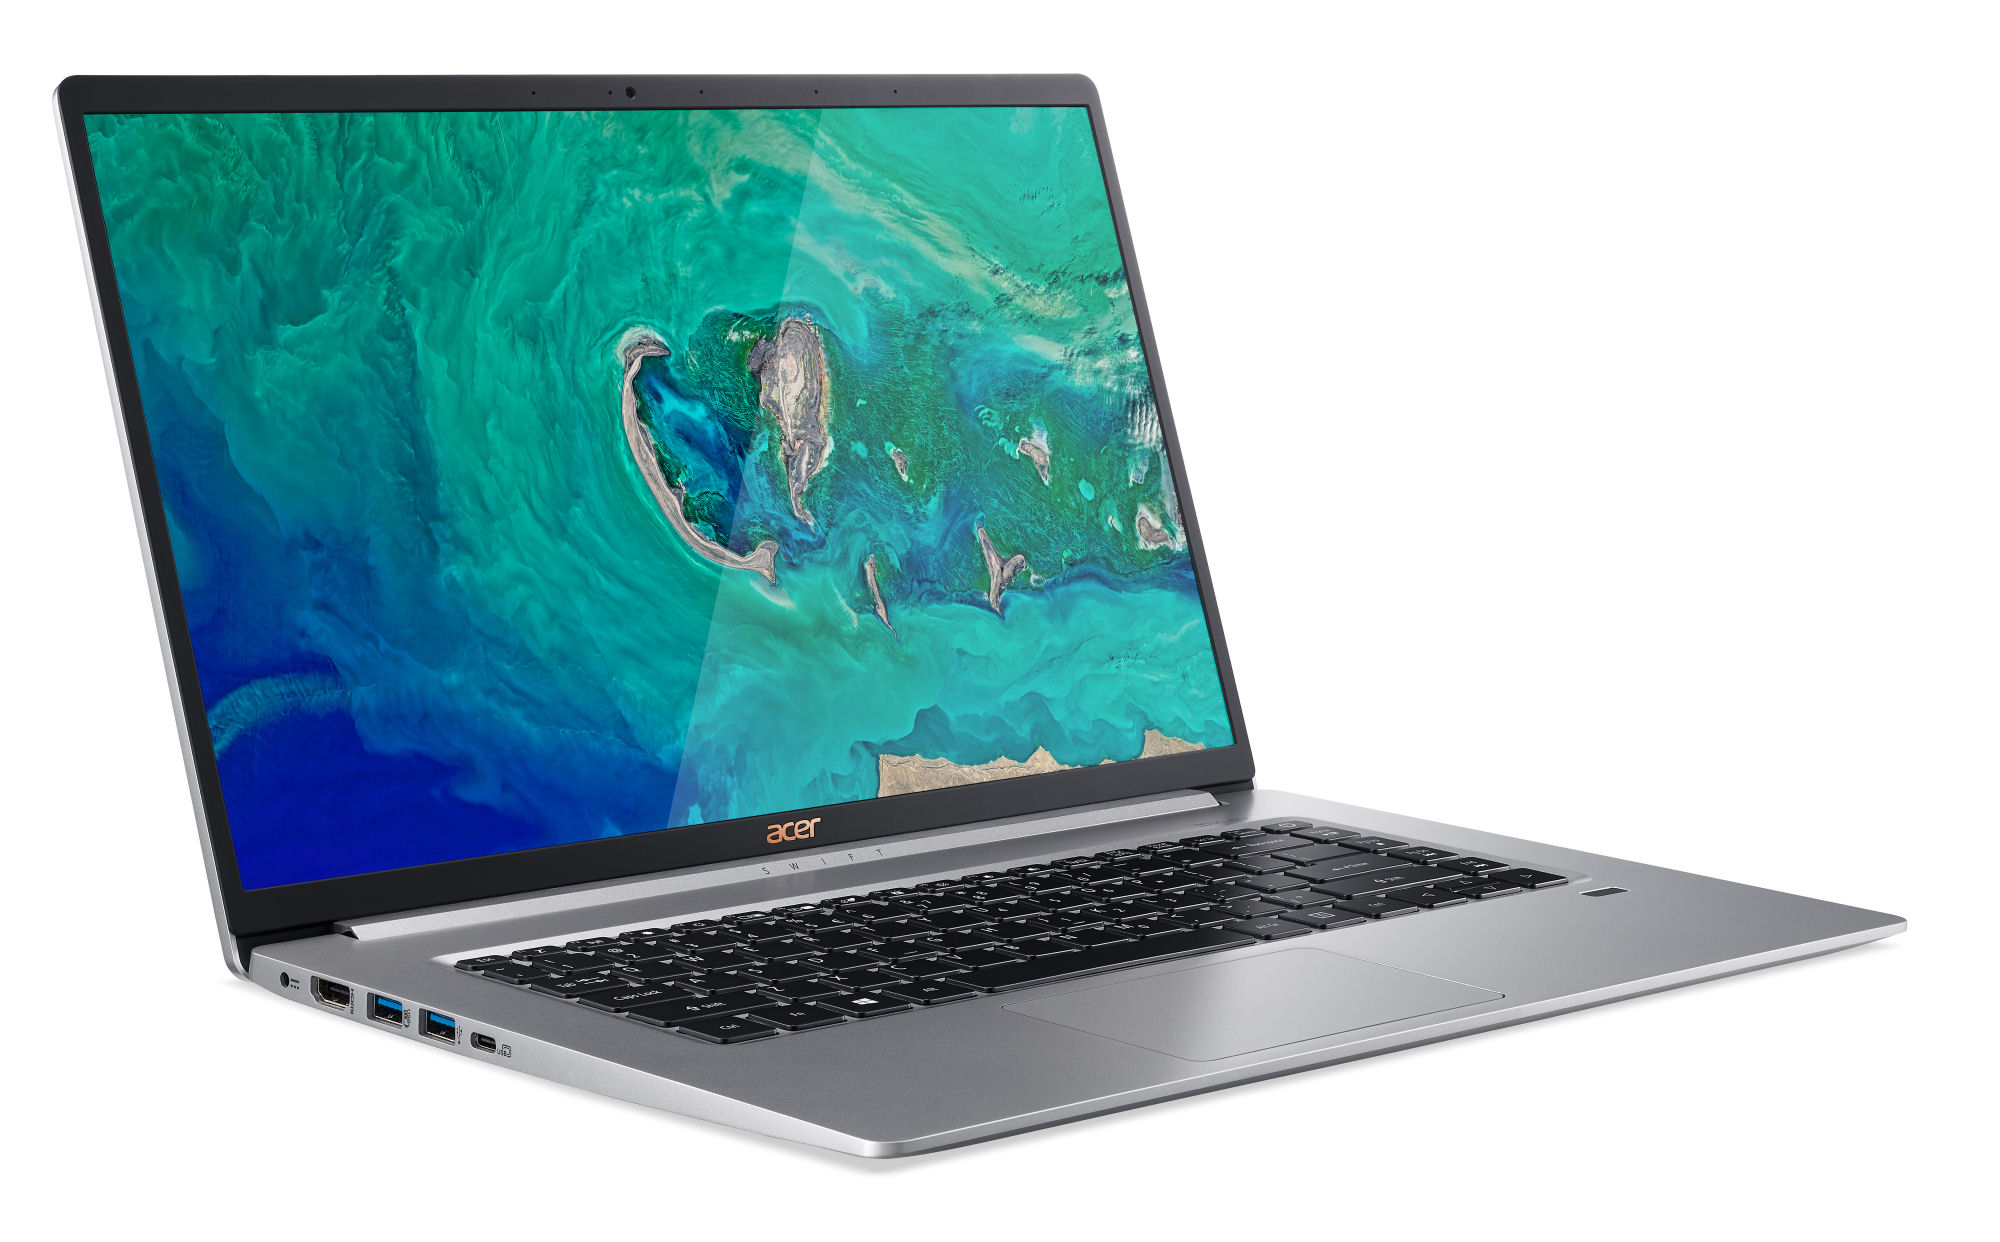
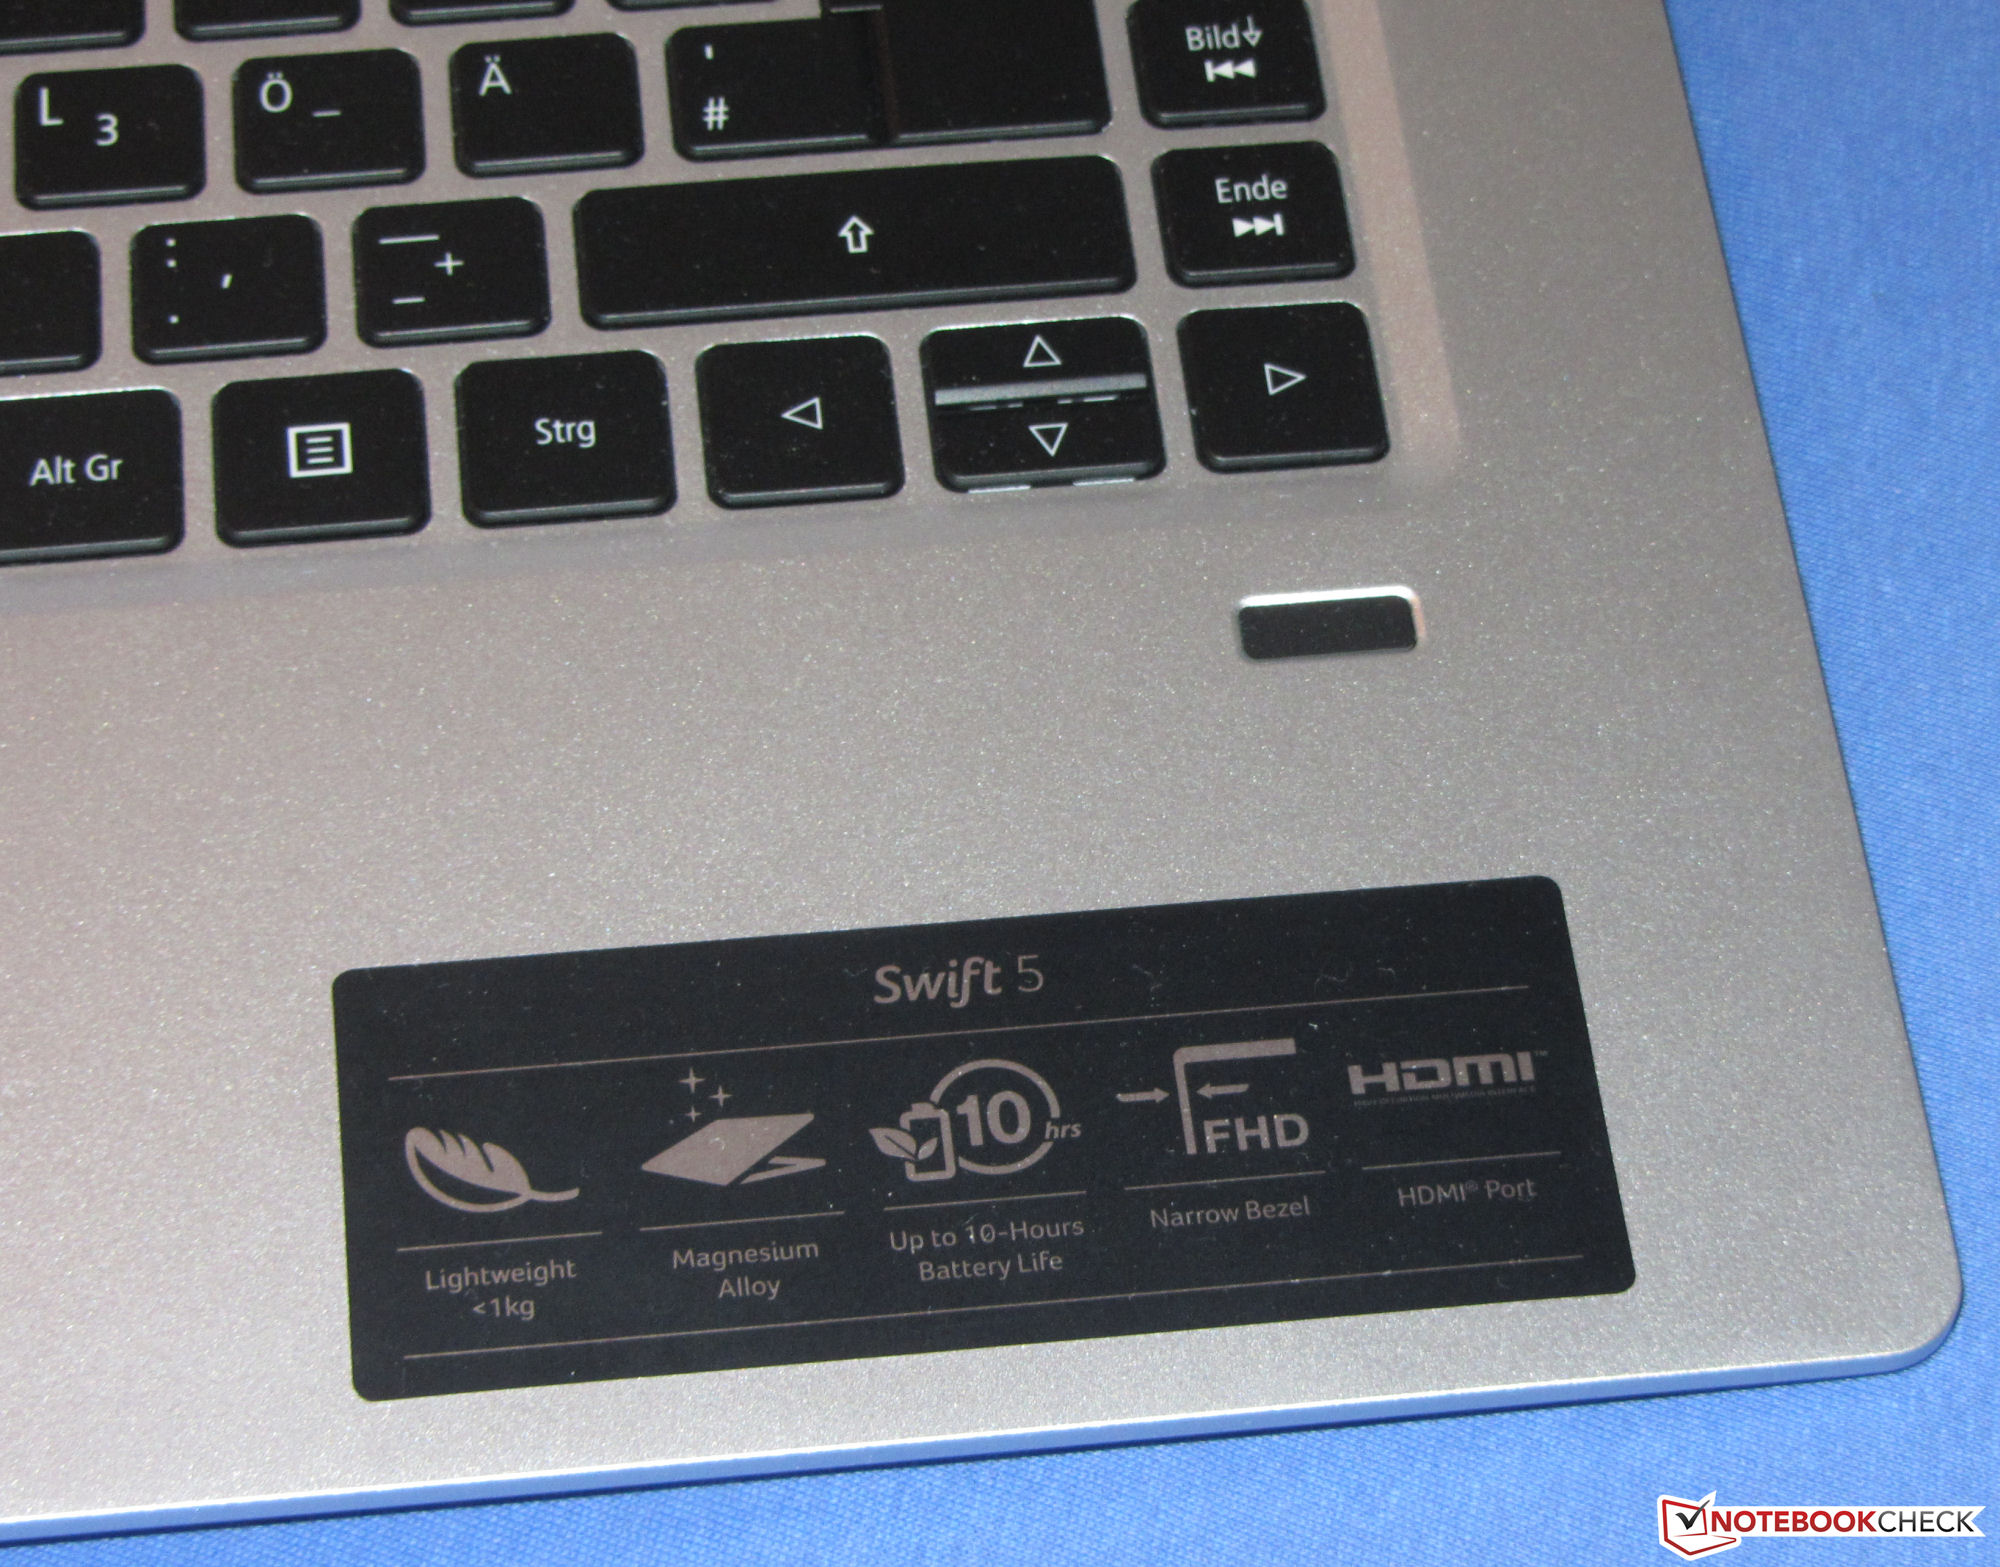
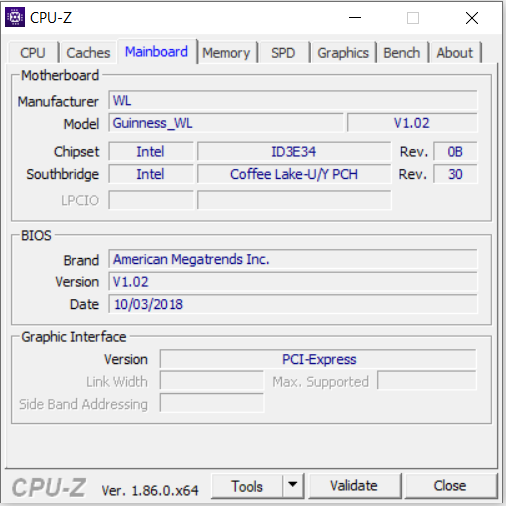
为了达到这么低的重量,宏碁选择了镁合金外壳和一些牺牲。RAM,SSD和Wi-Fi模块都焊接到主板上,这意味着这些组件都不能更换或扩展。因此,在购买Swift 5之前,您应该知道在未来几年内需要多少存储空间。不过Swift 5至少有一个空余的M.2 2280插槽,因此您可以后期添加一些NVMe存储。
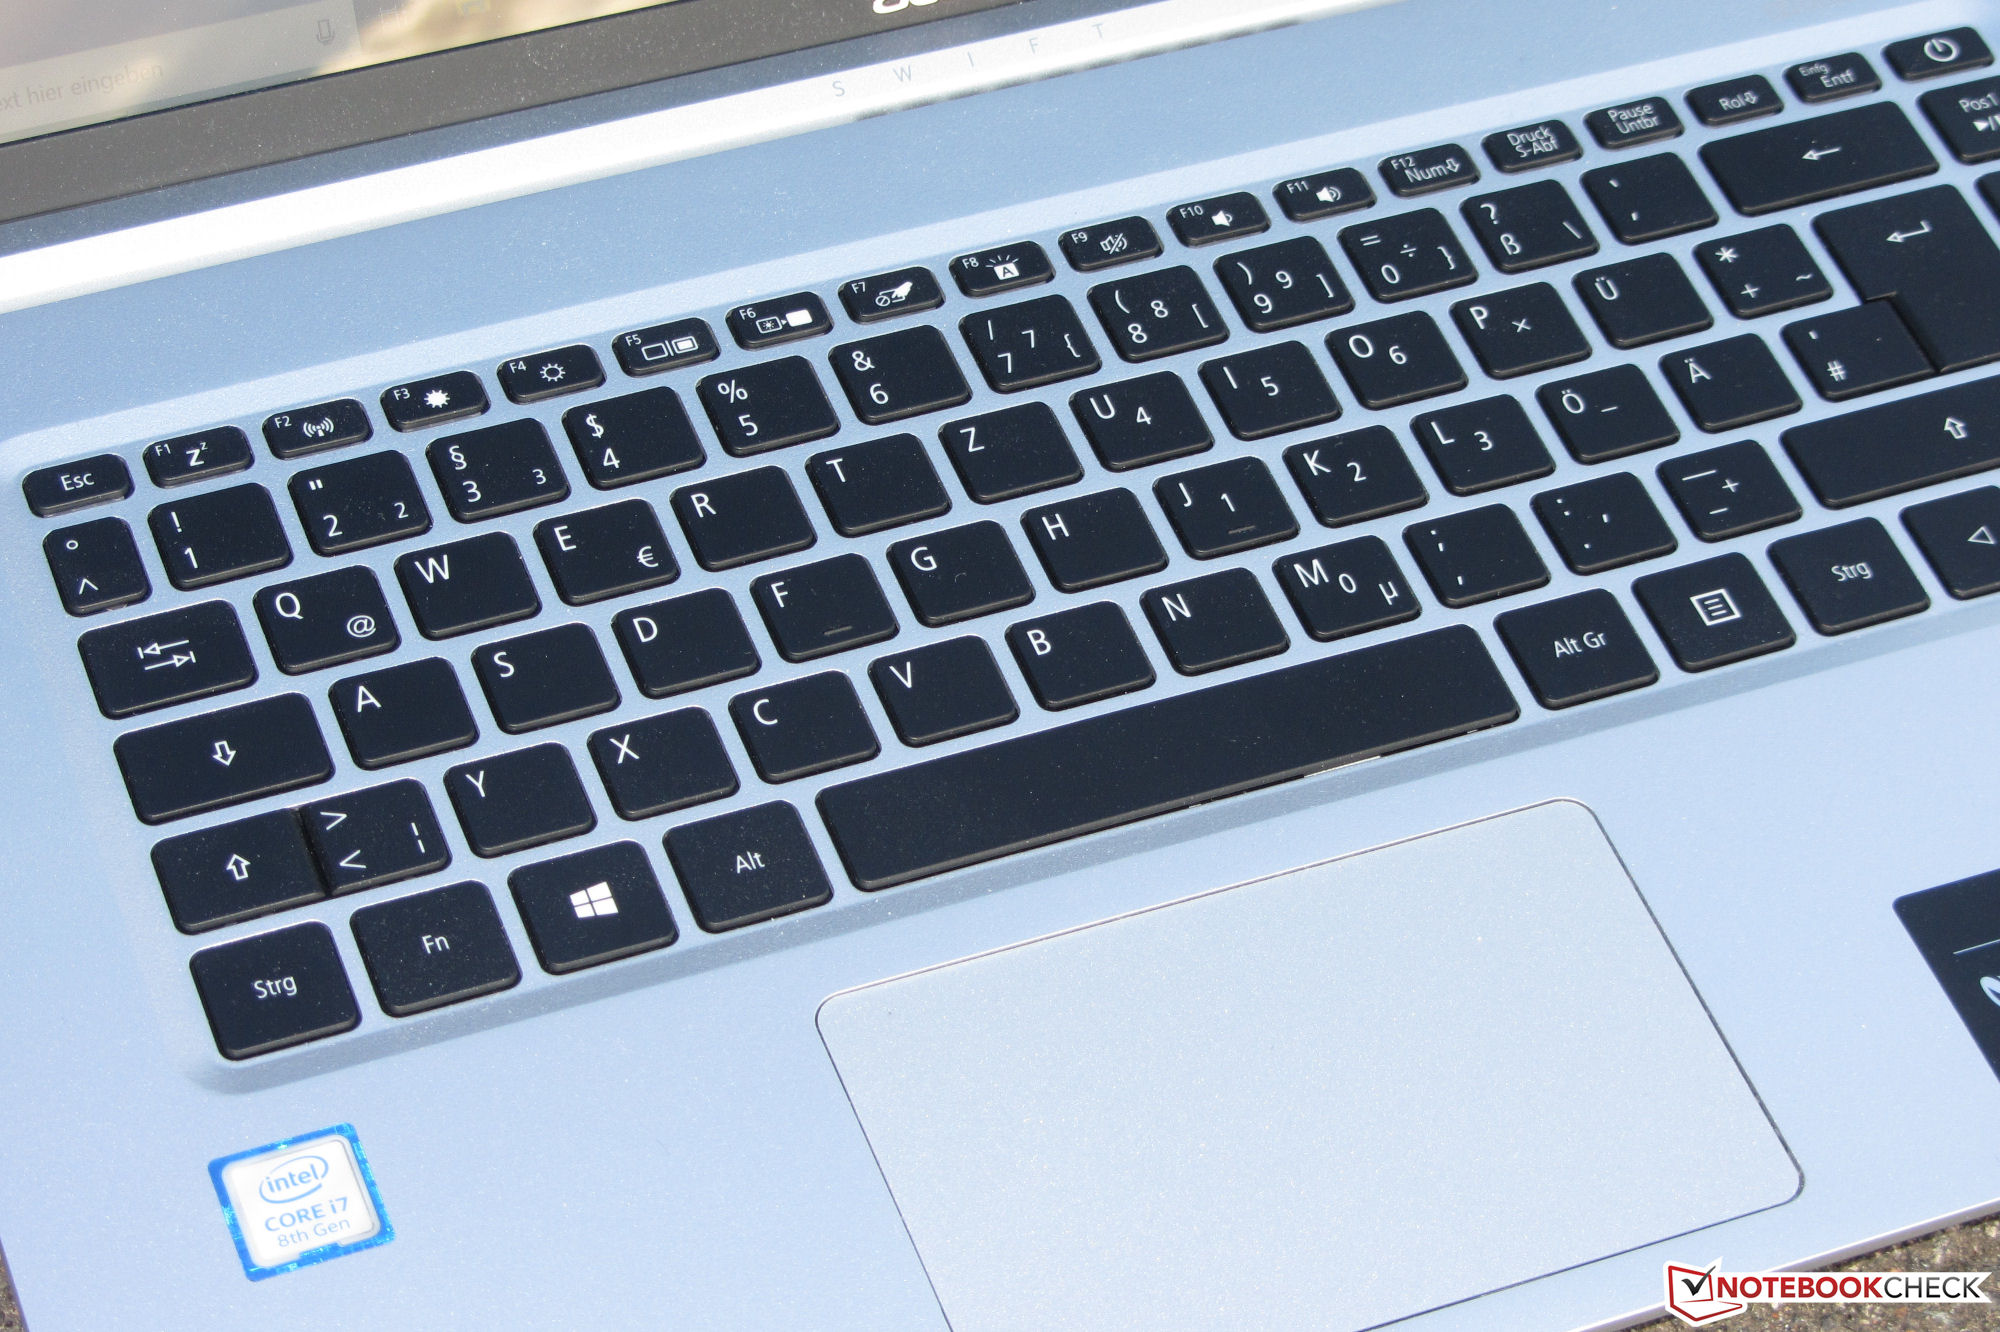
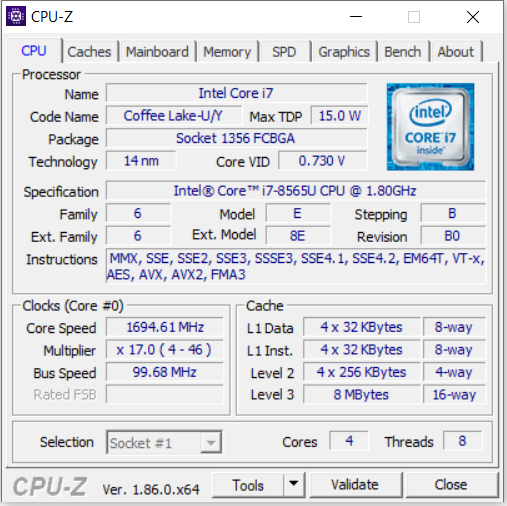
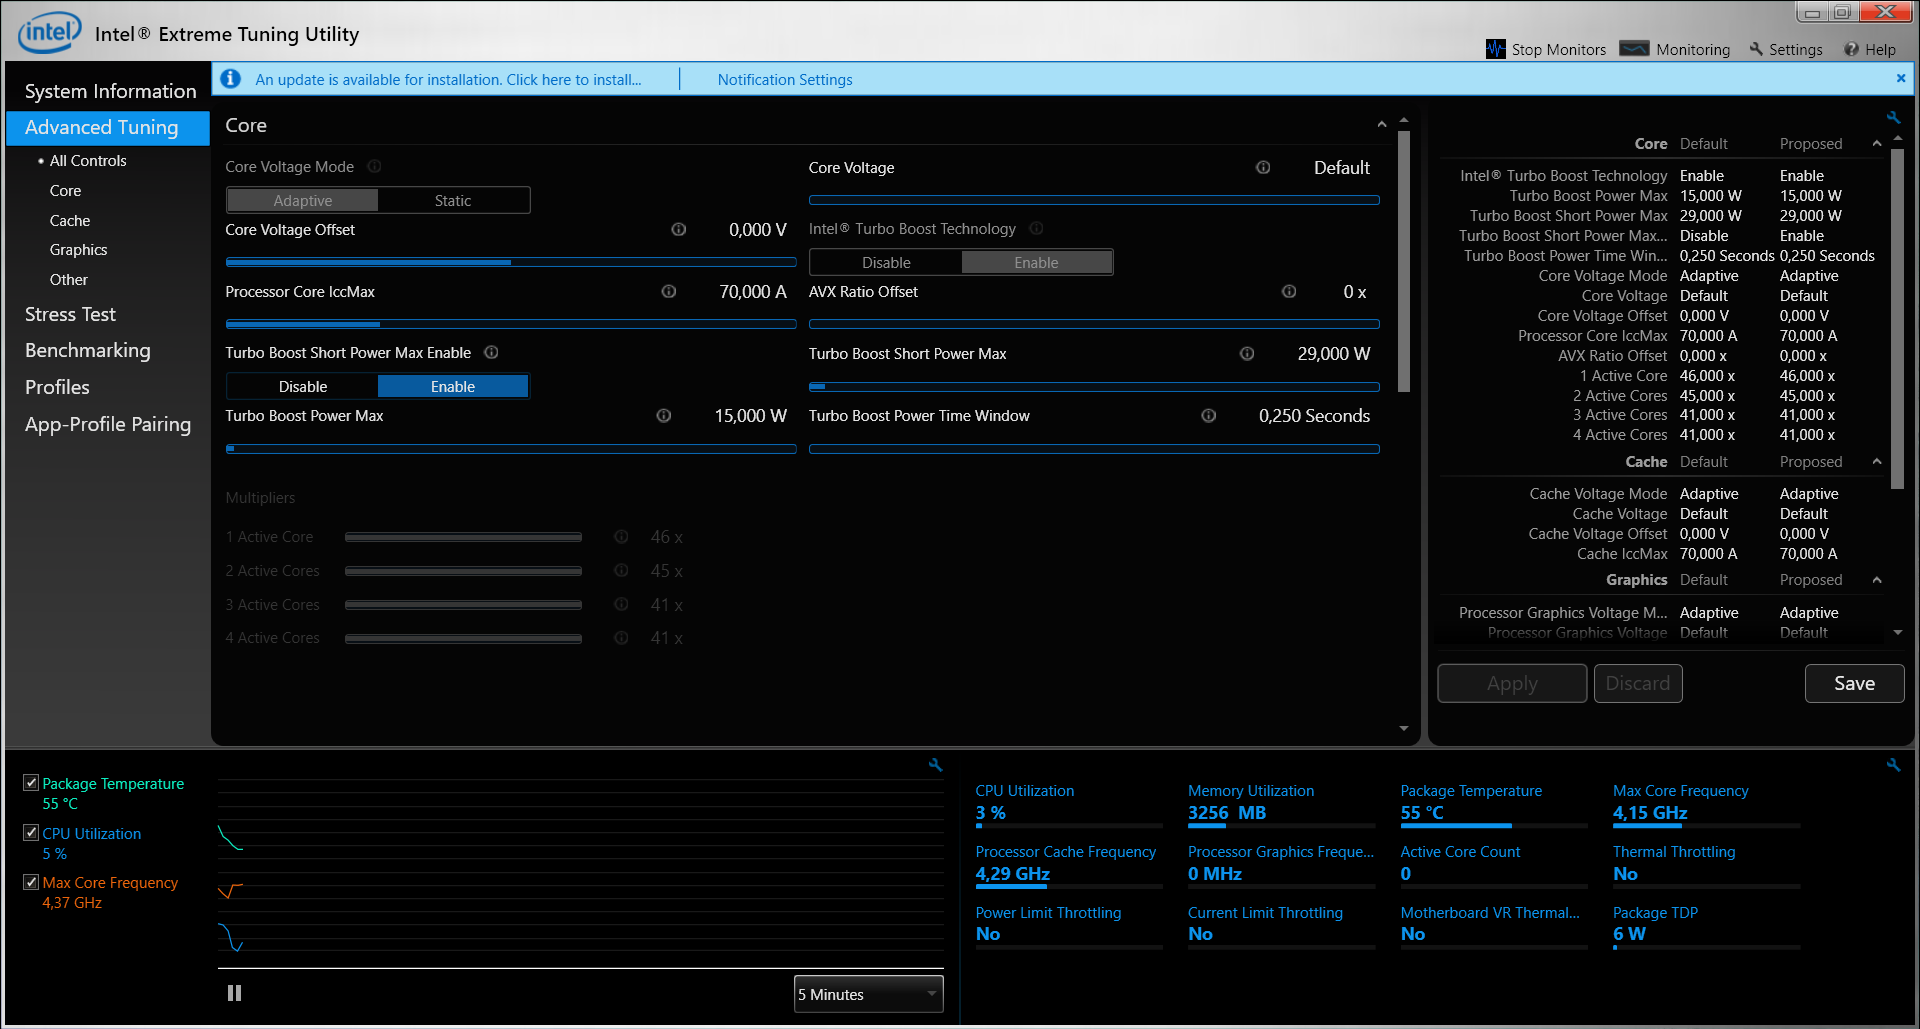
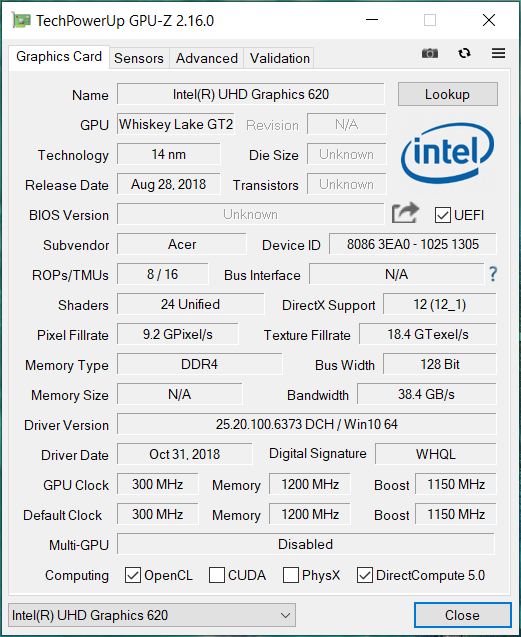
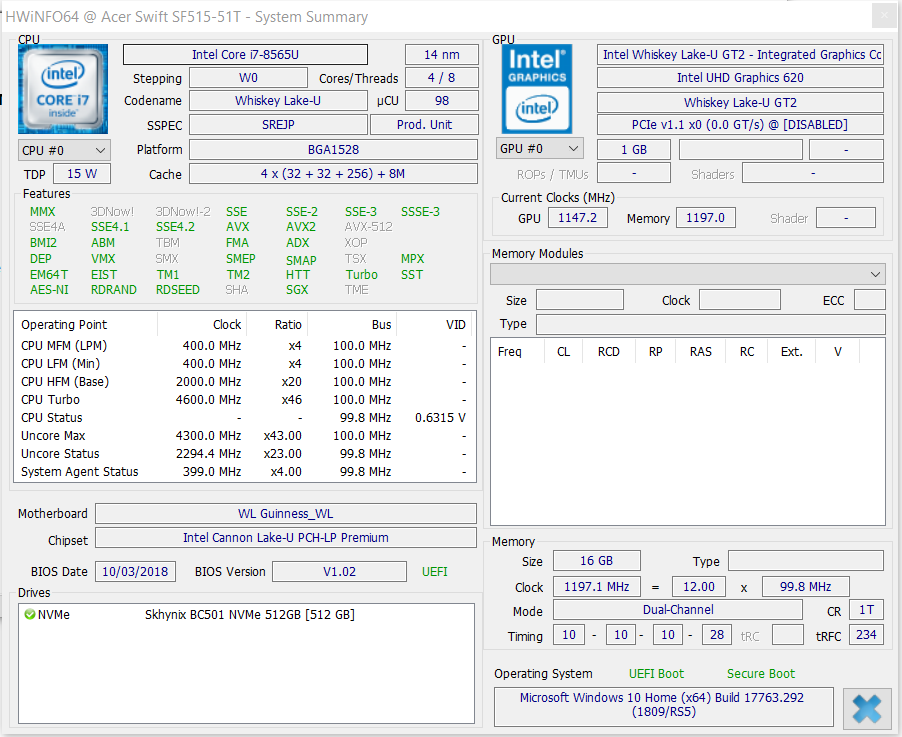
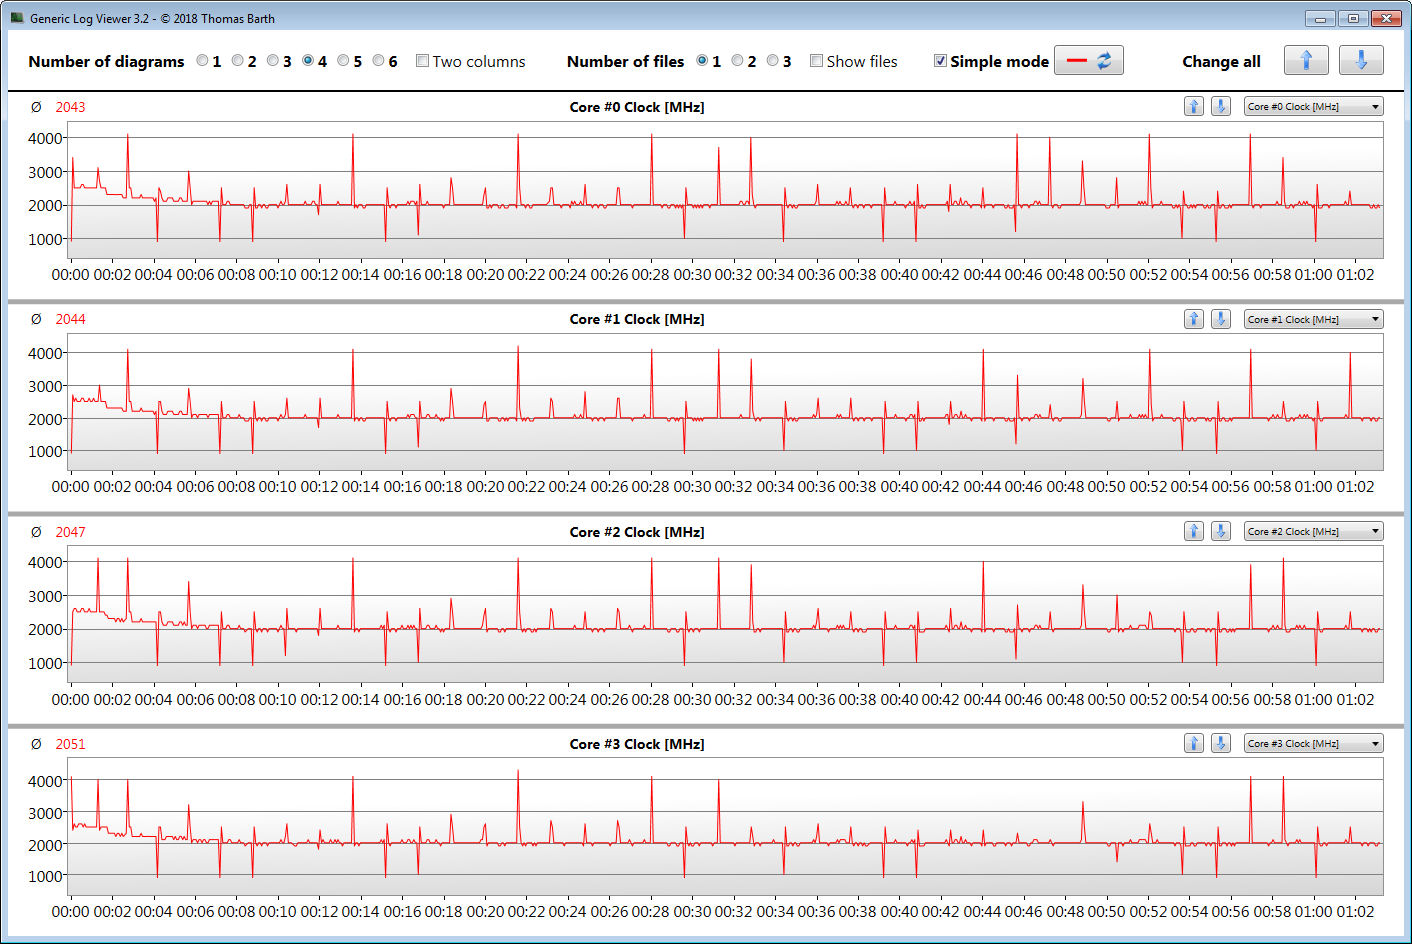
该设备采用酷睿i7 Whiskey Lake处理器,为办公室和互联网应用提供足够的处理能力。不幸的是,Swift 5在长时间工作时无法充分利用其CPU,特别是在多线程操作期间。如果您需要持续的最高性能,您最好看看其他竞品。
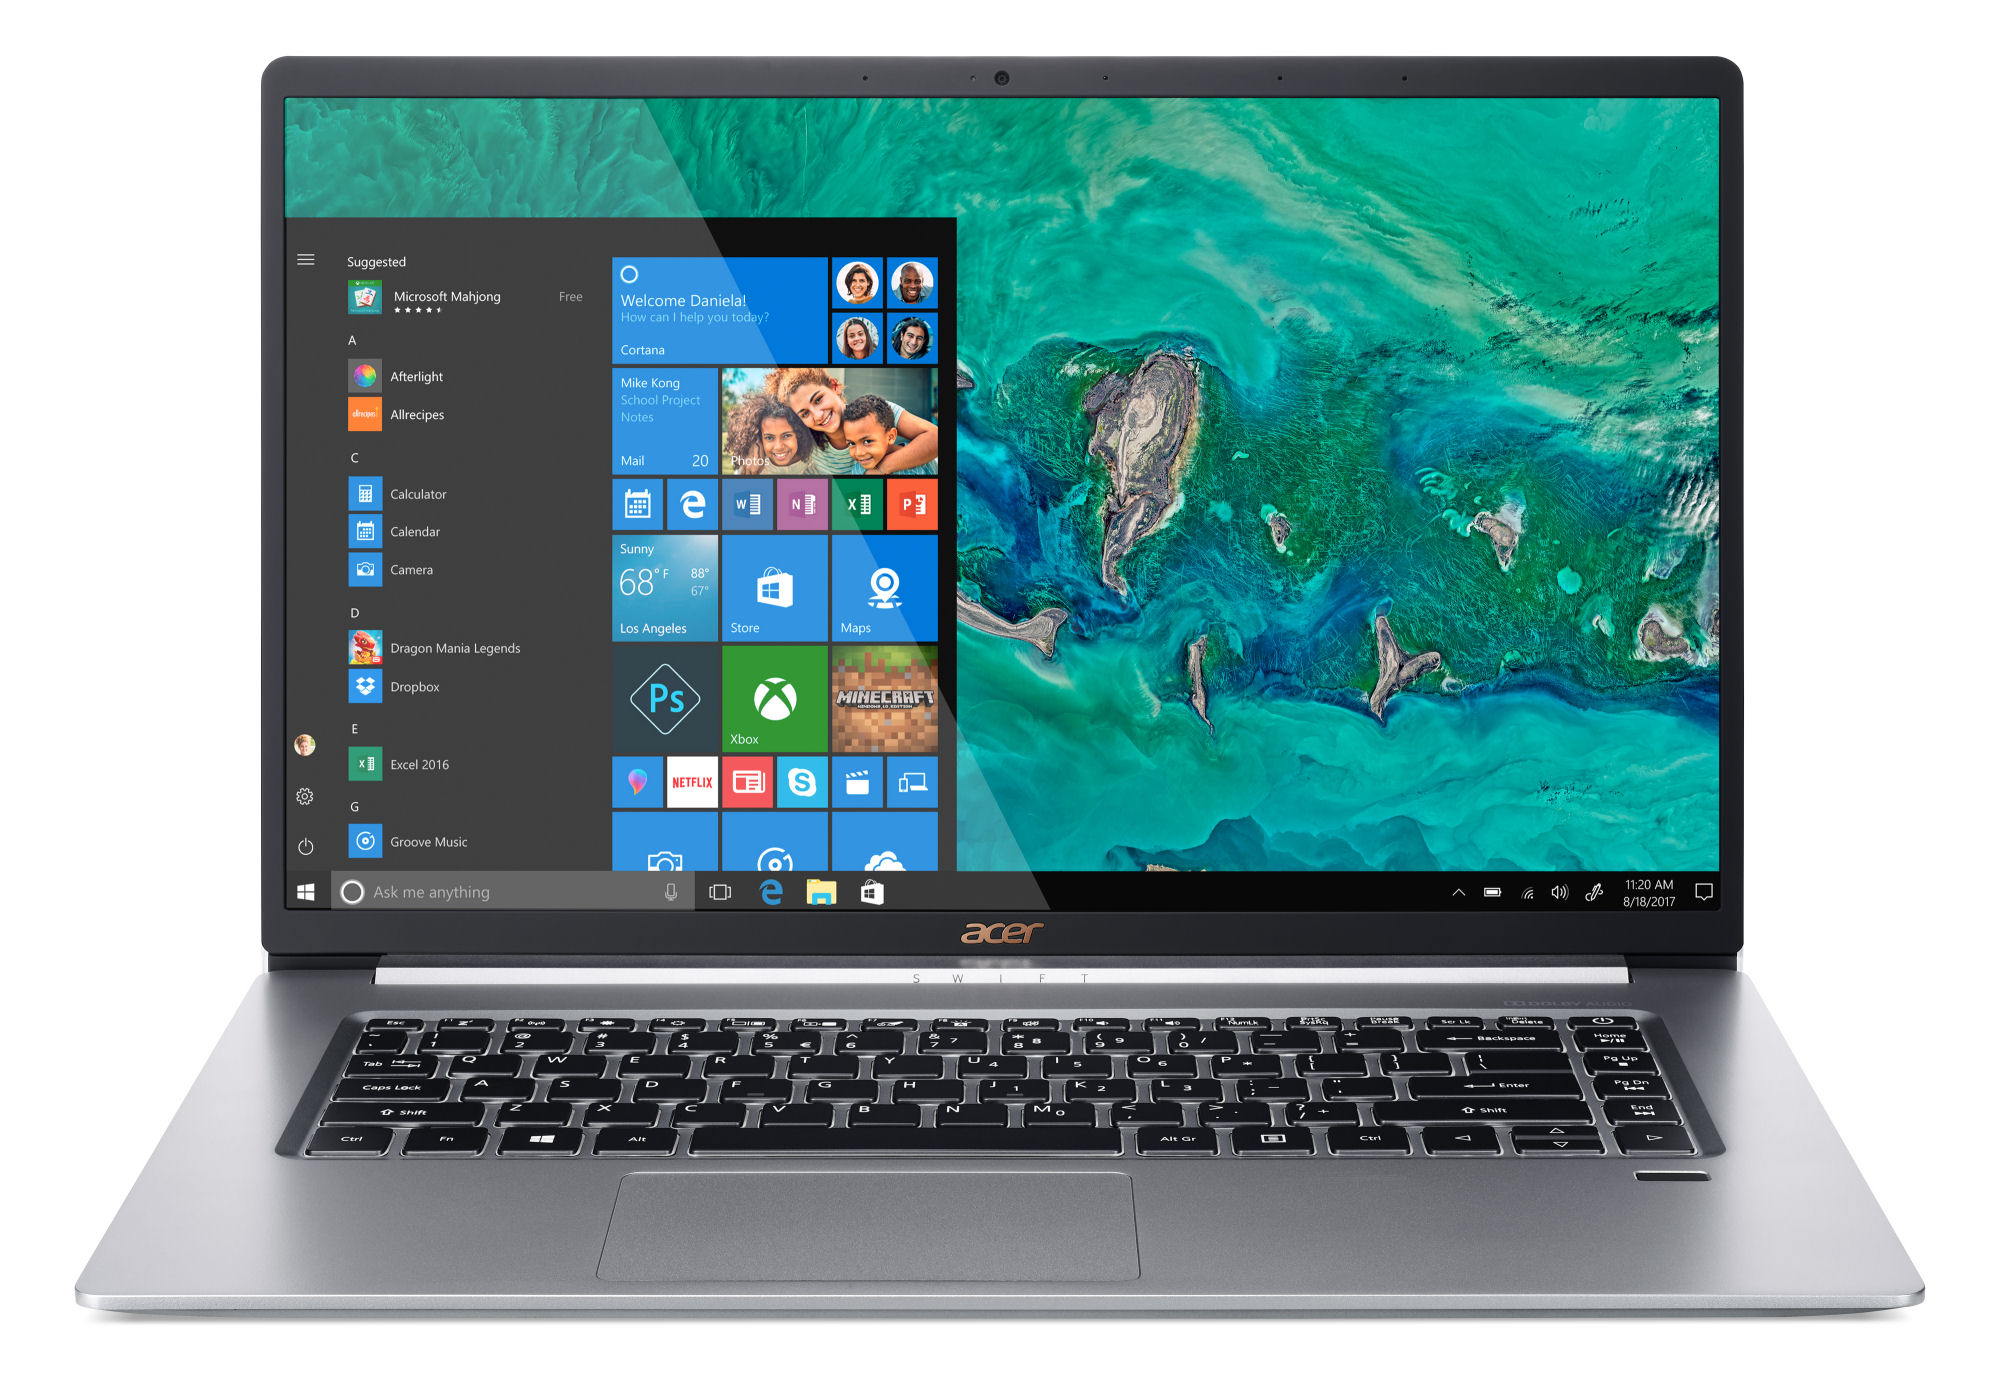
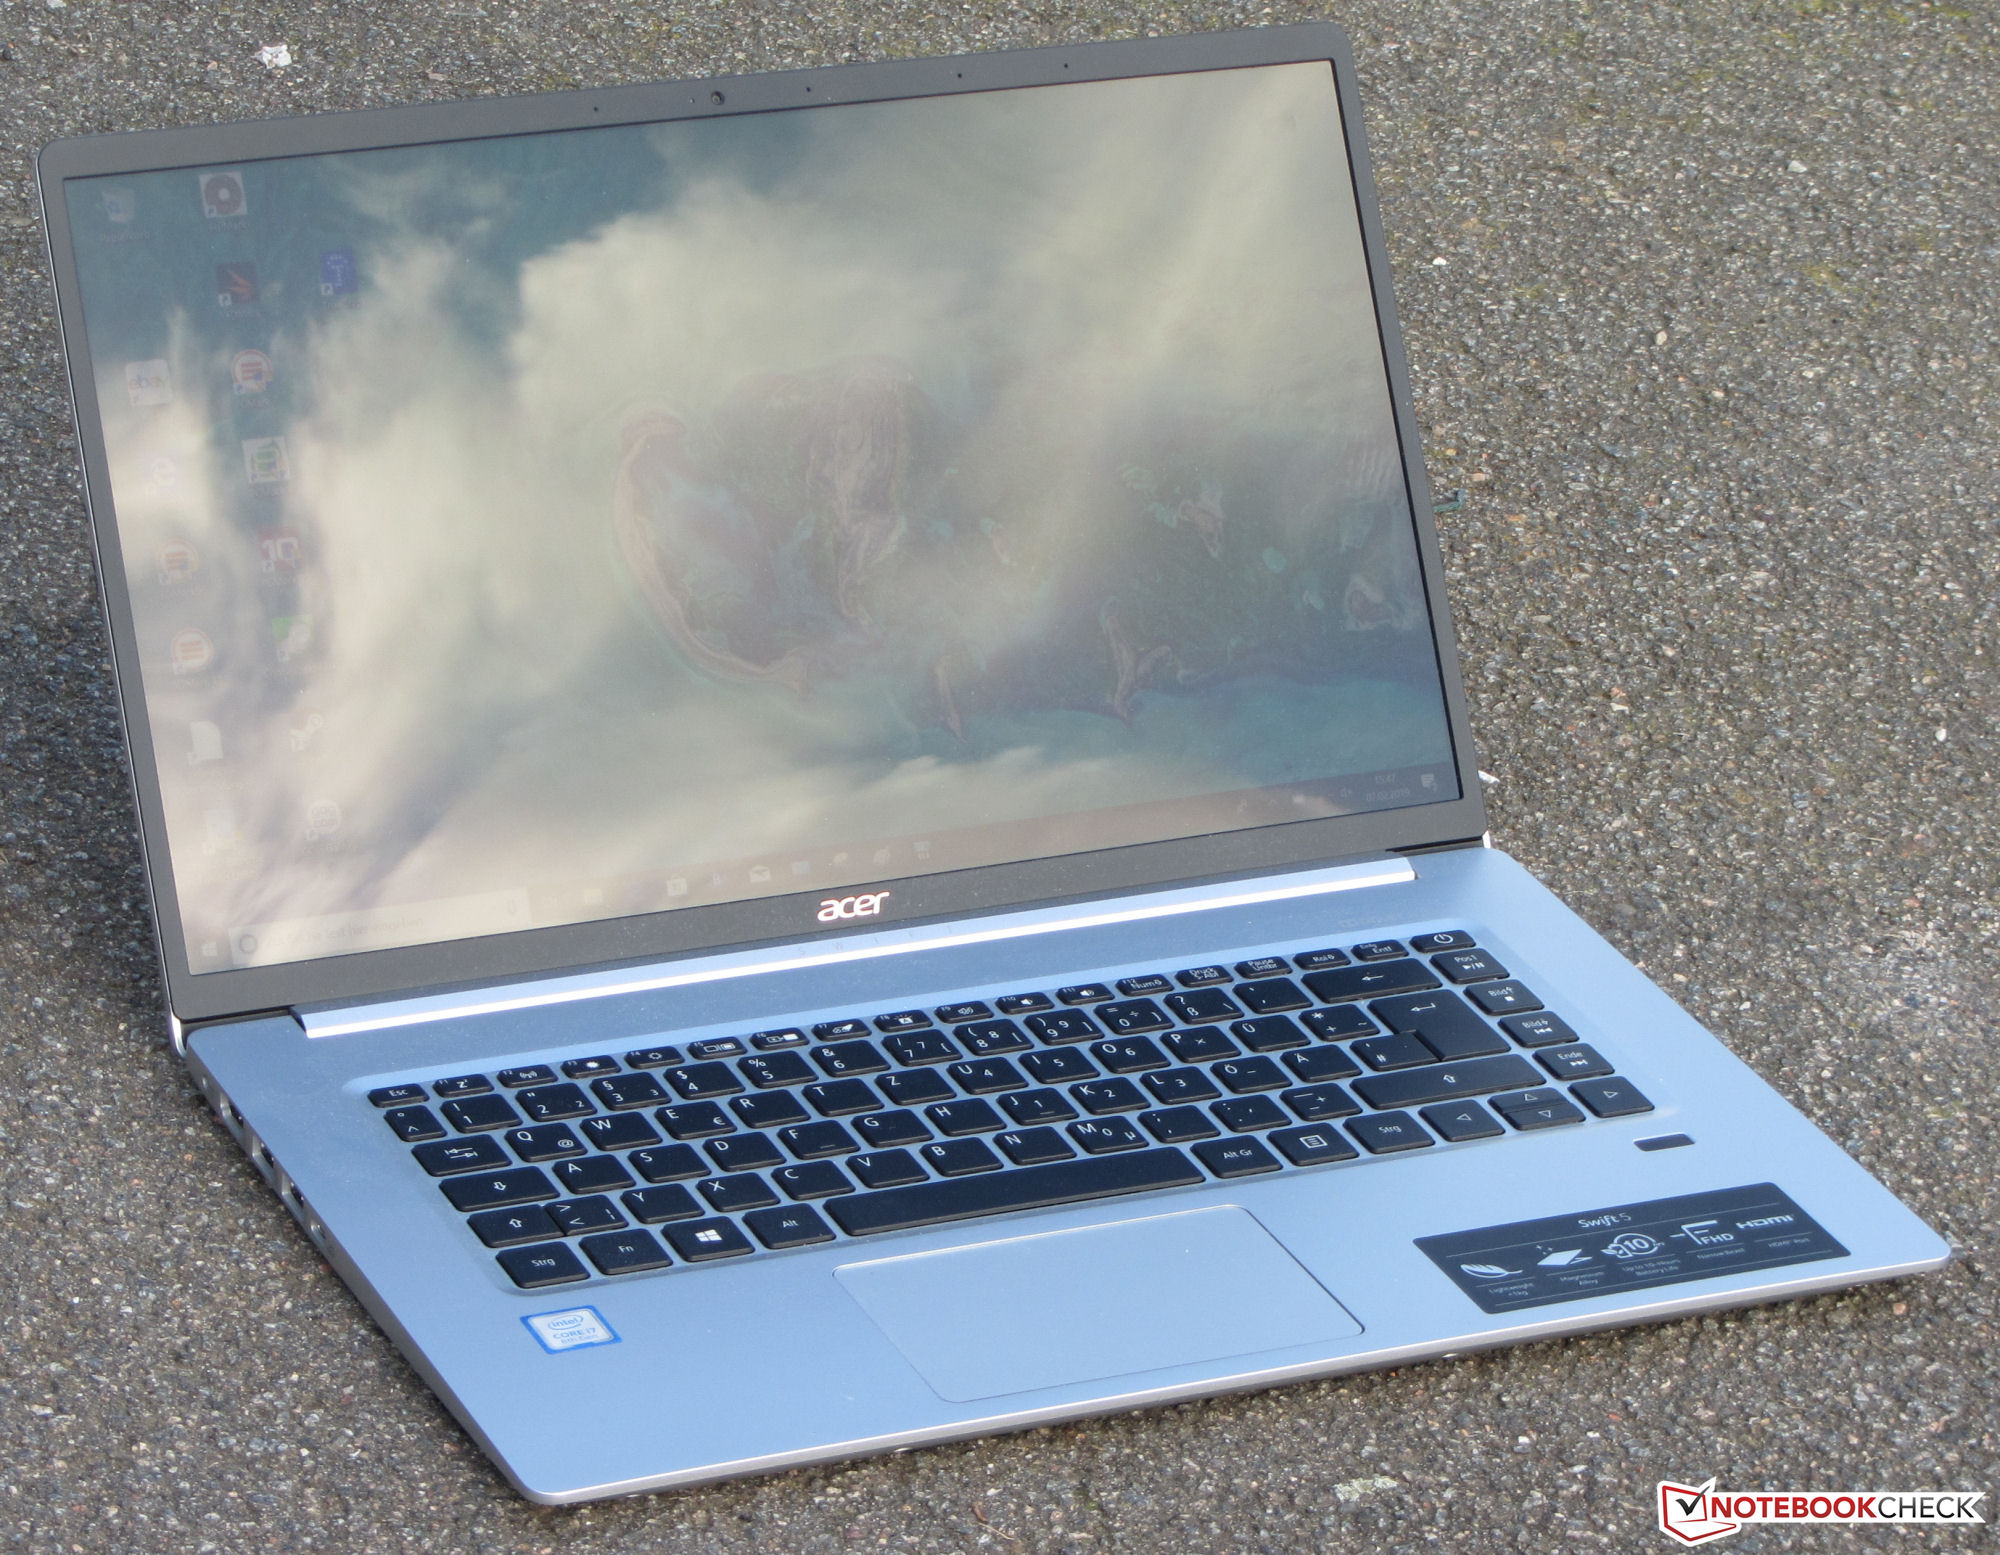
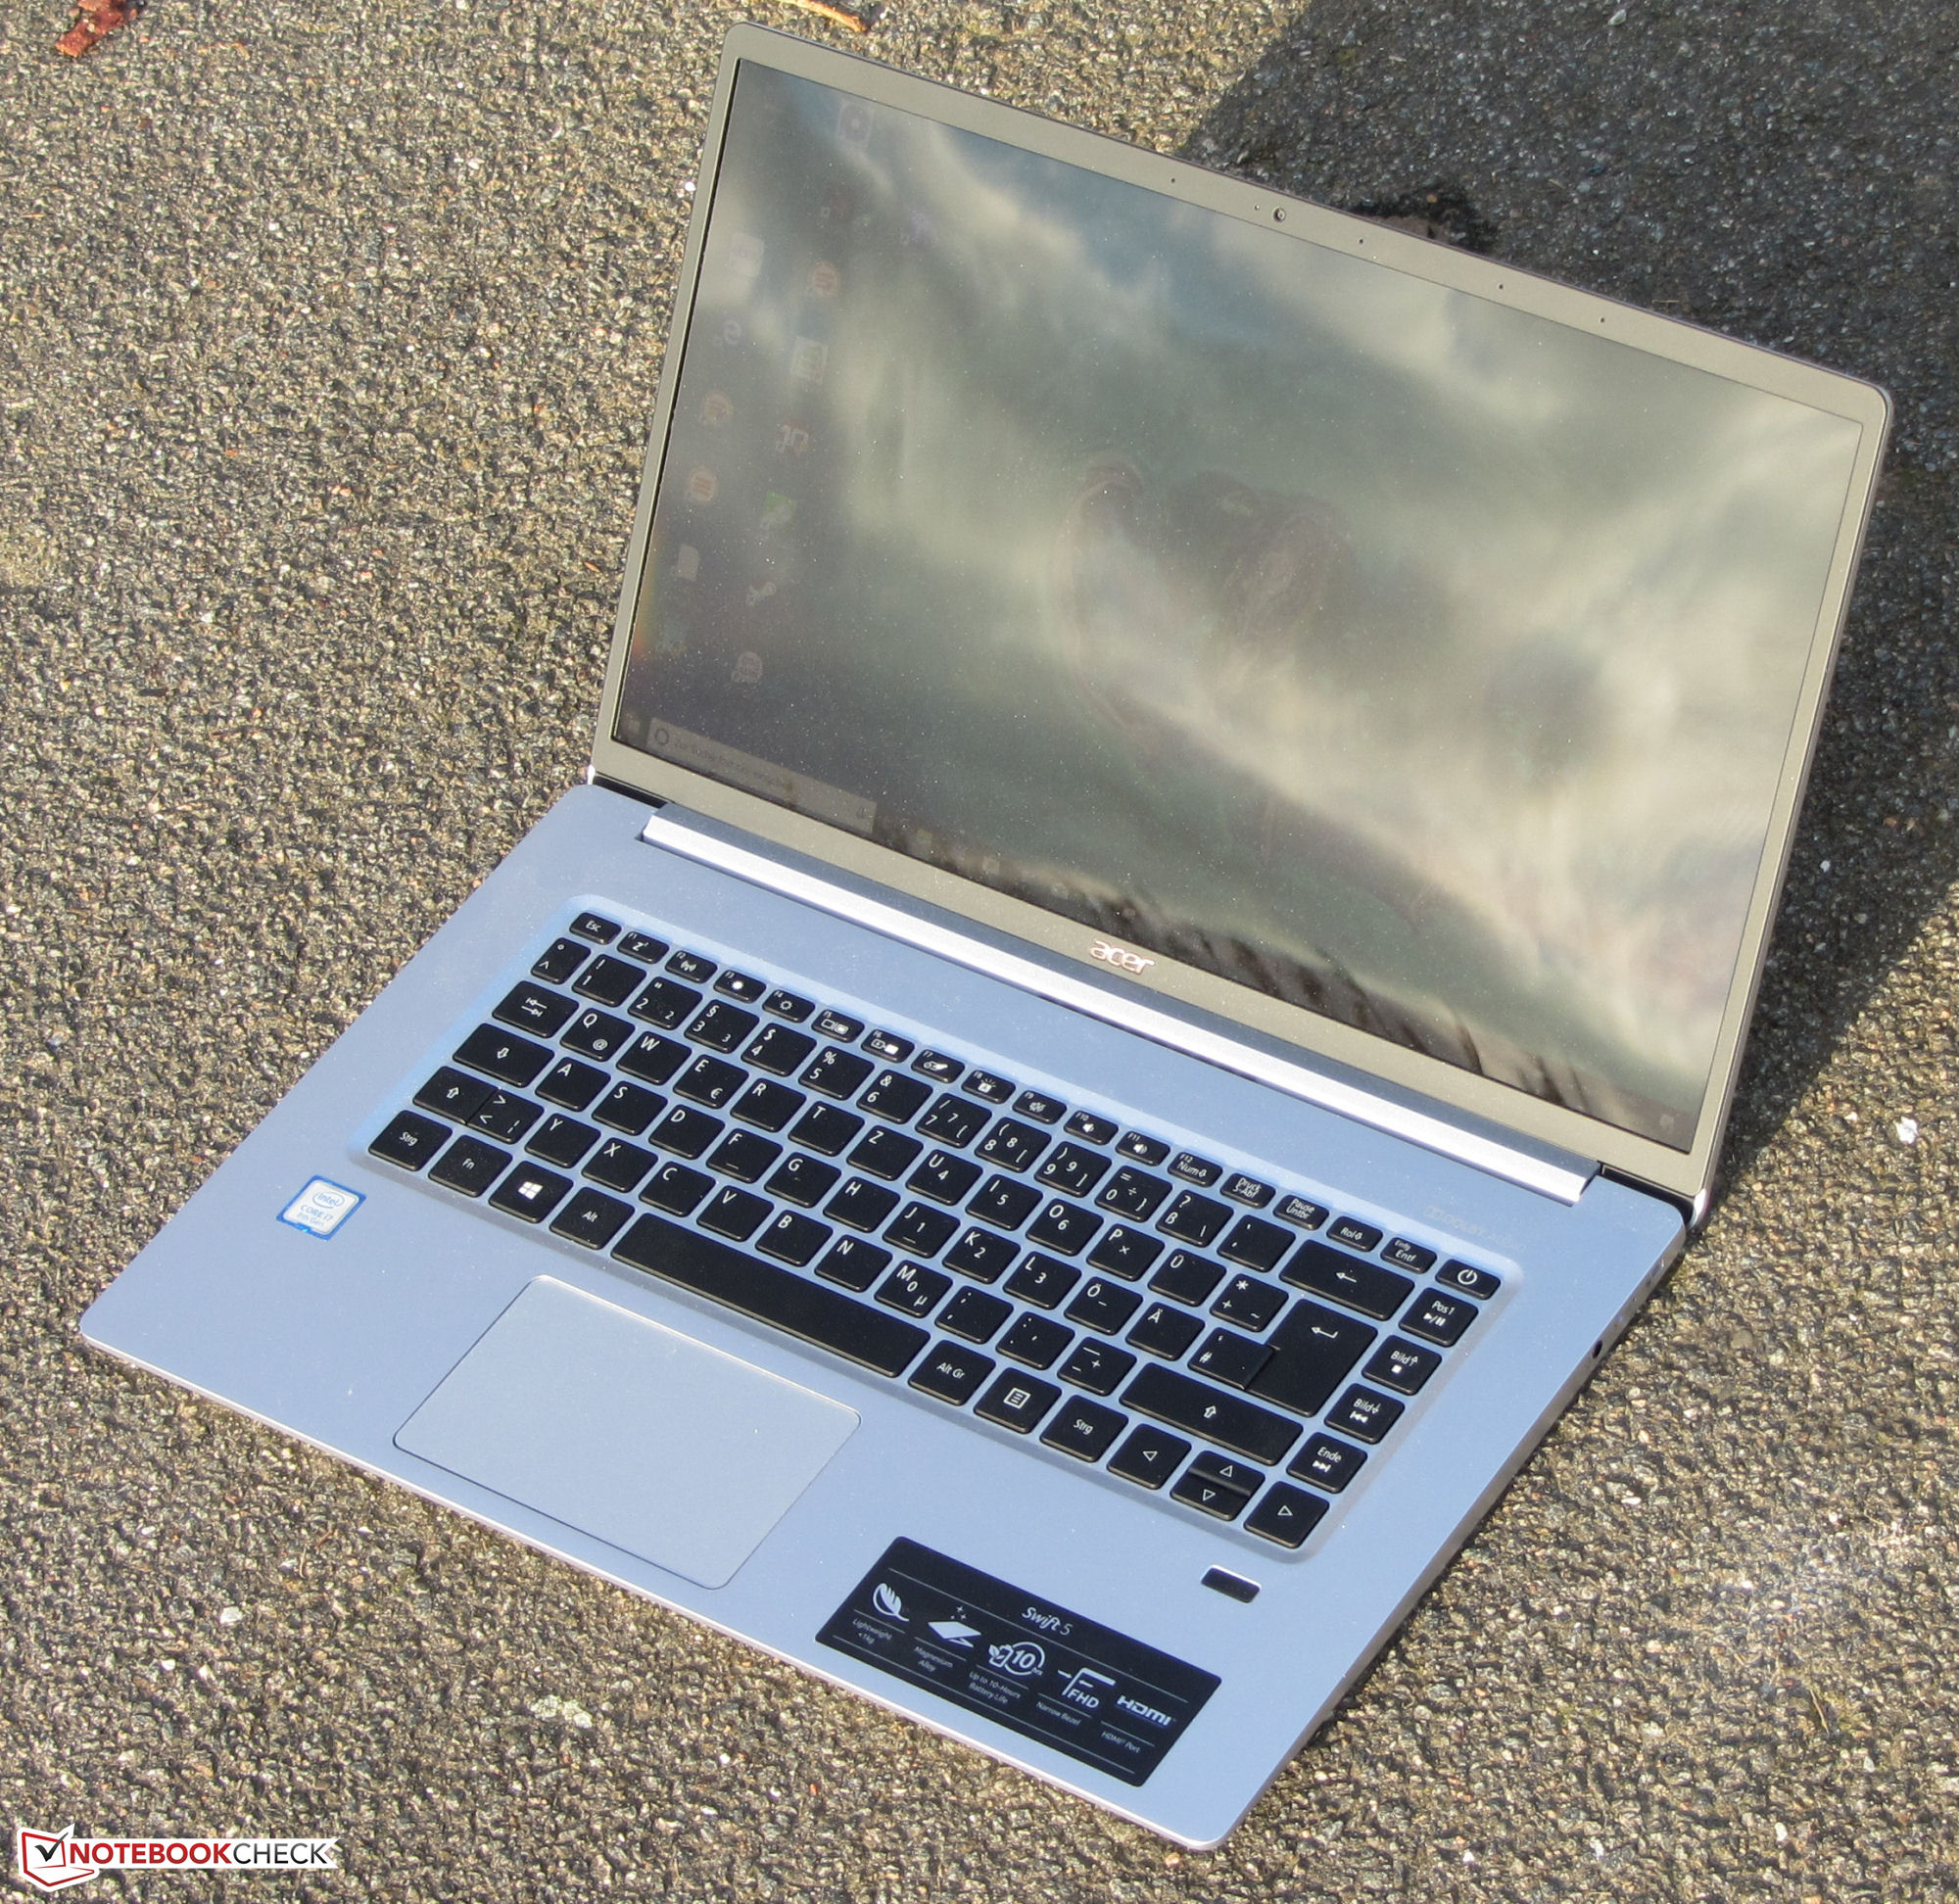
Swift 5有一块不错的键盘,带有一个单级别的背光,以及相对较好的续航时间。IPS触摸屏也给我们留下了良好的印象。它只有普通的对比度和亮度值,但其彩色显示效果令人赏心悦目。但请注意,这是一个亮面显示屏。我们更希望Acer会提供没有触摸屏功能的哑光显示屏。
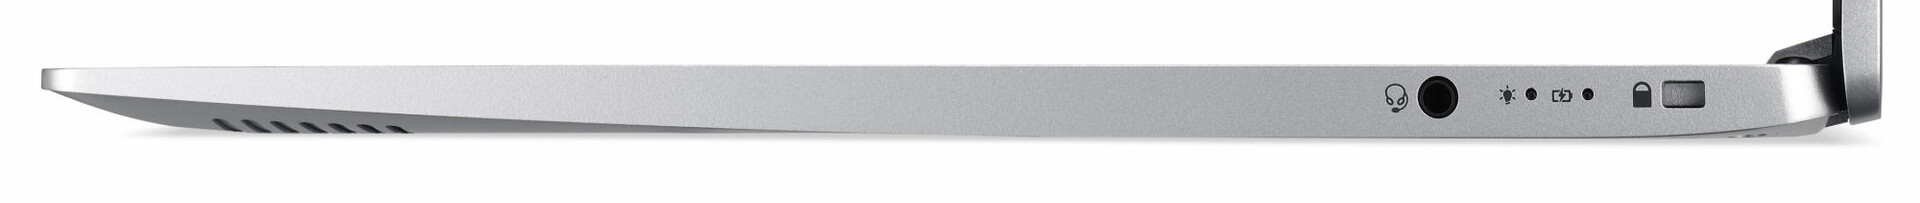
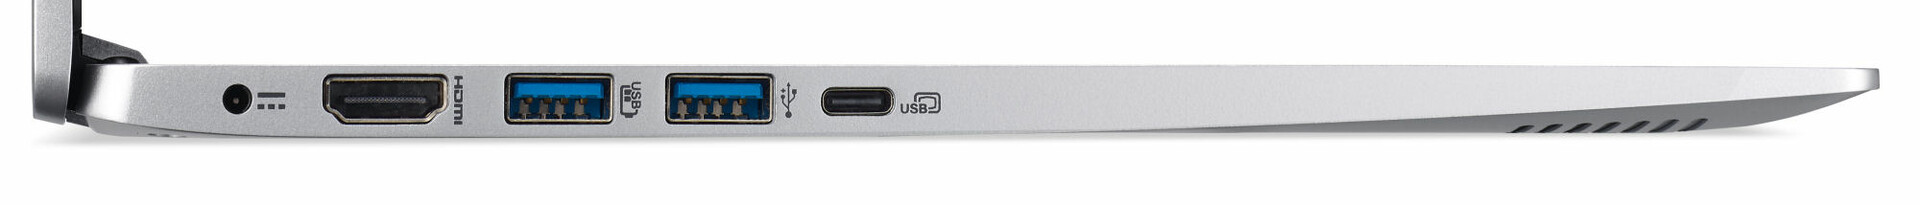
Acer Swift 5 SF515-51T与LG Gram 15Z980为竞争关系。宏碁在重量方面显然是赢家——但是,Gram提供了更长的续航时间和更好的端口选择。对于许多潜在买家而言,这两个因素可能会为LG加分。如果宏碁设法在未来版本的Swift 5中减轻重量,同时改善续航时间和端口选择,那么Gram就会面临很大压力。
Acer Swift 5 SF515-51T-76B6
- 02/11/2019 v6 (old)
Sascha Mölck
Price comparison

