联想 ThinkPad X1 Yoga 20FQ-000QUS 变形本简短评测
| |||||||||||||||||||||||||
Brightness Distribution: 89 %
Center on Battery: 284.7 cd/m²
Contrast: 743:1 (Black: 0.383 cd/m²)
ΔE ColorChecker Calman: 5.24 | ∀{0.5-29.43 Ø4.71}
ΔE Greyscale Calman: 7.32 | ∀{0.09-98 Ø4.96}
94.68% sRGB (Argyll 1.6.3 3D)
70.17% AdobeRGB 1998 (Argyll 1.6.3 3D)
70.2% AdobeRGB 1998 (Argyll 3D)
97.2% sRGB (Argyll 3D)
68.1% Display P3 (Argyll 3D)
Gamma: 2.22
CCT: 6277 K
| Lenovo Thinkpad X1 Yoga 20FQ-000QUS 14", 2560x1440 | Microsoft Surface Book Core i7 13.5", 3000x2000 | HP Spectre x360 13-4104ng 13.3", 2560x1440 | Lenovo ThinkPad Yoga 14 14", 1920x1080 | Sony Vaio Z Flip 13.3", 2560x1440 | |
|---|---|---|---|---|---|
| Display | -2% | -4% | 0% | ||
| Display P3 Coverage (%) | 68.1 | 66.3 -3% | 66.8 -2% | 68.7 1% | |
| sRGB Coverage (%) | 97.2 | 96 -1% | 92.8 -5% | 97.1 0% | |
| AdobeRGB 1998 Coverage (%) | 70.2 | 68 -3% | 67.3 -4% | 69.4 -1% | |
| Response Times | -8% | 37% | 6% | ||
| Response Time Grey 50% / Grey 80% * (ms) | 38 ? | 39 ? -3% | 24 ? 37% | 38.4 ? -1% | |
| Response Time Black / White * (ms) | 30.4 ? | 34 ? -12% | 19 ? 37% | 26.4 ? 13% | |
| PWM Frequency (Hz) | 219 ? | ||||
| Screen | 43% | 12% | 9% | 9% | |
| Brightness middle (cd/m²) | 284.7 | 438 54% | 324 14% | 286 0% | 355.2 25% |
| Brightness (cd/m²) | 272 | 414 52% | 324 19% | 274 1% | 354 30% |
| Brightness Distribution (%) | 89 | 88 -1% | 90 1% | 90 1% | 89 0% |
| Black Level * (cd/m²) | 0.383 | 0.25 35% | 0.34 11% | 0.3 22% | 0.285 26% |
| Contrast (:1) | 743 | 1752 136% | 953 28% | 953 28% | 1246 68% |
| Colorchecker dE 2000 * | 5.24 | 2.06 61% | 4.36 17% | 5.62 -7% | 9.56 -82% |
| Colorchecker dE 2000 max. * | 11.22 | 12.81 -14% | |||
| Greyscale dE 2000 * | 7.32 | 2.87 61% | 4.62 37% | 6.19 15% | 4.08 44% |
| Gamma | 2.22 99% | 2.44 90% | 2.18 101% | 2.35 94% | 2.33 94% |
| CCT | 6277 104% | 6820 95% | 6857 95% | 5606 116% | 6560 99% |
| Color Space (Percent of AdobeRGB 1998) (%) | 70.17 | 64 -9% | 60 -14% | 64.3 -8% | |
| Color Space (Percent of sRGB) (%) | 94.68 | 96 1% | 93 -2% | 97.1 3% | |
| Total Average (Program / Settings) | 11% /
26% | 15% /
12% | 9% /
9% | 5% /
7% |
* ... smaller is better
Display Response Times
| ↔ Response Time Black to White | ||
|---|---|---|
| 30.4 ms ... rise ↗ and fall ↘ combined | ↗ 6 ms rise | 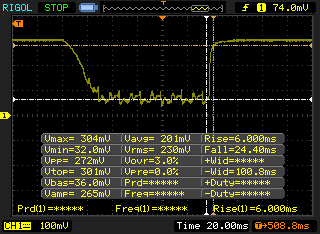 |
| ↘ 24.4 ms fall | ||
| The screen shows slow response rates in our tests and will be unsatisfactory for gamers. In comparison, all tested devices range from 0.1 (minimum) to 240 (maximum) ms. » 82 % of all devices are better. This means that the measured response time is worse than the average of all tested devices (19.8 ms). | ||
| ↔ Response Time 50% Grey to 80% Grey | ||
| 38 ms ... rise ↗ and fall ↘ combined | ↗ 15.2 ms rise | 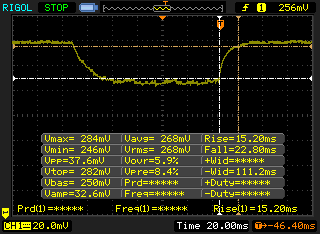 |
| ↘ 22.8 ms fall | ||
| The screen shows slow response rates in our tests and will be unsatisfactory for gamers. In comparison, all tested devices range from 0.165 (minimum) to 636 (maximum) ms. » 55 % of all devices are better. This means that the measured response time is worse than the average of all tested devices (31 ms). | ||
Screen Flickering / PWM (Pulse-Width Modulation)
| Screen flickering / PWM detected | 219 Hz | ≤ 99 % brightness setting | 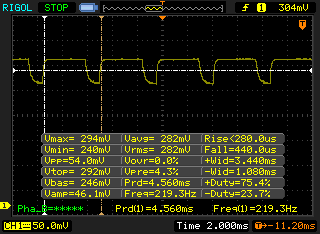 |
The display backlight flickers at 219 Hz (worst case, e.g., utilizing PWM) Flickering detected at a brightness setting of 99 % and below. There should be no flickering or PWM above this brightness setting. The frequency of 219 Hz is relatively low, so sensitive users will likely notice flickering and experience eyestrain at the stated brightness setting and below. In comparison: 52 % of all tested devices do not use PWM to dim the display. If PWM was detected, an average of 7757 (minimum: 5 - maximum: 343500) Hz was measured. | |||
| Cinebench R15 | |
| CPU Single 64Bit (sort by value) | |
| Lenovo Thinkpad X1 Yoga 20FQ-000QUS | |
| HP Spectre x360 13-4104ng | |
| Sony Vaio Z Flip | |
| Microsoft Surface Book Core i7 | |
| Asus Zenbook UX303UA-R4051T | |
| CPU Multi 64Bit (sort by value) | |
| Lenovo Thinkpad X1 Yoga 20FQ-000QUS | |
| HP Spectre x360 13-4104ng | |
| Sony Vaio Z Flip | |
| Microsoft Surface Book Core i7 | |
| Asus Zenbook UX303UA-R4051T | |
| wPrime 2.10 - 1024m (sort by value) | |
| Lenovo Thinkpad X1 Yoga 20FQ-000QUS | |
| HP Spectre x360 13-4104ng | |
| Sony Vaio Z Flip | |
| Super Pi Mod 1.5 XS 32M - 32M (sort by value) | |
| Lenovo Thinkpad X1 Yoga 20FQ-000QUS | |
| HP Spectre x360 13-4104ng | |
| Sony Vaio Z Flip | |
* ... smaller is better
| PCMark 8 | |
| Home Score Accelerated v2 (sort by value) | |
| Lenovo Thinkpad X1 Yoga 20FQ-000QUS | |
| Asus Zenbook UX303UA-R4051T | |
| Microsoft Surface Book Core i7 | |
| Work Score Accelerated v2 (sort by value) | |
| Lenovo Thinkpad X1 Yoga 20FQ-000QUS | |
| Asus Zenbook UX303UA-R4051T | |
| Microsoft Surface Book Core i7 | |
| PCMark 8 Home Score Accelerated v2 | 3137 points | |
| PCMark 8 Work Score Accelerated v2 | 3986 points | |
Help | ||
| Lenovo Thinkpad X1 Yoga 20FQ-000QUS HD Graphics 520, 6500U, Samsung SSD PM871 MZNLN512HCJH | Sony Vaio Z Flip Iris Graphics 550, 6567U, Samsung SM951 MZVPV256 m.2 | Lenovo ThinkPad Yoga 14 GeForce 840M, 5500U, Samsung SSD PM851 512 GB MZ7TE512HMHP | Microsoft Surface Book Core i7 Maxwell GPU (940M, GDDR5), 6600U, Samsung MZFLV512 NVMe | HP Spectre x360 15-ap011dx HD Graphics 520, 6200U, Liteon L8H-256V2G | |
|---|---|---|---|---|---|
| AS SSD | 111% | -7% | 81% | -13% | |
| Copy Game MB/s (MB/s) | 236.4 | 639 170% | 208.1 -12% | ||
| Copy Program MB/s (MB/s) | 196.5 | 349.2 78% | 185.6 -6% | ||
| Copy ISO MB/s (MB/s) | 258.4 | 731 183% | 224.2 -13% | ||
| Score Total (Points) | 1068 | 2323 118% | 1027 -4% | 2298 115% | 882 -17% |
| Score Write (Points) | 382 | 559 46% | 368 -4% | 683 79% | 353 -8% |
| Score Read (Points) | 449 | 1187 164% | 432 -4% | 1090 143% | 352 -22% |
| Access Time Write * (ms) | 0.046 | 0.031 33% | 0.056 -22% | 0.033 28% | 0.05 -9% |
| Access Time Read * (ms) | 0.058 | 0.039 33% | 0.048 17% | 0.067 -16% | |
| 4K-64 Write (MB/s) | 261.9 | 326.4 25% | 254 -3% | 520 99% | 252.9 -3% |
| 4K-64 Read (MB/s) | 369.1 | 949 157% | 358 -3% | 919 149% | 274.8 -26% |
| 4K Write (MB/s) | 75.7 | 121.8 61% | 73 -4% | 109 44% | 74.1 -2% |
| 4K Read (MB/s) | 30.35 | 47.59 57% | 26 -14% | 37.25 23% | 26 -14% |
| Seq Write (MB/s) | 447.5 | 1107 147% | 417 -7% | 545 22% | 263.2 -41% |
| Seq Read (MB/s) | 490.1 | 1896 287% | 484 -1% | 1342 174% | 513 5% |
* ... smaller is better

| 3DMark 11 - 1280x720 Performance (sort by value) | |
| Lenovo Thinkpad X1 Yoga 20FQ-000QUS | |
| Sony Vaio Z Flip | |
| HP Spectre x360 13-4104ng | |
| HP Spectre x360 13-4104ng | |
| Microsoft Surface Book Core i7 | |
| Asus Zenbook UX303UA-R4051T | |
| 3DMark | |
| 1920x1080 Fire Strike Score (sort by value) | |
| Sony Vaio Z Flip | |
| HP Spectre x360 13-4104ng | |
| HP Spectre x360 13-4104ng | |
| Microsoft Surface Book Core i7 | |
| Asus Zenbook UX303UA-R4051T | |
| 1280x720 Cloud Gate Standard Score (sort by value) | |
| Lenovo Thinkpad X1 Yoga 20FQ-000QUS | |
| Sony Vaio Z Flip | |
| HP Spectre x360 13-4104ng | |
| HP Spectre x360 13-4104ng | |
| Microsoft Surface Book Core i7 | |
| Asus Zenbook UX303UA-R4051T | |
| 1280x720 Ice Storm Standard Score (sort by value) | |
| Sony Vaio Z Flip | |
| HP Spectre x360 13-4104ng | |
| HP Spectre x360 13-4104ng | |
| Microsoft Surface Book Core i7 | |
| Asus Zenbook UX303UA-R4051T | |
| 3DMark 11 Performance | 1541 points | |
| 3DMark Cloud Gate Standard Score | 5745 points | |
Help | ||
| low | med. | high | ultra | |
|---|---|---|---|---|
| Tomb Raider (2013) | 71.6 | 38.8 | 25.1 | 11.2 |
| BioShock Infinite (2013) | 50.5 | 28.2 | 21.1 | 6.4 |
Noise level
| Idle |
| 28.8 / 28.8 / 28.8 dB(A) |
| Load |
| 35.2 / 35.2 dB(A) |
 | ||
30 dB silent 40 dB(A) audible 50 dB(A) loud |
||
min: | ||
(±) The maximum temperature on the upper side is 42.8 °C / 109 F, compared to the average of 35.4 °C / 96 F, ranging from 19.6 to 60 °C for the class Convertible.
(-) The bottom heats up to a maximum of 49.4 °C / 121 F, compared to the average of 36.9 °C / 98 F
(+) In idle usage, the average temperature for the upper side is 29.1 °C / 84 F, compared to the device average of 30.3 °C / 87 F.
(+) The palmrests and touchpad are cooler than skin temperature with a maximum of 28.2 °C / 82.8 F and are therefore cool to the touch.
(±) The average temperature of the palmrest area of similar devices was 28 °C / 82.4 F (-0.2 °C / -0.4 F).
| Off / Standby | |
| Idle | |
| Load |
|
Key:
min: | |
| Lenovo Thinkpad X1 Yoga 20FQ-000QUS HD Graphics 520, 6500U, Samsung SSD PM871 MZNLN512HCJH | HP Spectre x360 13-4104ng HD Graphics 520, 6200U, Samsung SSD PM851 256 GB MZNTE256HMHP | Lenovo ThinkPad Yoga 14 GeForce 840M, 5500U, Samsung SSD PM851 512 GB MZ7TE512HMHP | Microsoft Surface Book Core i7 Maxwell GPU (940M, GDDR5), 6600U, Samsung MZFLV512 NVMe | Sony Vaio Z Flip Iris Graphics 550, 6567U, Samsung SM951 MZVPV256 m.2 | |
|---|---|---|---|---|---|
| Battery runtime | 41% | -19% | 83% | 22% | |
| Reader / Idle (h) | 15.4 | 12.5 -19% | 15.8 3% | ||
| WiFi v1.3 (h) | 5.9 | 8.3 41% | 10.8 83% | 7.5 27% | |
| Load (h) | 2 | 2.7 35% | |||
| WiFi (h) | 5.9 |
Pros
Cons
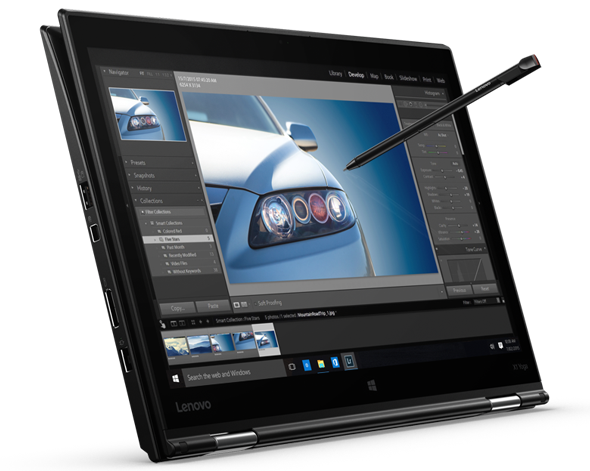
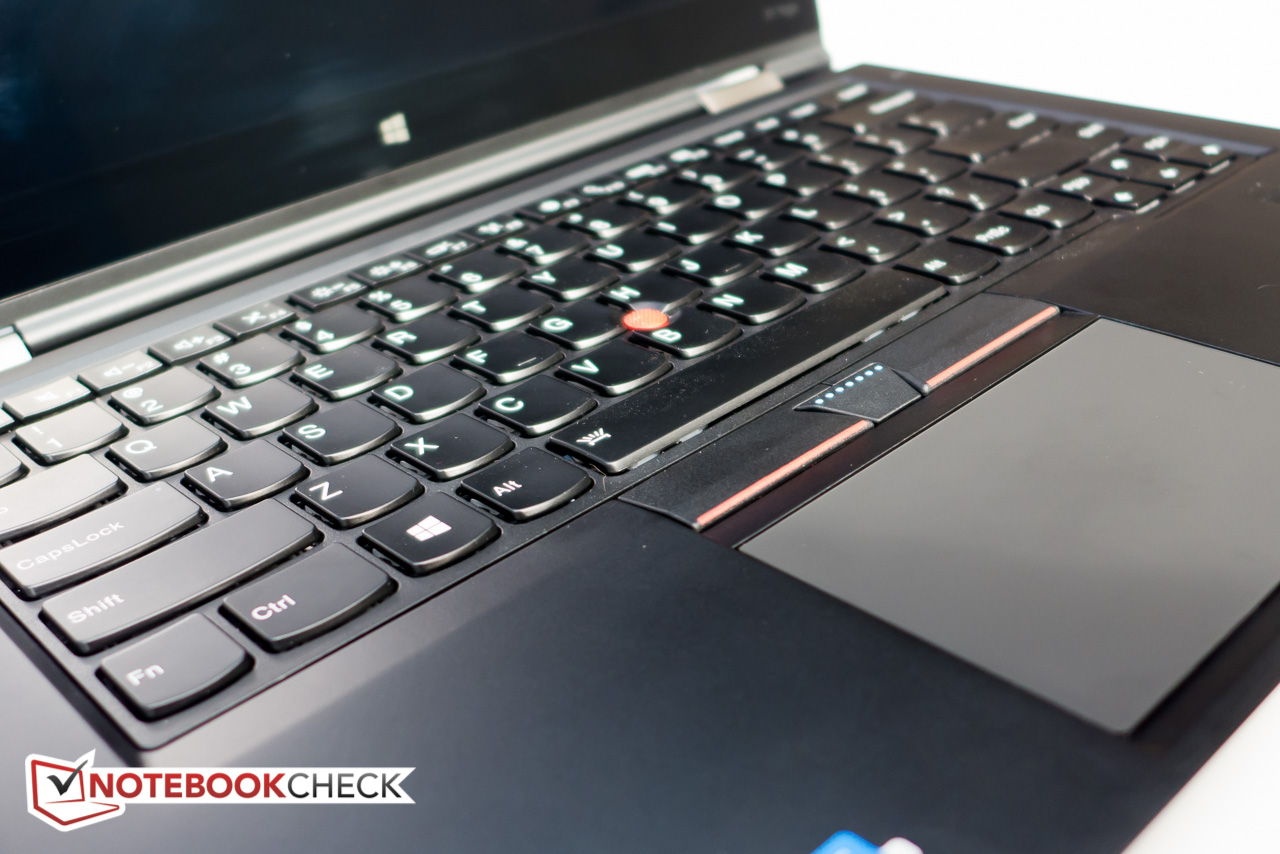
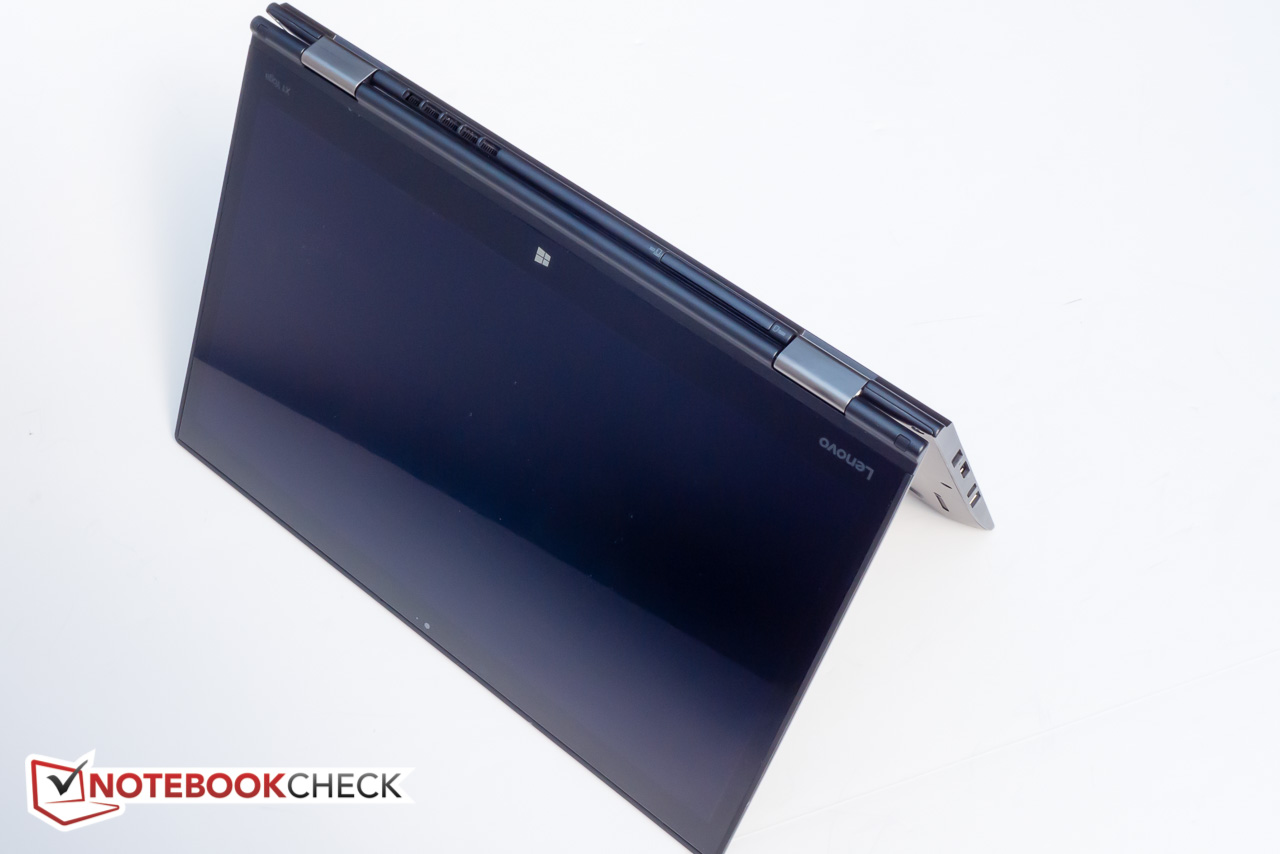
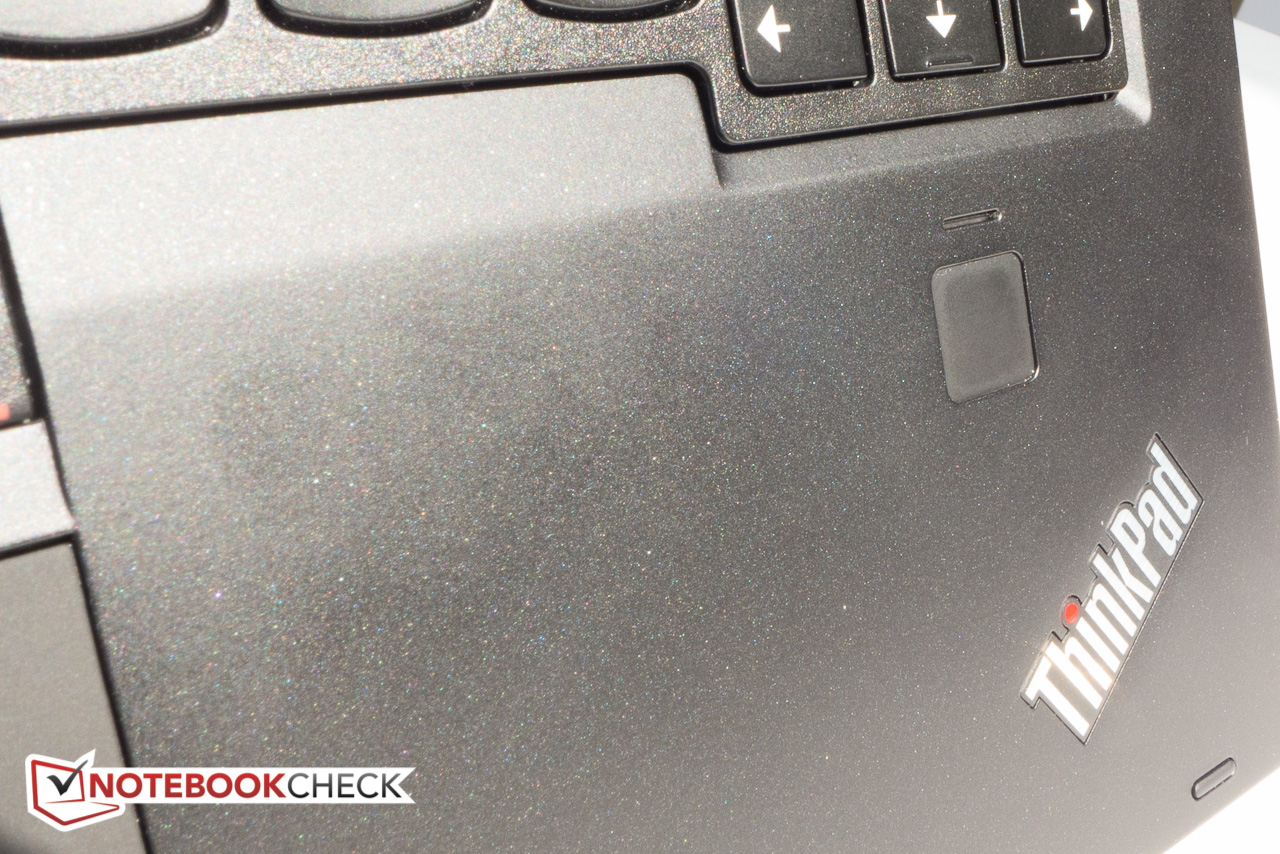
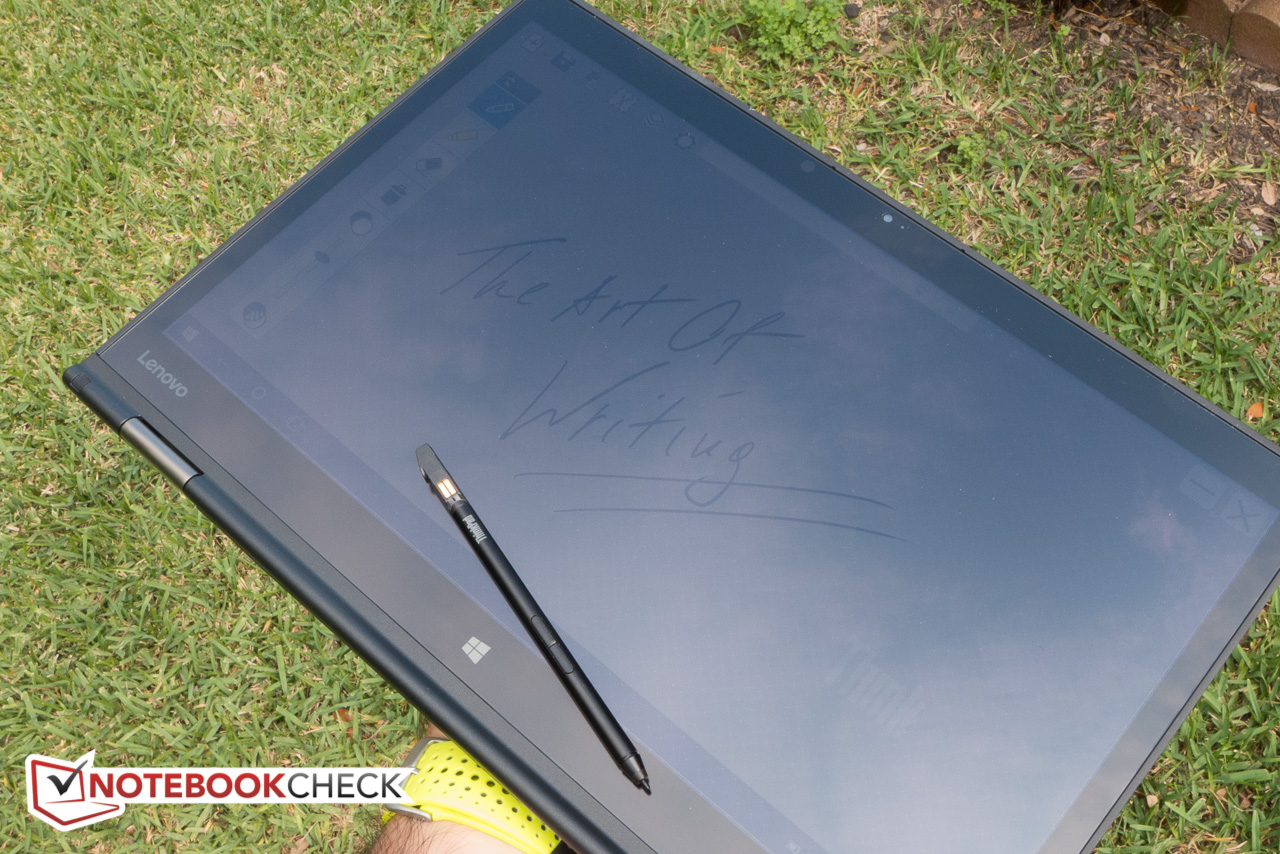
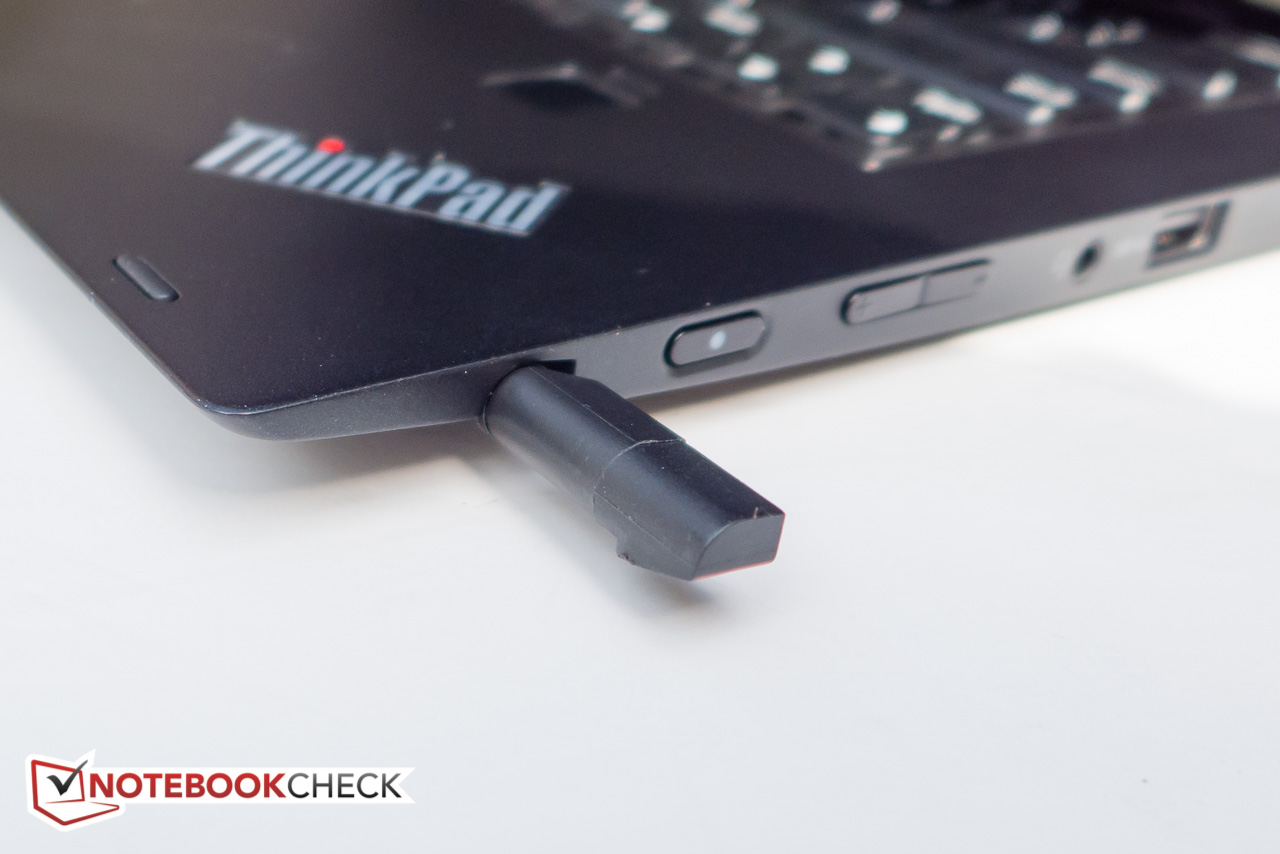
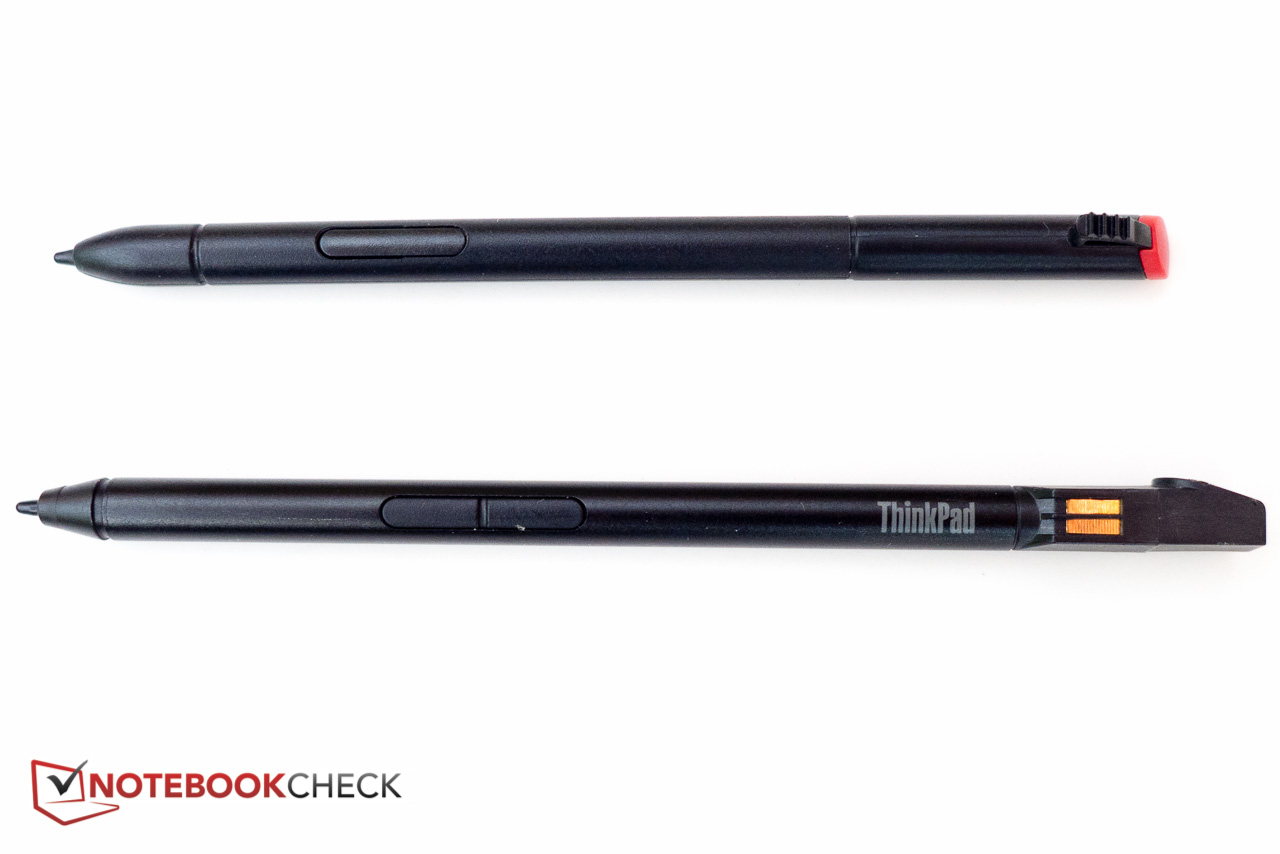
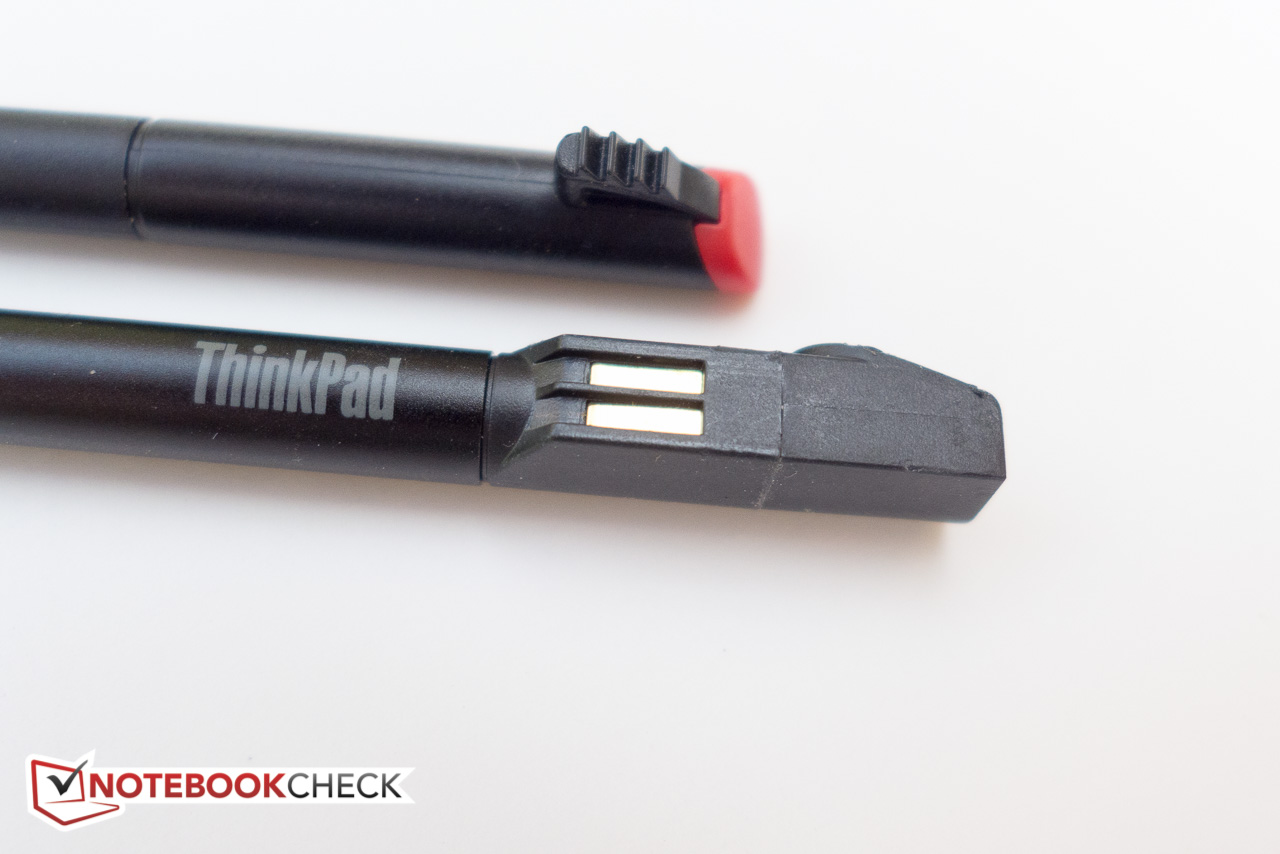
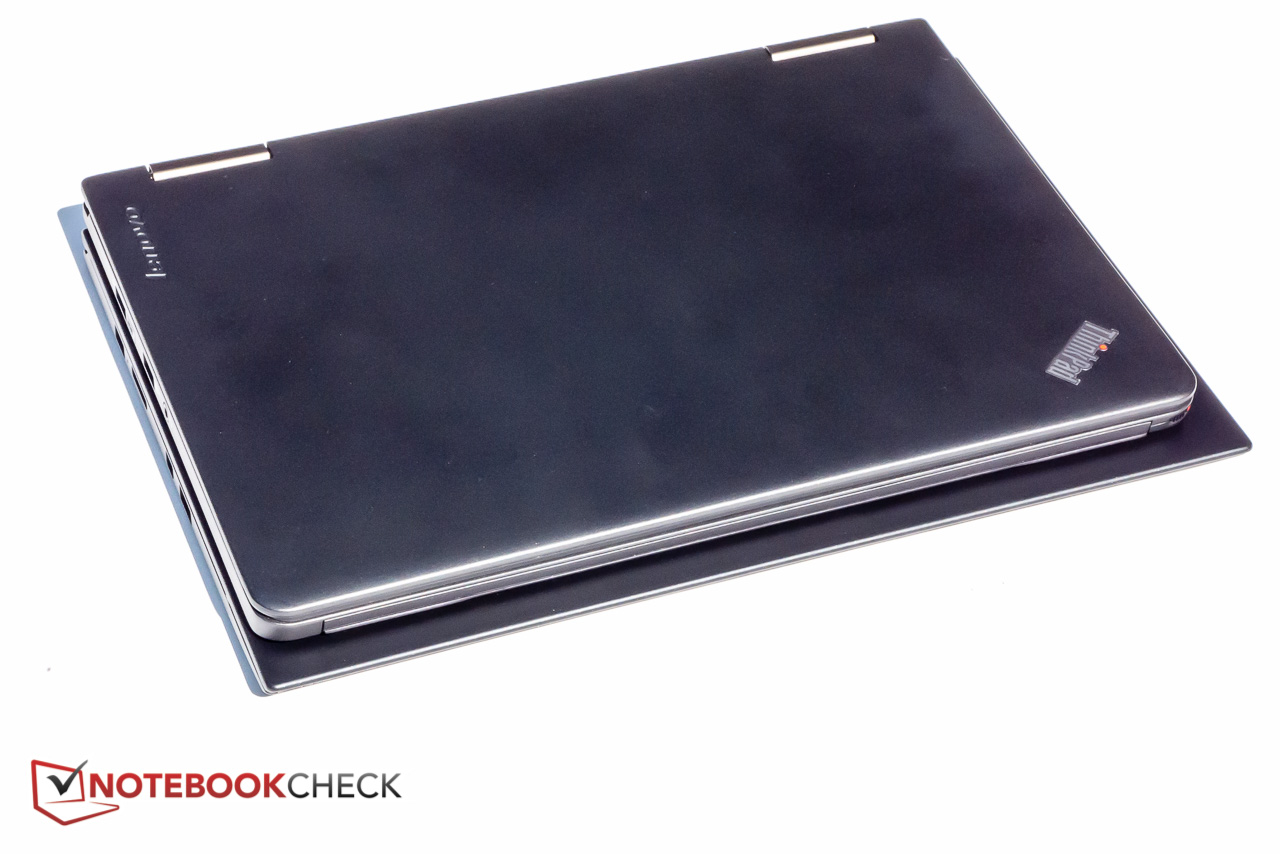
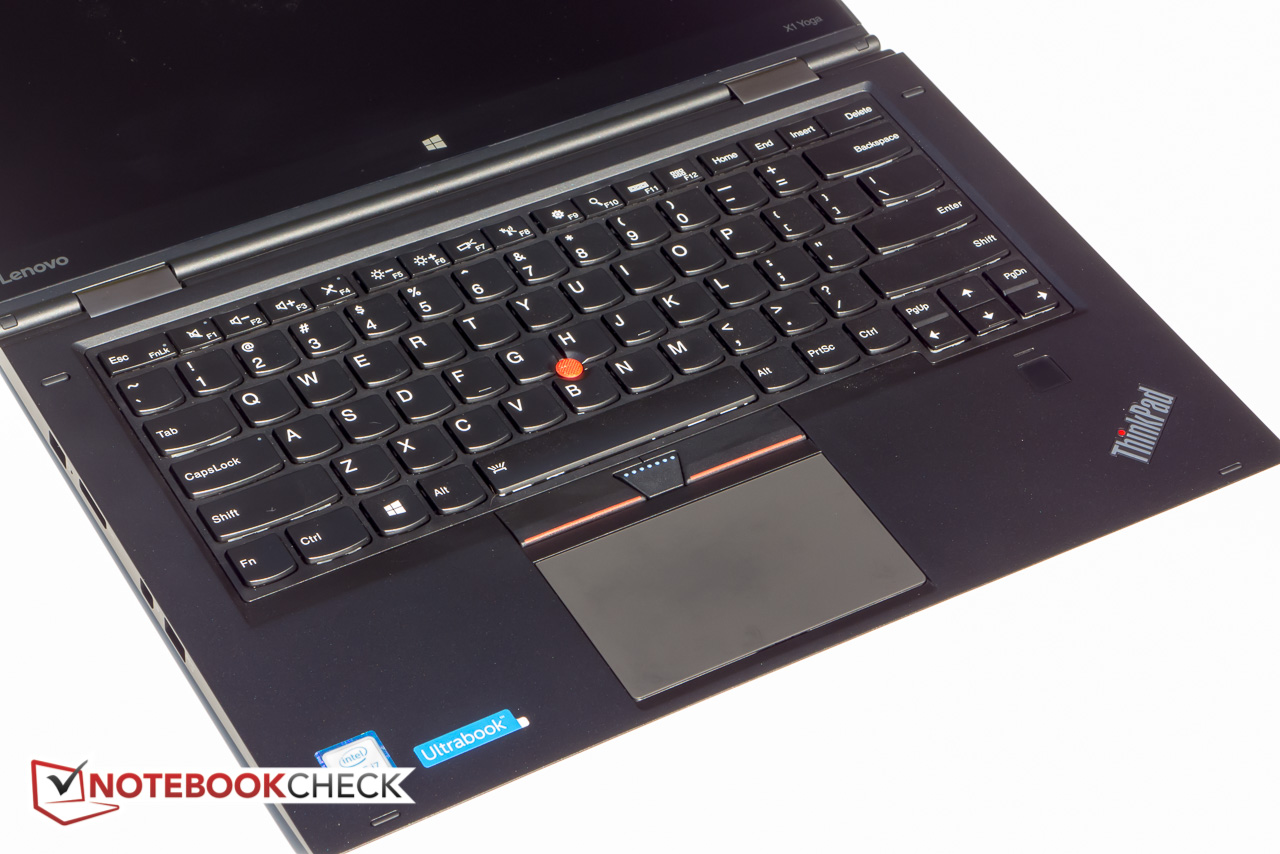
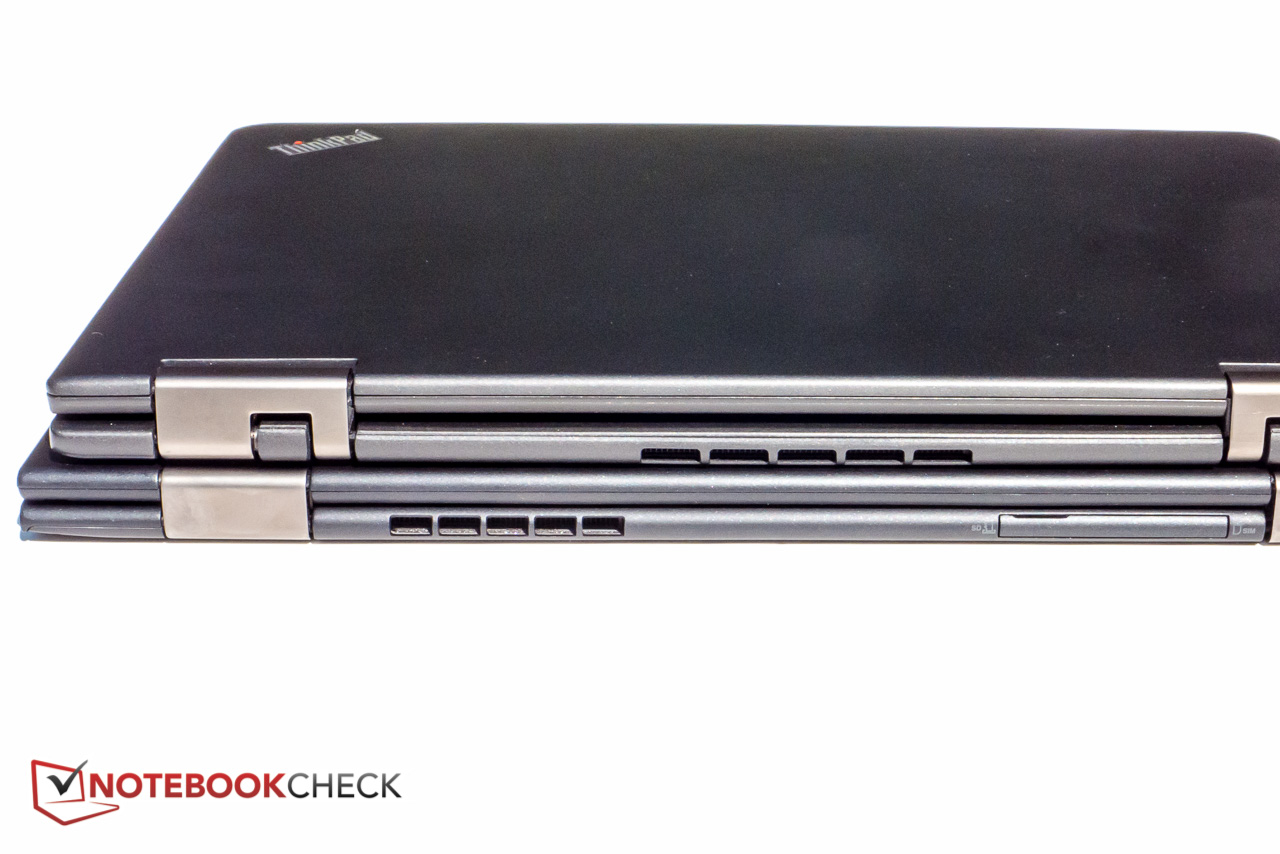
整体上,联想X1 Yoga是一款优秀且设计合理的商务变形本,尽管它1700美元(约11047人民币)的售价绝不算便宜。Yoga继承了“标准”X1的一些特性:它的机身由碳纤维和镁合金制成,不仅轻盈纤薄,还搭配了360度旋转转轴,可以支持笔记本电脑模式,帐篷模式,简报模式和平板模式。主动式手写笔式相对Thinkpad Yoga 12的一大进步,它仍然同样小巧,可以储存在机身之内。当然手写笔对平板模式的帮助很大——但是长时间握着一台14寸的笔记本电脑并不是很容易。它的键盘延续了Thinkpad品质,触控板/指点杆的搭配也同样出色。
它的屏幕在校对之后可以说是联想设备中色彩准确的之一。它的色域覆盖范围也很优秀,遗憾的是最大亮度略低。
Thinkpad X1 Yoga成功实现了设计初衷,而价位也不低。
希望笔记本电脑可以用作平板的用户可以考虑搭配可拆卸键盘底座的Surface Book,不过它的售价更高。惠普Spectre x360 13可能不太适合商务用途,但配置相同而售价仅1200美元(约7798人民币)让它也值得推荐。联想自家的Thinkpad Yoga 460与X1 Yoga定位相当,不过它较为笨重,售价也更亲民。较老的Thinkpad Yoga 14依然值得参考:搭配全高清屏幕,独立显卡,前代处理器,现在的售价仅900美元(约5848人民币)。
注:本文是基于完整评测的缩减版本,阅读完整的英文评测,请点击这里。
Lenovo Thinkpad X1 Yoga 20FQ-000QUS
- 04/18/2016 v5.1 (old)
Bernhard Pechlaner
Price comparison
