HP Elitebook x360 1040 G5 (i7-8650U, FHD) 翻转本
| |||||||||||||||||||||||||
Brightness Distribution: 89 %
Center on Battery: 416.3 cd/m²
Contrast: 1436:1 (Black: 0.29 cd/m²)
ΔE ColorChecker Calman: 2.69 | ∀{0.5-29.43 Ø4.73}
calibrated: 2.13
ΔE Greyscale Calman: 2.9 | ∀{0.09-98 Ø4.97}
94.5% sRGB (Argyll 1.6.3 3D)
60.1% AdobeRGB 1998 (Argyll 1.6.3 3D)
65.5% AdobeRGB 1998 (Argyll 3D)
94.1% sRGB (Argyll 3D)
64.3% Display P3 (Argyll 3D)
Gamma: 2.4
CCT: 6623 K
| HP Elitebook x360 1040 G5 AU Optronics AUO533D, IPS, 14", 1920x1080 | HP Elitebook 1040 G4-2XU40UT Chi Mei CMN14D7, IPS, 14", 1920x1080 | Lenovo Yoga C930-13IKB B139HAN03_0, IPS, 13.9", 1920x1080 | Huawei Matebook X Pro i5 Tianma XM, IPS, 13.9", 3000x2000 | Dell XPS 13 9380 2019 ID: AUO 282B B133ZAN Dell: 90NTH, IPS, 13.3", 3840x2160 | Microsoft Surface Pro 6, Core i7, 512 GB LGPhilips LP123WQ112604, IPS, 12.3", 2736x1824 | |
|---|---|---|---|---|---|---|
| Display | 4% | 1% | 2% | 0% | 3% | |
| Display P3 Coverage (%) | 64.3 | 66.8 4% | 64.3 0% | 65.9 2% | 64.7 1% | 67.1 4% |
| sRGB Coverage (%) | 94.1 | 97.1 3% | 94.6 1% | 95.2 1% | 93.1 -1% | 95.5 1% |
| AdobeRGB 1998 Coverage (%) | 65.5 | 69 5% | 66.2 1% | 67.6 3% | 65.3 0% | 67.9 4% |
| Response Times | 32% | 31% | 35% | 7% | 33% | |
| Response Time Grey 50% / Grey 80% * (ms) | 70.8 ? | 34.4 ? 51% | 40.8 ? 42% | 40.4 ? 43% | 58 ? 18% | 43 ? 39% |
| Response Time Black / White * (ms) | 34.4 ? | 30 ? 13% | 27.6 ? 20% | 25.6 ? 26% | 36 ? -5% | 25 ? 27% |
| PWM Frequency (Hz) | 735 ? | 26040 ? | 22000 ? | |||
| Screen | -17% | -51% | -19% | -18% | -7% | |
| Brightness middle (cd/m²) | 416.3 | 295.9 -29% | 316 -24% | 442.7 6% | 404 -3% | 484 16% |
| Brightness (cd/m²) | 400 | 287 -28% | 291 -27% | 428 7% | 389 -3% | 473 18% |
| Brightness Distribution (%) | 89 | 87 -2% | 83 -7% | 84 -6% | 85 -4% | 91 2% |
| Black Level * (cd/m²) | 0.29 | 0.23 21% | 0.36 -24% | 0.31 -7% | 0.37 -28% | 0.33 -14% |
| Contrast (:1) | 1436 | 1287 -10% | 878 -39% | 1428 -1% | 1092 -24% | 1467 2% |
| Colorchecker dE 2000 * | 2.69 | 2.83 -5% | 5.9 -119% | 2.24 17% | 3.72 -38% | 4.29 -59% |
| Colorchecker dE 2000 max. * | 4.95 | 7.34 -48% | 12.9 -161% | 7.19 -45% | 7.38 -49% | 6.46 -31% |
| Colorchecker dE 2000 calibrated * | 2.13 | 1.3 39% | 1.11 48% | 2.06 3% | 1.34 37% | |
| Greyscale dE 2000 * | 2.9 | 5.2 -79% | 8.6 -197% | 9.7 -234% | 4.44 -53% | 4.3 -48% |
| Gamma | 2.4 92% | 2.28 96% | 2.1 105% | 1.42 155% | 2.34 94% | 2.51 88% |
| CCT | 6623 98% | 7056 92% | 6854 95% | 6227 104% | 7095 92% | 7315 89% |
| Color Space (Percent of AdobeRGB 1998) (%) | 60.1 | 63 5% | 60.7 1% | 61.6 2% | 60 0% | 62 3% |
| Color Space (Percent of sRGB) (%) | 94.5 | 97 3% | 94.5 0% | 95 1% | 93 -2% | 95 1% |
| Total Average (Program / Settings) | 6% /
-6% | -6% /
-31% | 6% /
-9% | -4% /
-12% | 10% /
0% |
* ... smaller is better
Display Response Times
| ↔ Response Time Black to White | ||
|---|---|---|
| 34.4 ms ... rise ↗ and fall ↘ combined | ↗ 18.8 ms rise | 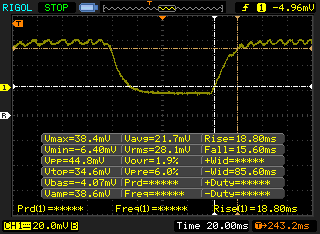 |
| ↘ 15.6 ms fall | ||
| The screen shows slow response rates in our tests and will be unsatisfactory for gamers. In comparison, all tested devices range from 0.1 (minimum) to 240 (maximum) ms. » 92 % of all devices are better. This means that the measured response time is worse than the average of all tested devices (19.9 ms). | ||
| ↔ Response Time 50% Grey to 80% Grey | ||
| 70.8 ms ... rise ↗ and fall ↘ combined | ↗ 34.8 ms rise | 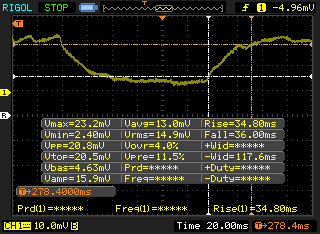 |
| ↘ 36 ms fall | ||
| The screen shows slow response rates in our tests and will be unsatisfactory for gamers. In comparison, all tested devices range from 0.165 (minimum) to 636 (maximum) ms. » 99 % of all devices are better. This means that the measured response time is worse than the average of all tested devices (31.1 ms). | ||
Screen Flickering / PWM (Pulse-Width Modulation)
| Screen flickering / PWM detected | 735 Hz | ≤ 100 % brightness setting | 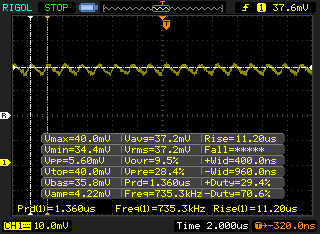 |
The display backlight flickers at 735 Hz (worst case, e.g., utilizing PWM) Flickering detected at a brightness setting of 100 % and below. There should be no flickering or PWM above this brightness setting. The frequency of 735 Hz is quite high, so most users sensitive to PWM should not notice any flickering. In comparison: 52 % of all tested devices do not use PWM to dim the display. If PWM was detected, an average of 7798 (minimum: 5 - maximum: 343500) Hz was measured. | |||
| Cinebench R15 | |
| CPU Single 64Bit | |
| Razer Blade Stealth i7-8565U | |
| HP Elitebook x360 1040 G5 | |
| Lenovo Yoga C930-13IKB 81C4 | |
| HP Elitebook 1040 G4-2XU40UT | |
| Lenovo Legion Y730-15ICH i5-8300H | |
| Average Intel Core i7-8650U (128 - 178, n=17) | |
| Dell XPS 13 9360 FHD i7 Iris | |
| Dell XPS 13 9380 2019 | |
| Lenovo ThinkPad 13 20J1005TPB | |
| Huawei Matebook X Pro i5 | |
| HP EliteBook 755 G5 3UN79EA | |
| HP x2 210 G2 | |
| CPU Multi 64Bit | |
| Lenovo Legion Y730-15ICH i5-8300H | |
| Razer Blade Stealth i7-8565U | |
| Dell XPS 13 9380 2019 | |
| HP Elitebook 1040 G4-2XU40UT | |
| Lenovo Yoga C930-13IKB 81C4 | |
| HP EliteBook 755 G5 3UN79EA | |
| Average Intel Core i7-8650U (451 - 675, n=19) | |
| HP Elitebook x360 1040 G5 | |
| Huawei Matebook X Pro i5 | |
| Lenovo ThinkPad 13 20J1005TPB | |
| Dell XPS 13 9360 FHD i7 Iris | |
| HP x2 210 G2 | |
| PCMark 8 Home Score Accelerated v2 | 3308 points | |
| PCMark 8 Work Score Accelerated v2 | 4558 points | |
| PCMark 10 Score | 4078 points | |
Help | ||
| HP Elitebook x360 1040 G5 Samsung SSD PM981 MZVLB512HAJQ | HP Elitebook 1040 G4-2XU40UT Toshiba XG4 NVMe (THNSN5512GPUK) | Lenovo Yoga C930-13IKB SK hynix PC401 HFS256GD9TNG | Huawei Matebook X Pro i5 Samsung PM961 MZVLW256HEHP | Microsoft Surface Pro 6 i5 256GB Toshiba KBG30ZPZ256G | Dell XPS 13 9380 2019 SK hynix PC401 HFS256GD9TNG | |
|---|---|---|---|---|---|---|
| AS SSD | -45% | -52% | -25% | -111% | -42% | |
| Seq Read (MB/s) | 1816 | 1585 -13% | 1850 2% | 2416 33% | 1169 -36% | 2035 12% |
| Seq Write (MB/s) | 1270 | 863 -32% | 661 -48% | 1170 -8% | 171 -87% | 658 -48% |
| 4K Read (MB/s) | 46.25 | 38.49 -17% | 38.04 -18% | 48.33 4% | 29.51 -36% | 39.74 -14% |
| 4K Write (MB/s) | 104.1 | 100.1 -4% | 95 -9% | 103.1 -1% | 83.7 -20% | 105.7 2% |
| 4K-64 Read (MB/s) | 1342 | 782 -42% | 434.3 -68% | 1039 -23% | 330 -75% | 461 -66% |
| 4K-64 Write (MB/s) | 1209 | 662 -45% | 266.3 -78% | 399.6 -67% | 130.5 -89% | 300.1 -75% |
| Access Time Read * (ms) | 0.043 | 0.105 -144% | 0.069 -60% | 0.058 -35% | 0.069 -60% | 0.061 -42% |
| Access Time Write * (ms) | 0.035 | 0.038 -9% | 0.056 -60% | 0.036 -3% | 0.276 -689% | 0.051 -46% |
| Score Read (Points) | 1569 | 979 -38% | 657 -58% | 1329 -15% | 476 -70% | 704 -55% |
| Score Write (Points) | 1440 | 848 -41% | 427 -70% | 620 -57% | 231 -84% | 471 -67% |
| Score Total (Points) | 3790 | 2299 -39% | 1373 -64% | 2575 -32% | 911 -76% | 1479 -61% |
| Copy ISO MB/s (MB/s) | 2034 | 534 -74% | 539 -74% | 739 -64% | 231.9 -89% | 893 -56% |
| Copy Program MB/s (MB/s) | 450.3 | 133.7 -70% | 209.7 -53% | 312.3 -31% | 218.1 -52% | 287.9 -36% |
| Copy Game MB/s (MB/s) | 1024 | 394.2 -62% | 340 -67% | 486.3 -53% | 165.3 -84% | 618 -40% |
* ... smaller is better

| 3DMark 11 | |
| 1280x720 Performance GPU | |
| Razer Blade Stealth i7-8565U | |
| Huawei Matebook X Pro i5 | |
| Lenovo ThinkPad 25 | |
| HP EliteBook 755 G5 3UN79EA | |
| Dell XPS 13 9360 FHD i7 Iris | |
| Microsoft Surface Pro 6, Core i7, 512 GB | |
| Lenovo Yoga C930-13IKB 81C4 | |
| HP Elitebook x360 1040 G5 | |
| Dell XPS 13 9380 2019 | |
| Average Intel UHD Graphics 620 (1144 - 3432, n=244) | |
| Lenovo Yoga C930-13IKB | |
| HP Elitebook 1040 G4-2XU40UT | |
| Lenovo ThinkPad 13 20J1005TPB | |
| HP x2 210 G2 | |
| 1280x720 Performance Combined | |
| Razer Blade Stealth i7-8565U | |
| Huawei Matebook X Pro i5 | |
| Lenovo ThinkPad 25 | |
| HP Elitebook x360 1040 G5 | |
| Lenovo Yoga C930-13IKB 81C4 | |
| Microsoft Surface Pro 6, Core i7, 512 GB | |
| Dell XPS 13 9360 FHD i7 Iris | |
| HP EliteBook 755 G5 3UN79EA | |
| HP Elitebook 1040 G4-2XU40UT | |
| Dell XPS 13 9380 2019 | |
| Average Intel UHD Graphics 620 (927 - 2505, n=244) | |
| Lenovo Yoga C930-13IKB | |
| Lenovo ThinkPad 13 20J1005TPB | |
| HP x2 210 G2 | |
| 3DMark - 1280x720 Cloud Gate Standard Graphics | |
| Razer Blade Stealth i7-8565U | |
| Huawei Matebook X Pro i5 | |
| Lenovo ThinkPad 25 | |
| Dell XPS 13 9360 FHD i7 Iris | |
| HP Elitebook x360 1040 G5 | |
| HP EliteBook 755 G5 3UN79EA | |
| Lenovo Yoga C930-13IKB 81C4 | |
| Microsoft Surface Pro 6, Core i7, 512 GB | |
| Dell XPS 13 9380 2019 | |
| Lenovo Yoga C930-13IKB | |
| HP Elitebook 1040 G4-2XU40UT | |
| Average Intel UHD Graphics 620 (6205 - 16400, n=225) | |
| Lenovo ThinkPad 13 20J1005TPB | |
| HP x2 210 G2 | |
| 3DMark 11 Performance | 2131 points | |
| 3DMark Cloud Gate Standard Score | 9217 points | |
Help | ||
| HP Elitebook x360 1040 G5 UHD Graphics 620, i7-8650U, Samsung SSD PM981 MZVLB512HAJQ | HP Elitebook 1040 G4-2XU40UT HD Graphics 630, i7-7820HQ, Toshiba XG4 NVMe (THNSN5512GPUK) | Lenovo Yoga C930-13IKB UHD Graphics 620, i5-8250U, SK hynix PC401 HFS256GD9TNG | Huawei Matebook X Pro i5 GeForce MX150, i5-8250U, Samsung PM961 MZVLW256HEHP | Microsoft Surface Pro 6, Core i7, 512 GB UHD Graphics 620, i7-8650U, Toshiba KBG30ZPZ512G | |
|---|---|---|---|---|---|
| Noise | 0% | -1% | -5% | -4% | |
| off / environment * (dB) | 28.3 | 28.2 -0% | 29.3 -4% | 27.9 1% | 30.3 -7% |
| Idle Minimum * (dB) | 28.3 | 28.2 -0% | 29.3 -4% | 27.9 1% | 30.3 -7% |
| Idle Average * (dB) | 28.3 | 28.2 -0% | 29.3 -4% | 27.9 1% | 30.3 -7% |
| Idle Maximum * (dB) | 28.3 | 28.2 -0% | 29.7 -5% | 27.9 1% | 30.3 -7% |
| Load Average * (dB) | 32.6 | 33.3 -2% | 31.8 2% | 36.2 -11% | 33.5 -3% |
| Load Maximum * (dB) | 36.6 | 35.3 4% | 32.7 11% | 45.2 -23% | 33.5 8% |
| Witcher 3 ultra * (dB) | 45 |
* ... smaller is better
Noise level
| Idle |
| 28.3 / 28.3 / 28.3 dB(A) |
| Load |
| 32.6 / 36.6 dB(A) |
 | ||
30 dB silent 40 dB(A) audible 50 dB(A) loud |
||
min: | ||
(+) The maximum temperature on the upper side is 38.2 °C / 101 F, compared to the average of 34.3 °C / 94 F, ranging from 21.2 to 62.5 °C for the class Office.
(-) The bottom heats up to a maximum of 48 °C / 118 F, compared to the average of 36.8 °C / 98 F
(+) In idle usage, the average temperature for the upper side is 22.6 °C / 73 F, compared to the device average of 29.5 °C / 85 F.
(+) The palmrests and touchpad are cooler than skin temperature with a maximum of 26.8 °C / 80.2 F and are therefore cool to the touch.
(±) The average temperature of the palmrest area of similar devices was 27.5 °C / 81.5 F (+0.7 °C / 1.3 F).
HP Elitebook x360 1040 G5 audio analysis
(±) | speaker loudness is average but good (80.9 dB)
Bass 100 - 315 Hz
(±) | reduced bass - on average 11.3% lower than median
(±) | linearity of bass is average (13.7% delta to prev. frequency)
Mids 400 - 2000 Hz
(+) | balanced mids - only 3.2% away from median
(+) | mids are linear (4.8% delta to prev. frequency)
Highs 2 - 16 kHz
(+) | balanced highs - only 3.6% away from median
(±) | linearity of highs is average (7.2% delta to prev. frequency)
Overall 100 - 16.000 Hz
(+) | overall sound is linear (13.1% difference to median)
Compared to same class
» 7% of all tested devices in this class were better, 2% similar, 92% worse
» The best had a delta of 7%, average was 21%, worst was 53%
Compared to all devices tested
» 13% of all tested devices were better, 3% similar, 84% worse
» The best had a delta of 4%, average was 24%, worst was 134%
Apple MacBook 12 (Early 2016) 1.1 GHz audio analysis
(+) | speakers can play relatively loud (83.6 dB)
Bass 100 - 315 Hz
(±) | reduced bass - on average 11.3% lower than median
(±) | linearity of bass is average (14.2% delta to prev. frequency)
Mids 400 - 2000 Hz
(+) | balanced mids - only 2.4% away from median
(+) | mids are linear (5.5% delta to prev. frequency)
Highs 2 - 16 kHz
(+) | balanced highs - only 2% away from median
(+) | highs are linear (4.5% delta to prev. frequency)
Overall 100 - 16.000 Hz
(+) | overall sound is linear (10.2% difference to median)
Compared to same class
» 7% of all tested devices in this class were better, 2% similar, 91% worse
» The best had a delta of 5%, average was 18%, worst was 53%
Compared to all devices tested
» 5% of all tested devices were better, 1% similar, 94% worse
» The best had a delta of 4%, average was 24%, worst was 134%
| Off / Standby | |
| Idle | |
| Load |
|
Key:
min: | |
| HP Elitebook x360 1040 G5 i7-8650U, UHD Graphics 620, Samsung SSD PM981 MZVLB512HAJQ, IPS, 1920x1080, 14" | HP Elitebook 1040 G4-2XU40UT i7-7820HQ, HD Graphics 630, Toshiba XG4 NVMe (THNSN5512GPUK), IPS, 1920x1080, 14" | Lenovo Yoga C930-13IKB i5-8250U, UHD Graphics 620, SK hynix PC401 HFS256GD9TNG, IPS, 1920x1080, 13.9" | Huawei Matebook X Pro i5 i5-8250U, GeForce MX150, Samsung PM961 MZVLW256HEHP, IPS, 3000x2000, 13.9" | Dell XPS 13 9380 2019 i5-8265U, UHD Graphics 620, SK hynix PC401 HFS256GD9TNG, IPS, 3840x2160, 13.3" | Microsoft Surface Pro 6, Core i7, 512 GB i7-8650U, UHD Graphics 620, Toshiba KBG30ZPZ512G, IPS, 2736x1824, 12.3" | |
|---|---|---|---|---|---|---|
| Power Consumption | -24% | -6% | -23% | -19% | 0% | |
| Idle Minimum * (Watt) | 2.7 | 5.1 -89% | 3.3 -22% | 3.5 -30% | 4.8 -78% | 3.2 -19% |
| Idle Average * (Watt) | 6.5 | 7 -8% | 6.8 -5% | 8.9 -37% | 8.6 -32% | 8.7 -34% |
| Idle Maximum * (Watt) | 11.5 | 11.7 -2% | 9.5 17% | 12.3 -7% | 10.4 10% | 10.4 10% |
| Load Average * (Watt) | 38.7 | 41.2 -6% | 40.8 -5% | 54.2 -40% | 37.9 2% | 29.2 25% |
| Load Maximum * (Watt) | 50.5 | 56.9 -13% | 57 -13% | 52.1 -3% | 48.5 4% | 40.8 19% |
| Witcher 3 ultra * (Watt) | 42.4 |
* ... smaller is better
| HP Elitebook x360 1040 G5 i7-8650U, UHD Graphics 620, 56 Wh | HP Elitebook 1040 G4-2XU40UT i7-7820HQ, HD Graphics 630, 67 Wh | Lenovo Yoga C930-13IKB i5-8250U, UHD Graphics 620, 60 Wh | Huawei Matebook X Pro i5 i5-8250U, GeForce MX150, 57.4 Wh | Dell XPS 13 9380 2019 i5-8265U, UHD Graphics 620, 52 Wh | Microsoft Surface Pro 6, Core i7, 512 GB i7-8650U, UHD Graphics 620, 45 Wh | |
|---|---|---|---|---|---|---|
| Battery runtime | -20% | -19% | -22% | -27% | -27% | |
| Reader / Idle (h) | 27.9 | 22.5 -19% | 23.9 -14% | 20.7 -26% | 17.2 -38% | 18.1 -35% |
| WiFi v1.3 (h) | 10.4 | 11.1 7% | 9.2 -12% | 9.3 -11% | 8.3 -20% | 8.5 -18% |
| Load (h) | 3.1 | 1.6 -48% | 2.1 -32% | 2.2 -29% | 2.4 -23% | 2.2 -29% |
Pros
Cons
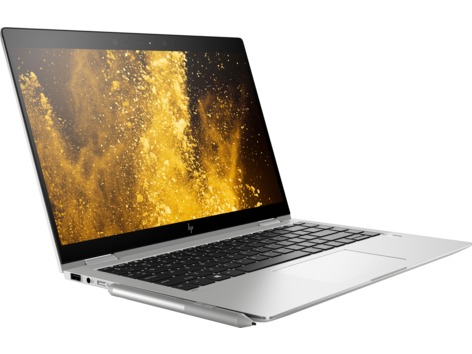
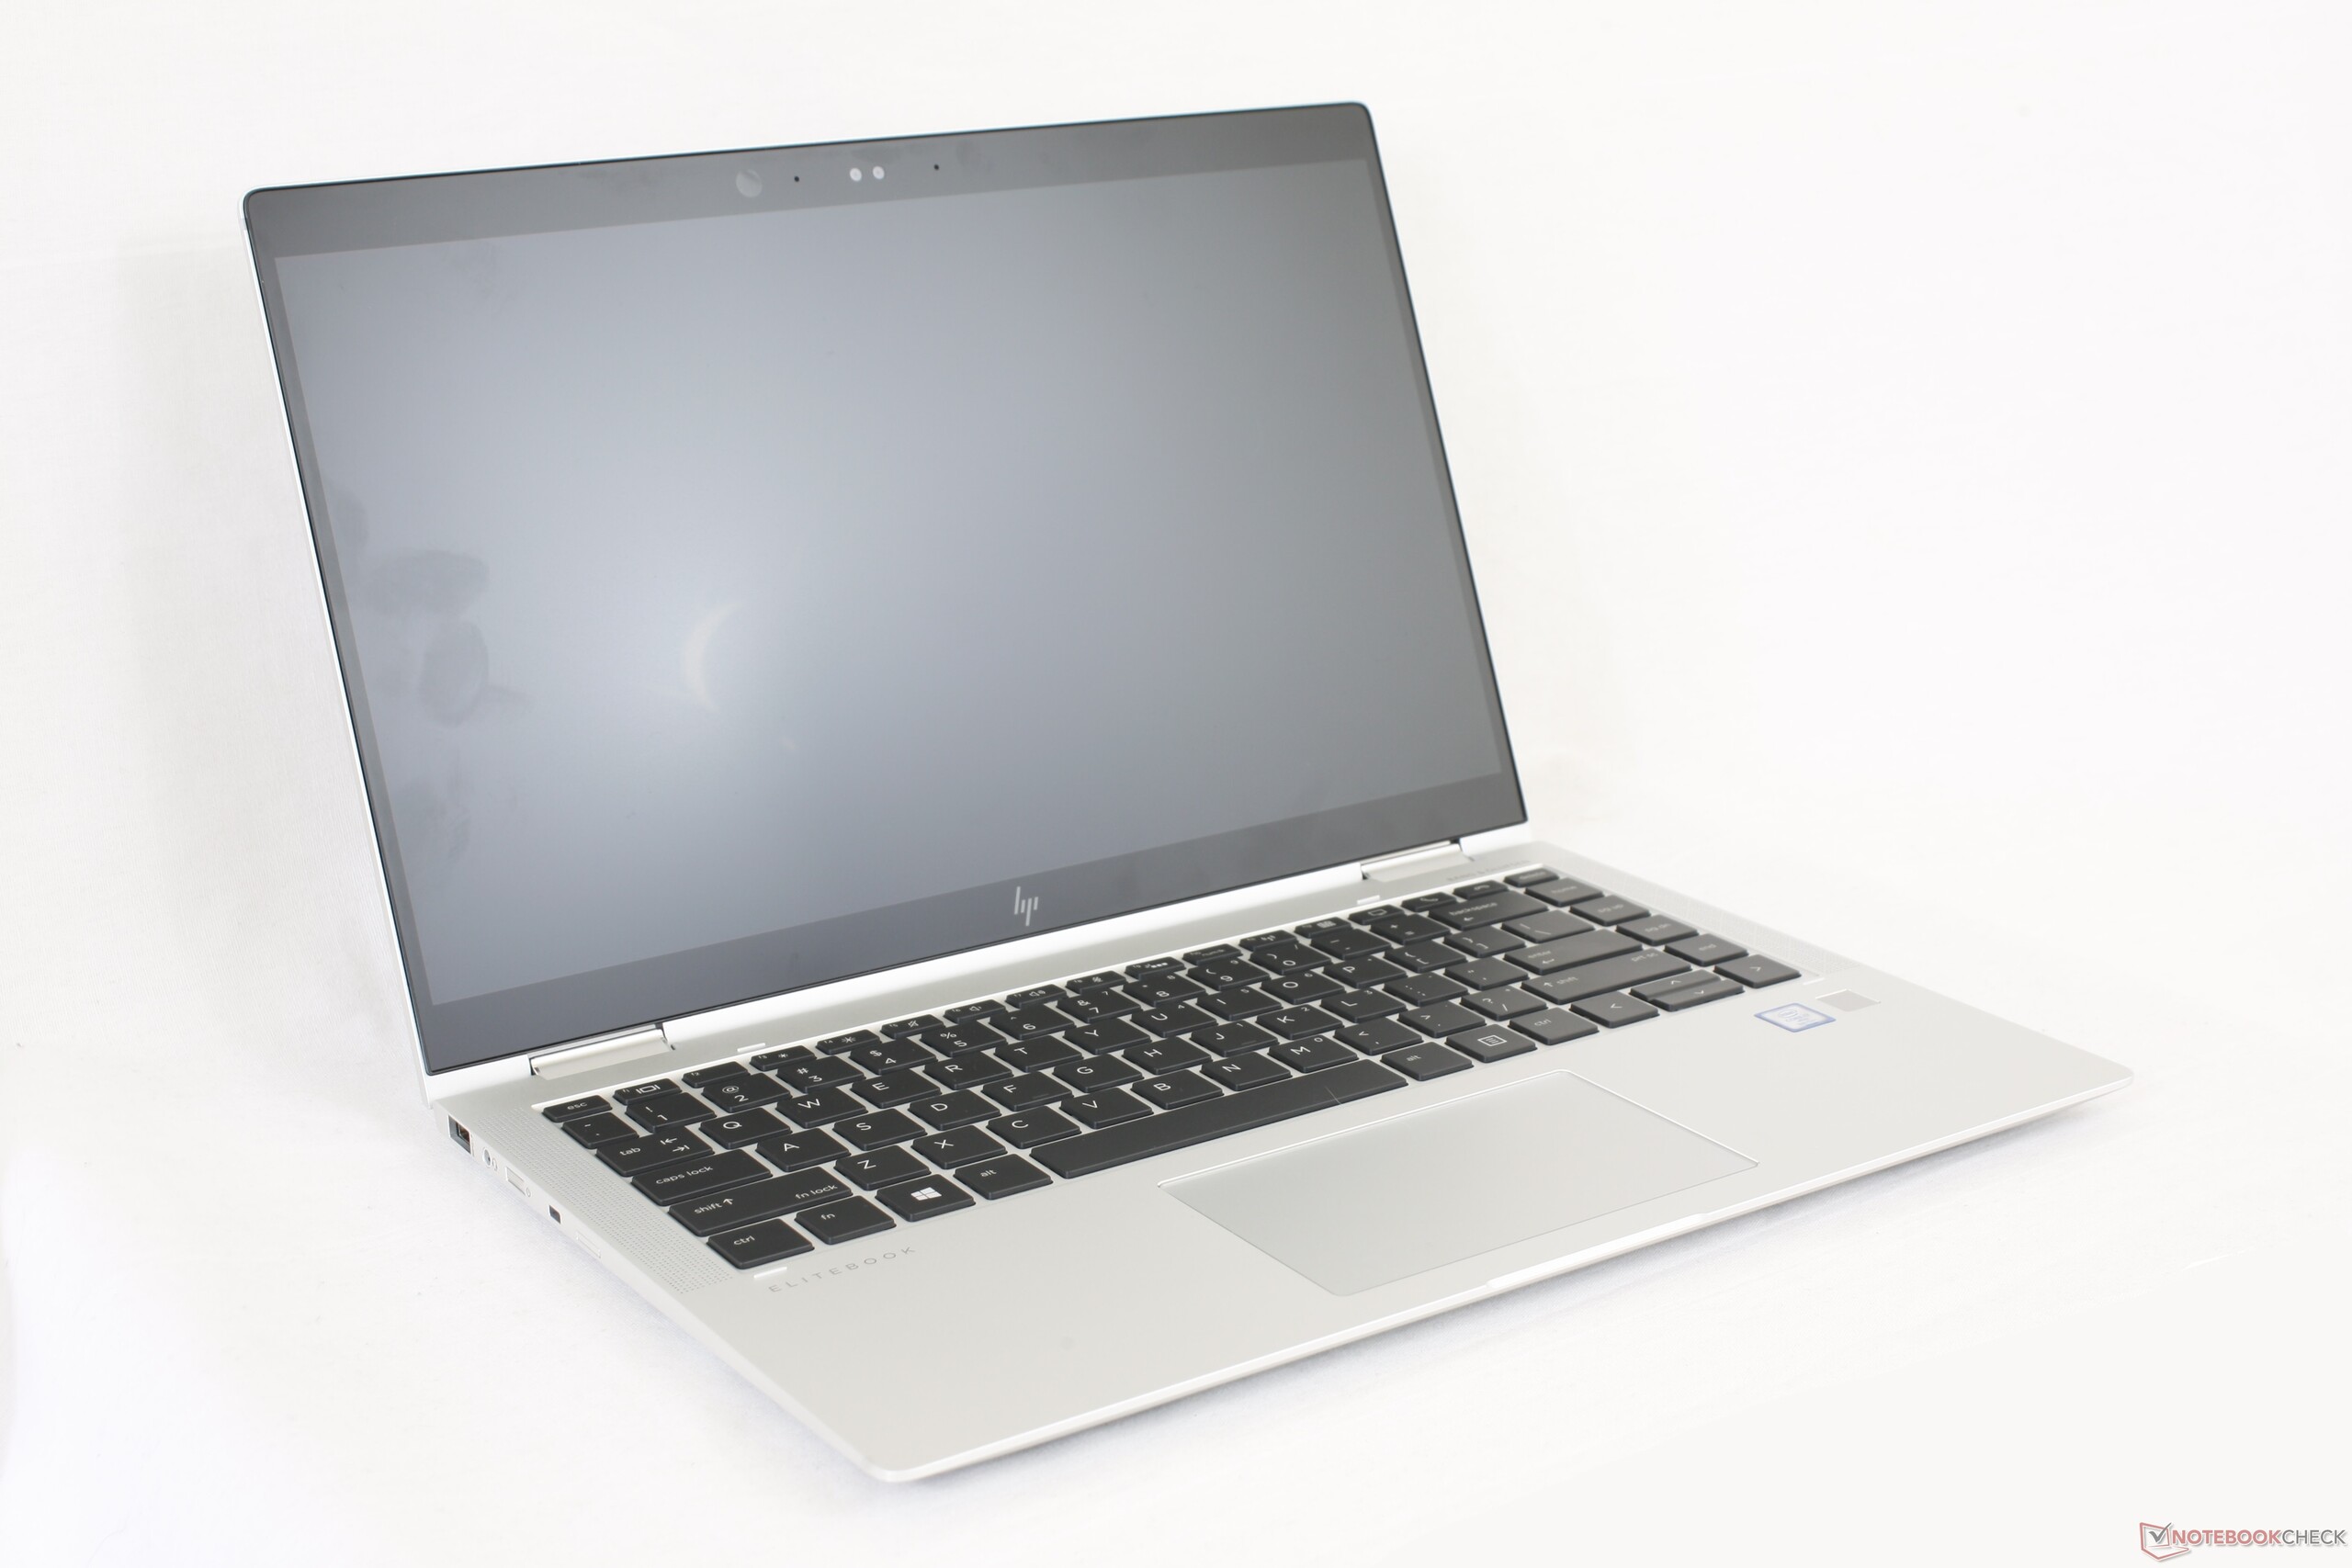
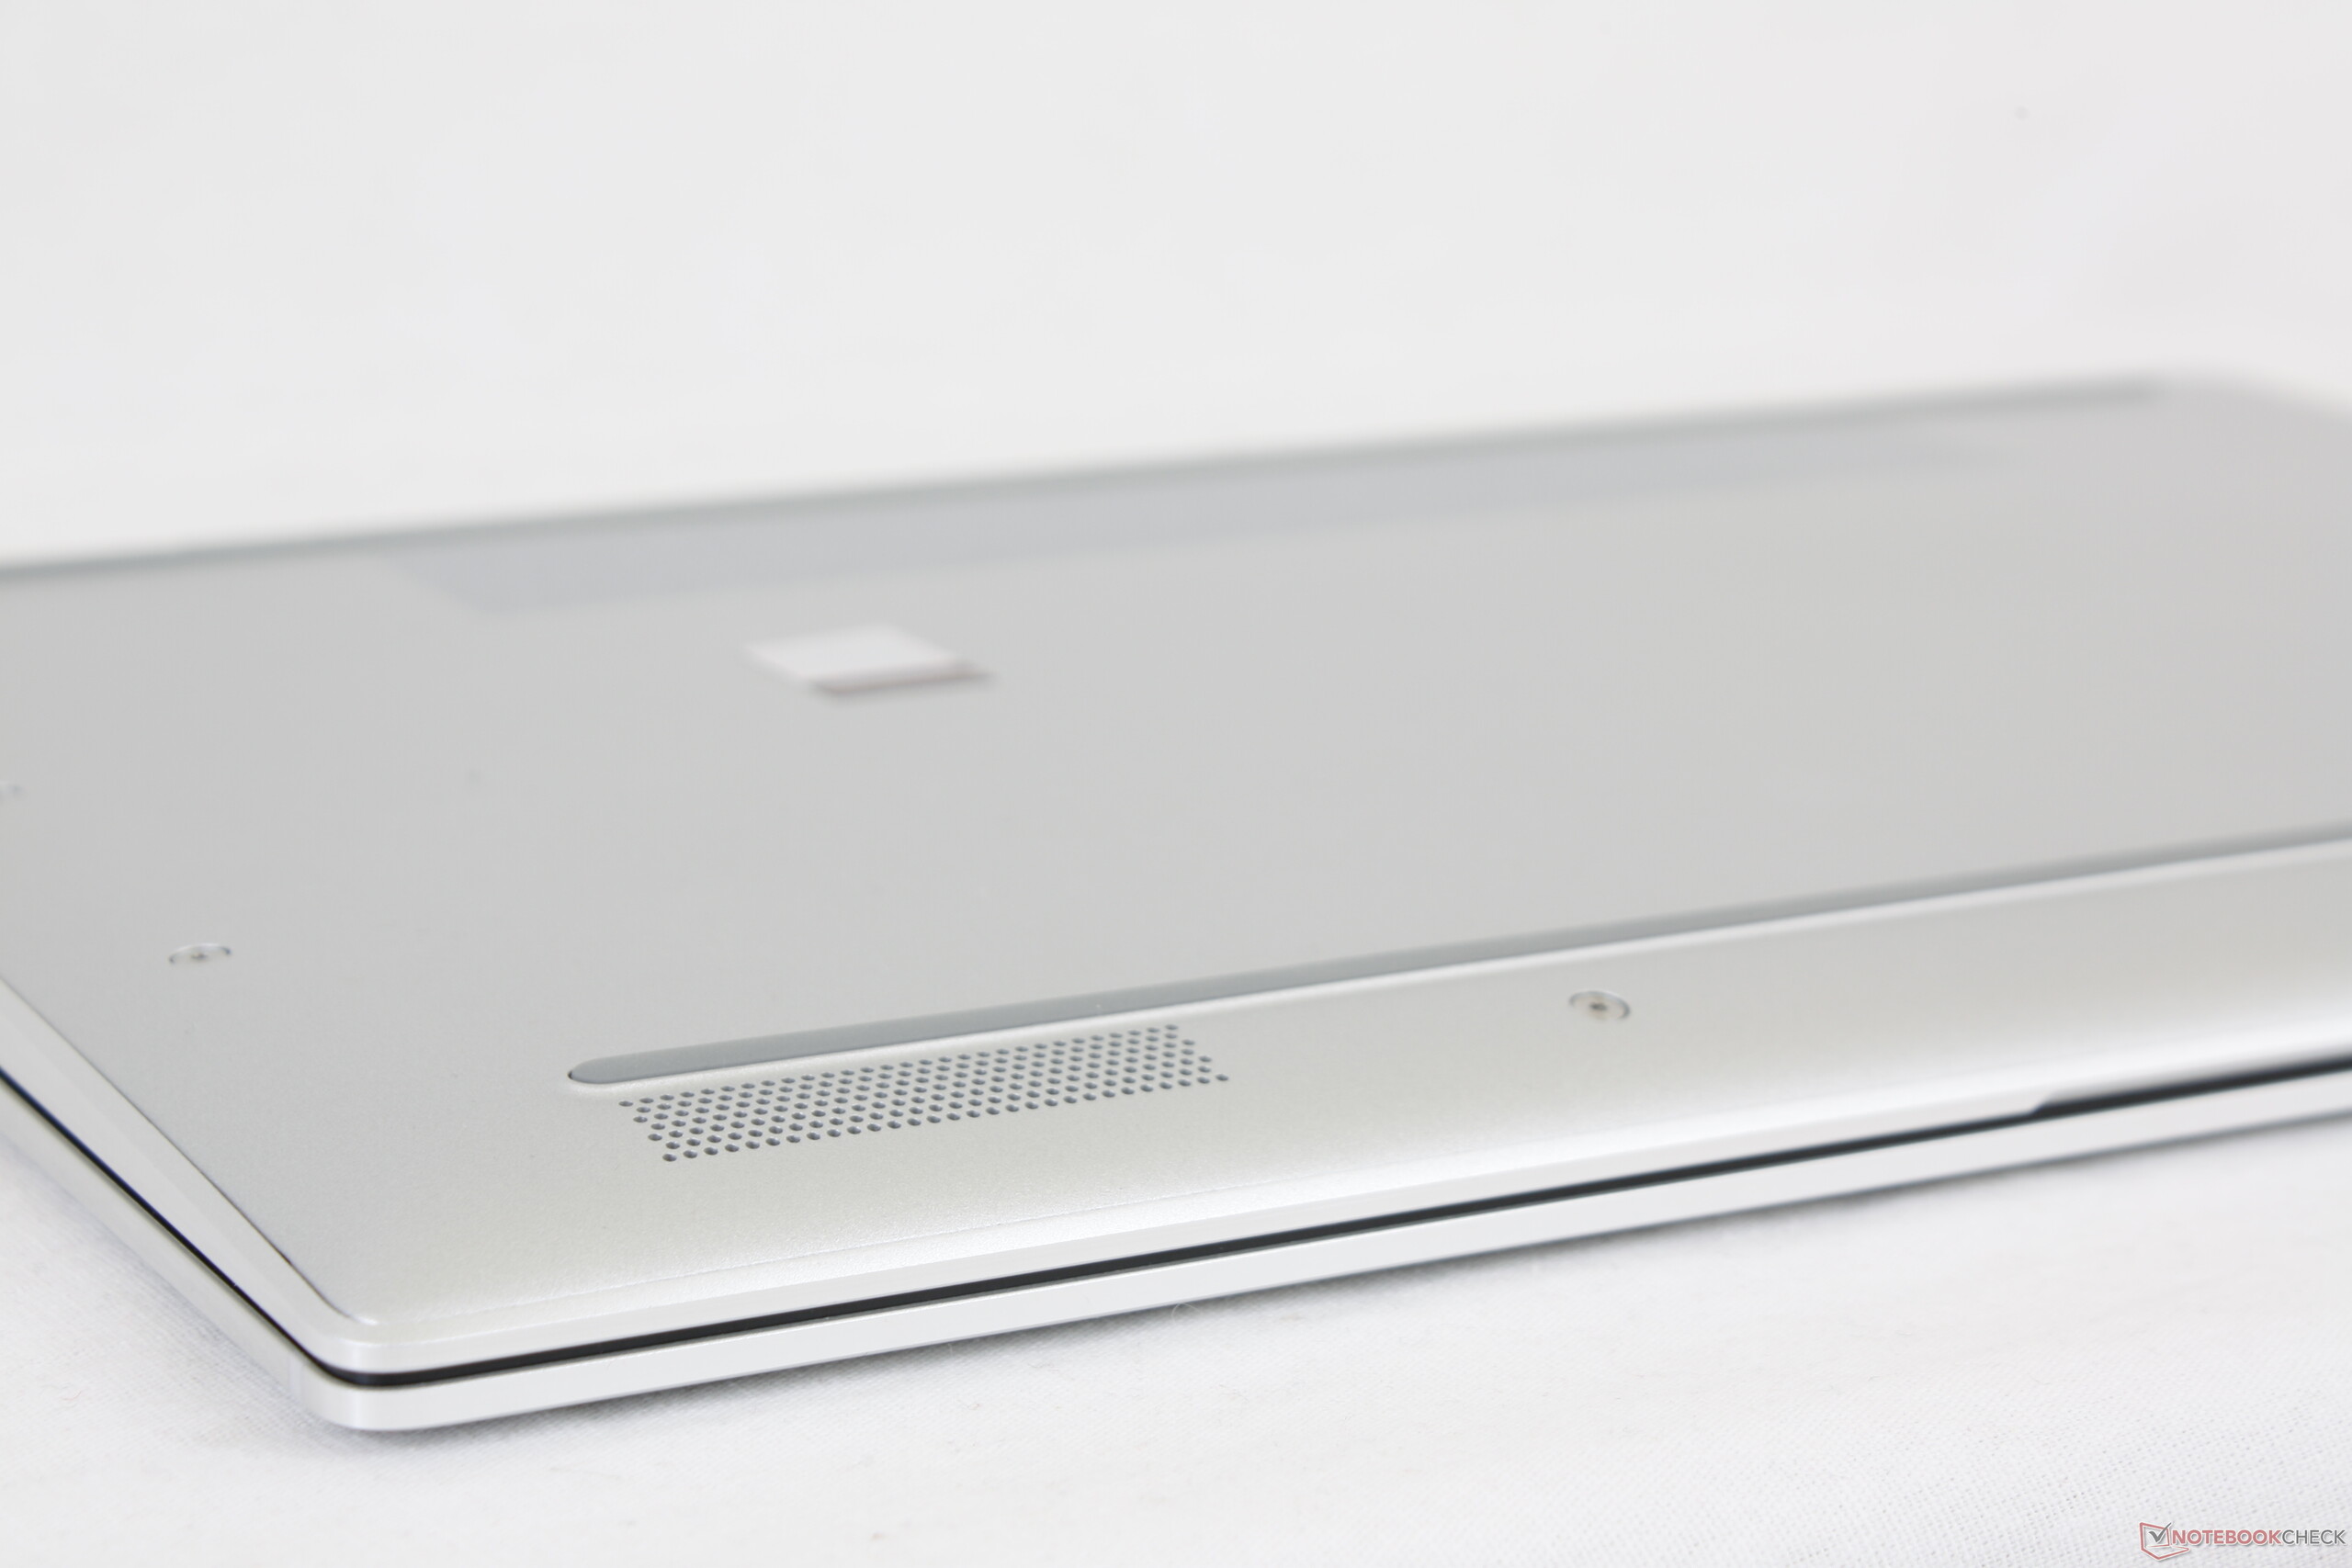
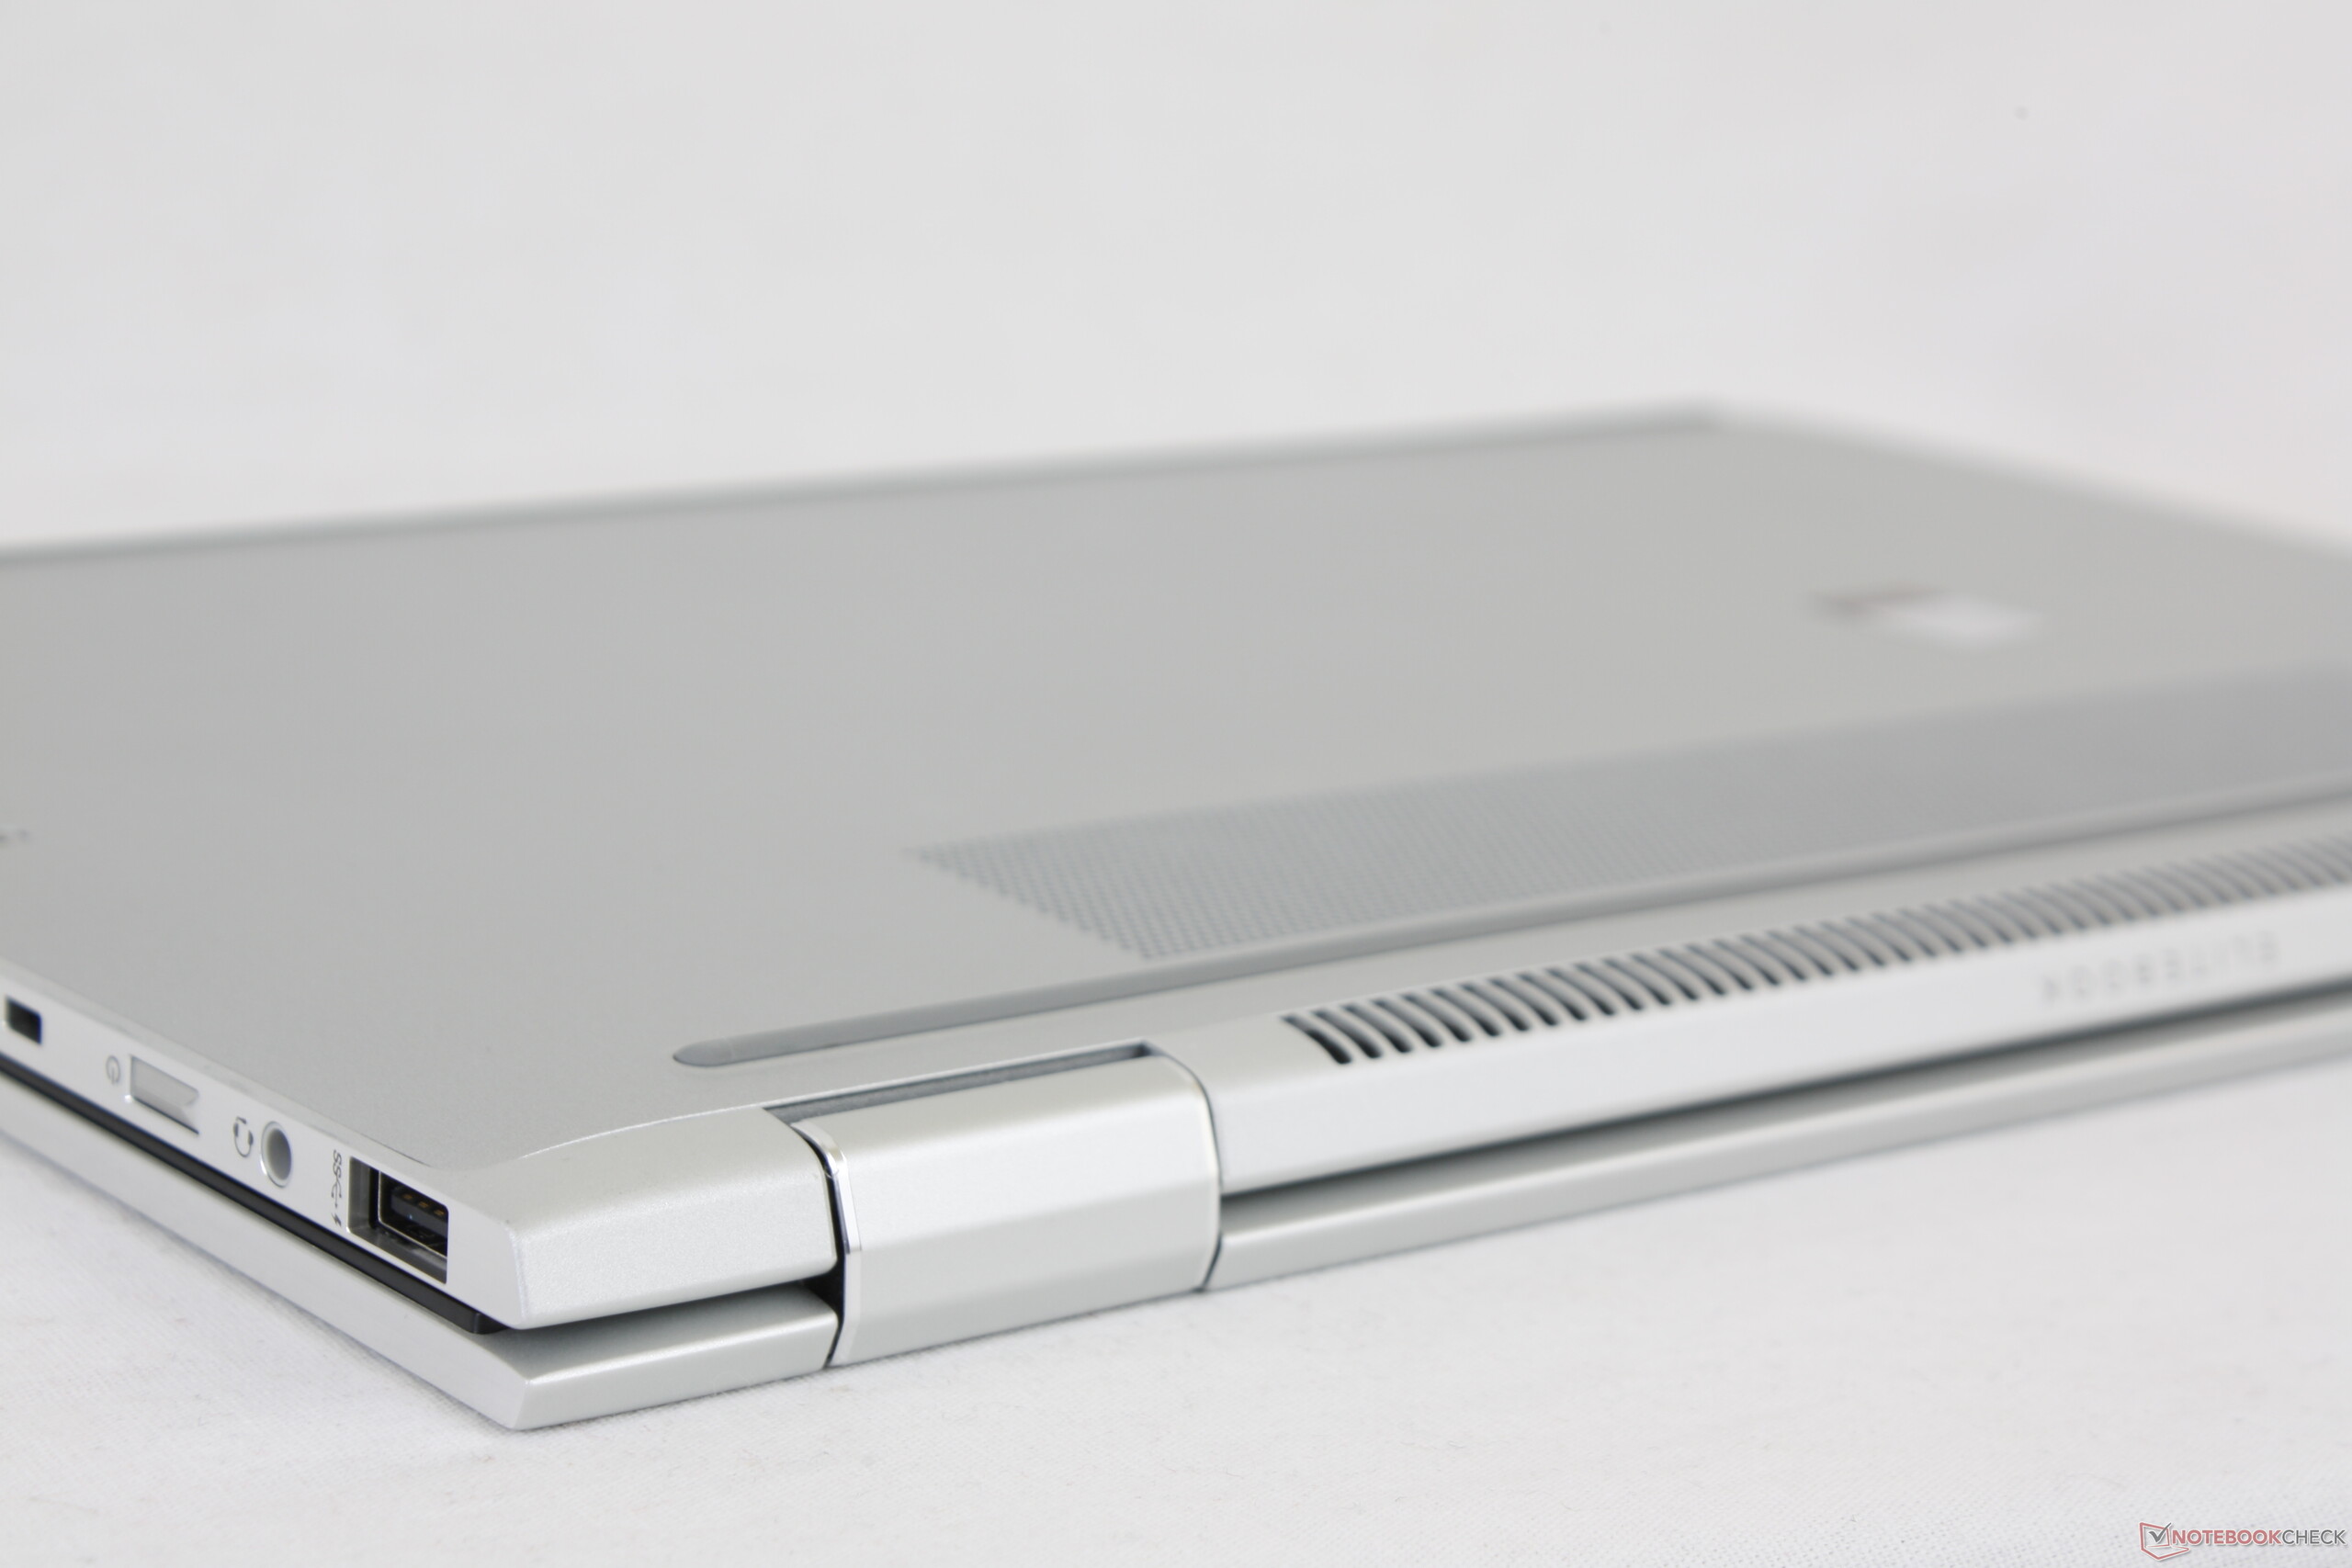
EliteBook x360 1040 G5是我们所喜爱的EliteBook x360 1030 G3升级版,配备了更宽敞的14英寸显示屏。在功能和安全性方面,它可以最好地描述为加强版的Spectre x360 13。你不会再找到另一款带有更好键盘的14英寸翻转本,它也配备了Thunderbolt 3,4G LTE,优质扬声器,超亮700尼特显示屏和超长续航时间。这就是最适合需要出差的商务人士的终极Windows翻转本。
要记住一些关键的缺点。首先,独特的防眩光哑光触摸屏减少了眩光,但增加了颗粒感。一些用户可能不会为此烦恼,但那些习惯于具有快速响应时间的清晰亮面屏用户会发现哑光触摸屏感觉不太一样。值得庆幸的是,有标准光泽(BrightView)选项可选。
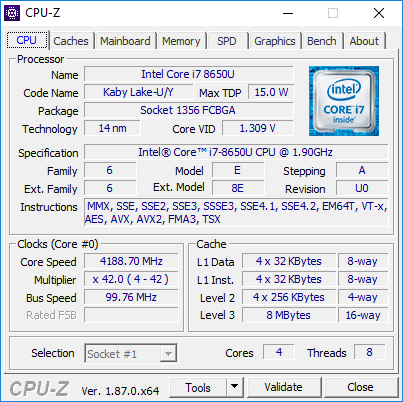
其次,由于Turbo Boost有限,CPU性能仍然低于平均水平。由于我们在EliteBook x360 1030 G3上发现了类似的结果,我们希望这不会成为EliteBook x360系列的趋势。当联想Yoga C930中更便宜的酷睿i7-8550U在我们的HP中表现优于所谓的更快的Core i7-8650U时,我们感到不大对劲。
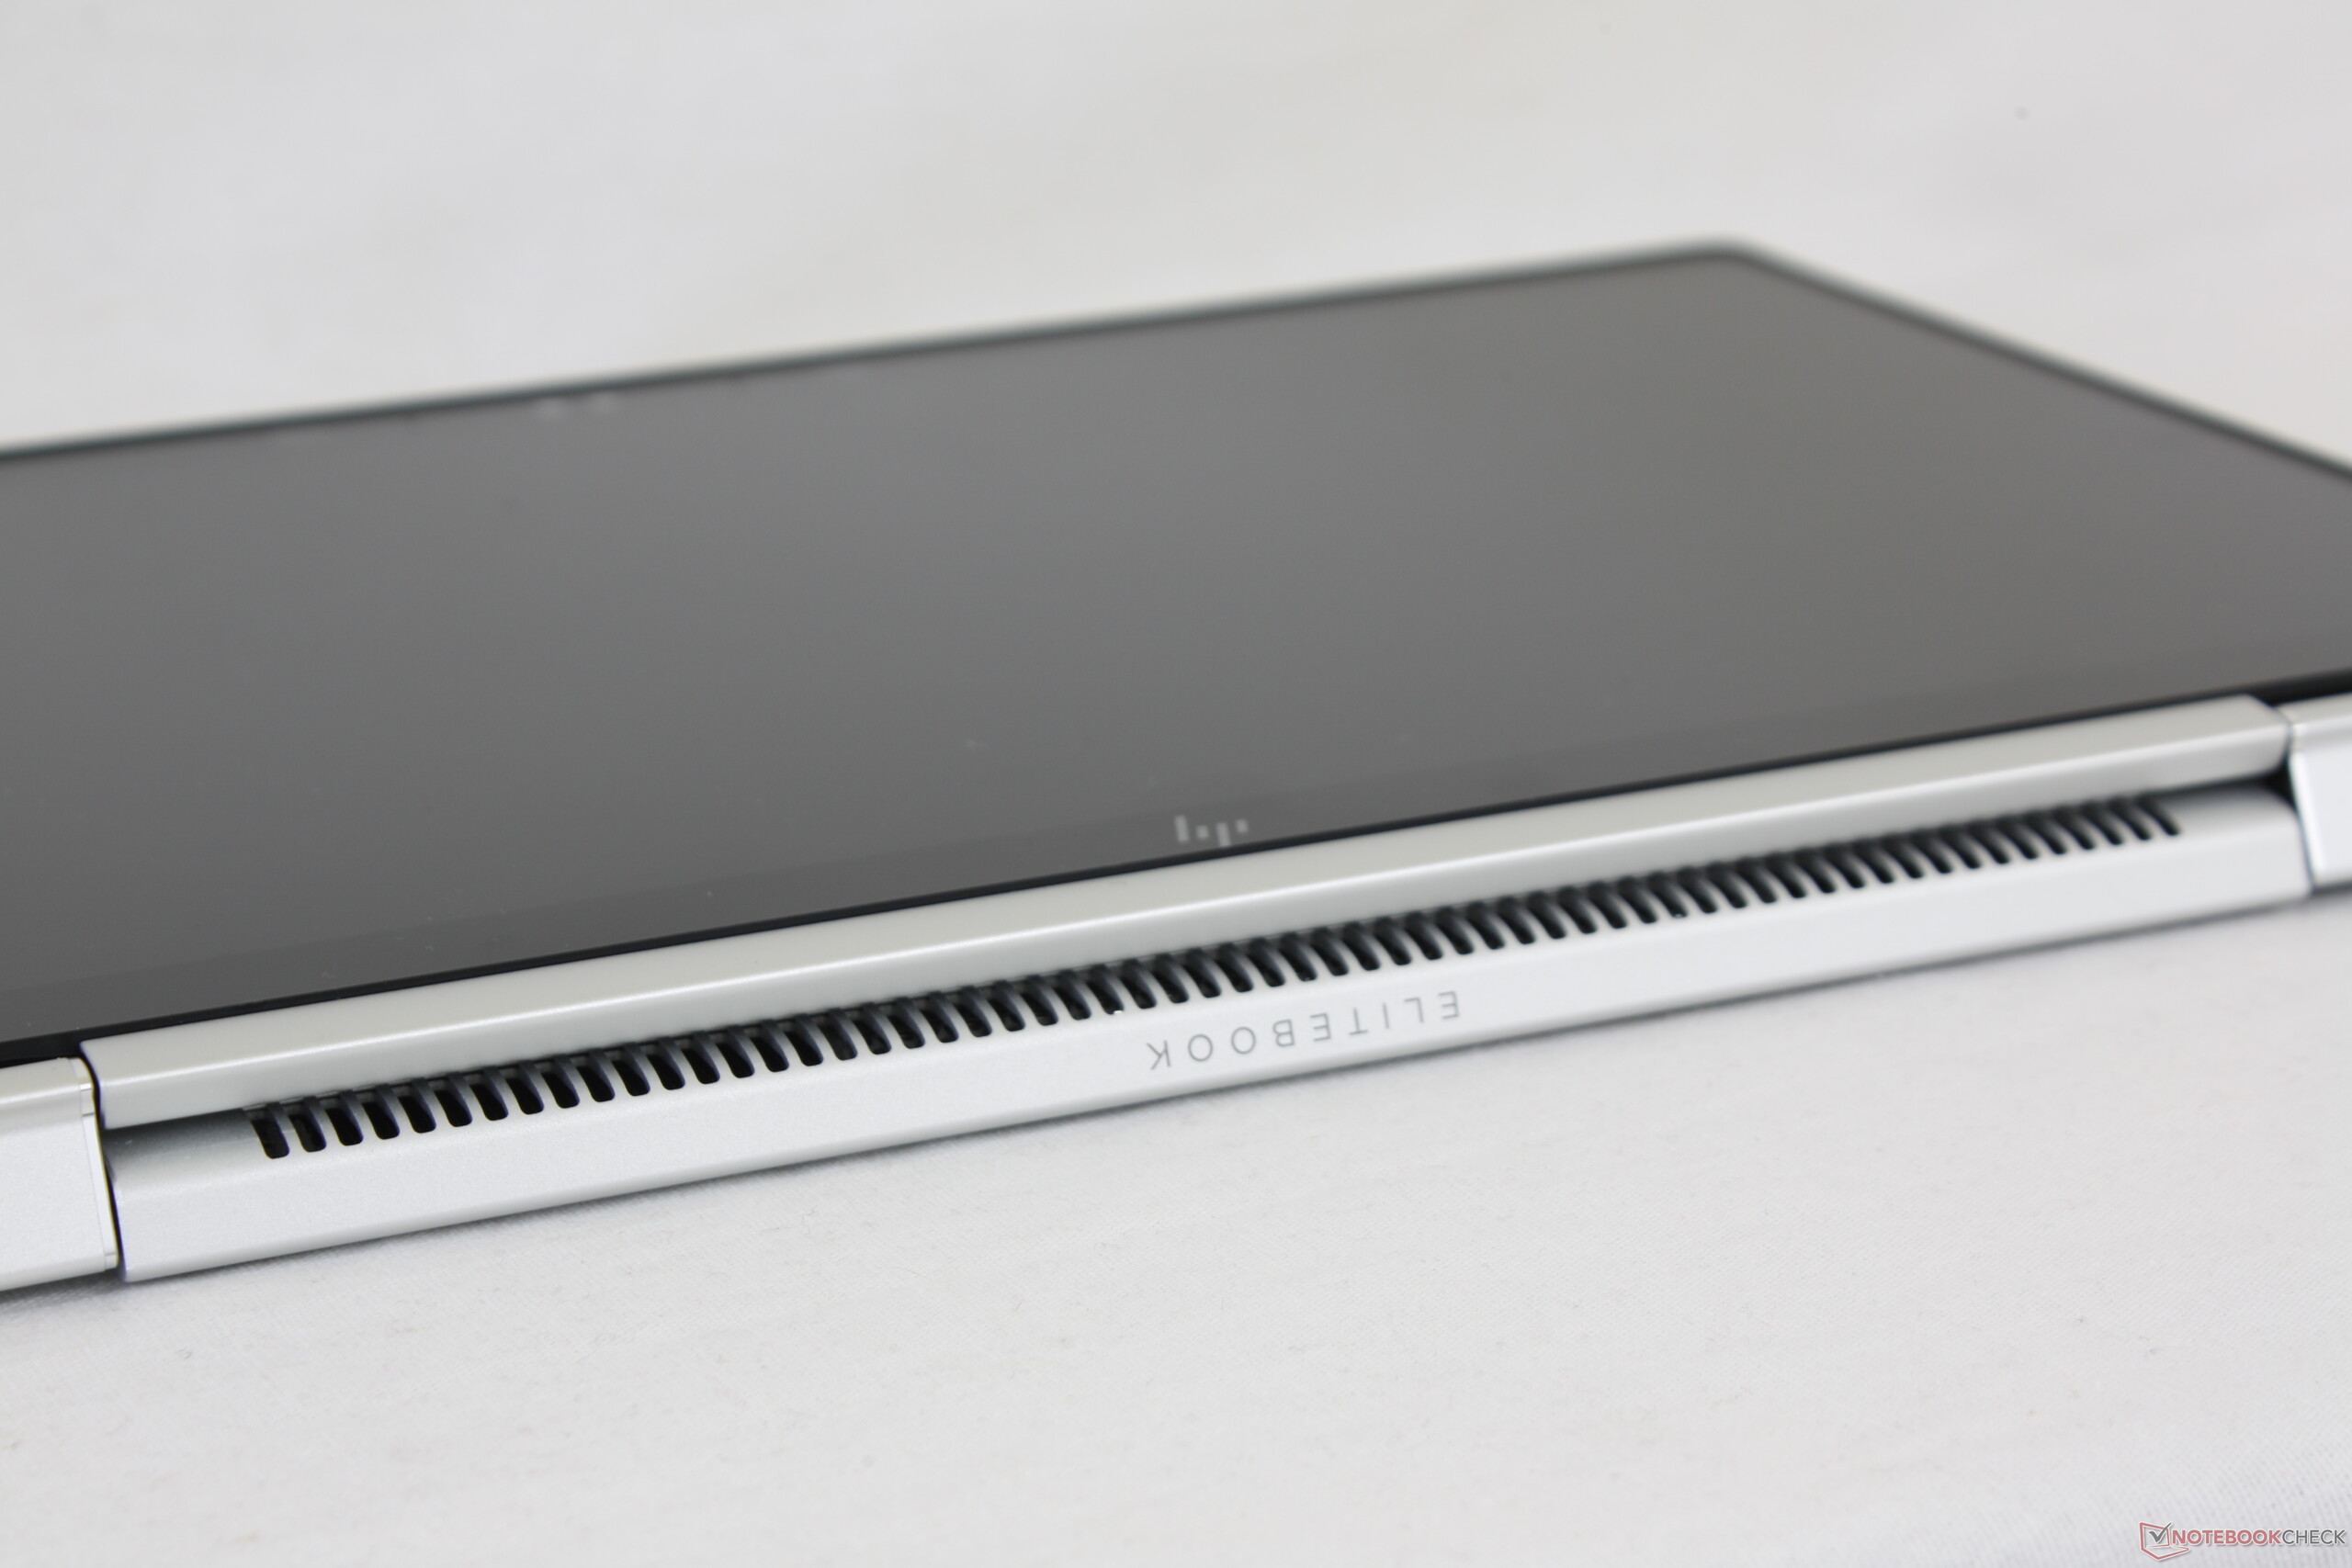
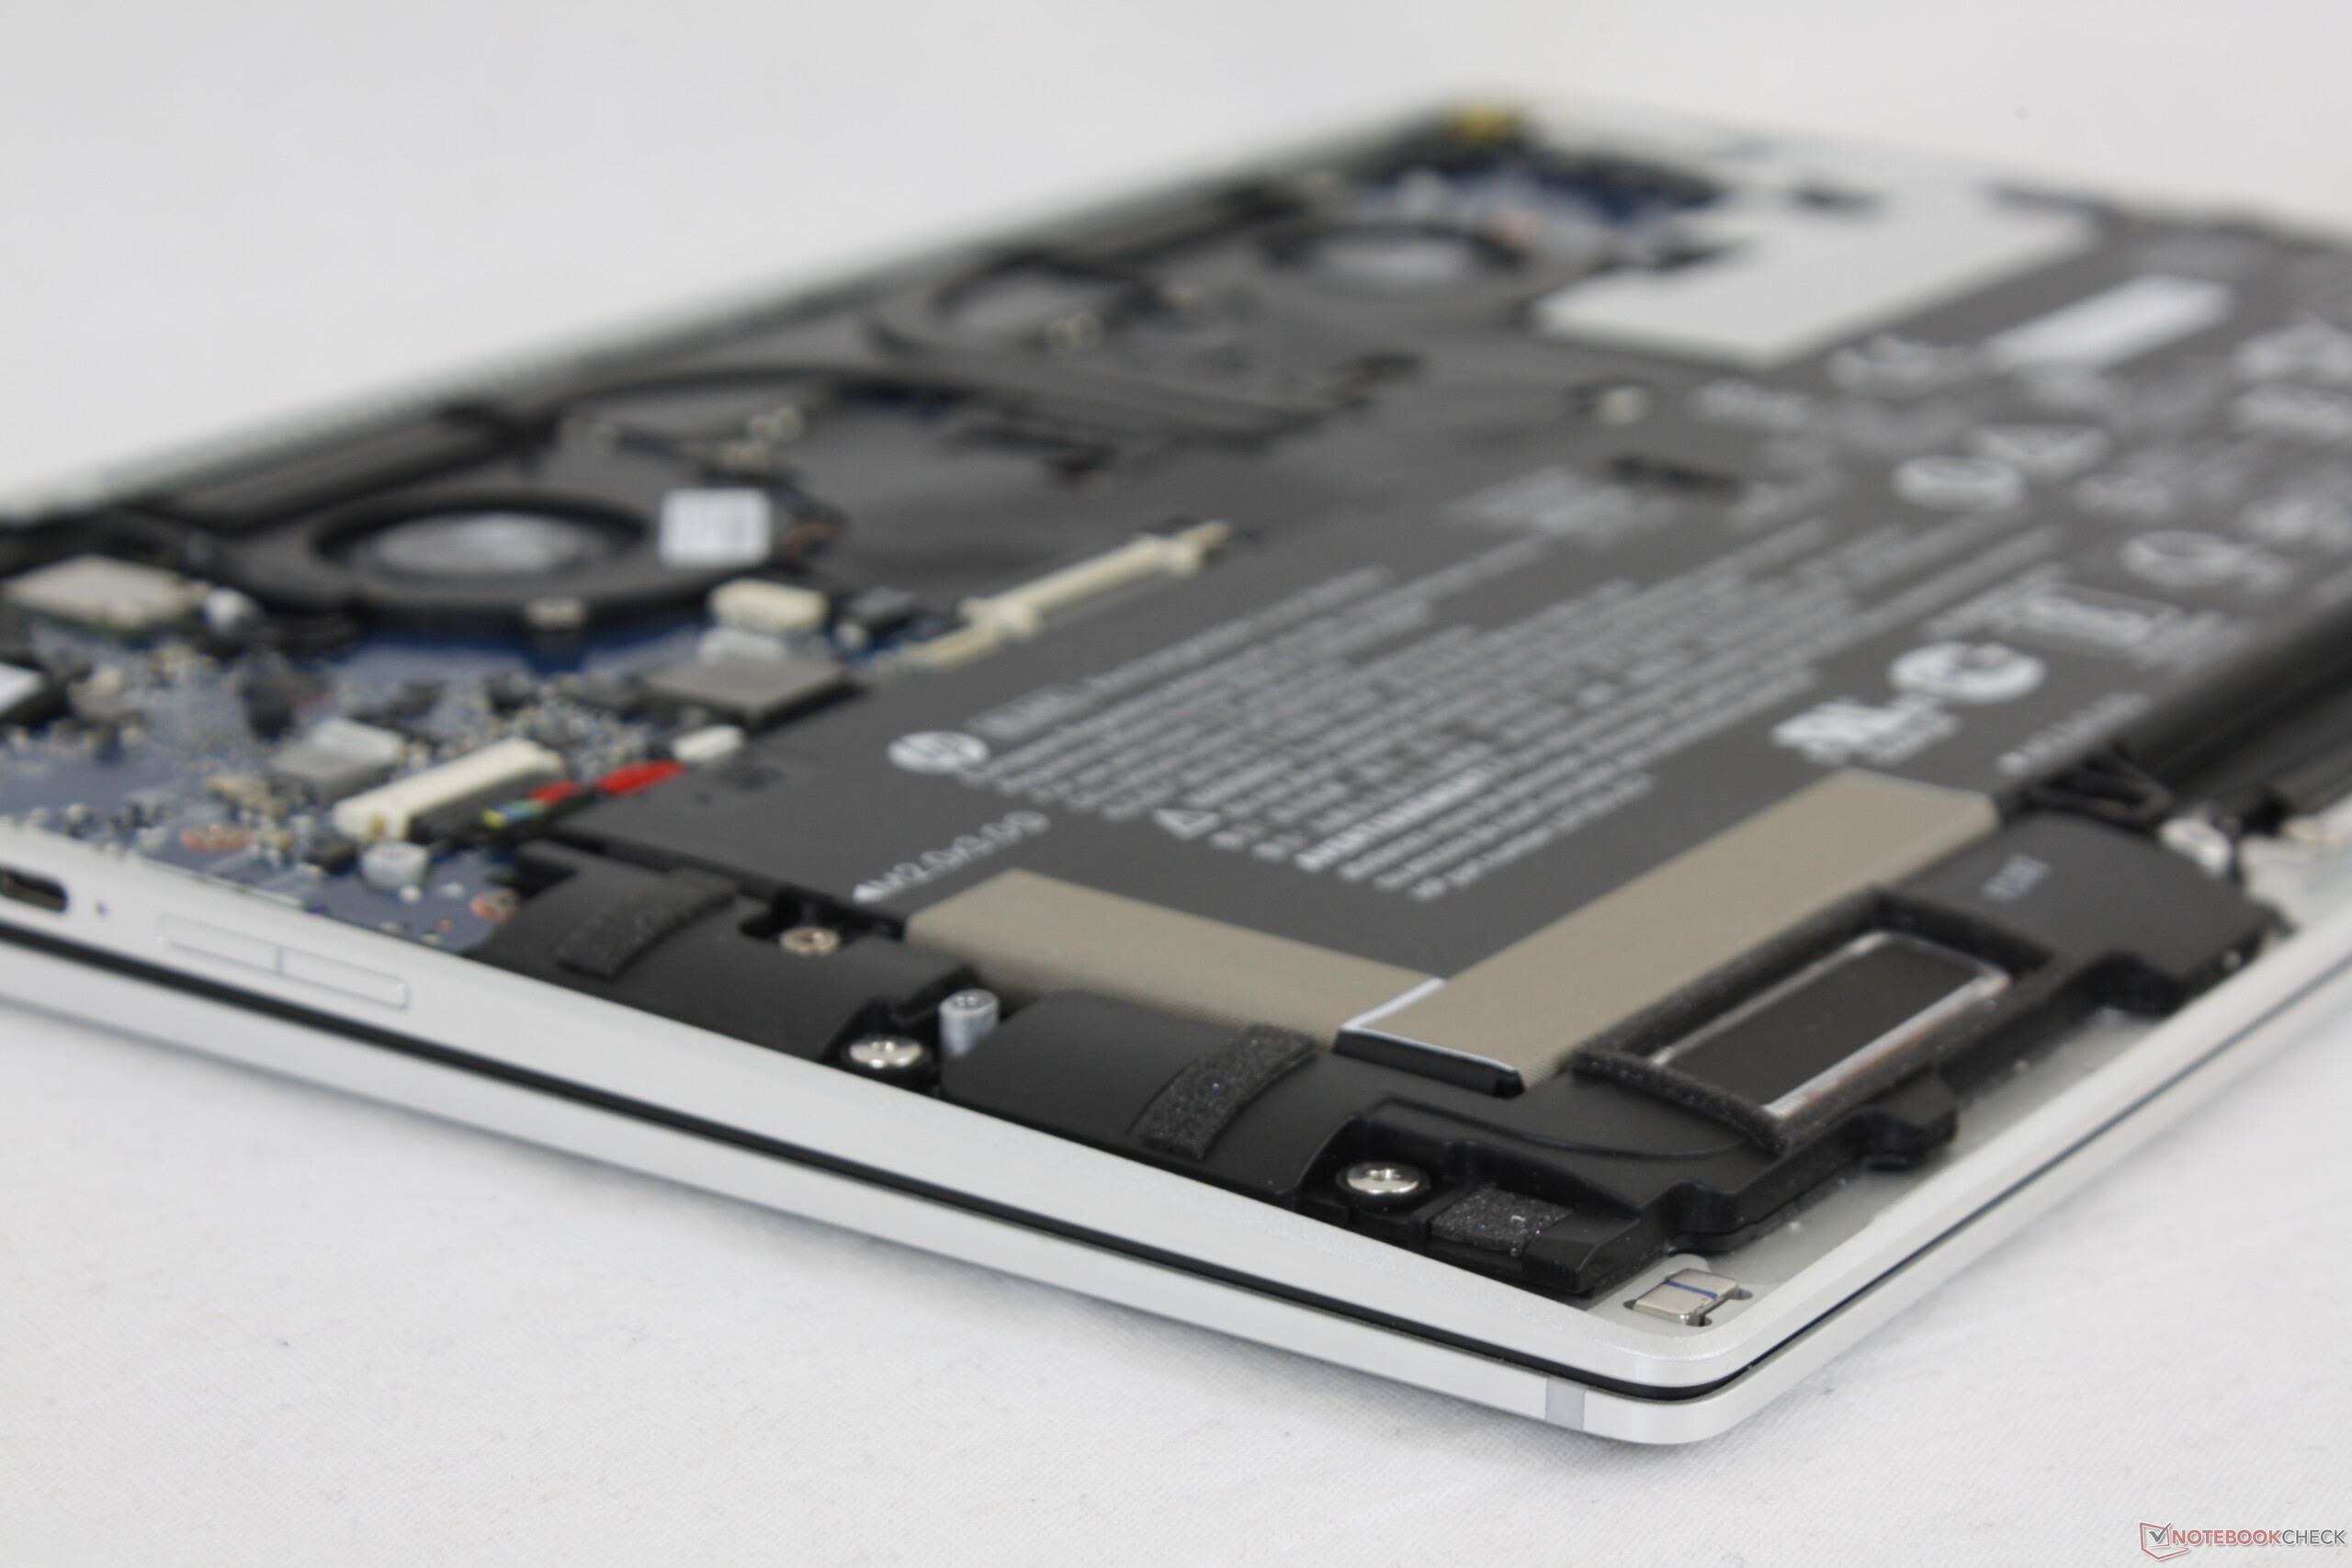
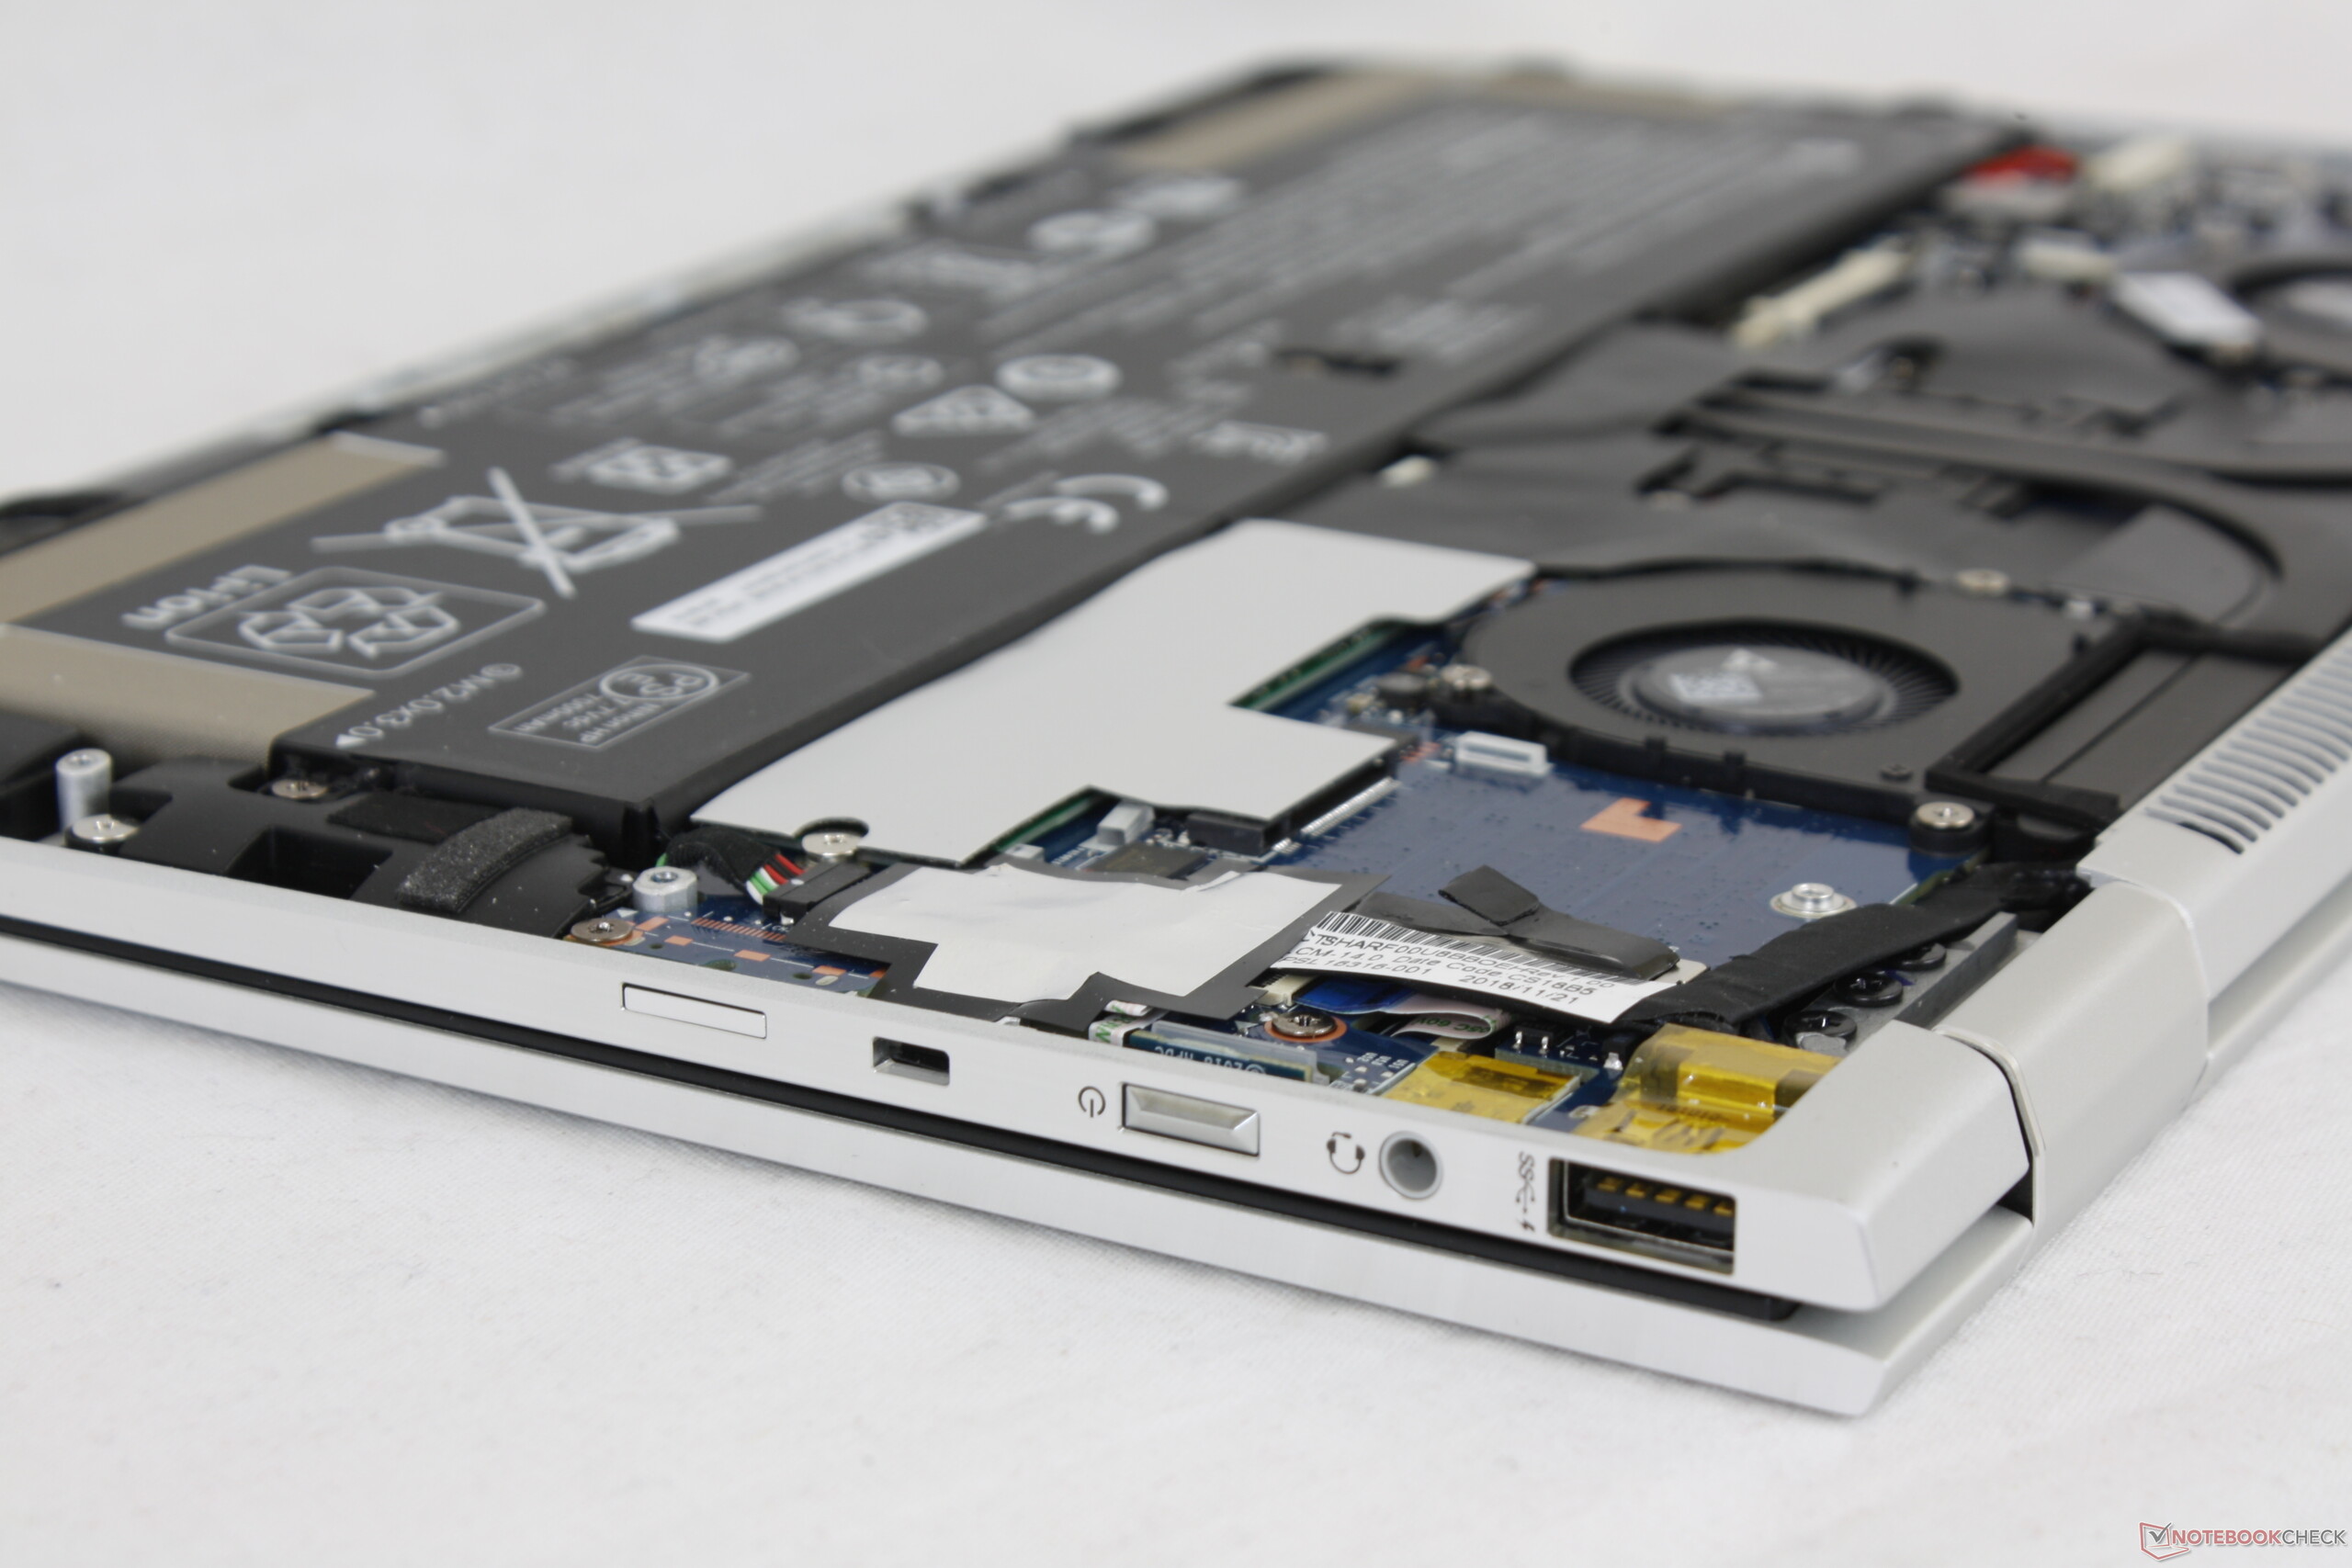
最后,风扇噪音比我们对Ultrabook的期望更高。我们怀疑主要是因为小风扇的使用,因为风扇噪音频率自然会随着直径的减小而变高。这并不是说笔记本电脑很响亮,但是一旦它们开始加速,风扇就会变得明显。
我们强烈推荐EliteBook x360 1040 G5,它不仅适用于商务用户,也适用于可能正在考虑超极本的普通消费者。即使是最便宜的SKU,也可以提供与任何可转换Ultrabook一样多的产品。通过跳过选择i5 的SKU,可节省数百美元。因为Turbo Boost有限,该系统无法充分挖掘Core i7系列的全部潜力。
这是一台14英寸的翻转本。它的一些缺点并没有盖过大多数其他商务本中没有的功能和硬件选项,包括4G LTE和700-nit触摸屏。但是,如果GPU性能比较重要,那么Acer Swift 7或Surface Book 2可能是提供更好的替代品。
HP Elitebook x360 1040 G5
- 10/22/2019 v7 (old)
Allen Ngo
Price comparison

