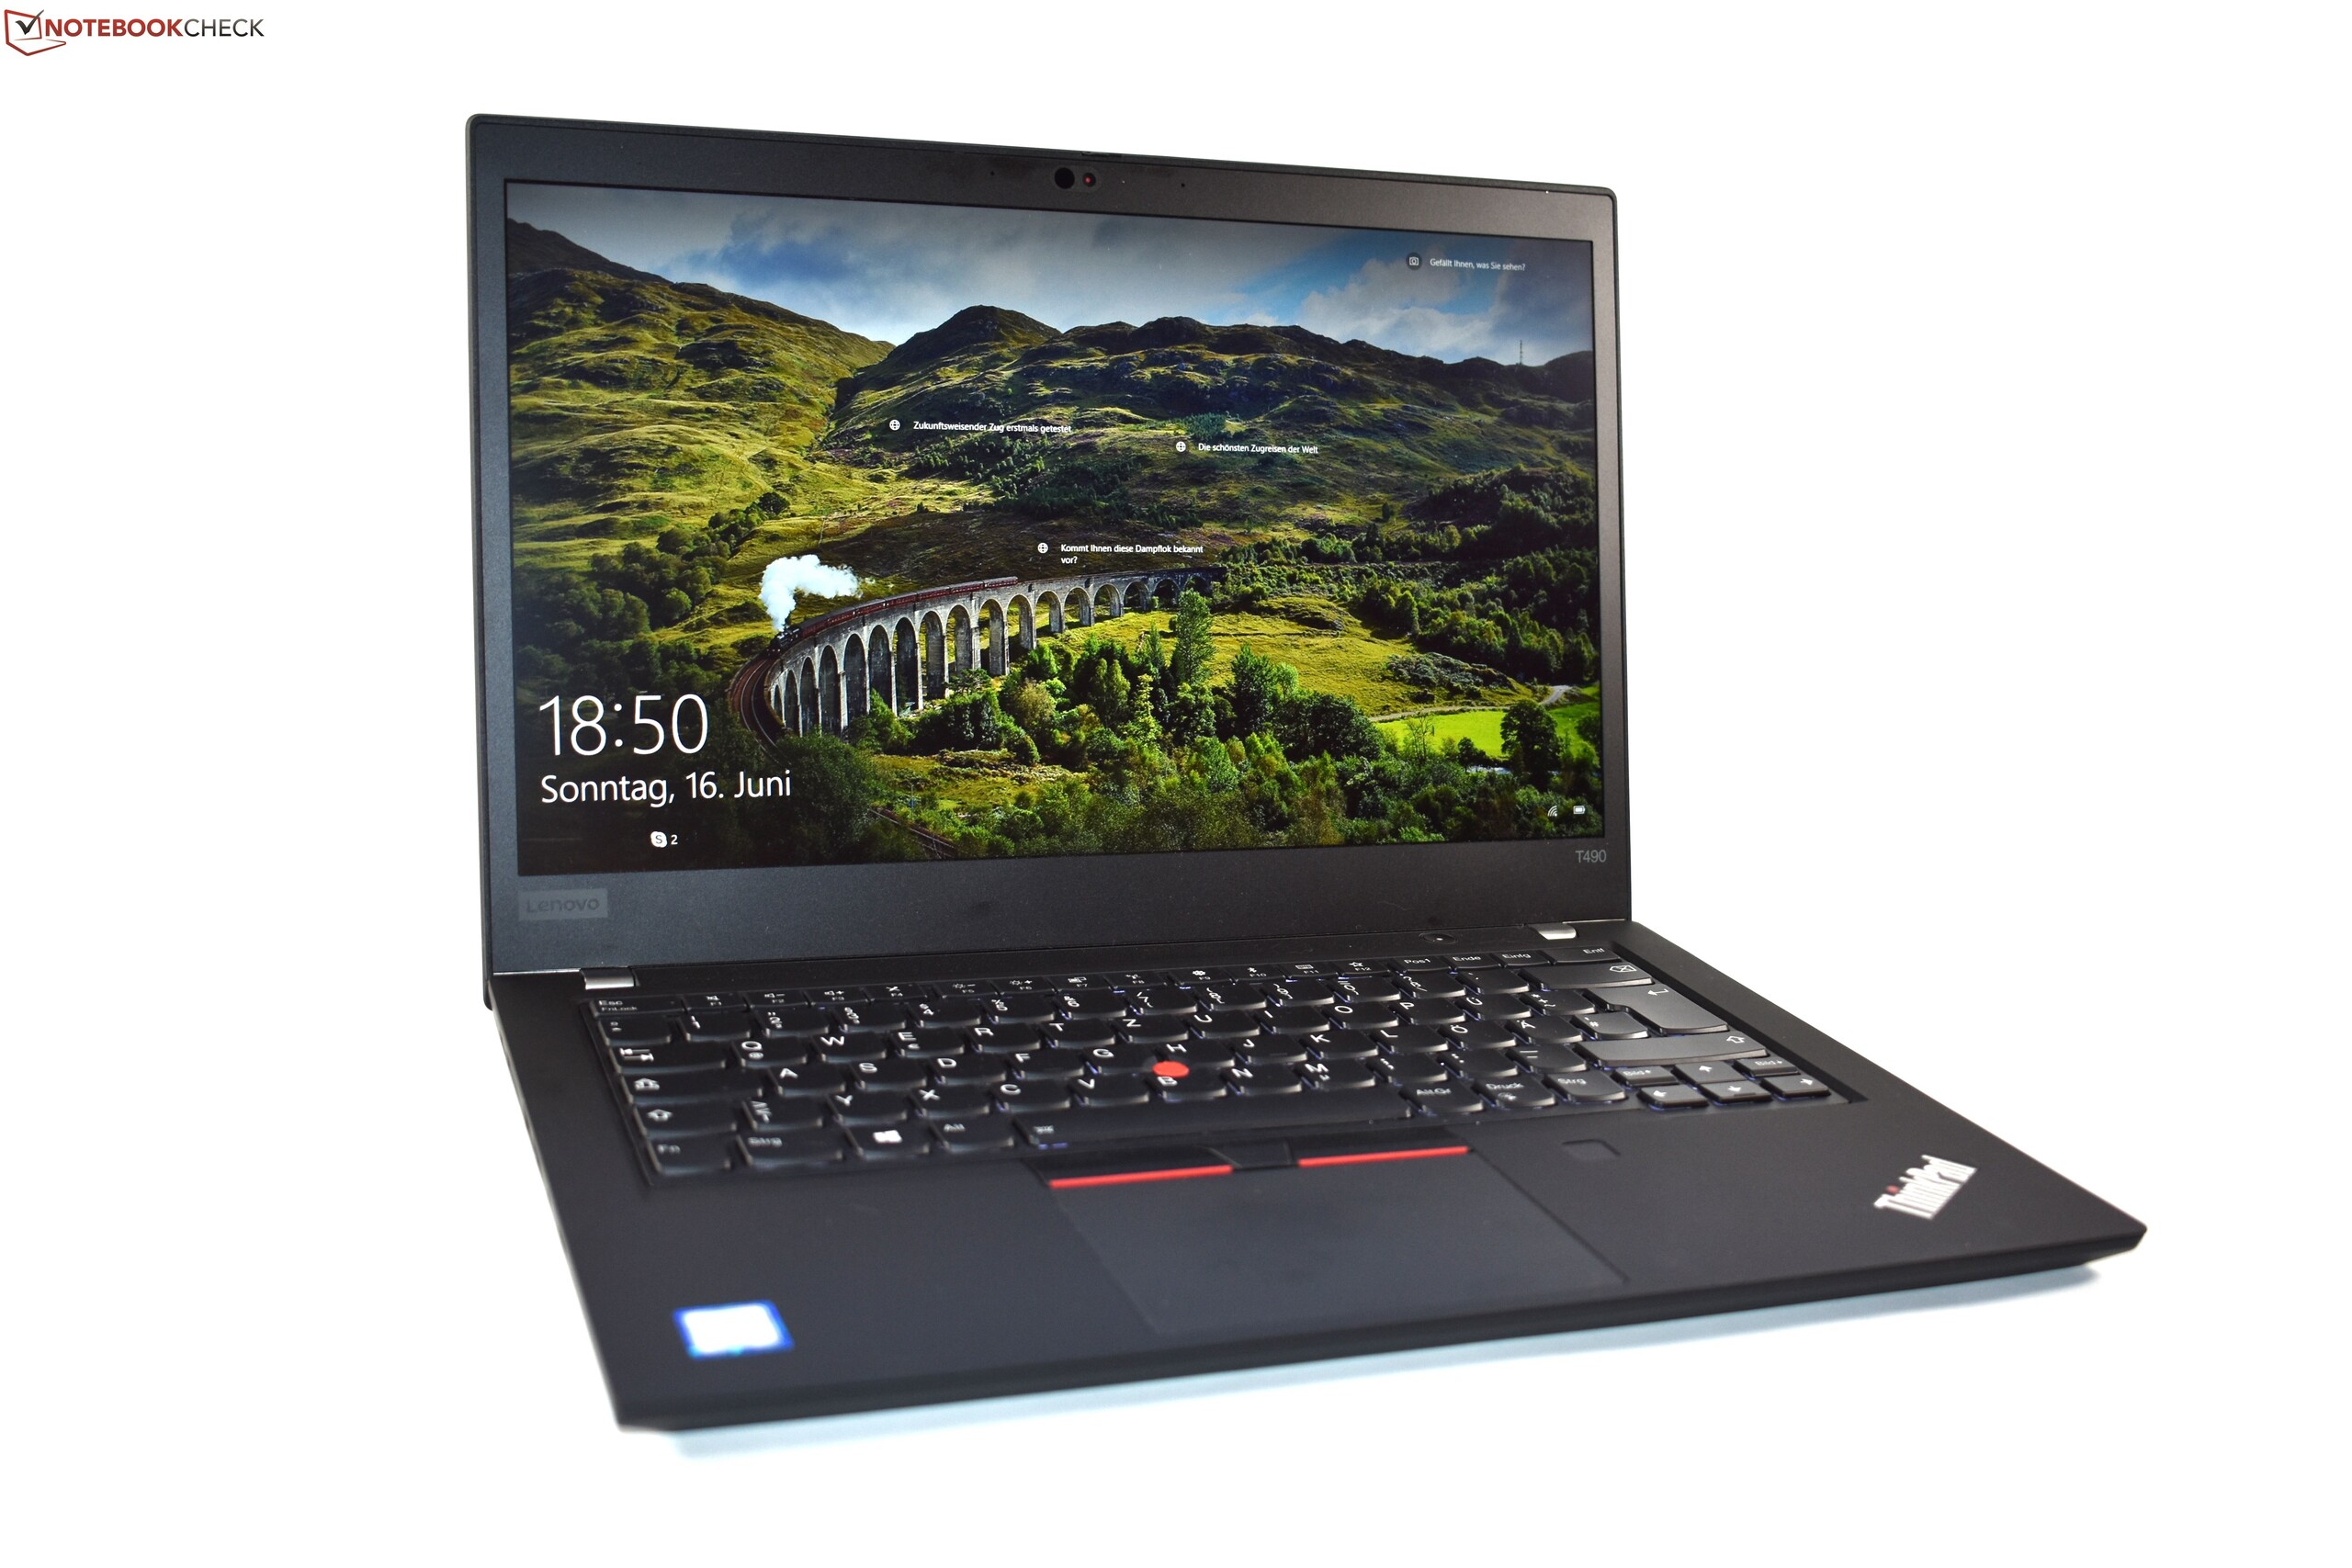
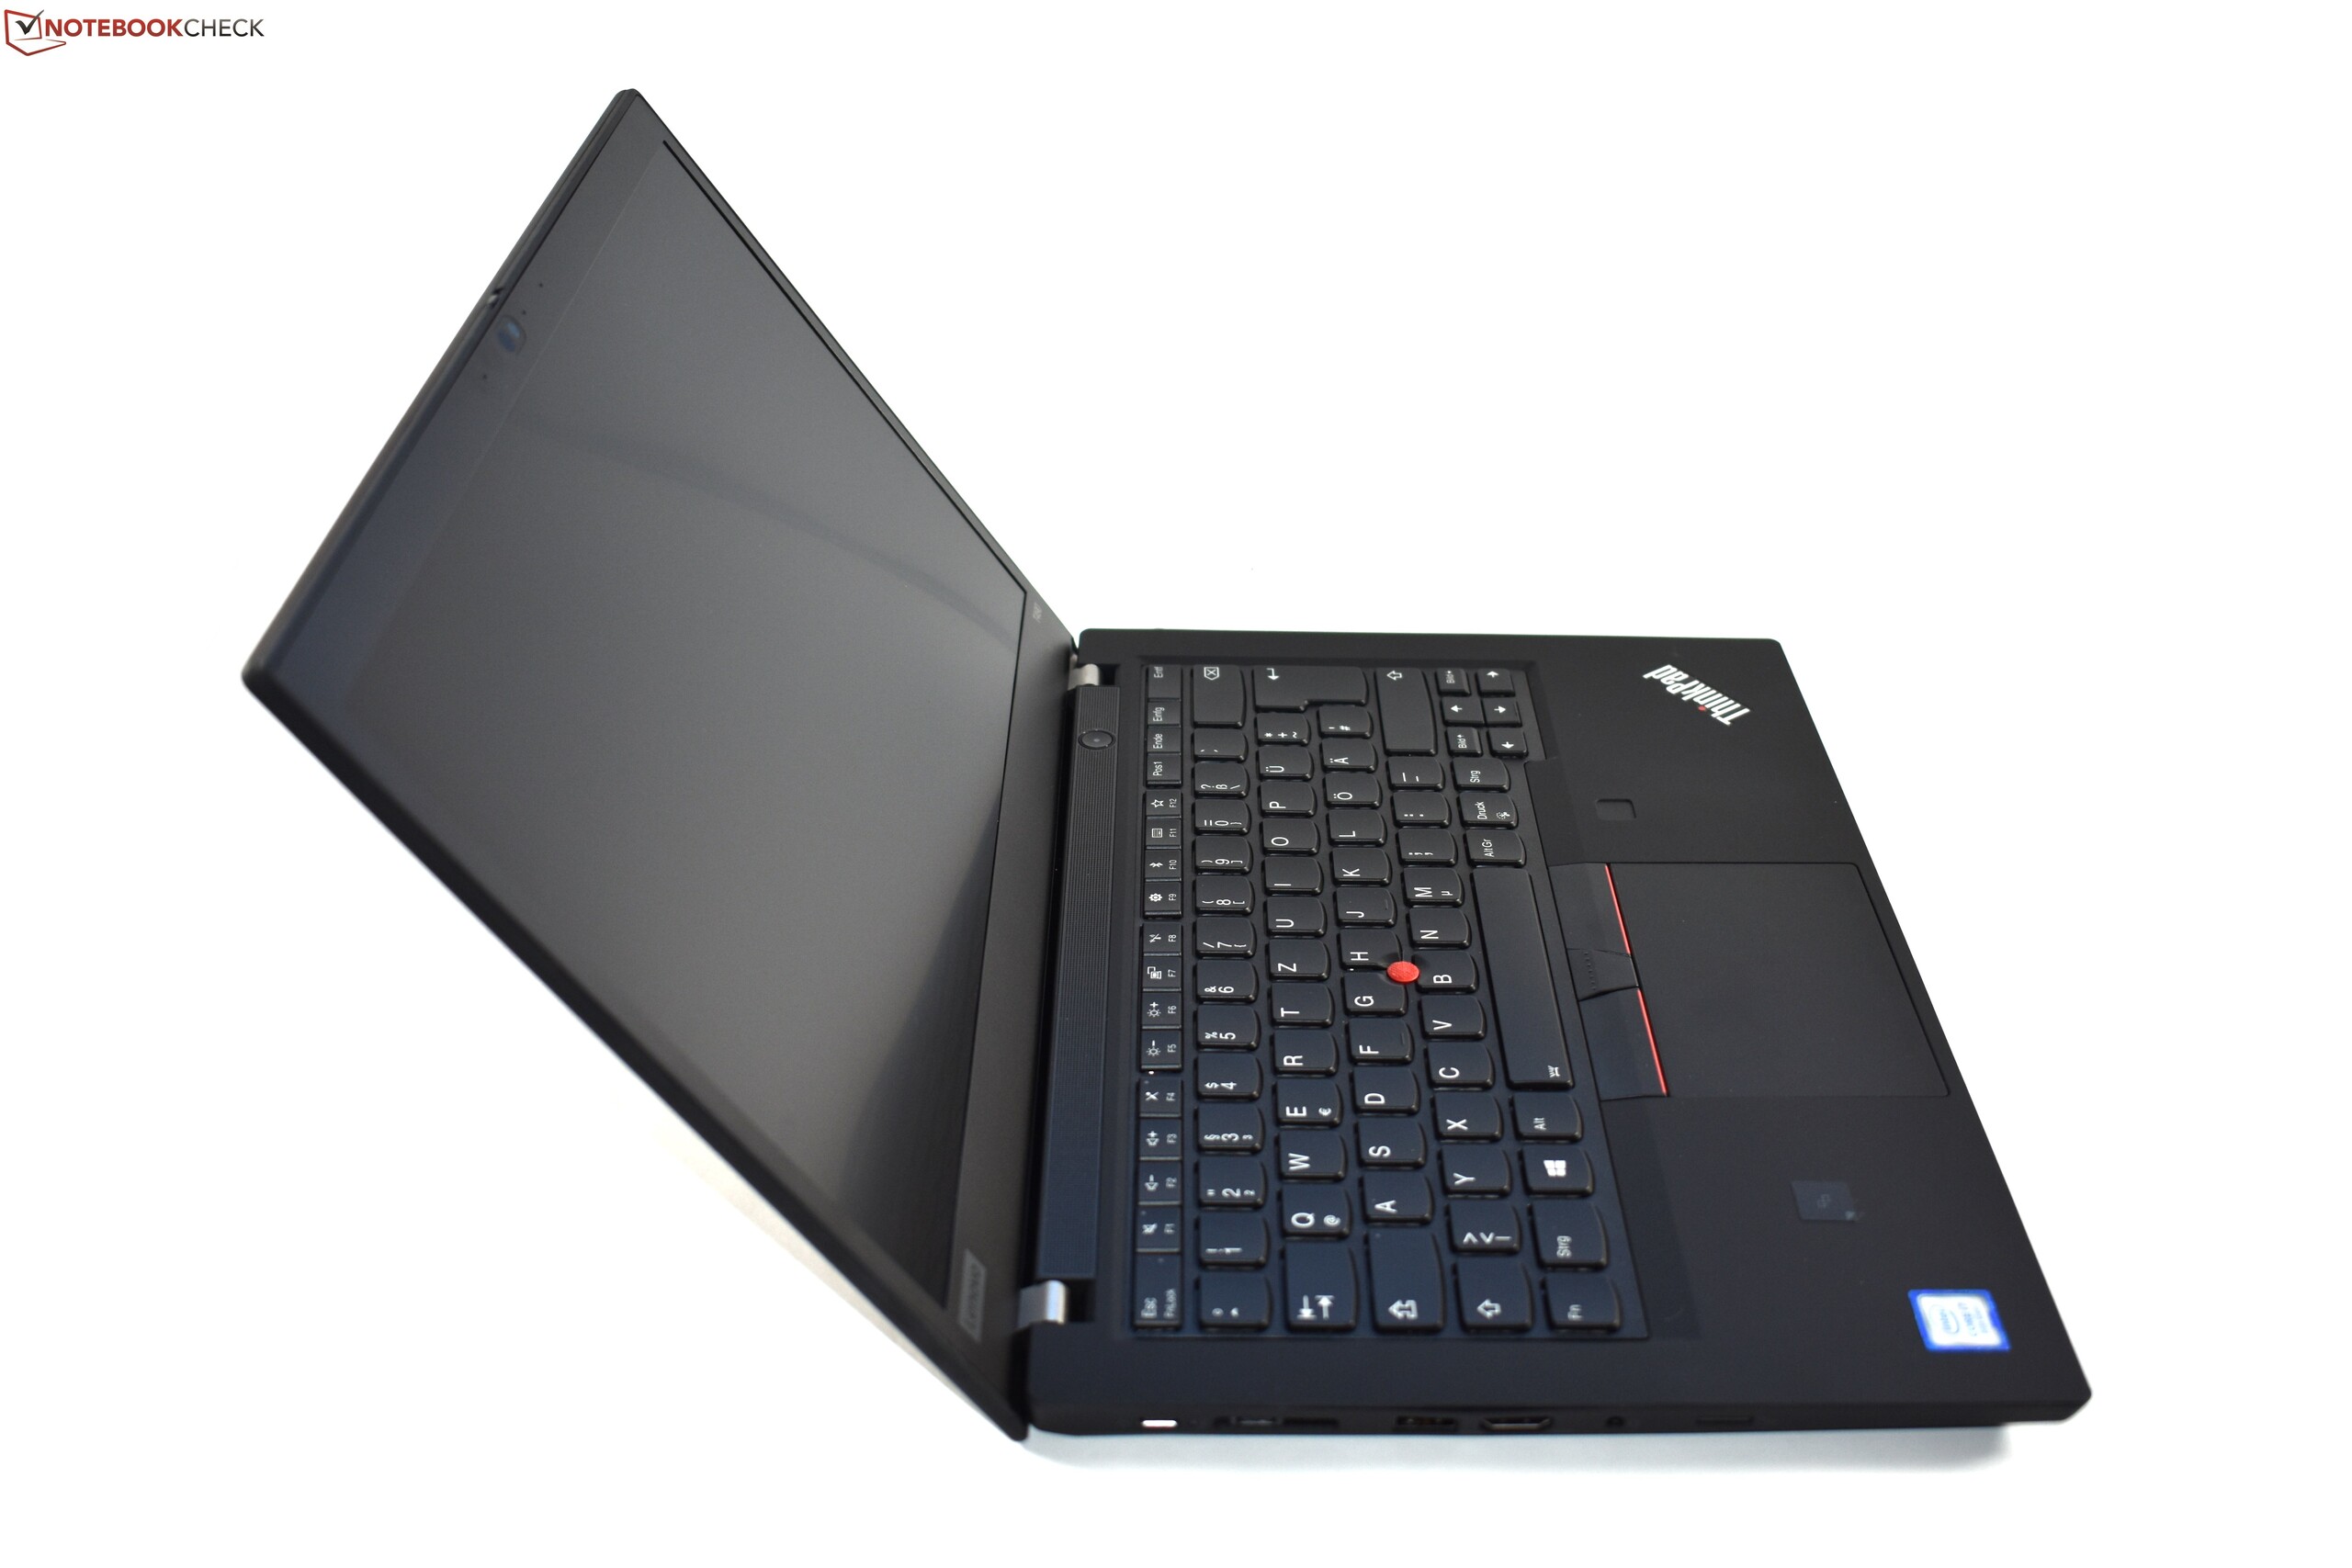
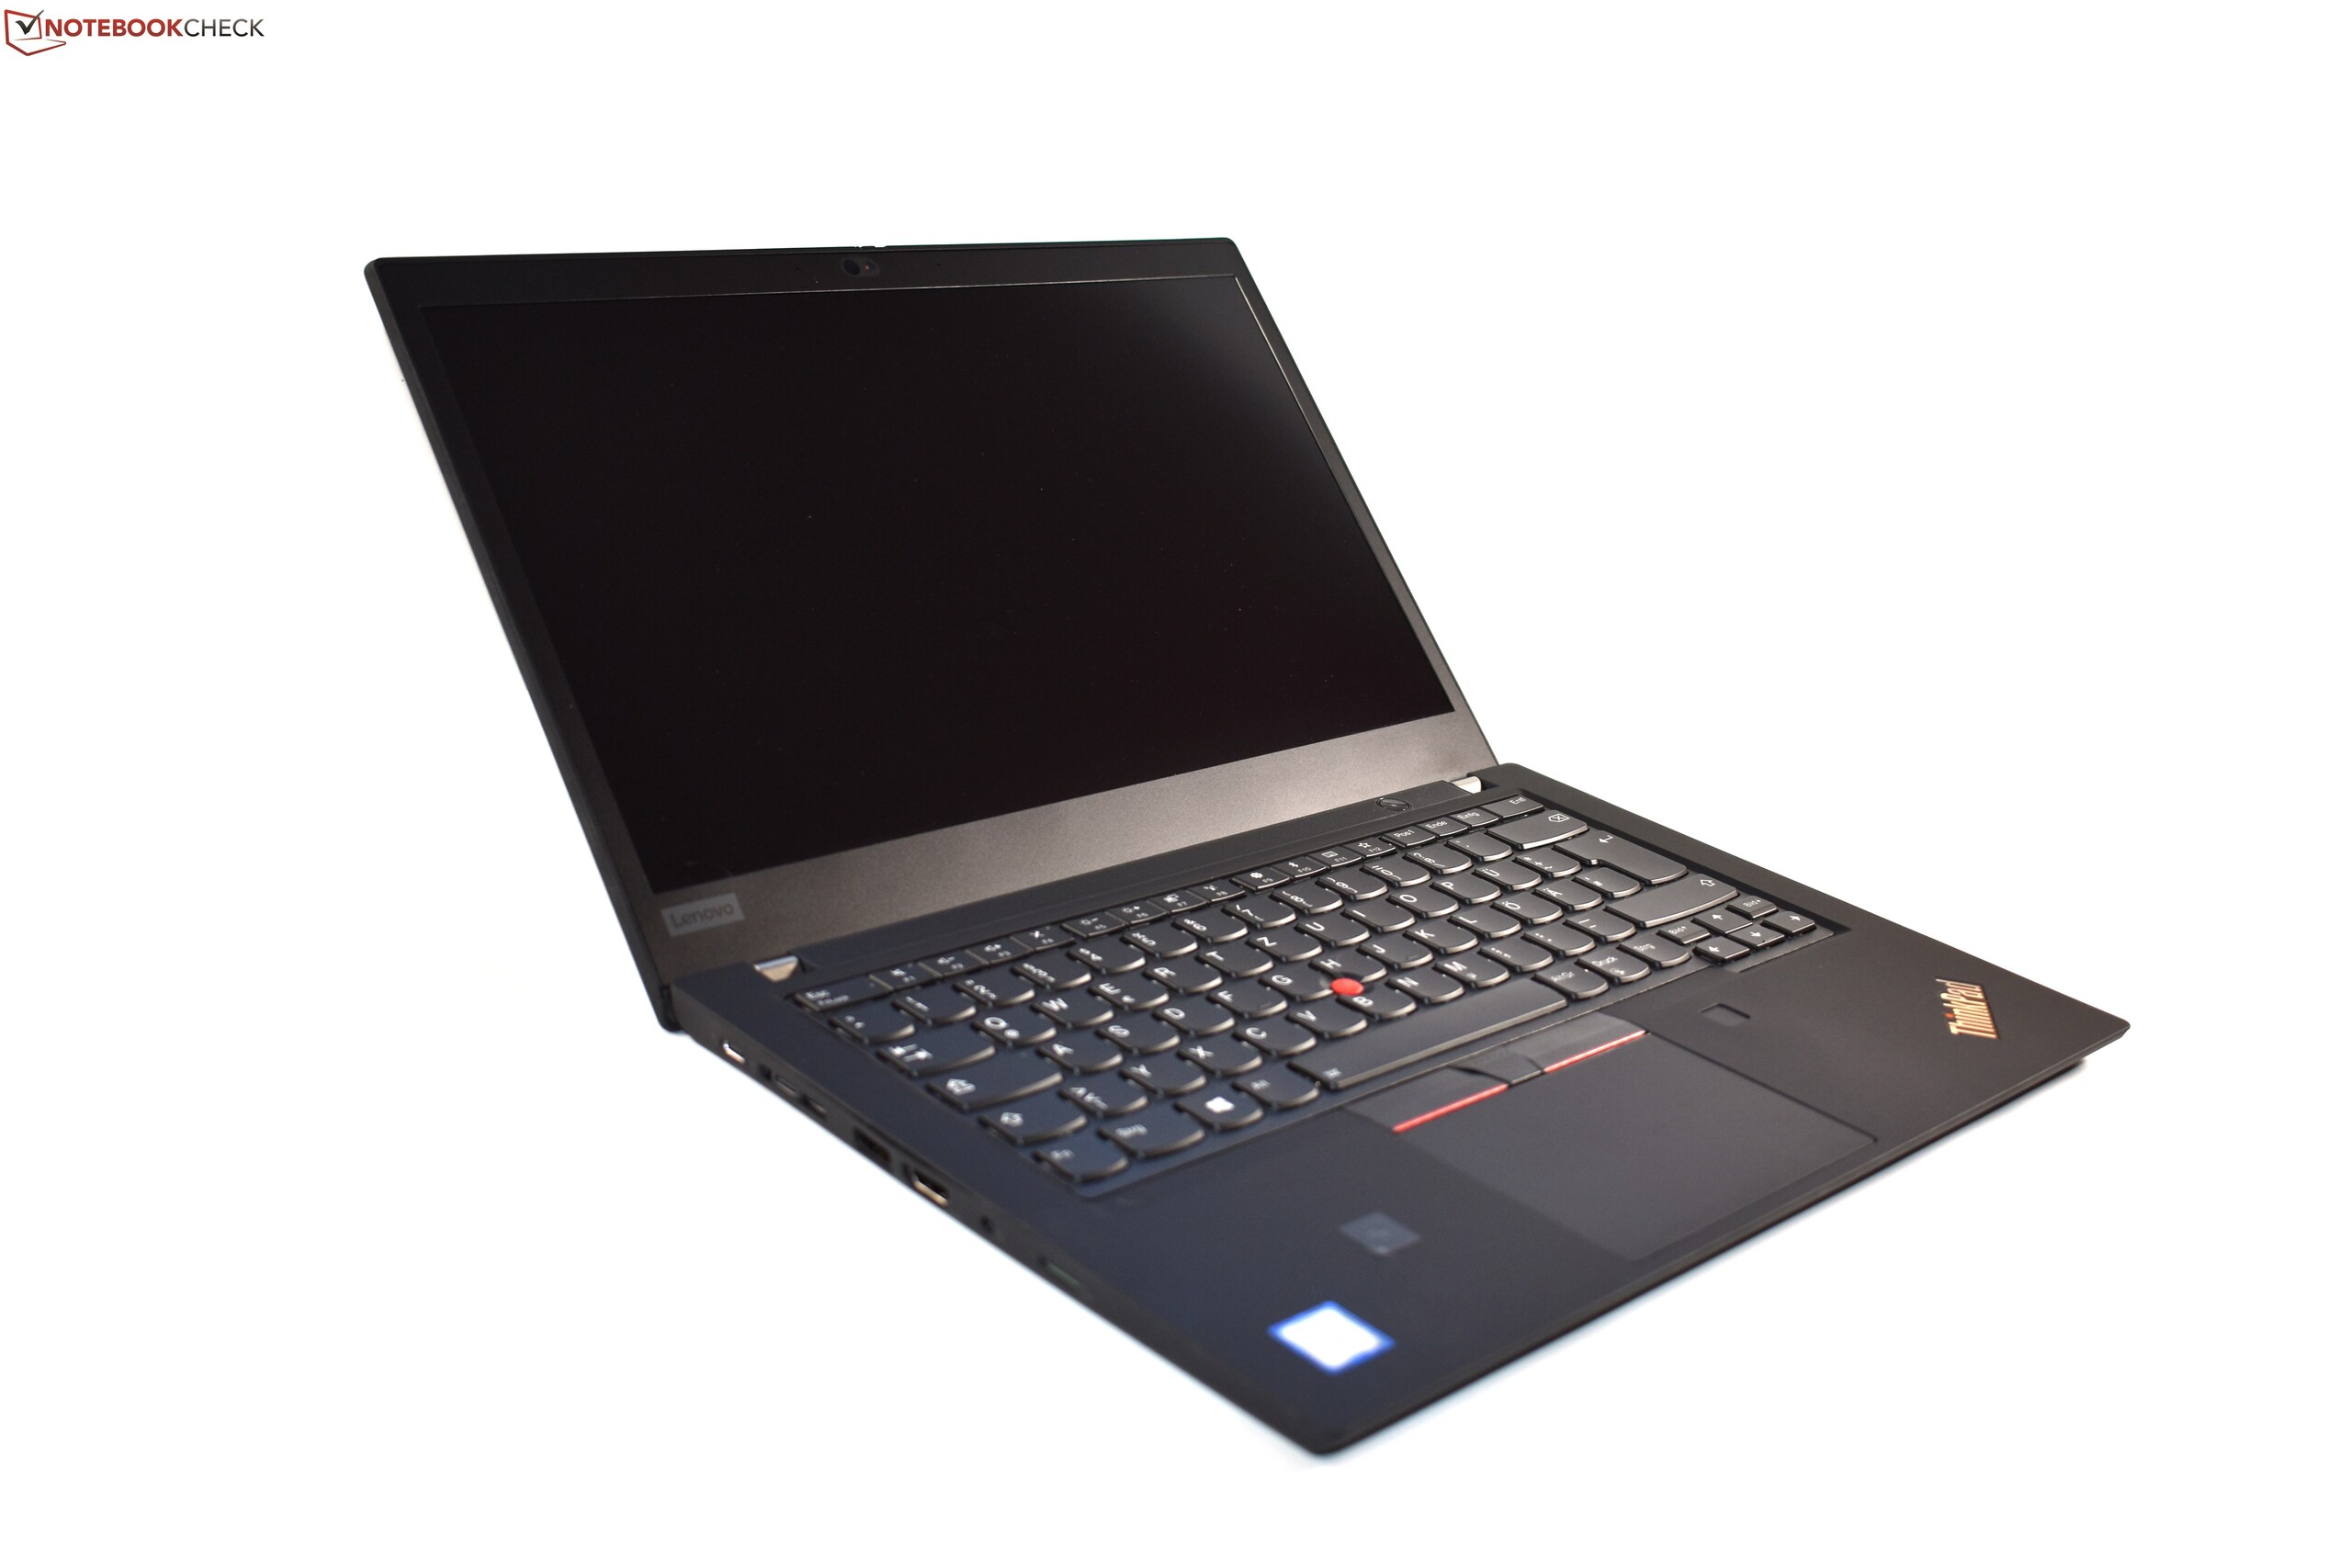
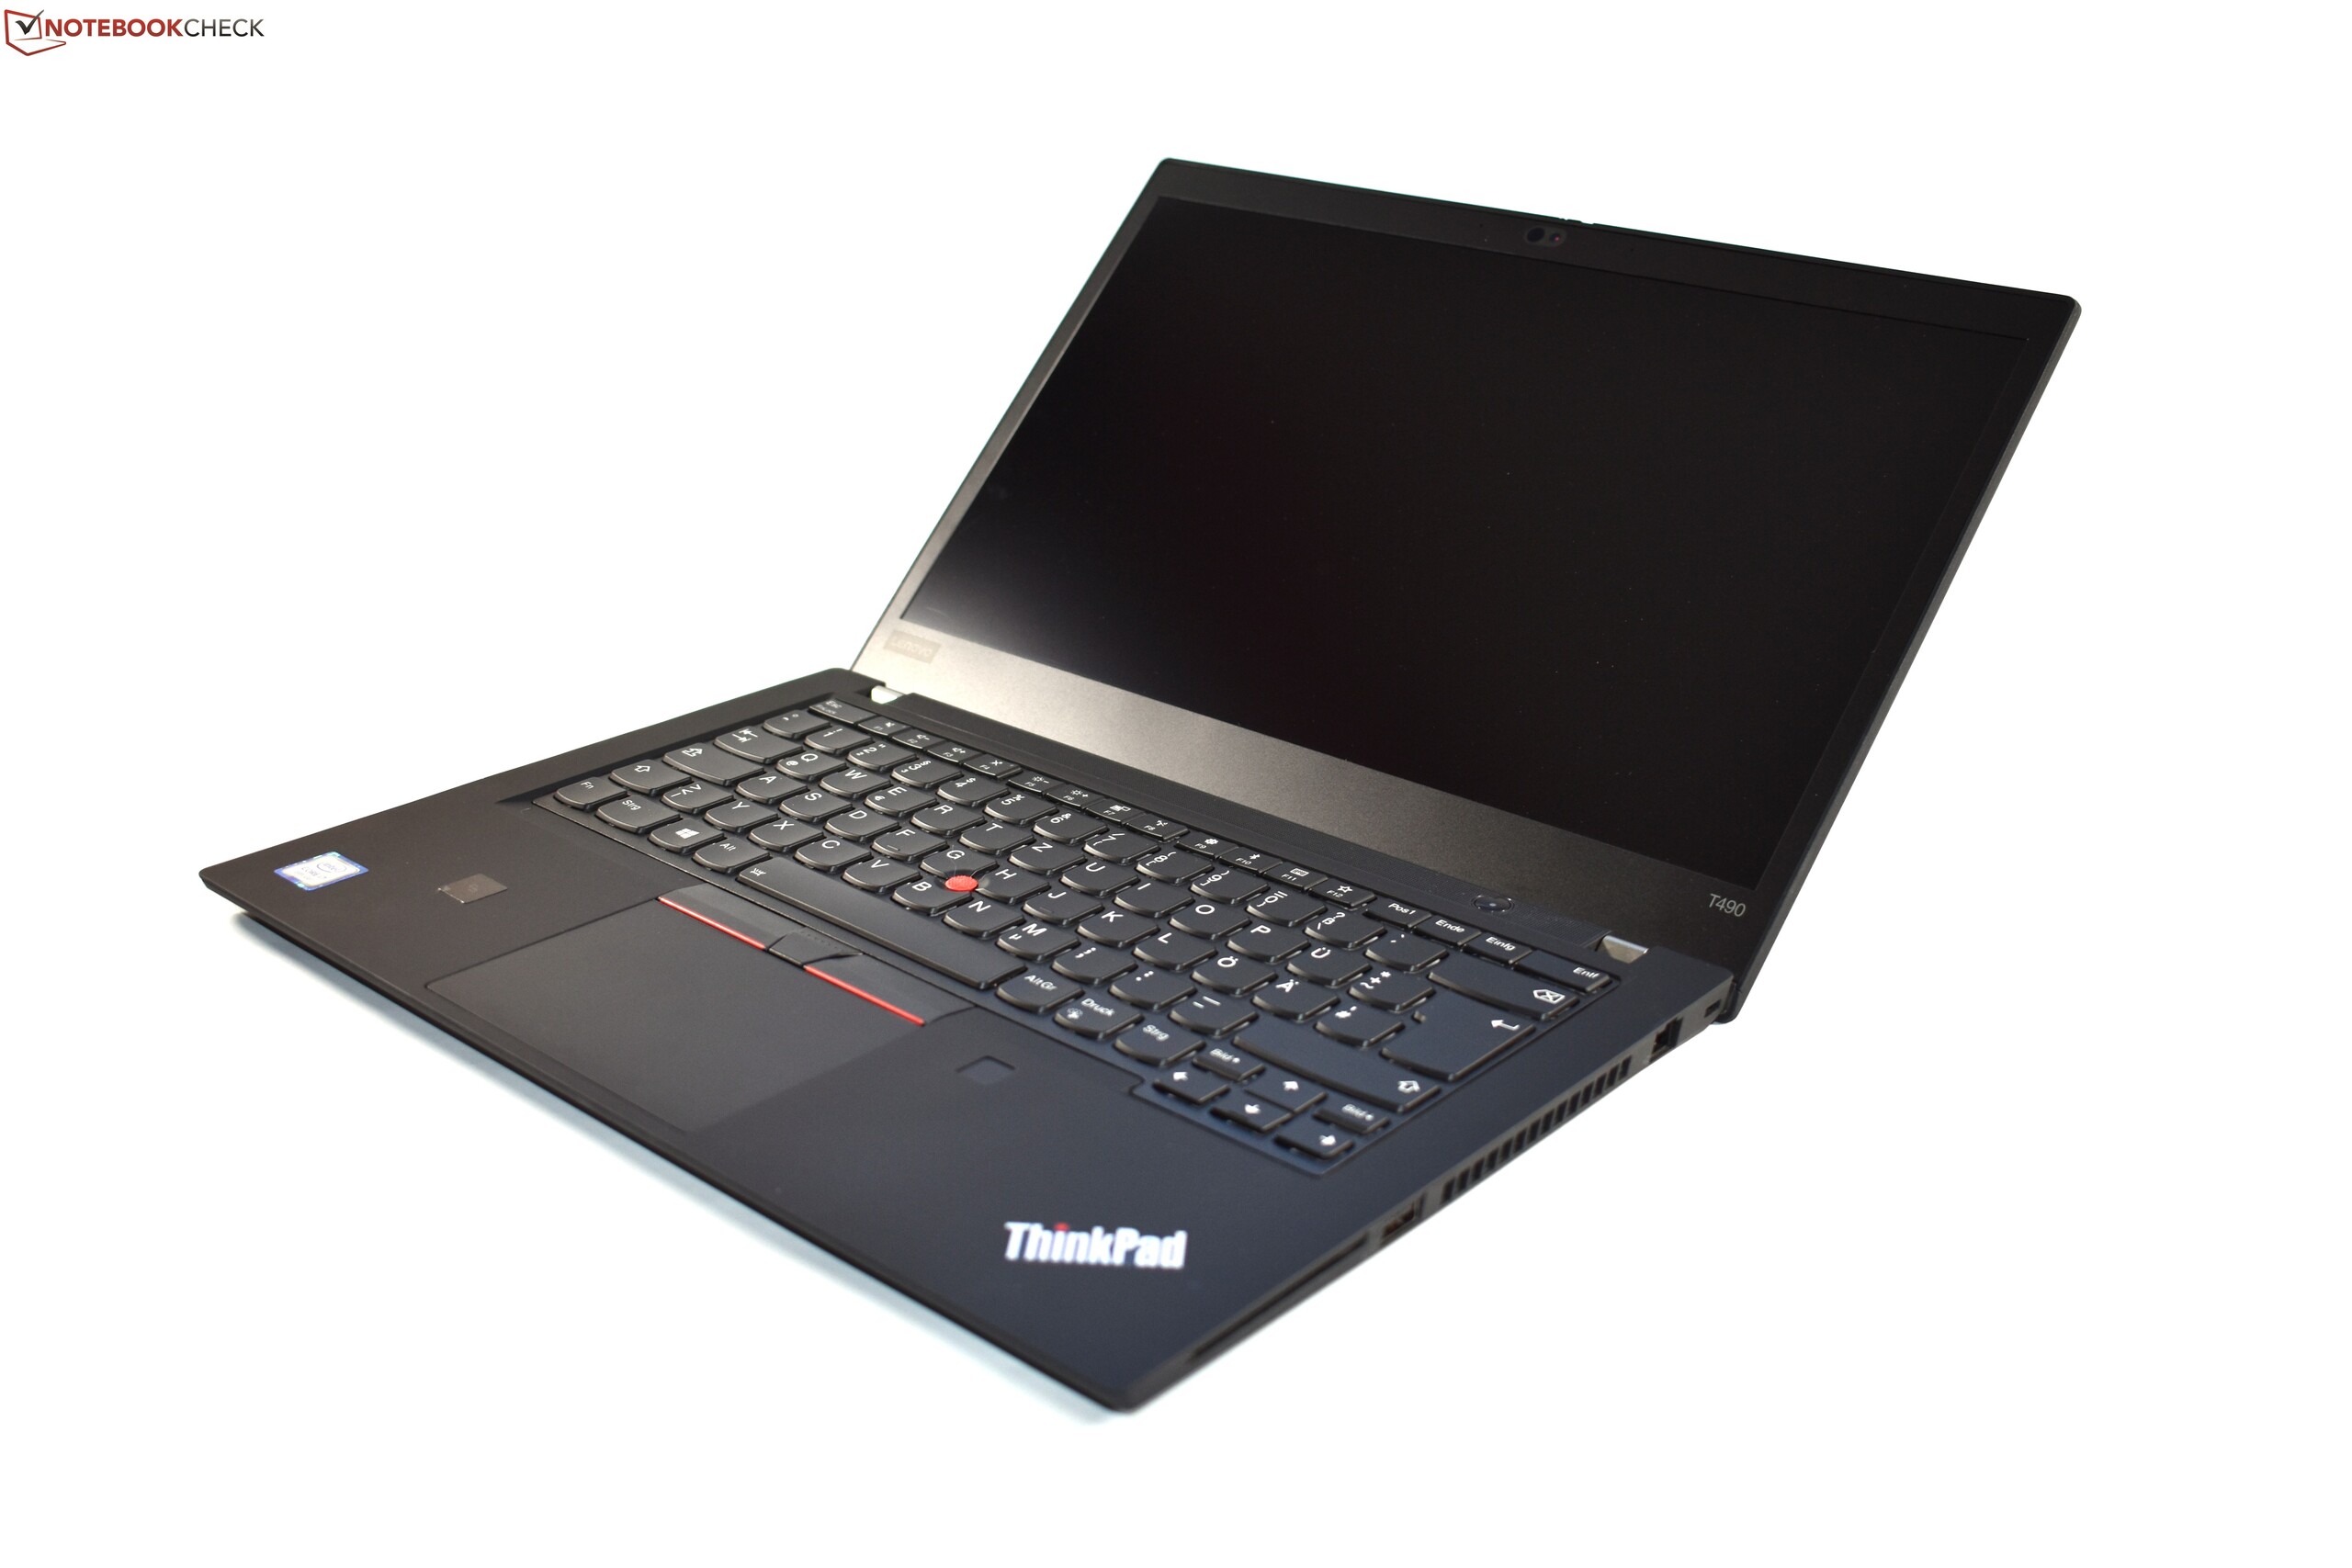
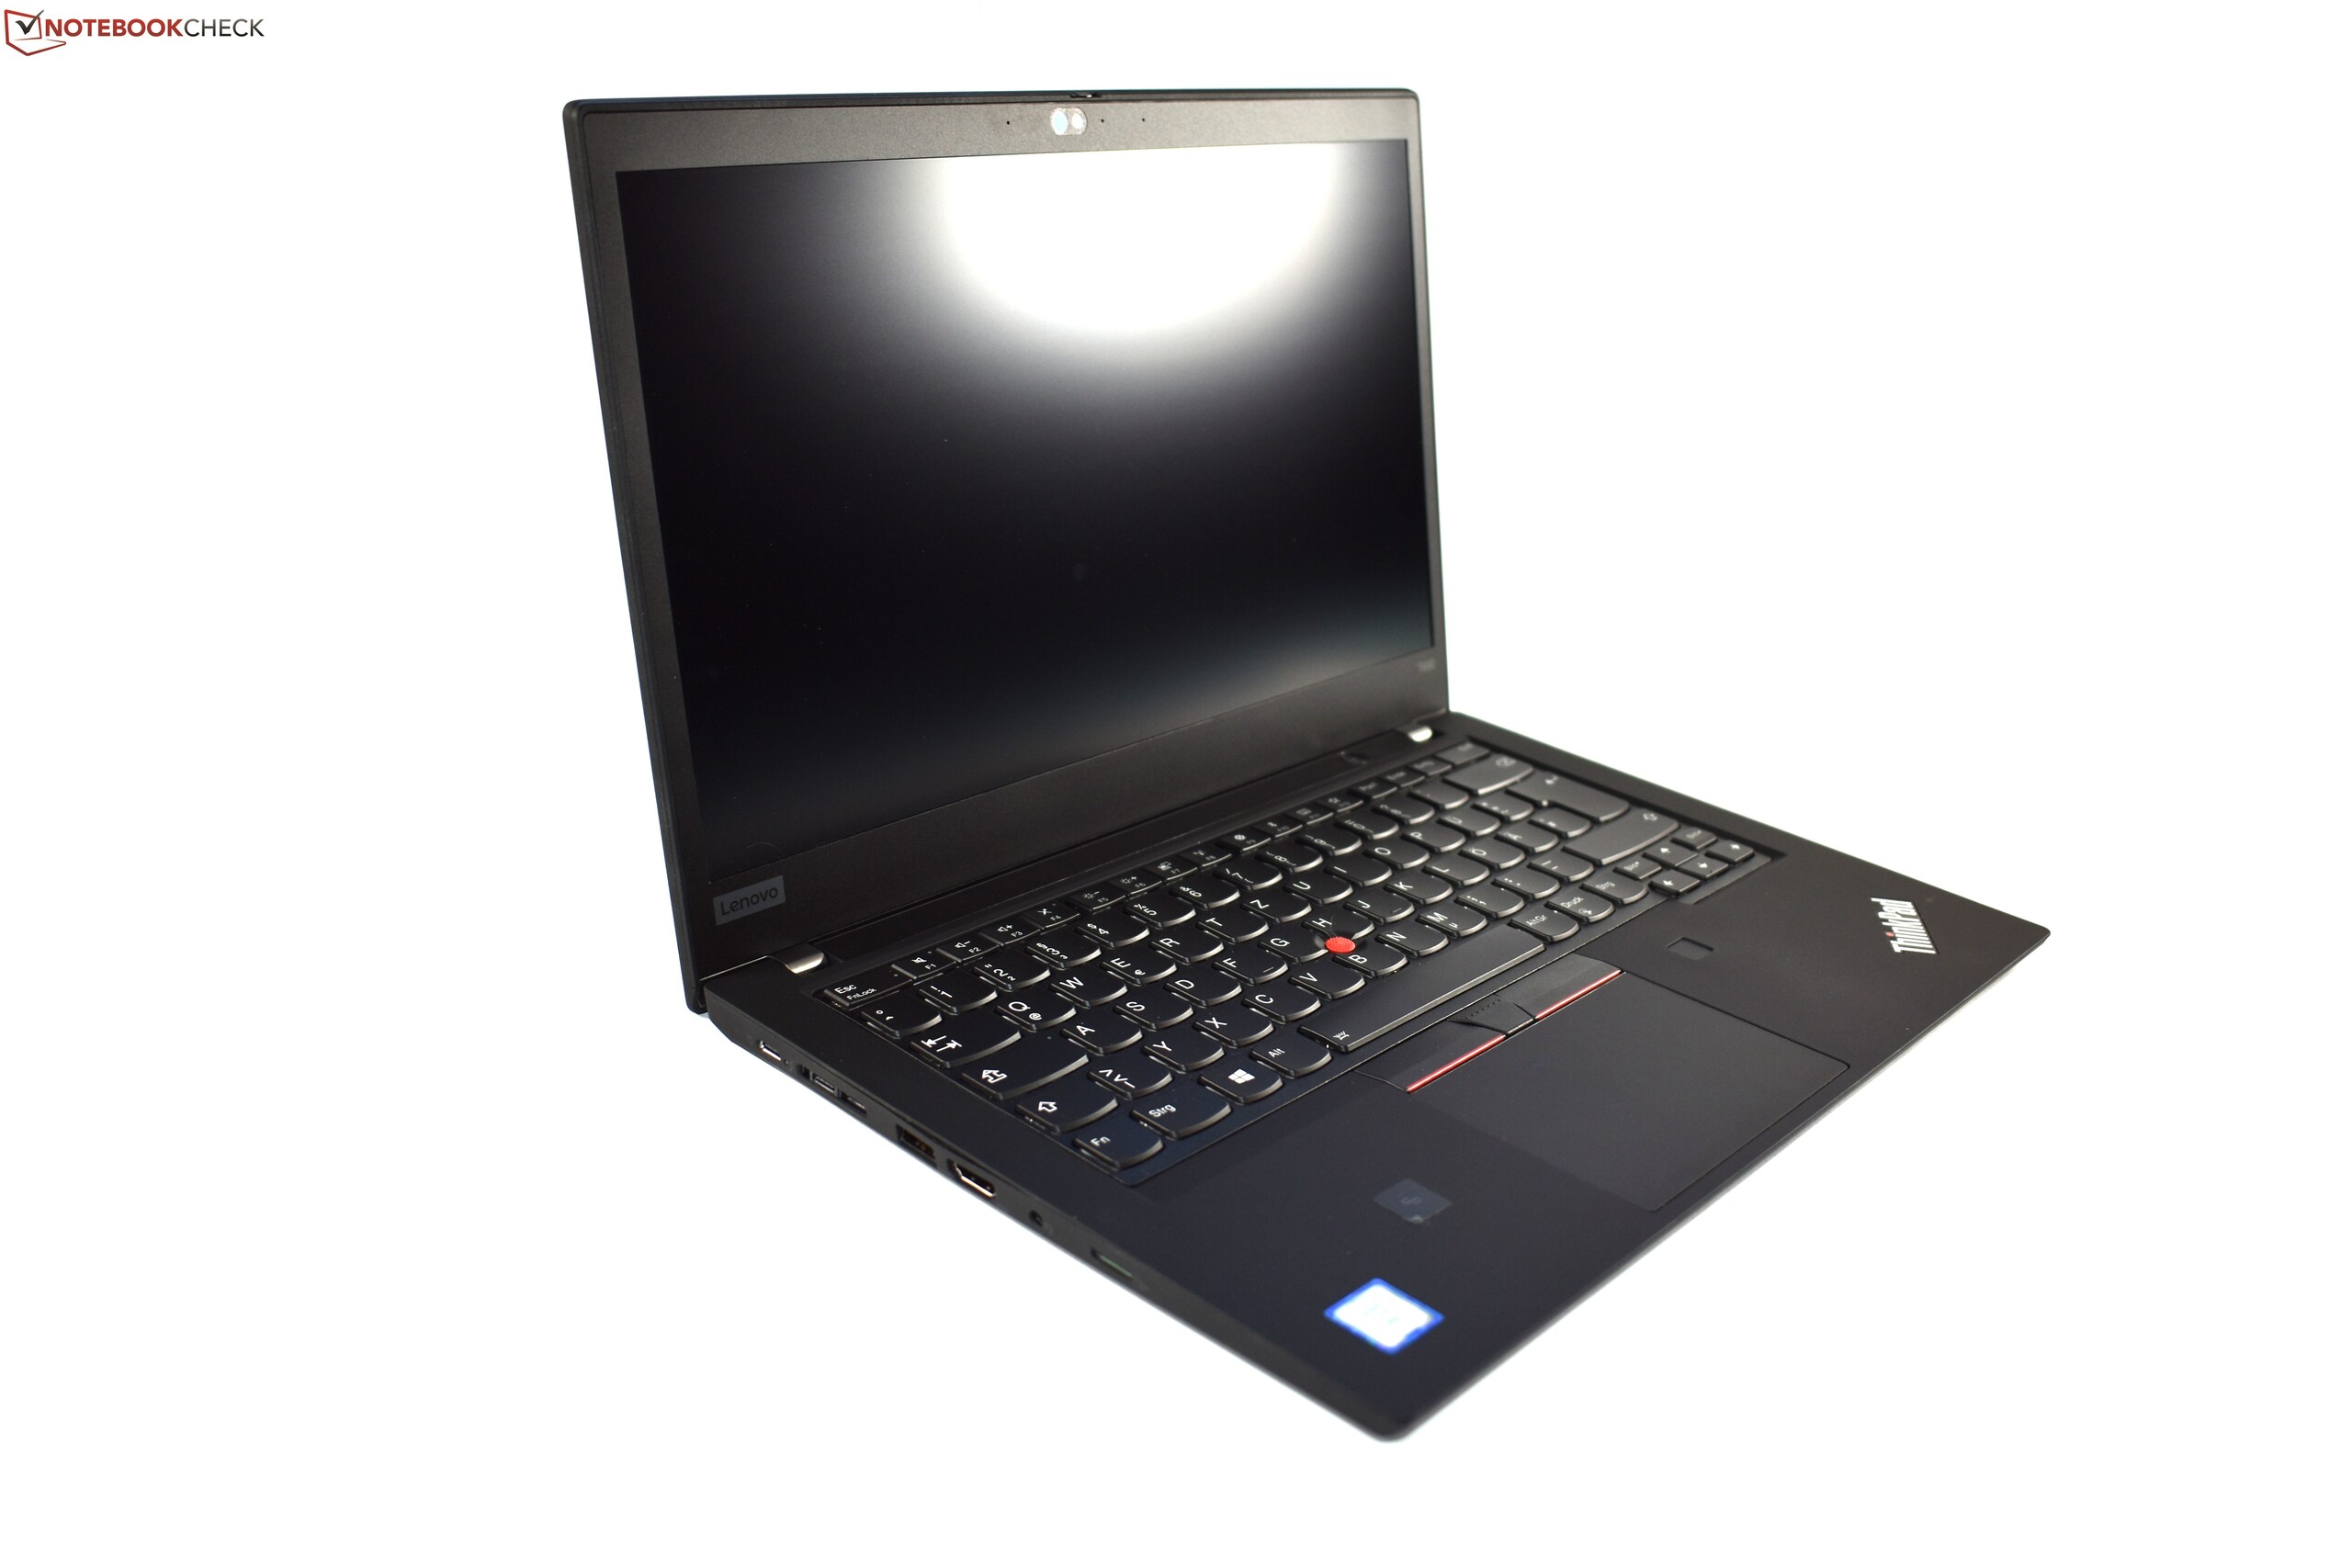
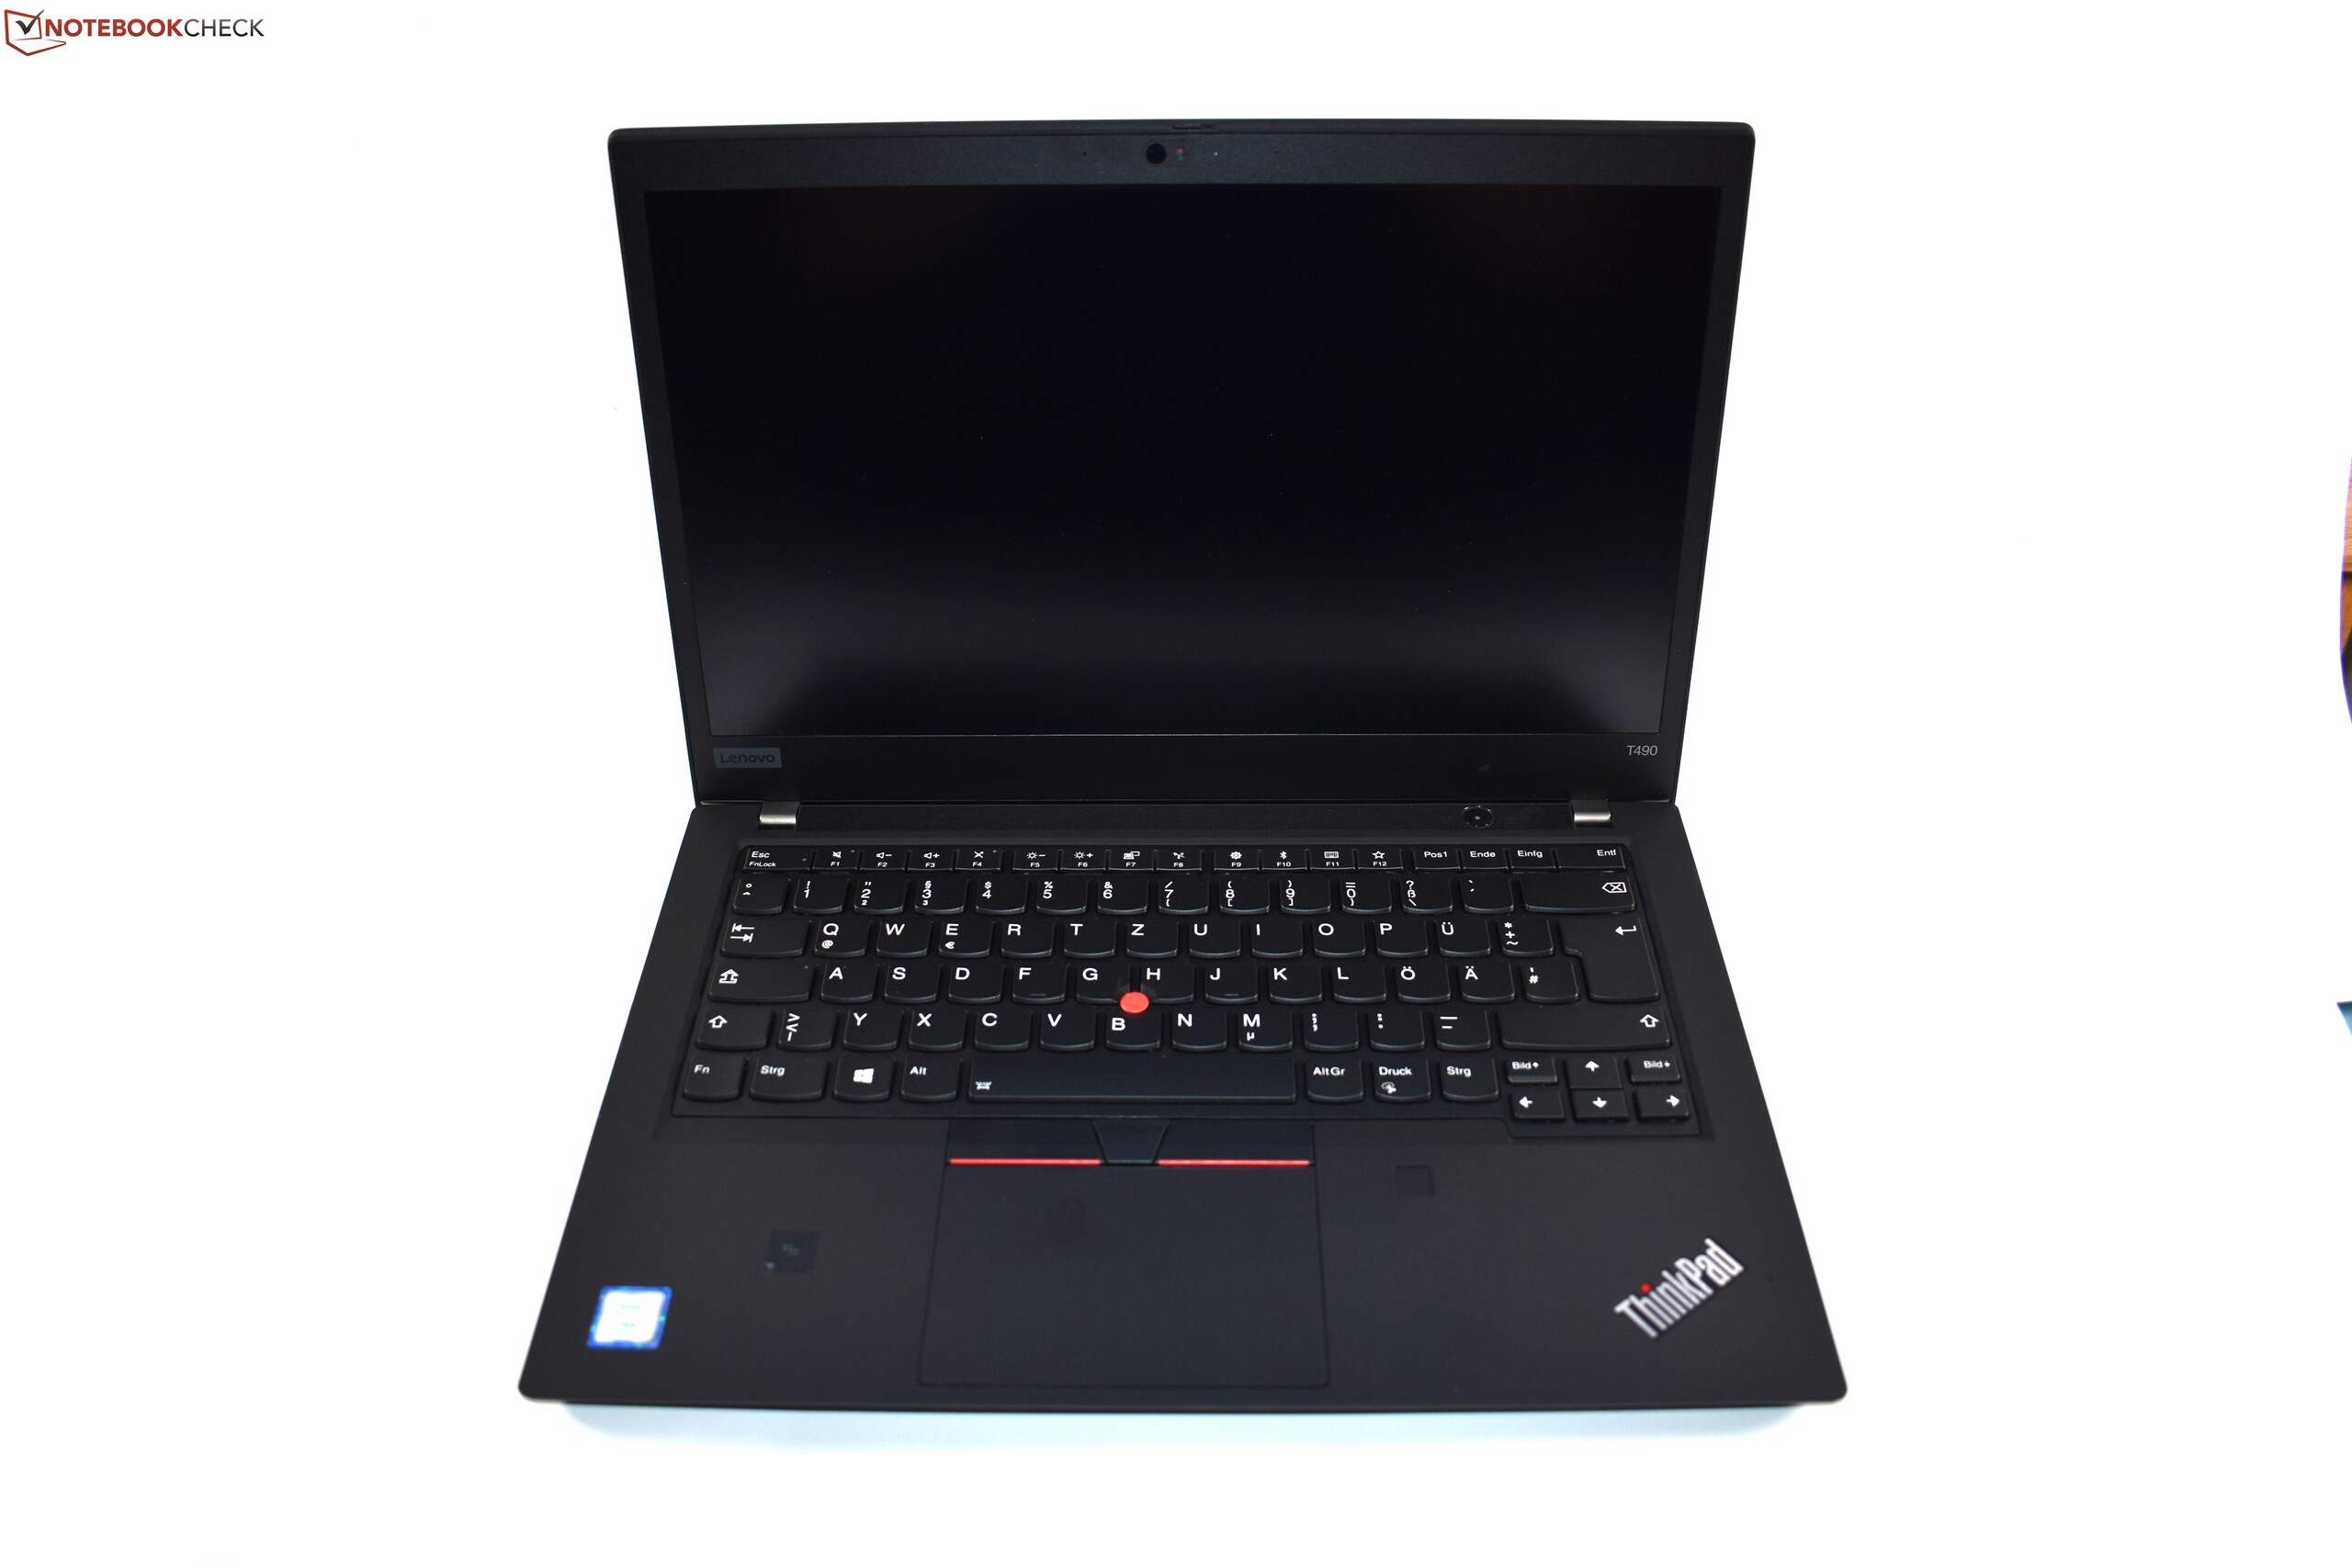
联想ThinkPad T490笔记本电脑评测:一台装配核显的长续航商务本
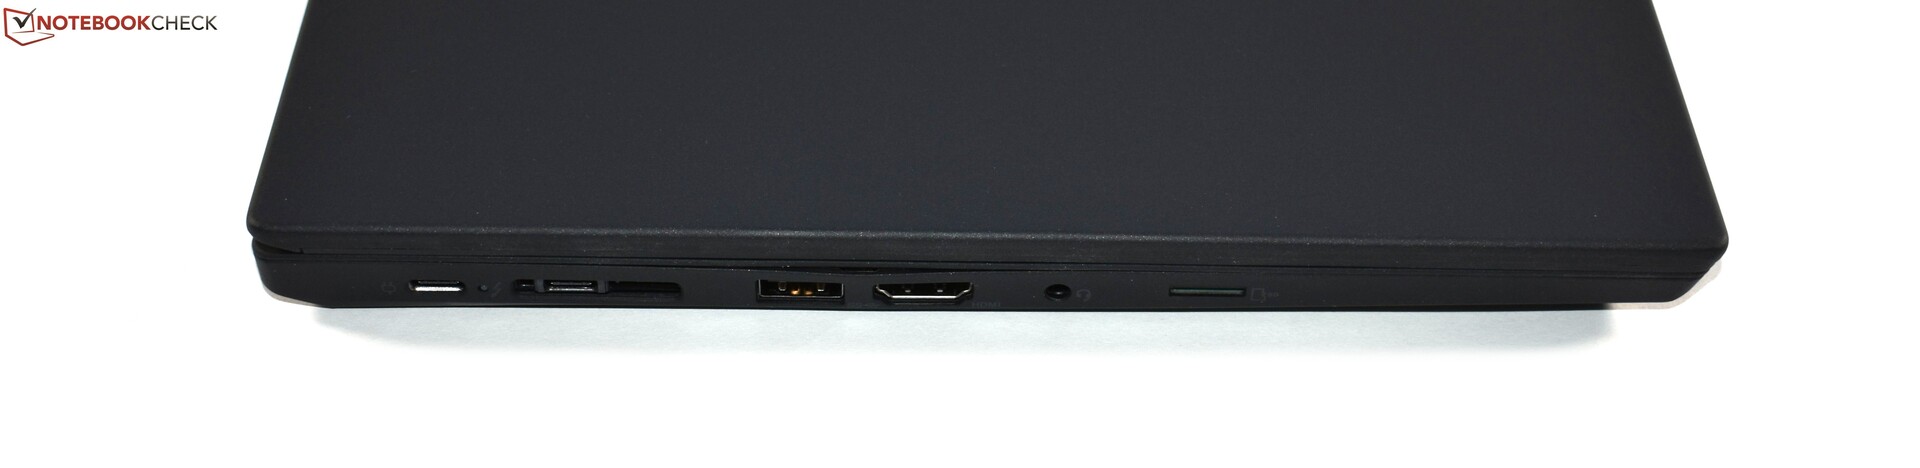
| SD Card Reader | |
| average JPG Copy Test (av. of 3 runs) | |
| Dell Latitude 7490 (Toshiba Exceria Pro M501 UHS-II) | |
| Lenovo ThinkPad T480s-20L8S02D00 (Toshiba Exceria Pro SDXC 64 GB UHS-II) | |
| Lenovo ThinkPad T480-20L6S01V00 (Toshiba Exceria Pro SDXC 64 GB UHS-II) | |
| Lenovo ThinkPad T490-20N2004EGE (Toshiba Exceria Pro M501 64 GB UHS-II) | |
| Lenovo ThinkPad T490s-20NYS02A00 (Toshiba Exceria Pro M501) | |
| Average of class Office (19.8 - 198.5, n=22, last 2 years) | |
| maximum AS SSD Seq Read Test (1GB) | |
| Dell Latitude 7490 (Toshiba Exceria Pro M501 UHS-II) | |
| Lenovo ThinkPad T480s-20L8S02D00 (Toshiba Exceria Pro SDXC 64 GB UHS-II) | |
| Lenovo ThinkPad T490s-20NYS02A00 (Toshiba Exceria Pro M501) | |
| Lenovo ThinkPad T480-20L6S01V00 (Toshiba Exceria Pro SDXC 64 GB UHS-II) | |
| Lenovo ThinkPad T490-20N2004EGE (Toshiba Exceria Pro M501 64 GB UHS-II) | |
| Average of class Office (27.4 - 249, n=21, last 2 years) | |
| Networking | |
| iperf3 transmit AX12 | |
| Lenovo ThinkPad T490s-20NYS02A00 | |
| Lenovo ThinkPad T490-20N2004EGE | |
| Lenovo ThinkPad T480-20L6S01V00 | |
| Lenovo ThinkPad T480s-20L8S02D00 | |
| Dell Latitude 7490 | |
| iperf3 receive AX12 | |
| Dell Latitude 7490 | |
| Lenovo ThinkPad T490s-20NYS02A00 | |
| Lenovo ThinkPad T490-20N2004EGE | |
| Lenovo ThinkPad T480-20L6S01V00 | |
| Lenovo ThinkPad T480s-20L8S02D00 | |
| |||||||||||||||||||||||||
Brightness Distribution: 91 %
Center on Battery: 428 cd/m²
Contrast: 1476:1 (Black: 0.29 cd/m²)
ΔE ColorChecker Calman: 4.6 | ∀{0.5-29.43 Ø4.71}
calibrated: 2
ΔE Greyscale Calman: 5.4 | ∀{0.09-98 Ø4.96}
92.2% sRGB (Argyll 1.6.3 3D)
60% AdobeRGB 1998 (Argyll 1.6.3 3D)
67.6% AdobeRGB 1998 (Argyll 3D)
92.3% sRGB (Argyll 3D)
69.2% Display P3 (Argyll 3D)
Gamma: 2.09
CCT: 7562 K
| Lenovo ThinkPad T490-20N2004EGE NE140FHM-N61, , 1920x1080, 14" | Lenovo ThinkPad T490-20N3S02L00 NE140FHM-N61, , 1920x1080, 14" | Lenovo ThinkPad T490s-20NYS02A00 B140HAN05.7, , 1920x1080, 14" | HP EliteBook 840 G5-3JX61EA IVO M140NVF7 R0, , 1920x1080, 14" | Dell Latitude 7490 AUO503D (D04YD_B140HAN), , 1920x1080, 14" | Lenovo ThinkPad T480-20L6S01V00 Lenovo LP140WF6-SPB7, , 1920x1080, 14" | |
|---|---|---|---|---|---|---|
| Display | 0% | 1% | -8% | 0% | -40% | |
| Display P3 Coverage (%) | 69.2 | 69.3 0% | 67.1 -3% | 61 -12% | 66.6 -4% | 39.24 -43% |
| sRGB Coverage (%) | 92.3 | 92.2 0% | 97.6 6% | 87.7 -5% | 96.8 5% | 58.8 -36% |
| AdobeRGB 1998 Coverage (%) | 67.6 | 67.4 0% | 68.5 1% | 62.1 -8% | 67.9 0% | 40.56 -40% |
| Response Times | -3% | 13% | 48% | 36% | 48% | |
| Response Time Grey 50% / Grey 80% * (ms) | 71.2 ? | 74 ? -4% | 61.6 ? 13% | 33 ? 54% | 41.6 ? 42% | 35.6 ? 50% |
| Response Time Black / White * (ms) | 44.8 ? | 45.6 ? -2% | 38.8 ? 13% | 26 ? 42% | 32 ? 29% | 24.8 ? 45% |
| PWM Frequency (Hz) | 2427 ? | 2451 ? | 3125 ? | |||
| Screen | 1% | 15% | 3% | -11% | -38% | |
| Brightness middle (cd/m²) | 428 | 418 -2% | 391 -9% | 655 53% | 308.6 -28% | 307 -28% |
| Brightness (cd/m²) | 409 | 400 -2% | 389 -5% | 630 54% | 294 -28% | 295 -28% |
| Brightness Distribution (%) | 91 | 88 -3% | 87 -4% | 93 2% | 89 -2% | 90 -1% |
| Black Level * (cd/m²) | 0.29 | 0.24 17% | 0.23 21% | 0.56 -93% | 0.23 21% | 0.25 14% |
| Contrast (:1) | 1476 | 1742 18% | 1700 15% | 1170 -21% | 1342 -9% | 1228 -17% |
| Colorchecker dE 2000 * | 4.6 | 4.7 -2% | 3.4 26% | 3.27 29% | 6.07 -32% | 5.7 -24% |
| Colorchecker dE 2000 max. * | 8.2 | 8.7 -6% | 4.7 43% | 5.92 28% | 10.58 -29% | 21.3 -160% |
| Colorchecker dE 2000 calibrated * | 2 | 2.1 -5% | 1.1 45% | 3.22 -61% | 1.67 16% | 4.7 -135% |
| Greyscale dE 2000 * | 5.4 | 5.9 -9% | 4 26% | 2.85 47% | 7.3 -35% | 3.7 31% |
| Gamma | 2.09 105% | 2.06 107% | 2.49 88% | 2.45 90% | 2.061 107% | 2.11 104% |
| CCT | 7562 86% | 7350 88% | 6809 95% | 6065 107% | 7269 89% | 7353 88% |
| Color Space (Percent of AdobeRGB 1998) (%) | 60 | 59.9 0% | 62.4 4% | 57 -5% | 62 3% | 37.4 -38% |
| Color Space (Percent of sRGB) (%) | 92.2 | 92.1 0% | 97.4 6% | 88 -5% | 97 5% | 58.7 -36% |
| Total Average (Program / Settings) | -1% /
0% | 10% /
12% | 14% /
6% | 8% /
-3% | -10% /
-28% |
* ... smaller is better
Display Response Times
| ↔ Response Time Black to White | ||
|---|---|---|
| 44.8 ms ... rise ↗ and fall ↘ combined | ↗ 21.2 ms rise | 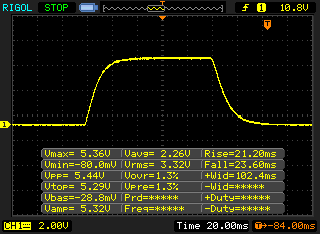 |
| ↘ 23.6 ms fall | ||
| The screen shows slow response rates in our tests and will be unsatisfactory for gamers. In comparison, all tested devices range from 0.1 (minimum) to 240 (maximum) ms. » 99 % of all devices are better. This means that the measured response time is worse than the average of all tested devices (19.8 ms). | ||
| ↔ Response Time 50% Grey to 80% Grey | ||
| 71.2 ms ... rise ↗ and fall ↘ combined | ↗ 33.2 ms rise | 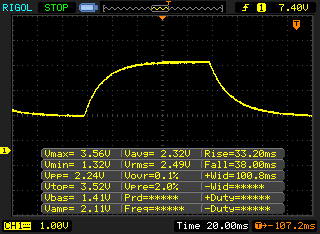 |
| ↘ 38 ms fall | ||
| The screen shows slow response rates in our tests and will be unsatisfactory for gamers. In comparison, all tested devices range from 0.165 (minimum) to 636 (maximum) ms. » 99 % of all devices are better. This means that the measured response time is worse than the average of all tested devices (30.9 ms). | ||
Screen Flickering / PWM (Pulse-Width Modulation)
| Screen flickering / PWM detected | 2427 Hz | ≤ 50 % brightness setting | 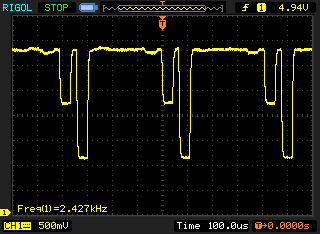 |
The display backlight flickers at 2427 Hz (worst case, e.g., utilizing PWM) Flickering detected at a brightness setting of 50 % and below. There should be no flickering or PWM above this brightness setting. The frequency of 2427 Hz is quite high, so most users sensitive to PWM should not notice any flickering. In comparison: 52 % of all tested devices do not use PWM to dim the display. If PWM was detected, an average of 7741 (minimum: 5 - maximum: 343500) Hz was measured. | |||
| PCMark 8 Home Score Accelerated v2 | 3436 points | |
| PCMark 8 Work Score Accelerated v2 | 4824 points | |
| PCMark 10 Score | 3704 points | |
Help | ||
| Lenovo ThinkPad T490-20N2004EGE Toshiba KXG5AZNV256G | Dell Latitude 7490 Toshiba KSG60ZMV256G | Lenovo ThinkPad T480s-20L8S02D00 Samsung SSD PM981 MZVLB512HAJQ | Lenovo ThinkPad T480-20L6S01V00 Samsung SSD PM981 MZVLB512HAJQ | Lenovo ThinkPad T490s-20NYS02A00 Intel SSD Pro 7600p SSDPEKKF512G8L | HP EliteBook 840 G5-3JX61EA Toshiba KXG50ZNV1T02 | Lenovo ThinkPad T490-20N3S02L00 Toshiba XG5 KXG50ZNV512G | Average Toshiba KXG5AZNV256G | |
|---|---|---|---|---|---|---|---|---|
| CrystalDiskMark 5.2 / 6 | -56% | 17% | -2% | 8% | -5% | 12% | -10% | |
| Write 4K (MB/s) | 119.9 | 79.4 -34% | 155.4 30% | 153.1 28% | 122 2% | 96.1 -20% | 126.6 6% | 115.4 ? -4% |
| Read 4K (MB/s) | 39.94 | 27.37 -31% | 47.61 19% | 48.3 21% | 45.56 14% | 31.12 -22% | 43.61 9% | 38.2 ? -4% |
| Write Seq (MB/s) | 1334 | 343.9 -74% | 1624 22% | 866 -35% | 1497 12% | 919 -31% | 1342 1% | 908 ? -32% |
| Read Seq (MB/s) | 1357 | 472.7 -65% | 1346 -1% | 904 -33% | 2385 76% | 2089 54% | 1251 -8% | 1391 ? 3% |
| Write 4K Q32T1 (MB/s) | 311.2 | 206 -34% | 340.7 9% | 424.6 36% | 240.9 -23% | 425.6 37% | 297.7 -4% | 333 ? 7% |
| Read 4K Q32T1 (MB/s) | 400.6 | 188.3 -53% | 449.3 12% | 403.2 1% | 338 -16% | 275.3 -31% | 376.4 -6% | 403 ? 1% |
| Write Seq Q32T1 (MB/s) | 1642 | 343.3 -79% | 1965 20% | 1725 5% | 1528 -7% | 958 -42% | 2969 81% | 1069 ? -35% |
| Read Seq Q32T1 (MB/s) | 2778 | 533 -81% | 3398 22% | 1780 -36% | 2915 5% | 3118 12% | 3228 16% | 2278 ? -18% |

| 3DMark 11 Performance | 1847 points | |
| 3DMark Cloud Gate Standard Score | 7289 points | |
| 3DMark Fire Strike Score | 937 points | |
Help | ||
| low | med. | high | ultra | |
|---|---|---|---|---|
| BioShock Infinite (2013) | 53 | 28.33 | 22.93 | |
| The Witcher 3 (2015) | 15 | |||
| Dota 2 Reborn (2015) | 64 | 38.2 | 18 | 15.9 |
| Rise of the Tomb Raider (2016) | 21.14 | 11.9 | ||
| X-Plane 11.11 (2018) | 23.6 | 15.9 | 14.3 |
Noise level
| Idle |
| 28.8 / 28.8 / 31.7 dB(A) |
| Load |
| 34 / 36.1 dB(A) |
 | ||
30 dB silent 40 dB(A) audible 50 dB(A) loud |
||
min: | ||
(±) The maximum temperature on the upper side is 41.1 °C / 106 F, compared to the average of 34.3 °C / 94 F, ranging from 21.2 to 62.5 °C for the class Office.
(-) The bottom heats up to a maximum of 49.3 °C / 121 F, compared to the average of 36.8 °C / 98 F
(+) In idle usage, the average temperature for the upper side is 22.6 °C / 73 F, compared to the device average of 29.5 °C / 85 F.
(+) The palmrests and touchpad are cooler than skin temperature with a maximum of 30 °C / 86 F and are therefore cool to the touch.
(-) The average temperature of the palmrest area of similar devices was 27.6 °C / 81.7 F (-2.4 °C / -4.3 F).
| Off / Standby | |
| Idle | |
| Load |
|
Key:
min: | |
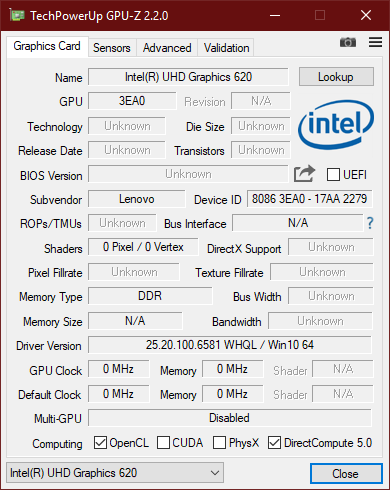
| Lenovo ThinkPad T490-20N2004EGE i5-8265U, UHD Graphics 620, Toshiba KXG5AZNV256G, IGZO IPS LED, 1920x1080, 14" | Lenovo ThinkPad T490-20N3S02L00 i7-8565U, GeForce MX250, Toshiba XG5 KXG50ZNV512G, IGZO IPS LED, 1920x1080, 14" | Lenovo ThinkPad T490s-20NYS02A00 i5-8265U, UHD Graphics 620, Intel SSD Pro 7600p SSDPEKKF512G8L, IPS, 1920x1080, 14" | Dell Latitude 7490 i5-8350U, UHD Graphics 620, Toshiba KSG60ZMV256G, IPS, 1920x1080, 14" | Lenovo ThinkPad T480s-20L8S02D00 i5-8250U, UHD Graphics 620, Samsung SSD PM981 MZVLB512HAJQ, IPS, 2560x1440, 14" | Lenovo ThinkPad T480-20L6S01V00 i5-8550U, GeForce MX150, Samsung SSD PM981 MZVLB512HAJQ, IPS, 1920x1080, 14" | HP EliteBook 840 G5-3JX61EA i5-8550U, UHD Graphics 620, Toshiba KXG50ZNV1T02, IPS, 1920x1080, 14" | Average Intel UHD Graphics 620 | Average of class Office | |
|---|---|---|---|---|---|---|---|---|---|
| Power Consumption | -21% | -11% | 14% | -31% | -44% | -24% | -19% | -35% | |
| Idle Minimum * (Watt) | 2.34 | 2.16 8% | 2.62 -12% | 2 15% | 3.1 -32% | 3.6 -54% | 3.8 -62% | 3.81 ? -63% | 4.25 ? -82% |
| Idle Average * (Watt) | 5.22 | 5.04 3% | 5.16 1% | 4.7 10% | 6.8 -30% | 7.1 -36% | 8.3 -59% | 6.94 ? -33% | 7.3 ? -40% |
| Idle Maximum * (Watt) | 8.82 | 8.64 2% | 8.7 1% | 5.7 35% | 10.1 -15% | 9.5 -8% | 10.7 -21% | 8.75 ? 1% | 8.57 ? 3% |
| Load Average * (Watt) | 35.8 | 63.2 -77% | 40 -12% | 38.4 -7% | 48.4 -35% | 63.9 -78% | 35.5 1% | 35 ? 2% | 43.8 ? -22% |
| Load Maximum * (Watt) | 47.3 | 67.5 -43% | 64 -35% | 38.9 18% | 67.1 -42% | 67.3 -42% | 37 22% | 47.5 ? -0% | 64.3 ? -36% |
| Witcher 3 ultra * (Watt) | 50 | 53.9 |
* ... smaller is better
| Lenovo ThinkPad T490-20N2004EGE i5-8265U, UHD Graphics 620, 50 Wh | Lenovo ThinkPad T490-20N3S02L00 i7-8565U, GeForce MX250, 50 Wh | Lenovo ThinkPad T490s-20NYS02A00 i5-8265U, UHD Graphics 620, 57 Wh | Dell Latitude 7490 i5-8350U, UHD Graphics 620, 60 Wh | Lenovo ThinkPad T480s-20L8S02D00 i5-8250U, UHD Graphics 620, 57 Wh | Lenovo ThinkPad T480-20L6S01V00 i5-8550U, GeForce MX150, 72 Wh | HP EliteBook 840 G5-3JX61EA i5-8550U, UHD Graphics 620, 50 Wh | Average of class Office | |
|---|---|---|---|---|---|---|---|---|
| Battery runtime | -26% | -3% | -4% | -7% | 11% | -22% | 15% | |
| H.264 (h) | 11.3 | 8.7 -23% | 13.9 23% | 12 6% | 10.6 -6% | 15.4 ? 36% | ||
| WiFi v1.3 (h) | 9.5 | 9.1 -4% | 10.1 6% | 9.1 -4% | 9 -5% | 13.2 39% | 7.4 -22% | 13.2 ? 39% |
| Load (h) | 2.7 | 1.3 -52% | 1.7 -37% | 2.1 -22% | 2.7 0% | 1.863 ? -31% | ||
| Reader / Idle (h) | 27.9 | 24.5 ? |
Pros
Cons

无论有没有独显,联想ThinkPad T490都是一款出色的商用笔记本电脑。没有独显的型号在某些领域比带独显的ThinkPad T490稍好一些,它将整体评级从我们给配备MX250的同型号产品的90%提升到91%。
除此之外,我们的评测单元比独显版ThinkPad T490具有更好的续航时间。前者比后者温度更低,并且不会受到恼人的扬声器噪音的影响。联想在很大程度上通过BIOS更新消除了这一点,所以它不应该影响任何ThinkPad T490 SKU。
此外,核显版本的T490由于较弱的CPU,在进行压力测试时也不会受到限制。而其他T490的亮点仍然存在,例如坚固轻巧的外壳,梦幻般的输入设备以及明亮且色彩准确的显示屏。我们也很欣赏多种接口选择和高于平均的CPU性能。
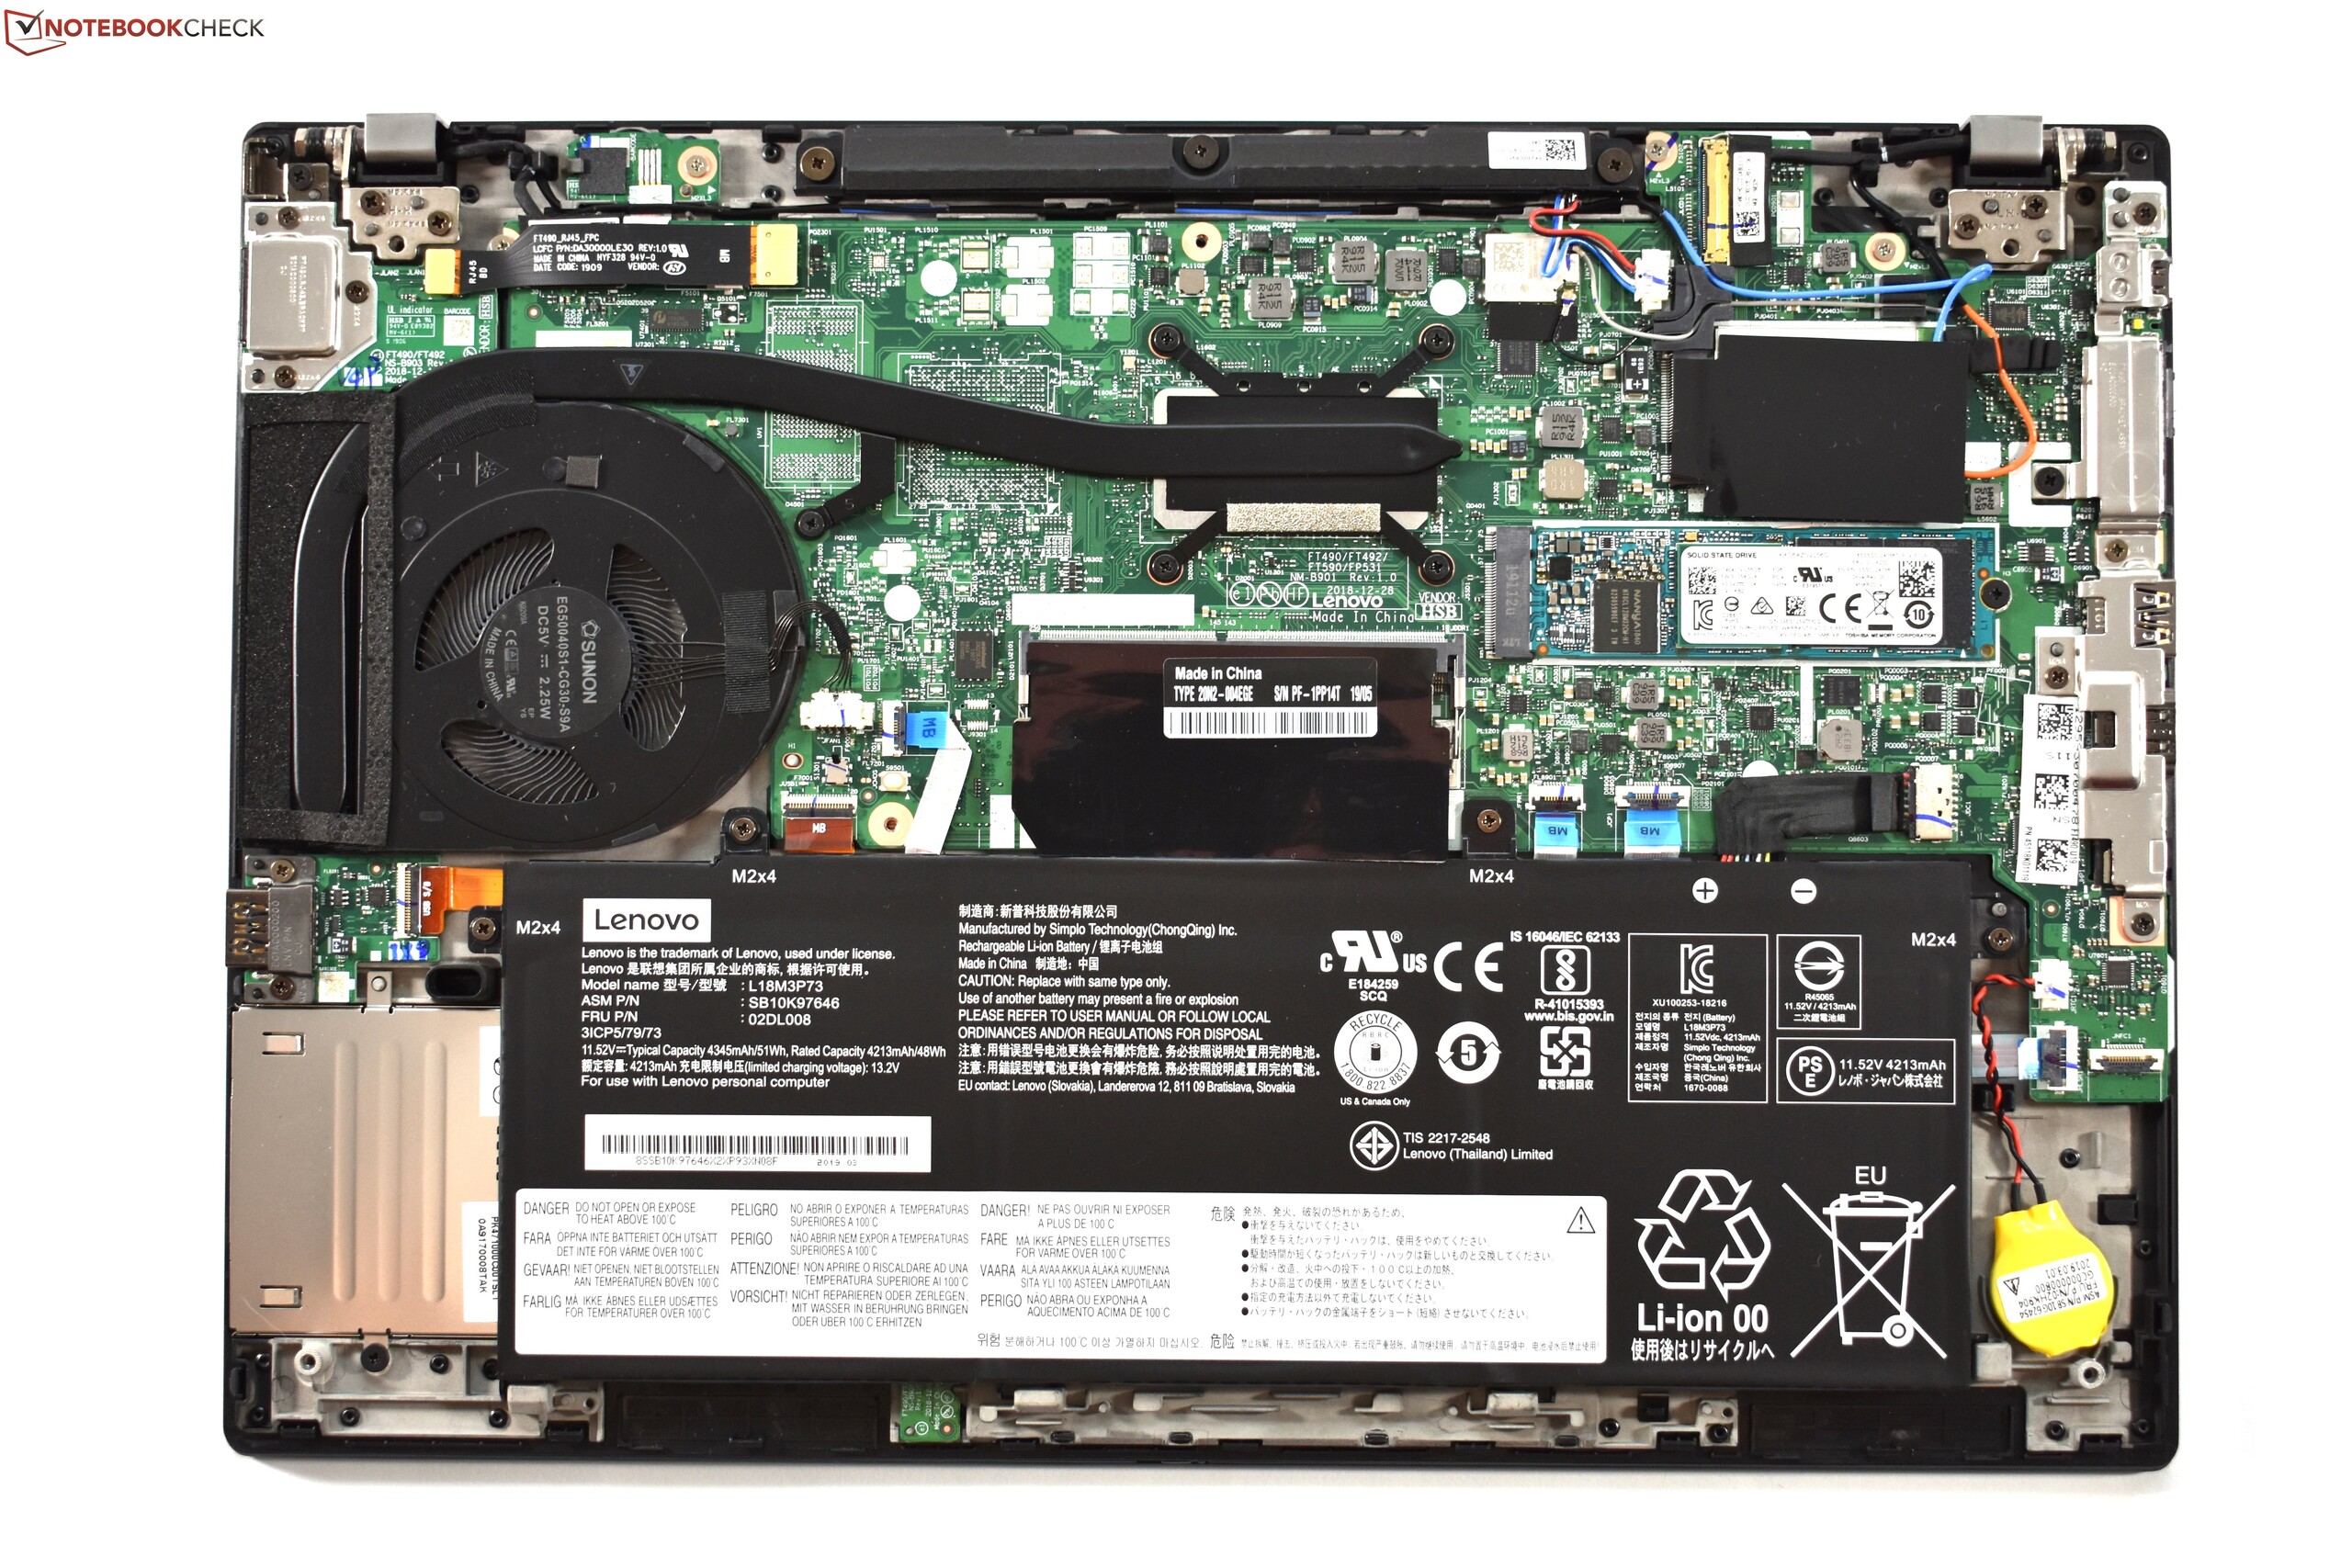
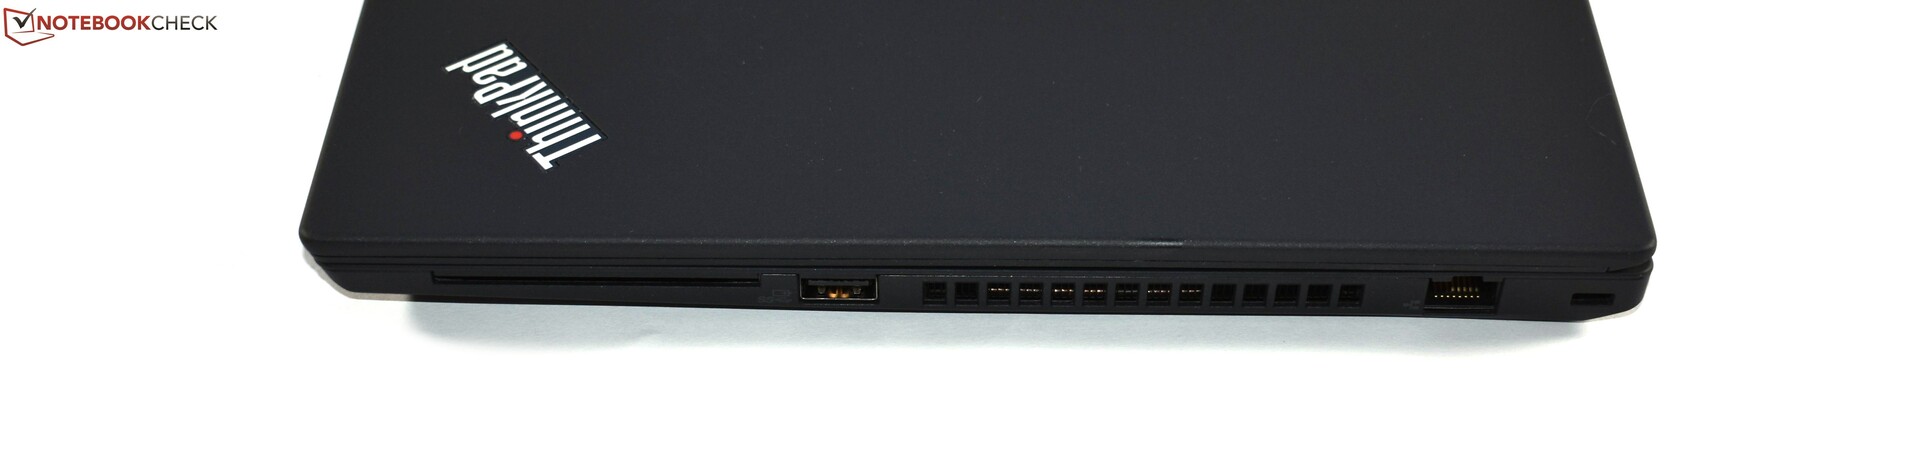
然而,两种型号都存在很大的相同缺点。低功耗屏幕的响应时间很短,而只包含microSD卡读卡器而不是全尺寸卡读卡器似乎有些失策。同样,虽然我们喜欢联想为其配备的雷电3端口,但我们无法理解为什么只允许它使用两个PCIe通道。此外,拆卸和重新组装外壳是一件痛苦的事情,而可拆卸电池的缺乏使得T490的灵活性低于其前代产品。
更低温,更持久:联想ThinkPad T490的核显版在某些领域比独显版更好,是一款出色的商务笔记本电脑。
总的来说,核显版的T490对于那些不需要GeForce MX250带来的附加图形功能的人来说应该足够了。如果您偶尔喜欢下班后玩游戏或需要可以处理视频编辑的笔记本电脑,那么带有独显的T490在我们看来是更好的选择。
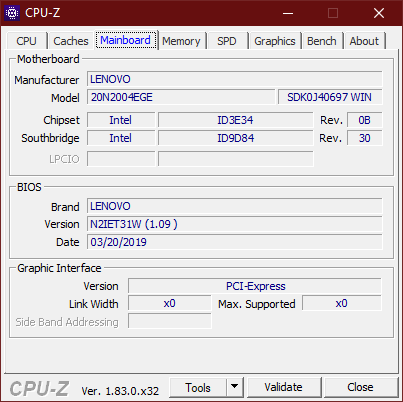
Lenovo ThinkPad T490-20N2004EGE
- 10/22/2019 v7 (old)
Benjamin Herzig
Price comparison

