惠普ZBook Studio G5 (i7, P1000, 4K)工作站评测
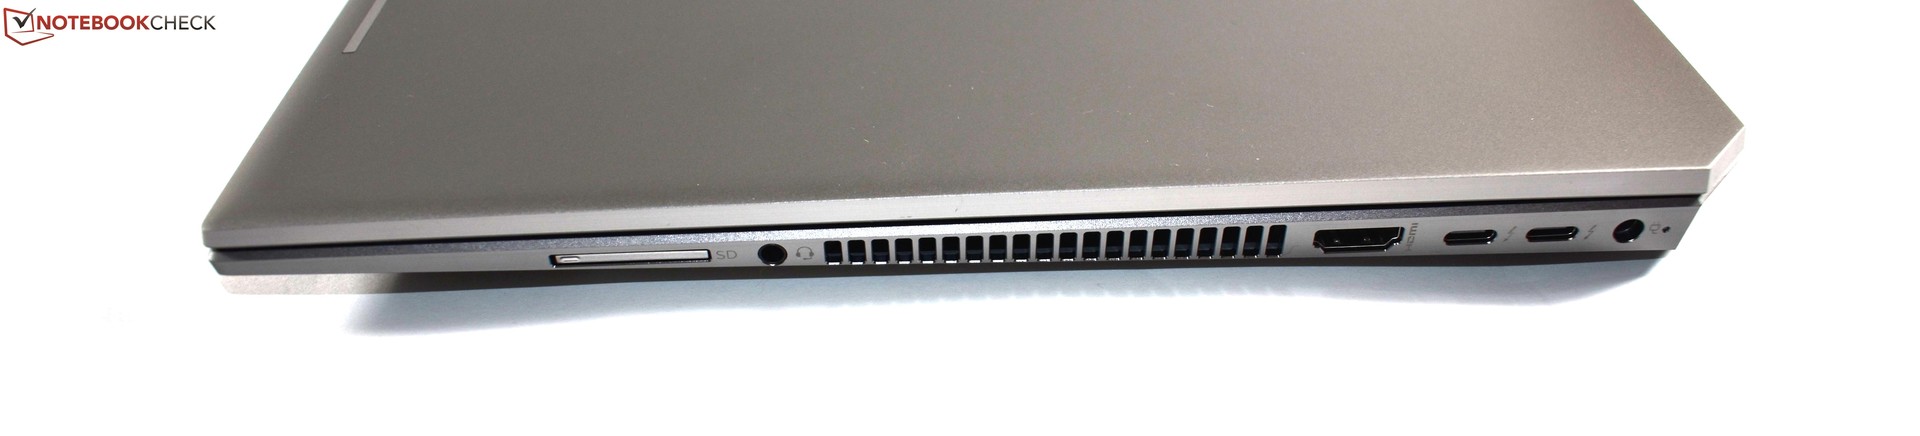
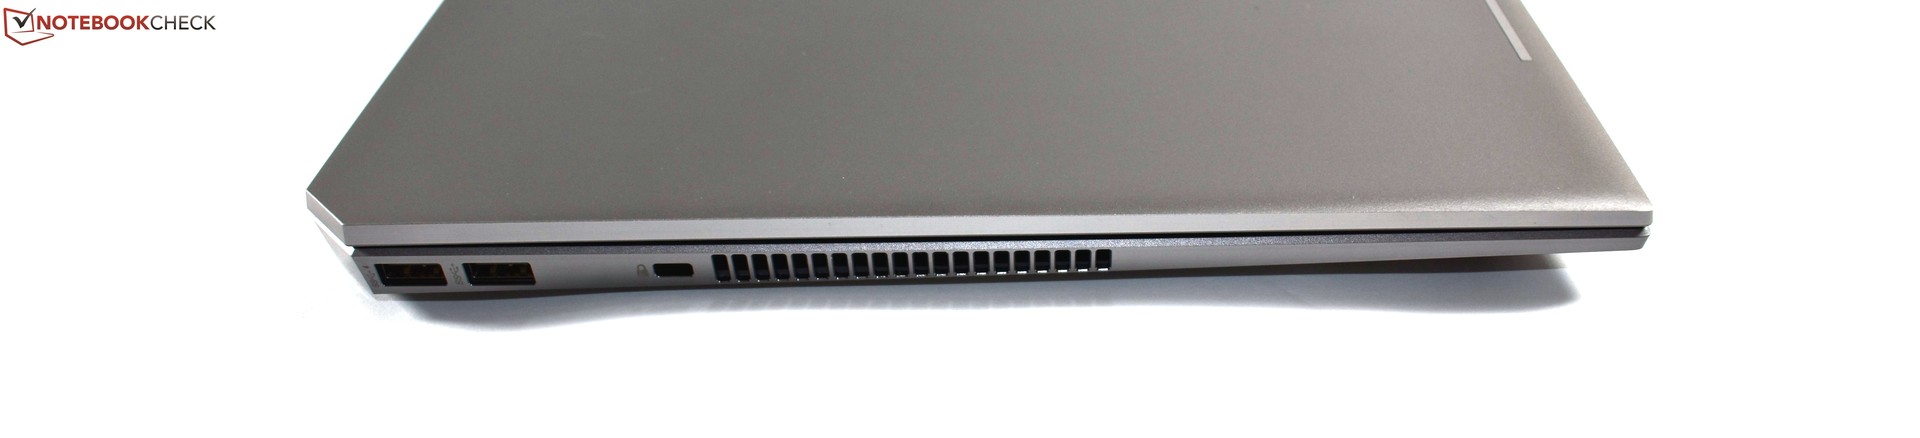
Connectivity
| SD Card Reader | |
| average JPG Copy Test (av. of 3 runs) | |
| HP ZBook Studio G5-4QH10EA (Toshiba Exceria Pro SDXC 64 GB UHS-II) | |
| Lenovo ThinkPad P1-20MD002LUS (Toshiba Exceria Pro SDXC 64 GB UHS-II) | |
| Dell Precision 5530 Xeon E-2176M (Toshiba Exceria Pro SDXC 64 GB UHS-II) | |
| Average of class Workstation (49.6 - 681, n=14, last 2 years) | |
| maximum AS SSD Seq Read Test (1GB) | |
| Lenovo ThinkPad P1-20MD002LUS (Toshiba Exceria Pro SDXC 64 GB UHS-II) | |
| Average of class Workstation (87.6 - 1455, n=14, last 2 years) | |
| HP ZBook Studio G5-4QH10EA (Toshiba Exceria Pro SDXC 64 GB UHS-II) | |
| Dell Precision 5530 Xeon E-2176M (Toshiba Exceria Pro SDXC 64 GB UHS-II) | |
| |||||||||||||||||||||||||
Brightness Distribution: 85 %
Center on Battery: 418 cd/m²
Contrast: 1438:1 (Black: 0.29 cd/m²)
ΔE ColorChecker Calman: 4.4 | ∀{0.5-29.43 Ø4.72}
calibrated: 1.9
ΔE Greyscale Calman: 5 | ∀{0.09-98 Ø4.97}
96% sRGB (Argyll 1.6.3 3D)
62.3% AdobeRGB 1998 (Argyll 1.6.3 3D)
68.8% AdobeRGB 1998 (Argyll 3D)
96.2% sRGB (Argyll 3D)
68.2% Display P3 (Argyll 3D)
Gamma: 2.28
CCT: 7575 K
| HP ZBook Studio G5-4QH10EA AUO30EB, , 3840x2160, 15.6" | Dell Precision 5530 Xeon E-2176M Sharp SHP148D / LQ156D1, , 3840x2160, 15.6" | Lenovo ThinkPad P1-20MD002LUS B156ZAN03.2, , 3840x2160, 15.6" | Apple MacBook Pro 15 2018 (2.6 GHz, 560X) APPA040, , 2880x1800, 15.4" | HP ZBook 15u G5 2ZC05EA CMN15E7, , 1920x1080, 15.6" | HP EliteBook 1050 G1-4QY20EA AUO30EB, , 3840x2160, 15.6" | |
|---|---|---|---|---|---|---|
| Display | 8% | 25% | 25% | -35% | -1% | |
| Display P3 Coverage (%) | 68.2 | 76.5 12% | 86.4 27% | 98.7 45% | 43.05 -37% | 67.8 -1% |
| sRGB Coverage (%) | 96.2 | 98.4 2% | 99.9 4% | 99.9 4% | 64.7 -33% | 94.1 -2% |
| AdobeRGB 1998 Coverage (%) | 68.8 | 76.4 11% | 99.1 44% | 86.6 26% | 44.5 -35% | 67.9 -1% |
| Response Times | 10% | 8% | 17% | 22% | 10% | |
| Response Time Grey 50% / Grey 80% * (ms) | 60.8 ? | 48 ? 21% | 55.6 ? 9% | 43.2 ? 29% | 41.6 ? 32% | 56 ? 8% |
| Response Time Black / White * (ms) | 32.8 ? | 33.6 ? -2% | 30.8 ? 6% | 31.2 ? 5% | 28.8 ? 12% | 29 ? 12% |
| PWM Frequency (Hz) | 1000 | 117000 ? | 25770 ? | |||
| Screen | -6% | -12% | 28% | -36% | -5% | |
| Brightness middle (cd/m²) | 417 | 451.7 8% | 397.6 -5% | 520 25% | 229 -45% | 440 6% |
| Brightness (cd/m²) | 412 | 440 7% | 396 -4% | 492 19% | 212 -49% | 389 -6% |
| Brightness Distribution (%) | 85 | 90 6% | 85 0% | 88 4% | 88 4% | 83 -2% |
| Black Level * (cd/m²) | 0.29 | 0.4 -38% | 0.25 14% | 0.39 -34% | 0.23 21% | 0.34 -17% |
| Contrast (:1) | 1438 | 1129 -21% | 1590 11% | 1333 -7% | 996 -31% | 1294 -10% |
| Colorchecker dE 2000 * | 4.4 | 3.11 29% | 4.95 -13% | 1.2 73% | 4.2 5% | 5.04 -15% |
| Colorchecker dE 2000 max. * | 6.7 | 8.62 -29% | 10.23 -53% | 2.3 66% | 18 -169% | 6.99 -4% |
| Colorchecker dE 2000 calibrated * | 1.9 | 3.07 -62% | 4.22 -122% | 4.2 -121% | 2.04 -7% | |
| Greyscale dE 2000 * | 5 | 3.7 26% | 5.1 -2% | 1.3 74% | 2 60% | 4.98 -0% |
| Gamma | 2.28 96% | 2.11 104% | 2.234 98% | 2.18 101% | 2.23 99% | 2.48 89% |
| CCT | 7575 86% | 6492 100% | 7543 86% | 6738 96% | 6292 103% | 7777 84% |
| Color Space (Percent of AdobeRGB 1998) (%) | 62.3 | 69 11% | 87.6 41% | 41 -34% | 61 -2% | |
| Color Space (Percent of sRGB) (%) | 96 | 98 2% | 100 4% | 64.5 -33% | 94 -2% | |
| Total Average (Program / Settings) | 4% /
-1% | 7% /
-2% | 23% /
25% | -16% /
-28% | 1% /
-3% |
* ... smaller is better
Display Response Times
| ↔ Response Time Black to White | ||
|---|---|---|
| 32.8 ms ... rise ↗ and fall ↘ combined | ↗ 16.4 ms rise | 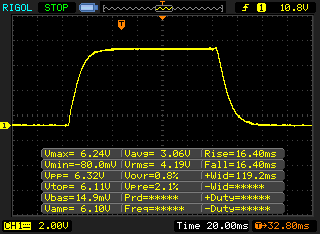 |
| ↘ 16.4 ms fall | ||
| The screen shows slow response rates in our tests and will be unsatisfactory for gamers. In comparison, all tested devices range from 0.1 (minimum) to 240 (maximum) ms. » 88 % of all devices are better. This means that the measured response time is worse than the average of all tested devices (19.8 ms). | ||
| ↔ Response Time 50% Grey to 80% Grey | ||
| 60.8 ms ... rise ↗ and fall ↘ combined | ↗ 30 ms rise | 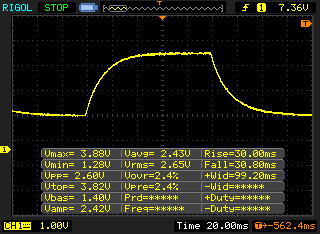 |
| ↘ 30.8 ms fall | ||
| The screen shows slow response rates in our tests and will be unsatisfactory for gamers. In comparison, all tested devices range from 0.165 (minimum) to 636 (maximum) ms. » 96 % of all devices are better. This means that the measured response time is worse than the average of all tested devices (31 ms). | ||
Screen Flickering / PWM (Pulse-Width Modulation)
| Screen flickering / PWM not detected | 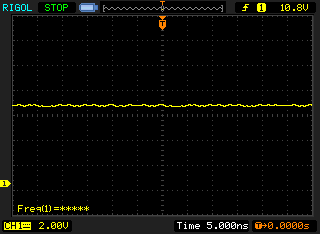 | ||
In comparison: 52 % of all tested devices do not use PWM to dim the display. If PWM was detected, an average of 7769 (minimum: 5 - maximum: 343500) Hz was measured. | |||
| PCMark 8 Home Score Accelerated v2 | 3433 points | |
| PCMark 8 Work Score Accelerated v2 | 4453 points | |
| PCMark 10 Score | 4462 points | |
Help | ||
| HP ZBook Studio G5-4QH10EA Samsung SSD PM981 MZVLB512HAJQ | Dell Precision 5530 Xeon E-2176M SK hynix PC400 512 GB | Lenovo ThinkPad P1-20MD002LUS Samsung SSD PM981 MZVLB2T0HMLB | HP ZBook 15u G5 2ZC05EA Toshiba XG5 KXG50ZNV256G | HP EliteBook 1050 G1-4QY20EA Toshiba XG5-P KXG50PNV2T04 | Average Samsung SSD PM981 MZVLB512HAJQ | |
|---|---|---|---|---|---|---|
| CrystalDiskMark 5.2 / 6 | 5% | 8% | -15% | -15% | 20% | |
| Write 4K (MB/s) | 102.7 | 97.8 -5% | 108 5% | 98.8 -4% | 94.8 -8% | 126.7 ? 23% |
| Read 4K (MB/s) | 38.32 | 41.21 8% | 37.24 -3% | 33.98 -11% | 26.45 -31% | 44 ? 15% |
| Write Seq (MB/s) | 1417 | 1312 -7% | 1476 4% | 395.7 -72% | 1037 -27% | 1617 ? 14% |
| Read Seq (MB/s) | 1289 | 1667 29% | 1367 6% | 2063 60% | 1280 -1% | 1716 ? 33% |
| Write 4K Q32T1 (MB/s) | 278.9 | 449.5 61% | 302.4 8% | 352.3 26% | 277.6 0% | 413 ? 48% |
| Read 4K Q32T1 (MB/s) | 348.8 | 327.4 -6% | 375 8% | 281.8 -19% | 333.9 -4% | 420 ? 20% |
| Write Seq Q32T1 (MB/s) | 1895 | 1385 -27% | 2433 28% | 355 -81% | 1037 -45% | 2076 ? 10% |
| Read Seq Q32T1 (MB/s) | 3352 | 2948 -12% | 3493 4% | 2775 -17% | 3135 -6% | 3130 ? -7% |

| SiSoft Sandra 2016 | |
| Image Processing | |
| Average NVIDIA Quadro P1000 (264 - 269, n=3) | |
| HP ZBook Studio G5-4QH10EA | |
| HP ZBook 15u G5 2ZC05EA | |
| GP Cryptography (Higher Security AES256+SHA2-512) | |
| Average NVIDIA Quadro P1000 (10.8 - 11, n=3) | |
| HP ZBook Studio G5-4QH10EA | |
| HP ZBook 15u G5 2ZC05EA | |
| GP Financial Analysis (FP High/Double Precision) | |
| HP ZBook 15u G5 2ZC05EA | |
| Average NVIDIA Quadro P1000 (23.2 - 23.8, n=3) | |
| HP ZBook Studio G5-4QH10EA | |
| 3DMark 11 Performance | 6377 points | |
| 3DMark Cloud Gate Standard Score | 16596 points | |
| 3DMark Fire Strike Score | 4453 points | |
| 3DMark Time Spy Score | 1560 points | |
Help | ||
| The Witcher 3 - 1920x1080 High Graphics & Postprocessing (Nvidia HairWorks Off) | |
| Average of class Workstation (91 - 156.4, n=2, last 2 years) | |
| HP EliteBook 1050 G1-4QY20EA | |
| Dell Precision 5530 Xeon E-2176M | |
| Lenovo ThinkPad P1-20MD002LUS | |
| HP ZBook Studio G5-4QH10EA | |
| Average NVIDIA Quadro P1000 (26.1 - 29.9, n=3) | |
| low | med. | high | ultra | 4K | |
|---|---|---|---|---|---|
| BioShock Infinite (2013) | 249.7 | 152.2 | 133.7 | 51 | |
| The Witcher 3 (2015) | 88.7 | 54.4 | 29.5 | 16.1 | |
| Rise of the Tomb Raider (2016) | 100.1 | 57.5 | 32.3 | 27 | 10.6 |
Noise level
| Idle |
| 28.6 / 28.6 / 30 dB(A) |
| Load |
| 38.1 / 42.5 dB(A) |
 | ||
30 dB silent 40 dB(A) audible 50 dB(A) loud |
||
min: | ||
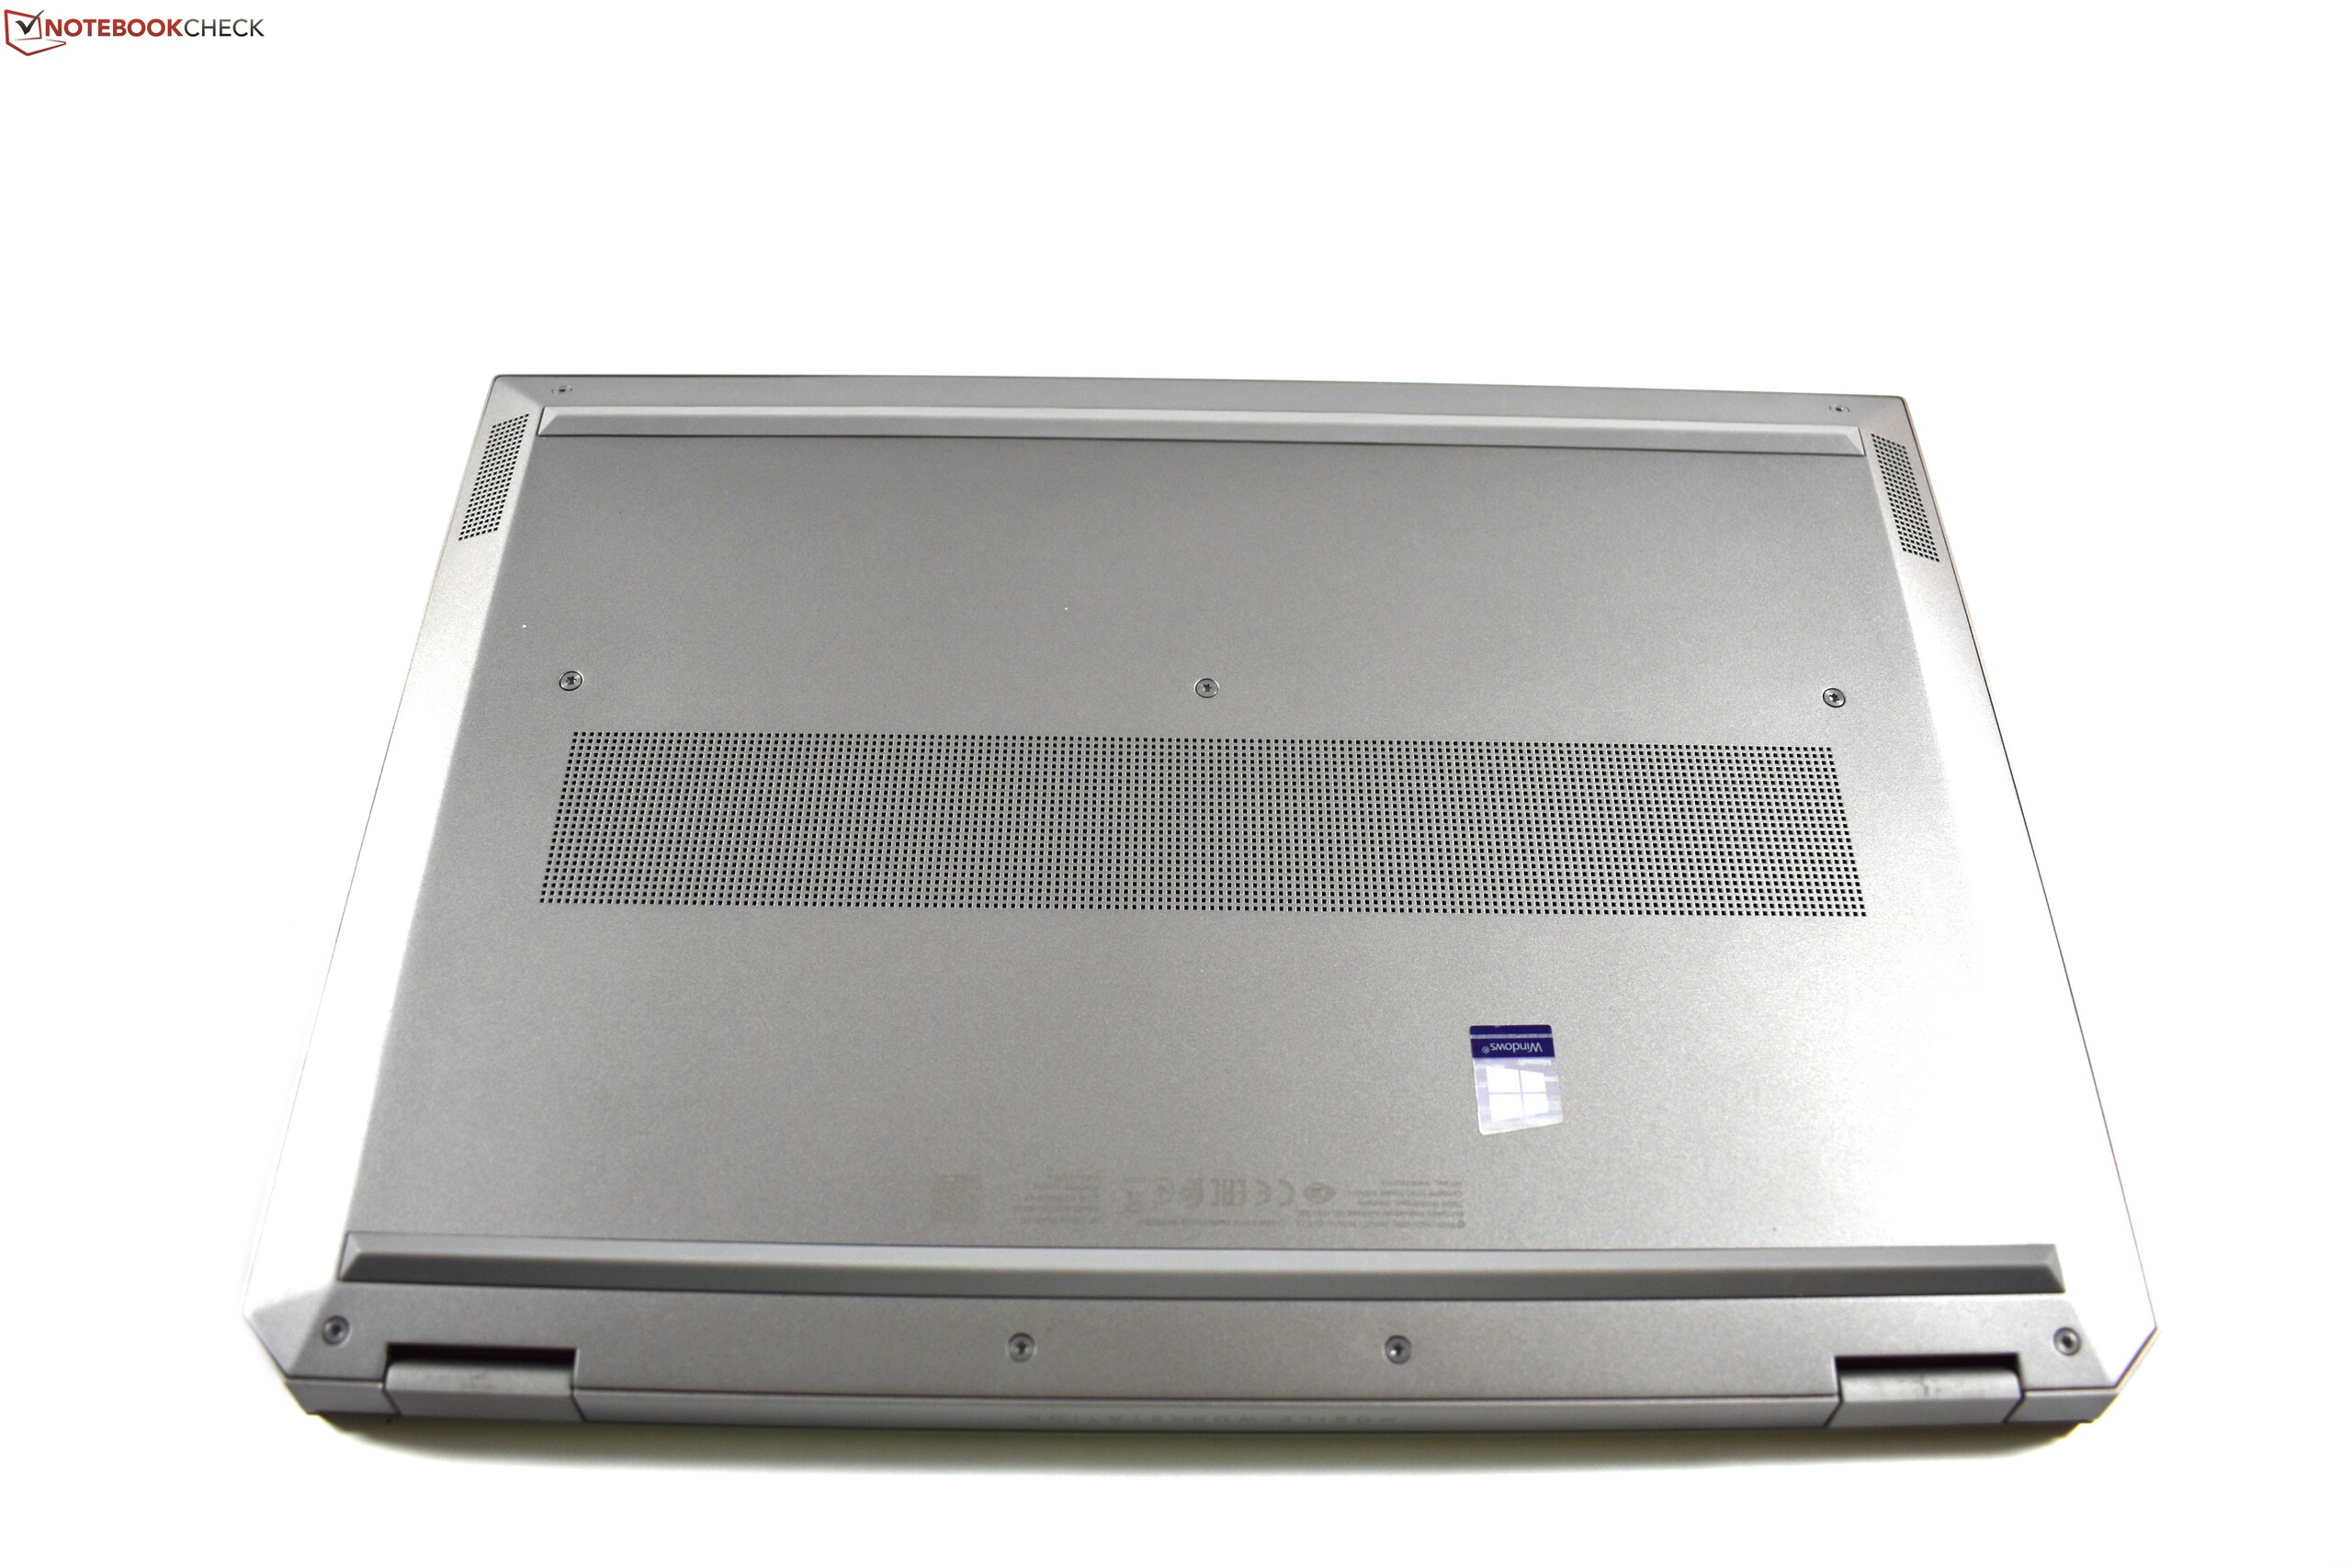
(±) The maximum temperature on the upper side is 42.3 °C / 108 F, compared to the average of 38.2 °C / 101 F, ranging from 22.2 to 69.8 °C for the class Workstation.
(±) The bottom heats up to a maximum of 43.1 °C / 110 F, compared to the average of 41.1 °C / 106 F
(+) In idle usage, the average temperature for the upper side is 23.2 °C / 74 F, compared to the device average of 32 °C / 90 F.
(±) Playing The Witcher 3, the average temperature for the upper side is 34.8 °C / 95 F, compared to the device average of 32 °C / 90 F.
(+) The palmrests and touchpad are cooler than skin temperature with a maximum of 29.6 °C / 85.3 F and are therefore cool to the touch.
(±) The average temperature of the palmrest area of similar devices was 27.8 °C / 82 F (-1.8 °C / -3.3 F).
HP ZBook Studio G5-4QH10EA audio analysis
(±) | speaker loudness is average but good (76.2 dB)
Bass 100 - 315 Hz
(±) | reduced bass - on average 8.5% lower than median
(±) | linearity of bass is average (10.7% delta to prev. frequency)
Mids 400 - 2000 Hz
(±) | higher mids - on average 6% higher than median
(±) | linearity of mids is average (7% delta to prev. frequency)
Highs 2 - 16 kHz
(+) | balanced highs - only 4.1% away from median
(+) | highs are linear (6.5% delta to prev. frequency)
Overall 100 - 16.000 Hz
(±) | linearity of overall sound is average (17.4% difference to median)
Compared to same class
» 53% of all tested devices in this class were better, 10% similar, 37% worse
» The best had a delta of 7%, average was 17%, worst was 35%
Compared to all devices tested
» 33% of all tested devices were better, 8% similar, 59% worse
» The best had a delta of 4%, average was 24%, worst was 134%
Lenovo ThinkPad P1-20MD002LUS audio analysis
(±) | speaker loudness is average but good (73.7 dB)
Bass 100 - 315 Hz
(±) | reduced bass - on average 10.1% lower than median
(±) | linearity of bass is average (12.3% delta to prev. frequency)
Mids 400 - 2000 Hz
(±) | higher mids - on average 5.9% higher than median
(±) | linearity of mids is average (8.9% delta to prev. frequency)
Highs 2 - 16 kHz
(+) | balanced highs - only 2% away from median
(+) | highs are linear (5.1% delta to prev. frequency)
Overall 100 - 16.000 Hz
(±) | linearity of overall sound is average (21.8% difference to median)
Compared to same class
» 77% of all tested devices in this class were better, 6% similar, 17% worse
» The best had a delta of 7%, average was 17%, worst was 35%
Compared to all devices tested
» 62% of all tested devices were better, 7% similar, 31% worse
» The best had a delta of 4%, average was 24%, worst was 134%
Dell Precision 5530 Xeon E-2176M audio analysis
(±) | speaker loudness is average but good (74.9 dB)
Bass 100 - 315 Hz
(-) | nearly no bass - on average 17.9% lower than median
(±) | linearity of bass is average (9.1% delta to prev. frequency)
Mids 400 - 2000 Hz
(±) | higher mids - on average 6.7% higher than median
(±) | linearity of mids is average (10.2% delta to prev. frequency)
Highs 2 - 16 kHz
(+) | balanced highs - only 4% away from median
(±) | linearity of highs is average (8.4% delta to prev. frequency)
Overall 100 - 16.000 Hz
(±) | linearity of overall sound is average (23% difference to median)
Compared to same class
» 83% of all tested devices in this class were better, 3% similar, 14% worse
» The best had a delta of 7%, average was 17%, worst was 35%
Compared to all devices tested
» 69% of all tested devices were better, 5% similar, 26% worse
» The best had a delta of 4%, average was 24%, worst was 134%
| Off / Standby | |
| Idle | |
| Load |
|
Key:
min: | |
| HP ZBook Studio G5-4QH10EA i7-8750H, Quadro P1000, Samsung SSD PM981 MZVLB512HAJQ, IPS LED, 3840x2160, 15.6" | Dell Precision 5530 Xeon E-2176M E-2176M, Quadro P2000, SK hynix PC400 512 GB, IGZO, 3840x2160, 15.6" | Lenovo ThinkPad P1-20MD002LUS E-2176M, Quadro P2000 Max-Q, Samsung SSD PM981 MZVLB2T0HMLB, IPS, 3840x2160, 15.6" | Apple MacBook Pro 15 2018 (2.6 GHz, 560X) i7-8850H, Radeon Pro 560X, Apple SSD AP0512, IPS, 2880x1800, 15.4" | HP ZBook 15u G5 2ZC05EA i5-8550U, Radeon Pro WX 3100, Toshiba XG5 KXG50ZNV256G, IPS LED, 1920x1080, 15.6" | HP EliteBook 1050 G1-4QY20EA i7-8750H, GeForce GTX 1050 Max-Q, Toshiba XG5-P KXG50PNV2T04, IPS LED, 3840x2160, 15.6" | Average NVIDIA Quadro P1000 | Average of class Workstation | |
|---|---|---|---|---|---|---|---|---|
| Power Consumption | -26% | -8% | 15% | 37% | 5% | 9% | -29% | |
| Idle Minimum * (Watt) | 6.8 | 9.8 -44% | 7.1 -4% | 3.4 50% | 3.2 53% | 6.1 10% | 5.09 ? 25% | 9.04 ? -33% |
| Idle Average * (Watt) | 11.3 | 16.8 -49% | 14.4 -27% | 11 3% | 6.1 46% | 10.2 10% | 9.25 ? 18% | 13.8 ? -22% |
| Idle Maximum * (Watt) | 14.3 | 16.9 -18% | 14.6 -2% | 14.9 -4% | 9.7 32% | 13.4 6% | 13 ? 9% | 17.7 ? -24% |
| Load Average * (Watt) | 78 | 102.3 -31% | 93.9 -20% | 78.9 -1% | 62 21% | 82 -5% | 78.2 ? -0% | 96.2 ? -23% |
| Witcher 3 ultra * (Watt) | 64 | 76.5 -20% | 77.9 -22% | 48 25% | ||||
| Load Maximum * (Watt) | 126 | 114.5 9% | 88.3 30% | 91.2 28% | 71 44% | 122 3% | 132.7 ? -5% | 178.5 ? -42% |
* ... smaller is better
| HP ZBook Studio G5-4QH10EA i7-8750H, Quadro P1000, 97 Wh | Dell Precision 5530 Xeon E-2176M E-2176M, Quadro P2000, 97 Wh | Lenovo ThinkPad P1-20MD002LUS E-2176M, Quadro P2000 Max-Q, 80 Wh | Apple MacBook Pro 15 2018 (2.6 GHz, 560X) i7-8850H, Radeon Pro 560X, 83 Wh | HP ZBook 15u G5 2ZC05EA i5-8550U, Radeon Pro WX 3100, 56 Wh | HP EliteBook 1050 G1-4QY20EA i7-8750H, GeForce GTX 1050 Max-Q, 96 Wh | Average of class Workstation | |
|---|---|---|---|---|---|---|---|
| Battery runtime | -12% | -45% | 17% | 20% | -2% | 2% | |
| Reader / Idle (h) | 17.3 | 16.5 -5% | 21.7 25% | 17.1 -1% | 26.1 ? 51% | ||
| H.264 (h) | 9.1 | 11.7 29% | 10.4 14% | 9.7 7% | 9.51 ? 5% | ||
| WiFi v1.3 (h) | 9.7 | 8.4 -13% | 5.3 -45% | 10.2 5% | 8.6 -11% | 8.7 -10% | 8.52 ? -12% |
| Load (h) | 2.2 | 1.8 -18% | 3.3 50% | 2.1 -5% | 1.429 ? -35% | ||
| Witcher 3 ultra (h) | 1.5 |
Pros
Cons
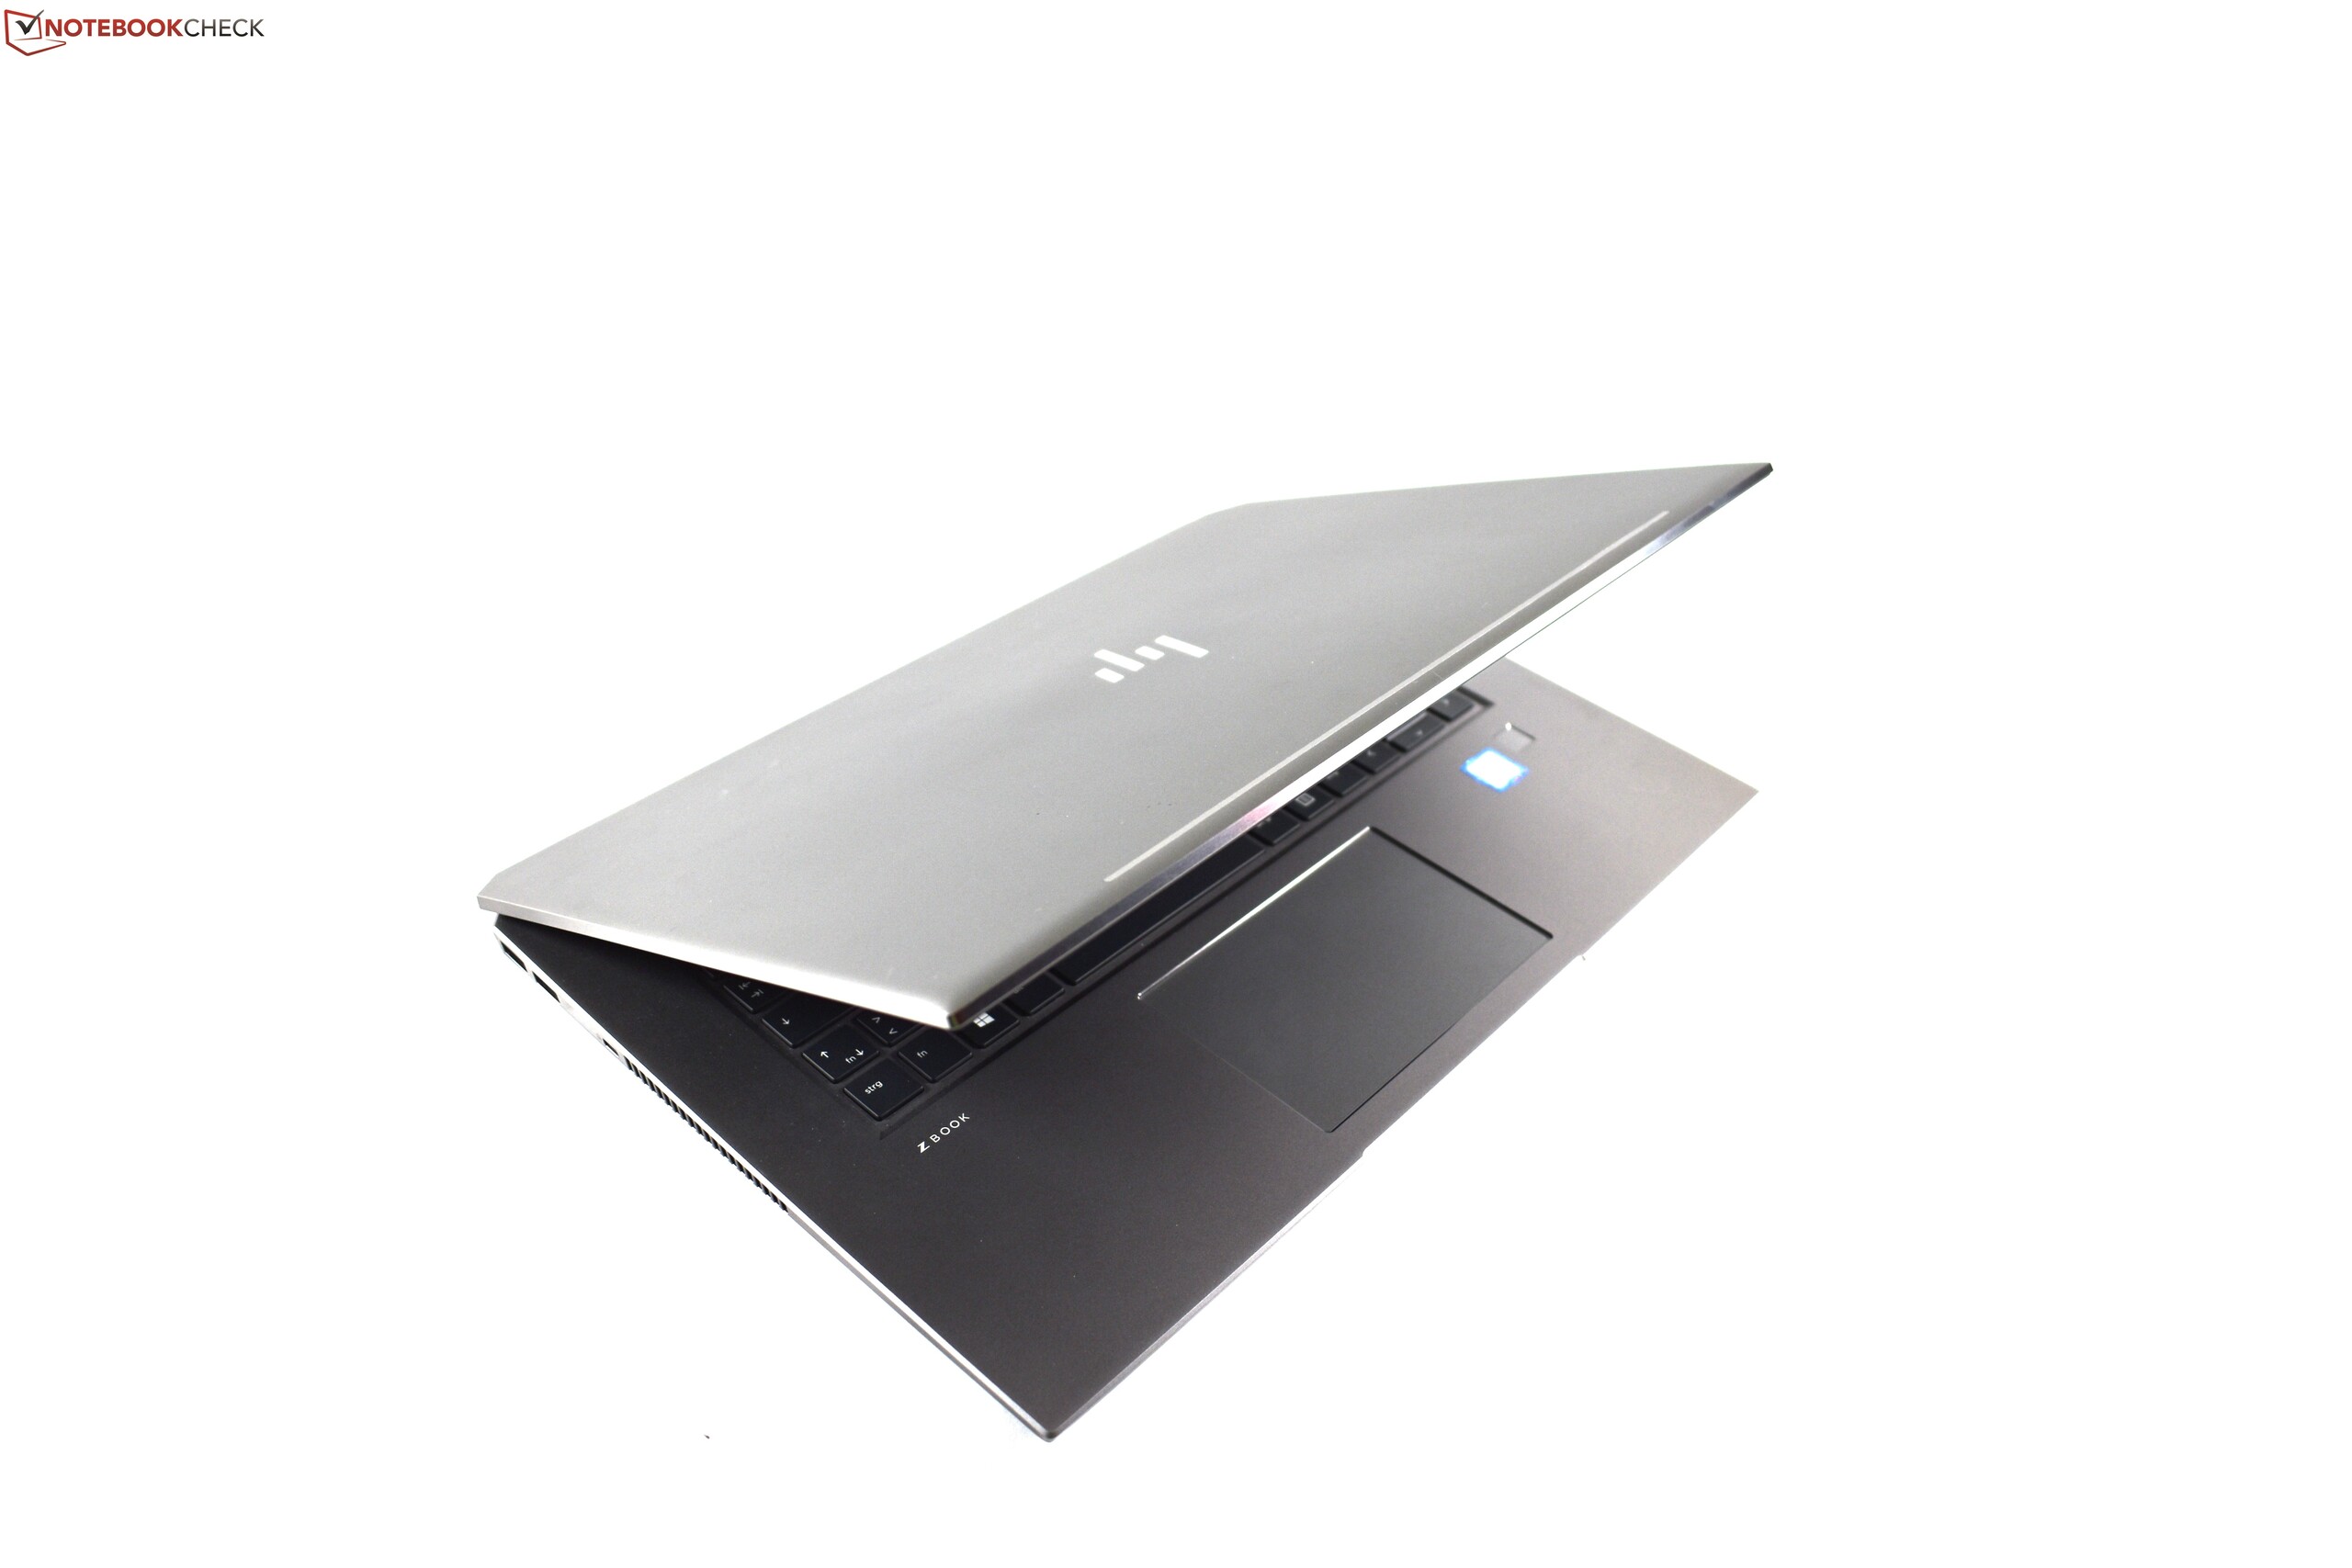
惠普ZBook Studio G5在我们的评测中表现良好——这就是为什么它得到了87%的评分,评级为“好”。它与EliteBook 1050 G1共享了大部分优点。
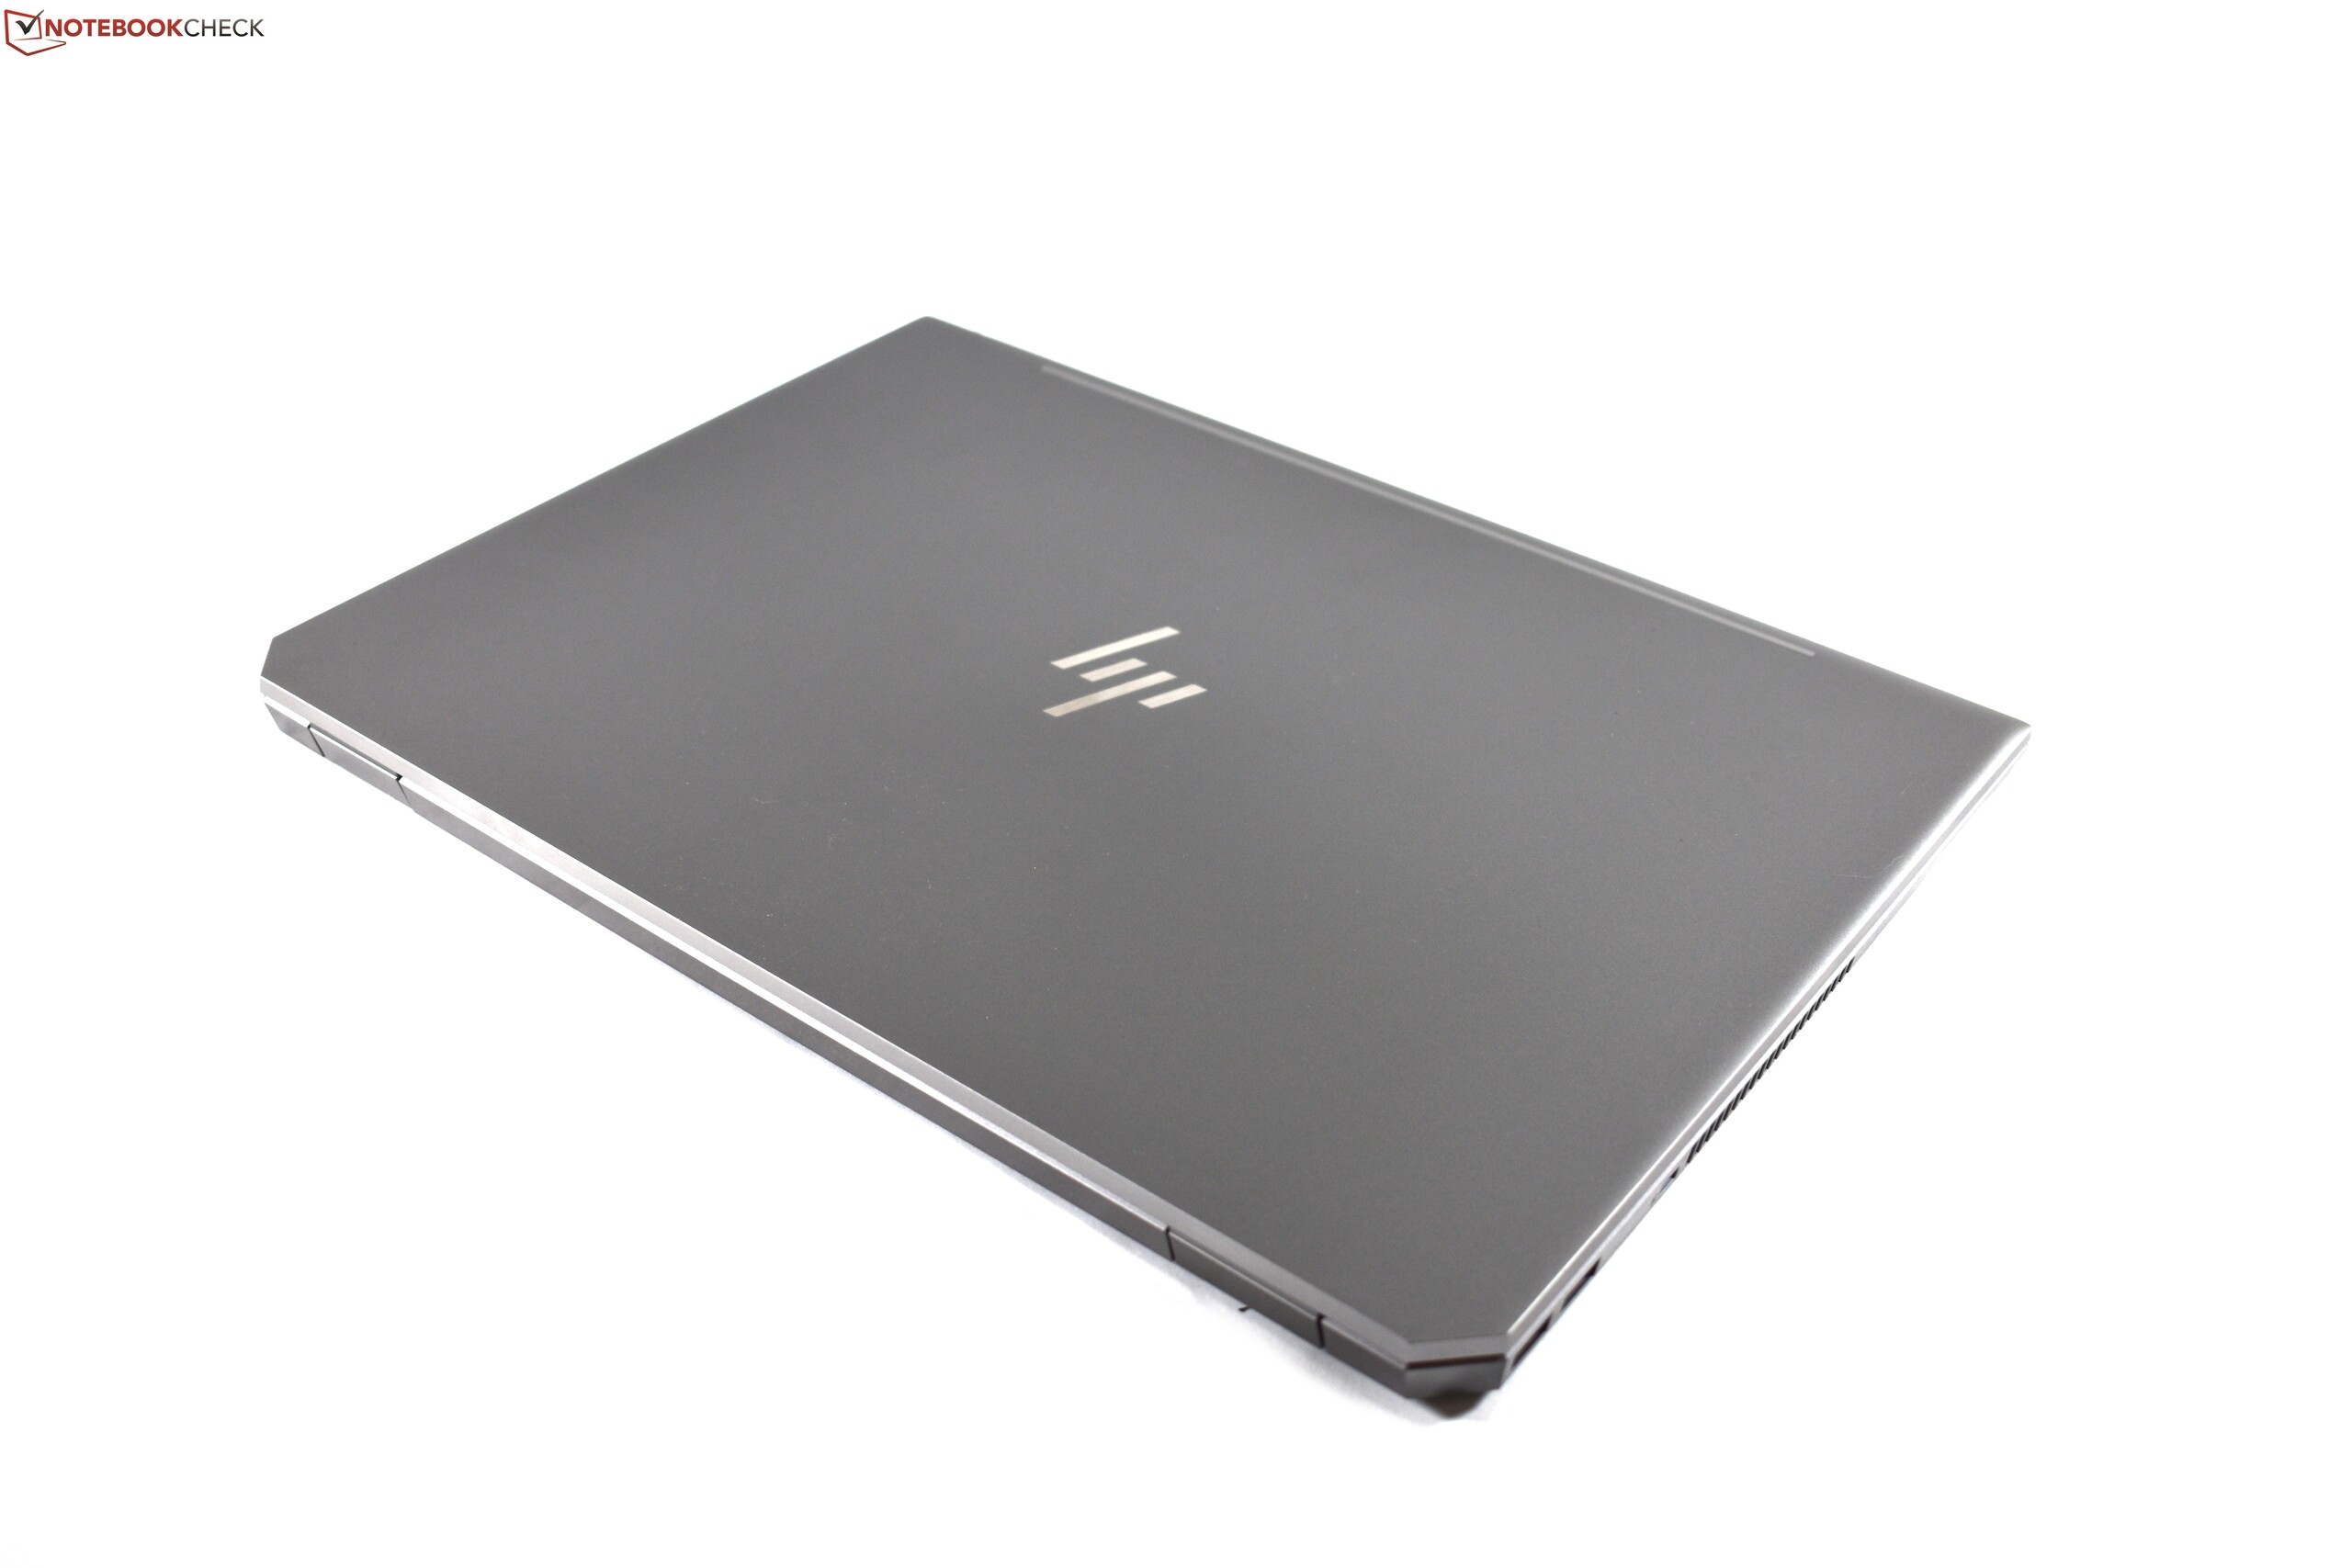
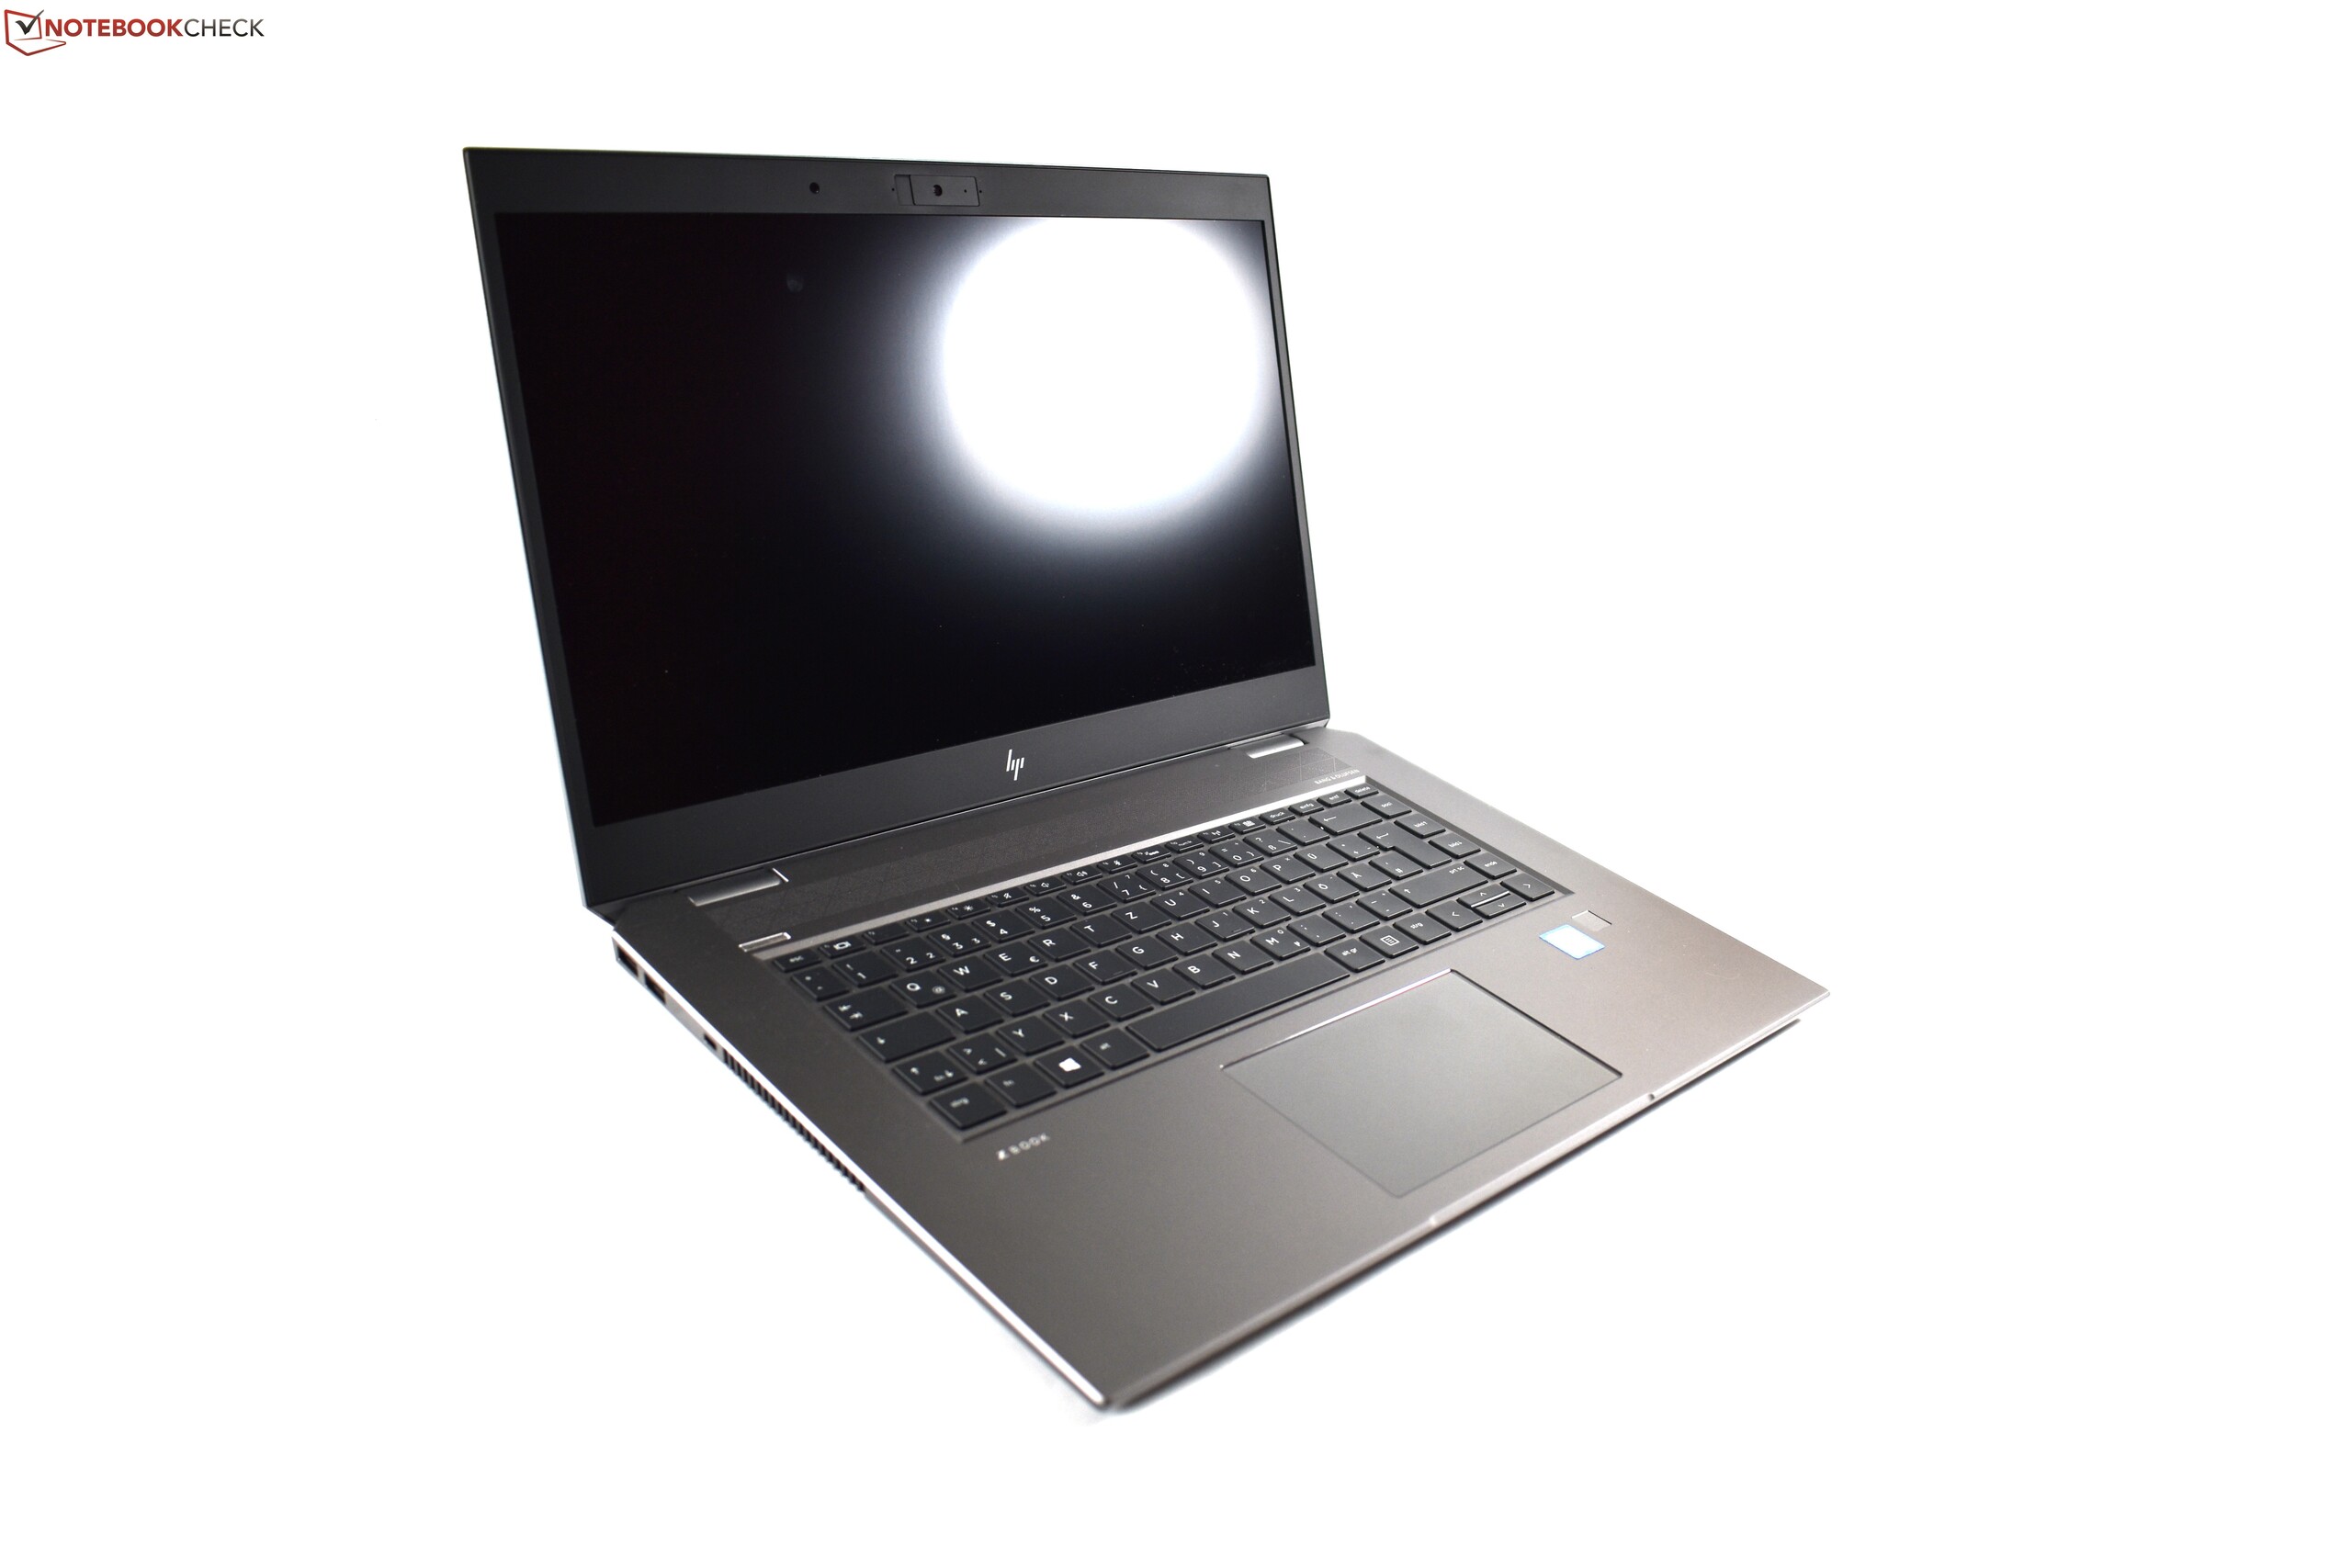
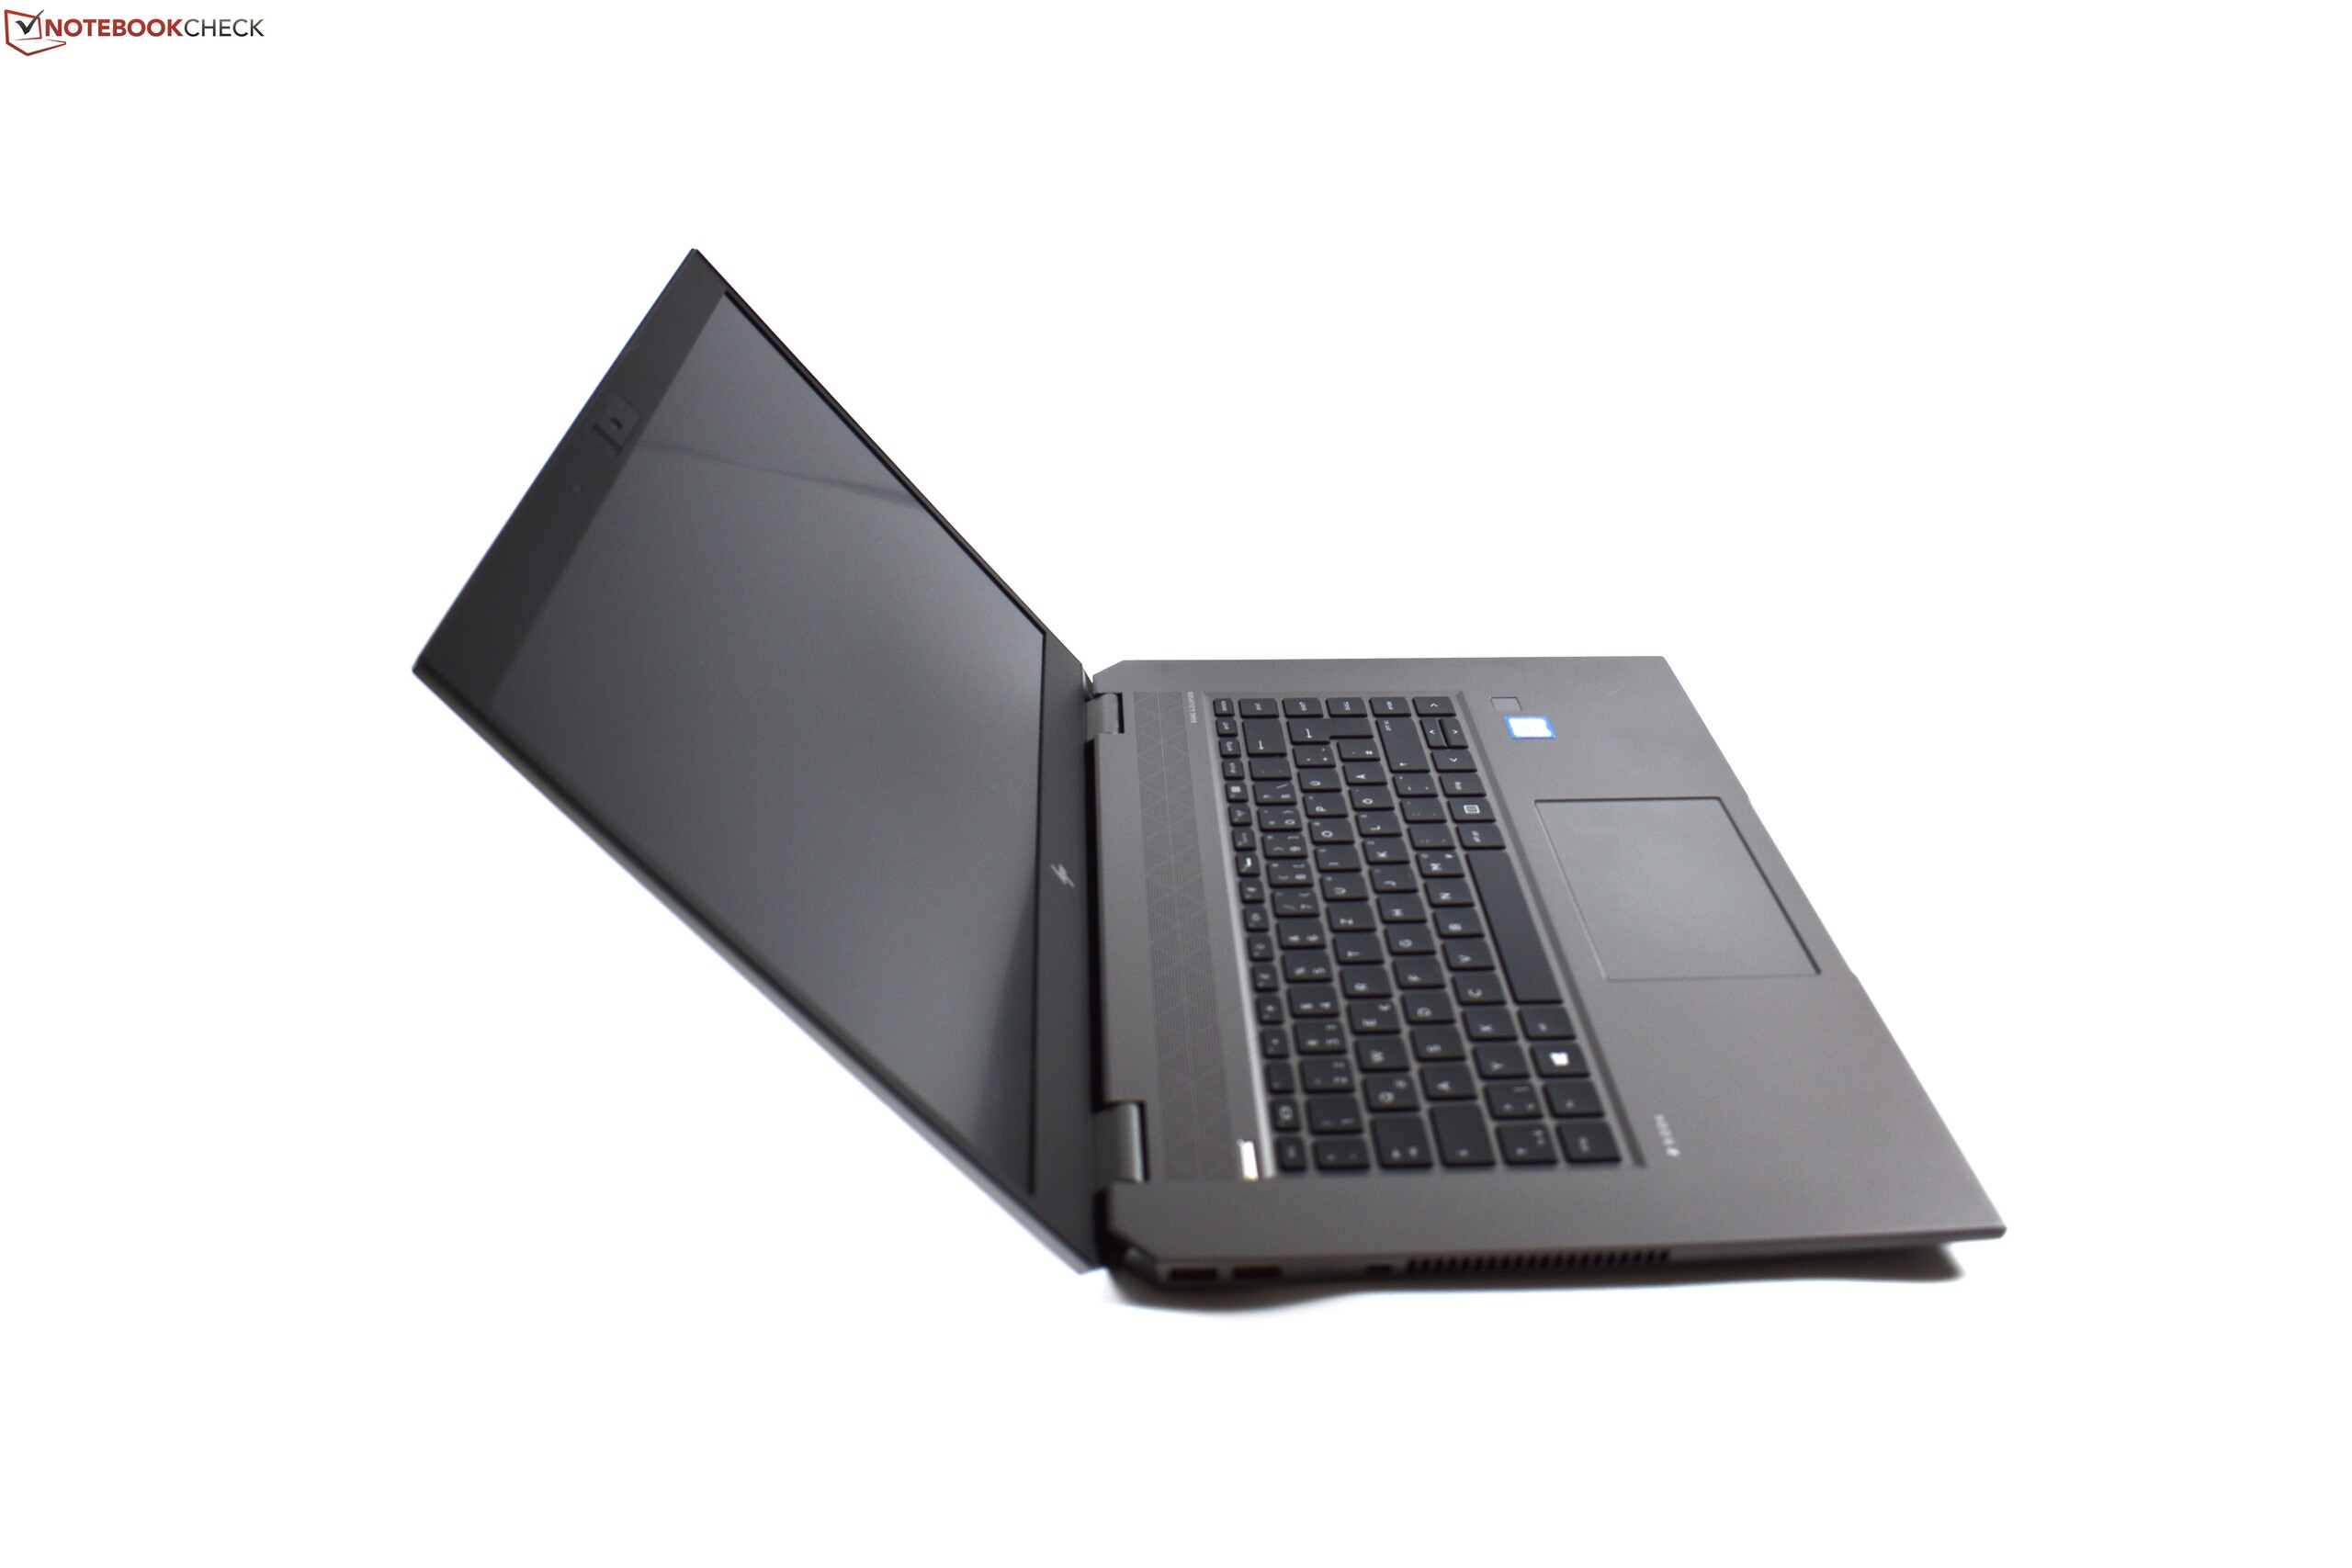
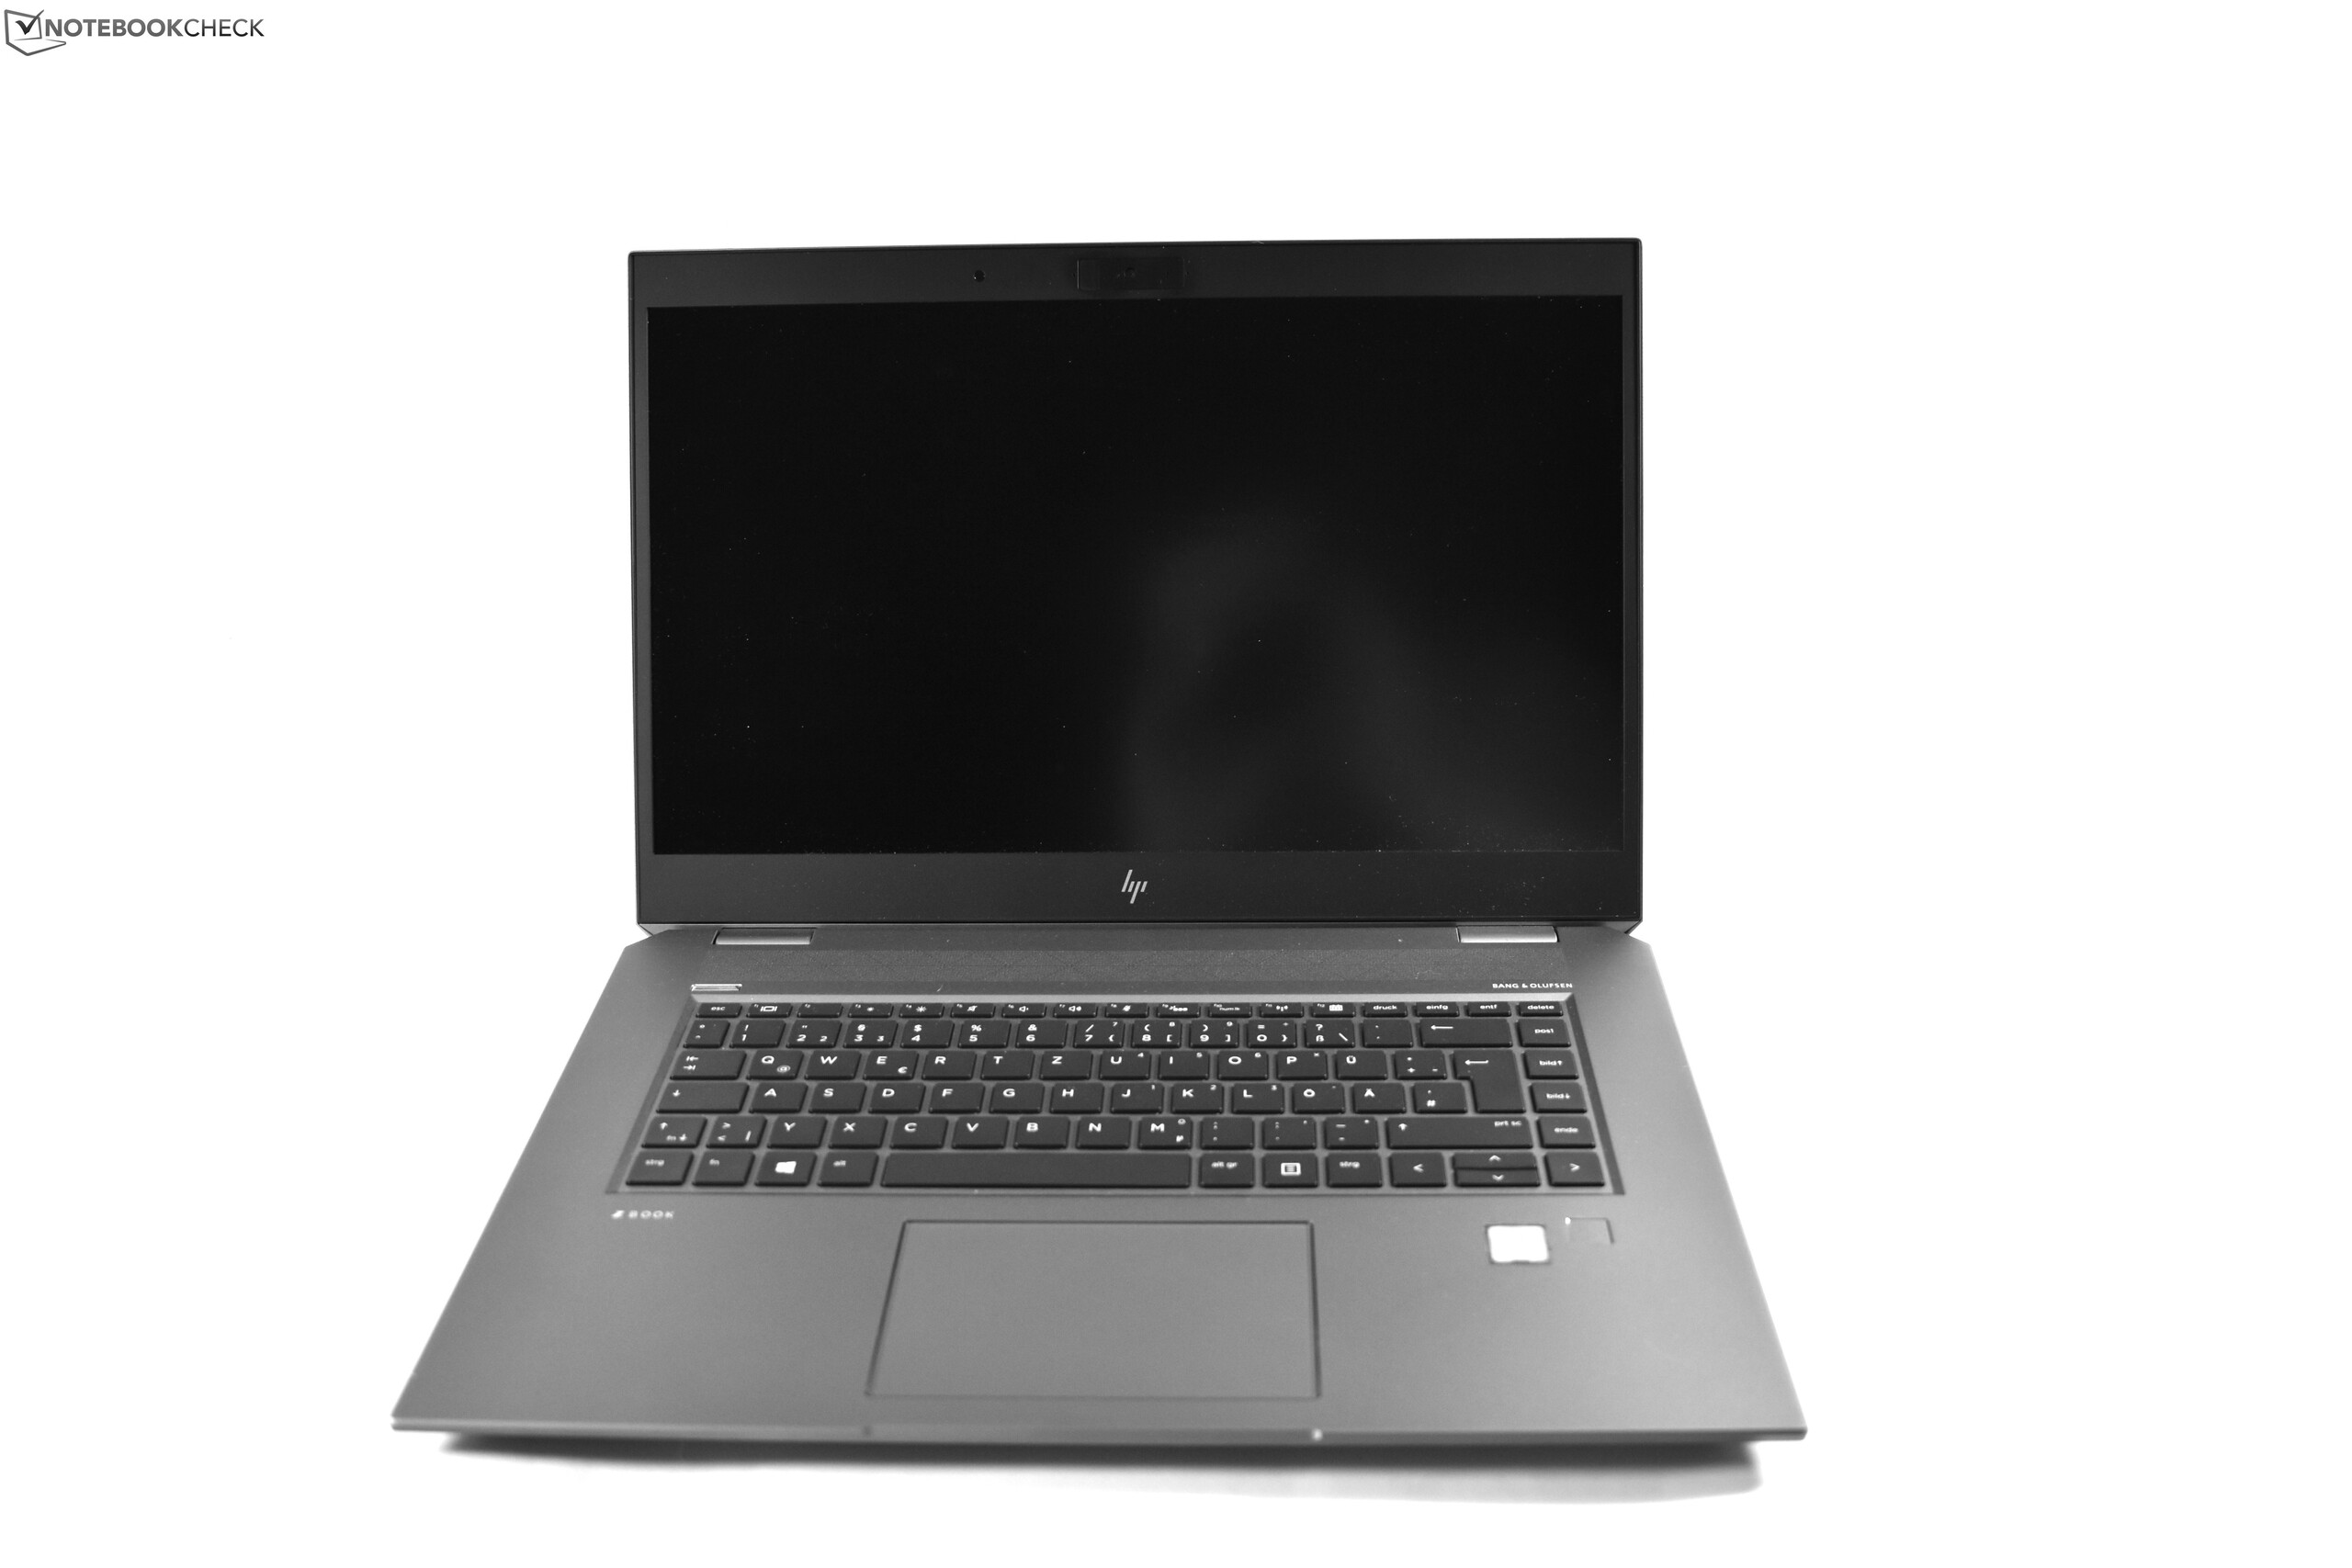
当然,考虑到ZBook Studio使用与EliteBook 1050 G1相同的坚固一体化机身——只不过Zbook只是灰色而不是银色,所以这并不是什么大惊喜。同样的地方还有:舒适的键盘,大电池,接口选择,值得称道的可维护性,出色的CPU性能和触摸板。我们的评测设备甚至使用与EliteBook双胞胎完全相同的AUO LCD面板。乍看之下差异不那么明显,不过最重要的区别是不同的GPU——ZBook使用了针对CAD优化的Quadro P1000,惠普在EliteBook中使用了性能更强的Nvidia GeForce GTX 1050 Max-Q。这使得ZBook的GPU至少在其Quadro P2000配置可选之前处于劣势。除此之外,值得注意的是,只有ZBook可以选择Dreamcolor梦幻屏,而EliteBook 1050 G1很遗憾不提供这种屏幕。
与联想ThinkPad P1和Dell Precision 5530相比,GPU性能方面的劣势仍然存在:前两者都配备了Quadro P2000,而ZBook至少在目前没有这个选项。Zbook与EliteBook 1050有着同样的缺点。这包括与竞争对手相比更高的重量,风扇出口位置以及使用电池时的性能节流。最后不得不提的是,ZBook Studio G5也是一款非常昂贵的工作站。
“令人信服:ZBook Studio G5是一款几乎没有什么明显弱点的坚固移动工作站。”
总的来说,ZBook值得我们推荐。但是它是否优于联想ThinkPad P1或Dell Precision 5530,则是用户个人品味和功能要求的问题。
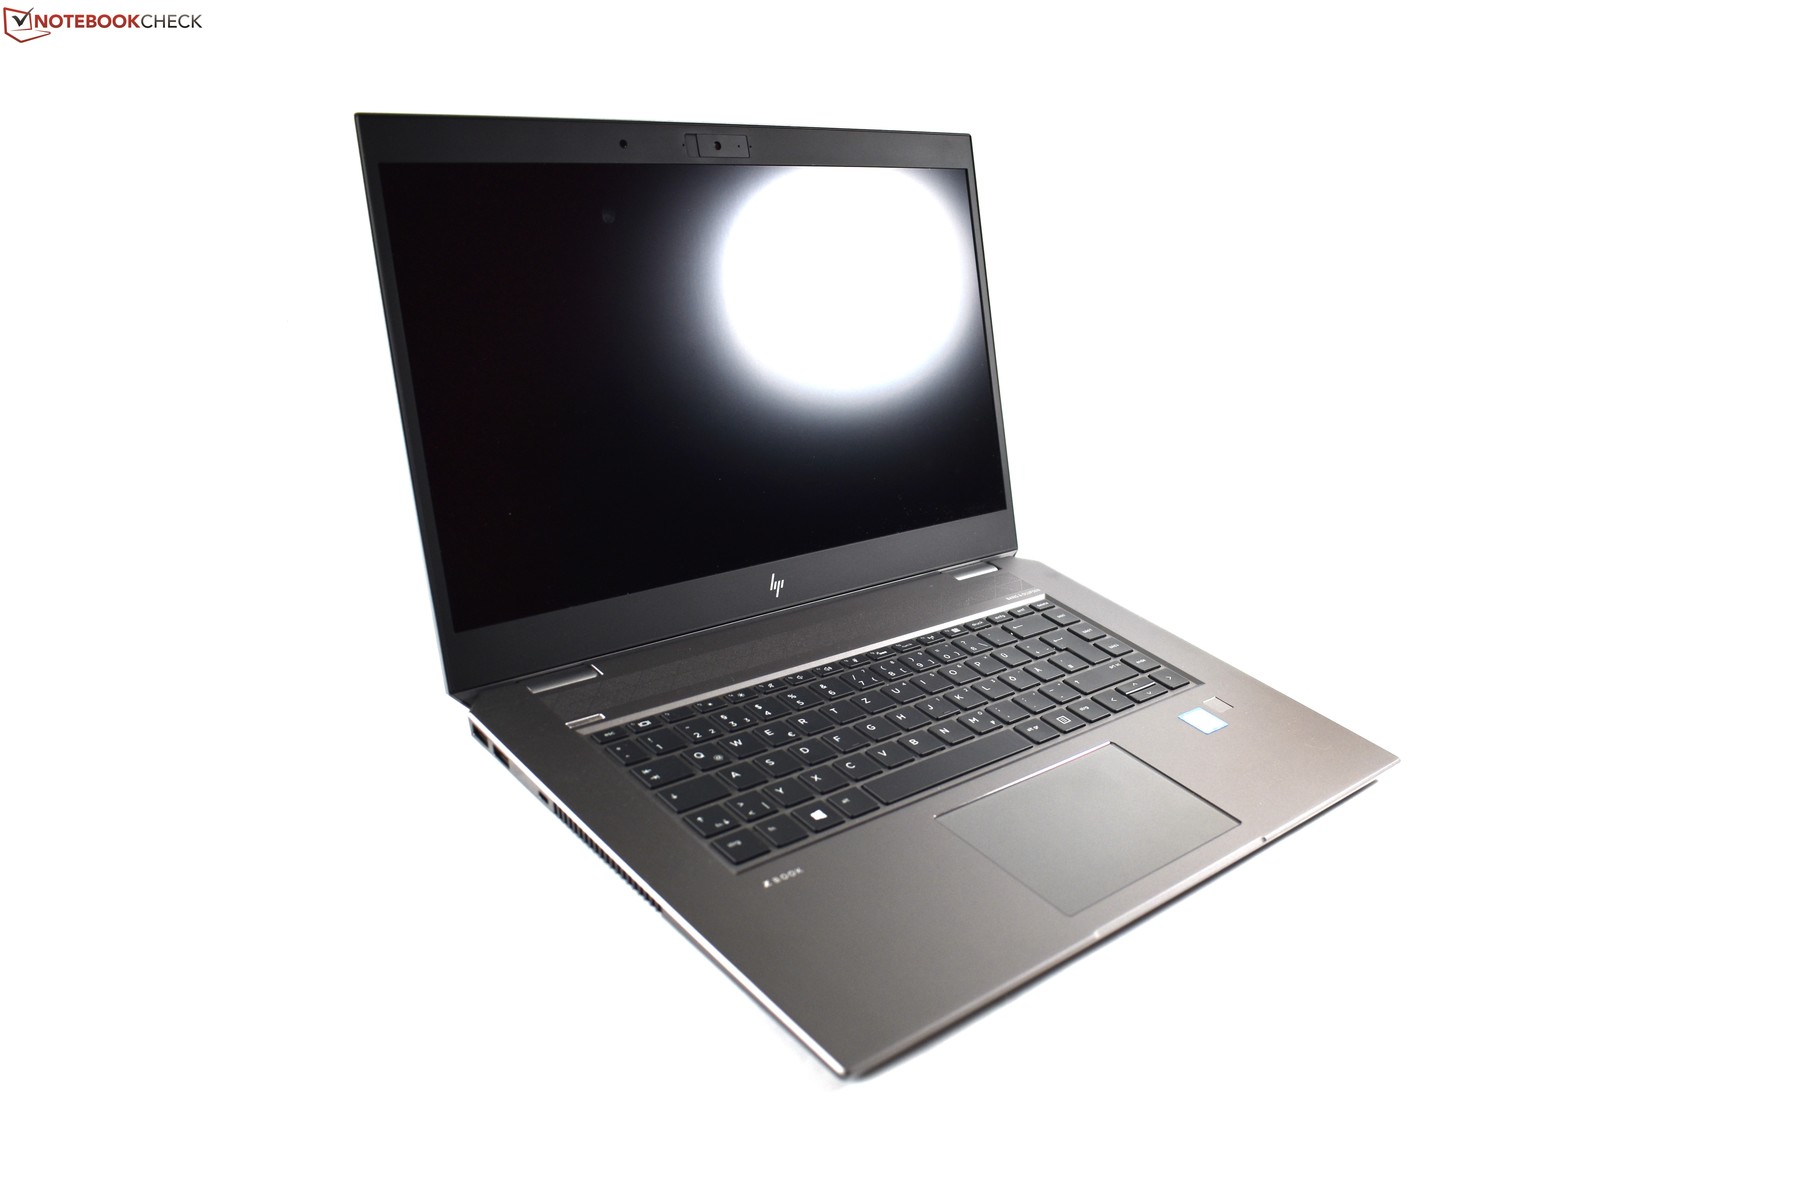
HP ZBook Studio G5-4QH10EA
- 03/26/2020 v7 (old)
Benjamin Herzig
Price comparison

