联想ThinkPad L390 Yoga(i5-8265U, 256 GB, FHD)翻转本评测

| SD Card Reader | |
| average JPG Copy Test (av. of 3 runs) | |
| Lenovo ThinkPad L380 Yoga-20M7001BGE (Toshiba Exceria Pro M501 microSDXC 64GB) | |
| Lenovo ThinkPad L390 Yoga-20NT000XGE (Toshiba Exceria Pro M501 UHS-II) | |
| Average of class Convertible (29.4 - 186, n=21, last 2 years) | |
| Dell Inspiron 13-5379-9573 (Toshiba Exceria Pro SDXC 64 GB UHS-II) | |
| Acer Spin 5 SP513-52N-54SF (Toshiba Exceria Pro SDXC 64 GB UHS-II) | |
| maximum AS SSD Seq Read Test (1GB) | |
| Average of class Convertible (67.5 - 254, n=20, last 2 years) | |
| Lenovo ThinkPad L380 Yoga-20M7001BGE (Toshiba Exceria Pro M501 microSDXC 64GB) | |
| Lenovo ThinkPad L390 Yoga-20NT000XGE (Toshiba Exceria Pro M501 UHS-II) | |
| Dell Inspiron 13-5379-9573 (Toshiba Exceria Pro SDXC 64 GB UHS-II) | |
| Acer Spin 5 SP513-52N-54SF (Toshiba Exceria Pro SDXC 64 GB UHS-II) | |
| |||||||||||||||||||||||||
Brightness Distribution: 90 %
Center on Battery: 311 cd/m²
Contrast: 1423:1 (Black: 0.22 cd/m²)
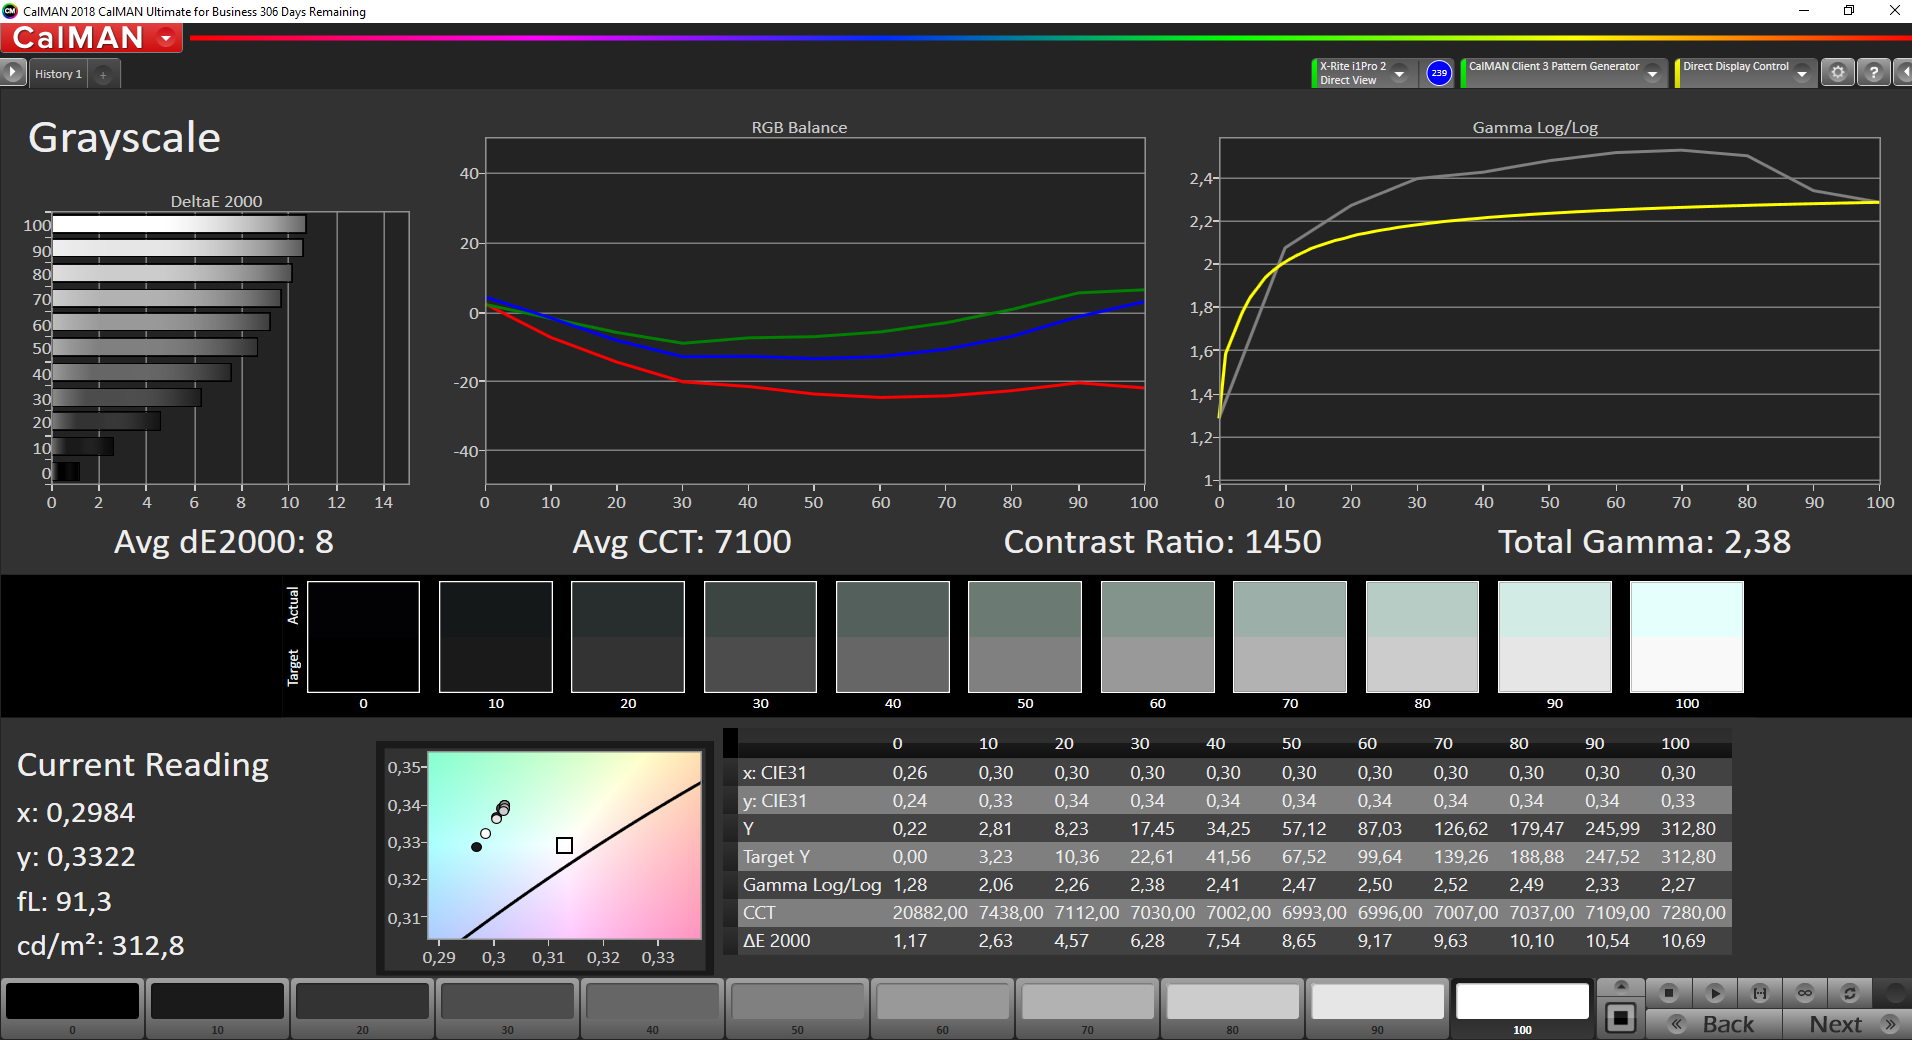
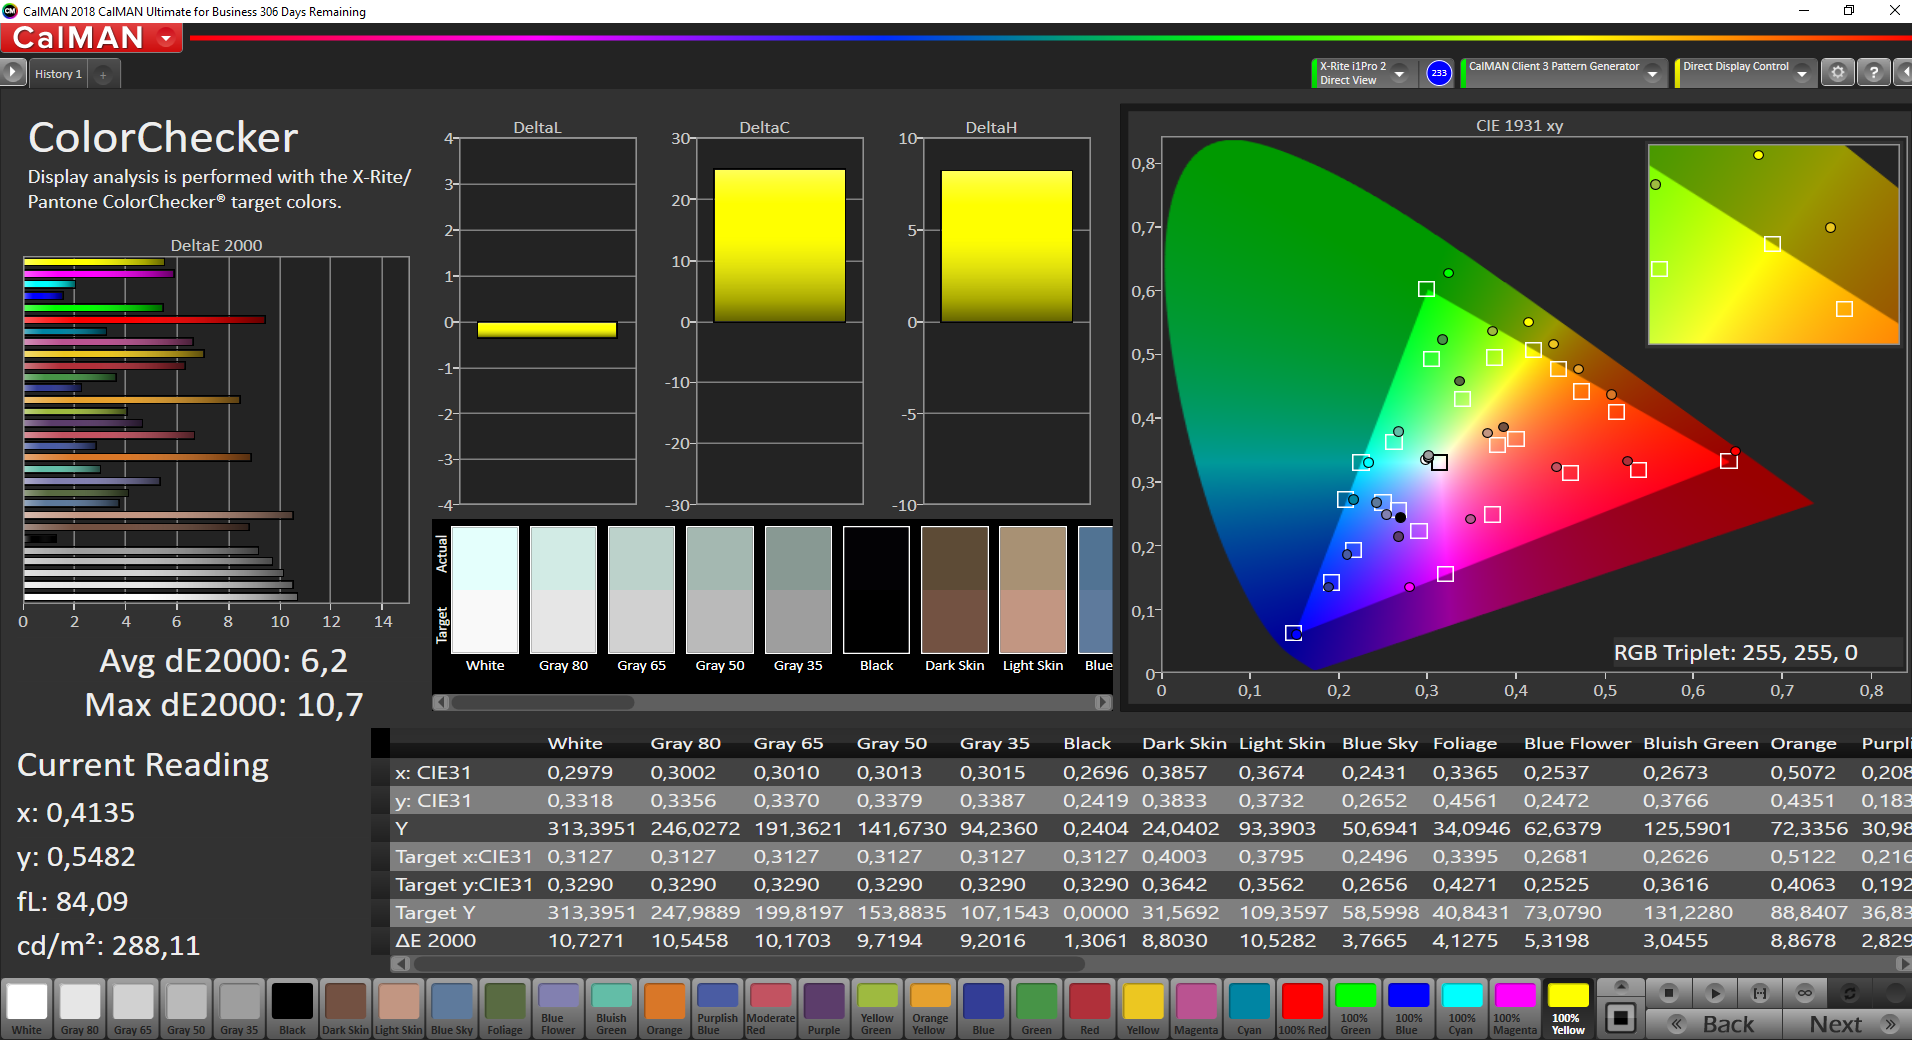
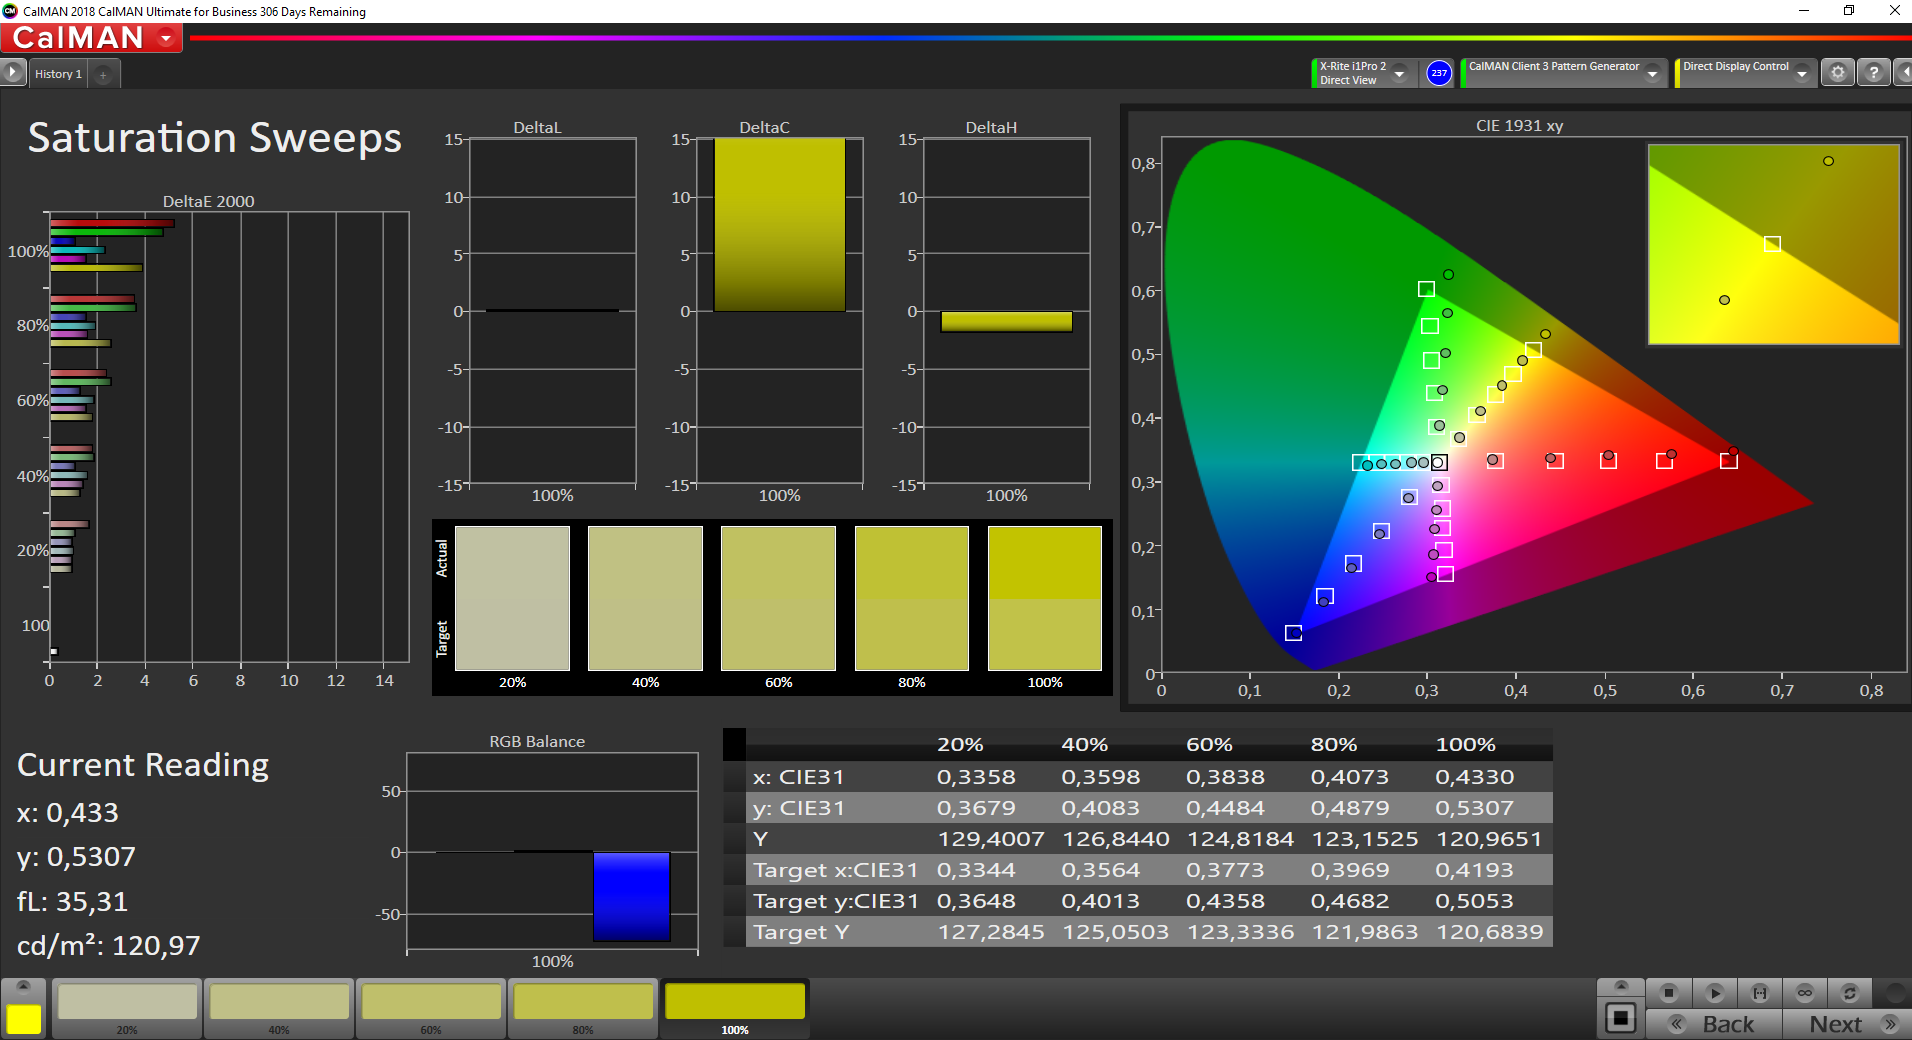
ΔE ColorChecker Calman: 6.2 | ∀{0.5-29.43 Ø4.71}
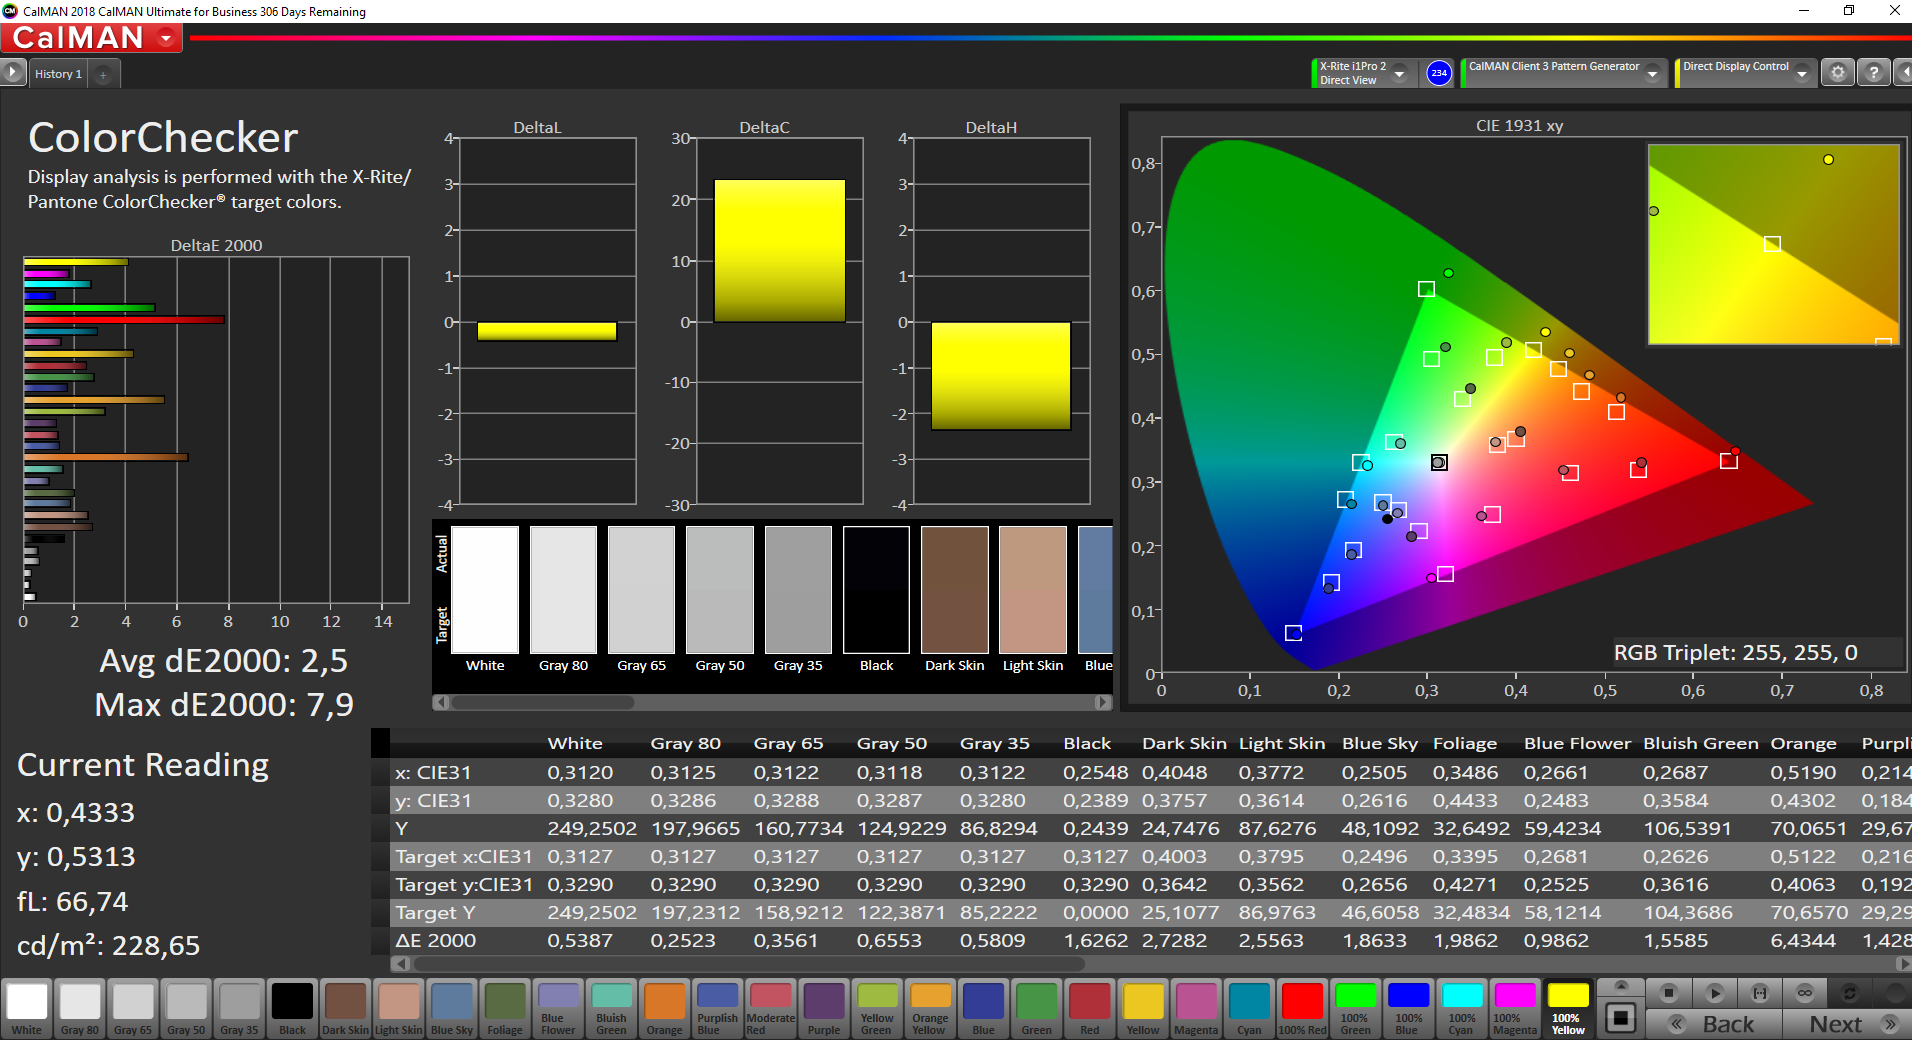
calibrated: 2.5
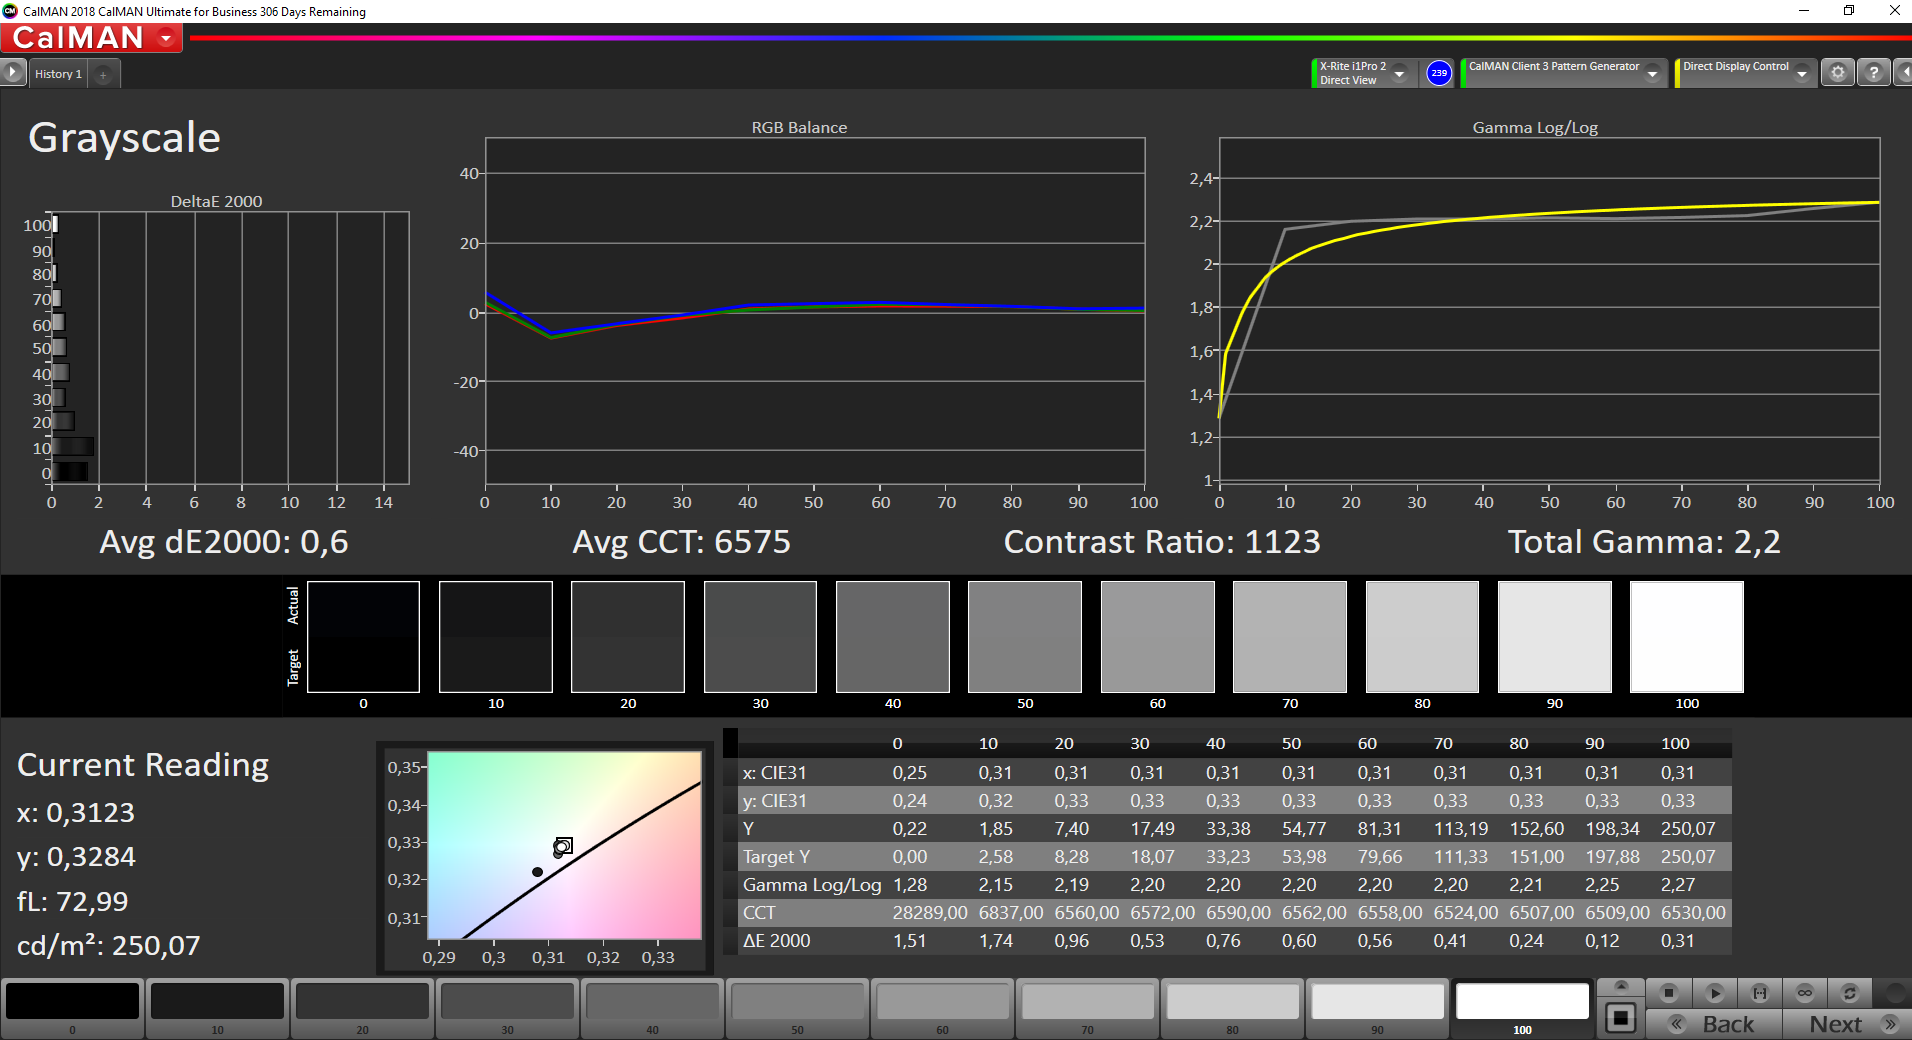
ΔE Greyscale Calman: 8 | ∀{0.09-98 Ø4.96}
90.6% sRGB (Argyll 1.6.3 3D)
59.1% AdobeRGB 1998 (Argyll 1.6.3 3D)
66.3% AdobeRGB 1998 (Argyll 3D)
90.6% sRGB (Argyll 3D)
69.2% Display P3 (Argyll 3D)
Gamma: 2.38
CCT: 7100 K
| Lenovo ThinkPad L390 Yoga-20NT000XGE LEN4094, NV133FHM-N5A, IPS LED, 1920x1080, 13.3" | Lenovo ThinkPad L380 Yoga-20M7001BGE M133NWF4-R3, IPS LED, 1920x1080, 13.3" | Dell Inspiron 13-5379-9573 BOE BOE06A7, IPS, 1920x1080, 13.3" | Lenovo Yoga C930-13IKB B139HAN03_0, IPS, 1920x1080, 13.9" | Acer Spin 5 SP513-52N-54SF LC133LF102, IPS, 1920x1080, 13.3" | |
|---|---|---|---|---|---|
| Display | 0% | -36% | -1% | 3% | |
| Display P3 Coverage (%) | 69.2 | 65.1 -6% | 41.2 -40% | 64.3 -7% | 69.8 1% |
| sRGB Coverage (%) | 90.6 | 95.5 5% | 61.7 -32% | 94.6 4% | 94.6 4% |
| AdobeRGB 1998 Coverage (%) | 66.3 | 66.9 1% | 42.6 -36% | 66.2 0% | 69.3 5% |
| Response Times | 16% | 11% | 23% | 16% | |
| Response Time Grey 50% / Grey 80% * (ms) | 51.2 ? | 47 ? 8% | 45 ? 12% | 40.8 ? 20% | 49 ? 4% |
| Response Time Black / White * (ms) | 36.8 ? | 28 ? 24% | 33 ? 10% | 27.6 ? 25% | 27 ? 27% |
| PWM Frequency (Hz) | 1000 ? | 217 ? | 192 ? | 1000 ? | |
| Screen | 6% | -16% | -7% | 11% | |
| Brightness middle (cd/m²) | 313 | 323 3% | 274 -12% | 316 1% | 295 -6% |
| Brightness (cd/m²) | 295 | 310 5% | 272 -8% | 291 -1% | 276 -6% |
| Brightness Distribution (%) | 90 | 88 -2% | 81 -10% | 83 -8% | 88 -2% |
| Black Level * (cd/m²) | 0.22 | 0.22 -0% | 0.32 -45% | 0.36 -64% | 0.27 -23% |
| Contrast (:1) | 1423 | 1468 3% | 856 -40% | 878 -38% | 1093 -23% |
| Colorchecker dE 2000 * | 6.2 | 5 19% | 5.57 10% | 5.9 5% | 2.97 52% |
| Colorchecker dE 2000 max. * | 10.7 | 9.56 11% | 13.48 -26% | 12.9 -21% | 5.67 47% |
| Colorchecker dE 2000 calibrated * | 2.5 | 1.3 48% | |||
| Greyscale dE 2000 * | 8 | 6.64 17% | 4.66 42% | 8.6 -8% | 3.12 61% |
| Gamma | 2.38 92% | 2.2 100% | 2.53 87% | 2.1 105% | 2.45 90% |
| CCT | 7100 92% | 6638 98% | 7010 93% | 6854 95% | 6676 97% |
| Color Space (Percent of AdobeRGB 1998) (%) | 59.1 | 61 3% | 39 -34% | 60.7 3% | 62 5% |
| Color Space (Percent of sRGB) (%) | 90.6 | 95 5% | 61 -33% | 94.5 4% | 94 4% |
| Total Average (Program / Settings) | 7% /
6% | -14% /
-16% | 5% /
-2% | 10% /
10% |
* ... smaller is better
Display Response Times
| ↔ Response Time Black to White | ||
|---|---|---|
| 36.8 ms ... rise ↗ and fall ↘ combined | ↗ 19.2 ms rise | 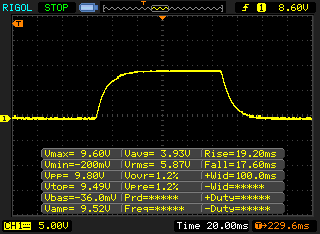 |
| ↘ 17.6 ms fall | ||
| The screen shows slow response rates in our tests and will be unsatisfactory for gamers. In comparison, all tested devices range from 0.1 (minimum) to 240 (maximum) ms. » 95 % of all devices are better. This means that the measured response time is worse than the average of all tested devices (19.8 ms). | ||
| ↔ Response Time 50% Grey to 80% Grey | ||
| 51.2 ms ... rise ↗ and fall ↘ combined | ↗ 26.8 ms rise | 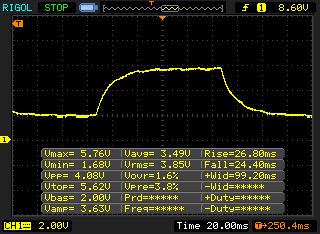 |
| ↘ 24.4 ms fall | ||
| The screen shows slow response rates in our tests and will be unsatisfactory for gamers. In comparison, all tested devices range from 0.165 (minimum) to 636 (maximum) ms. » 88 % of all devices are better. This means that the measured response time is worse than the average of all tested devices (30.9 ms). | ||
Screen Flickering / PWM (Pulse-Width Modulation)
| Screen flickering / PWM detected | 1000 Hz | ≤ 99 % brightness setting | 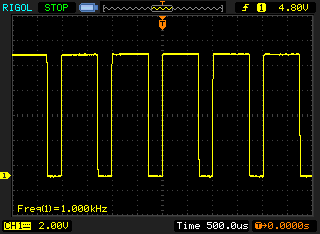 |
The display backlight flickers at 1000 Hz (worst case, e.g., utilizing PWM) Flickering detected at a brightness setting of 99 % and below. There should be no flickering or PWM above this brightness setting. The frequency of 1000 Hz is quite high, so most users sensitive to PWM should not notice any flickering. In comparison: 52 % of all tested devices do not use PWM to dim the display. If PWM was detected, an average of 7741 (minimum: 5 - maximum: 343500) Hz was measured. | |||
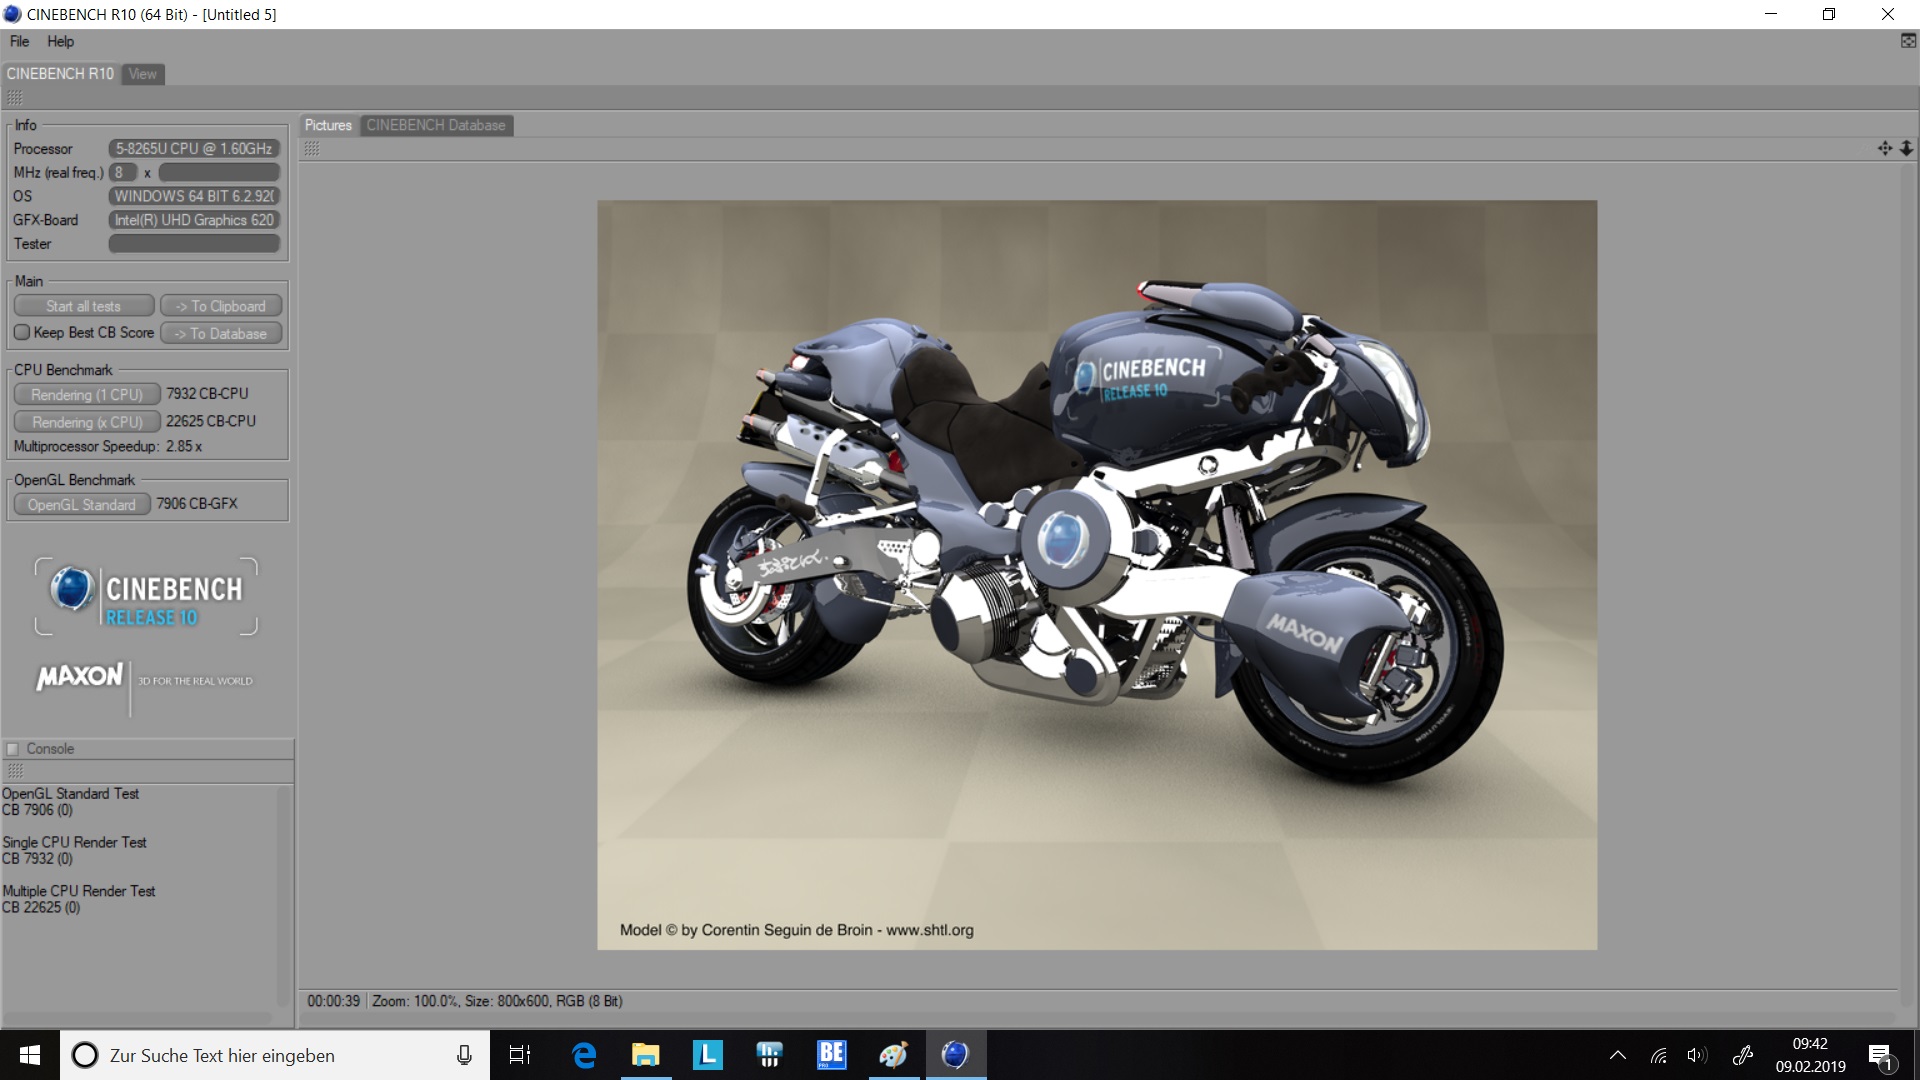
| Cinebench R10 | |
| Rendering Single CPUs 64Bit | |
| Average of class Convertible (12127 - 12555, n=2, last 2 years) | |
| Lenovo ThinkPad L390 Yoga-20NT000XGE | |
| Average Intel Core i5-8265U (7705 - 7975, n=4) | |
| Lenovo Yoga C930-13IKB | |
| Rendering Multiple CPUs 64Bit | |
| Average of class Convertible (36094 - 50439, n=2, last 2 years) | |
| Lenovo Yoga C930-13IKB | |
| Lenovo ThinkPad L390 Yoga-20NT000XGE | |
| Average Intel Core i5-8265U (18924 - 25361, n=4) | |
| Blender - v2.79 BMW27 CPU | |
| Average Intel Core i5-8265U (769 - 1098, n=15) | |
| Lenovo ThinkPad L390 Yoga-20NT000XGE | |
| Average of class Convertible (105 - 1051, n=48, last 2 years) | |
* ... smaller is better
| PCMark 8 Home Score Accelerated v2 | 3780 points | |
| PCMark 8 Creative Score Accelerated v2 | 4924 points | |
| PCMark 8 Work Score Accelerated v2 | 4843 points | |
| PCMark 10 Score | 3840 points | |
Help | ||
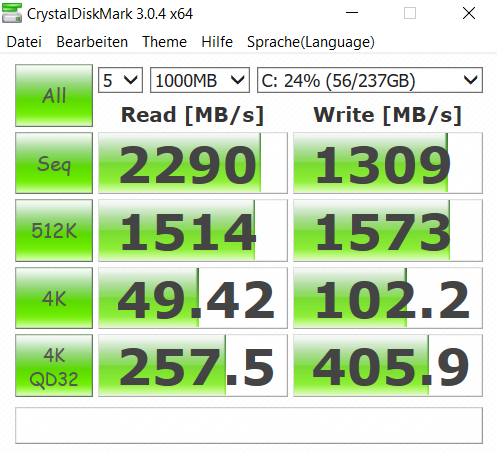
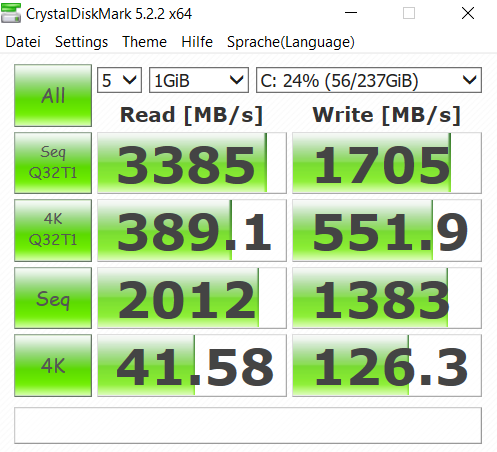
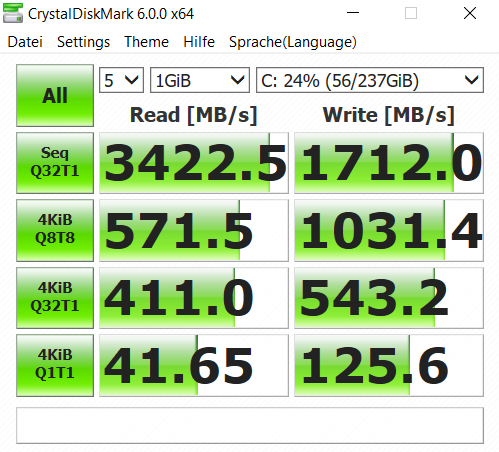
| Lenovo ThinkPad L390 Yoga-20NT000XGE Samsung SSD PM981 MZVLB256HAHQ | Lenovo ThinkPad L380 Yoga-20M7001BGE Samsung PM961 MZVLW256HEHP | Dell Inspiron 13-5379-9573 Micron 1100 MTFDDAV256TBN | Lenovo Yoga C930-13IKB SK hynix PC401 HFS256GD9TNG | Acer Spin 5 SP513-52N-54SF Micron 1100 MTFDDAV256TBN | Average Samsung SSD PM981 MZVLB256HAHQ | |
|---|---|---|---|---|---|---|
| CrystalDiskMark 5.2 / 6 | -8% | -62% | -35% | 32% | ||
| Write 4K (MB/s) | 126.3 | 123.4 -2% | 71.2 -44% | 94.5 -25% | 116.1 ? -8% | |
| Read 4K (MB/s) | 41.58 | 42.24 2% | 25.36 -39% | 39.95 -4% | 189.5 ? 356% | |
| Write Seq (MB/s) | 1383 | 920 -33% | 196.3 -86% | 531 -62% | 1409 ? 2% | |
| Read Seq (MB/s) | 2012 | 1991 -1% | 455.7 -77% | 1499 -25% | 1624 ? -19% | |
| Write 4K Q32T1 (MB/s) | 543 | 531 -2% | 261 -52% | 315.3 -42% | 360 ? -34% | |
| Read 4K Q32T1 (MB/s) | 411 | 373.6 -9% | 231.8 -44% | 279.8 -32% | 396 ? -4% | |
| Write Seq Q32T1 (MB/s) | 1712 | 1360 -21% | 510 -70% | 829 -52% | 1492 ? -13% | |
| Read Seq Q32T1 (MB/s) | 3423 | 3394 -1% | 525 -85% | 2570 -25% | 3313 ? -3% | |
| Write 4K Q8T8 (MB/s) | 1031 | 332 -68% | 1152 ? 12% | |||
| Read 4K Q8T8 (MB/s) | 572 | 488.6 -15% | 736 ? 29% | |||
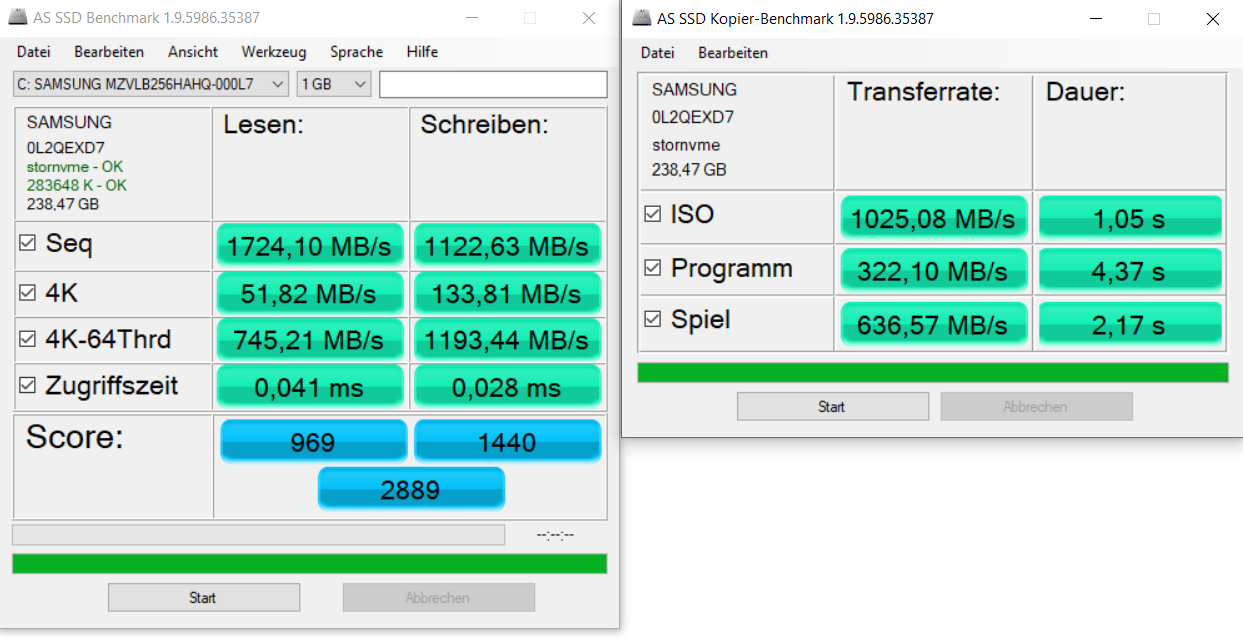
| AS SSD | -25% | -90% | -47% | -74% | -6% | |
| Seq Read (MB/s) | 1724 | 1609 -7% | 462.8 -73% | 1850 7% | 486.3 -72% | 2032 ? 18% |
| Seq Write (MB/s) | 1123 | 859 -24% | 365.7 -67% | 661 -41% | 421.4 -62% | 1339 ? 19% |
| 4K Read (MB/s) | 51.8 | 49.34 -5% | 24.71 -52% | 38.04 -27% | 25.48 -51% | 46.1 ? -11% |
| 4K Write (MB/s) | 133.8 | 117 -13% | 68.2 -49% | 95 -29% | 80.8 -40% | 107.4 ? -20% |
| 4K-64 Read (MB/s) | 745 | 774 4% | 232.2 -69% | 434.3 -42% | 235.5 -68% | 712 ? -4% |
| 4K-64 Write (MB/s) | 1193 | 299.9 -75% | 245.1 -79% | 266.3 -78% | 216.5 -82% | 999 ? -16% |
| Access Time Read * (ms) | 0.041 | 0.049 -20% | 0.13 -217% | 0.069 -68% | 0.11 -168% | 0.07076 ? -73% |
| Access Time Write * (ms) | 0.028 | 0.031 -11% | 0.074 -164% | 0.056 -100% | 0.055 -96% | 0.04352 ? -55% |
| Score Read (Points) | 969 | 984 2% | 303 -69% | 657 -32% | 310 -68% | 961 ? -1% |
| Score Write (Points) | 1440 | 503 -65% | 350 -76% | 427 -70% | 340 -76% | 1240 ? -14% |
| Score Total (Points) | 2889 | 1966 -32% | 812 -72% | 1373 -52% | 813 -72% | 2671 ? -8% |
| Copy ISO MB/s (MB/s) | 1025 | 747 -27% | 539 -47% | 327.5 -68% | 1297 ? 27% | |
| Copy Program MB/s (MB/s) | 322.1 | 216.3 -33% | 209.7 -35% | 157.3 -51% | 409 ? 27% | |
| Copy Game MB/s (MB/s) | 637 | 364.9 -43% | 340 -47% | 246.6 -61% | 786 ? 23% | |
| Total Average (Program / Settings) | -17% /
-19% | -76% /
-78% | -41% /
-42% | -74% /
-74% | 13% /
10% |
* ... smaller is better

| SPECviewperf 13 | |
| Solidworks (sw-04) | |
| Average Intel UHD Graphics 620 (28 - 37.6, n=7) | |
| Lenovo ThinkPad L390 Yoga-20NT000XGE | |
| Siemens NX (snx-03) | |
| Average Intel UHD Graphics 620 (4.37 - 5.37, n=7) | |
| Lenovo ThinkPad L390 Yoga-20NT000XGE | |
| Showcase (showcase-02) | |
| Average Intel UHD Graphics 620 (4.99 - 8.34, n=7) | |
| Lenovo ThinkPad L390 Yoga-20NT000XGE | |
| Medical (medical-02) | |
| Lenovo ThinkPad L390 Yoga-20NT000XGE | |
| Average Intel UHD Graphics 620 (1.96 - 2.26, n=7) | |
| Maya (maya-05) | |
| Average Intel UHD Graphics 620 (15.7 - 23, n=7) | |
| Lenovo ThinkPad L390 Yoga-20NT000XGE | |
| Energy (energy-02) | |
| Average Intel UHD Graphics 620 (0.21 - 2.85, n=6) | |
| Lenovo ThinkPad L390 Yoga-20NT000XGE | |
| Creo (creo-02) | |
| Average Intel UHD Graphics 620 (15.2 - 18.9, n=7) | |
| Lenovo ThinkPad L390 Yoga-20NT000XGE | |
| Catia (catia-05) | |
| Average Intel UHD Graphics 620 (17.4 - 23.4, n=7) | |
| Lenovo ThinkPad L390 Yoga-20NT000XGE | |
| 3ds Max (3dsmax-06) | |
| Average Intel UHD Graphics 620 (10.8 - 15, n=7) | |
| Lenovo ThinkPad L390 Yoga-20NT000XGE | |
| 3DMark 11 Performance | 1874 points | |
| 3DMark Ice Storm Standard Score | 57630 points | |
| 3DMark Cloud Gate Standard Score | 7947 points | |
| 3DMark Fire Strike Score | 1000 points | |
| 3DMark Fire Strike Extreme Score | 452 points | |
Help | ||
| low | med. | high | ultra | |
|---|---|---|---|---|
| BioShock Infinite (2013) | 54.3 | 29.1 | 23.7 | 7.3 |
| Dota 2 Reborn (2015) | 69.5 | 38.7 | 18 | 16 |
| X-Plane 11.11 (2018) | 30.3 | 22.7 | 19.1 |
Noise level
| Idle |
| 29.5 / 29.5 / 29.5 dB(A) |
| Load |
| 30.6 / 30.6 dB(A) |
 | ||
30 dB silent 40 dB(A) audible 50 dB(A) loud |
||
min: | ||
| Lenovo ThinkPad L390 Yoga-20NT000XGE UHD Graphics 620, i5-8265U, Samsung SSD PM981 MZVLB256HAHQ | Lenovo ThinkPad L380 Yoga-20M7001BGE UHD Graphics 620, i5-8250U, Samsung PM961 MZVLW256HEHP | Dell Inspiron 13-5379-9573 UHD Graphics 620, i5-8250U, Micron 1100 MTFDDAV256TBN | Lenovo Yoga C930-13IKB UHD Graphics 620, i5-8250U, SK hynix PC401 HFS256GD9TNG | Acer Spin 5 SP513-52N-54SF UHD Graphics 620, i5-8250U, Micron 1100 MTFDDAV256TBN | |
|---|---|---|---|---|---|
| Noise | -4% | -5% | -2% | -6% | |
| off / environment * (dB) | 29.5 | 30.4 -3% | 30.1 -2% | 29.3 1% | 30.4 -3% |
| Idle Minimum * (dB) | 29.5 | 30.4 -3% | 30.1 -2% | 29.3 1% | 30.4 -3% |
| Idle Average * (dB) | 29.5 | 30.4 -3% | 30.1 -2% | 29.3 1% | 30.4 -3% |
| Idle Maximum * (dB) | 29.5 | 30.8 -4% | 30.1 -2% | 29.7 -1% | 30.9 -5% |
| Load Average * (dB) | 30.6 | 32.1 -5% | 33 -8% | 31.8 -4% | 34 -11% |
| Load Maximum * (dB) | 30.6 | 32.9 -8% | 35 -14% | 32.7 -7% | 33.5 -9% |
* ... smaller is better
(-) The maximum temperature on the upper side is 46.7 °C / 116 F, compared to the average of 35.4 °C / 96 F, ranging from 19.6 to 60 °C for the class Convertible.
(-) The bottom heats up to a maximum of 50.7 °C / 123 F, compared to the average of 36.9 °C / 98 F
(+) In idle usage, the average temperature for the upper side is 22.9 °C / 73 F, compared to the device average of 30.3 °C / 87 F.
(+) The palmrests and touchpad are cooler than skin temperature with a maximum of 24.7 °C / 76.5 F and are therefore cool to the touch.
(+) The average temperature of the palmrest area of similar devices was 28 °C / 82.4 F (+3.3 °C / 5.9 F).
| Lenovo ThinkPad L390 Yoga-20NT000XGE UHD Graphics 620, i5-8265U, Samsung SSD PM981 MZVLB256HAHQ | Lenovo ThinkPad L380 Yoga-20M7001BGE UHD Graphics 620, i5-8250U, Samsung PM961 MZVLW256HEHP | Dell Inspiron 13-5379-9573 UHD Graphics 620, i5-8250U, Micron 1100 MTFDDAV256TBN | Lenovo Yoga C930-13IKB UHD Graphics 620, i5-8250U, SK hynix PC401 HFS256GD9TNG | Acer Spin 5 SP513-52N-54SF UHD Graphics 620, i5-8250U, Micron 1100 MTFDDAV256TBN | |
|---|---|---|---|---|---|
| Heat | 0% | -23% | 6% | 1% | |
| Maximum Upper Side * (°C) | 46.7 | 45 4% | 43.2 7% | 41.8 10% | 41.8 10% |
| Maximum Bottom * (°C) | 50.7 | 44.5 12% | 57.8 -14% | 40.9 19% | 47.8 6% |
| Idle Upper Side * (°C) | 23.8 | 25.6 -8% | 35.7 -50% | 25.6 -8% | 26 -9% |
| Idle Bottom * (°C) | 25.6 | 27.7 -8% | 34.6 -35% | 24.5 4% | 26.9 -5% |
* ... smaller is better
Lenovo ThinkPad L390 Yoga-20NT000XGE audio analysis
(±) | speaker loudness is average but good (76.3 dB)
Bass 100 - 315 Hz
(-) | nearly no bass - on average 17.9% lower than median
(±) | linearity of bass is average (12.9% delta to prev. frequency)
Mids 400 - 2000 Hz
(+) | balanced mids - only 2.1% away from median
(+) | mids are linear (6.1% delta to prev. frequency)
Highs 2 - 16 kHz
(±) | higher highs - on average 7.5% higher than median
(±) | linearity of highs is average (9.1% delta to prev. frequency)
Overall 100 - 16.000 Hz
(±) | linearity of overall sound is average (23% difference to median)
Compared to same class
» 69% of all tested devices in this class were better, 5% similar, 26% worse
» The best had a delta of 6%, average was 20%, worst was 57%
Compared to all devices tested
» 69% of all tested devices were better, 5% similar, 26% worse
» The best had a delta of 4%, average was 23%, worst was 134%
Lenovo Yoga C930-13IKB audio analysis
(±) | speaker loudness is average but good (77.4 dB)
Bass 100 - 315 Hz
(+) | good bass - only 4.8% away from median
(±) | linearity of bass is average (8.8% delta to prev. frequency)
Mids 400 - 2000 Hz
(+) | balanced mids - only 3% away from median
(+) | mids are linear (4.6% delta to prev. frequency)
Highs 2 - 16 kHz
(±) | reduced highs - on average 5.1% lower than median
(+) | highs are linear (5.4% delta to prev. frequency)
Overall 100 - 16.000 Hz
(+) | overall sound is linear (14.1% difference to median)
Compared to same class
» 20% of all tested devices in this class were better, 4% similar, 76% worse
» The best had a delta of 6%, average was 20%, worst was 57%
Compared to all devices tested
» 17% of all tested devices were better, 4% similar, 79% worse
» The best had a delta of 4%, average was 23%, worst was 134%
| Off / Standby | |
| Idle | |
| Load |
|
Key:
min: | |
| Lenovo ThinkPad L390 Yoga-20NT000XGE i5-8265U, UHD Graphics 620, Samsung SSD PM981 MZVLB256HAHQ, IPS LED, 1920x1080, 13.3" | Lenovo ThinkPad L380 Yoga-20M7001BGE i5-8250U, UHD Graphics 620, Samsung PM961 MZVLW256HEHP, IPS LED, 1920x1080, 13.3" | Dell Inspiron 13-5379-9573 i5-8250U, UHD Graphics 620, Micron 1100 MTFDDAV256TBN, IPS, 1920x1080, 13.3" | Lenovo Yoga C930-13IKB i5-8250U, UHD Graphics 620, SK hynix PC401 HFS256GD9TNG, IPS, 1920x1080, 13.9" | Acer Spin 5 SP513-52N-54SF i5-8250U, UHD Graphics 620, Micron 1100 MTFDDAV256TBN, IPS, 1920x1080, 13.3" | Average Intel UHD Graphics 620 | Average of class Convertible | |
|---|---|---|---|---|---|---|---|
| Power Consumption | 18% | 15% | -1% | 12% | 5% | -12% | |
| Idle Minimum * (Watt) | 4 | 3.44 14% | 3.2 20% | 3.3 17% | 3.9 2% | 3.81 ? 5% | 4.28 ? -7% |
| Idle Average * (Watt) | 7.1 | 6.9 3% | 5.9 17% | 6.8 4% | 8.2 -15% | 6.94 ? 2% | 6.96 ? 2% |
| Idle Maximum * (Watt) | 10.7 | 9.2 14% | 8.8 18% | 9.5 11% | 8.8 18% | 8.75 ? 18% | 8.67 ? 19% |
| Load Average * (Watt) | 33.8 | 27.6 18% | 31.2 8% | 40.8 -21% | 28.5 16% | 35 ? -4% | 45.1 ? -33% |
| Load Maximum * (Watt) | 48.8 | 29 41% | 42.2 14% | 57 -17% | 30.7 37% | 47.5 ? 3% | 67.7 ? -39% |
* ... smaller is better
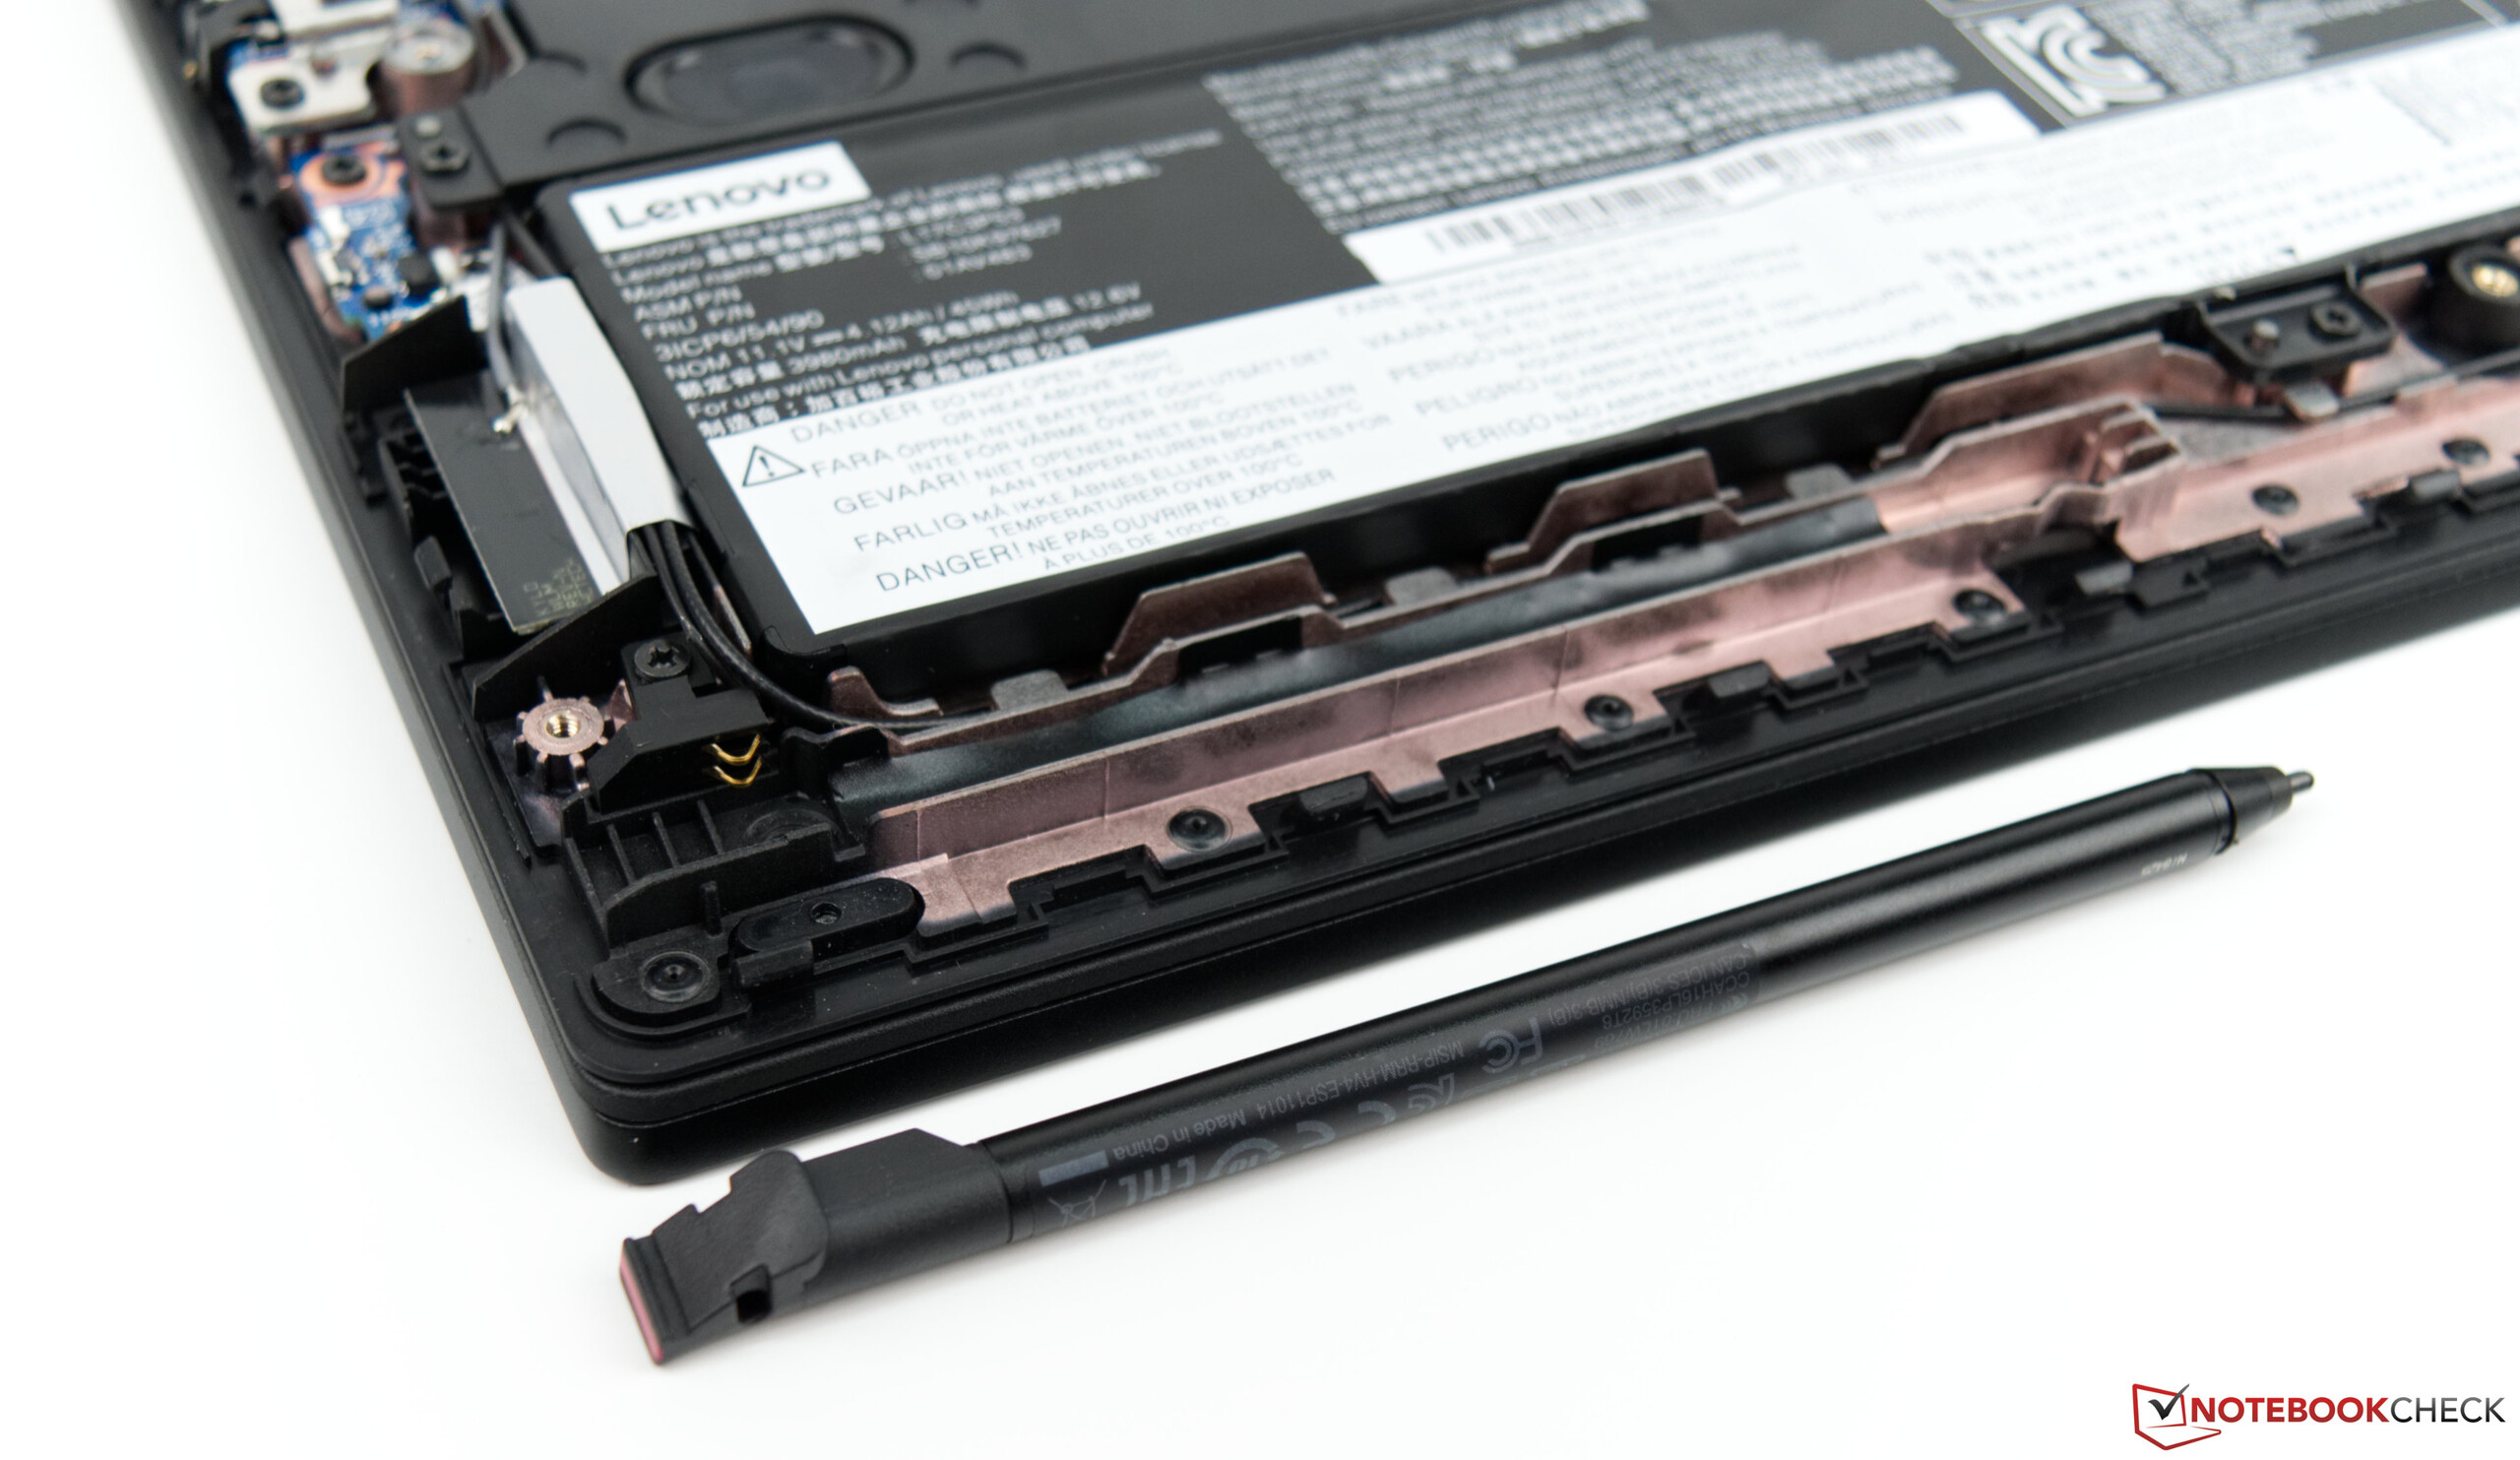
| Lenovo ThinkPad L390 Yoga-20NT000XGE i5-8265U, UHD Graphics 620, 45 Wh | Lenovo ThinkPad L380 Yoga-20M7001BGE i5-8250U, UHD Graphics 620, 45 Wh | Dell Inspiron 13-5379-9573 i5-8250U, UHD Graphics 620, 42 Wh | Lenovo Yoga C930-13IKB i5-8250U, UHD Graphics 620, 60 Wh | Acer Spin 5 SP513-52N-54SF i5-8250U, UHD Graphics 620, 53.9 Wh | Average of class Convertible | |
|---|---|---|---|---|---|---|
| Battery runtime | 3% | -7% | 40% | 15% | 63% | |
| Reader / Idle (h) | 15.8 | 13.9 -12% | 15.3 -3% | 23.9 51% | 26.7 ? 69% | |
| H.264 (h) | 7.4 | 8.5 15% | 10.5 42% | 15 ? 103% | ||
| WiFi v1.3 (h) | 7.2 | 7 -3% | 5.4 -25% | 9.2 28% | 8.3 15% | 12 ? 67% |
| Load (h) | 1.5 | 1.7 13% | 1.6 7% | 2.1 40% | 1.713 ? 14% |
Pros
Cons
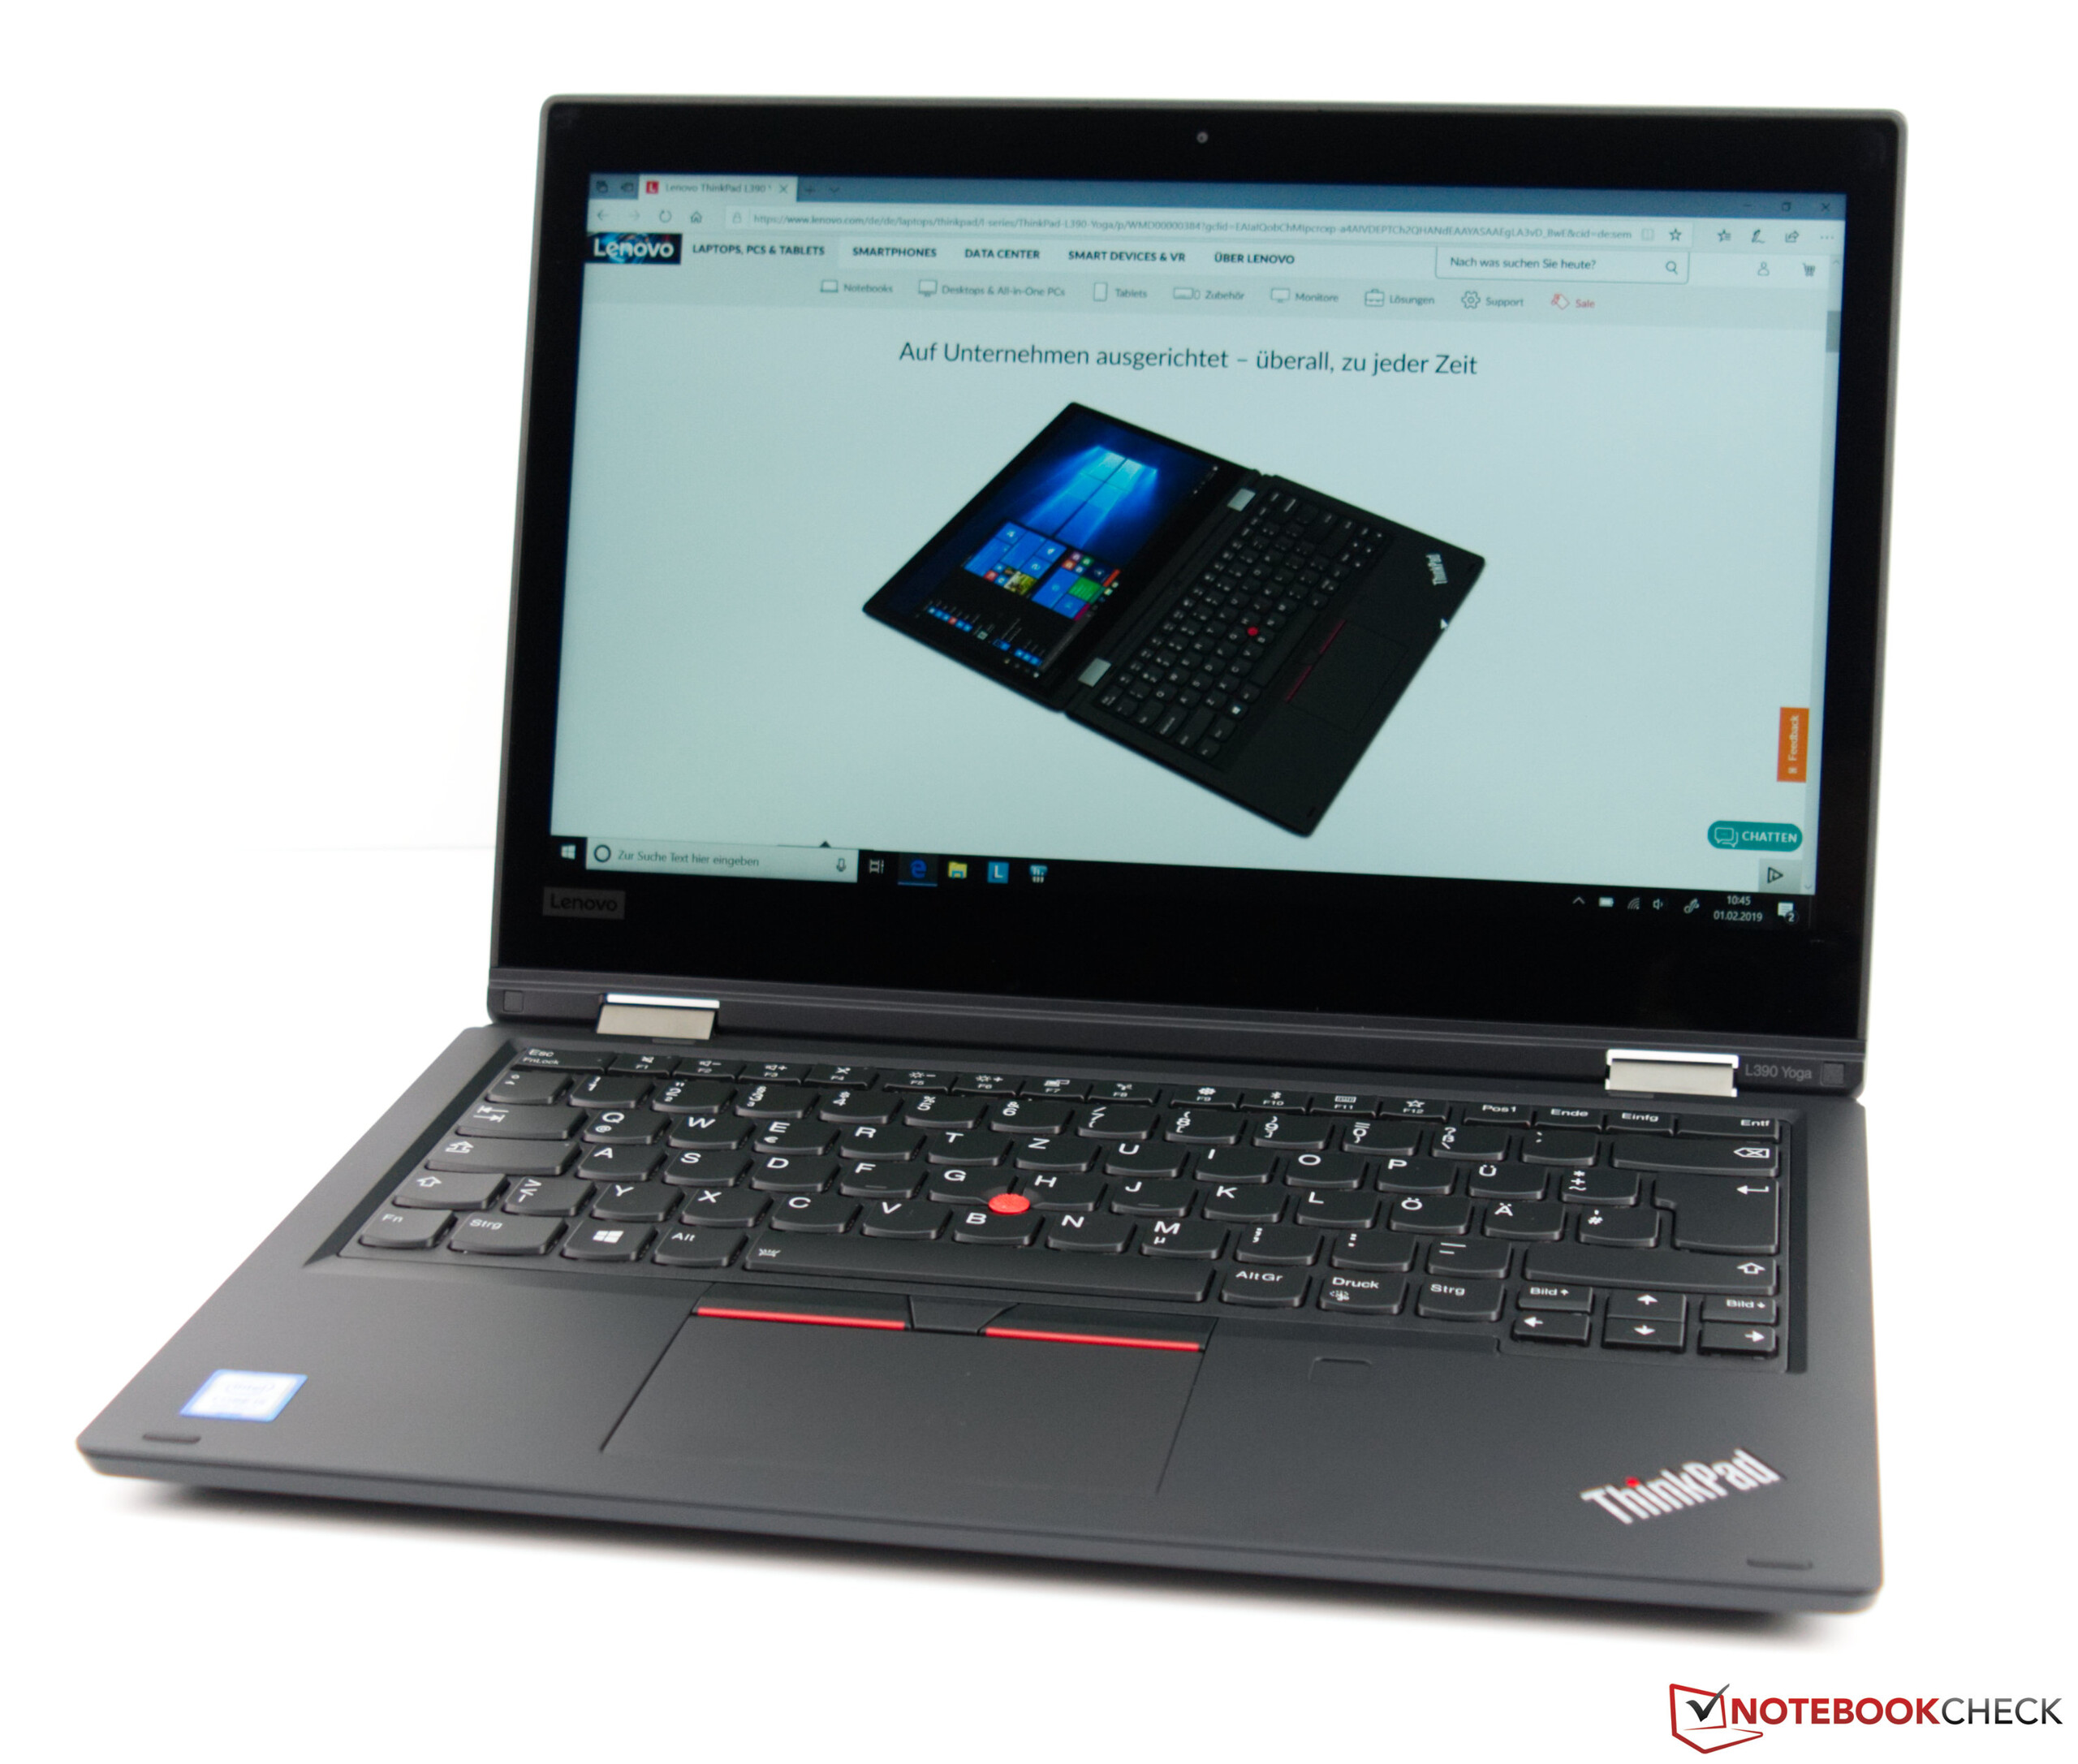
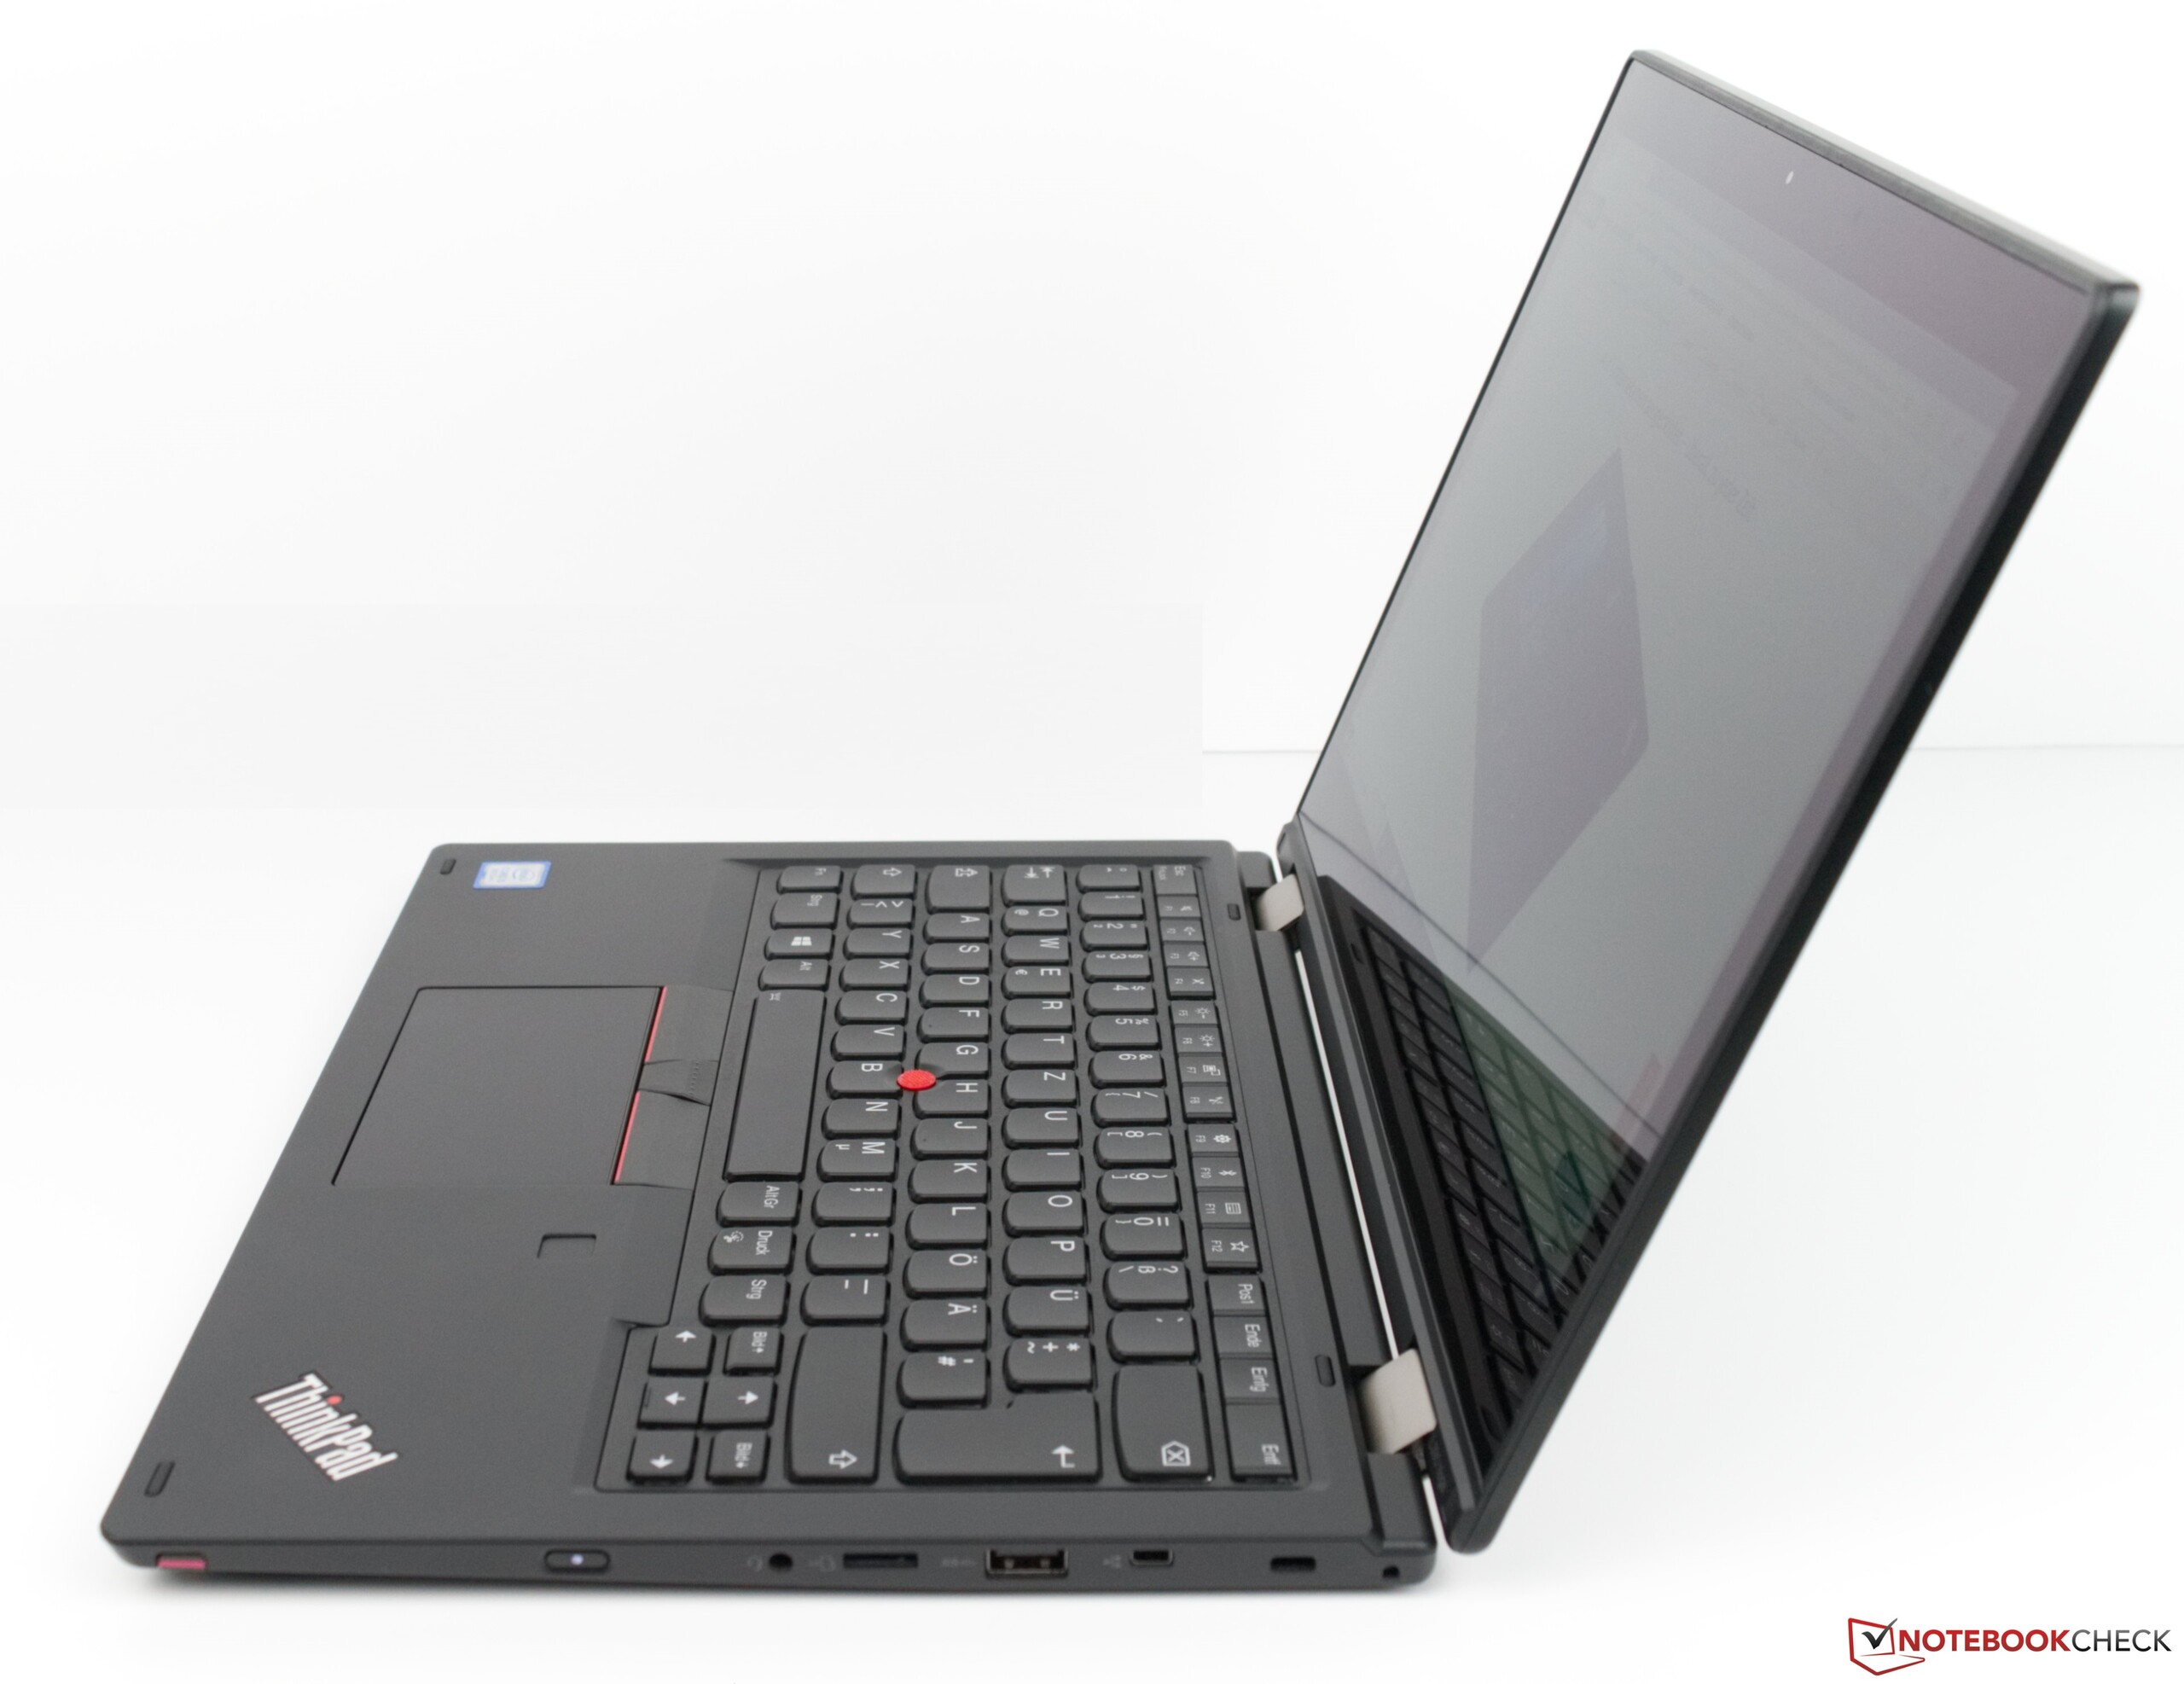
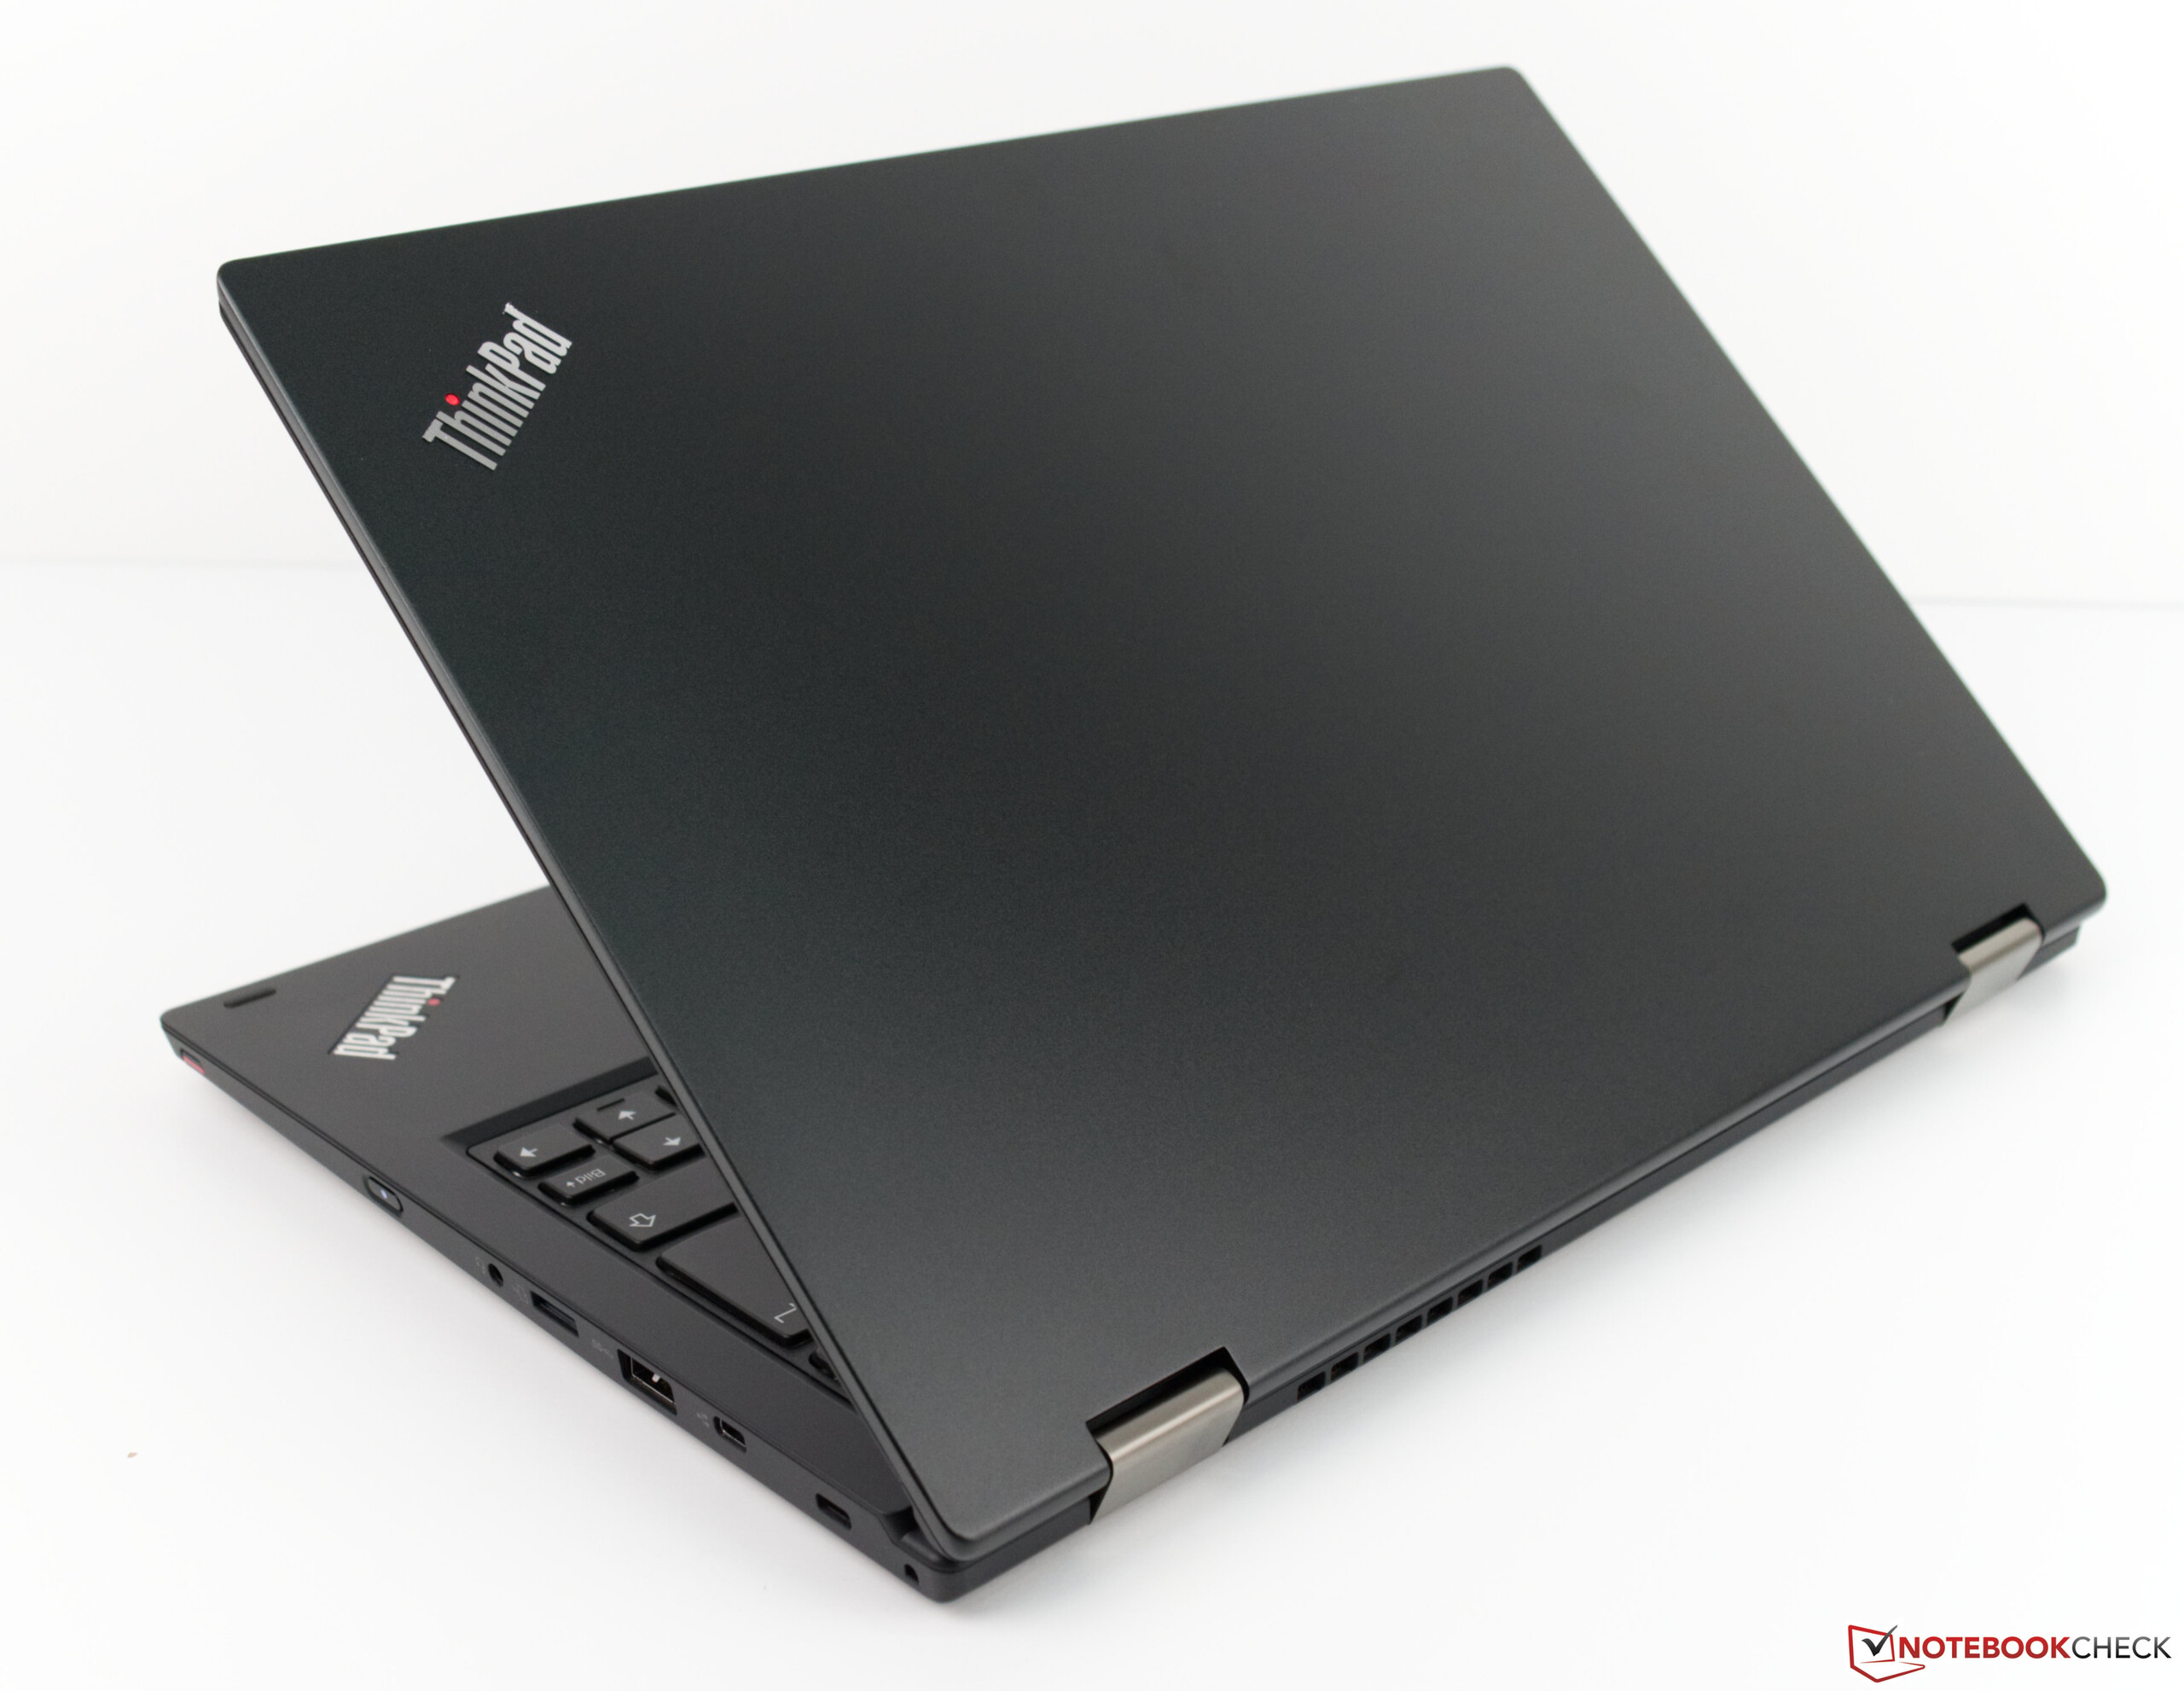
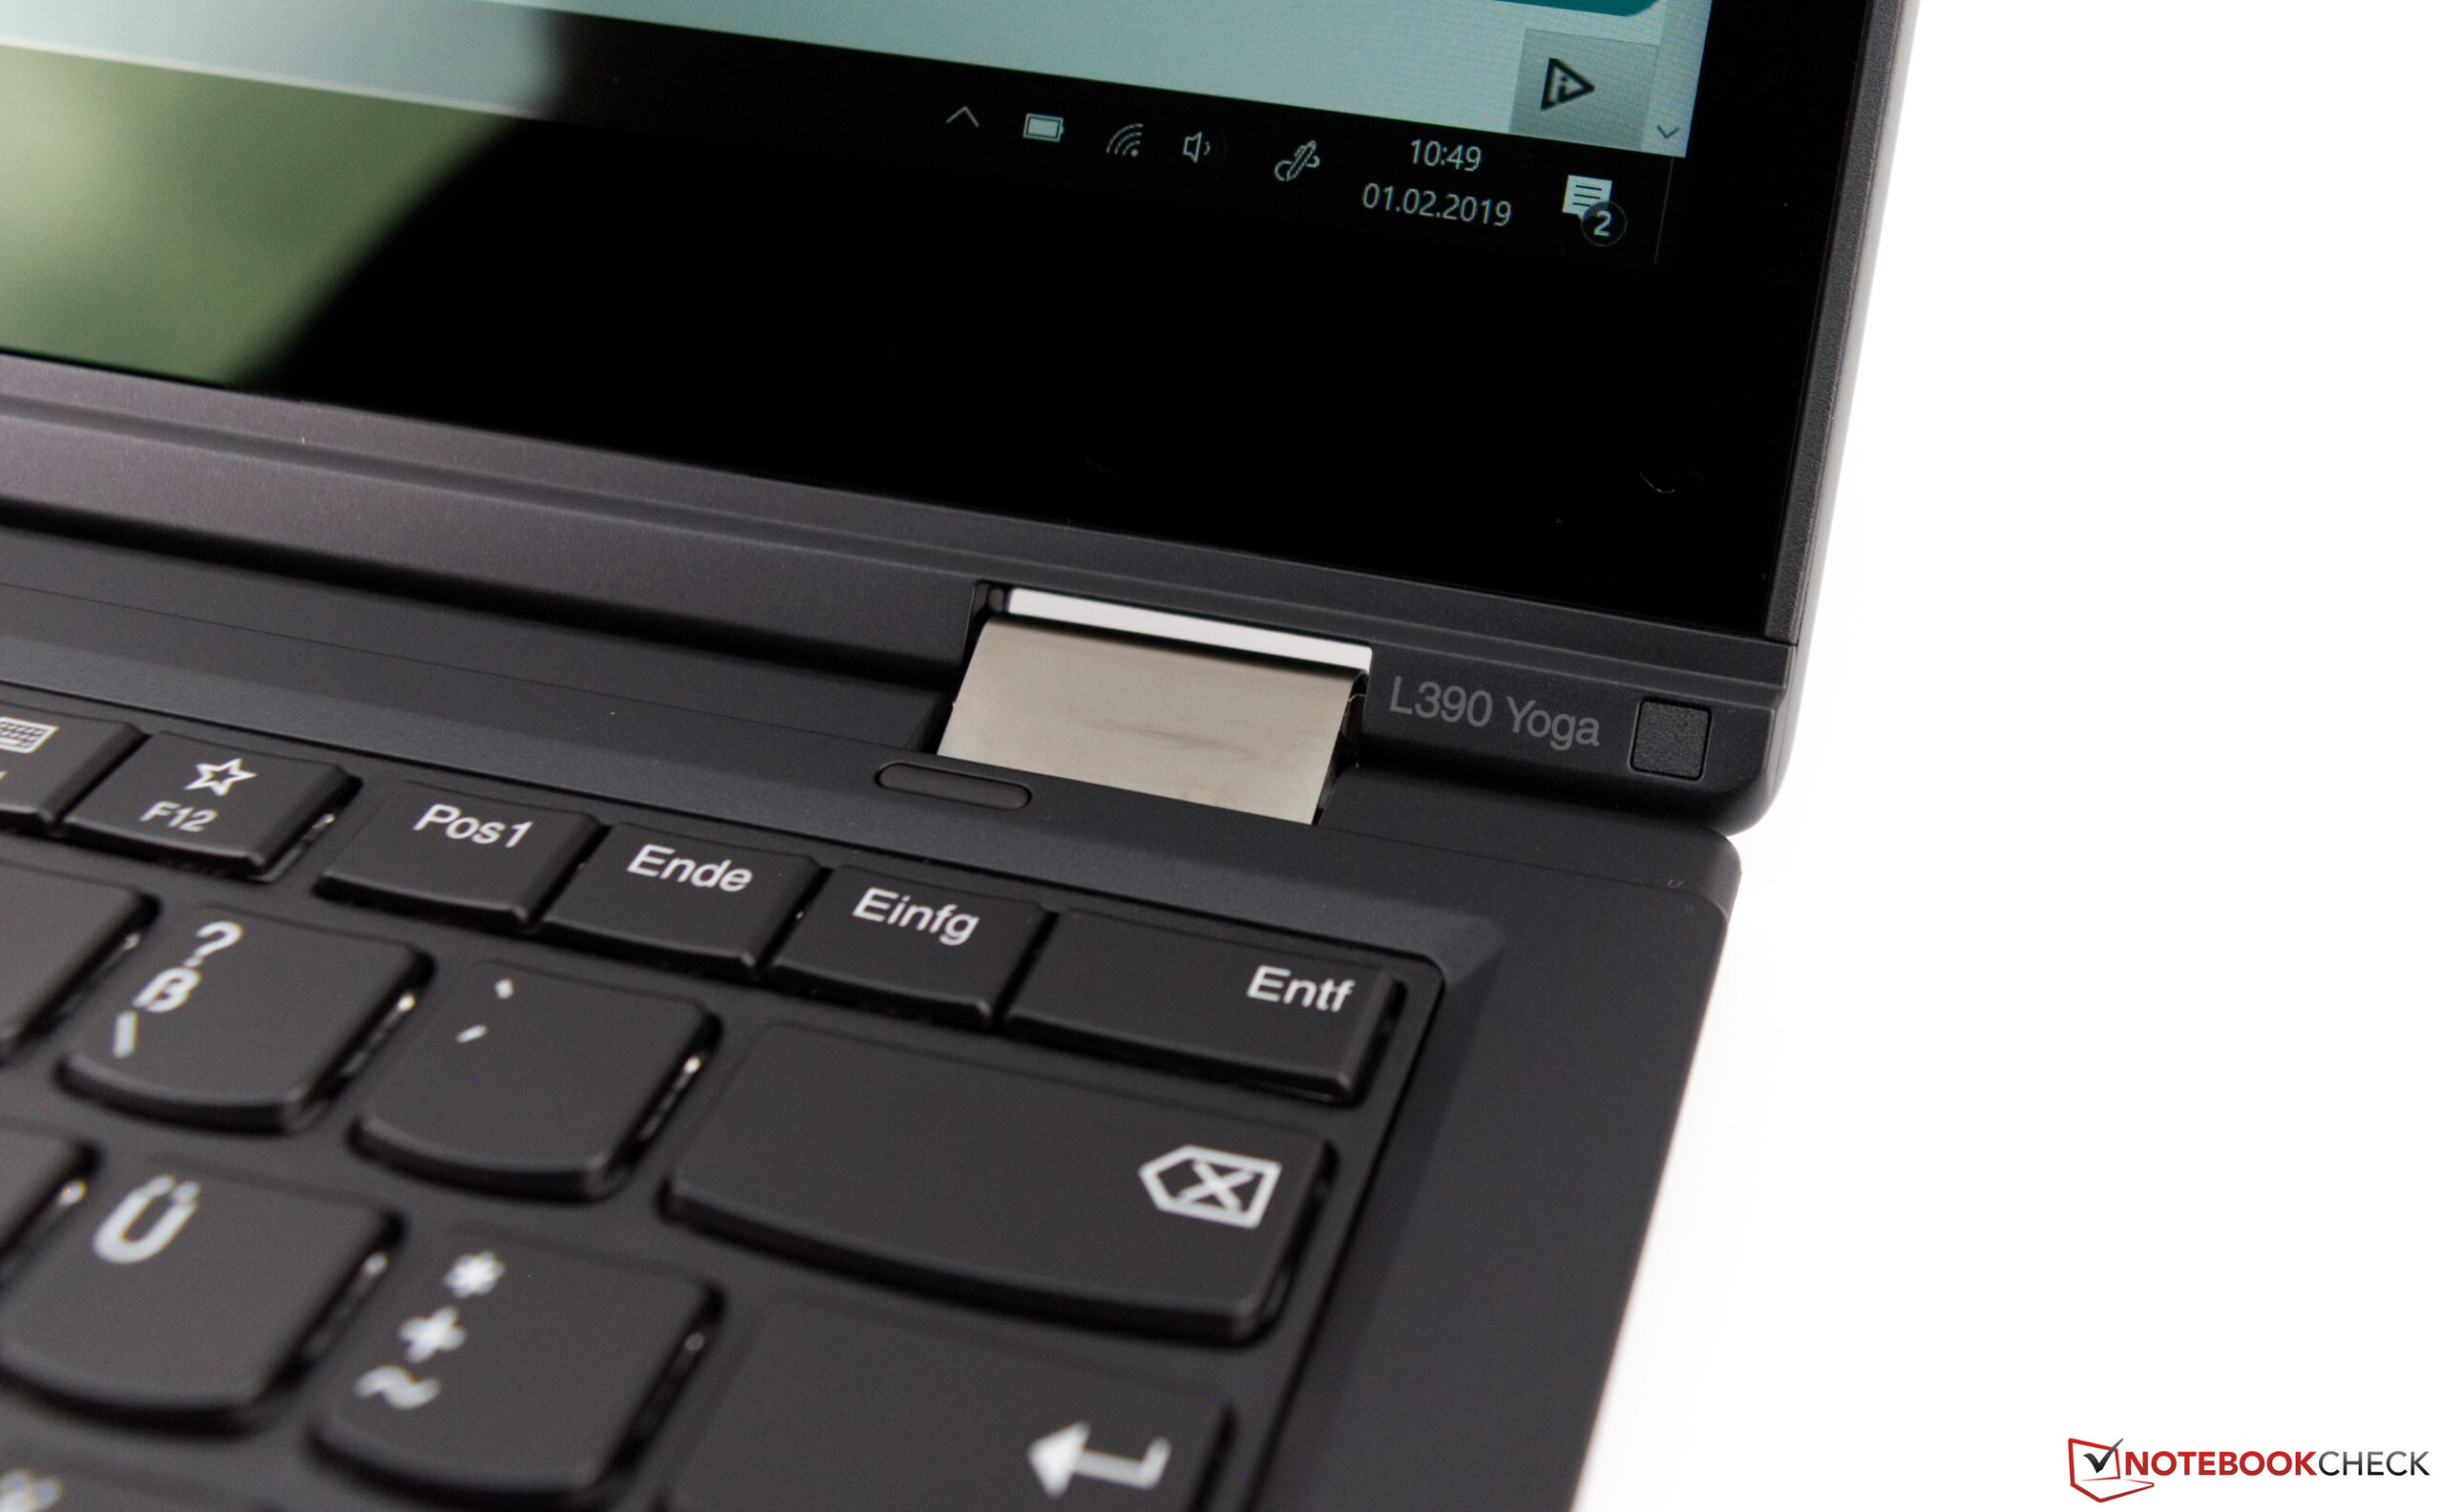
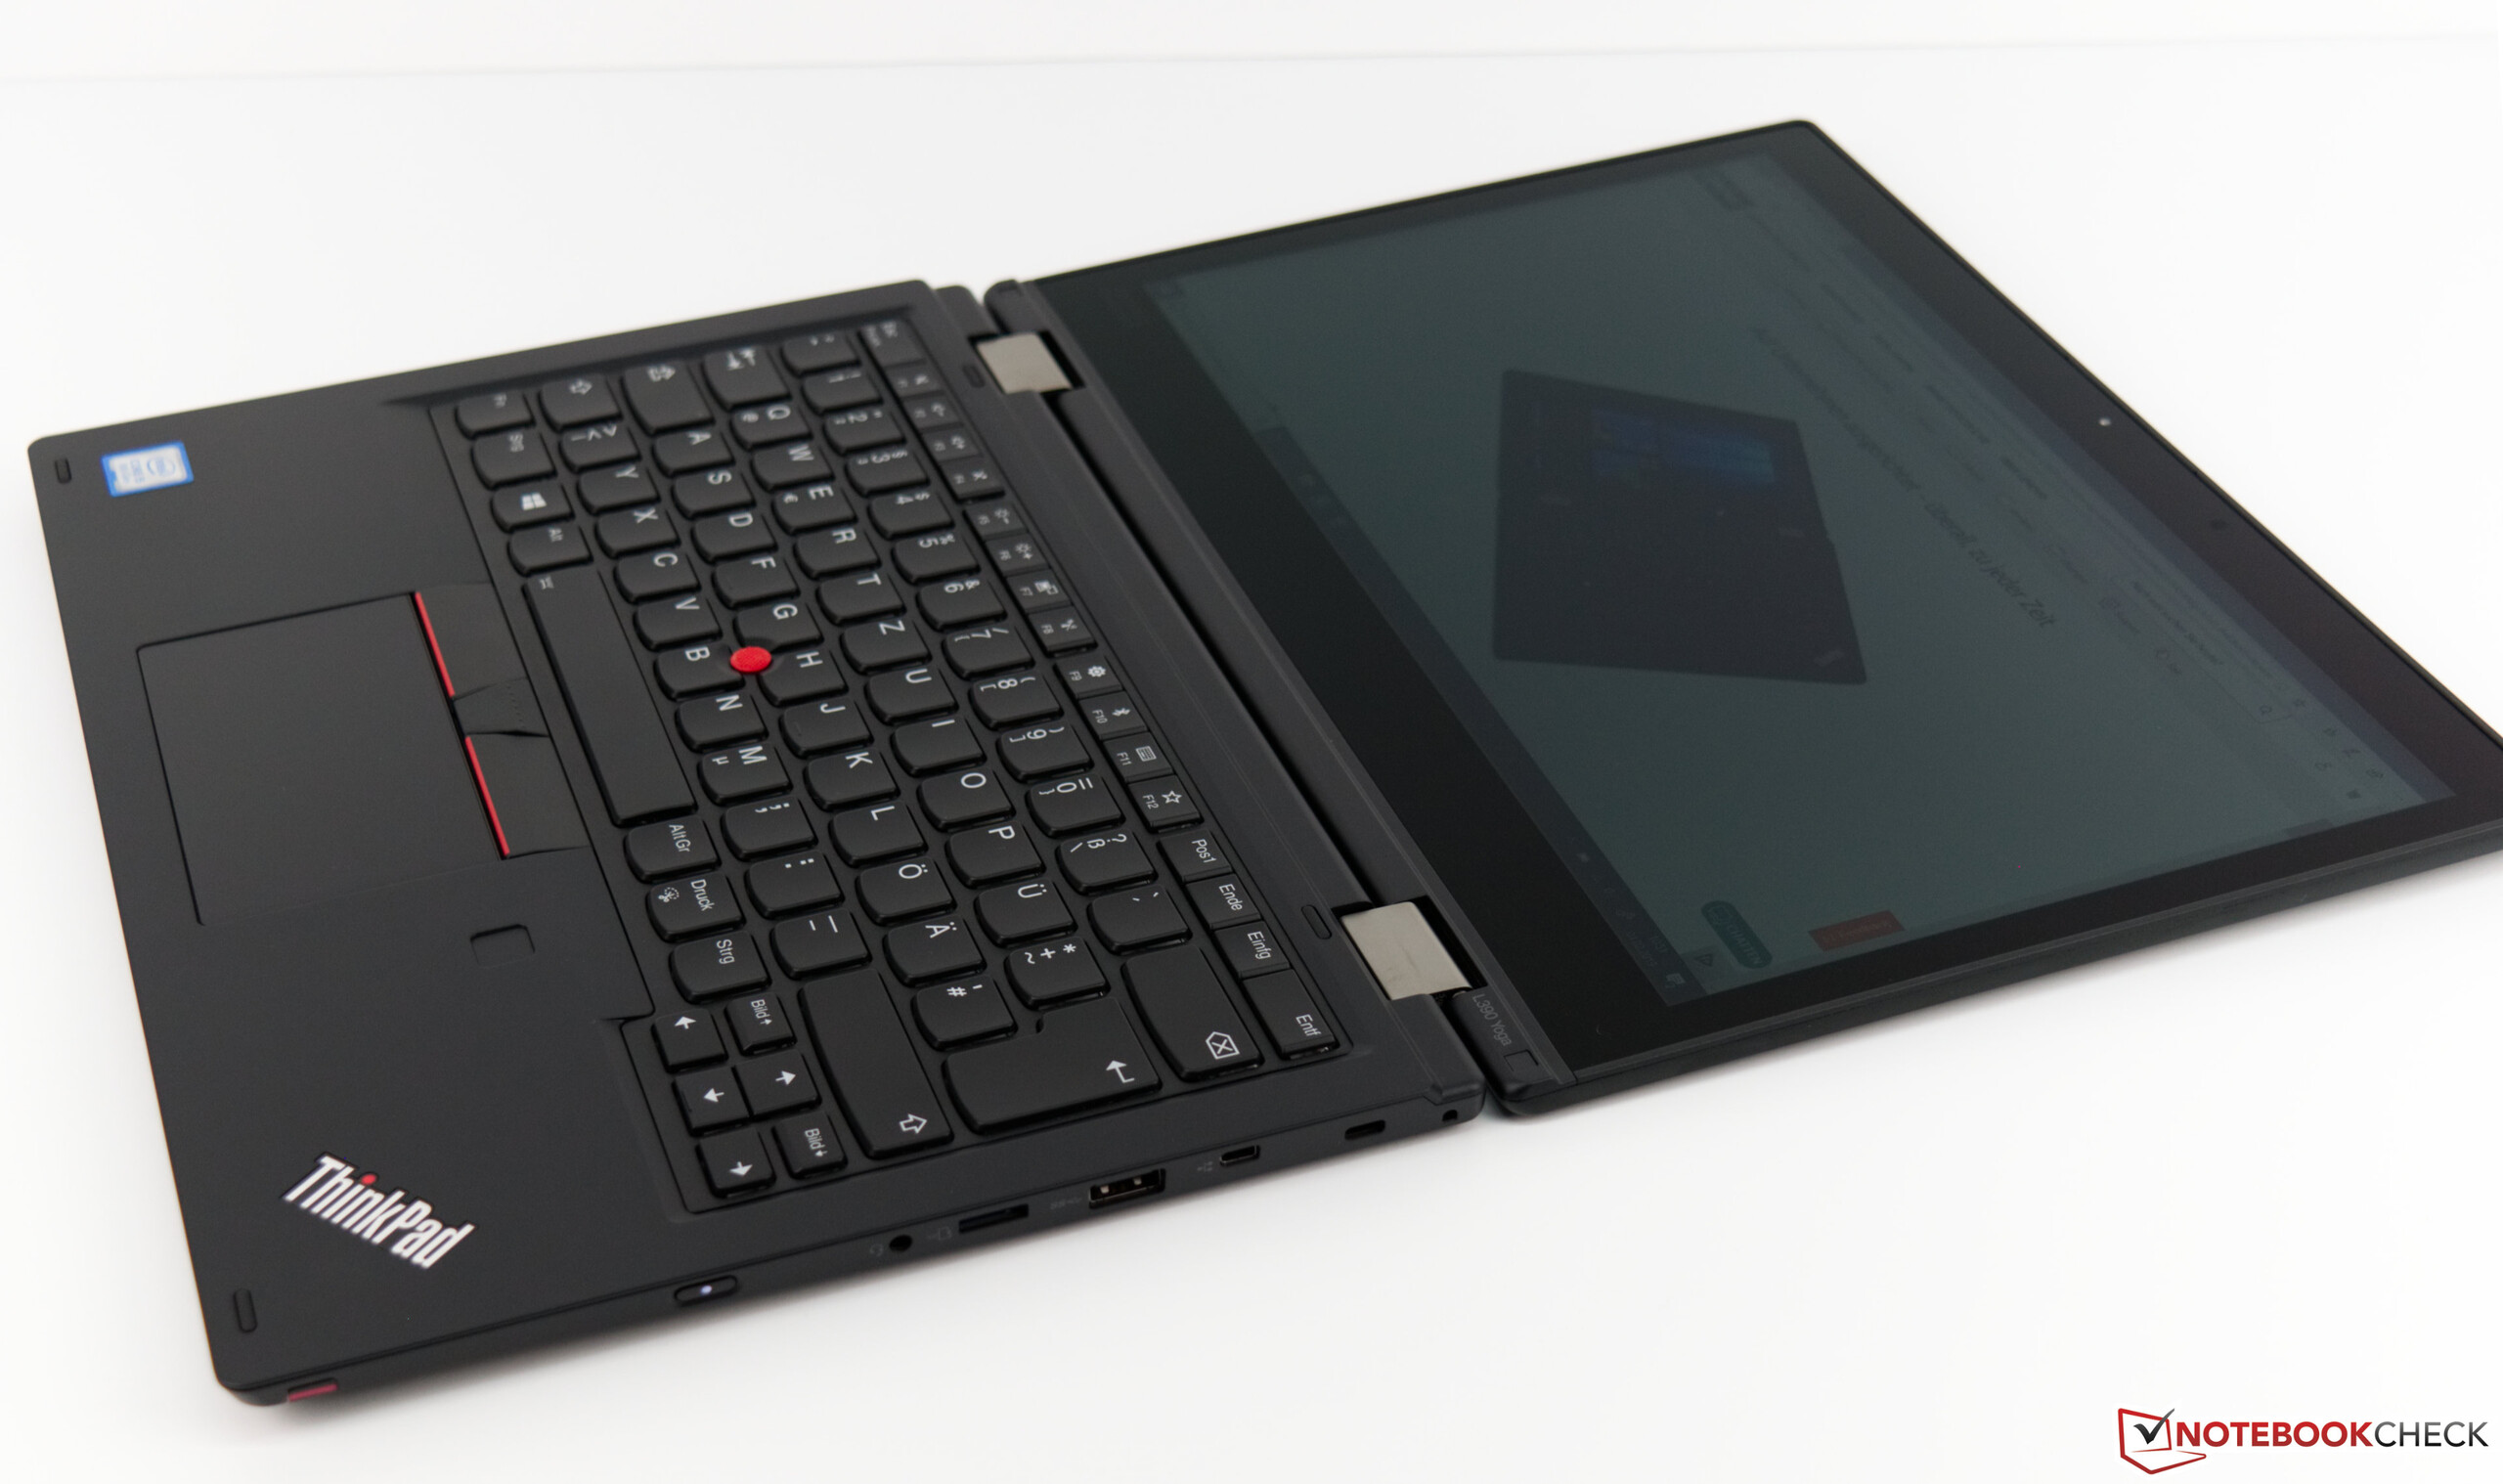
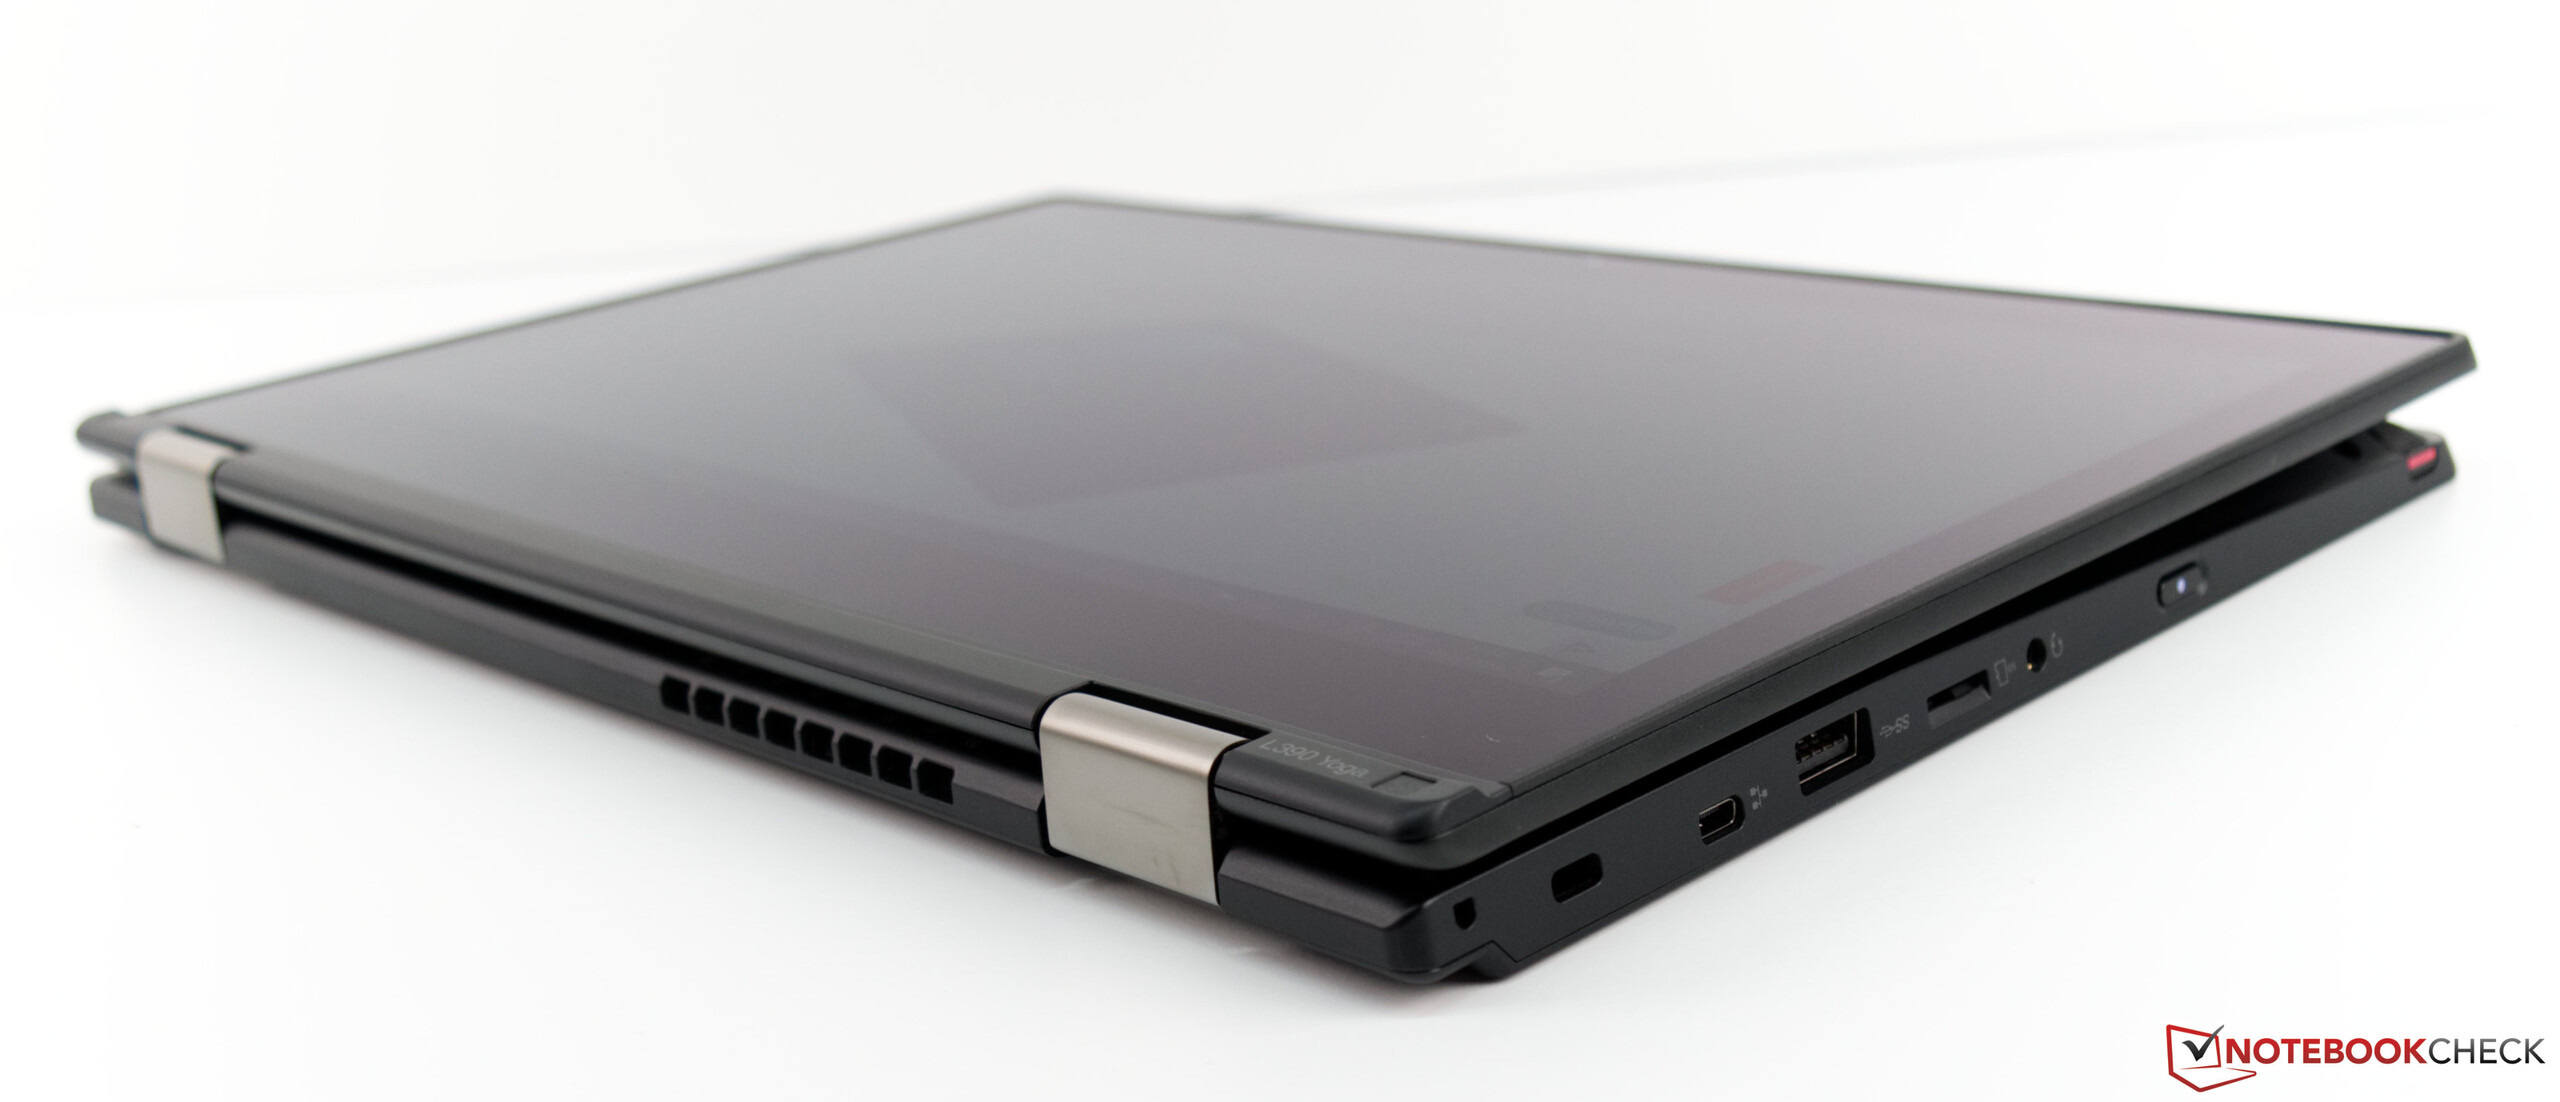
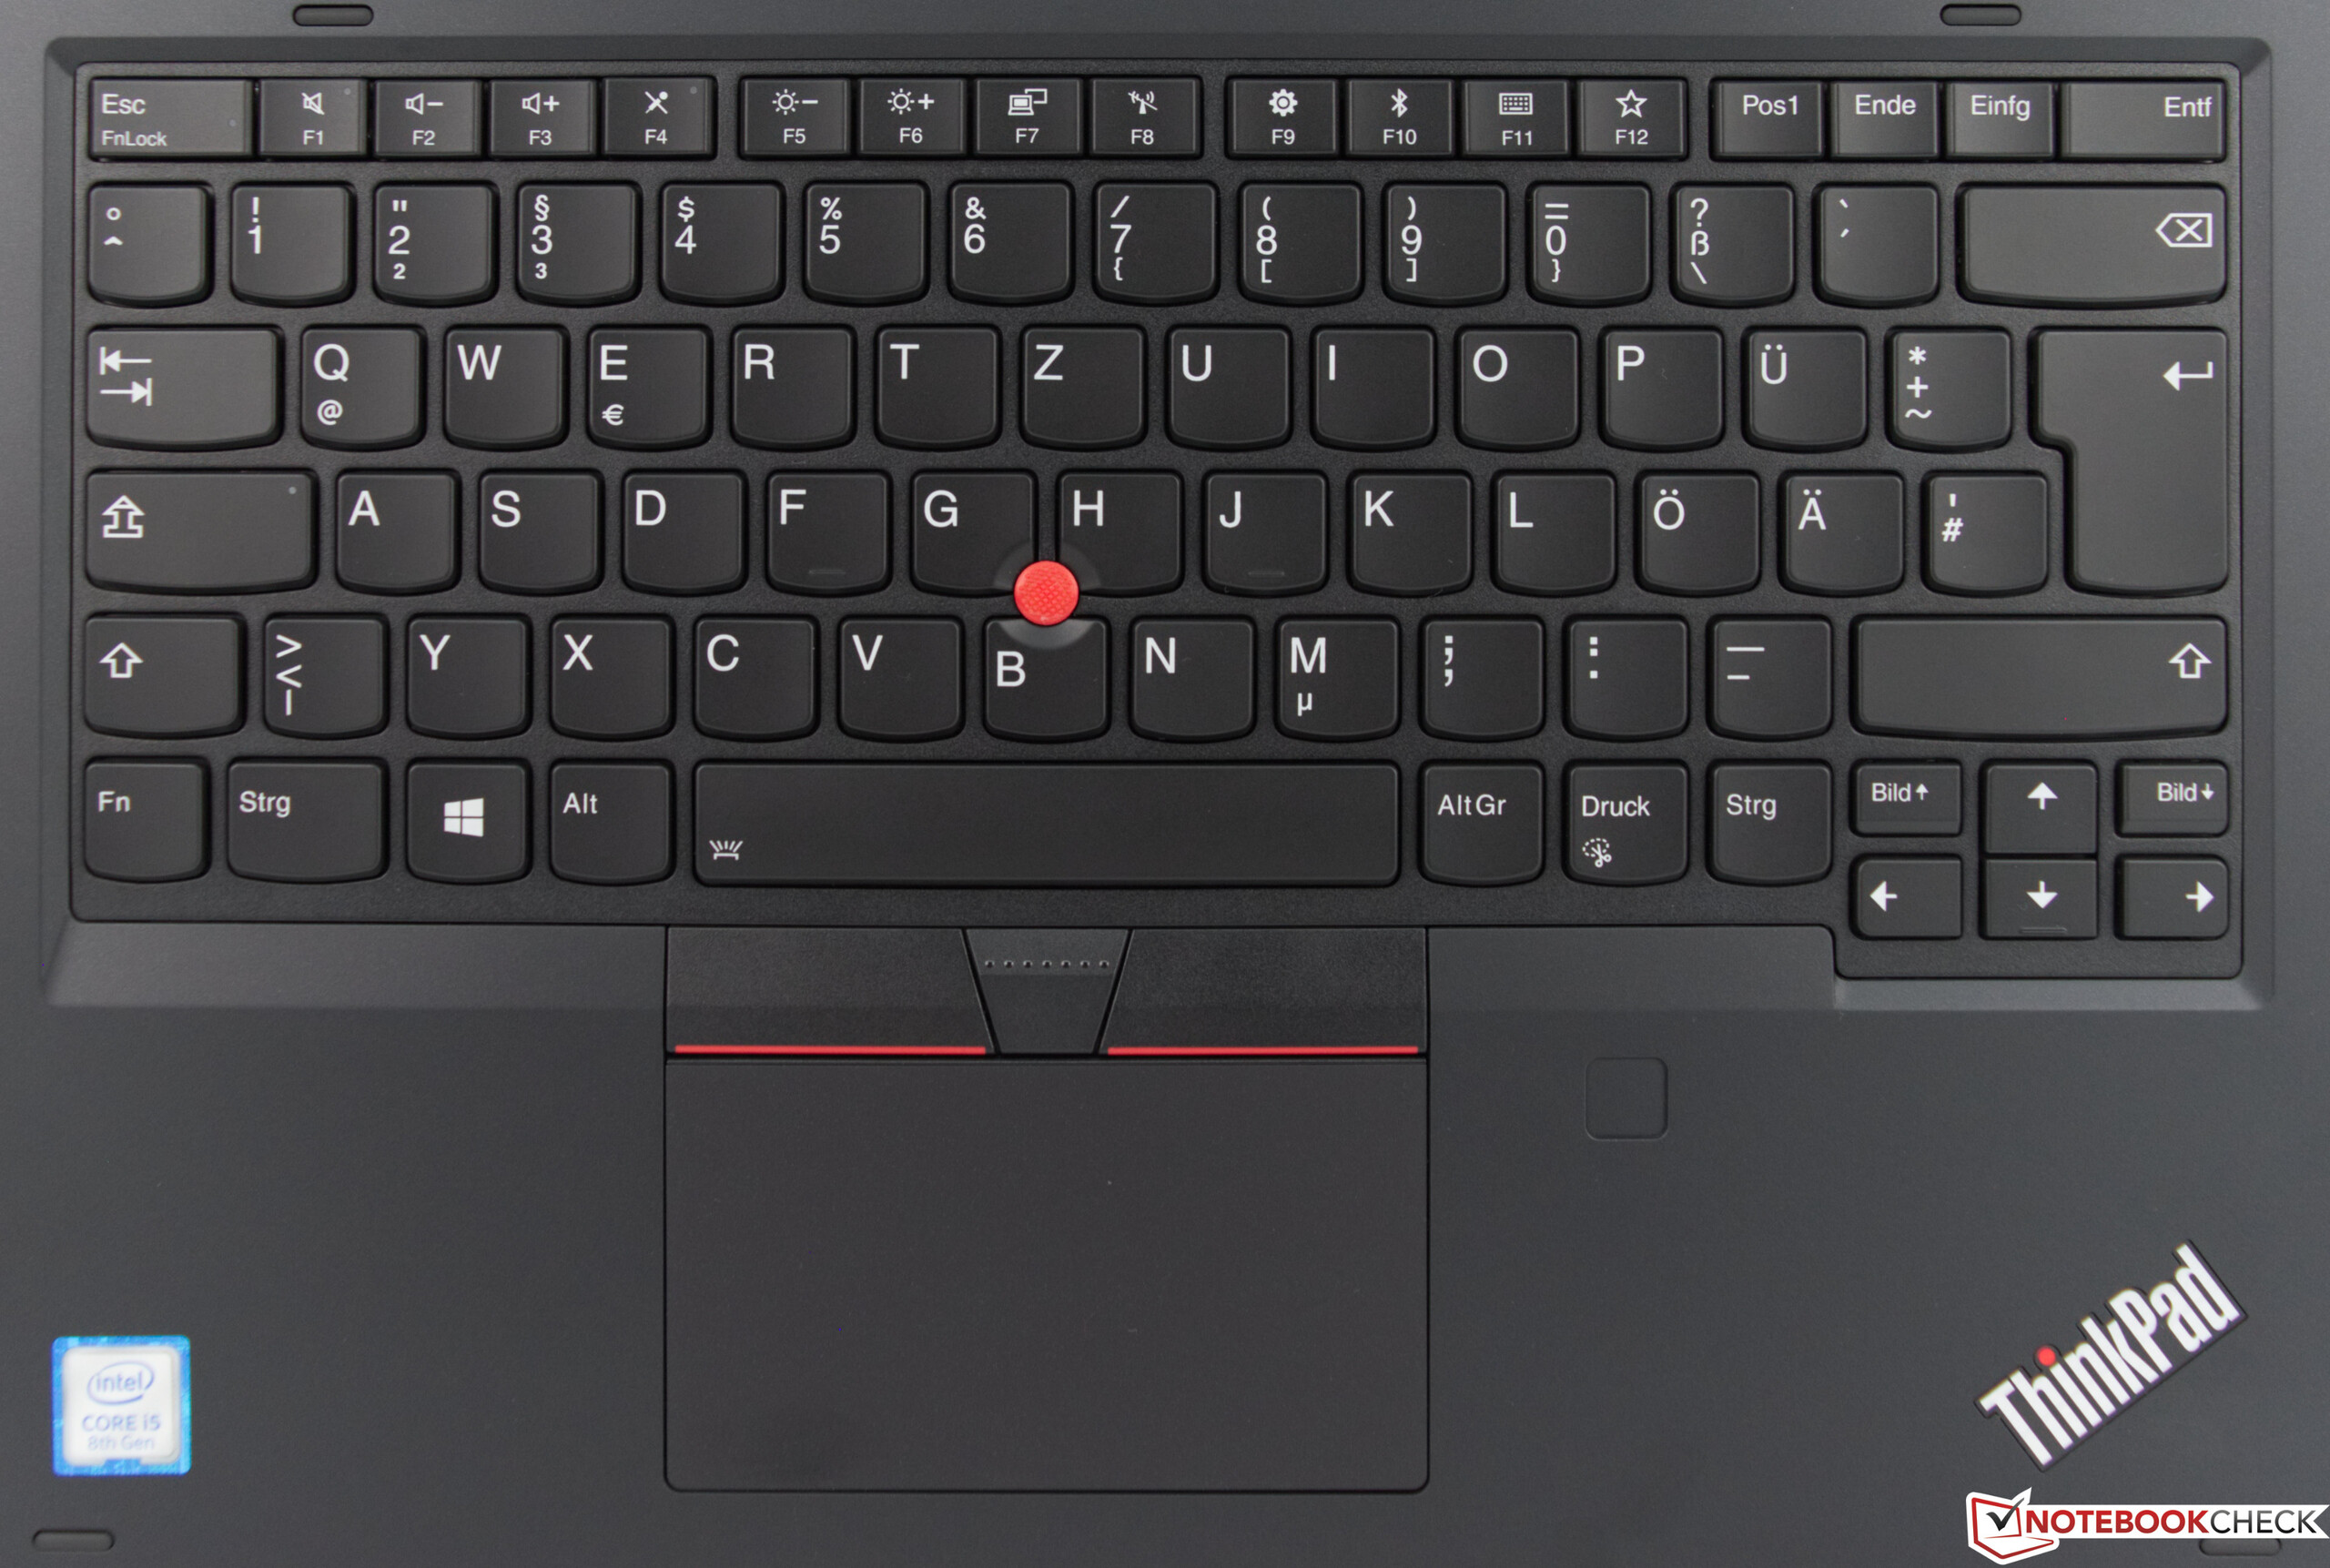
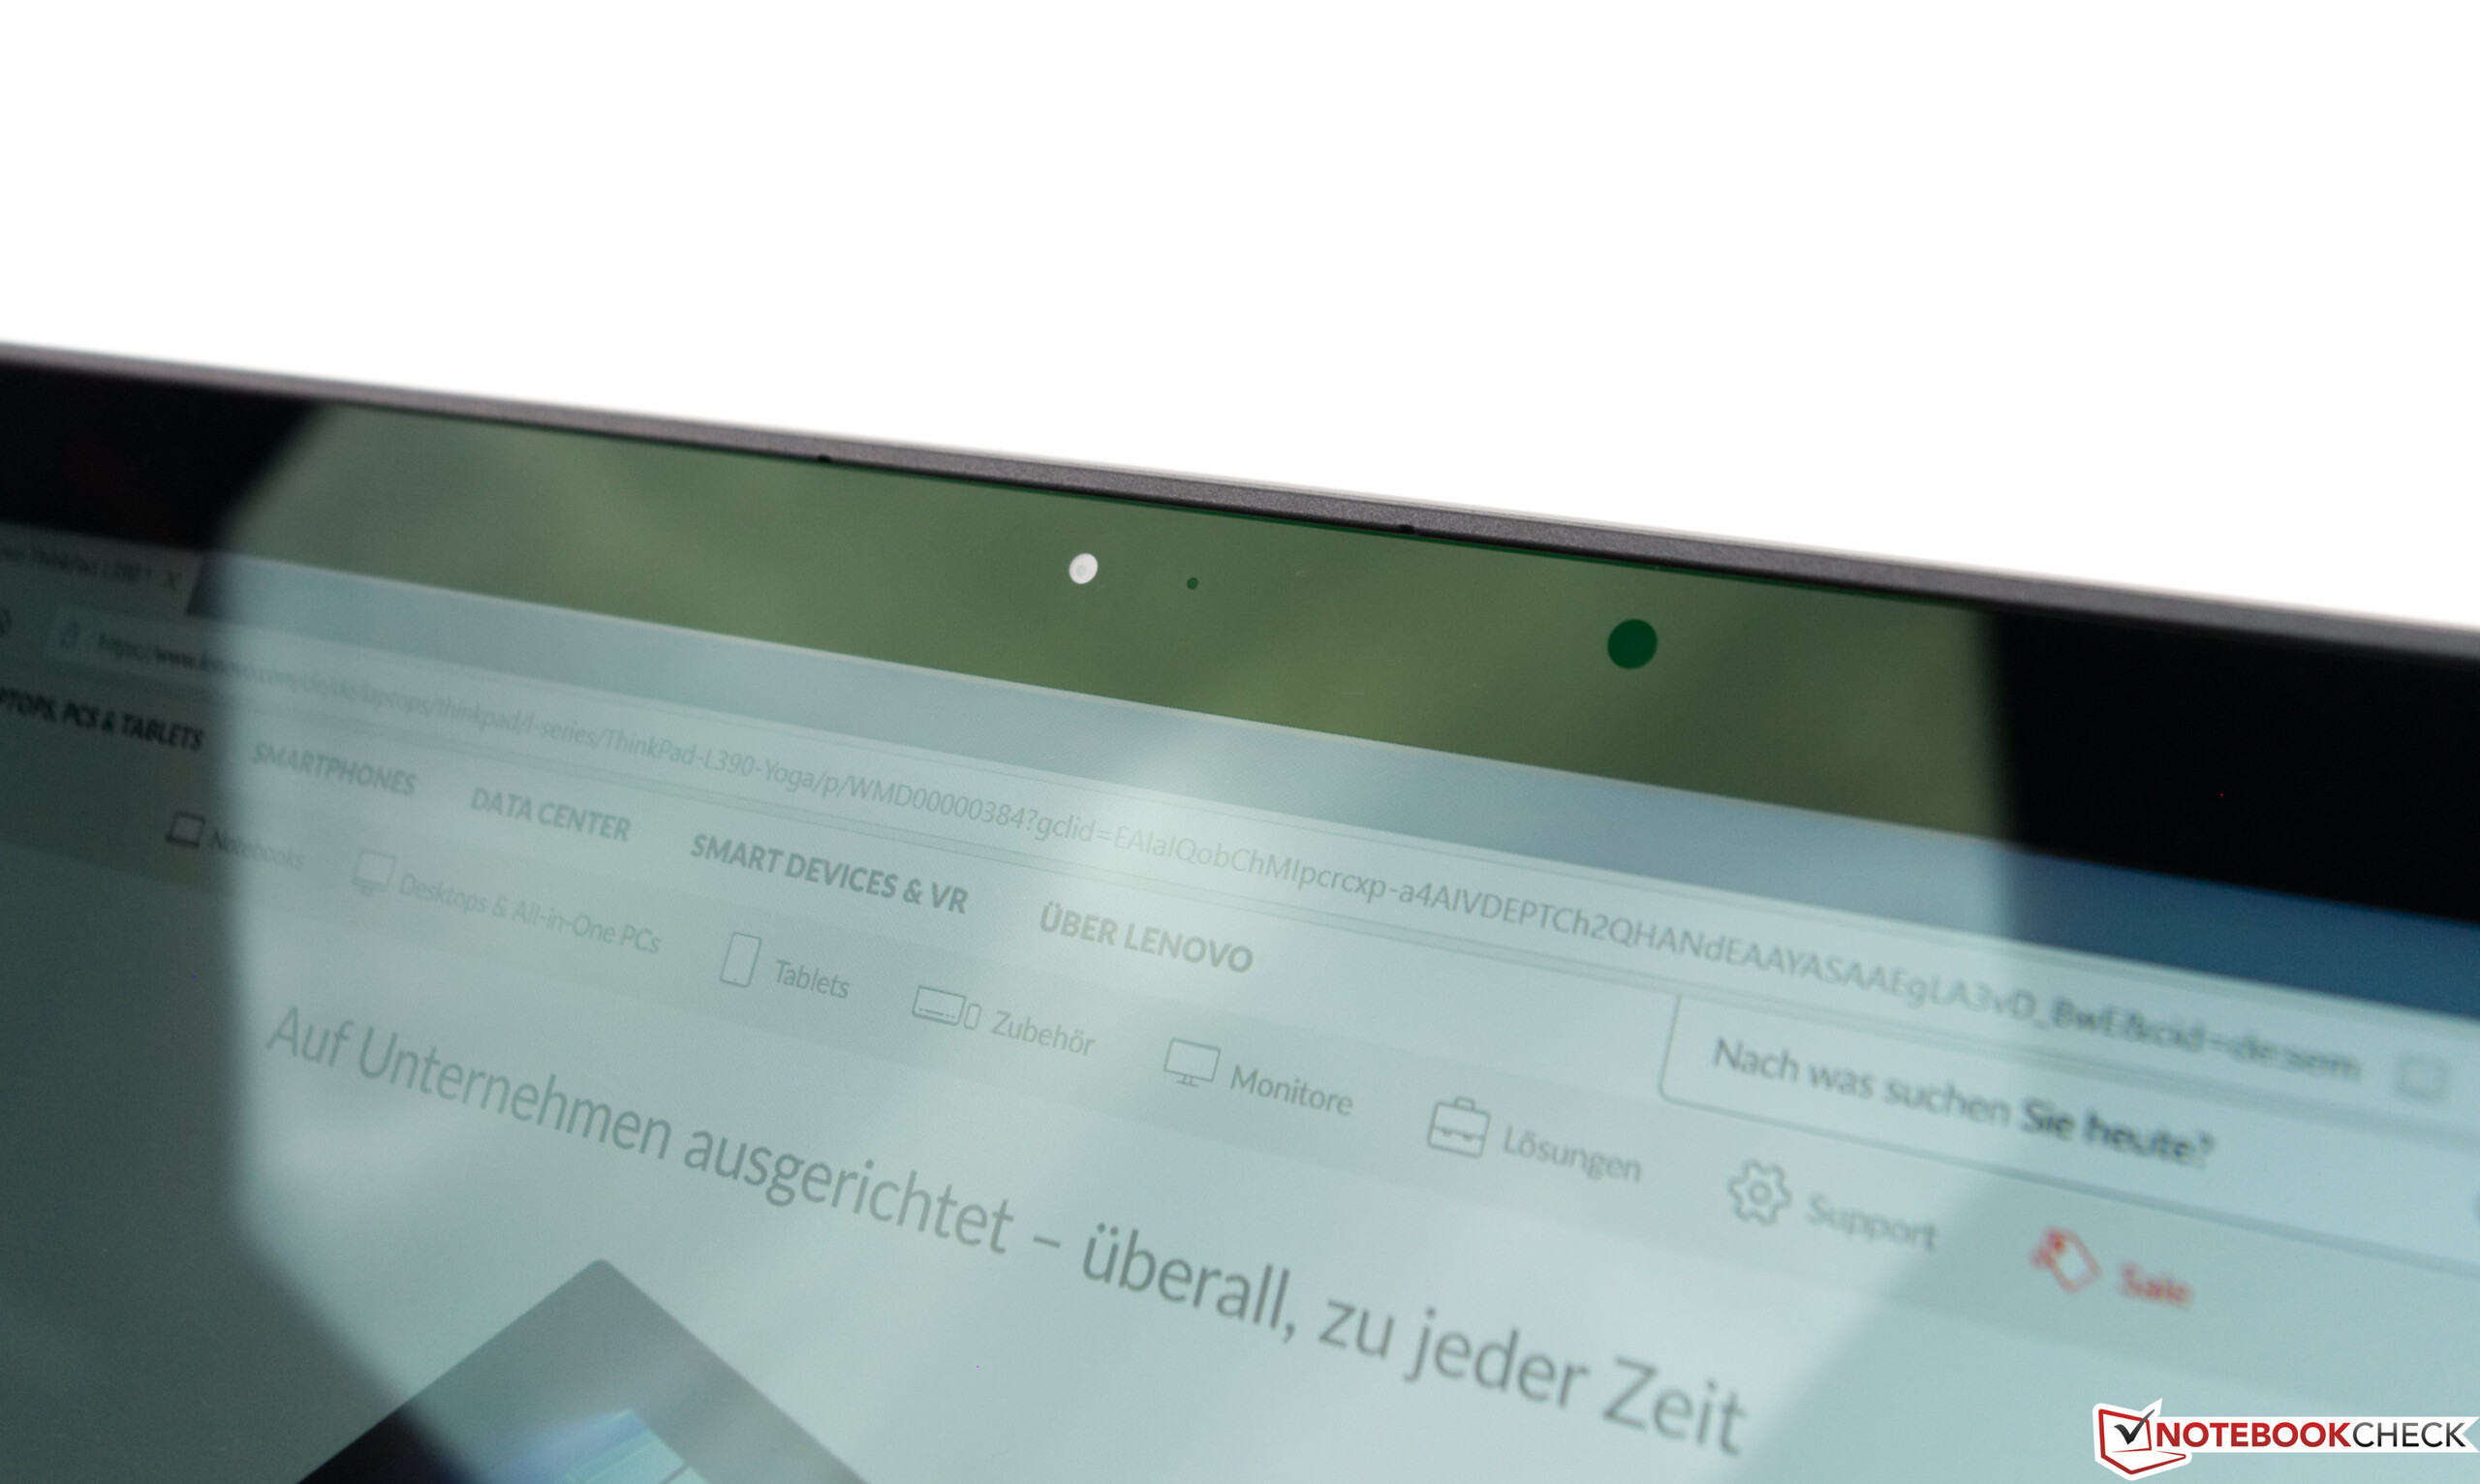
联想ThinkPad L390 Yoga是一款价格合理,制作精良的13英寸翻转本。联想并没有放弃让我们对其他ThinkPad留下深刻印象的东西以降低成本。ThinkPad使用玻璃纤维,铝和镁来制造L390 Yoga,就像它更昂贵的同类一样,这使得L390 Yoga看起来更加优质并且感觉坚固。它的宽屏幕边框使其看起来过时,但这仍然也是其他ThinkPad的特点。键盘提供了我们在其他ThinkPad上所喜爱的同样出色的打字体验,但是联想省略了它在更昂贵的翻转本上使用的升降和锁定机制,这有些遗憾。
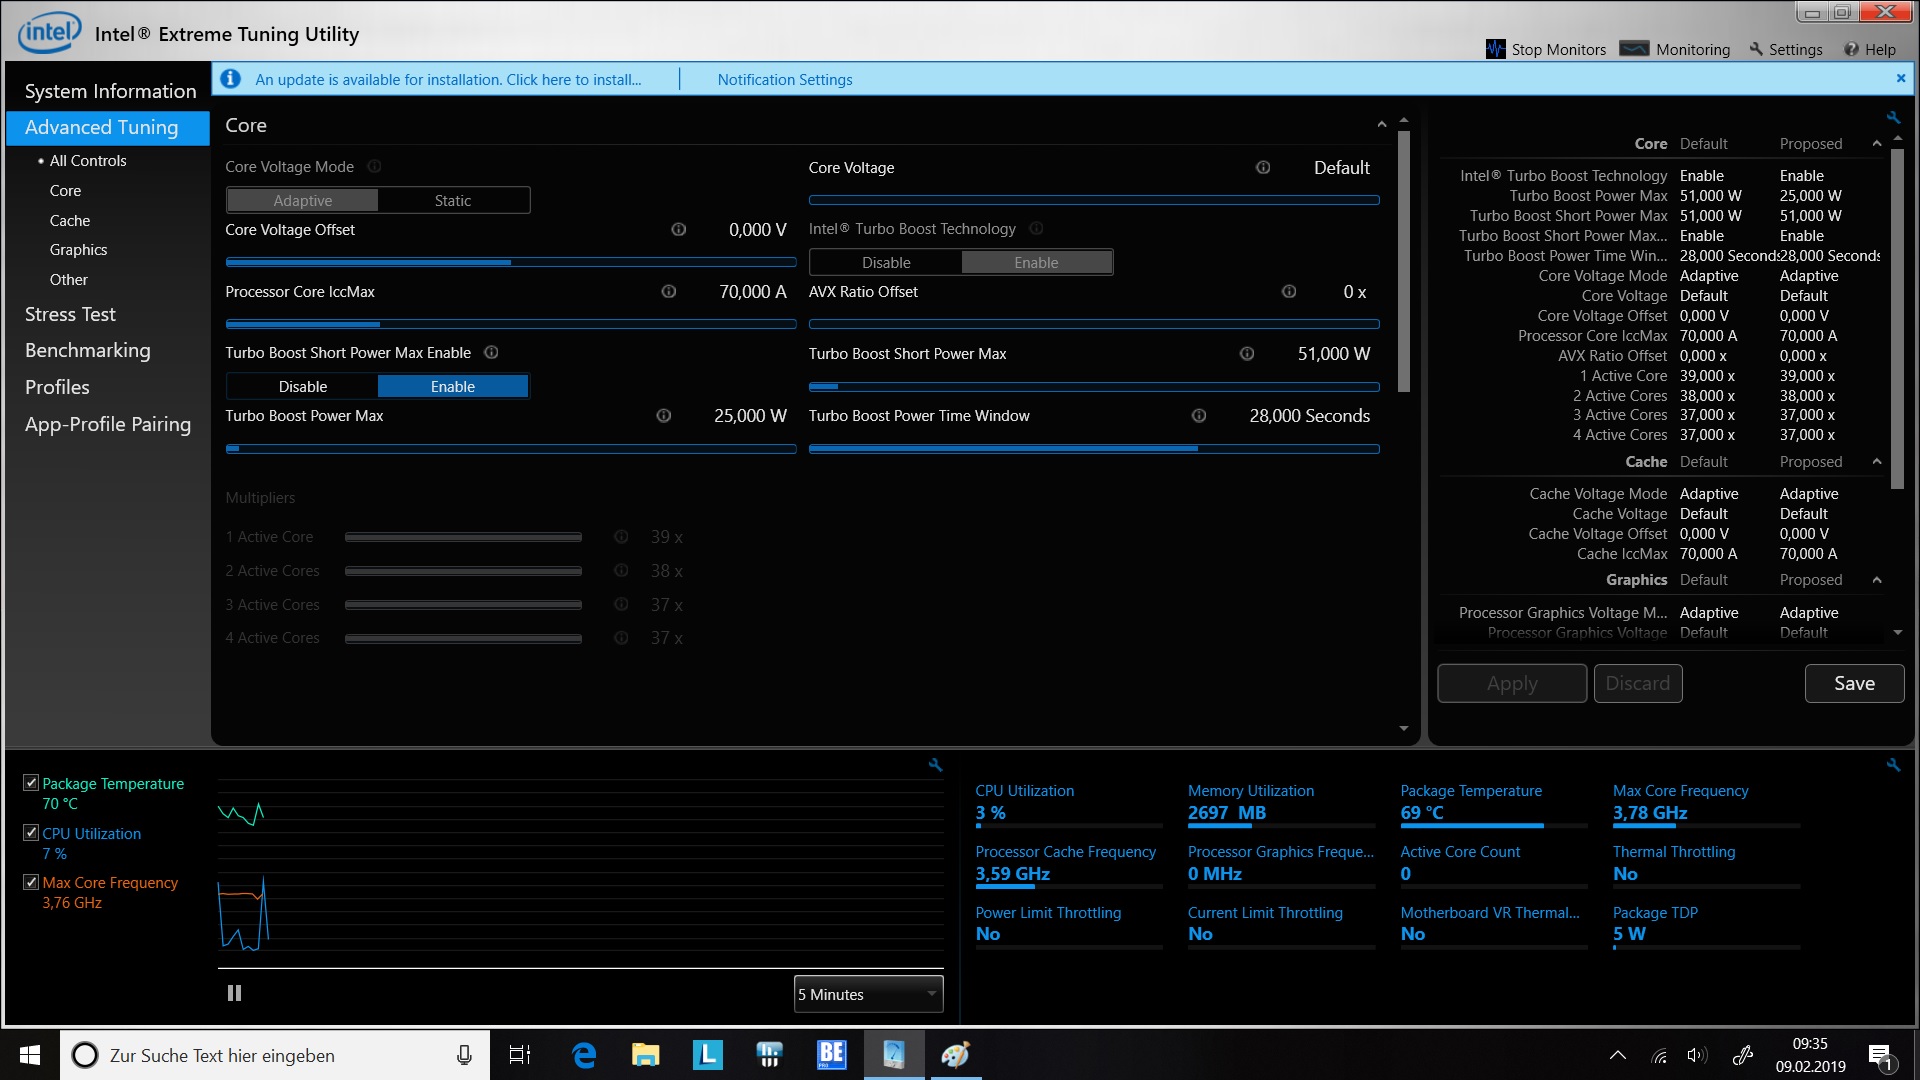
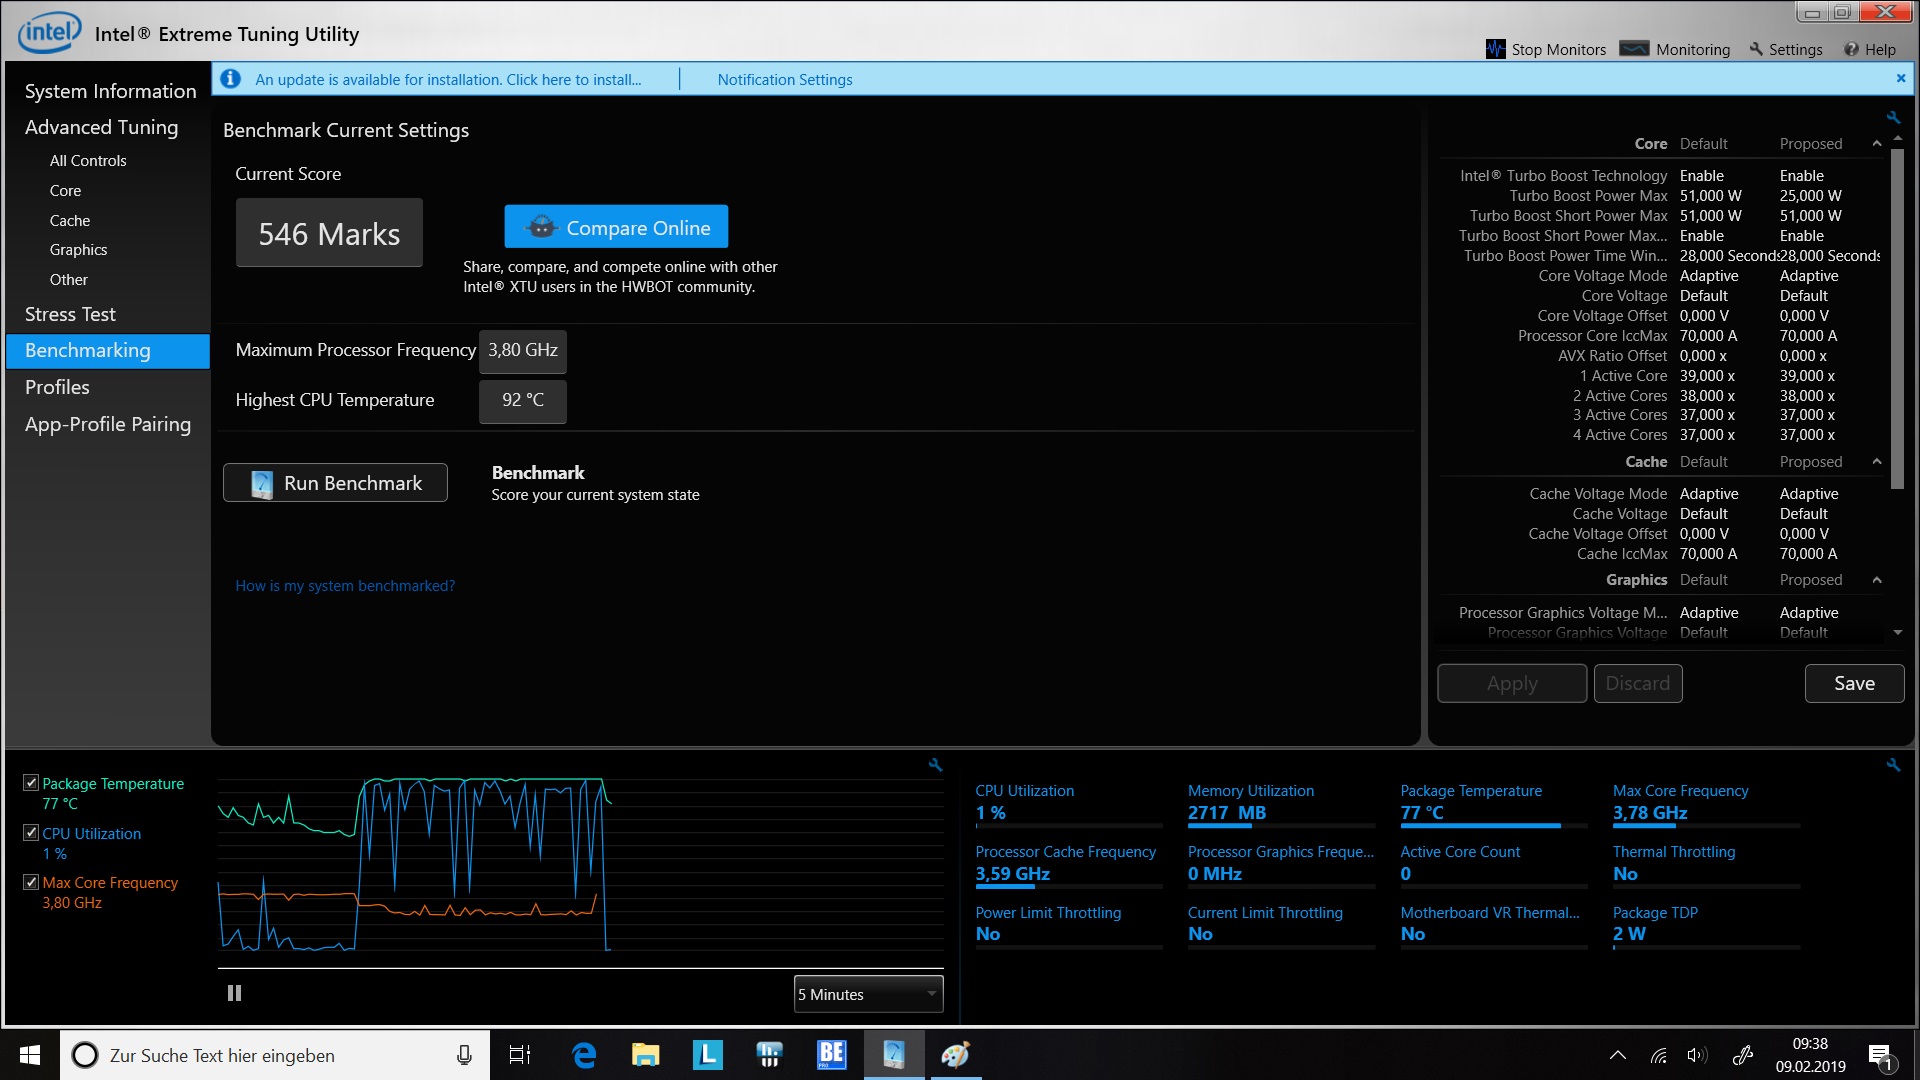
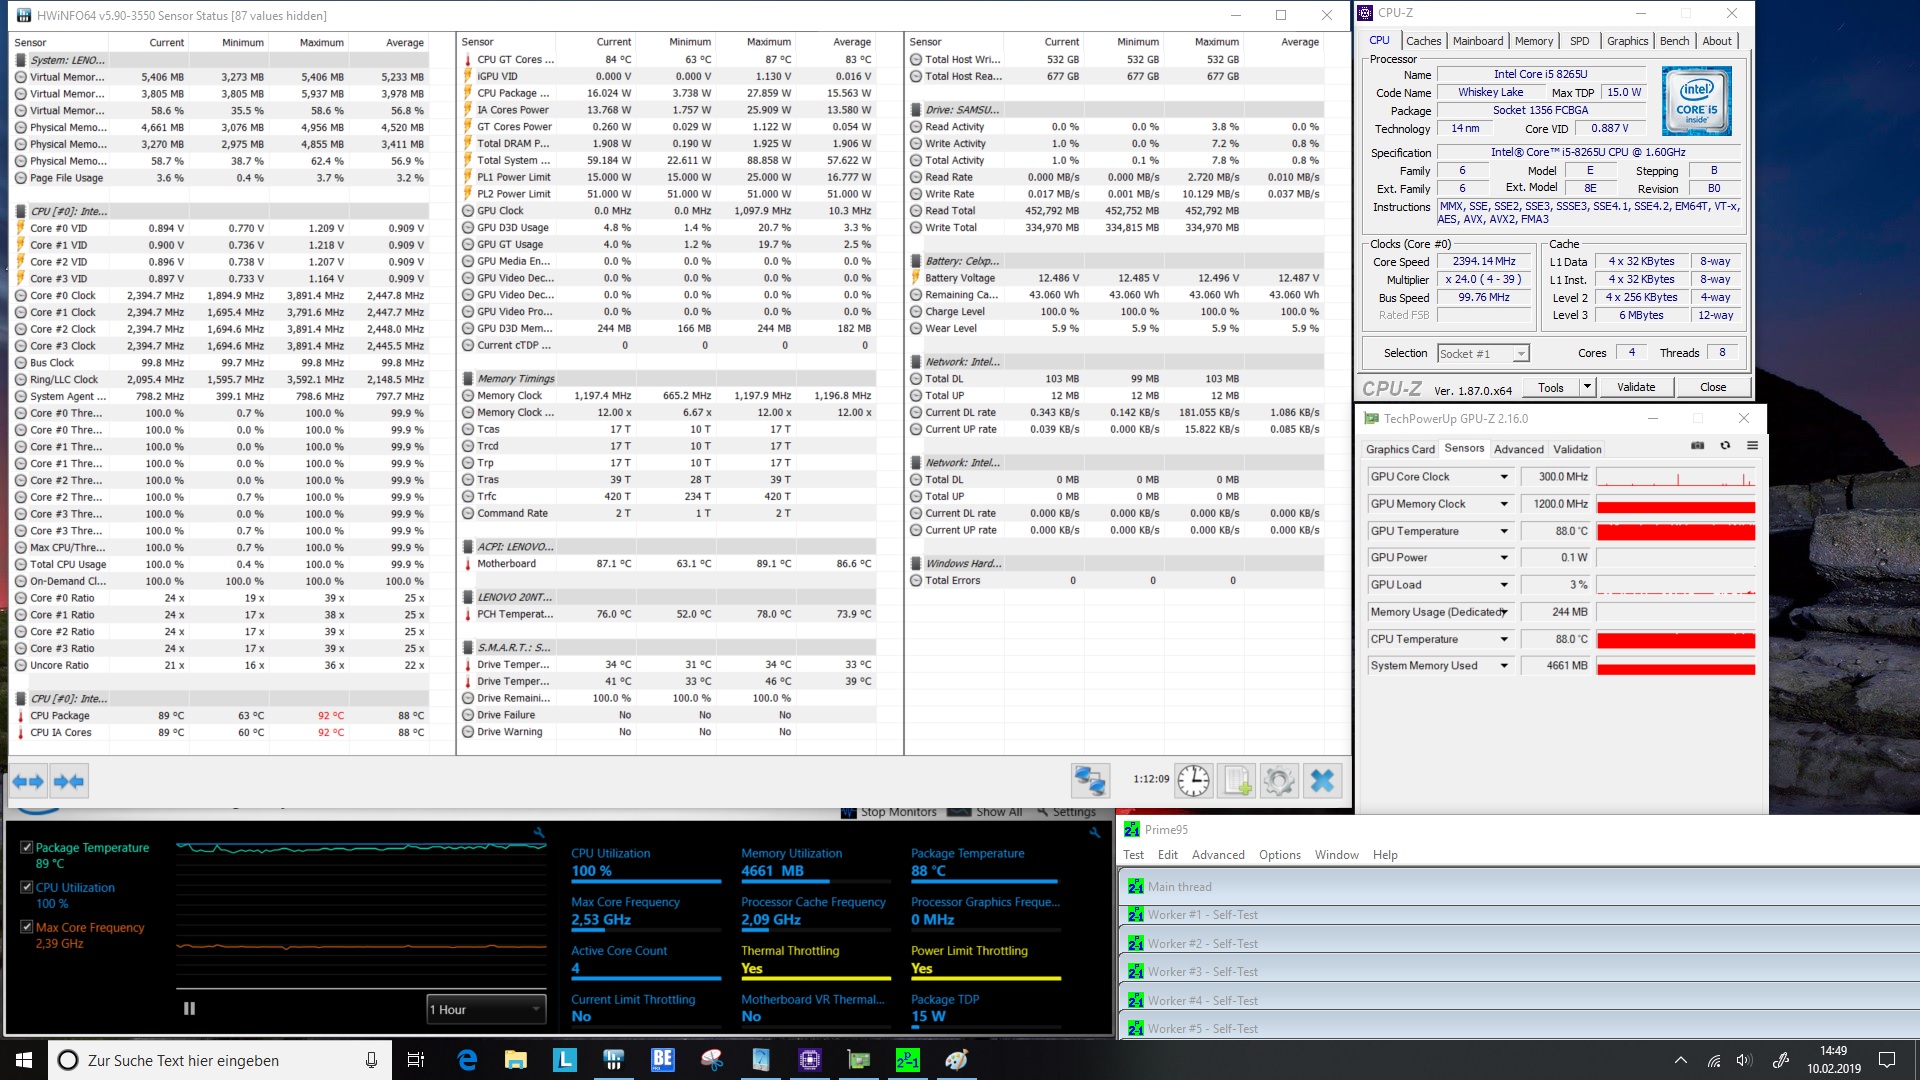
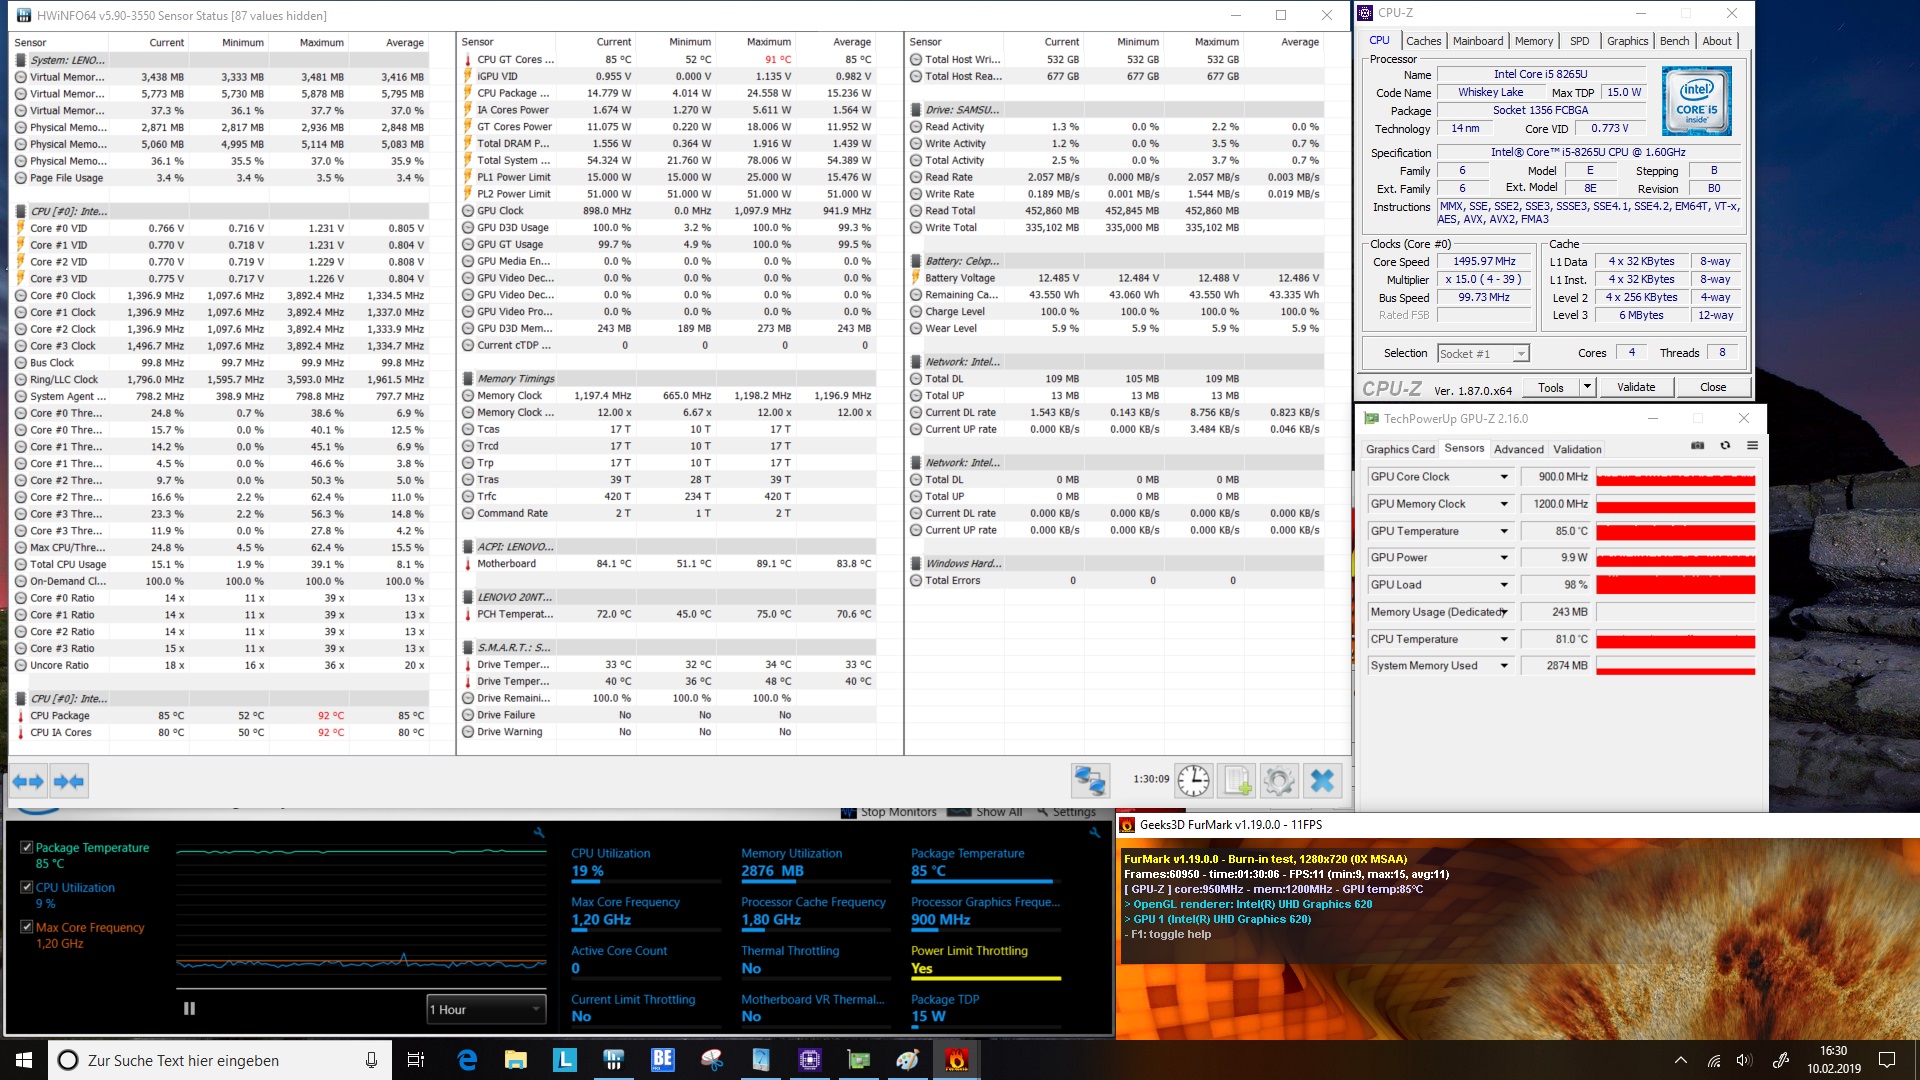
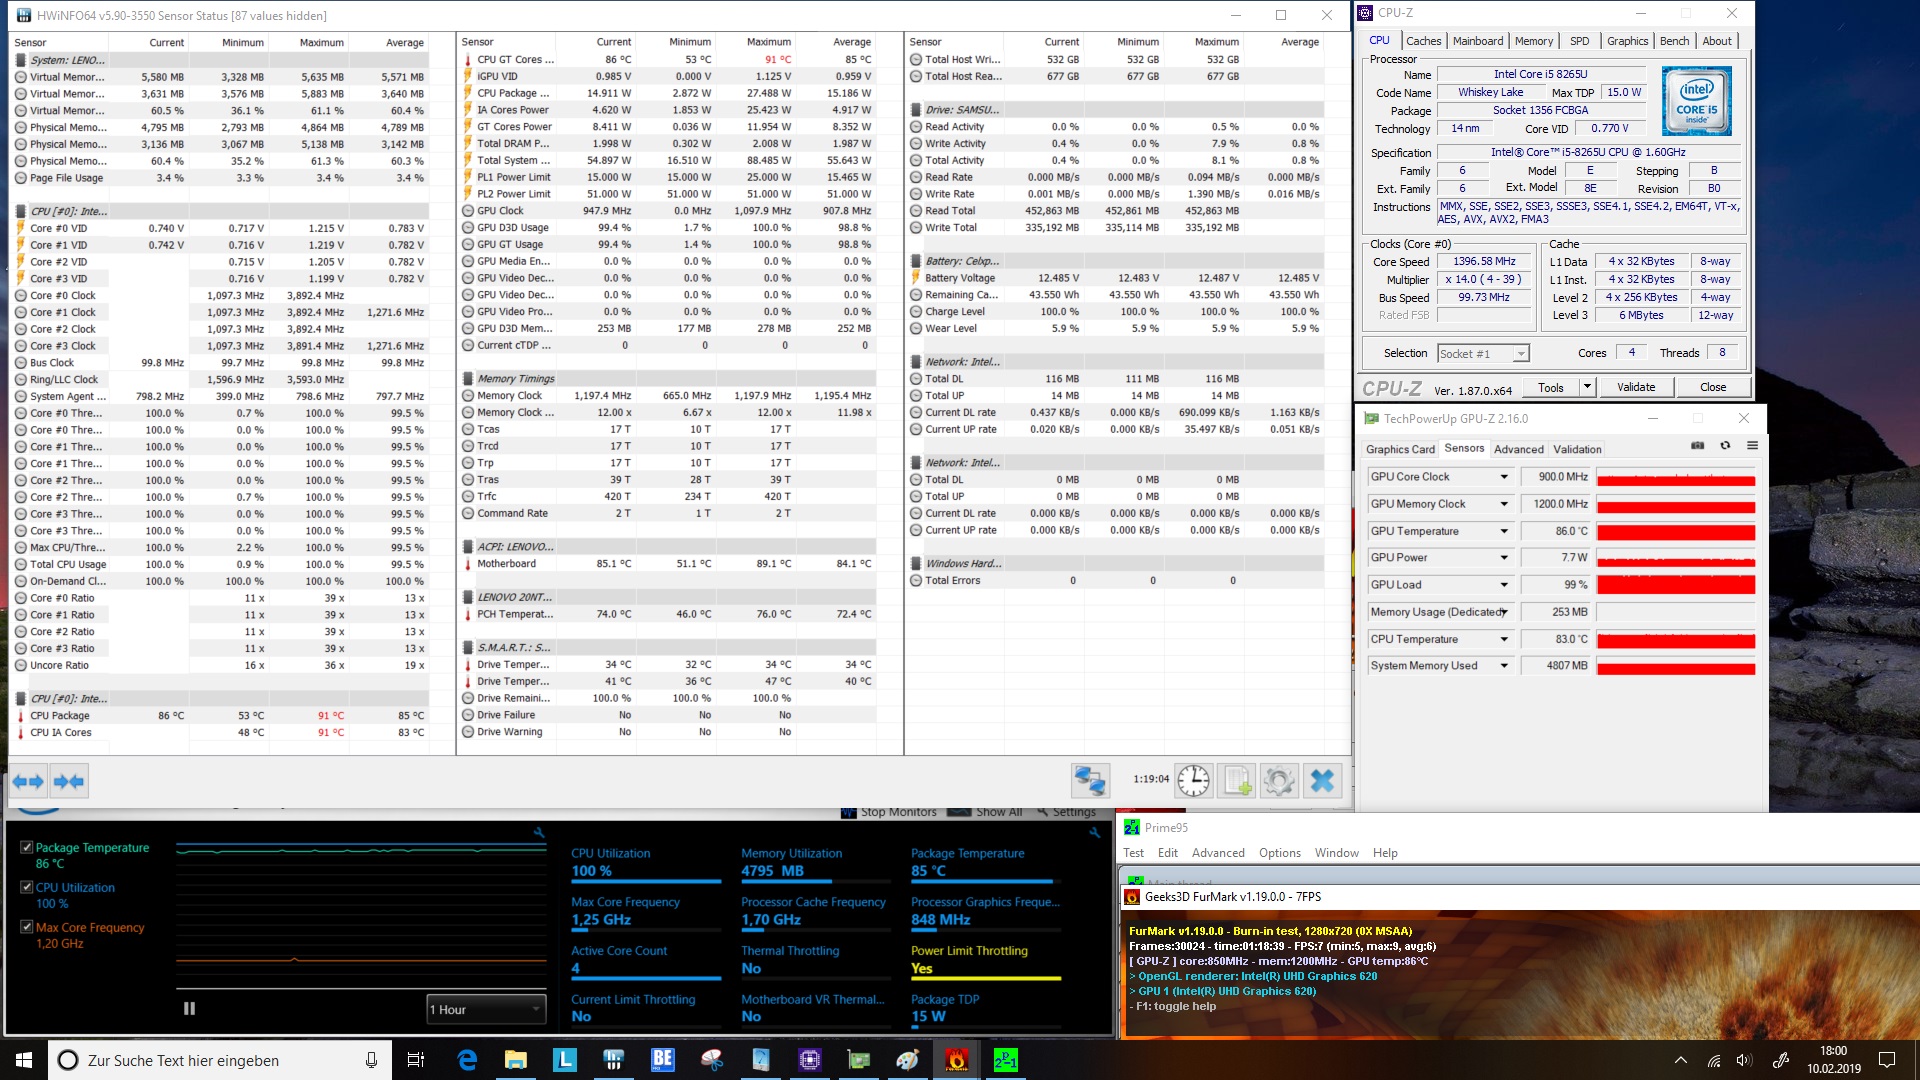
与L380 Yoga相比,Whiskey Lake处理器的升级也带来了性能的适度提升,但散热系统在持续负载下很快就会不堪重负,这会导致暂时的降频。因此,我们不确定i7版本在我们的测试中的表现如何。风扇也非常安静,但它以高温作为代价。
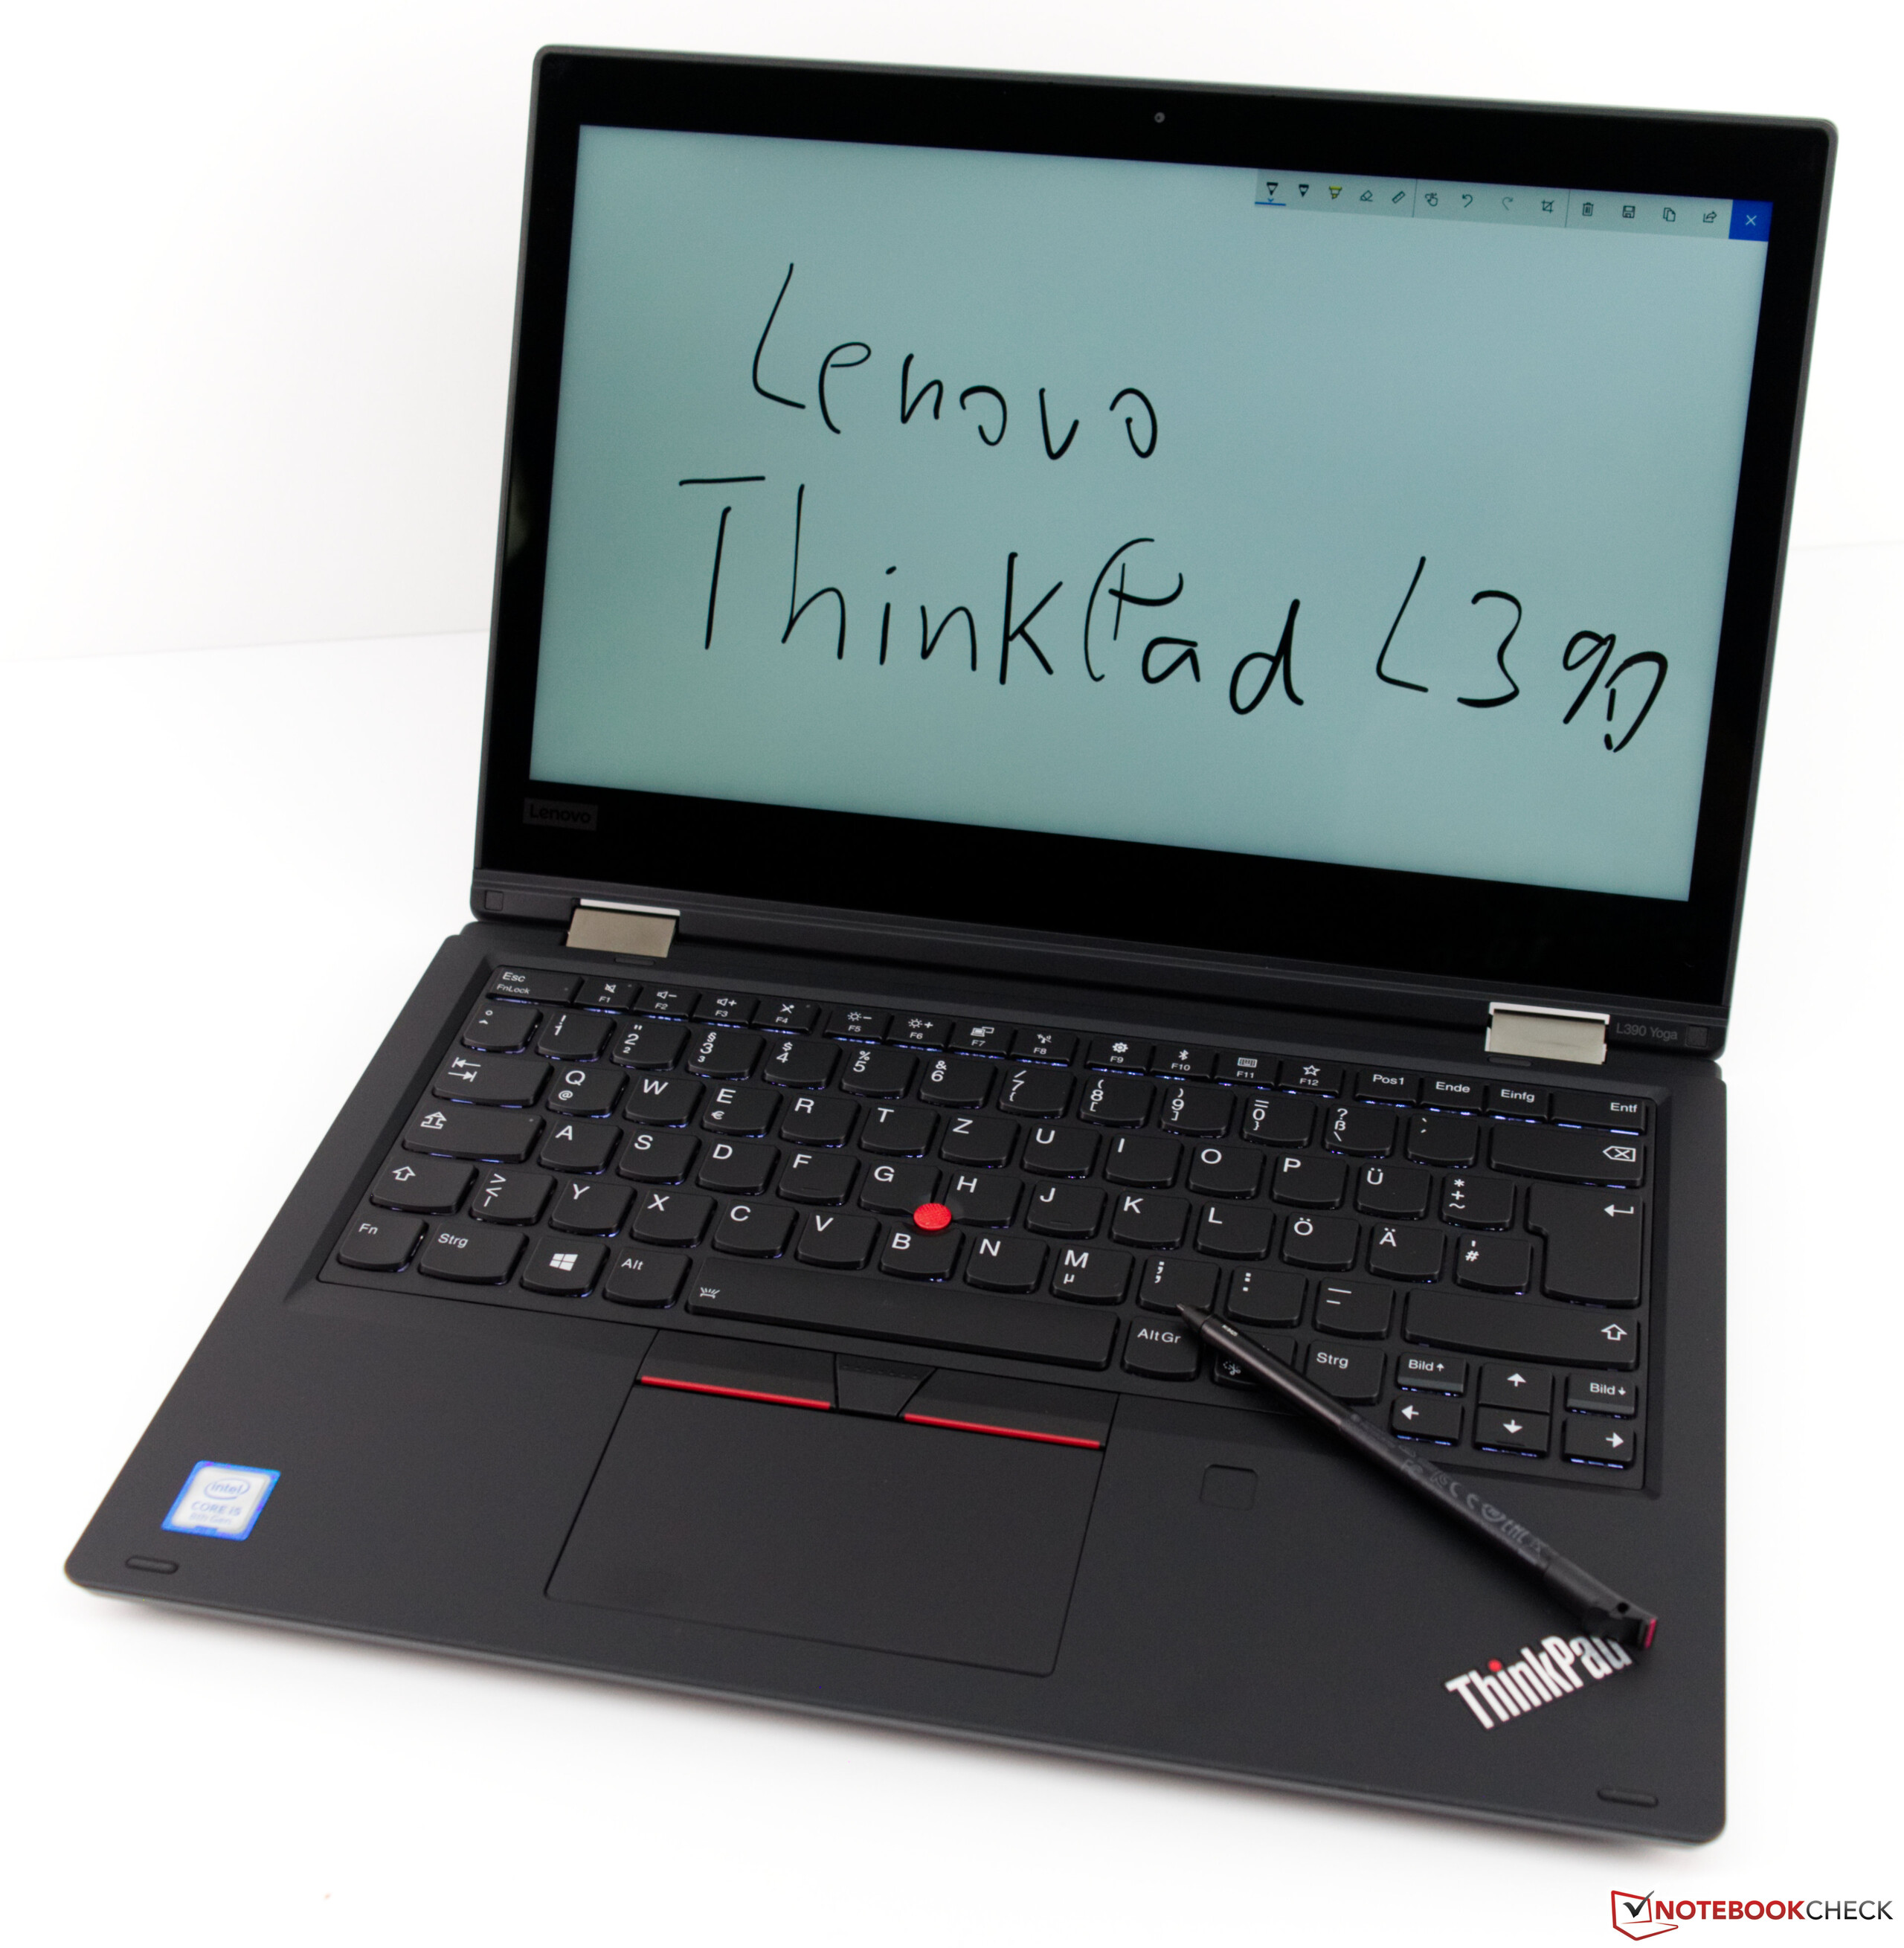
“联想ThinkPad L390 Yoga是对L380 Yoga的增量升级。Whiskey Lake处理器带来了性能上的提升,联想再次推出了廉价的翻转本ThinkPad,但它不会影响ThinkPad那令人印象深刻的工艺,输入设备和性能。”
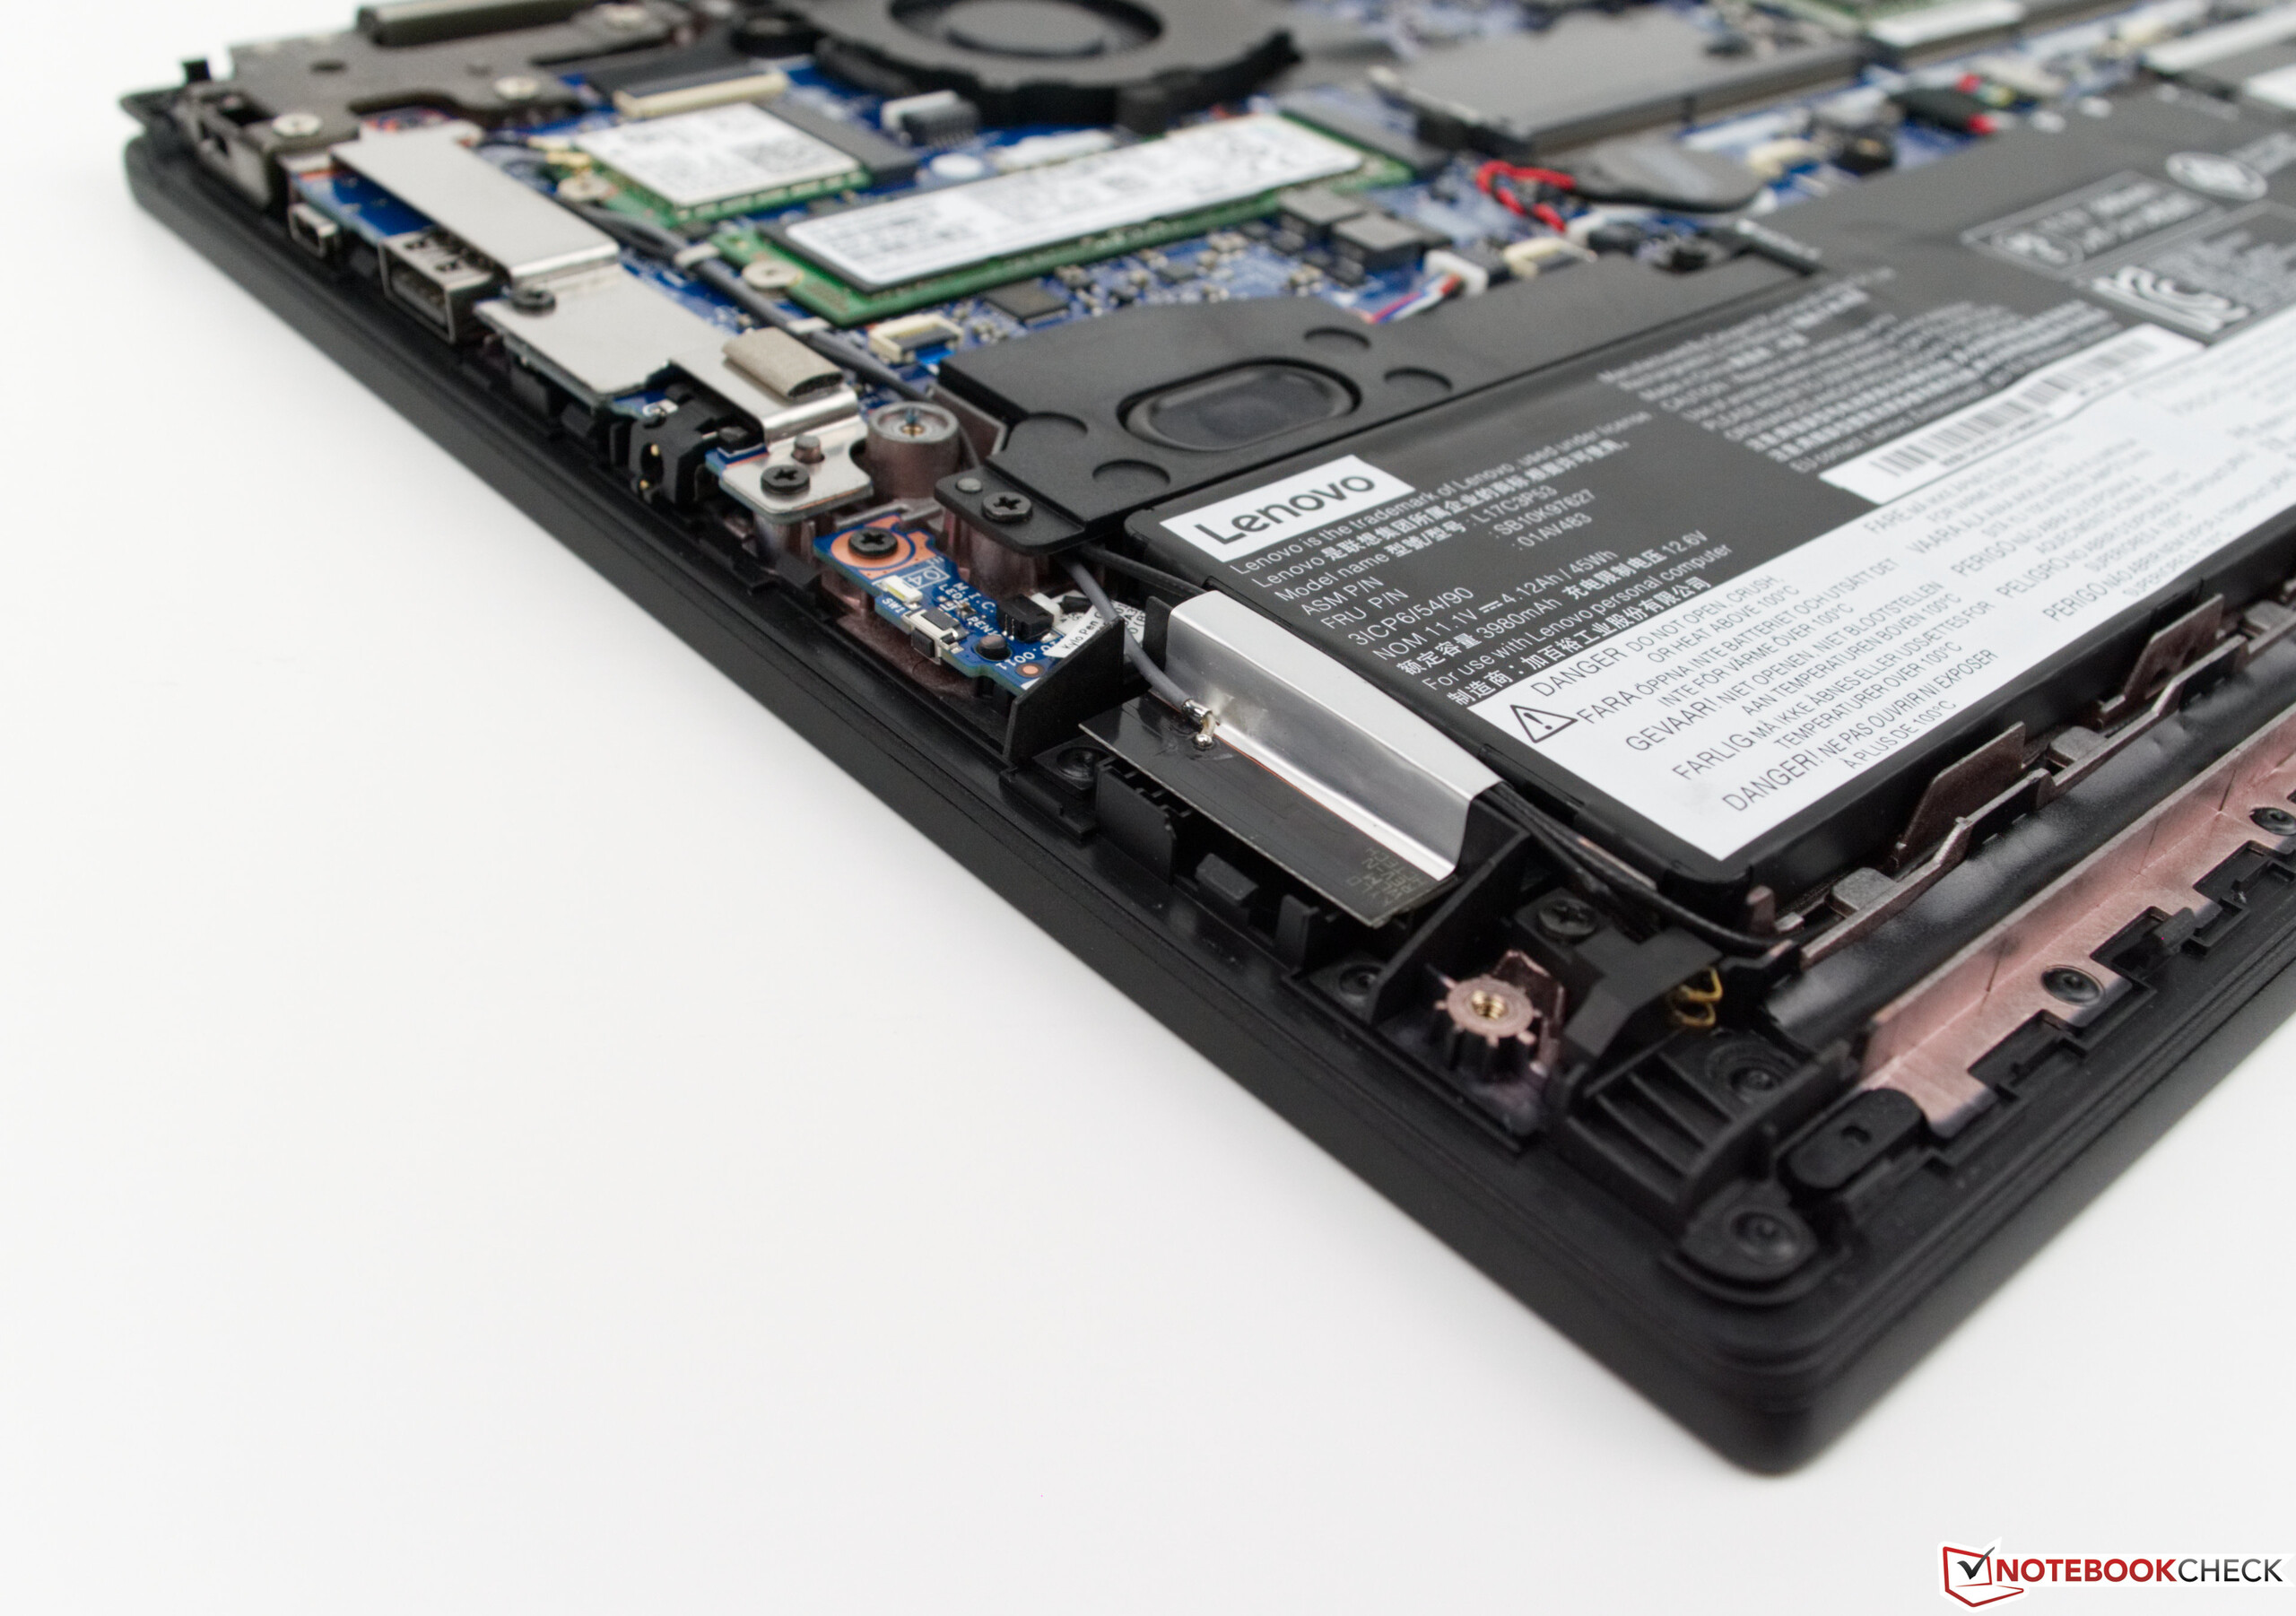
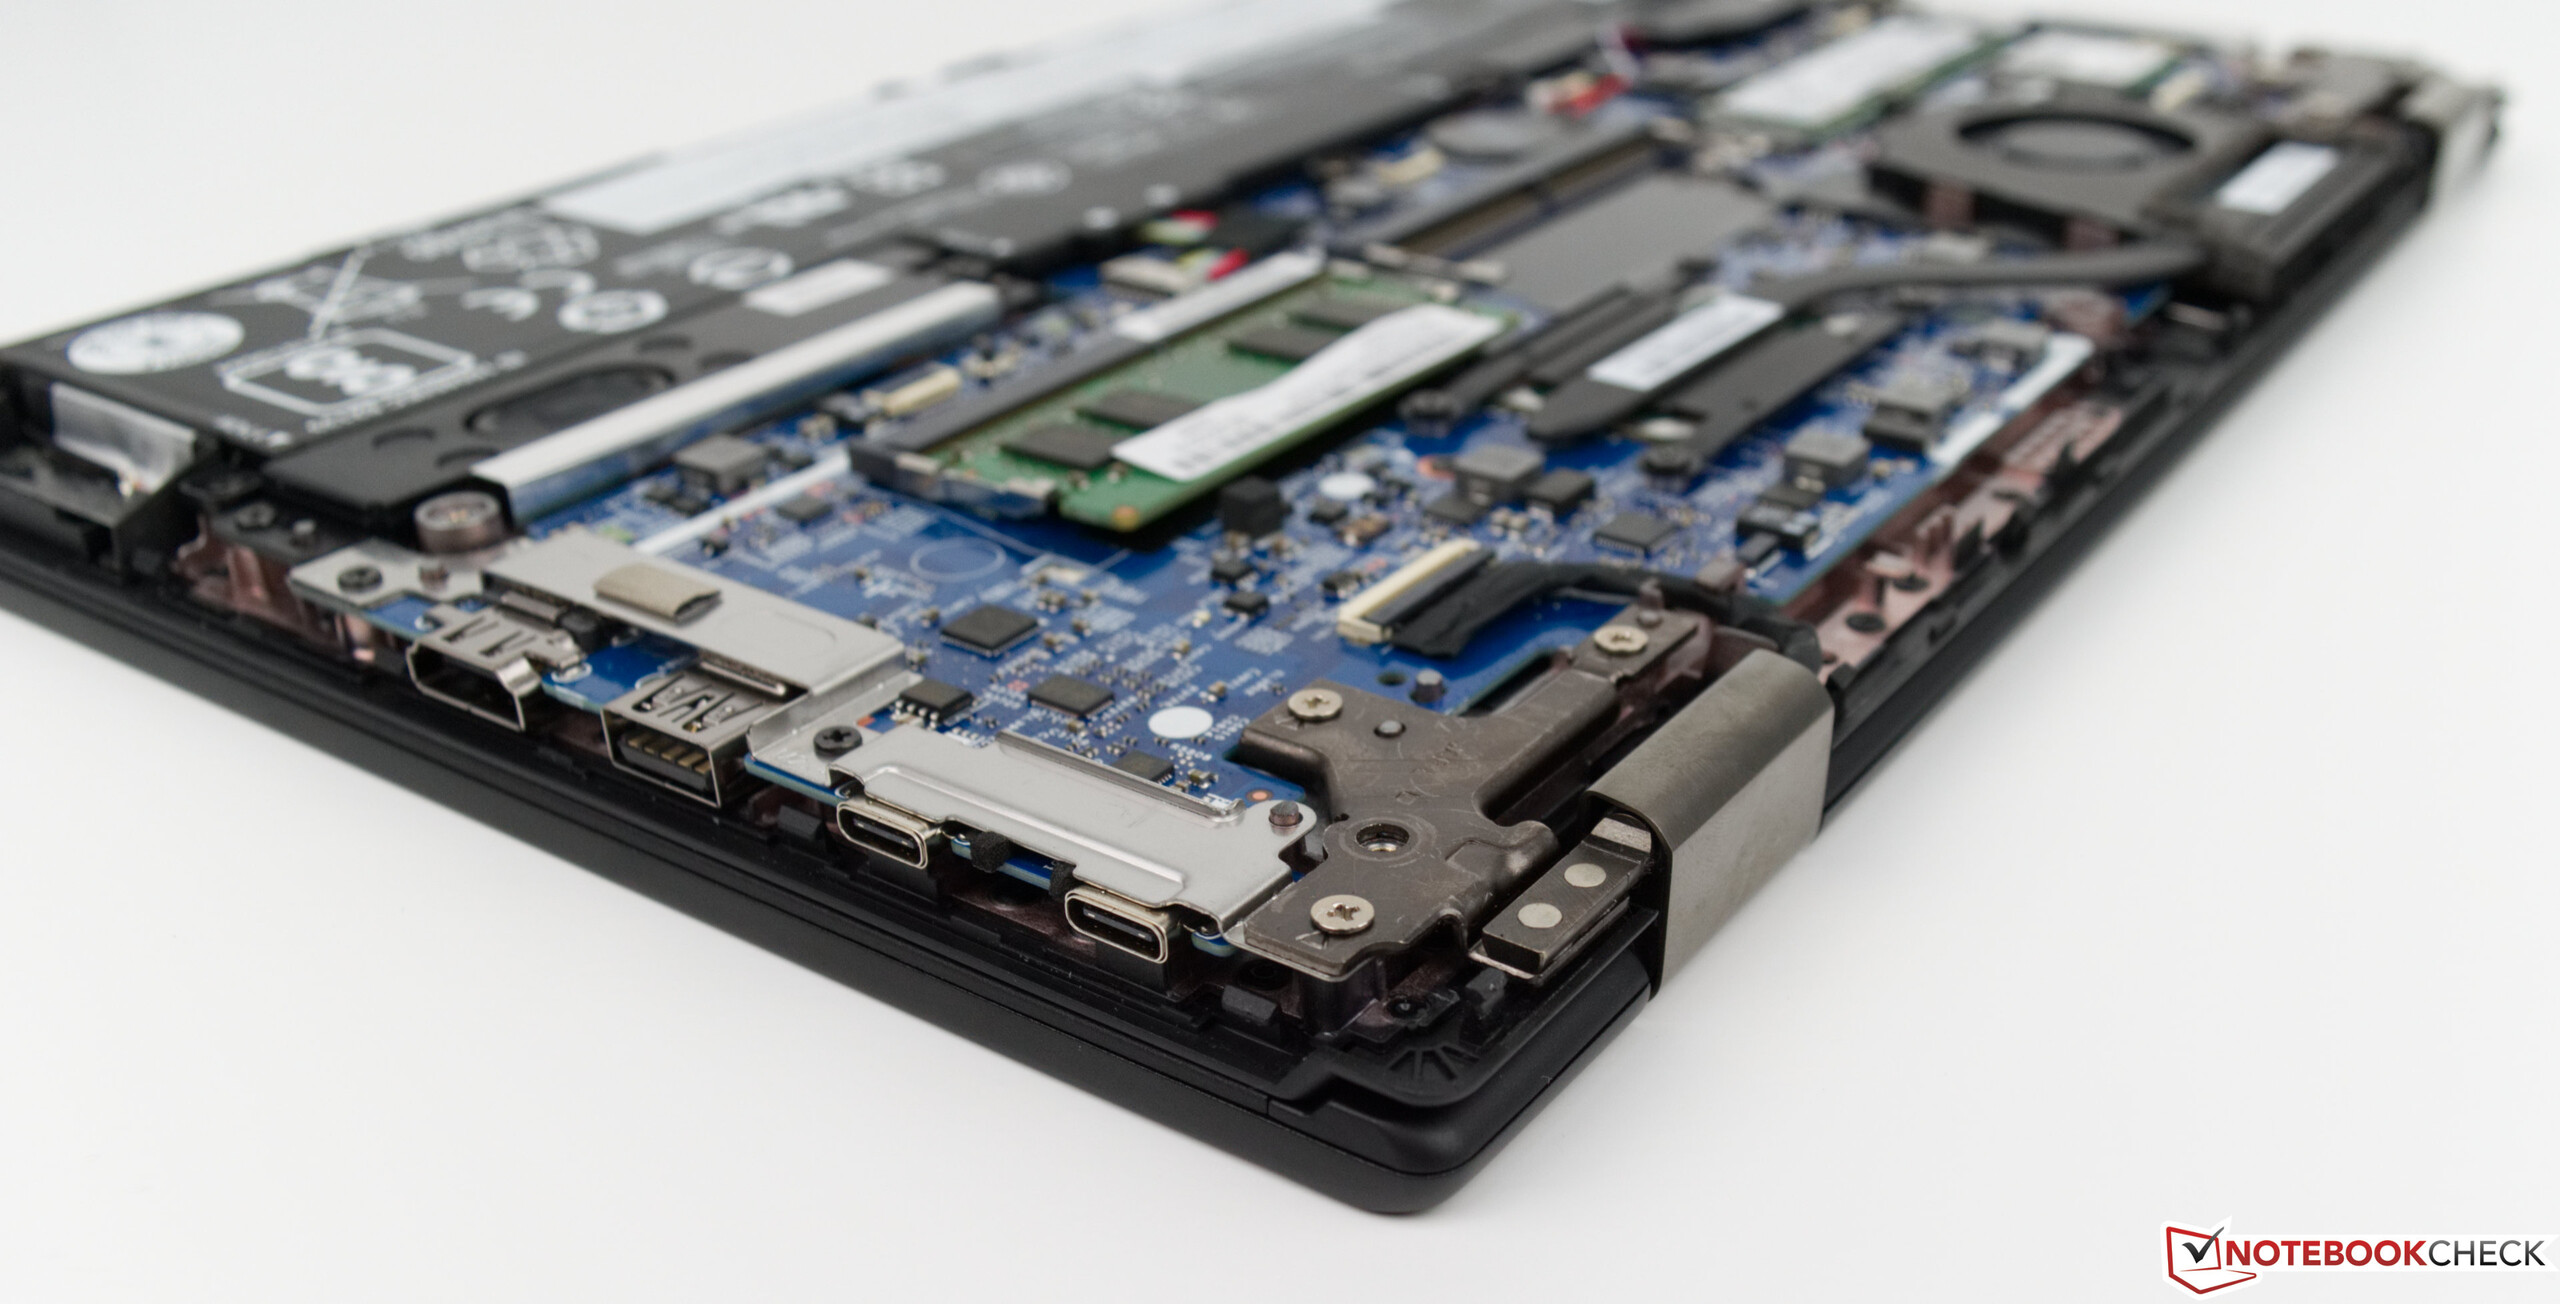
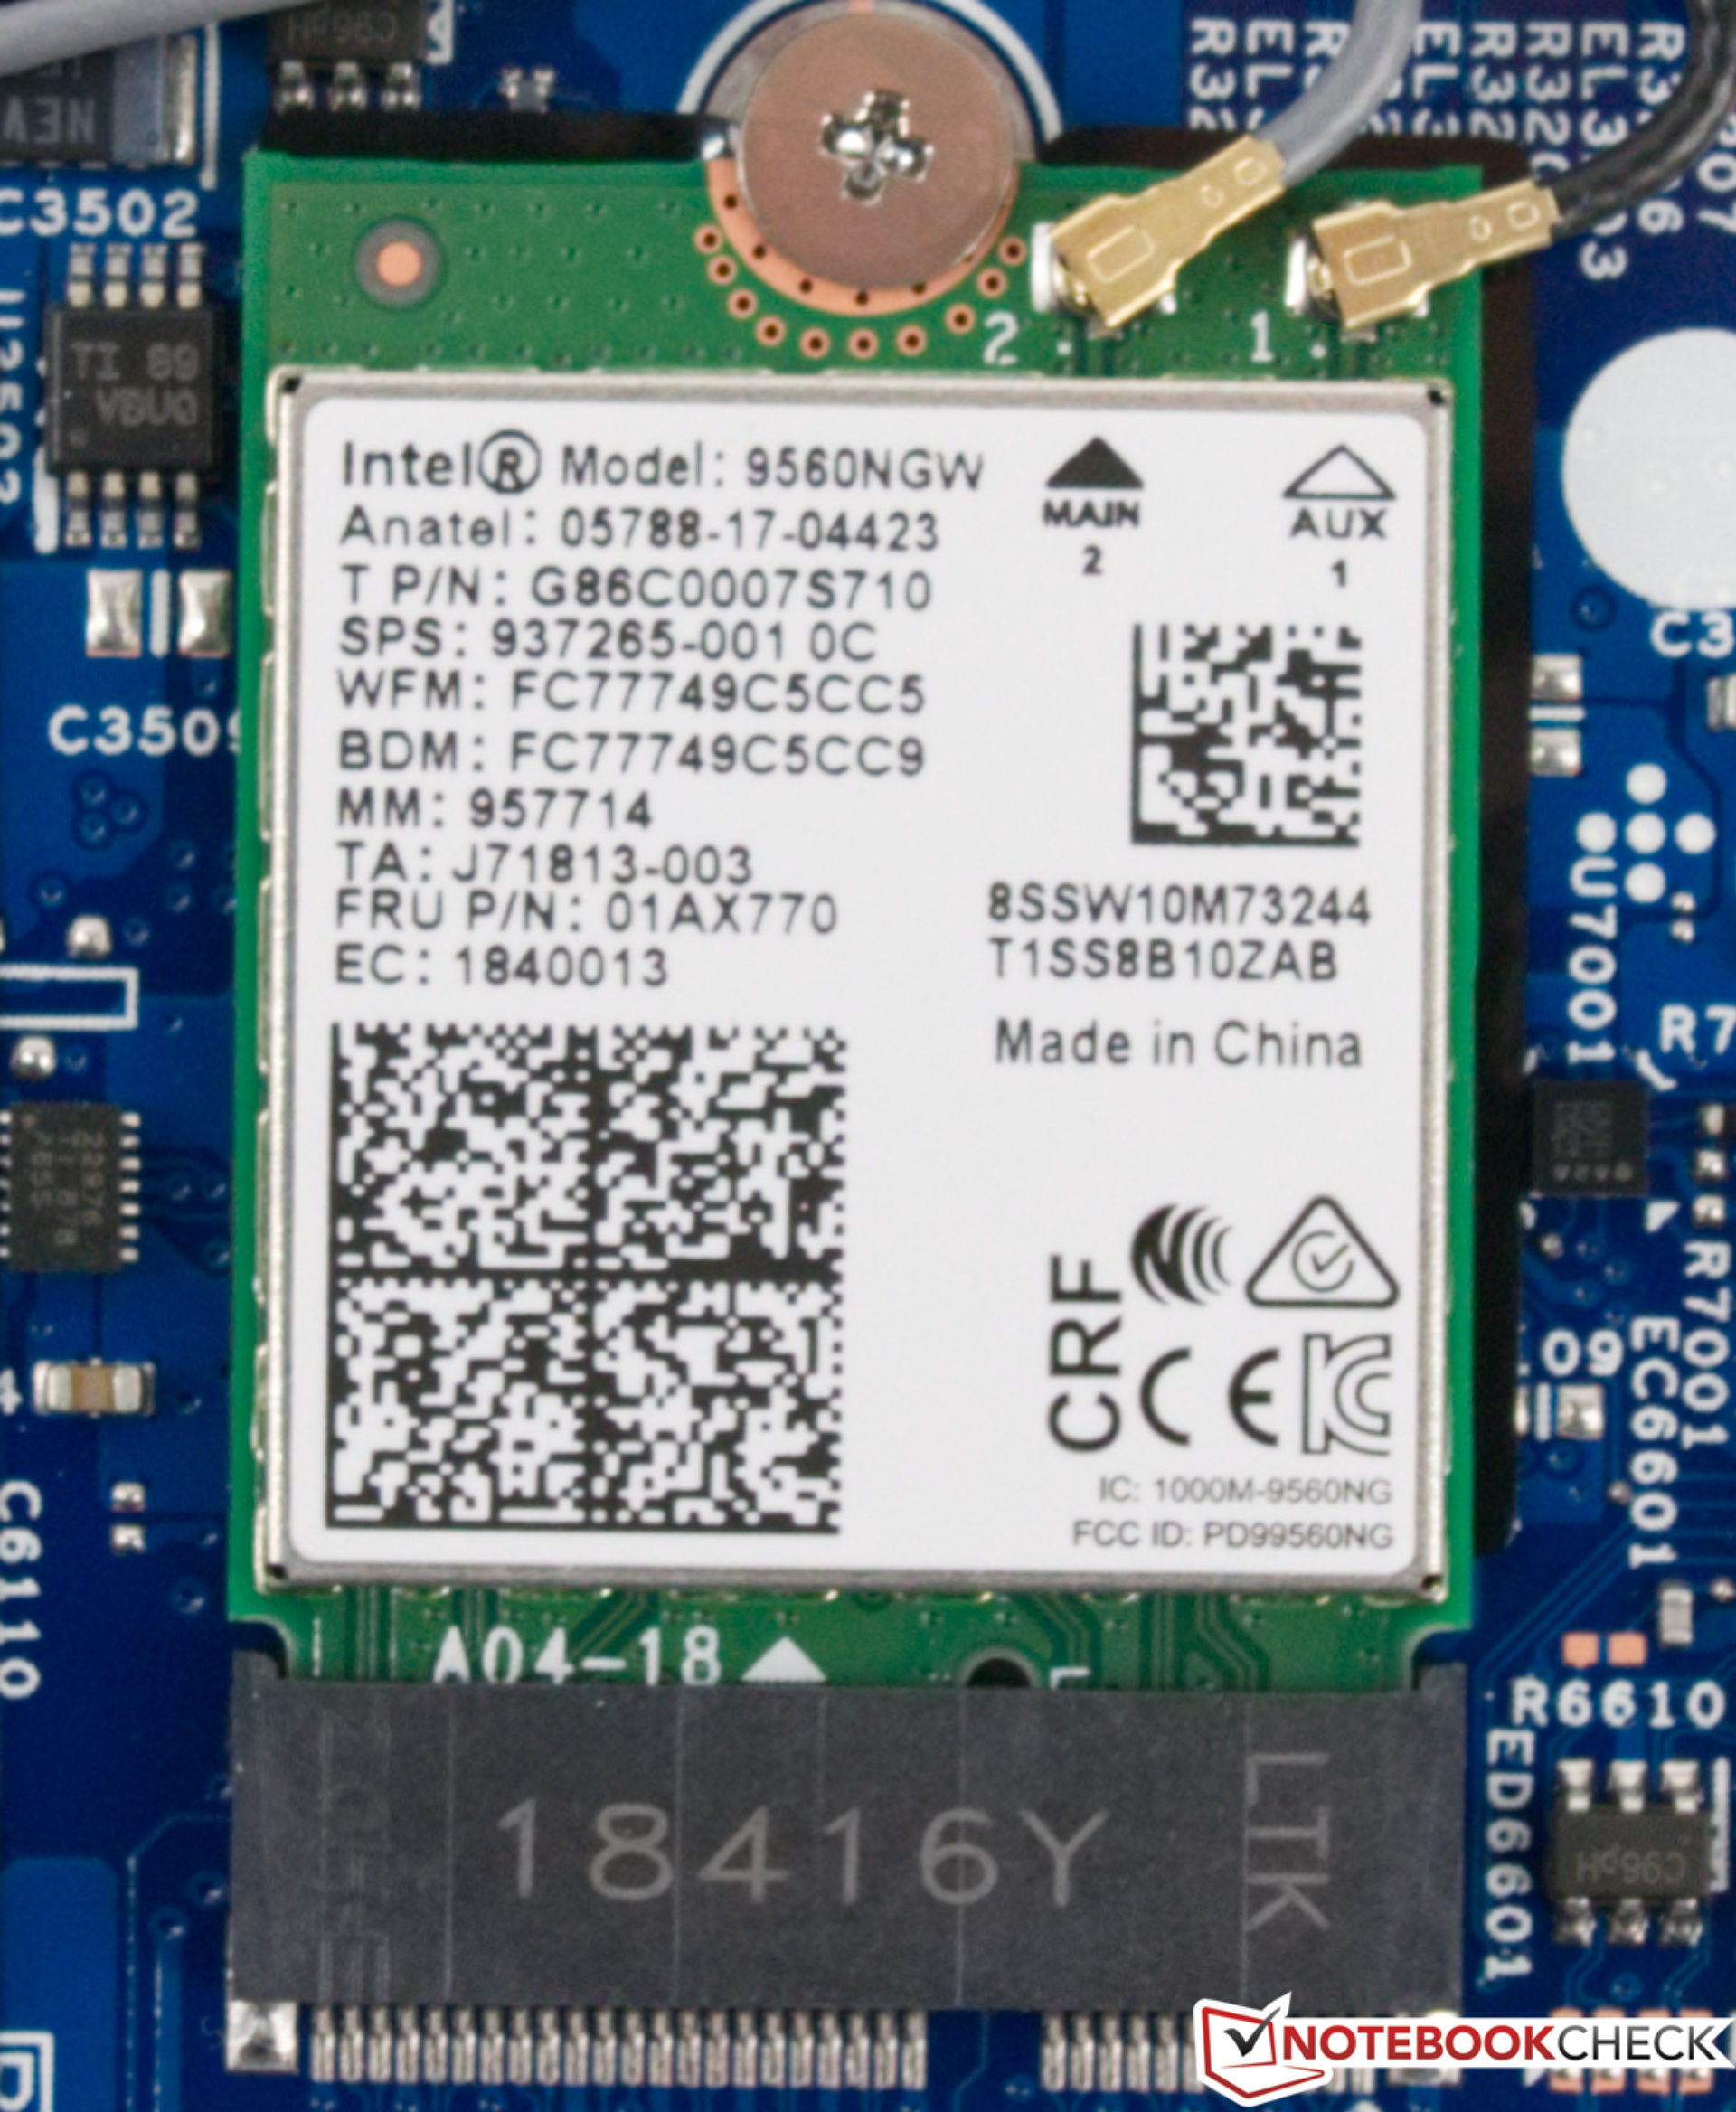
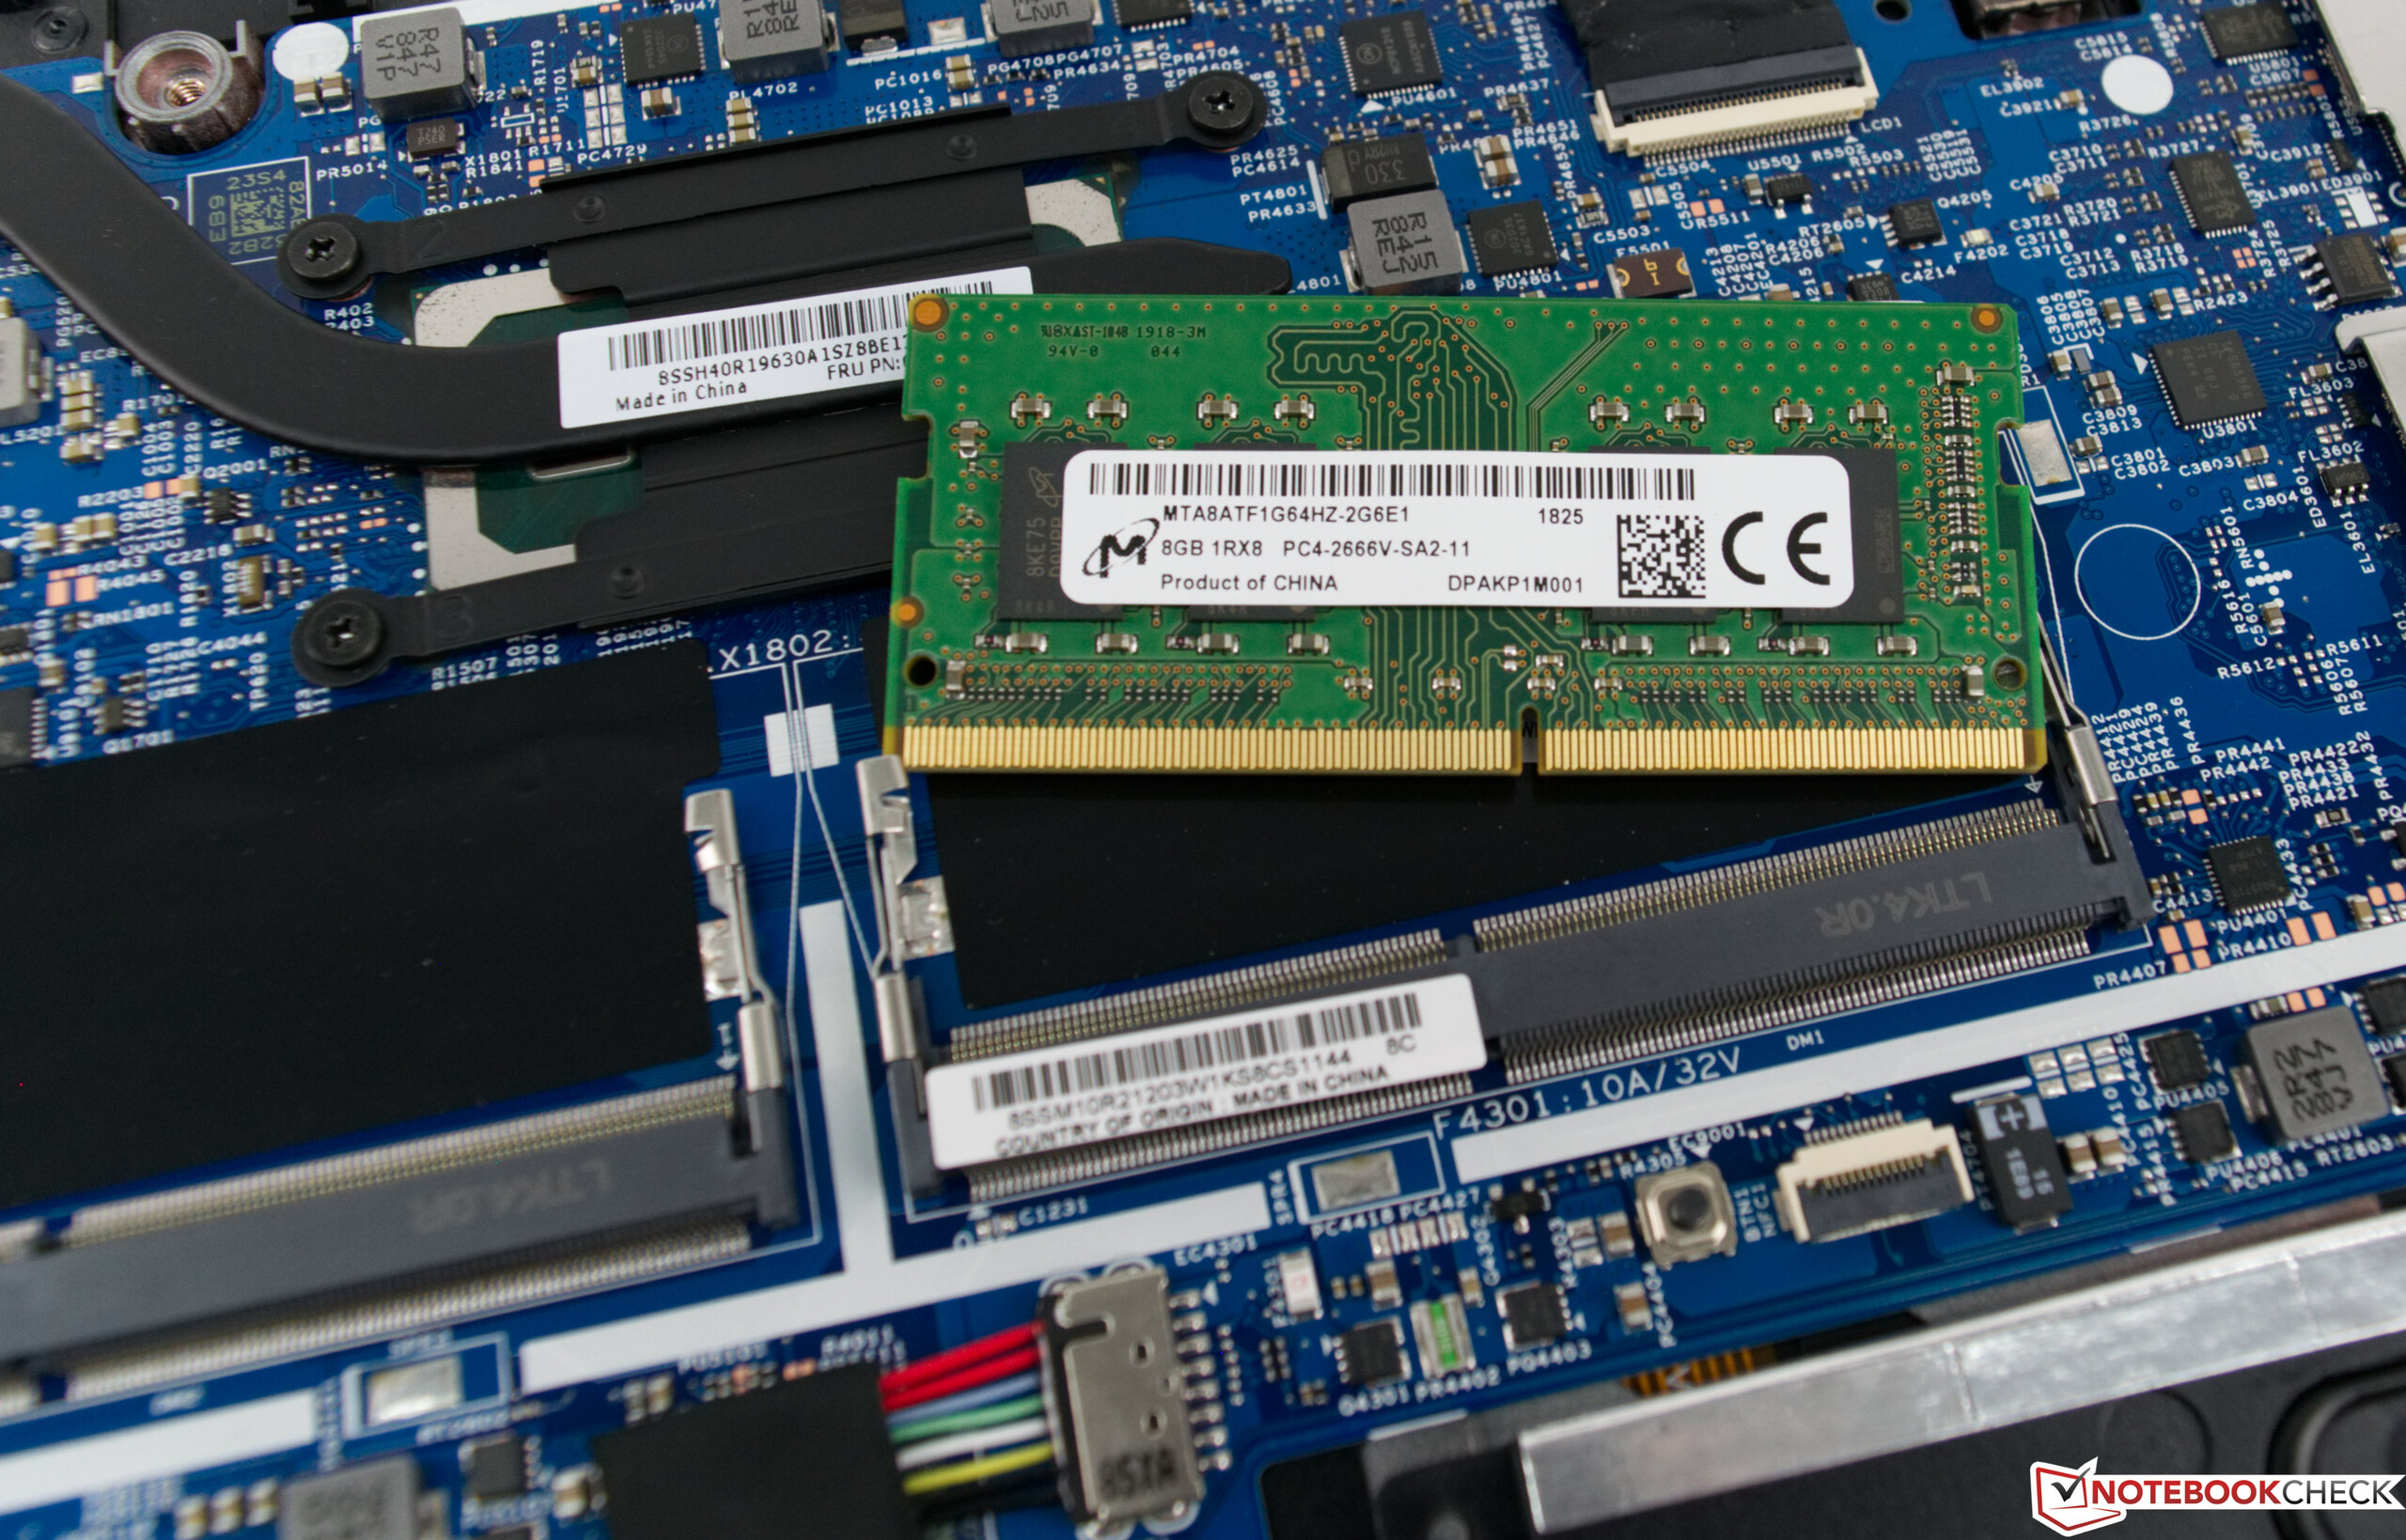
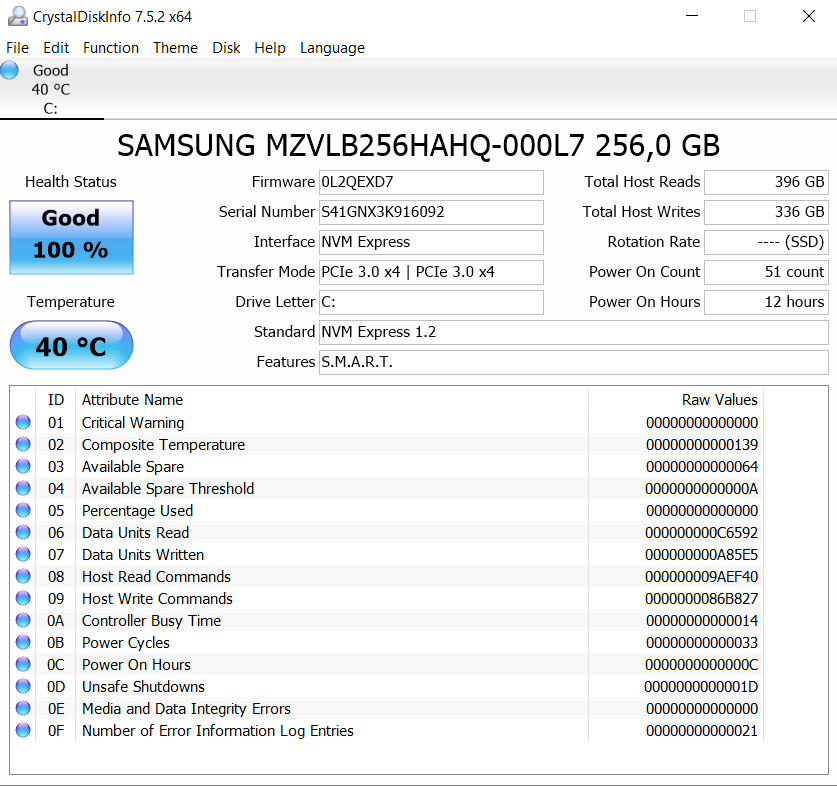
我们也喜欢这块高速固态硬盘,而联想则为这台机子配备了比其前代产品更新更快的英特尔Wi-Fi模块。廉价ThinkPad仍然易于维护和修复,这是另一个好。
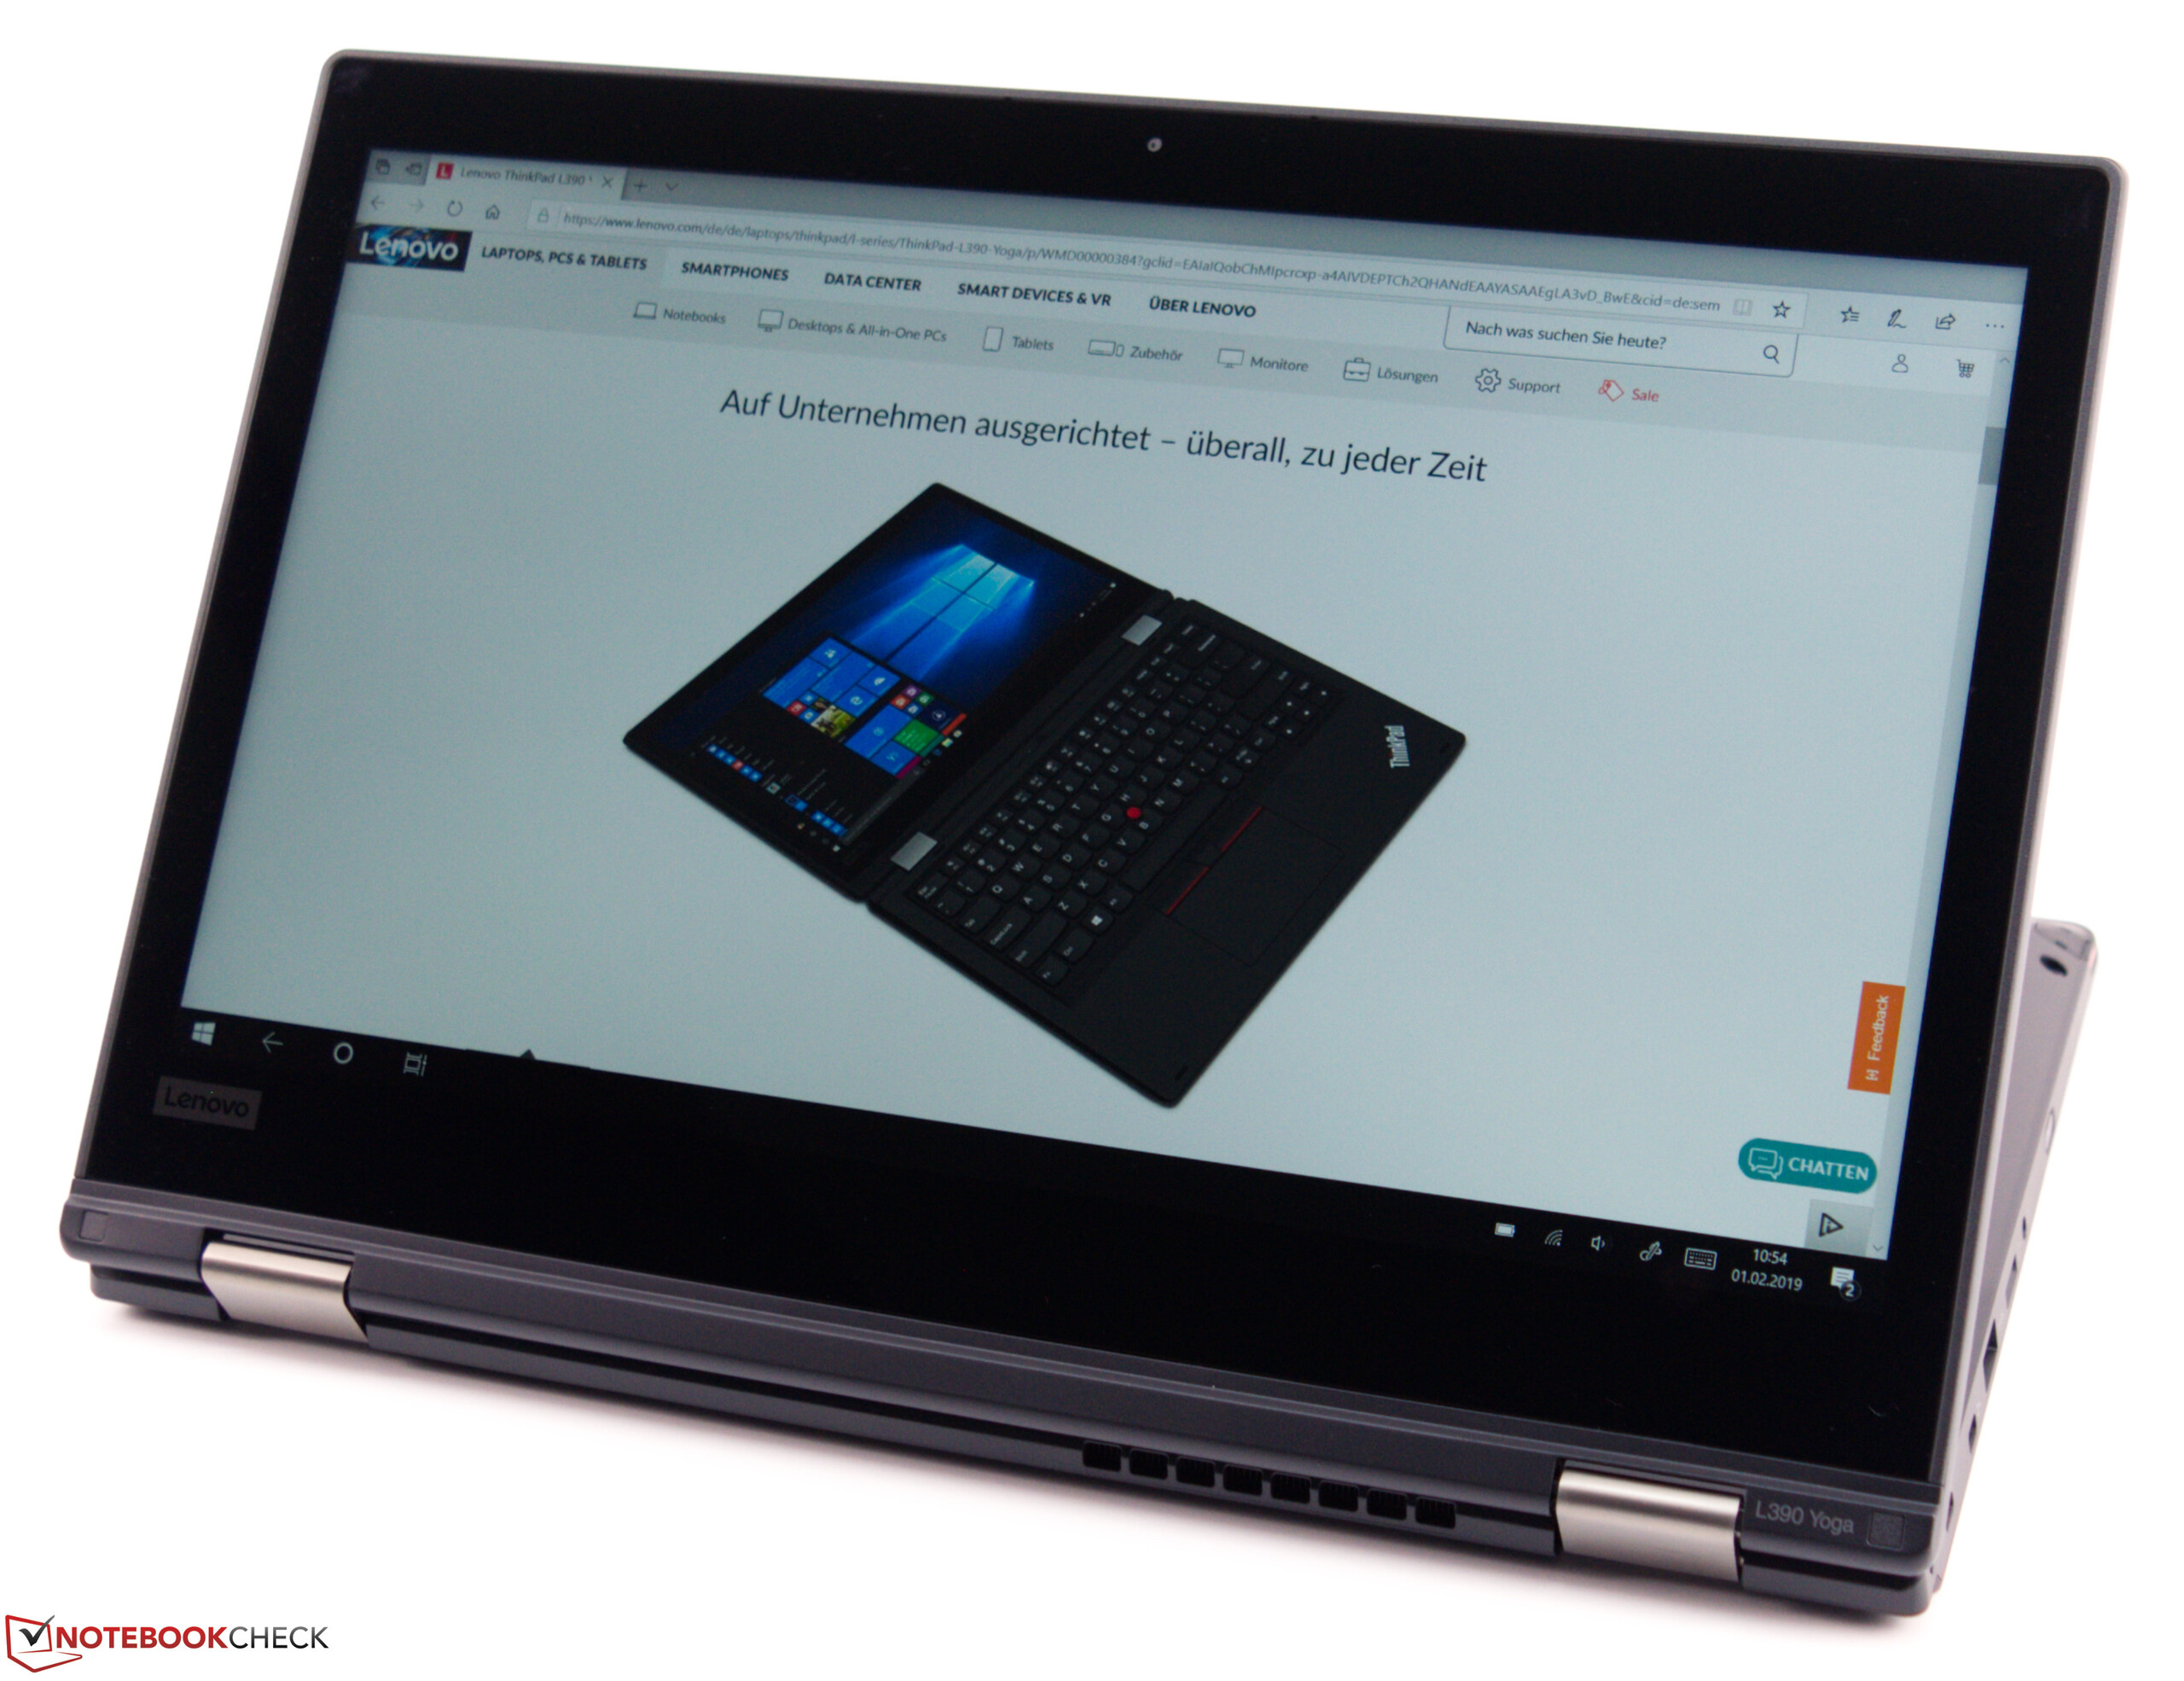
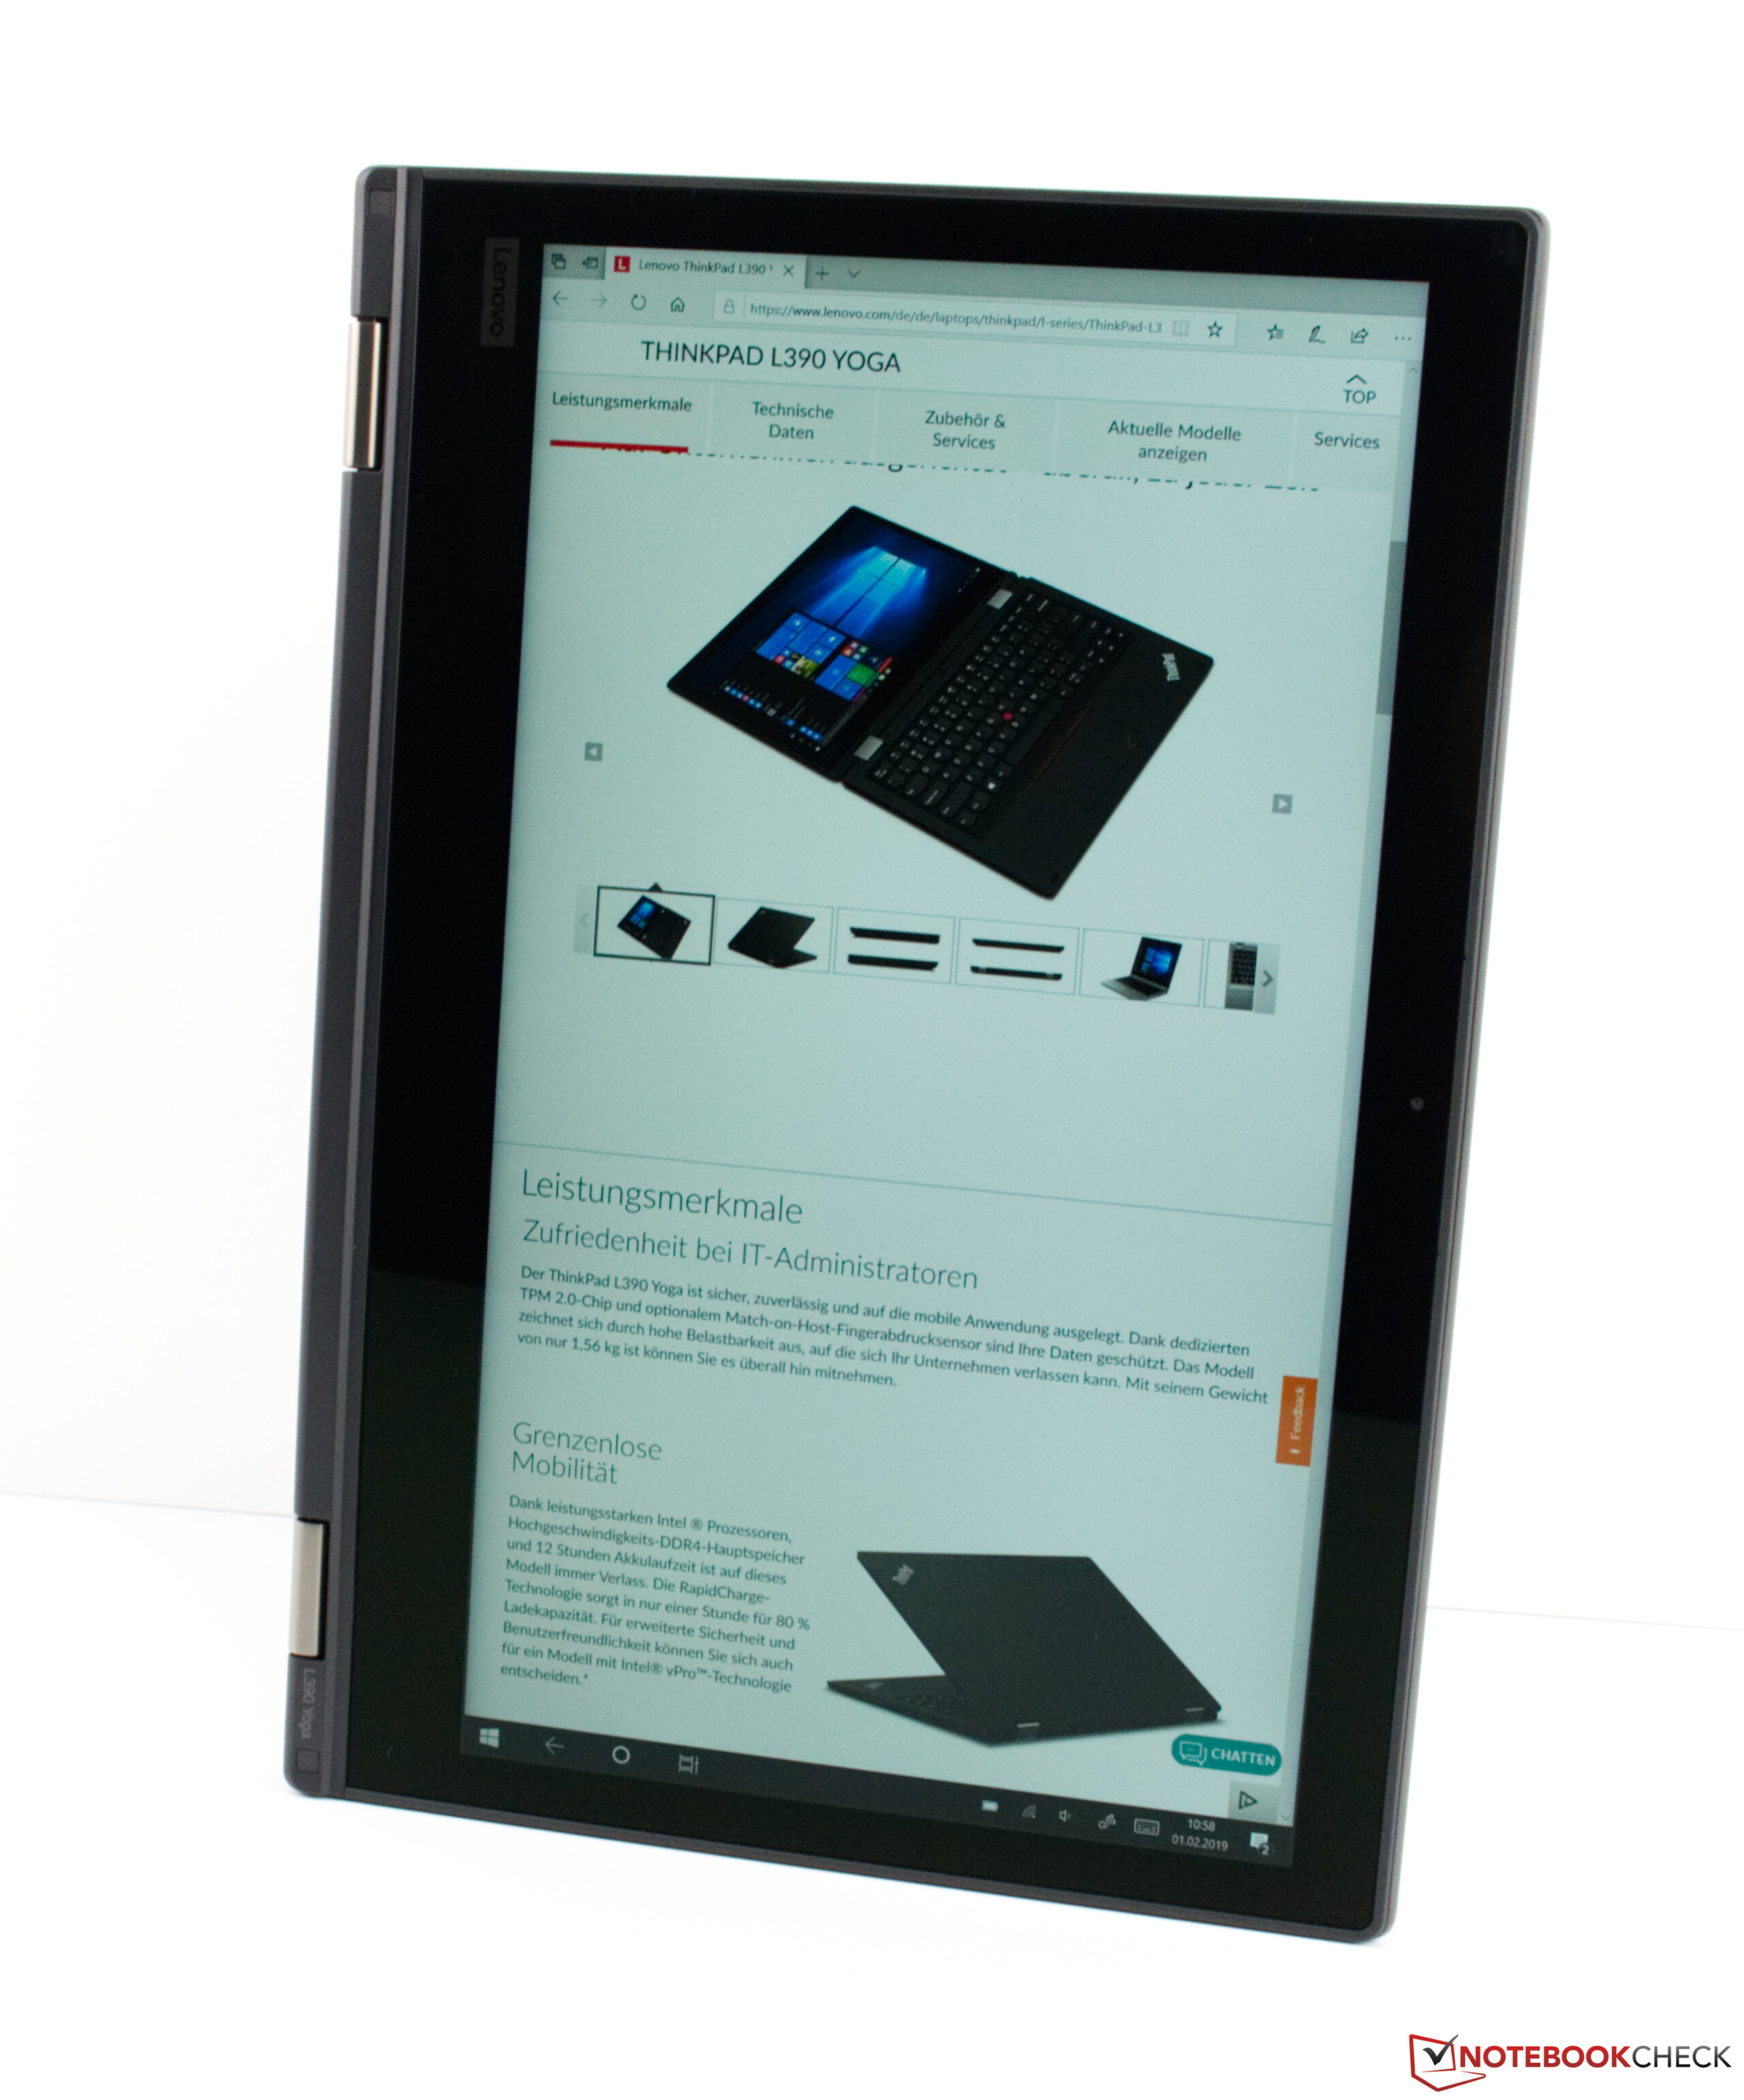
显示屏再次让我们有两种想法。它具有稳定的视角,而且尽管有光泽的表面,在室外仍然可读,但它亮度太低,颜色不准确。总体而言,L390瑜伽是一款令人印象深刻的商务翻转本,可在有限的预算范围内提供ThinkPad体验。
Lenovo ThinkPad L390 Yoga-20NT000XGE
- 02/13/2019 v6 (old)
Sebastian Bade
Price comparison

