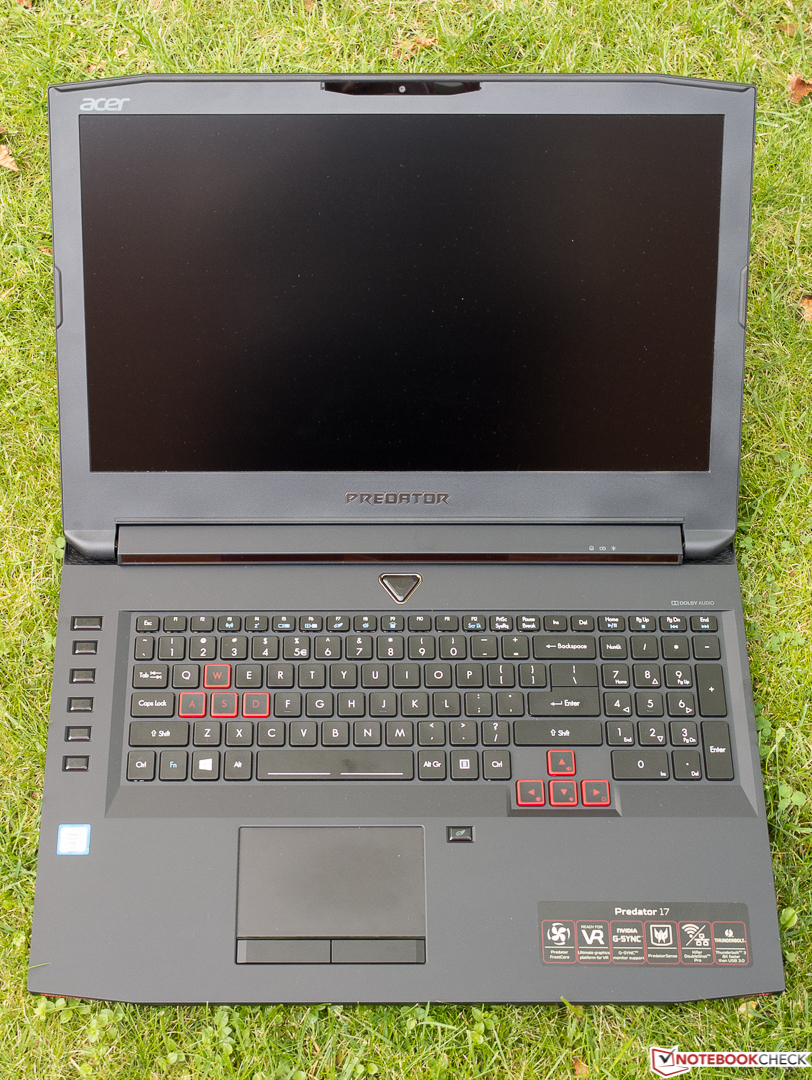
Acer Predator 17 G9-793 笔记本电脑简短评测


| SD Card Reader | |
| average JPG Copy Test (av. of 3 runs) | |
| Schenker XMG U716 | |
| MSI GT72VR 6RE-015US | |
| Alienware 17 R3 (A17-9935) | |
| Acer Predator 17 G9-793-77LG | |
| Asus G752VS-XB78K | |
| maximum AS SSD Seq Read Test (1GB) | |
| Schenker XMG U716 | |
| MSI GT72VR 6RE-015US | |
| Acer Predator 17 G9-793-77LG | |
| Alienware 17 R3 (A17-9935) | |
| Asus G752VS-XB78K | |
| Networking | |
| iperf Server (receive) TCP 1 m | |
| Asus G752VS-XB78K | |
| Acer Predator 17 G9-793-77LG | |
| iperf Client (transmit) TCP 1 m | |
| Acer Predator 17 G9-793-77LG | |
| Asus G752VS-XB78K | |
| |||||||||||||||||||||||||
Brightness Distribution: 88 %
Center on Battery: 336 cd/m²
Contrast: 1344:1 (Black: 0.25 cd/m²)
ΔE ColorChecker Calman: 3.61 | ∀{0.5-29.43 Ø4.71}
ΔE Greyscale Calman: 4.78 | ∀{0.09-98 Ø4.96}
100% sRGB (Argyll 1.6.3 3D)
88% AdobeRGB 1998 (Argyll 1.6.3 3D)
99.4% AdobeRGB 1998 (Argyll 3D)
100% sRGB (Argyll 3D)
86.9% Display P3 (Argyll 3D)
Gamma: 2.32
CCT: 6185 K
| Acer Predator 17 G9-793-77LG AU Optronics B173ZAN01.0 (AUO109B), 3840x2160 | Asus G752VS-XB78K LG Philips LP173WF4-SPF3 (LGD04E8), 1920x1080 | MSI GT72VR 6RE-015US LG Philips LGD046E, 1920x1080 | Alienware 17 R3 (A17-9935) CV69H_173WF4 (LGD0459), 1920x1080 | Schenker XMG U716 AU B173ZAN01.0 (AUO109B), 3840x2160 | |
|---|---|---|---|---|---|
| Display | -25% | -23% | -26% | 0% | |
| Display P3 Coverage (%) | 86.9 | 66.9 -23% | 68.3 -21% | 66.9 -23% | 86.5 0% |
| sRGB Coverage (%) | 100 | 85.2 -15% | 86.7 -13% | 83.9 -16% | 100 0% |
| AdobeRGB 1998 Coverage (%) | 99.4 | 62.3 -37% | 63.4 -36% | 61.4 -38% | 99 0% |
| Response Times | 3% | 1% | 8% | -20% | |
| Response Time Grey 50% / Grey 80% * (ms) | 37 ? | 38 ? -3% | 34.4 ? 7% | 33 ? 11% | 45 ? -22% |
| Response Time Black / White * (ms) | 24 ? | 22 ? 8% | 25.2 ? -5% | 23 ? 4% | 28 ? -17% |
| PWM Frequency (Hz) | |||||
| Screen | -10% | -10% | -24% | -11% | |
| Brightness middle (cd/m²) | 336 | 328 -2% | 348.7 4% | 360 7% | 374 11% |
| Brightness (cd/m²) | 320 | 317 -1% | 327 2% | 336 5% | 356 11% |
| Brightness Distribution (%) | 88 | 88 0% | 89 1% | 90 2% | 88 0% |
| Black Level * (cd/m²) | 0.25 | 0.3 -20% | 0.323 -29% | 0.44 -76% | 0.4 -60% |
| Contrast (:1) | 1344 | 1093 -19% | 1080 -20% | 818 -39% | 935 -30% |
| Colorchecker dE 2000 * | 3.61 | 3.74 -4% | 4.09 -13% | 4.76 -32% | 4.23 -17% |
| Colorchecker dE 2000 max. * | 6.02 | 8.97 -49% | 9.02 -50% | 10.8 -79% | 6.7 -11% |
| Greyscale dE 2000 * | 4.78 | 2.67 44% | 2.14 55% | 3.69 23% | 5.48 -15% |
| Gamma | 2.32 95% | 2.41 91% | 2.25 98% | 2.24 98% | 2.35 94% |
| CCT | 6185 105% | 6861 95% | 6885 94% | 6091 107% | 6686 97% |
| Color Space (Percent of AdobeRGB 1998) (%) | 88 | 56 -36% | 56.9 -35% | 55 -37% | 88 0% |
| Color Space (Percent of sRGB) (%) | 100 | 85 -15% | 86.5 -13% | 84 -16% | 100 0% |
| Total Average (Program / Settings) | -11% /
-11% | -11% /
-11% | -14% /
-20% | -10% /
-10% |
* ... smaller is better
Display Response Times
| ↔ Response Time Black to White | ||
|---|---|---|
| 24 ms ... rise ↗ and fall ↘ combined | ↗ 5 ms rise | 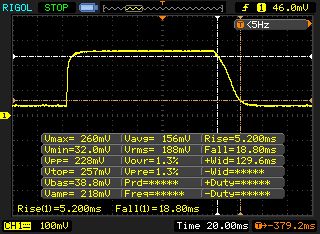 |
| ↘ 19 ms fall | ||
| The screen shows good response rates in our tests, but may be too slow for competitive gamers. In comparison, all tested devices range from 0.1 (minimum) to 240 (maximum) ms. » 54 % of all devices are better. This means that the measured response time is worse than the average of all tested devices (19.8 ms). | ||
| ↔ Response Time 50% Grey to 80% Grey | ||
| 37 ms ... rise ↗ and fall ↘ combined | ↗ 13 ms rise | 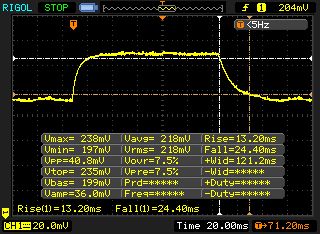 |
| ↘ 24 ms fall | ||
| The screen shows slow response rates in our tests and will be unsatisfactory for gamers. In comparison, all tested devices range from 0.165 (minimum) to 636 (maximum) ms. » 53 % of all devices are better. This means that the measured response time is worse than the average of all tested devices (31 ms). | ||
Screen Flickering / PWM (Pulse-Width Modulation)
| Screen flickering / PWM not detected |  | ||
In comparison: 52 % of all tested devices do not use PWM to dim the display. If PWM was detected, an average of 7757 (minimum: 5 - maximum: 343500) Hz was measured. | |||
| PCMark 8 - Home Score Accelerated v2 | |
| Asus G752VS-XB78K | |
| MSI GT72VR 6RE-015US | |
| Schenker XMG U716 | |
| Acer Predator 17 G9-793-77LG | |
| PCMark 8 Home Score Accelerated v2 | 4060 points | |
| PCMark 8 Creative Score Accelerated v2 | 2303 points | |
Help | ||
| Acer Predator 17 G9-793-77LG Toshiba NVMe THNSN5256GPU7 | Asus G752VS-XB78K Toshiba NVMe THNSN5512GPU7 | MSI GT72VR 6RE-015US SanDisk SD8SNAT256G1122 | Alienware 17 R3 (A17-9935) Samsung PM951 NVMe 512 GB | Schenker XMG U716 Samsung SM951 MZHPV512HDGL m.2 PCI-e | |
|---|---|---|---|---|---|
| AS SSD | -53% | 14% | |||
| Seq Read (MB/s) | 2016 | 507 -75% | 1942 -4% | ||
| Seq Write (MB/s) | 837 | 322.1 -62% | 1516 81% | ||
| 4K Read (MB/s) | 35.5 | 21.41 -40% | 40.86 15% | ||
| 4K Write (MB/s) | 105.2 | 84.1 -20% | 102.8 -2% | ||
| Score Total (Points) | 2320 | 688 -70% | 1910 -18% |

| 3DMark 11 - 1280x720 Performance GPU | |
| Asus G752VS-XB78K | |
| Acer Predator 17 G9-793-77LG | |
| Schenker XMG U716 | |
| MSI GT72VR 6RE-015US | |
| Alienware 17 R3 (A17-9935) | |
| 3DMark - 1920x1080 Fire Strike Graphics | |
| MSI GT72VR 6RE-015US | |
| Asus G752VS-XB78K | |
| Acer Predator 17 G9-793-77LG | |
| Schenker XMG U716 | |
| Alienware 17 R3 (A17-9935) | |
| 3DMark 11 Performance | 15153 points | |
| 3DMark Cloud Gate Standard Score | 24298 points | |
| 3DMark Fire Strike Score | 12354 points | |
Help | ||
| Far Cry Primal | |
| 3840x2160 High Preset AA:SM | |
| Asus G752VS-XB78K | |
| Acer Predator 17 G9-793-77LG | |
| 1920x1080 Ultra Preset AA:SM | |
| Asus G752VS-XB78K | |
| Acer Predator 17 G9-793-77LG | |
| Rise of the Tomb Raider | |
| 3840x2160 High Preset AA:FX AF:4x | |
| Asus G752VS-XB78K | |
| Acer Predator 17 G9-793-77LG | |
| 1920x1080 Very High Preset AA:FX AF:16x | |
| Asus G752VS-XB78K | |
| MSI GT72VR 6RE-015US | |
| Acer Predator 17 G9-793-77LG | |
| Alienware 17 R3 (A17-9935) | |
| Anno 2205 | |
| 3840x2160 High Preset AA:4x | |
| Acer Predator 17 G9-793-77LG | |
| Schenker XMG U716 | |
| 1920x1080 Ultra High Preset AA:8x | |
| Acer Predator 17 G9-793-77LG | |
| Schenker XMG U716 | |
| The Witcher 3 | |
| 3840x2160 High Graphics & Postprocessing (Nvidia HairWorks Off) | |
| Acer Predator 17 G9-793-77LG | |
| Asus G752VS-XB78K | |
| Schenker XMG U716 | |
| 1920x1080 Ultra Graphics & Postprocessing (HBAO+) | |
| Acer Predator 17 G9-793-77LG | |
| Asus G752VS-XB78K | |
| Schenker XMG U716 | |
| The Division | |
| 3840x2160 High Preset AF:8x | |
| Acer Predator 17 G9-793-77LG | |
| 1920x1080 Ultra Preset AF:16x | |
| Acer Predator 17 G9-793-77LG | |
| Mirror's Edge Catalyst | |
| 3840x2160 High Preset AF:16x | |
| Acer Predator 17 G9-793-77LG | |
| 1920x1080 Ultra Preset AF:16x | |
| MSI GT72VR 6RE-015US | |
| Acer Predator 17 G9-793-77LG | |
| Battlefield 4 | |
| 3840x2160 High Preset | |
| Asus G752VS-XB78K | |
| Acer Predator 17 G9-793-77LG | |
| Schenker XMG U716 | |
| 1920x1080 Ultra Preset AA:4x MS | |
| Asus G752VS-XB78K | |
| Acer Predator 17 G9-793-77LG | |
| Schenker XMG U716 | |
| Star Wars Battlefront | |
| 3840x2160 High Preset AA:FX | |
| Acer Predator 17 G9-793-77LG | |
| Schenker XMG U716 | |
| 1920x1080 Ultra Preset AA:FX | |
| Acer Predator 17 G9-793-77LG | |
| Schenker XMG U716 | |
| low | med. | high | ultra | 4K | |
|---|---|---|---|---|---|
| Battlefield 4 (2013) | 172.9 | 131.2 | 67.3 | ||
| The Witcher 3 (2015) | 103.8 | 58 | 38 | ||
| Anno 2205 (2015) | 44.1 | 49.2 | |||
| Star Wars Battlefront (2015) | 143.6 | 123.8 | 47.6 | ||
| Rise of the Tomb Raider (2016) | 107.6 | 85.5 | 37.4 | ||
| Far Cry Primal (2016) | 80 | 75 | 35 | ||
| The Division (2016) | 92 | 73.2 | 36.9 | ||
| Mirror's Edge Catalyst (2016) | 99.2 | 90.9 | 35.2 |
Noise level
| Idle |
| 33 / 34 / 40 dB(A) |
| Load |
| 44 / 50 dB(A) |
 | ||
30 dB silent 40 dB(A) audible 50 dB(A) loud |
||
min: | ||
| Acer Predator 17 G9-793-77LG GeForce GTX 1070 Mobile, 6700HQ | Asus G752VS-XB78K GeForce GTX 1070 Mobile, 6820HK | MSI GT72VR 6RE-015US GeForce GTX 1070 Mobile, 6700HQ | Alienware 17 R3 (A17-9935) GeForce GTX 980M, 6700HQ | Schenker XMG U716 GeForce GTX 980 (Laptop), 6700 | |
|---|---|---|---|---|---|
| Noise | 8% | 7% | 8% | 1% | |
| off / environment * (dB) | 31 | 30 3% | 28.9 7% | 30 3% | |
| Idle Minimum * (dB) | 33 | 31 6% | 32.4 2% | 31 6% | 33 -0% |
| Idle Average * (dB) | 34 | 32 6% | 32.4 5% | 32 6% | 35 -3% |
| Idle Maximum * (dB) | 40 | 33 17% | 32.4 19% | 33 17% | 38 5% |
| Load Average * (dB) | 44 | 40 9% | 39.4 10% | 38 14% | 45 -2% |
| Load Maximum * (dB) | 50 | 47 6% | 52 -4% | 50 -0% | 48 4% |
* ... smaller is better
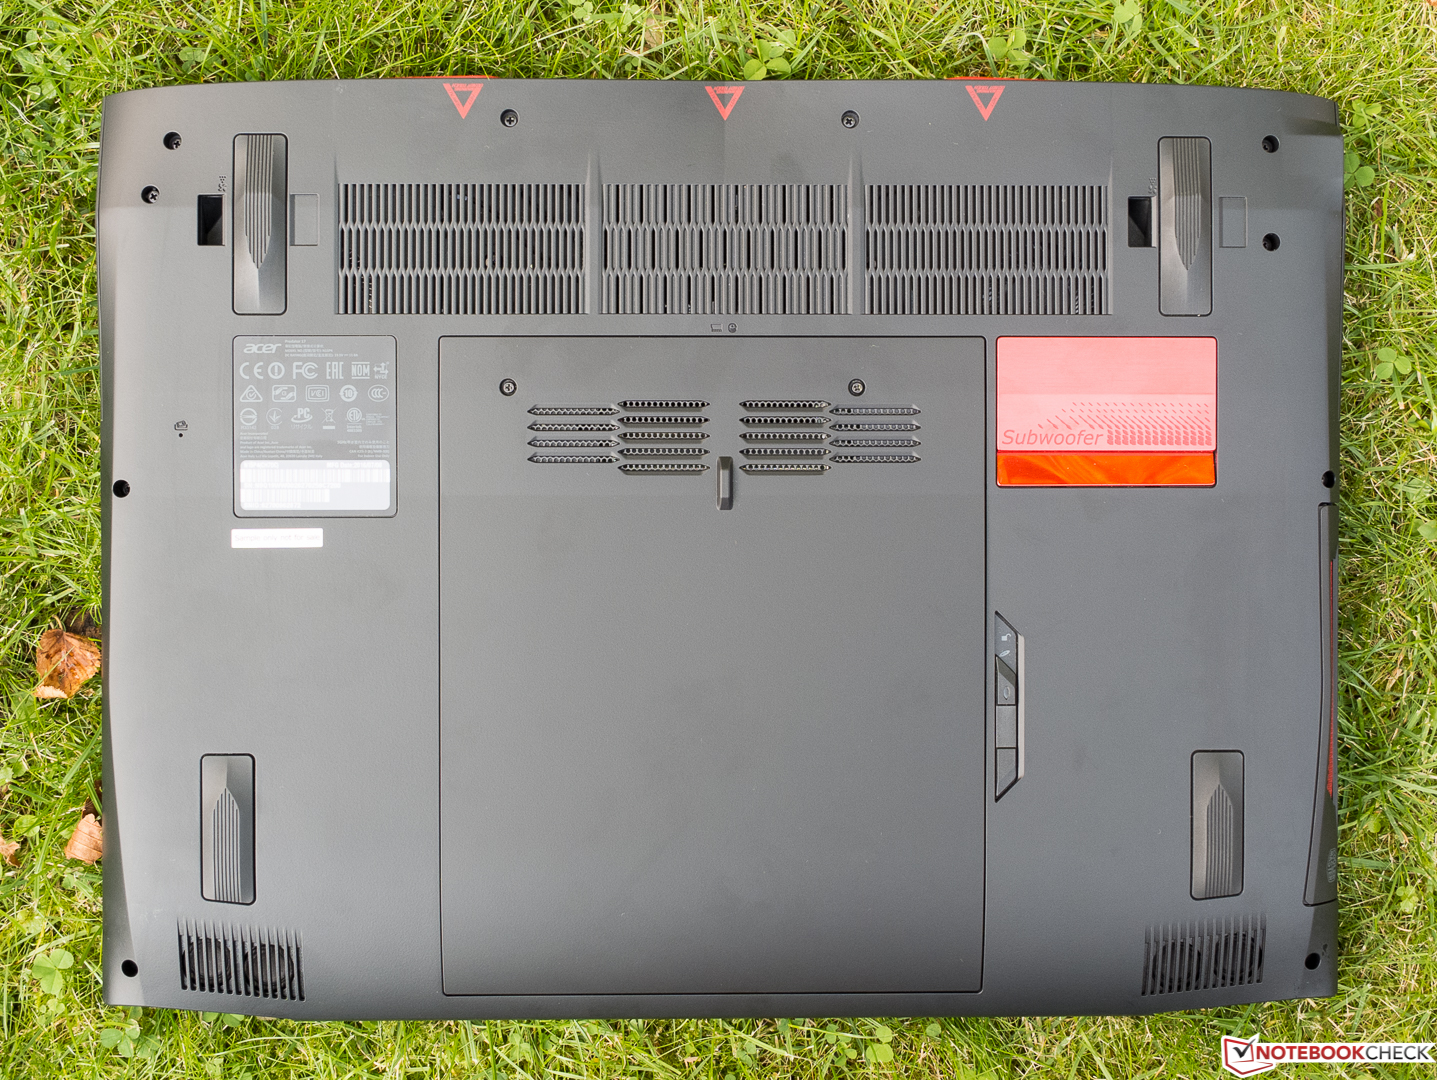
(±) The maximum temperature on the upper side is 42.6 °C / 109 F, compared to the average of 40.4 °C / 105 F, ranging from 21.2 to 68.8 °C for the class Gaming.
(±) The bottom heats up to a maximum of 44.9 °C / 113 F, compared to the average of 43.2 °C / 110 F
(+) In idle usage, the average temperature for the upper side is 29.5 °C / 85 F, compared to the device average of 33.9 °C / 93 F.
(+) The palmrests and touchpad are reaching skin temperature as a maximum (33.5 °C / 92.3 F) and are therefore not hot.
(-) The average temperature of the palmrest area of similar devices was 28.8 °C / 83.8 F (-4.7 °C / -8.5 F).
| Acer Predator 17 G9-793-77LG GeForce GTX 1070 Mobile, 6700HQ | Asus G752VS-XB78K GeForce GTX 1070 Mobile, 6820HK | MSI GT72VR 6RE-015US GeForce GTX 1070 Mobile, 6700HQ | Alienware 17 R3 (A17-9935) GeForce GTX 980M, 6700HQ | Schenker XMG U716 GeForce GTX 980 (Laptop), 6700 | |
|---|---|---|---|---|---|
| Heat | 3% | -2% | -11% | -20% | |
| Maximum Upper Side * (°C) | 42.6 | 42.9 -1% | 40.6 5% | 51.1 -20% | 48.8 -15% |
| Maximum Bottom * (°C) | 44.9 | 41.5 8% | 59.4 -32% | 53.2 -18% | 55.8 -24% |
| Idle Upper Side * (°C) | 33.1 | 31.6 5% | 28.2 15% | 31.7 4% | 36.7 -11% |
| Idle Bottom * (°C) | 28.9 | 29.5 -2% | 27.8 4% | 32.2 -11% | 37.3 -29% |
* ... smaller is better
Acer Predator 17 G9-793-77LG audio analysis
(+) | speakers can play relatively loud (83 dB)
Bass 100 - 315 Hz
(±) | reduced bass - on average 7.8% lower than median
(±) | linearity of bass is average (8.2% delta to prev. frequency)
Mids 400 - 2000 Hz
(+) | balanced mids - only 4% away from median
(+) | mids are linear (4.6% delta to prev. frequency)
Highs 2 - 16 kHz
(+) | balanced highs - only 3.7% away from median
(±) | linearity of highs is average (7.1% delta to prev. frequency)
Overall 100 - 16.000 Hz
(+) | overall sound is linear (12% difference to median)
Compared to same class
» 12% of all tested devices in this class were better, 4% similar, 84% worse
» The best had a delta of 6%, average was 18%, worst was 132%
Compared to all devices tested
» 9% of all tested devices were better, 2% similar, 88% worse
» The best had a delta of 4%, average was 23%, worst was 134%
MSI GT73VR-6RE16SR451 audio analysis
(+) | speakers can play relatively loud (82 dB)
Bass 100 - 315 Hz
(±) | reduced bass - on average 6.2% lower than median
(+) | bass is linear (6.4% delta to prev. frequency)
Mids 400 - 2000 Hz
(+) | balanced mids - only 1.6% away from median
(+) | mids are linear (5.3% delta to prev. frequency)
Highs 2 - 16 kHz
(±) | higher highs - on average 6.6% higher than median
(+) | highs are linear (6.8% delta to prev. frequency)
Overall 100 - 16.000 Hz
(+) | overall sound is linear (13.8% difference to median)
Compared to same class
» 21% of all tested devices in this class were better, 7% similar, 71% worse
» The best had a delta of 6%, average was 18%, worst was 132%
Compared to all devices tested
» 15% of all tested devices were better, 4% similar, 81% worse
» The best had a delta of 4%, average was 23%, worst was 134%
| Off / Standby | |
| Idle | |
| Load |
|
Key:
min: | |
| Acer Predator 17 G9-793-77LG GeForce GTX 1070 Mobile, 6700HQ | Asus G752VS-XB78K GeForce GTX 1070 Mobile, 6820HK | MSI GT72VR 6RE-015US GeForce GTX 1070 Mobile, 6700HQ | Alienware 17 R3 (A17-9935) GeForce GTX 980M, 6700HQ | Schenker XMG U716 GeForce GTX 980 (Laptop), 6700 | |
|---|---|---|---|---|---|
| Power Consumption | 11% | 6% | 34% | -28% | |
| Idle Minimum * (Watt) | 25 | 24 4% | 22.3 11% | 12 52% | 35 -40% |
| Idle Average * (Watt) | 35 | 31 11% | 27.3 22% | 18 49% | 44 -26% |
| Idle Maximum * (Watt) | 46 | 36 22% | 30 35% | 26 43% | 51 -11% |
| Load Average * (Watt) | 103 | 94 9% | 152.2 -48% | 95 8% | 134 -30% |
| Load Maximum * (Watt) | 223 | 204 9% | 204.2 8% | 188 16% | 298 -34% |
* ... smaller is better
| Acer Predator 17 G9-793-77LG 88 Wh | Asus G752VS-XB78K 90 Wh | MSI GT72VR 6RE-015US 83 Wh | Alienware 17 R3 (A17-9935) 92 Wh | Schenker XMG U716 82 Wh | |
|---|---|---|---|---|---|
| Battery runtime | 4% | 7% | 106% | -22% | |
| Reader / Idle (h) | 4.6 | 5.2 13% | 5.4 17% | 12.6 174% | 2.6 -43% |
| WiFi v1.3 (h) | 3.3 | 3.5 6% | 3.7 12% | 7.4 124% | |
| Load (h) | 1.5 | 1.4 -7% | 1.4 -7% | 1.8 20% | 1.5 0% |
| H.264 (h) | 3.1 | ||||
| Gaming (h) | 1.3 |
Pros
Cons
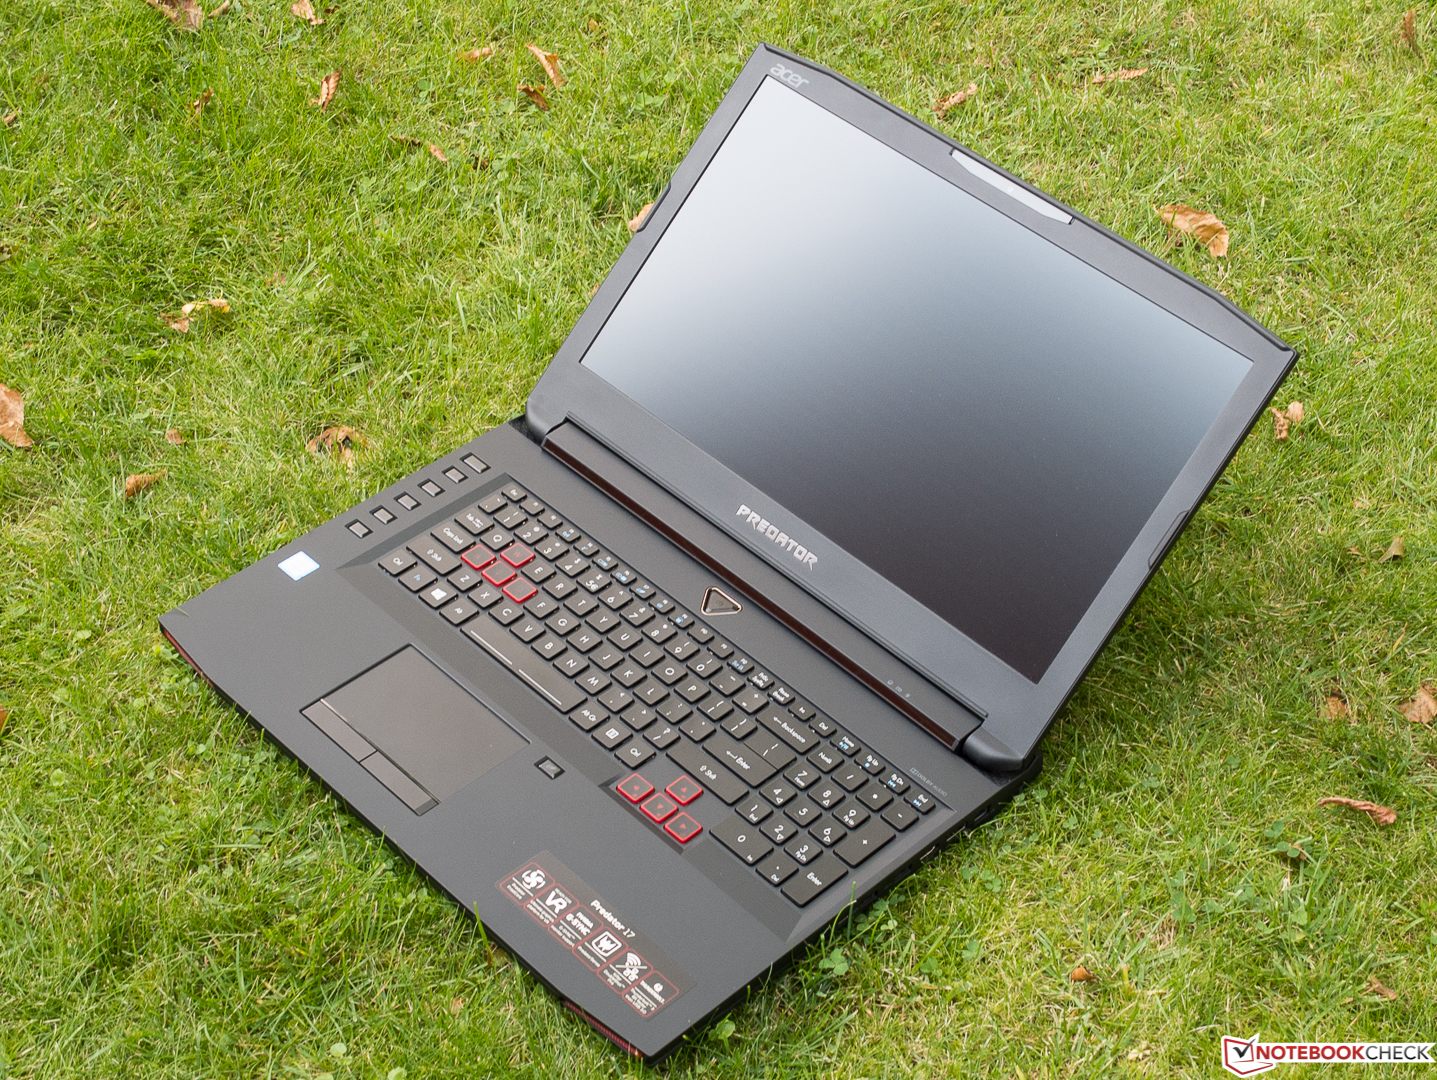
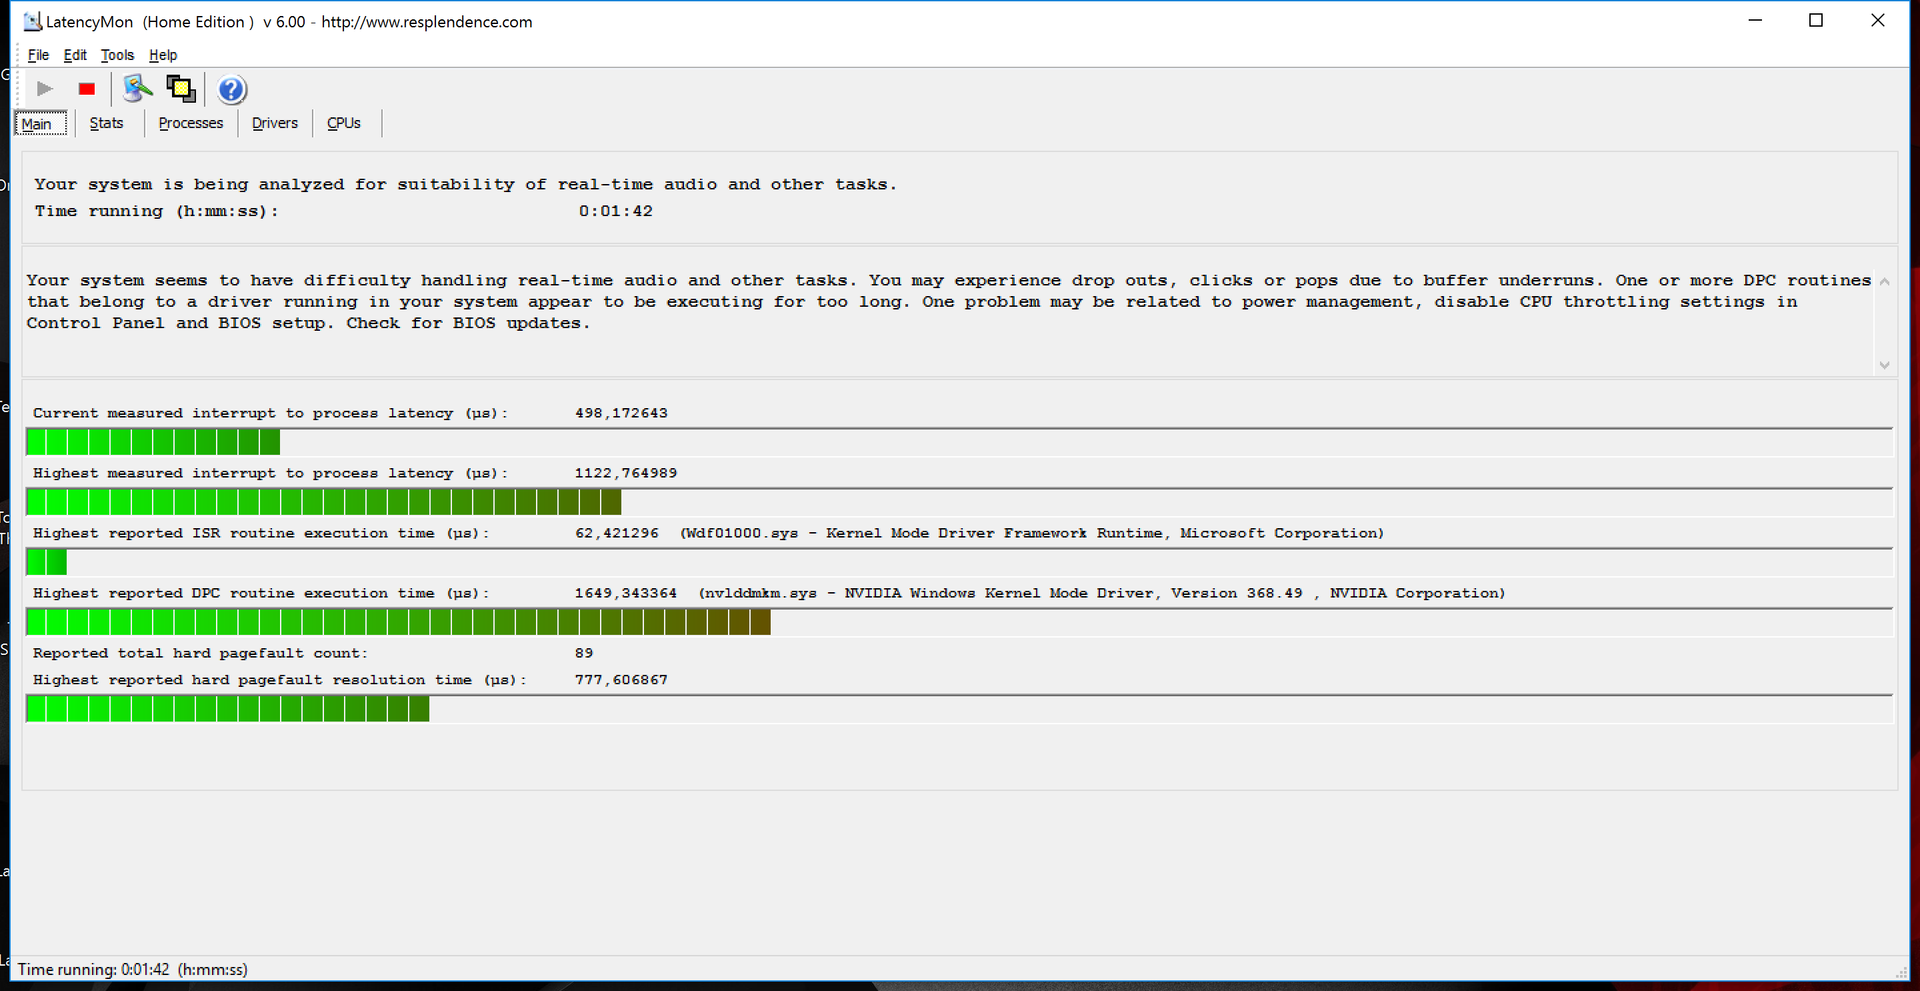
屏幕漏光可能是因为我们的测试机属于工程样机(不过我们对此仍有质疑),因此我们也相应地调整了它的最后得分。问题更加严重的可能是这台笨重笔记本电脑的处理器在负载下可以达到98度的高温,而同是它的显卡也会过热降频。必须承认的是,可能我们有一些吹毛求疵。整体上,它的“引擎”从来没有出错,在大型游戏设置全开的情况下也是如此。我们的另外一个不满之处是G9-793仍然不是特别易于维护升级。
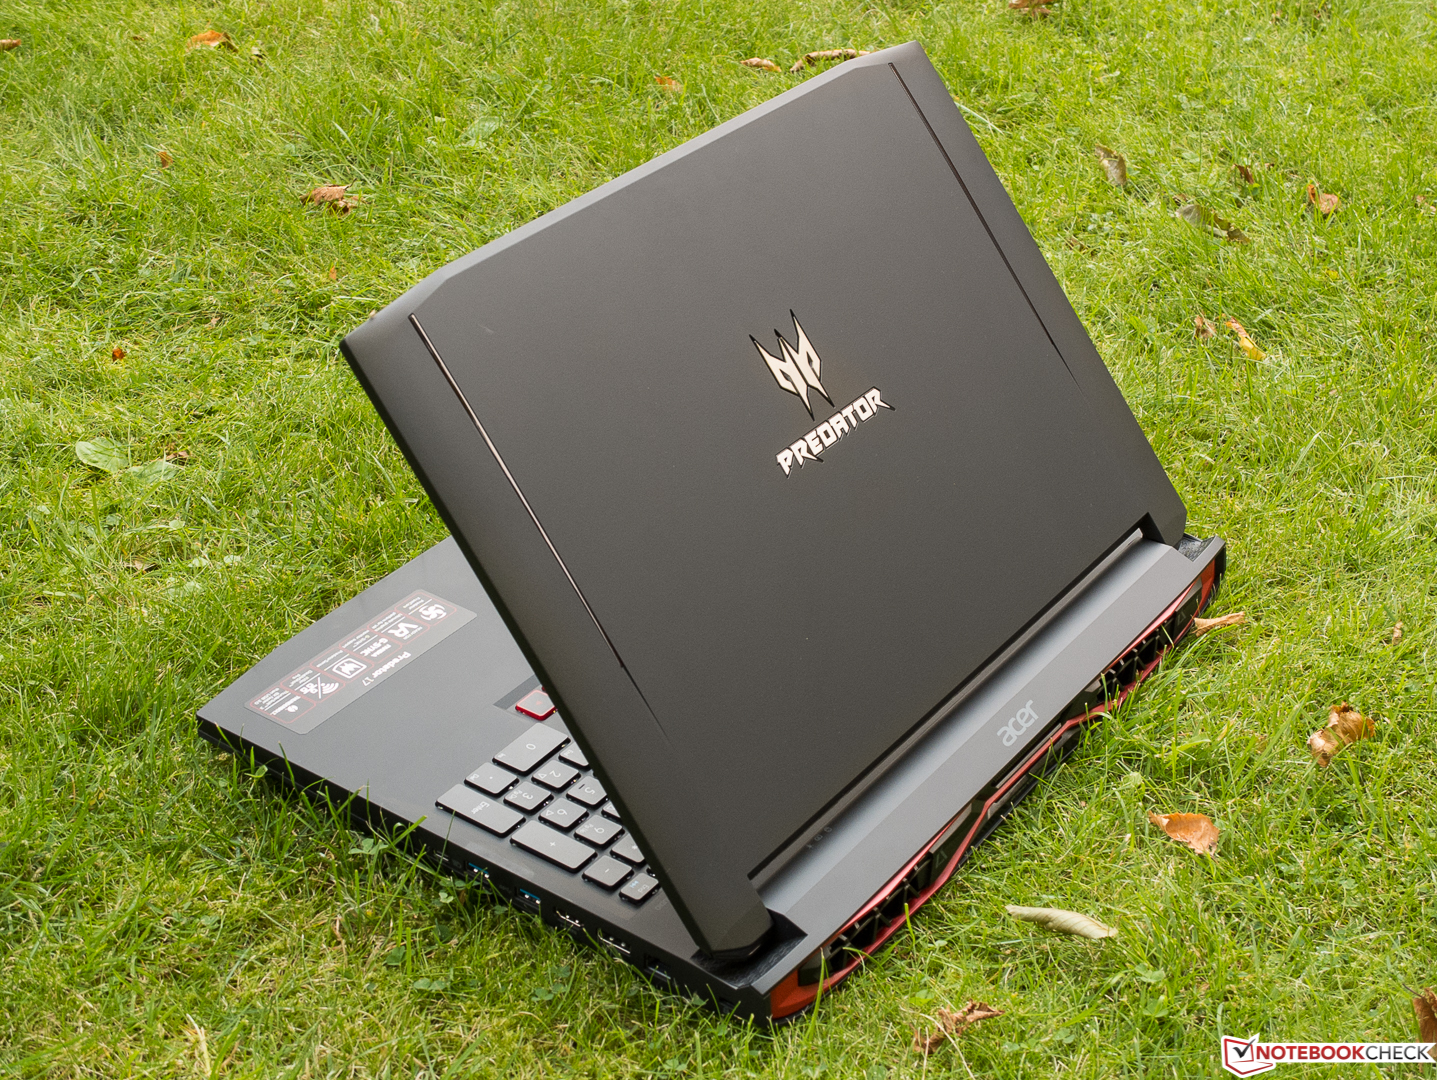
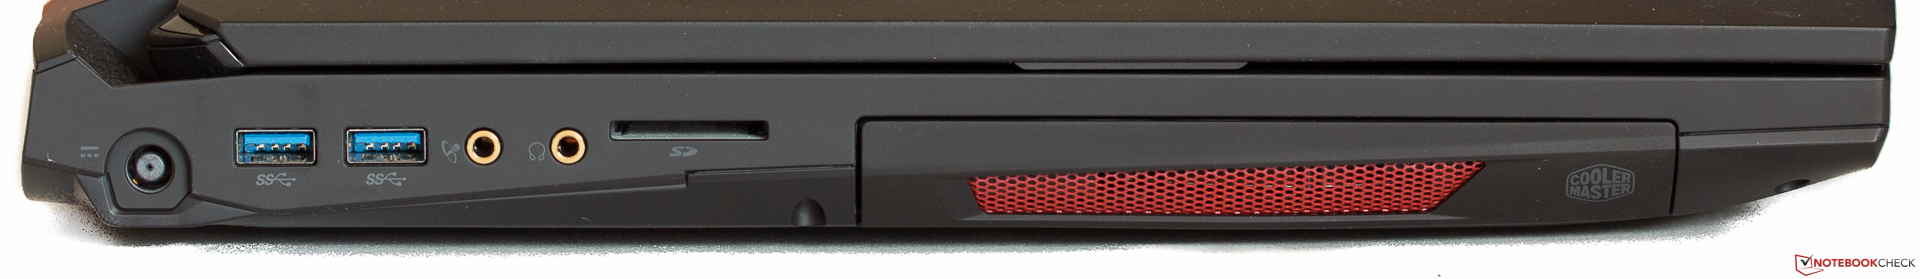
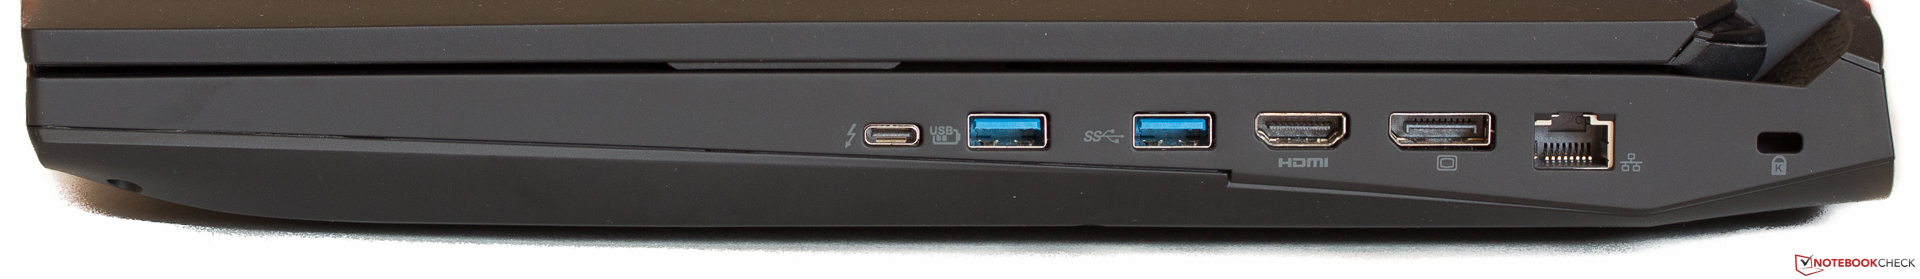
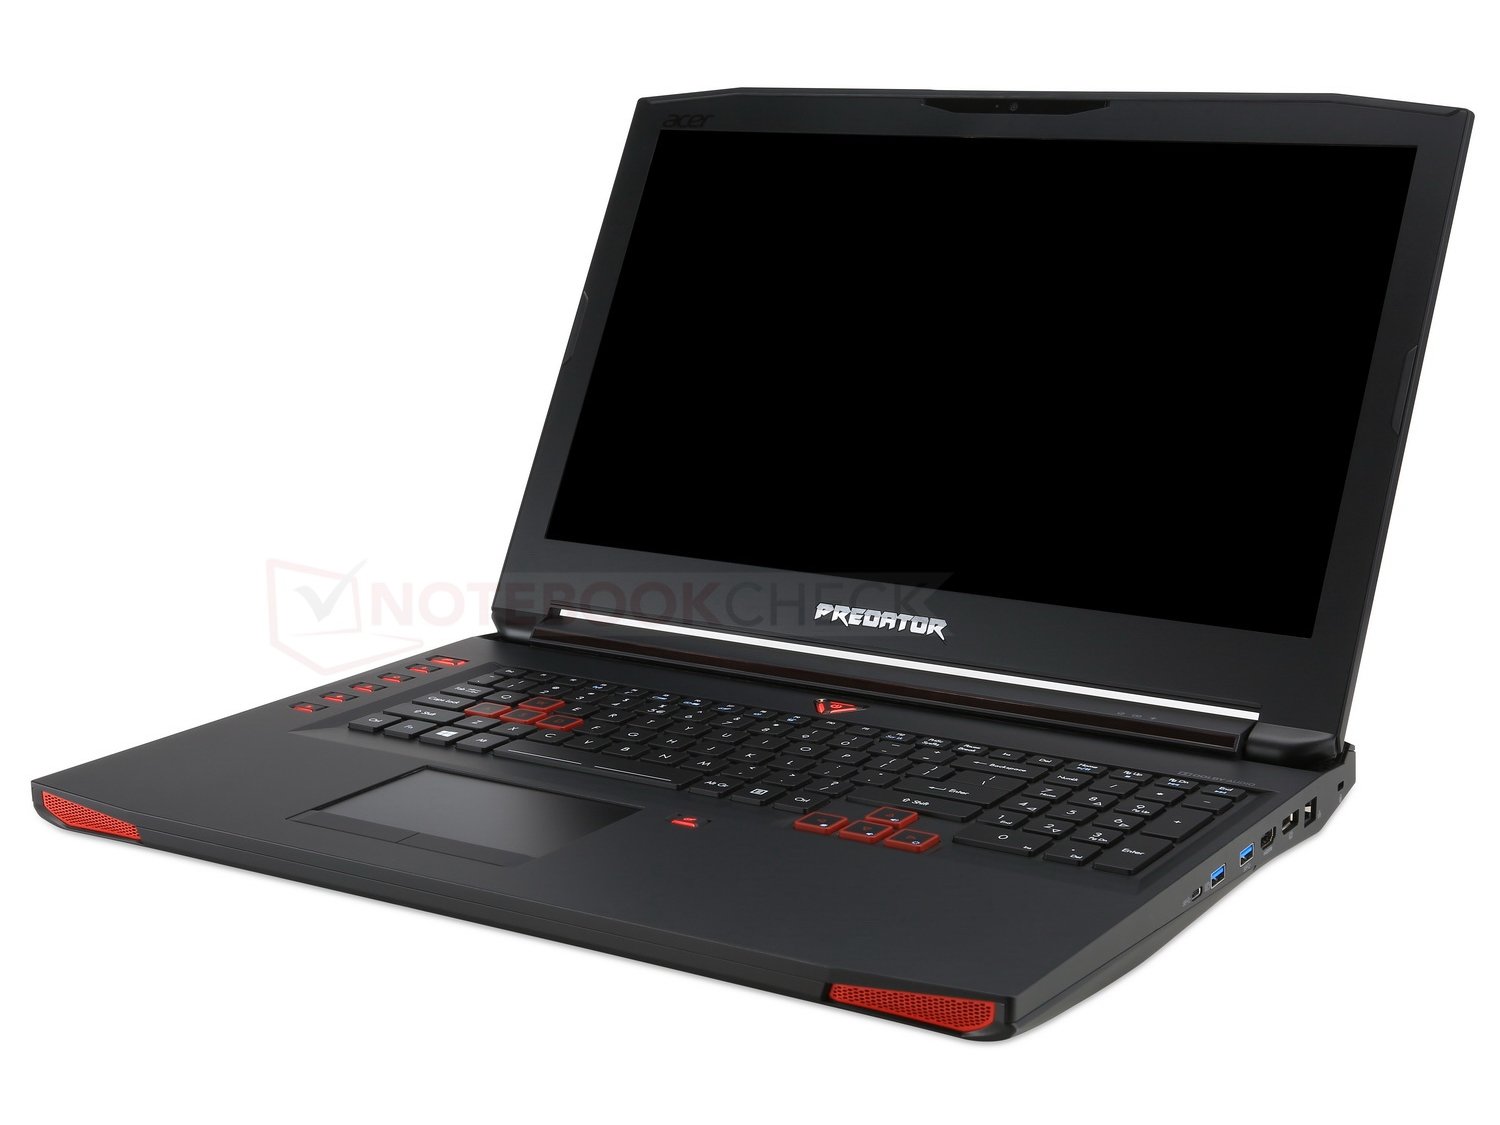
它的优势包括非常不错的工艺品质,出色的屏幕,非常强大的硬件配置,以及最现代的接口配备,包括Thunderbolt 3。游戏相关的工具软件和可定义按键也十分方便。最后,它非常不错的音响系统也同样值得一提。
注:本文是基于完整评测的缩减版本,阅读完整的英文评测,请点击这里。
Acer Predator 17 G9-793-77LG
- 09/03/2016 v5.1 (old)
Sven Kloevekorn
Price comparison
