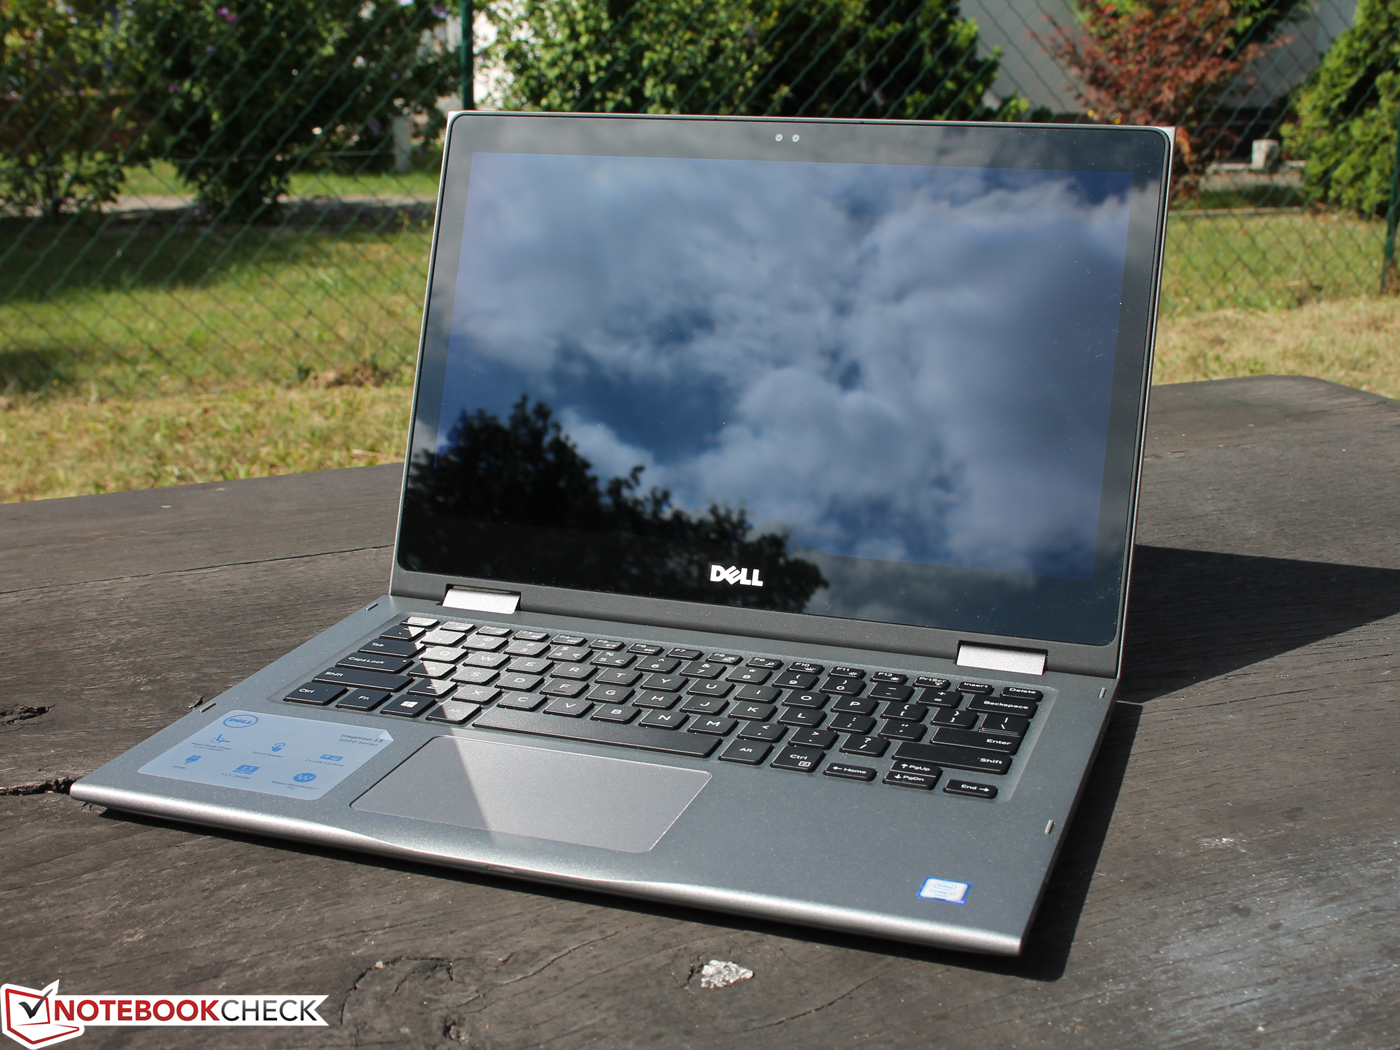
戴尔 Inspiron 13 5368 Convertible Review
| SD Card Reader | |
| average JPG Copy Test (av. of 3 runs) | |
| HP EliteBook 820 G3 | |
| Asus Zenbook UX360CA-FC060T | |
| Dell Inspiron 13 5368 | |
| Acer Aspire R13 R7-372T-746N | |
| maximum AS SSD Seq Read Test (1GB) | |
| HP EliteBook 820 G3 | |
| Asus Zenbook UX360CA-FC060T | |
| Acer Aspire R13 R7-372T-746N | |
| Dell Inspiron 13 5368 | |
| |||||||||||||||||||||||||
Brightness Distribution: 92 %
Center on Battery: 239 cd/m²
Contrast: 1000:1 (Black: 0.24 cd/m²)
ΔE ColorChecker Calman: 4.75 | ∀{0.5-29.43 Ø4.71}
ΔE Greyscale Calman: 4.3 | ∀{0.09-98 Ø4.96}
57.39% sRGB (Argyll 1.6.3 3D)
36.79% AdobeRGB 1998 (Argyll 1.6.3 3D)
40.17% AdobeRGB 1998 (Argyll 3D)
57.7% sRGB (Argyll 3D)
38.88% Display P3 (Argyll 3D)
Gamma: 2.5
CCT: 5893 K
| Dell Inspiron 13 5368 AUO B133HAB, , 1920x1080, 13.3" | Acer Aspire R13 R7-372T-746N Sharp LQ133T1JW02, , 2560x1440, 13.3" | HP Spectre x360 13-4104ng LG Philips LGD0000, , 2560x1440, 13.3" | Asus Zenbook UX360CA-FC060T AUO B133HAN02.7, , 1920x1080, 13.3" | Lenovo Yoga 900-13ISK 80MK 3200x1800, 13.3" | |
|---|---|---|---|---|---|
| Display | 75% | 67% | 65% | 60% | |
| Display P3 Coverage (%) | 38.88 | 69.6 79% | 66.8 72% | 65.1 67% | 63.2 63% |
| sRGB Coverage (%) | 57.7 | 98 70% | 92.8 61% | 93 61% | 88.7 54% |
| AdobeRGB 1998 Coverage (%) | 40.17 | 70.7 76% | 67.3 68% | 66.5 66% | 64.9 62% |
| Response Times | 11% | 42% | 32% | 20% | |
| Response Time Grey 50% / Grey 80% * (ms) | 44 ? | 36 ? 18% | 24 ? 45% | 29 ? 34% | 38.8 ? 12% |
| Response Time Black / White * (ms) | 31 ? | 30 ? 3% | 19 ? 39% | 22 ? 29% | 22.4 ? 28% |
| PWM Frequency (Hz) | 1000 ? | 192 ? | 1316 | ||
| Screen | 36% | 17% | 8% | -6% | |
| Brightness middle (cd/m²) | 240 | 320 33% | 324 35% | 302 26% | 319.8 33% |
| Brightness (cd/m²) | 229 | 308 34% | 324 41% | 298 30% | 302 32% |
| Brightness Distribution (%) | 92 | 91 -1% | 90 -2% | 90 -2% | 88 -4% |
| Black Level * (cd/m²) | 0.24 | 0.17 29% | 0.34 -42% | 0.21 12% | 0.835 -248% |
| Contrast (:1) | 1000 | 1882 88% | 953 -5% | 1438 44% | 383 -62% |
| Colorchecker dE 2000 * | 4.75 | 3.18 33% | 4.36 8% | 6.33 -33% | 2.68 44% |
| Colorchecker dE 2000 max. * | 9.09 | 9.91 -9% | 11.89 -31% | ||
| Greyscale dE 2000 * | 4.3 | 4.13 4% | 4.62 -7% | 8.13 -89% | 2.35 45% |
| Gamma | 2.5 88% | 2.03 108% | 2.18 101% | 2.52 87% | 2.09 105% |
| CCT | 5893 110% | 6752 96% | 6857 95% | 6811 95% | 6975 93% |
| Color Space (Percent of AdobeRGB 1998) (%) | 36.79 | 65 77% | 60 63% | 60 63% | 57 55% |
| Color Space (Percent of sRGB) (%) | 57.39 | 98 71% | 93 62% | 93 62% | 88 53% |
| Total Average (Program / Settings) | 41% /
40% | 42% /
31% | 35% /
23% | 25% /
12% |
* ... smaller is better
Display Response Times
| ↔ Response Time Black to White | ||
|---|---|---|
| 31 ms ... rise ↗ and fall ↘ combined | ↗ 15 ms rise | 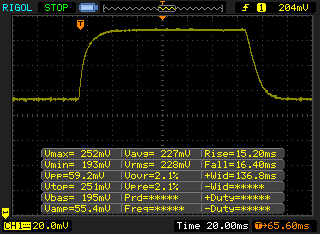 |
| ↘ 16 ms fall | ||
| The screen shows slow response rates in our tests and will be unsatisfactory for gamers. In comparison, all tested devices range from 0.1 (minimum) to 240 (maximum) ms. » 84 % of all devices are better. This means that the measured response time is worse than the average of all tested devices (19.8 ms). | ||
| ↔ Response Time 50% Grey to 80% Grey | ||
| 44 ms ... rise ↗ and fall ↘ combined | ↗ 20 ms rise |  |
| ↘ 24 ms fall | ||
| The screen shows slow response rates in our tests and will be unsatisfactory for gamers. In comparison, all tested devices range from 0.165 (minimum) to 636 (maximum) ms. » 73 % of all devices are better. This means that the measured response time is worse than the average of all tested devices (31 ms). | ||
Screen Flickering / PWM (Pulse-Width Modulation)
| Screen flickering / PWM not detected | ||
In comparison: 52 % of all tested devices do not use PWM to dim the display. If PWM was detected, an average of 7754 (minimum: 5 - maximum: 343500) Hz was measured. | ||
| Cinebench R15 | |
| CPU Single 64Bit | |
| Dell Inspiron 13 5368 | |
| HP Spectre x360 13-4104ng | |
| Acer Aspire R13 R7-372T-746N | |
| Lenovo Yoga 900-13ISK 80MK | |
| Asus Zenbook UX360CA-FC060T | |
| CPU Multi 64Bit | |
| Acer Aspire R13 R7-372T-746N | |
| Dell Inspiron 13 5368 | |
| Lenovo Yoga 900-13ISK 80MK | |
| HP Spectre x360 13-4104ng | |
| Asus Zenbook UX360CA-FC060T | |
| PCMark 8 | |
| Home Score Accelerated v2 | |
| Dell Inspiron 13 5368 | |
| Acer Aspire R13 R7-372T-746N | |
| Lenovo Yoga 900-13ISK 80MK | |
| Asus Zenbook UX360CA-FC060T | |
| Work Score Accelerated v2 | |
| Dell Inspiron 13 5368 | |
| Acer Aspire R13 R7-372T-746N | |
| Lenovo Yoga 900-13ISK 80MK | |
| Asus Zenbook UX360CA-FC060T | |
| PCMark 8 Home Score Accelerated v2 | 3699 points | |
| PCMark 8 Work Score Accelerated v2 | 4577 points | |
Help | ||
| Dell Inspiron 13 5368 Toshiba THNSNK256GCS8 | Acer Aspire R13 R7-372T-746N Lite-On CV1-8B256 | HP Spectre x360 13-4104ng Samsung SSD PM851 256 GB MZNTE256HMHP | Asus Zenbook UX360CA-FC060T Lite-On CV1-8B128 | Lenovo Yoga 900-13ISK 80MK Samsung SSD PM871 MZNLN512HCJH | |
|---|---|---|---|---|---|
| CrystalDiskMark 3.0 | 13% | -17% | -19% | 19% | |
| Read Seq (MB/s) | 479 | 507 6% | 491.8 3% 491.8 3% | 497 4% | 514 7% |
| Write Seq (MB/s) | 270.1 | 354.4 31% | 264.5 -2% 264.5 -2% | 182.9 -32% | 459.5 70% |
| Read 512 (MB/s) | 428.3 | 355.3 -17% | 396.2 -7% 396.2 -7% | 353 -18% | 413.4 -3% |
| Write 512 (MB/s) | 267.9 | 353.9 32% | 264.5 -1% 264.5 -1% | 144.1 -46% | 424.5 58% |
| Read 4k (MB/s) | 23.77 | 32.66 37% | 30.88 30% 30.88 30% | 31.89 34% | 36.34 53% |
| Write 4k (MB/s) | 81.4 | 81.6 0% | 75.6 -7% 75.6 -7% | 62 -24% | 100.1 23% |
| Read 4k QD32 (MB/s) | 333.6 | 277.6 -17% | 31.85 -90% 31.85 -90% | 207.7 -38% | 313.8 -6% |
| Write 4k QD32 (MB/s) | 200.9 | 261.2 30% | 73.9 -63% 73.9 -63% | 131.8 -34% | 96.8 -52% |

| 3DMark 11 - 1280x720 Performance GPU | |
| Dell Inspiron 13 5368 | |
| Acer Aspire R13 R7-372T-746N | |
| Lenovo Yoga 900-13ISK 80MK | |
| HP Spectre x360 13-4104ng | |
| HP Spectre x360 13-4104ng | |
| Asus Zenbook UX360CA-FC060T | |
| 3DMark - 1280x720 Cloud Gate Standard Graphics | |
| Dell Inspiron 13 5368 | |
| Acer Aspire R13 R7-372T-746N | |
| HP Spectre x360 13-4104ng | |
| HP Spectre x360 13-4104ng | |
| Lenovo Yoga 900-13ISK 80MK | |
| Asus Zenbook UX360CA-FC060T | |
| 3DMark 11 Performance | 1658 points | |
| 3DMark Cloud Gate Standard Score | 5937 points | |
Help | ||
| Rise of the Tomb Raider - 1024x768 Lowest Preset | |
| Dell Inspiron 13 5368 | |
| Asus VivoBook Flip TP301UA-DW006T | |
| Asus Zenbook UX360CA-FC060T | |
| BioShock Infinite - 1366x768 Medium Preset | |
| Dell Inspiron 13 5368 | |
| Acer Aspire R13 R7-372T-746N | |
| HP Spectre x360 13-4104ng | |
| Asus VivoBook Flip TP301UA-DW006T | |
| Asus Zenbook UX360CA-FC060T | |
| Thief - 1024x768 Very Low Preset | |
| Dell Inspiron 13 5368 | |
| Asus VivoBook Flip TP301UA-DW006T | |
| low | med. | high | ultra | |
|---|---|---|---|---|
| BioShock Infinite (2013) | 59.8 | 32.2 | 27.5 | |
| Thief (2014) | 24.3 | 15.1 | 12.6 | |
| Rise of the Tomb Raider (2016) | 17.3 | 11 |
Noise level
| Idle |
| 29 / 29 / 29 dB(A) |
| Load |
| 31 / 40.3 dB(A) |
 | ||
30 dB silent 40 dB(A) audible 50 dB(A) loud |
||
min: | ||
(±) The maximum temperature on the upper side is 41.6 °C / 107 F, compared to the average of 35.4 °C / 96 F, ranging from 19.6 to 60 °C for the class Convertible.
(-) The bottom heats up to a maximum of 45.9 °C / 115 F, compared to the average of 36.9 °C / 98 F
(+) In idle usage, the average temperature for the upper side is 29.9 °C / 86 F, compared to the device average of 30.3 °C / 87 F.
(+) The palmrests and touchpad are cooler than skin temperature with a maximum of 28.6 °C / 83.5 F and are therefore cool to the touch.
(±) The average temperature of the palmrest area of similar devices was 28 °C / 82.4 F (-0.6 °C / -1.1 F).
Dell Inspiron 13 5368 audio analysis
(+) | speakers can play relatively loud (84.6 dB)
Bass 100 - 315 Hz
(±) | reduced bass - on average 12.2% lower than median
(±) | linearity of bass is average (12.6% delta to prev. frequency)
Mids 400 - 2000 Hz
(±) | higher mids - on average 7.1% higher than median
(±) | linearity of mids is average (7.1% delta to prev. frequency)
Highs 2 - 16 kHz
(±) | reduced highs - on average 6.4% lower than median
(±) | linearity of highs is average (10.2% delta to prev. frequency)
Overall 100 - 16.000 Hz
(±) | linearity of overall sound is average (20.8% difference to median)
Compared to same class
» 55% of all tested devices in this class were better, 10% similar, 35% worse
» The best had a delta of 6%, average was 20%, worst was 57%
Compared to all devices tested
» 56% of all tested devices were better, 8% similar, 36% worse
» The best had a delta of 4%, average was 23%, worst was 134%
Acer Aspire R13 R7-372T-746N audio analysis
(±) | speaker loudness is average but good (75 dB)
Analysis not possible as minimum curve is missing or too high
| Off / Standby | |
| Idle | |
| Load |
|
Key:
min: | |
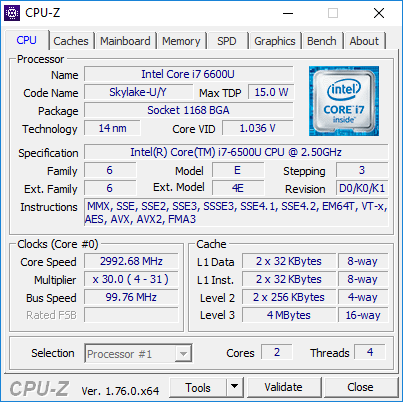
| Dell Inspiron 13 5368 6500U, HD Graphics 520, Toshiba THNSNK256GCS8, IPS, 1920x1080, 13.3" | Acer Aspire R13 R7-372T-746N 6500U, HD Graphics 520, Lite-On CV1-8B256, IPS, 2560x1440, 13.3" | HP Spectre x360 13-4104ng 6200U, HD Graphics 520, Samsung SSD PM851 256 GB MZNTE256HMHP, IPS, 2560x1440, 13.3" | Asus Zenbook UX360CA-FC060T 6Y30, HD Graphics 515, Lite-On CV1-8B128, IPS with 72% NTSC, 1920x1080, 13.3" | |
|---|---|---|---|---|
| Power Consumption | -39% | -6% | 13% | |
| Idle Minimum * (Watt) | 4.4 | 6.2 -41% | 3.9 11% | 3.4 23% |
| Idle Average * (Watt) | 6.1 | 8 -31% | 7.4 -21% | 7 -15% |
| Idle Maximum * (Watt) | 6.8 | 11.6 -71% | 9.2 -35% | 7.6 -12% |
| Load Average * (Watt) | 29 | 40 -38% | 28.1 3% | 19 34% |
| Load Maximum * (Watt) | 31.9 | 36.6 -15% | 27.6 13% | 20.1 37% |
* ... smaller is better
| Dell Inspiron 13 5368 6500U, HD Graphics 520, 42 Wh | Acer Aspire R13 R7-372T-746N 6500U, HD Graphics 520, 49 Wh | HP Spectre x360 13-4104ng 6200U, HD Graphics 520, 56 Wh | Asus Zenbook UX360CA-FC060T 6Y30, HD Graphics 515, 54 Wh | Lenovo Yoga 900-13ISK 80MK 6500U, HD Graphics 520, 66 Wh | |
|---|---|---|---|---|---|
| Battery runtime | 20% | 108% | 100% | 48% | |
| Reader / Idle (h) | 11.2 | 11.2 0% | 17.1 53% | 14.1 26% | |
| WiFi v1.3 (h) | 4 | 6.4 60% | 8.3 108% | 6.4 60% | 6.7 68% |
| Load (h) | 1.4 | 1.4 0% | 4 186% | 2.1 50% | |
| H.264 (h) | 6.6 |
Pros
Cons
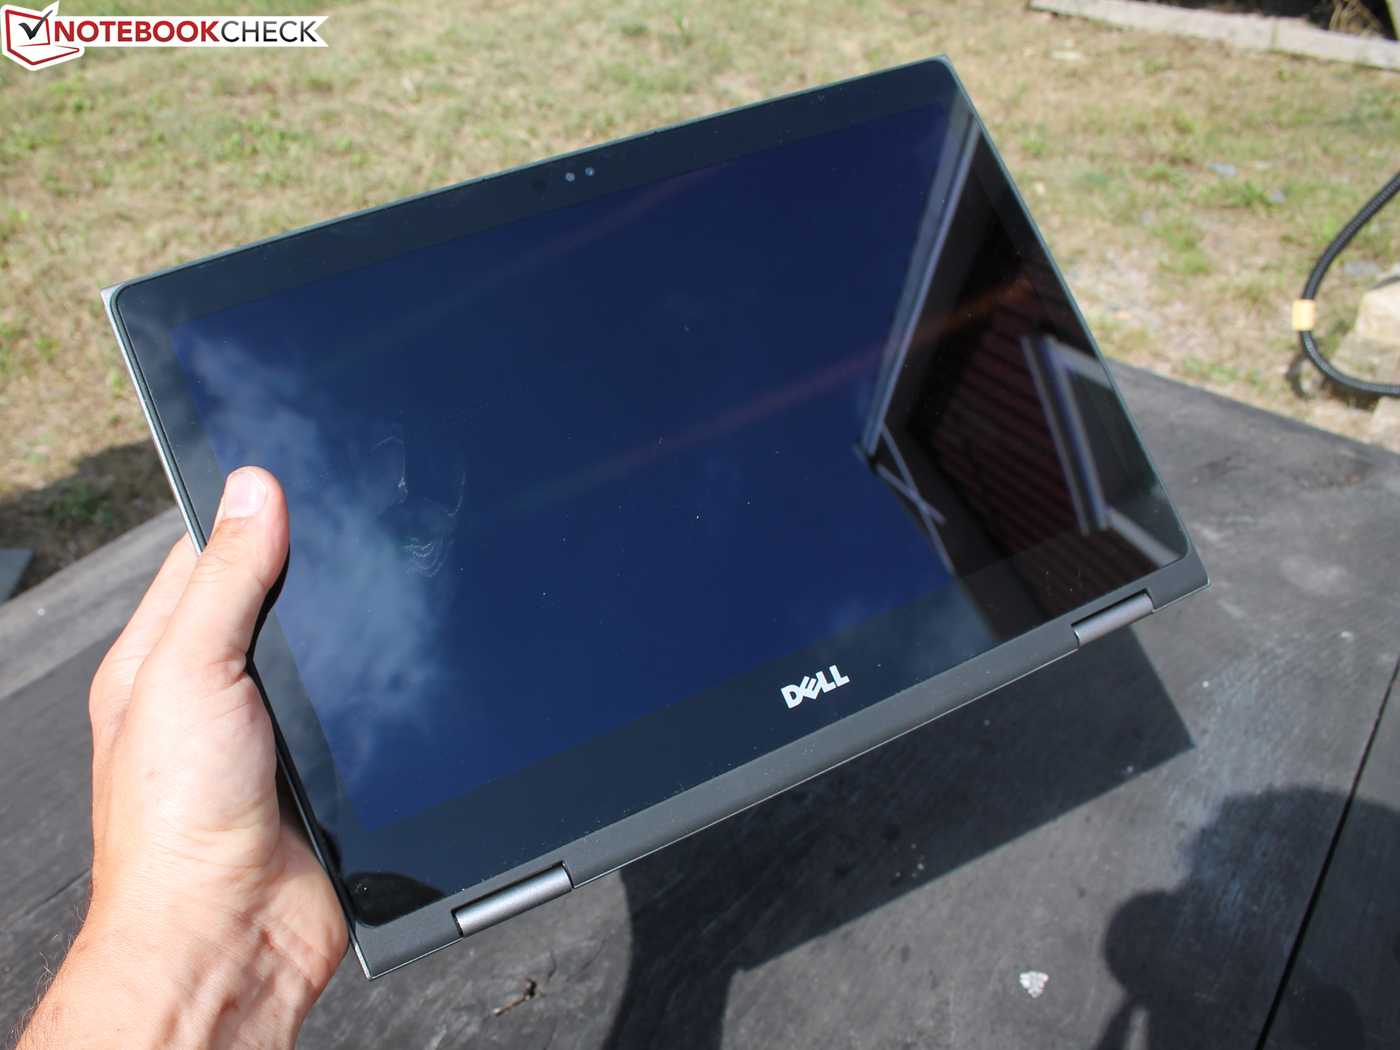
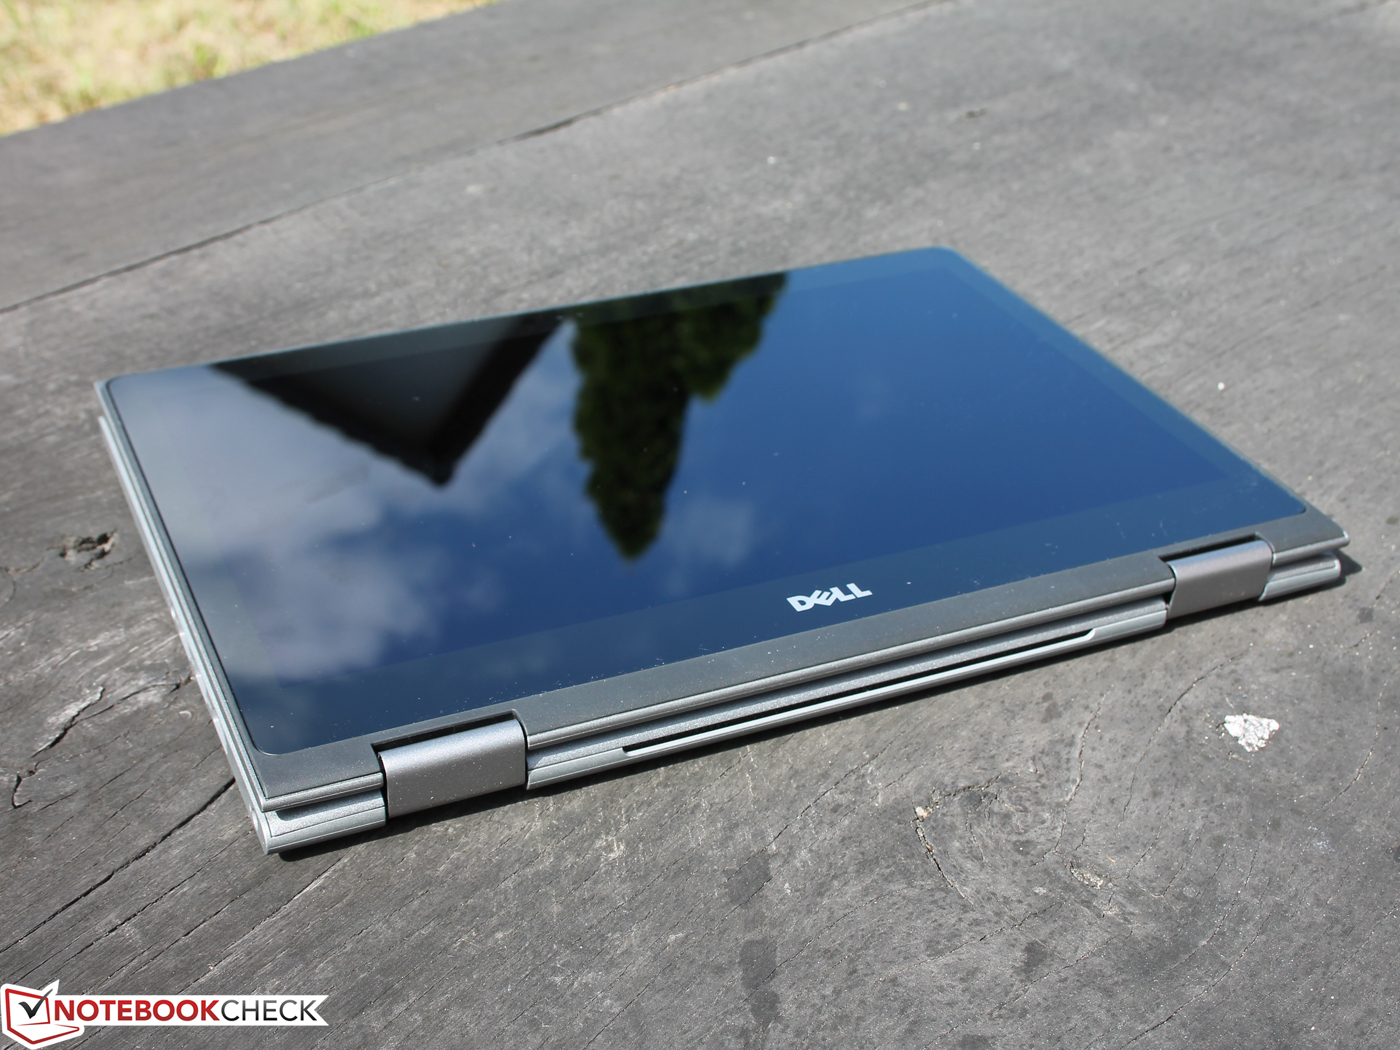
戴尔的Inspiron 13 5368没能得到最高的分数,它可能将无法进入我们的变形本Top 10排行榜。它的性能毫无弱点:酷睿i7处理器和固态硬盘可以超过所有的竞争对手,同时它的Turbo加速利用也十分不错。它的缺点首先出现在机身设计中:不够坚固的机身很难在平板模式中合严,它的键盘使用感受略差同时触控版键程也较短。另外,1.6千克的重量相对较高,屏幕亮度不是很高,而缺少USB-C型接口也让它受到了一些限制。尽管这些问题都不是不可忍受,但仍然影响了它的总分。戴尔Inspiron 13 5368的最大弱点是仅仅4小时的无线上网电池续航。其它同类产品都达到了6到8小时。
这些小问题集中在一起,掩盖了它在性能、可维护性和对比度不错的屏幕的优秀表现。整体上,它是一台性能优秀的全能型变形本,相比其它同类产品它1000欧元(约7484人民币)的售价有些过高。在这个方面,惠普Spectre x360 13和Acer Aspire R13 R7都提供了更好的机身品质。联想Yoga 900-13ISK也有更典雅的设计,但售价同样偏高。华硕Zenbook UX360CA-FC060T机身纤薄高质,但键盘噪音较大。
注:本文是基于完整评测的缩减版本,阅读完整的英文评测,请点击这里。
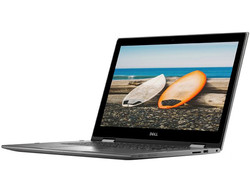
Dell Inspiron 13 5368
- 08/26/2016 v5.1 (old)
Sebastian Jentsch