惠普 Pavilion 17t (7700HQ, 超高清, GTX 1050) 笔记本电脑简短评测
| |||||||||||||||||||||||||
Brightness Distribution: 90 %
Center on Battery: 325.7 cd/m²
Contrast: 880:1 (Black: 0.37 cd/m²)
ΔE ColorChecker Calman: 6.5 | ∀{0.5-29.43 Ø4.73}
ΔE Greyscale Calman: 5.6 | ∀{0.09-98 Ø4.97}
100% sRGB (Argyll 1.6.3 3D)
87% AdobeRGB 1998 (Argyll 1.6.3 3D)
99.4% AdobeRGB 1998 (Argyll 3D)
99.9% sRGB (Argyll 3D)
87.1% Display P3 (Argyll 3D)
Gamma: 2.59
CCT: 5860 K
| HP Pavilion 17t-ab200 UHD AUO119B, IPS, 17.3", 3840x2160 | HP Pavilion 17t-ab200 AUO109D, IPS, 17.3", 1920x1080 | Gigabyte P57X v7 SHP145E, IPS, 17.3", 3840x2160 | MSI GT73VR 6RF IPS, 17.3", 3840x2160 | |
|---|---|---|---|---|
| Display | -24% | 0% | -22% | |
| Display P3 Coverage (%) | 87.1 | 65.2 -25% | 87.8 1% | 63.6 -27% |
| sRGB Coverage (%) | 99.9 | 87.6 -12% | 100 0% | 95.8 -4% |
| AdobeRGB 1998 Coverage (%) | 99.4 | 64.1 -36% | 98.9 -1% | 65.7 -34% |
| Response Times | 22% | -25% | 22% | |
| Response Time Grey 50% / Grey 80% * (ms) | 50.8 | 36.8 28% | 55.6 ? -9% | 33.6 ? 34% |
| Response Time Black / White * (ms) | 33.2 | 28 16% | 46.8 ? -41% | 30 ? 10% |
| PWM Frequency (Hz) | 1000 ? | |||
| Screen | -8% | 10% | -0% | |
| Brightness middle (cd/m²) | 325.7 | 278.8 -14% | 441.3 35% | 334.8 3% |
| Brightness (cd/m²) | 309 | 265 -14% | 408 32% | 316 2% |
| Brightness Distribution (%) | 90 | 91 1% | 86 -4% | 87 -3% |
| Black Level * (cd/m²) | 0.37 | 0.28 24% | 0.44 -19% | 0.422 -14% |
| Contrast (:1) | 880 | 996 13% | 1003 14% | 793 -10% |
| Colorchecker dE 2000 * | 6.5 | 5.8 11% | 5.1 22% | 4.11 37% |
| Colorchecker dE 2000 max. * | 9.6 | 10.6 -10% | 9.8 -2% | 7.8 19% |
| Greyscale dE 2000 * | 5.6 | 8.3 -48% | 4.3 23% | 5.74 -3% |
| Gamma | 2.59 85% | 2.1 105% | 2.08 106% | 2.3 96% |
| CCT | 5860 111% | 5723 114% | 7345 88% | 5987 109% |
| Color Space (Percent of AdobeRGB 1998) (%) | 87 | 57 -34% | 87 0% | 60.5 -30% |
| Color Space (Percent of sRGB) (%) | 100 | 87 -13% | 100 0% | 96 -4% |
| Total Average (Program / Settings) | -3% /
-8% | -5% /
3% | 0% /
-2% |
* ... smaller is better
Display Response Times
| ↔ Response Time Black to White | ||
|---|---|---|
| 33.2 ms ... rise ↗ and fall ↘ combined | ↗ ms rise | 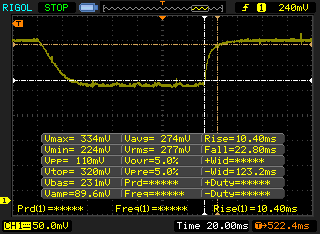 |
| ↘ ms fall | ||
| The screen shows slow response rates in our tests and will be unsatisfactory for gamers. In comparison, all tested devices range from 0.1 (minimum) to 240 (maximum) ms. » 90 % of all devices are better. This means that the measured response time is worse than the average of all tested devices (19.9 ms). | ||
| ↔ Response Time 50% Grey to 80% Grey | ||
| 50.8 ms ... rise ↗ and fall ↘ combined | ↗ ms rise | 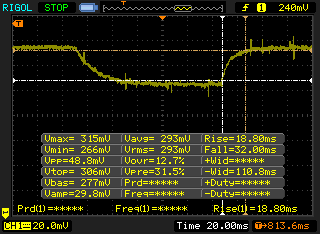 |
| ↘ ms fall | ||
| The screen shows slow response rates in our tests and will be unsatisfactory for gamers. In comparison, all tested devices range from 0.165 (minimum) to 636 (maximum) ms. » 87 % of all devices are better. This means that the measured response time is worse than the average of all tested devices (31.1 ms). | ||
Screen Flickering / PWM (Pulse-Width Modulation)
| Screen flickering / PWM not detected |  | ||
In comparison: 52 % of all tested devices do not use PWM to dim the display. If PWM was detected, an average of 7794 (minimum: 5 - maximum: 343500) Hz was measured. | |||
| Cinebench R11.5 | |
| CPU Single 64Bit | |
| MSI GT73VR 6RF | |
| HP Pavilion 17t-ab200 UHD | |
| Gigabyte P57X v7 | |
| HP Pavilion 17t-ab200 | |
| CPU Multi 64Bit | |
| MSI GT73VR 6RF | |
| HP Pavilion 17t-ab200 | |
| Gigabyte P57X v7 | |
| HP Pavilion 17t-ab200 UHD | |
| wPrime 2.10 - 1024m | |
| Gigabyte P57X v7 | |
| HP Pavilion 17t-ab200 UHD | |
| HP Pavilion 17t-ab200 | |
* ... smaller is better
| PCMark 8 | |
| Home Score Accelerated v2 | |
| MSI GT73VR 6RF | |
| HP Pavilion 17t-ab200 | |
| Gigabyte P57X v7 | |
| HP Pavilion 17t-ab200 UHD | |
| Acer Aspire V17 Nitro BE VN7-793G-706L | |
| Work Score Accelerated v2 | |
| HP Pavilion 17t-ab200 | |
| MSI GT73VR 6RF | |
| Gigabyte P57X v7 | |
| HP Pavilion 17t-ab200 UHD | |
| Creative Score Accelerated v2 | |
| MSI GT73VR 6RF | |
| HP Pavilion 17t-ab200 | |
| Gigabyte P57X v7 | |
| HP Pavilion 17t-ab200 UHD | |
| PCMark 8 Home Score Accelerated v2 | 3056 points | |
| PCMark 8 Creative Score Accelerated v2 | 4516 points | |
| PCMark 8 Work Score Accelerated v2 | 2213 points | |
Help | ||
| HP Pavilion 17t-ab200 UHD Intel SSD 600p SSDPEKKW256G7 | HP Pavilion 17t-ab200 Samsung CM871a MZNTY128HDHP | Gigabyte P57X v7 Transcend MTS800 256GB M.2 (TS256GMTS800) | Acer Aspire V17 Nitro BE VN7-793G-706L Toshiba NVMe THNSN5512GPU7 | MSI GT73VR 6RF 2x SanDisk X400 1TB M.2 SD8SN8U1T001122 (RAID 0) | |
|---|---|---|---|---|---|
| CrystalDiskMark 3.0 | -16% | -19% | 59% | 50% | |
| Read Seq (MB/s) | 1076 | 520 -52% | 517 -52% | 1172 9% | 914 -15% |
| Write Seq (MB/s) | 263.2 | 353.6 34% | 305.7 16% | 1073 308% | 916 248% |
| Read 512 (MB/s) | 695 | 376.2 -46% | 315 -55% | 760 9% | 698 0% |
| Write 512 (MB/s) | 472.3 | 118.5 -75% | 306.1 -35% | 878 86% | 916 94% |
| Read 4k (MB/s) | 20.09 | 32.7 63% | 26.04 30% | 21.04 5% | 31.37 56% |
| Write 4k (MB/s) | 116.2 | 85.3 -27% | 82.3 -29% | 59.8 -49% | 65.7 -43% |
| Read 4k QD32 (MB/s) | 282.7 | 399 41% | 281.3 0% | 573 103% | 425 50% |
| Write 4k QD32 (MB/s) | 405.2 | 132.5 -67% | 296 -27% | 419.8 4% | 441.8 9% |

| 3DMark 11 | |
| 1280x720 Performance GPU | |
| MSI GT73VR 6RF | |
| Gigabyte P57X v7 | |
| Acer Aspire V17 Nitro BE VN7-793G-706L | |
| HP Pavilion 17t-ab200 UHD | |
| HP Pavilion 17t-ab200 | |
| 1280x720 Performance Combined | |
| Gigabyte P57X v7 | |
| MSI GT73VR 6RF | |
| HP Pavilion 17t-ab200 | |
| HP Pavilion 17t-ab200 UHD | |
| Acer Aspire V17 Nitro BE VN7-793G-706L | |
| 3DMark | |
| 1280x720 Cloud Gate Standard Graphics | |
| MSI GT73VR 6RF | |
| Gigabyte P57X v7 | |
| HP Pavilion 17t-ab200 | |
| Acer Aspire V17 Nitro BE VN7-793G-706L | |
| HP Pavilion 17t-ab200 UHD | |
| 1920x1080 Fire Strike Graphics | |
| MSI GT73VR 6RF | |
| Gigabyte P57X v7 | |
| Acer Aspire V17 Nitro BE VN7-793G-706L | |
| HP Pavilion 17t-ab200 UHD | |
| HP Pavilion 17t-ab200 | |
| 3DMark 06 Standard Score | 25817 points | |
| 3DMark 11 Performance | 7554 points | |
| 3DMark Ice Storm Standard Score | 11692 points | |
| 3DMark Cloud Gate Standard Score | 11173 points | |
| 3DMark Fire Strike Score | 5383 points | |
Help | ||
| Rise of the Tomb Raider - 3840x2160 High Preset AA:FX AF:4x (sort by value) | |
| HP Pavilion 17t-ab200 UHD | |
| Gigabyte P57X v7 | |
| Acer Aspire V17 Nitro BE VN7-793G-706L | |
| MSI GT73VR 6RF | |
| Doom - 3840x2160 High Preset AA:FX (sort by value) | |
| HP Pavilion 17t-ab200 UHD | |
| MSI GT73VR 6RF | |
| Batman: Arkham Knight - 3840x2160 High / On (Interactive Smoke & Paper Debris Off) AA:SM AF:8x (sort by value) | |
| HP Pavilion 17t-ab200 UHD | |
| Gigabyte P57X v7 | |
| MSI GT73VR 6RF | |
| low | med. | high | ultra | 4K | |
|---|---|---|---|---|---|
| Batman: Arkham Knight (2015) | 13 | ||||
| Rise of the Tomb Raider (2016) | 12 | ||||
| Doom (2016) | 15 |
Noise level
| Idle |
| 34.5 / 34.5 / 36.6 dB(A) |
| DVD |
| 36.6 / dB(A) |
| Load |
| 46.6 / 52.3 dB(A) |
 | ||
30 dB silent 40 dB(A) audible 50 dB(A) loud |
||
min: | ||
| HP Pavilion 17t-ab200 UHD GeForce GTX 1050 Mobile, i7-7700HQ, Intel SSD 600p SSDPEKKW256G7 | HP Pavilion 17t-ab200 GeForce GTX 1050 Mobile, i7-7700HQ, Samsung CM871a MZNTY128HDHP | Gigabyte P57X v7 GeForce GTX 1070 Mobile, i7-7700HQ, Transcend MTS800 256GB M.2 (TS256GMTS800) | MSI GT73VR 6RF GeForce GTX 1080 Mobile, 6820HK, 2x SanDisk X400 1TB M.2 SD8SN8U1T001122 (RAID 0) | |
|---|---|---|---|---|
| Noise | -1% | 6% | -2% | |
| off / environment * (dB) | 29.6 | 30.8 -4% | 29 2% | 29.2 1% |
| Idle Minimum * (dB) | 34.5 | 35.3 -2% | 30.4 12% | 32 7% |
| Idle Average * (dB) | 34.5 | 35.4 -3% | 32.1 7% | 32 7% |
| Idle Maximum * (dB) | 36.6 | 35.4 3% | 32.1 12% | 35 4% |
| Load Average * (dB) | 46.6 | 48.6 -4% | 45.6 2% | 50 -7% |
| Load Maximum * (dB) | 52.3 | 49.8 5% | 51.5 2% | 64 -22% |
* ... smaller is better
(-) The maximum temperature on the upper side is 48.8 °C / 120 F, compared to the average of 36.8 °C / 98 F, ranging from 21 to 71 °C for the class Multimedia.
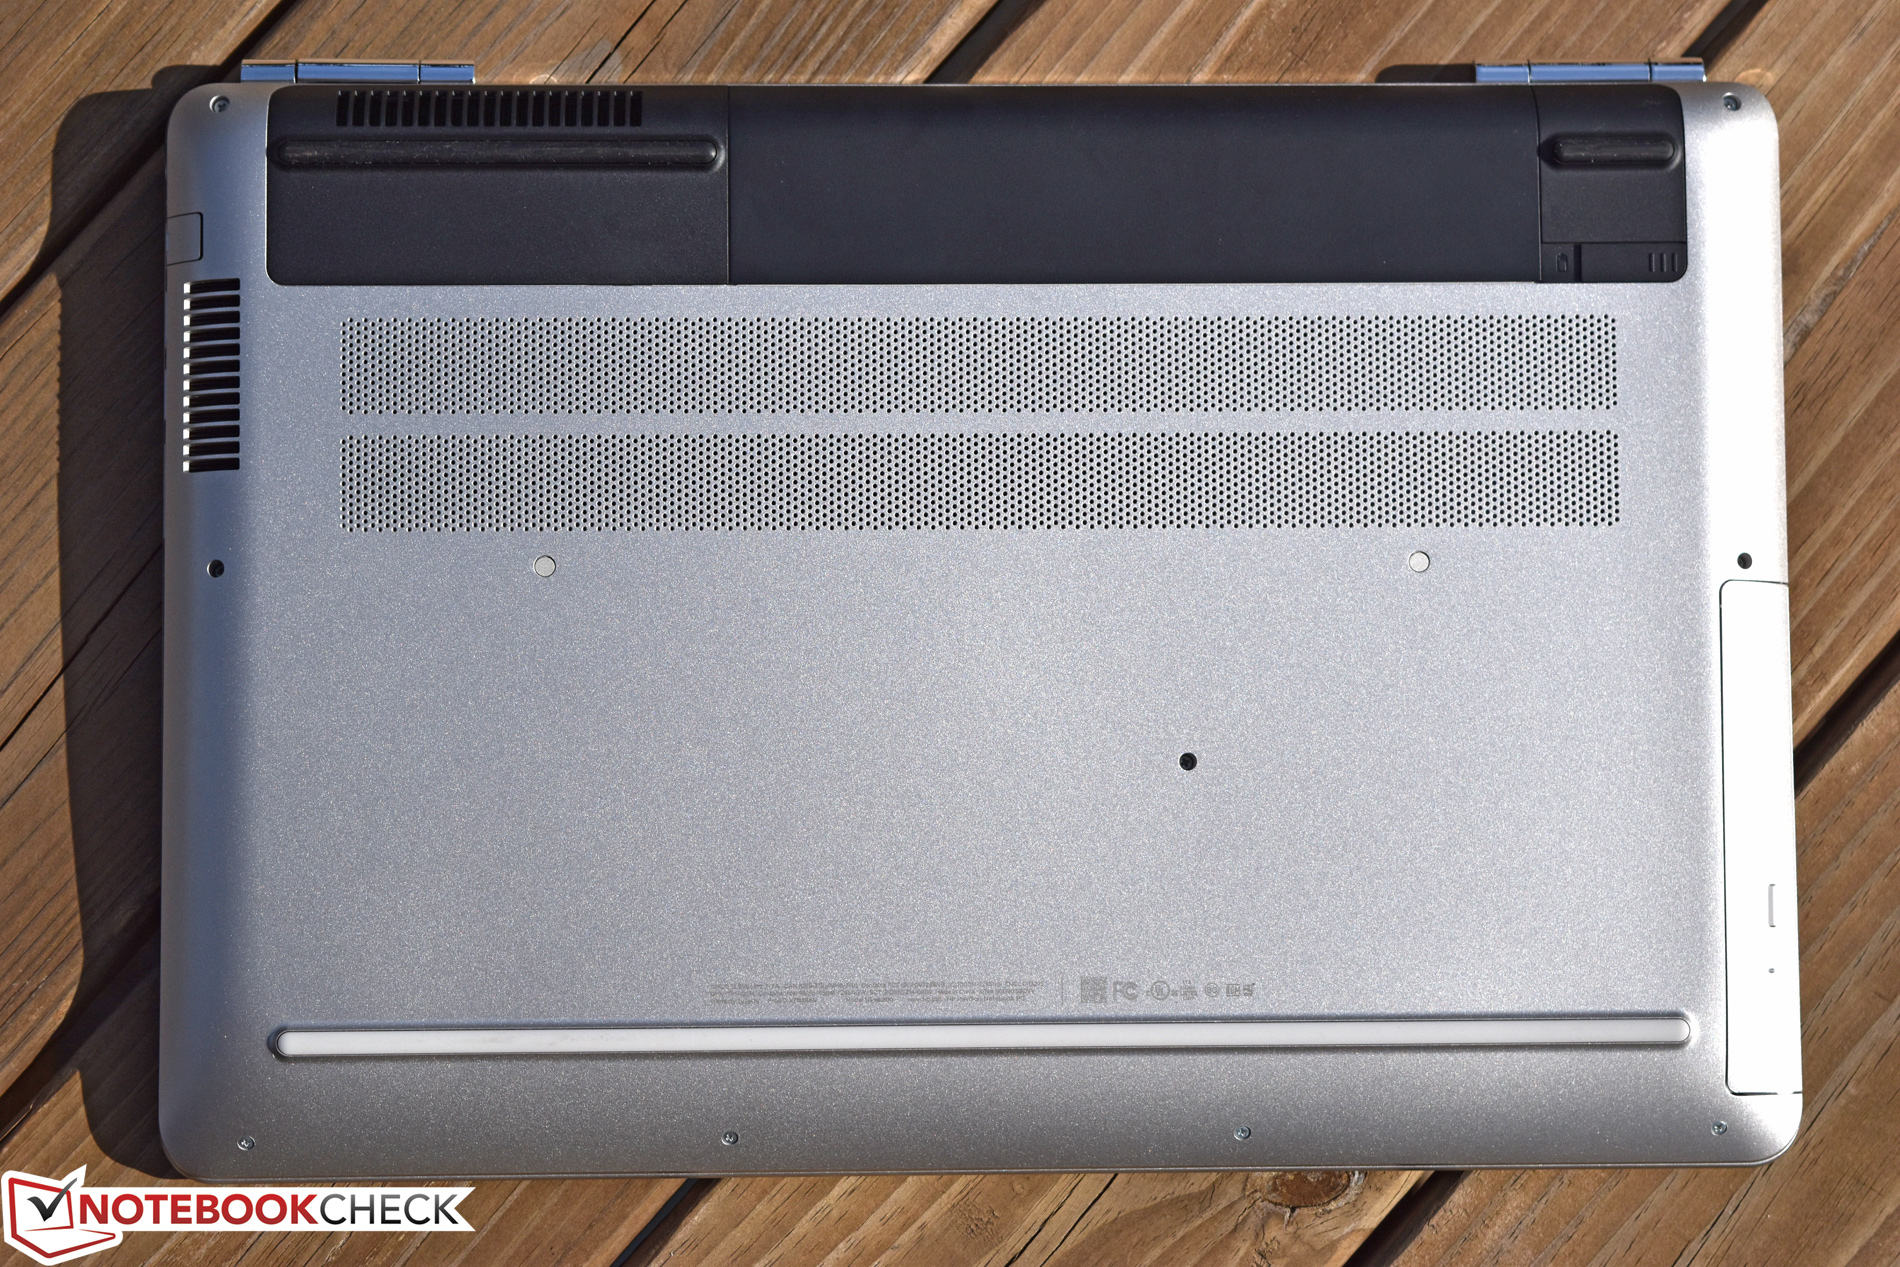
(+) The bottom heats up to a maximum of 38.4 °C / 101 F, compared to the average of 39.1 °C / 102 F
(+) In idle usage, the average temperature for the upper side is 22.2 °C / 72 F, compared to the device average of 31.3 °C / 88 F.
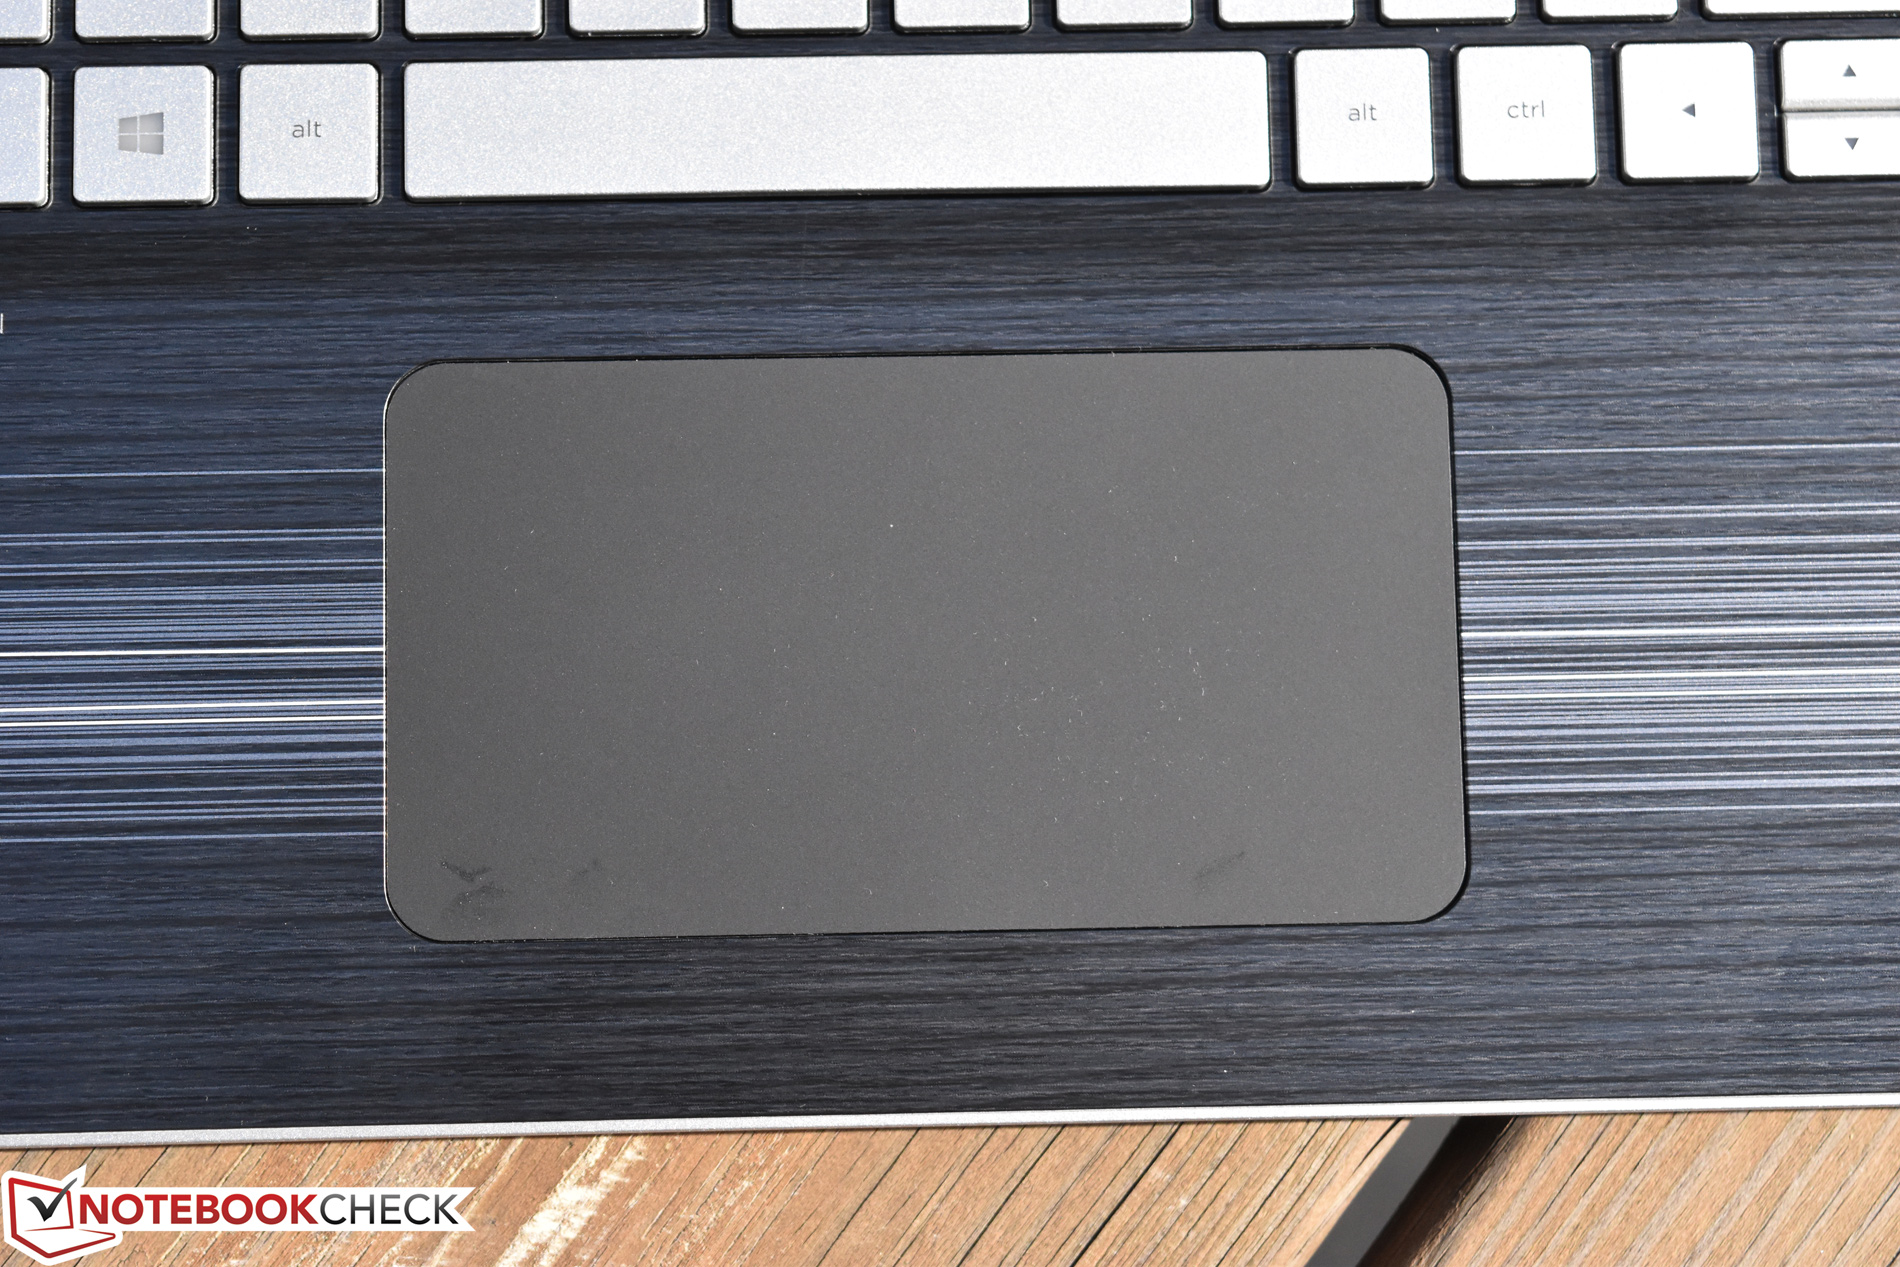
(+) The palmrests and touchpad are cooler than skin temperature with a maximum of 31 °C / 87.8 F and are therefore cool to the touch.
(-) The average temperature of the palmrest area of similar devices was 28.7 °C / 83.7 F (-2.3 °C / -4.1 F).
HP Pavilion 17t-ab200 UHD audio analysis
(±) | speaker loudness is average but good (73.9 dB)
Bass 100 - 315 Hz
(±) | reduced bass - on average 13.3% lower than median
(±) | linearity of bass is average (10.8% delta to prev. frequency)
Mids 400 - 2000 Hz
(+) | balanced mids - only 3.1% away from median
(+) | mids are linear (5.4% delta to prev. frequency)
Highs 2 - 16 kHz
(+) | balanced highs - only 3.5% away from median
(±) | linearity of highs is average (7.8% delta to prev. frequency)
Overall 100 - 16.000 Hz
(±) | linearity of overall sound is average (23.7% difference to median)
Compared to same class
» 83% of all tested devices in this class were better, 6% similar, 10% worse
» The best had a delta of 5%, average was 17%, worst was 45%
Compared to all devices tested
» 71% of all tested devices were better, 6% similar, 23% worse
» The best had a delta of 4%, average was 24%, worst was 134%
MSI GT73VR 6RF audio analysis
(±) | speaker loudness is average but good (79.1 dB)
Bass 100 - 315 Hz
(±) | reduced bass - on average 8.2% lower than median
(±) | linearity of bass is average (8% delta to prev. frequency)
Mids 400 - 2000 Hz
(+) | balanced mids - only 3.3% away from median
(+) | mids are linear (6.4% delta to prev. frequency)
Highs 2 - 16 kHz
(+) | balanced highs - only 4.6% away from median
(±) | linearity of highs is average (9.9% delta to prev. frequency)
Overall 100 - 16.000 Hz
(±) | linearity of overall sound is average (19.9% difference to median)
Compared to same class
» 70% of all tested devices in this class were better, 6% similar, 24% worse
» The best had a delta of 6%, average was 18%, worst was 132%
Compared to all devices tested
» 51% of all tested devices were better, 7% similar, 42% worse
» The best had a delta of 4%, average was 24%, worst was 134%
| Off / Standby | |
| Idle | |
| Load |
|
Key:
min: | |
| HP Pavilion 17t-ab200 UHD i7-7700HQ, GeForce GTX 1050 Mobile, Intel SSD 600p SSDPEKKW256G7, IPS, 3840x2160, 17.3" | HP Pavilion 17t-ab200 i7-7700HQ, GeForce GTX 1050 Mobile, Samsung CM871a MZNTY128HDHP, IPS, 1920x1080, 17.3" | Gigabyte P57X v7 i7-7700HQ, GeForce GTX 1070 Mobile, Transcend MTS800 256GB M.2 (TS256GMTS800), IPS, 3840x2160, 17.3" | MSI GT73VR 6RF 6820HK, GeForce GTX 1080 Mobile, 2x SanDisk X400 1TB M.2 SD8SN8U1T001122 (RAID 0), IPS, 3840x2160, 17.3" | |
|---|---|---|---|---|
| Power Consumption | 24% | -62% | -122% | |
| Idle Minimum * (Watt) | 13.3 | 8.2 38% | 15.7 -18% | 28.9 -117% |
| Idle Average * (Watt) | 18.5 | 11 41% | 23.4 -26% | 30.6 -65% |
| Idle Maximum * (Watt) | 19 | 11.1 42% | 23.5 -24% | 33.1 -74% |
| Load Average * (Watt) | 78 | 77 1% | 184.6 -137% | 224.4 -188% |
| Load Maximum * (Watt) | 113.4 | 116.9 -3% | 233.1 -106% | 302.6 -167% |
* ... smaller is better
| HP Pavilion 17t-ab200 UHD i7-7700HQ, GeForce GTX 1050 Mobile, 63 Wh | HP Pavilion 17t-ab200 i7-7700HQ, GeForce GTX 1050 Mobile, 62 Wh | Gigabyte P57X v7 i7-7700HQ, GeForce GTX 1070 Mobile, 75.81 Wh | Acer Aspire V17 Nitro BE VN7-793G-706L i7-7700HQ, GeForce GTX 1060 Mobile, 69 Wh | MSI GT73VR 6RF 6820HK, GeForce GTX 1080 Mobile, 75.2 Wh | |
|---|---|---|---|---|---|
| Battery runtime | 31% | -28% | -21% | -32% | |
| Reader / Idle (h) | 8.9 | 11.5 29% | 4.3 -52% | 5.1 -43% | |
| WiFi v1.3 (h) | 4.8 | 6.8 42% | 2.6 -46% | 3.8 -21% | 3.3 -31% |
| Load (h) | 1.4 | 1.7 21% | 1.6 14% | 1.1 -21% |
Pros
Cons

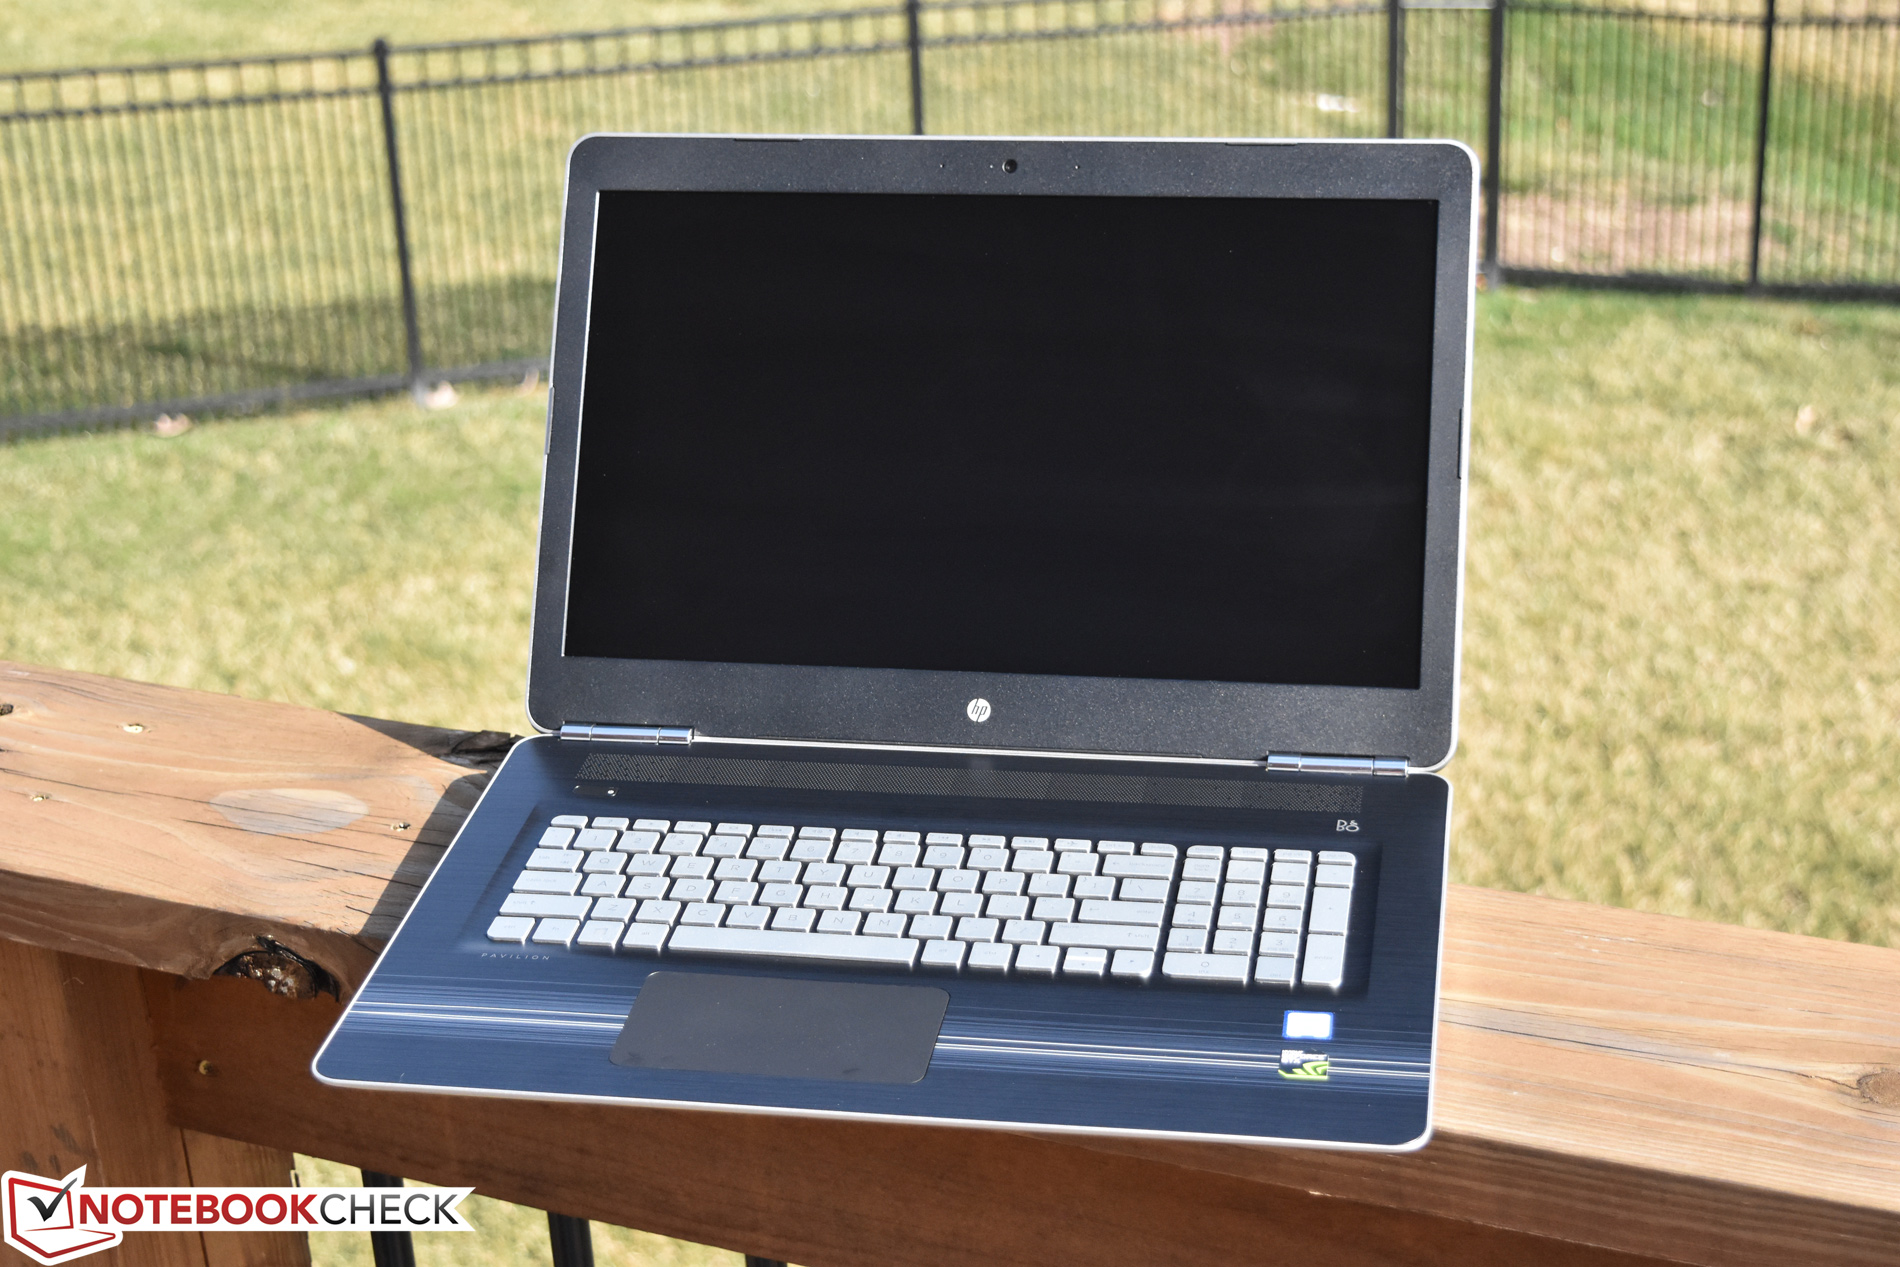
我们上个月评测的Pavilion 17t,通过对比,可以说对于高预算发烧级游戏玩家,它似乎是一个合理的备选方案。而这个最新型号笔记本更是在优缺点上更加偏激,抢眼。虽然显卡和其他大部分组件与以前的配置保持一致,但一些电源/固件的限制导致了它比1080p机型性能更低,虽然更高分辨率的屏幕更具吸引力,但也意味着不可能依靠GTX1050达到原本的显示设置和帧率。这可以说是一个很好的例子——获得意味着失去。市场中那些对Pavilion 17t感兴趣的用户,可能没有任何理由支付更高的价格来获取在游戏中无法真正被利用的屏幕升级。
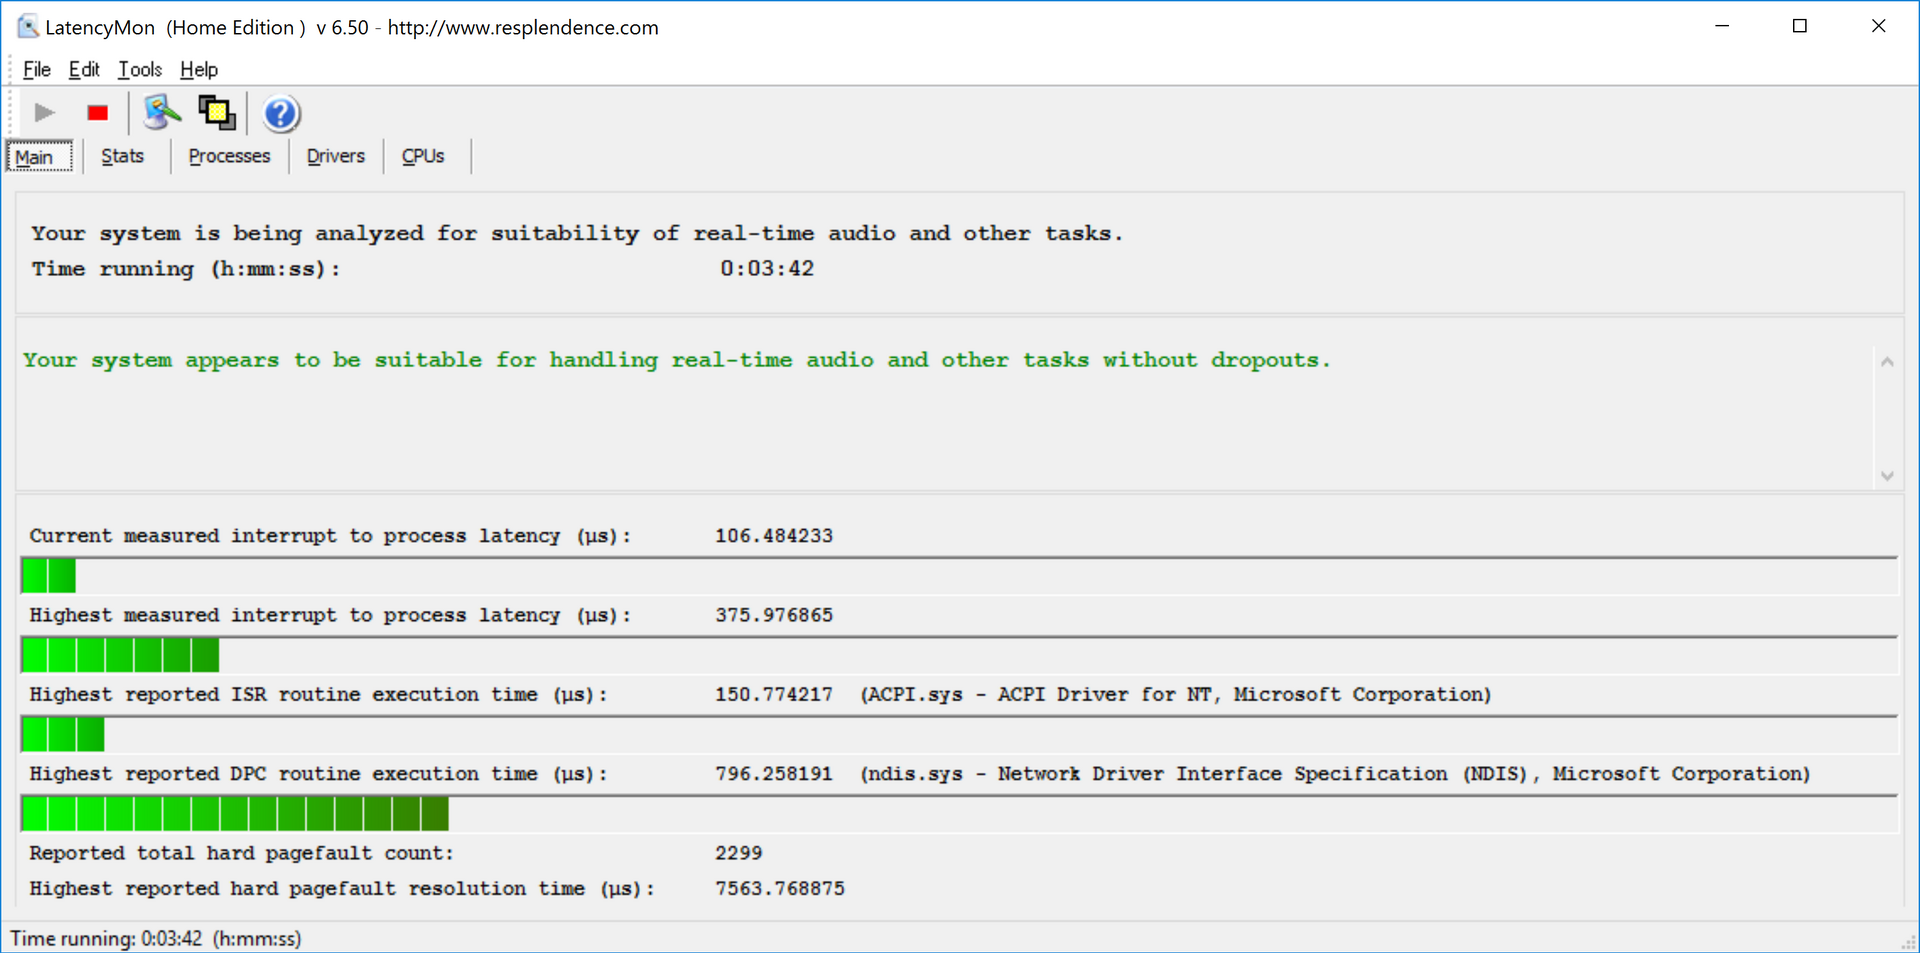
然后是关于照片和视频编辑爱好者的问题,因为超高清面板确实提供非常好的色域覆盖和比1080p型号更好的亮度和分辨率。然而,存在更好的机器能满足这些优点,并且考虑到我们在测试期间17t所遇到的相对严重的稳定性问题(包括性能卡顿,即使在固件升级后,它仍然在某种程度上存在)。假如想要重新投入一笔适度的投资来支持照片或视频编辑,您明智的做法是,不要为购买有相关问题的设备,无论能省下多少钱。
考虑到其无数问题,如果仍然要选择Pavilion 17t,那么用户迫切需要应用 BIOS F.35 REV A 来纠正一些最明显的稳定性问题。
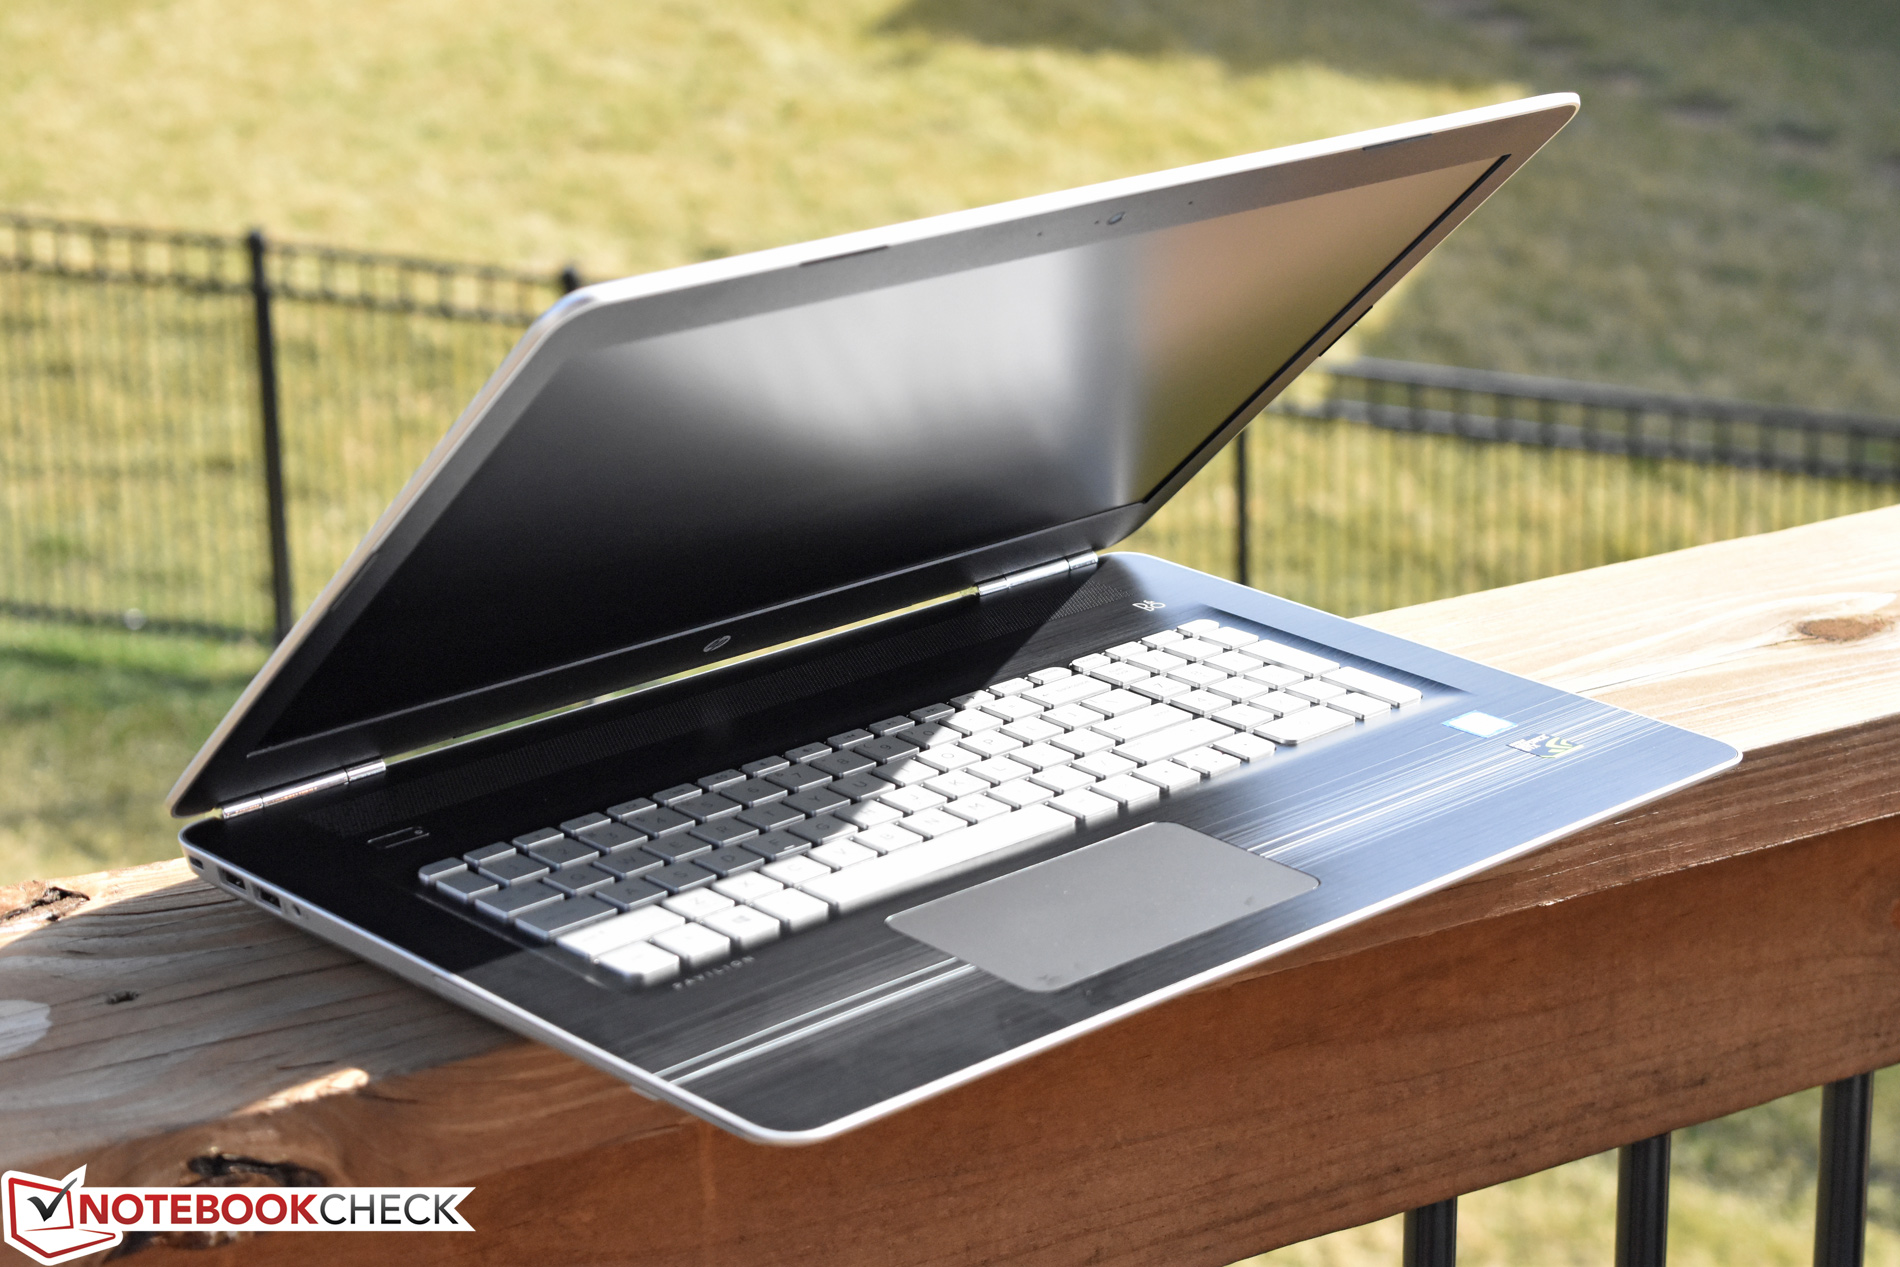
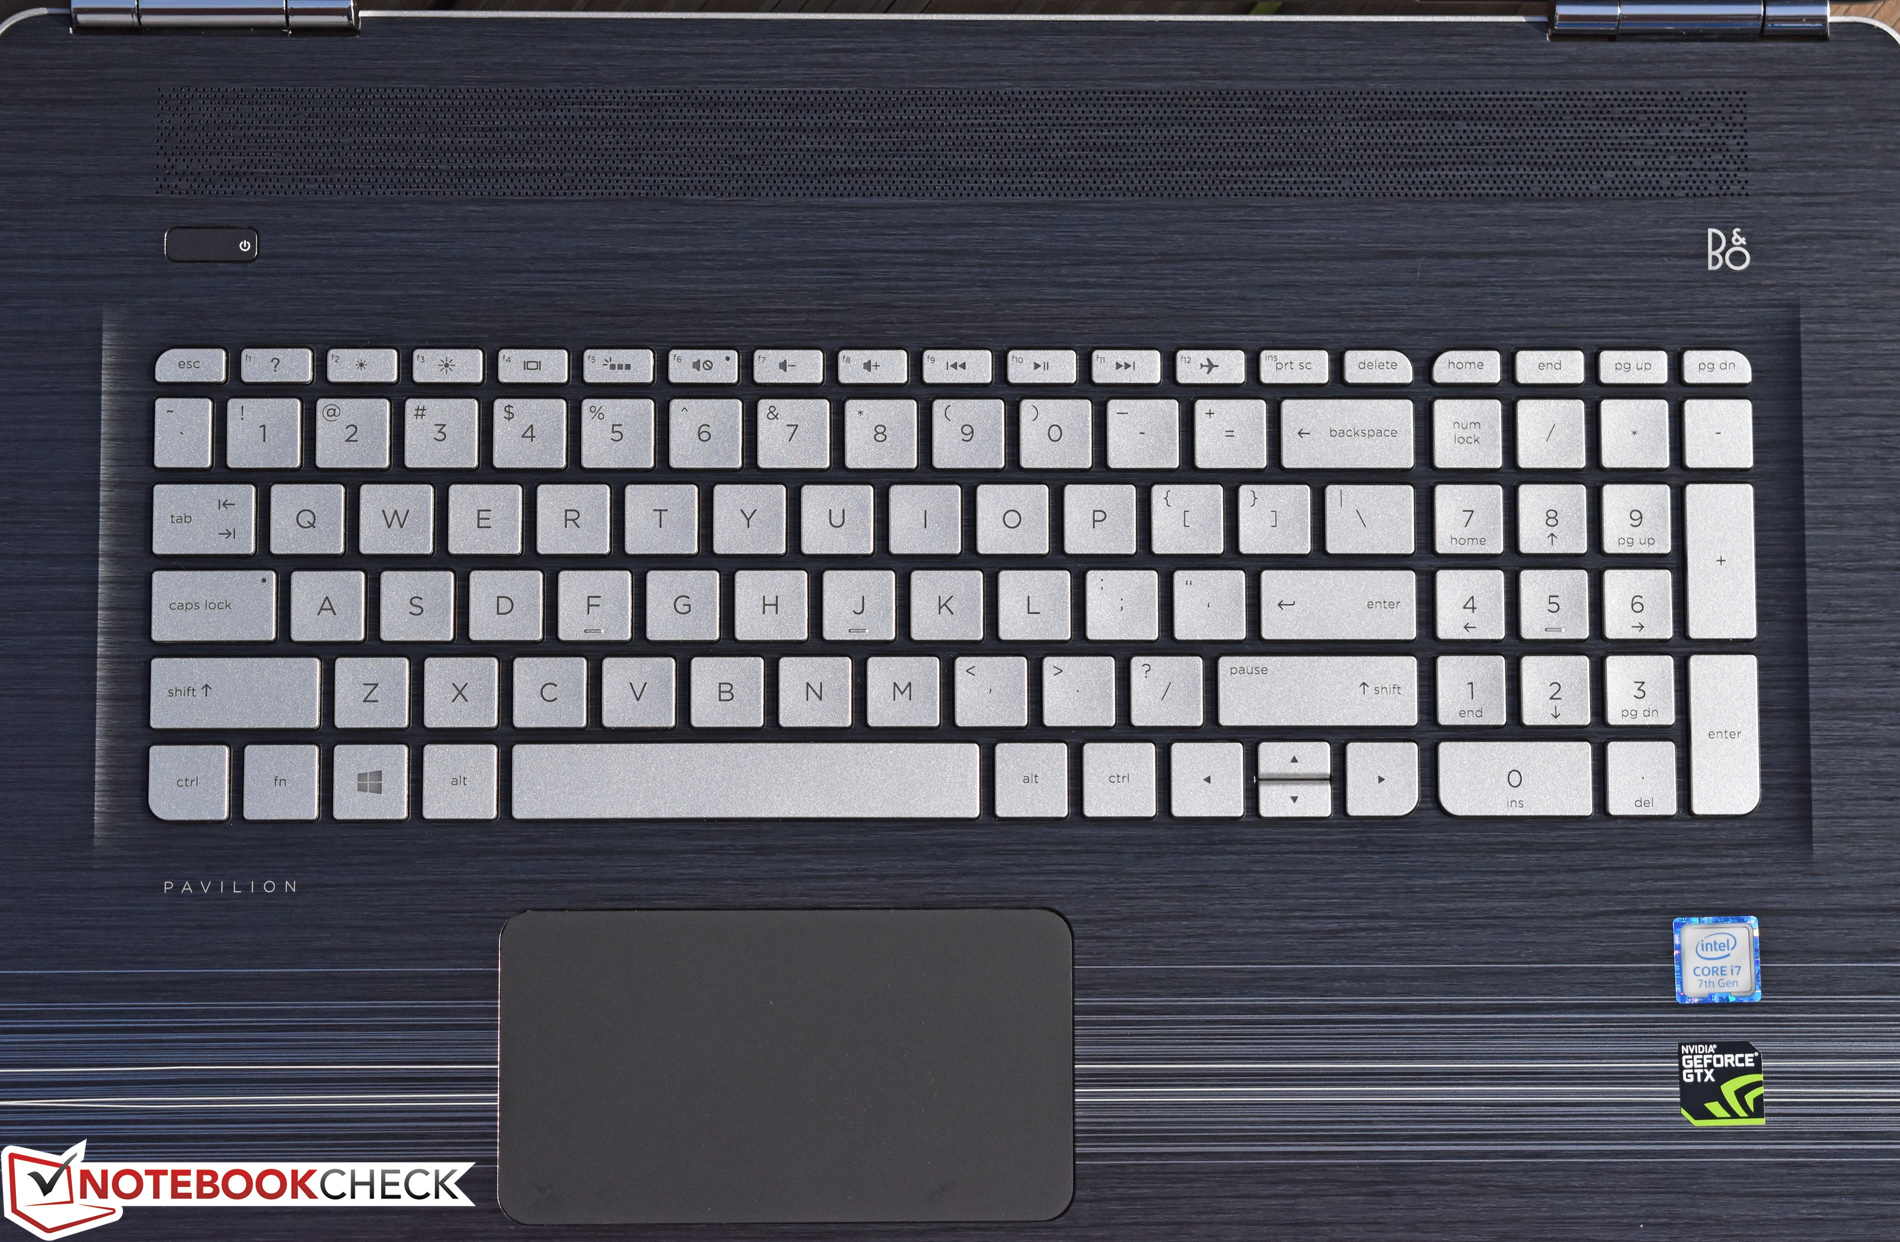
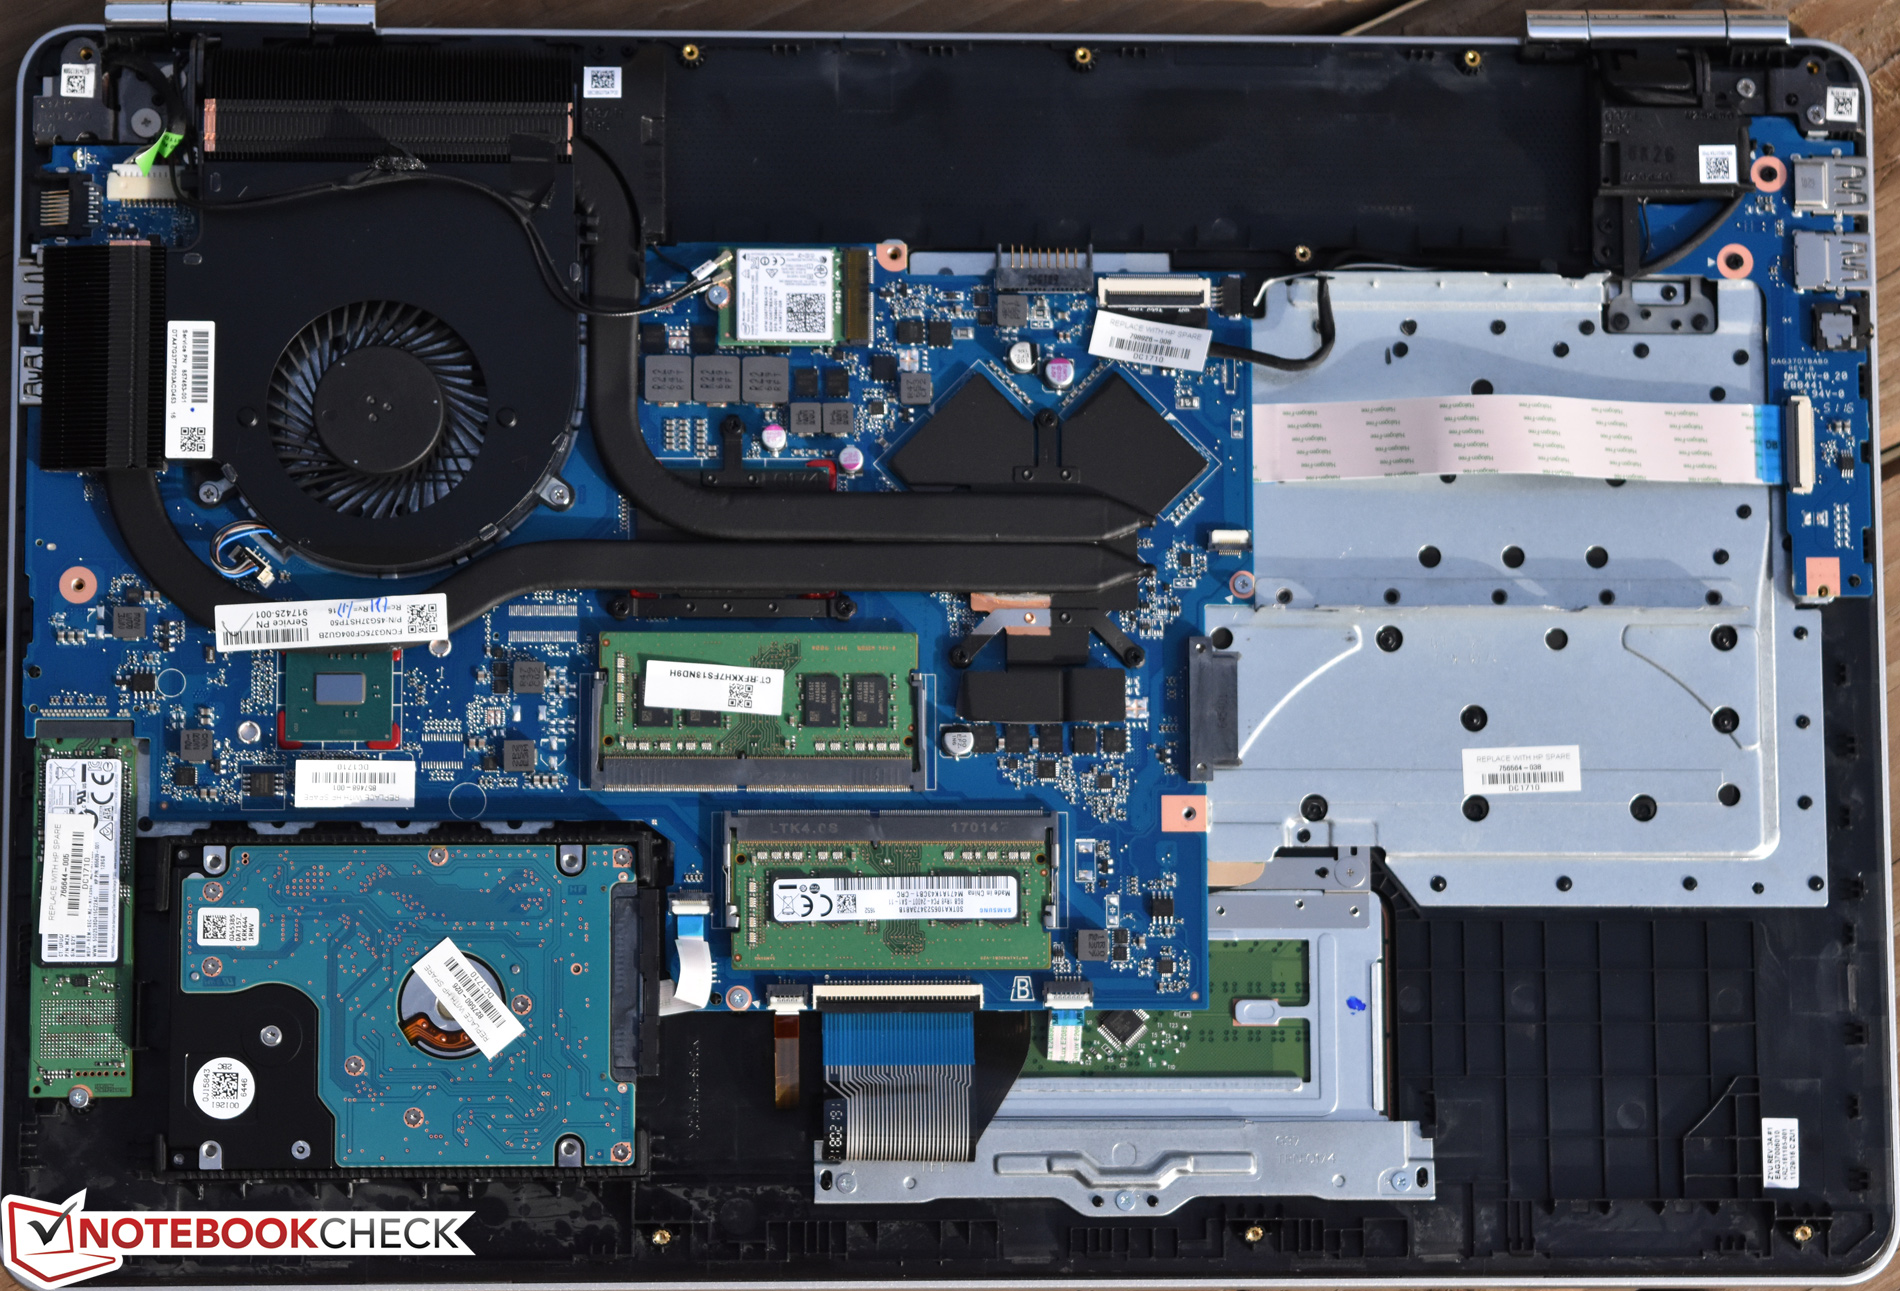
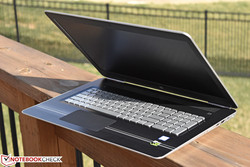
And l我们不要忘记所有其他的缺点,包括薄的塑料外壳,难以维护,触摸板差,端口选择差,操作噪音等。最重要的是,您甚至不必再看其他惠普机器,去寻找到更好选择--从惠普 Spectre to a 戴尔 XPS 15 或联想 Yoga 720,虽然价格更昂贵,但都是更好的选择。 Pavilion 17t是一台我们希望您忽略的笔记本电脑。
注:本文是基于完整评测的缩减版本,阅读完整的英文评测,请点击这里。
HP Pavilion 17t-ab200 UHD
- 03/27/2017 v6 (old)
Steve Schardein
Price comparison
