Nexoc G734IV (蓝天 P670HS-G) 笔记本电脑简短评测
| SD Card Reader | |
| average JPG Copy Test (av. of 3 runs) | |
| MSI GT72VR 7RE-433 | |
| Acer Predator 17 G9-793-77LG | |
| Nexoc G734III | |
| Gigabyte P57X v6 | |
| HP Omen 17-w110ng | |
| Nexoc G734IV | |
| maximum AS SSD Seq Read Test (1GB) | |
| MSI GT72VR 7RE-433 | |
| Gigabyte P57X v6 | |
| Acer Predator 17 G9-793-77LG | |
| Nexoc G734IV | |
| HP Omen 17-w110ng | |
| Nexoc G734III | |
| Networking | |
| iperf3 transmit AX12 | |
| MSI GT72VR 7RE-433 | |
| HP Omen 17-w110ng | |
| Nexoc G734IV | |
| iperf3 receive AX12 | |
| Nexoc G734IV | |
| HP Omen 17-w110ng | |
| MSI GT72VR 7RE-433 | |
| |||||||||||||||||||||||||
Brightness Distribution: 91 %
Center on Battery: 348 cd/m²
Contrast: 1088:1 (Black: 0.32 cd/m²)
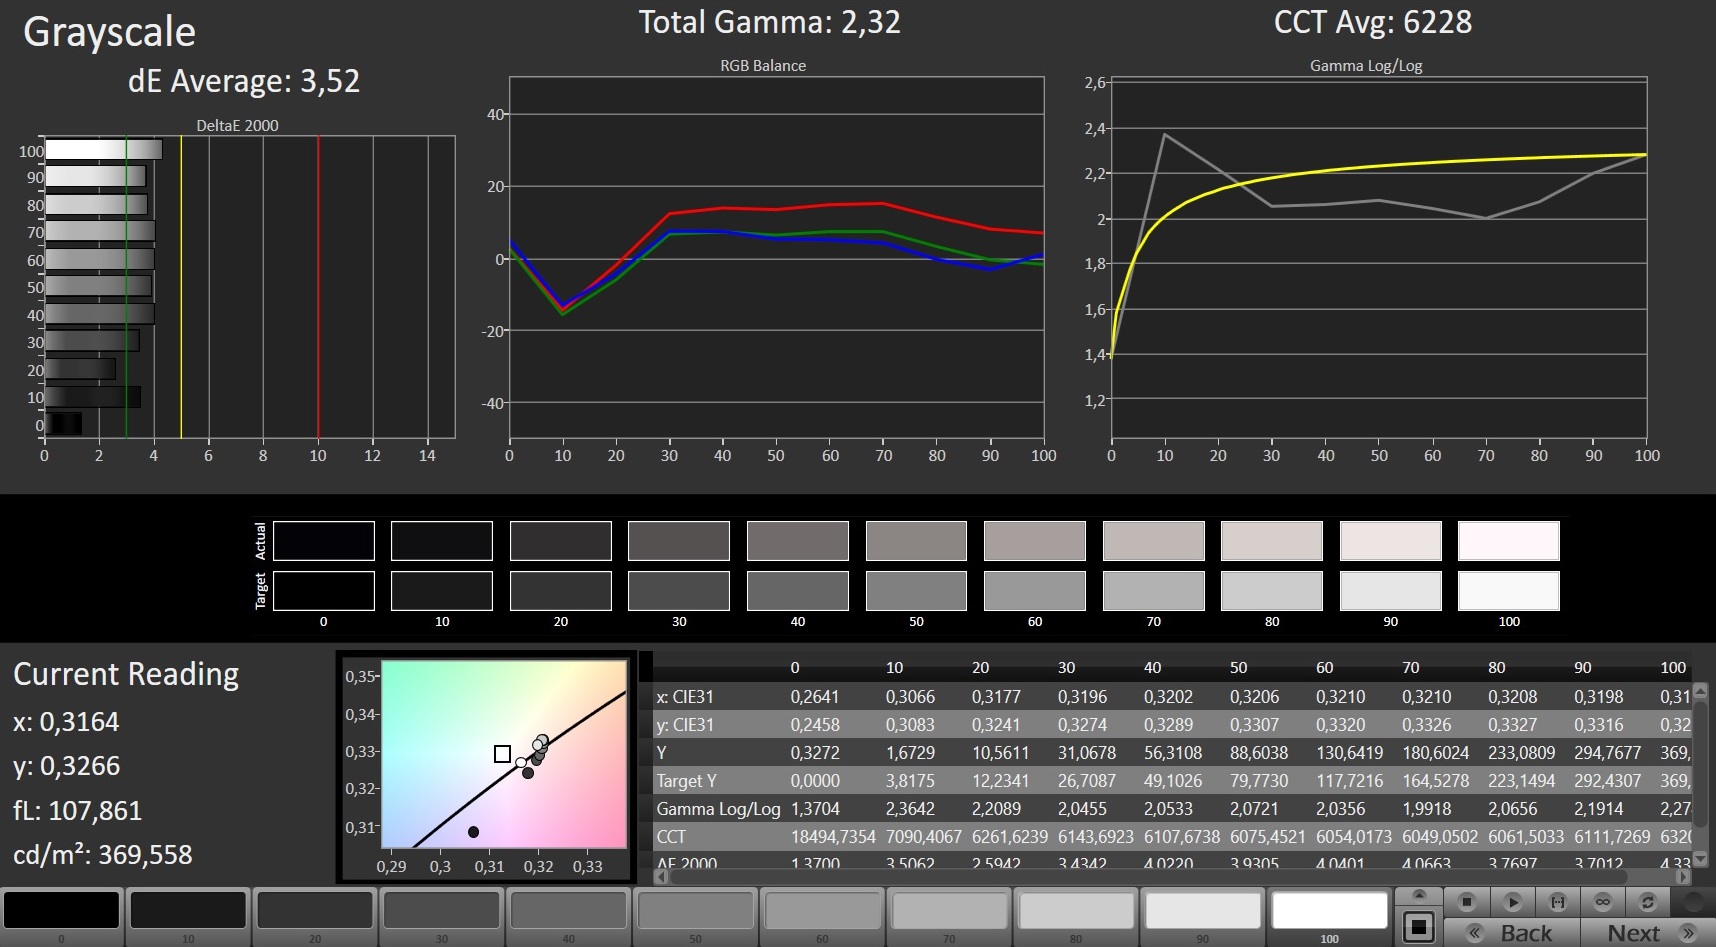
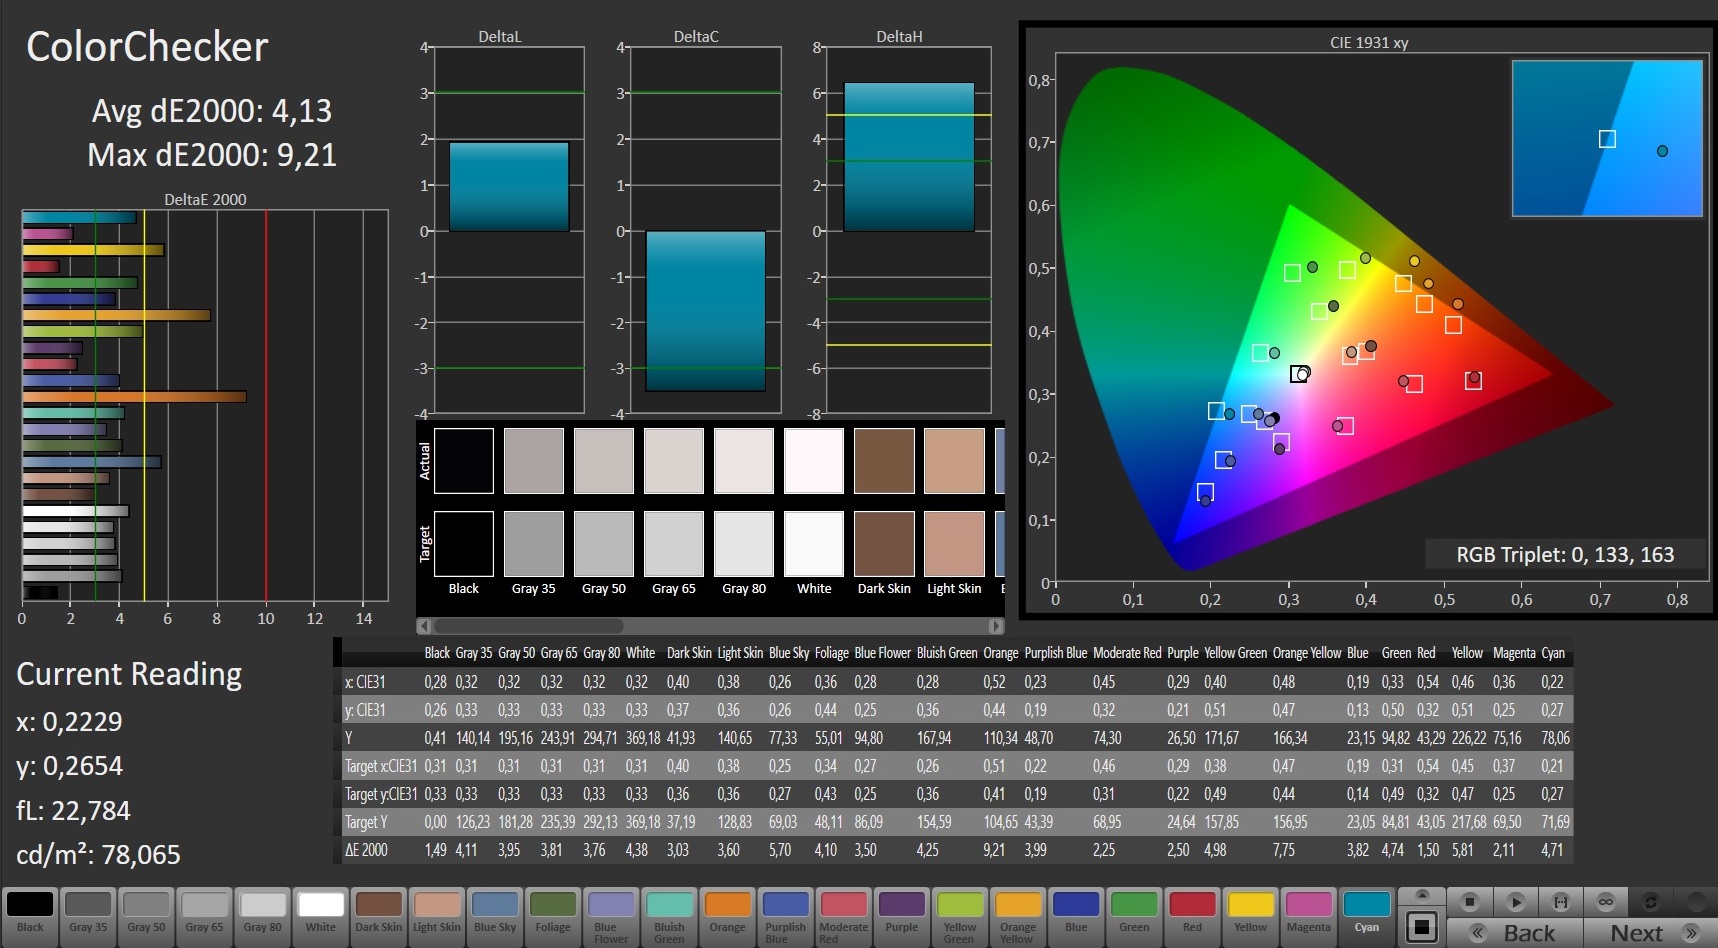
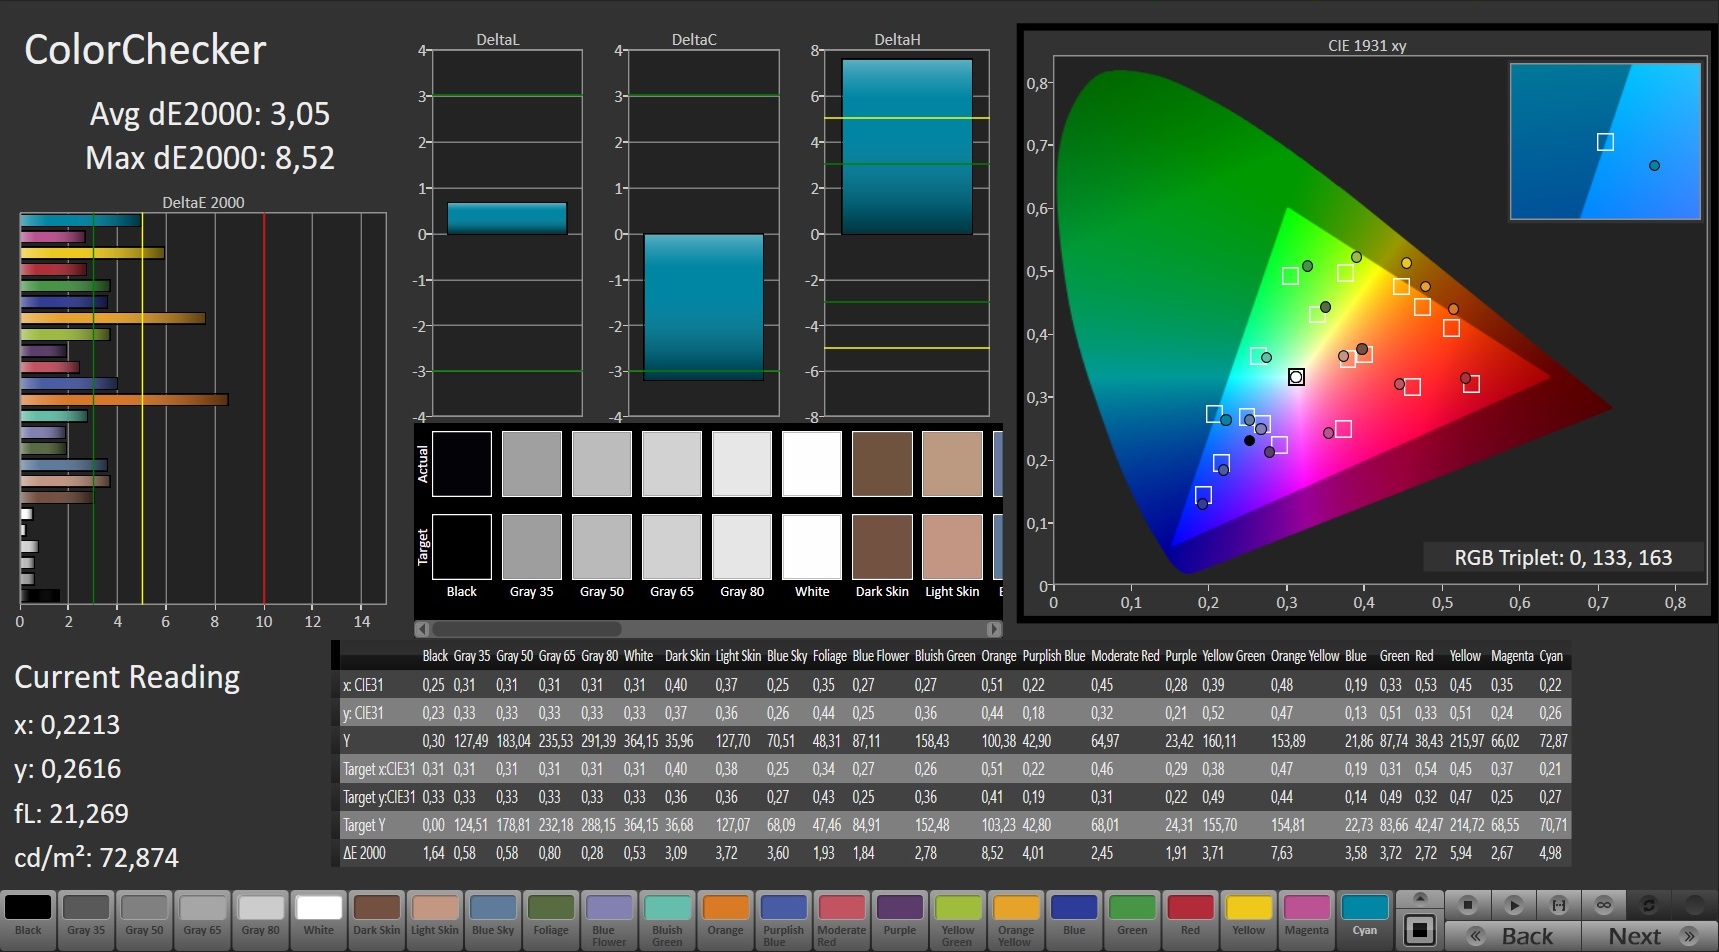
ΔE ColorChecker Calman: 4.13 | ∀{0.5-29.43 Ø4.73}
ΔE Greyscale Calman: 3.52 | ∀{0.09-98 Ø4.97}
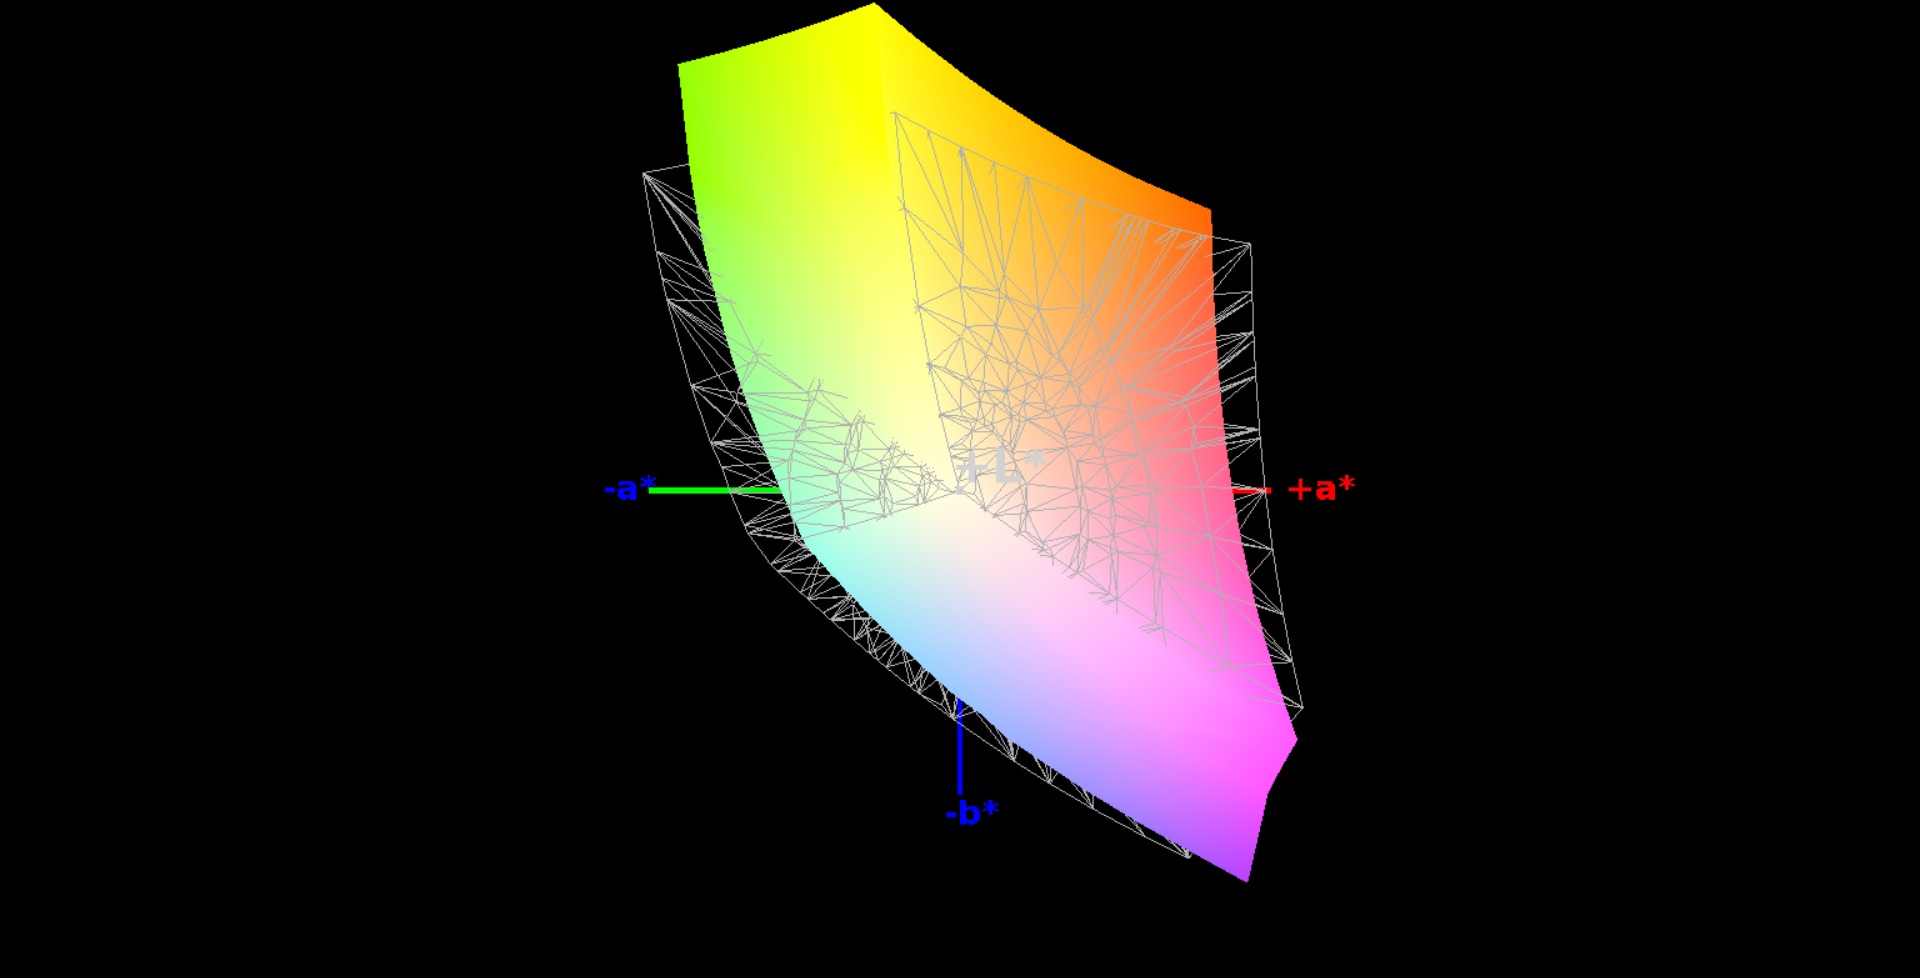
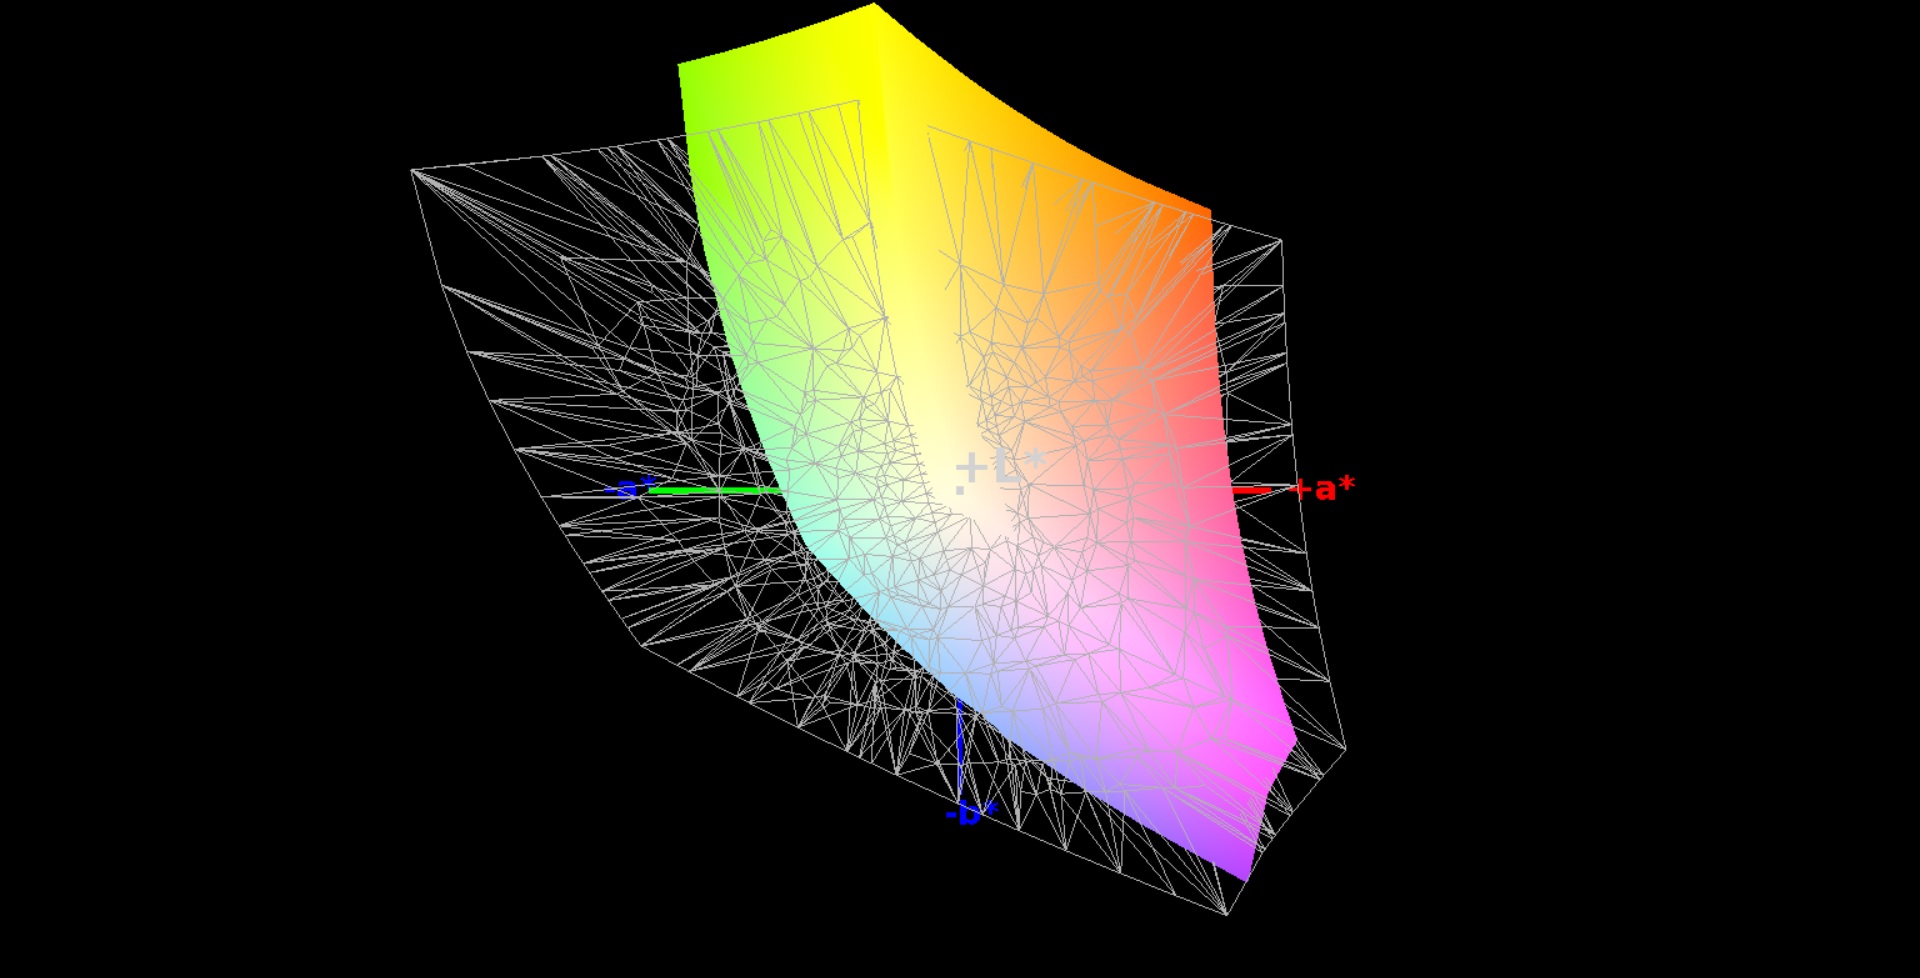
84% sRGB (Argyll 1.6.3 3D)
55% AdobeRGB 1998 (Argyll 1.6.3 3D)
61.2% AdobeRGB 1998 (Argyll 3D)
83.7% sRGB (Argyll 3D)
66.2% Display P3 (Argyll 3D)
Gamma: 2.32
CCT: 6228 K
| Nexoc G734IV LG Philips LP173WF4-SPD1 (LGD046C), 1920x1080 | Nexoc G734III LG Philips LP173WF4-SPD1 (LGD046C), 1920x1080 | MSI GT72VR 7RE-433 Chi Mei N173HHE-G32 (CMN1747), 1920x1080 | HP Omen 17-w110ng LG Philips LGD046E, 1920x1080 | Gigabyte P57X v6 LGD0469, 1920x1080 | Acer Predator 17 G9-793-77LG AU Optronics B173ZAN01.0 (AUO109B), 3840x2160 | |
|---|---|---|---|---|---|---|
| Display | 3% | 4% | 0% | 4% | 37% | |
| Display P3 Coverage (%) | 66.2 | 67.4 2% | 68.3 3% | 66.6 1% | 68 3% | 86.9 31% |
| sRGB Coverage (%) | 83.7 | 85.8 3% | 86.7 4% | 84.1 0% | 87.5 5% | 100 19% |
| AdobeRGB 1998 Coverage (%) | 61.2 | 62.8 3% | 63.4 4% | 61.5 0% | 64 5% | 99.4 62% |
| Response Times | 16% | 53% | 13% | 15% | 13% | |
| Response Time Grey 50% / Grey 80% * (ms) | 42 ? | 36 ? 14% | 29 ? 31% | 37 ? 12% | 33.6 ? 20% | 37 ? 12% |
| Response Time Black / White * (ms) | 28 ? | 23 ? 18% | 7 ? 75% | 24 ? 14% | 25.6 ? 9% | 24 ? 14% |
| PWM Frequency (Hz) | 50 ? | |||||
| Screen | -1% | -34% | 0% | -12% | 13% | |
| Brightness middle (cd/m²) | 348 | 314 -10% | 299 -14% | 362 4% | 329.2 -5% | 336 -3% |
| Brightness (cd/m²) | 336 | 308 -8% | 277 -18% | 342 2% | 321 -4% | 320 -5% |
| Brightness Distribution (%) | 91 | 92 1% | 87 -4% | 87 -4% | 93 2% | 88 -3% |
| Black Level * (cd/m²) | 0.32 | 0.28 12% | 0.27 16% | 0.31 3% | 0.267 17% | 0.25 22% |
| Contrast (:1) | 1088 | 1121 3% | 1107 2% | 1168 7% | 1233 13% | 1344 24% |
| Colorchecker dE 2000 * | 4.13 | 4.17 -1% | 9.65 -134% | 4.5 -9% | 5.93 -44% | 3.61 13% |
| Colorchecker dE 2000 max. * | 9.21 | 8.94 3% | 15.43 -68% | 9.31 -1% | 11.07 -20% | 6.02 35% |
| Greyscale dE 2000 * | 3.52 | 3.84 -9% | 9.68 -175% | 3.48 1% | 6.72 -91% | 4.78 -36% |
| Gamma | 2.32 95% | 2.41 91% | 1.89 116% | 2.23 99% | 2.12 104% | 2.32 95% |
| CCT | 6228 104% | 6950 94% | 11652 56% | 6144 106% | 7611 85% | 6185 105% |
| Color Space (Percent of AdobeRGB 1998) (%) | 55 | 56 2% | 75 36% | 55 0% | 57 4% | 88 60% |
| Color Space (Percent of sRGB) (%) | 84 | 86 2% | 100 19% | 84 0% | 87 4% | 100 19% |
| Total Average (Program / Settings) | 6% /
2% | 8% /
-15% | 4% /
2% | 2% /
-5% | 21% /
18% |
* ... smaller is better
Display Response Times
| ↔ Response Time Black to White | ||
|---|---|---|
| 28 ms ... rise ↗ and fall ↘ combined | ↗ 6 ms rise | 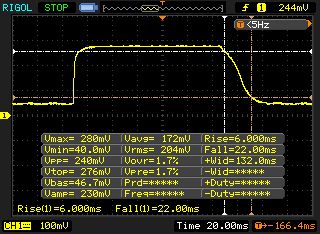 |
| ↘ 22 ms fall | ||
| The screen shows relatively slow response rates in our tests and may be too slow for gamers. In comparison, all tested devices range from 0.1 (minimum) to 240 (maximum) ms. » 71 % of all devices are better. This means that the measured response time is worse than the average of all tested devices (19.9 ms). | ||
| ↔ Response Time 50% Grey to 80% Grey | ||
| 42 ms ... rise ↗ and fall ↘ combined | ↗ 15 ms rise | 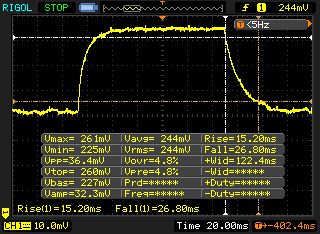 |
| ↘ 27 ms fall | ||
| The screen shows slow response rates in our tests and will be unsatisfactory for gamers. In comparison, all tested devices range from 0.165 (minimum) to 636 (maximum) ms. » 67 % of all devices are better. This means that the measured response time is worse than the average of all tested devices (31.1 ms). | ||
Screen Flickering / PWM (Pulse-Width Modulation)
| Screen flickering / PWM not detected | 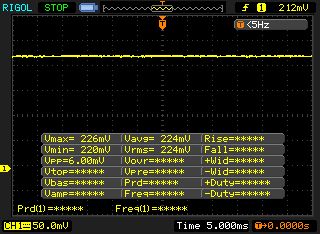 | ||
In comparison: 52 % of all tested devices do not use PWM to dim the display. If PWM was detected, an average of 7791 (minimum: 5 - maximum: 343500) Hz was measured. | |||
| Cinebench R11.5 | |
| CPU Multi 64Bit | |
| MSI GT72VR 7RE-433 | |
| Nexoc G734IV | |
| HP Omen 17-w110ng | |
| Gigabyte P57X v6 | |
| Nexoc G734III | |
| CPU Single 64Bit | |
| MSI GT72VR 7RE-433 | |
| Nexoc G734IV | |
| HP Omen 17-w110ng | |
| Nexoc G734III | |
| Gigabyte P57X v6 | |
| Cinebench R10 | |
| Rendering Multiple CPUs 32Bit | |
| MSI GT72VR 7RE-433 | |
| Nexoc G734IV | |
| HP Omen 17-w110ng | |
| Rendering Single 32Bit | |
| MSI GT72VR 7RE-433 | |
| Nexoc G734IV | |
| HP Omen 17-w110ng | |
| Geekbench 3 | |
| 32 Bit Single-Core Score | |
| Nexoc G734IV | |
| MSI GT72VR 7RE-433 | |
| 32 Bit Multi-Core Score | |
| Nexoc G734IV | |
| MSI GT72VR 7RE-433 | |
| Geekbench 4.0 | |
| 64 Bit Single-Core Score | |
| Nexoc G734IV | |
| MSI GT72VR 7RE-433 | |
| 64 Bit Multi-Core Score | |
| Nexoc G734IV | |
| MSI GT72VR 7RE-433 | |
| JetStream 1.1 - 1.1 Total | |
| HP Omen 17-w110ng | |
| Nexoc G734IV | |
| MSI GT72VR 7RE-433 | |
| Gigabyte P57X v6 | |
| Nexoc G734III | |
| PCMark 7 Score | 6219 points | |
| PCMark 8 Home Score Accelerated v2 | 4330 points | |
| PCMark 8 Creative Score Accelerated v2 | 5378 points | |
| PCMark 8 Work Score Accelerated v2 | 5288 points | |
Help | ||
| PCMark 8 | |
| Home Score Accelerated v2 | |
| MSI GT72VR 7RE-433 | |
| HP Omen 17-w110ng | |
| Nexoc G734IV | |
| Gigabyte P57X v6 | |
| Nexoc G734III | |
| Acer Predator 17 G9-793-77LG | |
| Work Score Accelerated v2 | |
| MSI GT72VR 7RE-433 | |
| HP Omen 17-w110ng | |
| Nexoc G734IV | |
| Gigabyte P57X v6 | |
| Nexoc G734III | |

| Nexoc G734IV Samsung SM961 MZVKW512HMJP m.2 PCI-e | Nexoc G734III Samsung SM951 MZVPV256HDGL m.2 PCI-e | MSI GT72VR 7RE-433 Kingston RBU-SNS8152S3256GG5 | HP Omen 17-w110ng Samsung PM951 NVMe MZVLV256 | Gigabyte P57X v6 Transcend MTS800 256GB M.2 (TS256GMTS800) | |
|---|---|---|---|---|---|
| CrystalDiskMark 3.0 | 5% | -48% | -28% | -57% | |
| Read Seq (MB/s) | 2268 | 1917 -15% | 521 -77% | 1156 -49% | 481.7 -79% |
| Write Seq (MB/s) | 1559 | 1283 -18% | 311.8 -80% | 294.9 -81% | 315.4 -80% |
| Read 512 (MB/s) | 413.8 | 871 110% | 403.1 -3% | 616 49% | 303.1 -27% |
| Write 512 (MB/s) | 1167 | 1199 3% | 332.3 -72% | 294.7 -75% | 314.4 -73% |
| Read 4k (MB/s) | 54 | 51 -6% | 33.35 -38% | 42.7 -21% | 25.93 -52% |
| Write 4k (MB/s) | 154.9 | 142.1 -8% | 111.1 -28% | 153.3 -1% | 84.6 -45% |
| Read 4k QD32 (MB/s) | 634 | 603 -5% | 331.1 -48% | 600 -5% | 273.9 -57% |
| Write 4k QD32 (MB/s) | 509 | 382.4 -25% | 318.3 -37% | 295.3 -42% | 274.9 -46% |
| 3DMark 11 Performance | 15979 points | |
| 3DMark Ice Storm Standard Score | 92034 points | |
| 3DMark Cloud Gate Standard Score | 25308 points | |
| 3DMark Fire Strike Score | 13940 points | |
| 3DMark Fire Strike Extreme Score | 7643 points | |
| 3DMark Time Spy Score | 5385 points | |
Help | ||
| 3DMark 11 - 1280x720 Performance GPU | |
| Gigabyte P57X v6 | |
| MSI GT72VR 7RE-433 | |
| Nexoc G734IV | |
| Acer Predator 17 G9-793-77LG | |
| Nexoc G734III | |
| HP Omen 17-w110ng | |
| 3DMark - 1920x1080 Fire Strike Graphics | |
| MSI GT72VR 7RE-433 | |
| Nexoc G734IV | |
| Nexoc G734III | |
| HP Omen 17-w110ng | |
| Acer Predator 17 G9-793-77LG | |
| BioShock Infinite - 1920x1080 Ultra Preset, DX11 (DDOF) | |
| MSI GT72VR 7RE-433 | |
| Nexoc G734IV | |
| Gigabyte P57X v6 | |
| Nexoc G734III | |
| HP Omen 17-w110ng | |
| Battlefield 4 - 1920x1080 Ultra Preset AA:4x MS | |
| MSI GT72VR 7RE-433 | |
| Nexoc G734IV | |
| Acer Predator 17 G9-793-77LG | |
| Civilization 6 - 1920x1080 Ultra Preset AA:4xMS | |
| MSI GT72VR 7RE-433 | |
| Nexoc G734IV | |
| Resident Evil 7 - 1920x1080 Very High / On AA:FXAA+T | |
| Nexoc G734IV | |
| low | med. | high | ultra | |
|---|---|---|---|---|
| Tomb Raider (2013) | 405.7 | 417.6 | 354.6 | 202.5 |
| BioShock Infinite (2013) | 191.6 | 177.4 | 168.6 | 124.1 |
| Battlefield 4 (2013) | 199.3 | 197.7 | 197.1 | 136.7 |
| Rise of the Tomb Raider (2016) | 179.7 | 163.5 | 104.6 | 90.3 |
| Ashes of the Singularity (2016) | 78 | 73 | 65.5 | |
| Deus Ex Mankind Divided (2016) | 140.3 | 127.1 | 82.1 | 42.1 |
| Civilization 6 (2016) | 73.9 | 58 | 52 | 51.6 |
| Resident Evil 7 (2017) | 359.6 | 273.9 | 160.9 | 132.8 |
Noise level
| Idle |
| 34 / 35 / 46 dB(A) |
| Load |
| 49 / 56 dB(A) |
 | ||
30 dB silent 40 dB(A) audible 50 dB(A) loud |
||
min: | ||
| Nexoc G734IV i7-7700HQ, GeForce GTX 1070 Mobile | Nexoc G734III 6700HQ, GeForce GTX 1070 Mobile | MSI GT72VR 7RE-433 i7-7700HQ, GeForce GTX 1070 Mobile | HP Omen 17-w110ng 6700HQ, GeForce GTX 1070 Mobile | Gigabyte P57X v6 6700HQ, GeForce GTX 1070 Mobile | Acer Predator 17 G9-793-77LG 6700HQ, GeForce GTX 1070 Mobile | |
|---|---|---|---|---|---|---|
| Noise | 10% | 10% | 8% | 8% | 6% | |
| off / environment * (dB) | 30 | 30 -0% | 31 -3% | 30 -0% | 29.7 1% | 31 -3% |
| Idle Minimum * (dB) | 34 | 31 9% | 34 -0% | 33 3% | 33.2 2% | 33 3% |
| Idle Average * (dB) | 35 | 32 9% | 35 -0% | 34 3% | 33.2 5% | 34 3% |
| Idle Maximum * (dB) | 46 | 33 28% | 37 20% | 35 24% | 33.2 28% | 40 13% |
| Load Average * (dB) | 49 | 49 -0% | 37 24% | 45 8% | 47.5 3% | 44 10% |
| Load Maximum * (dB) | 56 | 50 11% | 44 21% | 52 7% | 52.5 6% | 50 11% |
* ... smaller is better
(-) The maximum temperature on the upper side is 48.1 °C / 119 F, compared to the average of 40.4 °C / 105 F, ranging from 21.2 to 68.8 °C for the class Gaming.
(-) The bottom heats up to a maximum of 59.3 °C / 139 F, compared to the average of 43.2 °C / 110 F
(+) In idle usage, the average temperature for the upper side is 25 °C / 77 F, compared to the device average of 33.9 °C / 93 F.
(+) The palmrests and touchpad are cooler than skin temperature with a maximum of 30.9 °C / 87.6 F and are therefore cool to the touch.
(-) The average temperature of the palmrest area of similar devices was 28.8 °C / 83.8 F (-2.1 °C / -3.8 F).
| Nexoc G734IV i7-7700HQ, GeForce GTX 1070 Mobile | Nexoc G734III 6700HQ, GeForce GTX 1070 Mobile | MSI GT72VR 7RE-433 i7-7700HQ, GeForce GTX 1070 Mobile | HP Omen 17-w110ng 6700HQ, GeForce GTX 1070 Mobile | Gigabyte P57X v6 6700HQ, GeForce GTX 1070 Mobile | Acer Predator 17 G9-793-77LG 6700HQ, GeForce GTX 1070 Mobile | |
|---|---|---|---|---|---|---|
| Heat | -3% | 9% | -0% | -18% | 2% | |
| Maximum Upper Side * (°C) | 48.1 | 50 -4% | 41.5 14% | 45 6% | 59 -23% | 42.6 11% |
| Maximum Bottom * (°C) | 59.3 | 60.5 -2% | 50.6 15% | 54.3 8% | 66 -11% | 44.9 24% |
| Idle Upper Side * (°C) | 28.2 | 29.1 -3% | 26.4 6% | 29.6 -5% | 33.2 -18% | 33.1 -17% |
| Idle Bottom * (°C) | 26 | 26.9 -3% | 25.4 2% | 28.6 -10% | 30.6 -18% | 28.9 -11% |
* ... smaller is better
Nexoc G734IV audio analysis
(±) | speaker loudness is average but good (77 dB)
Bass 100 - 315 Hz
(±) | reduced bass - on average 14.7% lower than median
(±) | linearity of bass is average (13.9% delta to prev. frequency)
Mids 400 - 2000 Hz
(+) | balanced mids - only 3.5% away from median
(+) | mids are linear (4% delta to prev. frequency)
Highs 2 - 16 kHz
(+) | balanced highs - only 3.3% away from median
(+) | highs are linear (6.4% delta to prev. frequency)
Overall 100 - 16.000 Hz
(±) | linearity of overall sound is average (17.3% difference to median)
Compared to same class
» 47% of all tested devices in this class were better, 12% similar, 41% worse
» The best had a delta of 6%, average was 18%, worst was 132%
Compared to all devices tested
» 32% of all tested devices were better, 8% similar, 59% worse
» The best had a delta of 4%, average was 24%, worst was 134%
MSI GT72VR 7RE-433 audio analysis
(+) | speakers can play relatively loud (87 dB)
Bass 100 - 315 Hz
(±) | reduced bass - on average 5.4% lower than median
(±) | linearity of bass is average (11.3% delta to prev. frequency)
Mids 400 - 2000 Hz
(±) | higher mids - on average 5% higher than median
(+) | mids are linear (4.1% delta to prev. frequency)
Highs 2 - 16 kHz
(+) | balanced highs - only 4.7% away from median
(+) | highs are linear (5.7% delta to prev. frequency)
Overall 100 - 16.000 Hz
(+) | overall sound is linear (11.7% difference to median)
Compared to same class
» 11% of all tested devices in this class were better, 4% similar, 85% worse
» The best had a delta of 6%, average was 18%, worst was 132%
Compared to all devices tested
» 8% of all tested devices were better, 3% similar, 89% worse
» The best had a delta of 4%, average was 24%, worst was 134%
| Off / Standby | |
| Idle | |
| Load |
|
Key:
min: | |
| Nexoc G734IV i7-7700HQ, GeForce GTX 1070 Mobile | Nexoc G734III 6700HQ, GeForce GTX 1070 Mobile | MSI GT72VR 7RE-433 i7-7700HQ, GeForce GTX 1070 Mobile | HP Omen 17-w110ng 6700HQ, GeForce GTX 1070 Mobile | Gigabyte P57X v6 6700HQ, GeForce GTX 1070 Mobile | Acer Predator 17 G9-793-77LG 6700HQ, GeForce GTX 1070 Mobile | |
|---|---|---|---|---|---|---|
| Power Consumption | -10% | -30% | -27% | -40% | -69% | |
| Idle Minimum * (Watt) | 12 | 13 -8% | 20 -67% | 19 -58% | 18.4 -53% | 25 -108% |
| Idle Average * (Watt) | 17 | 20 -18% | 27 -59% | 25 -47% | 22.8 -34% | 35 -106% |
| Idle Maximum * (Watt) | 22 | 27 -23% | 31 -41% | 31 -41% | 24 -9% | 46 -109% |
| Load Average * (Watt) | 86 | 90 -5% | 86 -0% | 90 -5% | 175.5 -104% | 103 -20% |
| Load Maximum * (Watt) | 224 | 210 6% | 184 18% | 193 14% | 229.5 -2% | 223 -0% |
* ... smaller is better
| Nexoc G734IV i7-7700HQ, GeForce GTX 1070 Mobile, 60 Wh | Nexoc G734III 6700HQ, GeForce GTX 1070 Mobile, 60 Wh | MSI GT72VR 7RE-433 i7-7700HQ, GeForce GTX 1070 Mobile, 83 Wh | HP Omen 17-w110ng 6700HQ, GeForce GTX 1070 Mobile, 95 Wh | Gigabyte P57X v6 6700HQ, GeForce GTX 1070 Mobile, 75.81 Wh | Acer Predator 17 G9-793-77LG 6700HQ, GeForce GTX 1070 Mobile, 88 Wh | |
|---|---|---|---|---|---|---|
| Battery runtime | 4% | 5% | 23% | 11% | -6% | |
| Reader / Idle (h) | 7.7 | 6.7 -13% | 5.3 -31% | 7.2 -6% | 7 -9% | 4.6 -40% |
| H.264 (h) | 3.3 | 3.5 6% | 3.8 15% | 3.9 18% | ||
| WiFi v1.3 (h) | 3.4 | 3 -12% | 3.8 12% | 4.1 21% | 3.4 0% | 3.3 -3% |
| Load (h) | 1.2 | 1.6 33% | 1.5 25% | 1.9 58% | 1.7 42% | 1.5 25% |
Pros
Cons
Nexoc G734IV可以属于“机型更新”这一类设备。最新的Kaby Lake四核处理器相比Skylake芯片只能提供些许的优势。与G734III相似,可以在全高清分辨率和最高设定下运行所有最新游戏。对英伟达G-Sync技术的支持保证了在60赫兹屏幕上的显示效果更佳平滑。雾面IPS全高清屏幕提供了高亮度,高对比度和稳定的可视角度范围。
G734IV是Nexoc为游戏玩家带来的全能型游戏笔记本电脑更新。
这台笔记本电脑的发热量作为游戏本算是中规中矩。Nexoc应该改进它在待机模式下的风扇控制:它的风扇会保持一直运转,而且在不必要的时候会突然加速,这可能会让人十分烦躁。幸运的是,用户可以自己通过软件修复这个问题。
一块高速NVMe固态硬盘保证了非常迅捷的系统运行。一块2.5寸机械硬盘也提供了必要的2TB存储空间。如果这还不够用的话,用户可自行添加第二块2.5寸硬盘。如果需要升级硬盘的话,用户需要打开这台笔记本电脑的底盖。
注:本文是基于完整评测的缩减版本,阅读完整的英文评测,请点击这里。
Nexoc G734IV
- 02/11/2017 v6 (old)
Sascha Mölck