技嘉 P57X v6 笔记本电脑简短评测

| SD Card Reader | |
| average JPG Copy Test (av. of 3 runs) | |
| MSI GT72VR 6RD-063US | |
| Acer Predator 17 G9-793-77LG | |
| Gigabyte P57X v6 | |
| Asus G752VS-XB78K | |
| Lenovo IdeaPad Y900 | |
| maximum AS SSD Seq Read Test (1GB) | |
| MSI GT72VR 6RD-063US | |
| Lenovo IdeaPad Y900 | |
| Gigabyte P57X v6 | |
| Acer Predator 17 G9-793-77LG | |
| Asus G752VS-XB78K | |
| Networking | |
| iperf Server (receive) TCP 1 m 512KB | |
| Lenovo IdeaPad Y900 | |
| Gigabyte P57X v6 | |
| iperf Client (transmit) TCP 1 m 512KB | |
| Lenovo IdeaPad Y900 | |
| Gigabyte P57X v6 | |
| |||||||||||||||||||||||||
Brightness Distribution: 93 %
Center on Battery: 329.2 cd/m²
Contrast: 1233:1 (Black: 0.267 cd/m²)
ΔE ColorChecker Calman: 5.93 | ∀{0.5-29.43 Ø4.71}
ΔE Greyscale Calman: 6.72 | ∀{0.09-98 Ø4.96}
87% sRGB (Argyll 1.6.3 3D)
57% AdobeRGB 1998 (Argyll 1.6.3 3D)
64% AdobeRGB 1998 (Argyll 3D)
87.5% sRGB (Argyll 3D)
68% Display P3 (Argyll 3D)
Gamma: 2.12
CCT: 7611 K
| Gigabyte P57X v6 LGD0469, IPS, 17.3", 1920x1080 | Lenovo IdeaPad Y900 17.3", 1920x1080 | MSI GT72VR 6RD-063US LG Philips LGD046E, IPS, 17.3", 1920x1080 | Acer Predator 17 G9-793-77LG AU Optronics B173ZAN01.0 (AUO109B), IPS, 17.3", 3840x2160 | EVGA SC17 IPS, 17.3", 3840x2160 | Asus G752VS-XB78K LG Philips LP173WF4-SPF3 (LGD04E8), IPS, 17.3", 1920x1080 | Gigabyte P57W LG Philips LP173WF4-SPF1 (LGD0469), IPS, 17.3", 1920x1080 | |
|---|---|---|---|---|---|---|---|
| Display | -1% | -1% | 32% | 33% | -3% | -3% | |
| Display P3 Coverage (%) | 68 | 67.4 -1% | 67.6 -1% | 86.9 28% | 87.6 29% | 66.9 -2% | 66.5 -2% |
| sRGB Coverage (%) | 87.5 | 86.3 -1% | 86.2 -1% | 100 14% | 100 14% | 85.2 -3% | 84.4 -4% |
| AdobeRGB 1998 Coverage (%) | 64 | 63.2 -1% | 63 -2% | 99.4 55% | 99 55% | 62.3 -3% | 61.7 -4% |
| Response Times | -2% | -3% | -2% | -82% | 1% | -2% | |
| Response Time Grey 50% / Grey 80% * (ms) | 33.6 ? | 34.8 ? -4% | 34.4 ? -2% | 37 ? -10% | 69.6 ? -107% | 38 ? -13% | 37 ? -10% |
| Response Time Black / White * (ms) | 25.6 ? | 25.6 ? -0% | 26.4 ? -3% | 24 ? 6% | 40 ? -56% | 22 ? 14% | 24 ? 6% |
| PWM Frequency (Hz) | 1000 ? | ||||||
| Screen | 2% | 7% | 20% | 6% | 8% | 0% | |
| Brightness middle (cd/m²) | 329.2 | 344.9 5% | 351.7 7% | 336 2% | 394.1 20% | 328 0% | 286 -13% |
| Brightness (cd/m²) | 321 | 329 2% | 339 6% | 320 0% | 367 14% | 317 -1% | 274 -15% |
| Brightness Distribution (%) | 93 | 86 -8% | 91 -2% | 88 -5% | 83 -11% | 88 -5% | 87 -6% |
| Black Level * (cd/m²) | 0.267 | 0.349 -31% | 0.37 -39% | 0.25 6% | 0.439 -64% | 0.3 -12% | 0.31 -16% |
| Contrast (:1) | 1233 | 988 -20% | 951 -23% | 1344 9% | 898 -27% | 1093 -11% | 923 -25% |
| Colorchecker dE 2000 * | 5.93 | 4.49 24% | 3.71 37% | 3.61 39% | 5.79 2% | 3.74 37% | 4.49 24% |
| Colorchecker dE 2000 max. * | 11.07 | 8.72 21% | 8.48 23% | 6.02 46% | 8.44 24% | 8.97 19% | 7.83 29% |
| Greyscale dE 2000 * | 6.72 | 4.63 31% | 2.46 63% | 4.78 29% | 4.23 37% | 2.67 60% | 4.76 29% |
| Gamma | 2.12 104% | 2.11 104% | 2.29 96% | 2.32 95% | 2.11 104% | 2.41 91% | 2.47 89% |
| CCT | 7611 85% | 6905 94% | 6849 95% | 6185 105% | 7479 87% | 6861 95% | 6843 95% |
| Color Space (Percent of AdobeRGB 1998) (%) | 57 | 56.7 -1% | 56.6 -1% | 88 54% | 86.6 52% | 56 -2% | 55 -4% |
| Color Space (Percent of sRGB) (%) | 87 | 86.4 -1% | 86.1 -1% | 100 15% | 100 15% | 85 -2% | 84 -3% |
| Total Average (Program / Settings) | -0% /
1% | 1% /
4% | 17% /
19% | -14% /
-0% | 2% /
5% | -2% /
-1% |
* ... smaller is better
Display Response Times
| ↔ Response Time Black to White | ||
|---|---|---|
| 25.6 ms ... rise ↗ and fall ↘ combined | ↗ 5.2 ms rise | 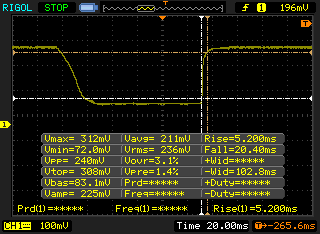 |
| ↘ 20.4 ms fall | ||
| The screen shows relatively slow response rates in our tests and may be too slow for gamers. In comparison, all tested devices range from 0.1 (minimum) to 240 (maximum) ms. » 61 % of all devices are better. This means that the measured response time is worse than the average of all tested devices (19.8 ms). | ||
| ↔ Response Time 50% Grey to 80% Grey | ||
| 33.6 ms ... rise ↗ and fall ↘ combined | ↗ 14 ms rise | 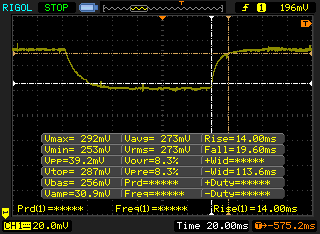 |
| ↘ 19.6 ms fall | ||
| The screen shows slow response rates in our tests and will be unsatisfactory for gamers. In comparison, all tested devices range from 0.165 (minimum) to 636 (maximum) ms. » 46 % of all devices are better. This means that the measured response time is similar to the average of all tested devices (31 ms). | ||
Screen Flickering / PWM (Pulse-Width Modulation)
| Screen flickering / PWM not detected | 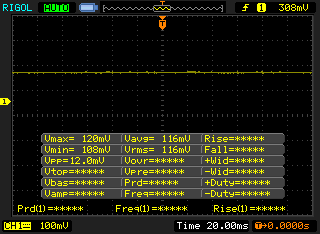 | ||
In comparison: 52 % of all tested devices do not use PWM to dim the display. If PWM was detected, an average of 7754 (minimum: 5 - maximum: 343500) Hz was measured. | |||
| Cinebench R11.5 | |
| CPU Single 64Bit | |
| Asus G752VS-XB78K | |
| EVGA SC17 | |
| Lenovo IdeaPad Y900 | |
| Gigabyte P57W | |
| MSI GT72VR 6RD-063US | |
| Gigabyte P57X v6 | |
| CPU Multi 64Bit | |
| Asus G752VS-XB78K | |
| Lenovo IdeaPad Y900 | |
| EVGA SC17 | |
| Gigabyte P57W | |
| Gigabyte P57X v6 | |
| MSI GT72VR 6RD-063US | |
| wPrime 2.10 - 1024m | |
| Gigabyte P57X v6 | |
| MSI GT72VR 6RD-063US | |
| Lenovo IdeaPad Y900 | |
| EVGA SC17 | |
| Super Pi Mod 1.5 XS 32M - 32M | |
| MSI GT72VR 6RD-063US | |
| EVGA SC17 | |
| Lenovo IdeaPad Y900 | |
| Gigabyte P57X v6 | |
* ... smaller is better
| PCMark 8 | |
| Home Score Accelerated v2 | |
| Asus G752VS-XB78K | |
| Lenovo IdeaPad Y900 | |
| MSI GT72VR 6RD-063US | |
| Gigabyte P57X v6 | |
| Acer Predator 17 G9-793-77LG | |
| Gigabyte P57W | |
| EVGA SC17 | |
| Work Score Accelerated v2 | |
| Asus G752VS-XB78K | |
| Lenovo IdeaPad Y900 | |
| Gigabyte P57X v6 | |
| Gigabyte P57W | |
| MSI GT72VR 6RD-063US | |
| EVGA SC17 | |
| Creative Score Accelerated v2 | |
| Asus G752VS-XB78K | |
| MSI GT72VR 6RD-063US | |
| Lenovo IdeaPad Y900 | |
| Gigabyte P57X v6 | |
| Gigabyte P57W | |
| EVGA SC17 | |
| Acer Predator 17 G9-793-77LG | |
| PCMark 8 Home Score Accelerated v2 | 4206 points | |
| PCMark 8 Creative Score Accelerated v2 | 5192 points | |
| PCMark 8 Work Score Accelerated v2 | 5014 points | |
Help | ||
| Gigabyte P57X v6 Transcend MTS800 256GB M.2 (TS256GMTS800) | Lenovo IdeaPad Y900 Samsung SM951 MZVPV256 m.2 | EVGA SC17 Samsung SSD 950 Pro 512GB m.2 NVMe | Asus G752VS-XB78K Toshiba NVMe THNSN5512GPU7 | Gigabyte P57W Lite-On IT L8T-256L9G | |
|---|---|---|---|---|---|
| CrystalDiskMark 3.0 | 159% | 220% | 210% | 6% | |
| Read Seq (MB/s) | 481.7 | 1559 224% | 2247 366% | 1718 257% | 491.6 2% |
| Write Seq (MB/s) | 315.4 | 1254 298% | 1534 386% | 1305 314% | 391.1 24% |
| Read 512 (MB/s) | 303.1 | 850 180% | 1113 267% | 1250 312% | 352.8 16% |
| Write 512 (MB/s) | 314.4 | 1228 291% | 1490 374% | 1438 357% | 371.7 18% |
| Read 4k (MB/s) | 25.93 | 49.32 90% | 52.1 101% | 44.42 71% | 29.89 15% |
| Write 4k (MB/s) | 84.6 | 140.3 66% | 149.2 76% | 154.4 83% | 37.75 -55% |
| Read 4k QD32 (MB/s) | 273.9 | 539 97% | 635 132% | 744 172% | 338.7 24% |
| Write 4k QD32 (MB/s) | 274.9 | 345.3 26% | 422 54% | 578 110% | 278 1% |

| 3DMark | |
| Fire Strike Extreme Graphics | |
| Gigabyte P57X v6 | |
| Asus G752VS-XB78K | |
| MSI GT72VR 6RD-063US | |
| EVGA SC17 | |
| Lenovo IdeaPad Y900 | |
| 1920x1080 Fire Strike Graphics | |
| Asus G752VS-XB78K | |
| Acer Predator 17 G9-793-77LG | |
| MSI GT72VR 6RD-063US | |
| Lenovo IdeaPad Y900 | |
| EVGA SC17 | |
| Gigabyte P57W | |
| 3DMark 11 | |
| 1280x720 Performance GPU | |
| Gigabyte P57X v6 | |
| Asus G752VS-XB78K | |
| Acer Predator 17 G9-793-77LG | |
| Lenovo IdeaPad Y900 | |
| EVGA SC17 | |
| MSI GT72VR 6RD-063US | |
| Gigabyte P57W | |
| 1280x720 Performance Combined | |
| Asus G752VS-XB78K | |
| Lenovo IdeaPad Y900 | |
| EVGA SC17 | |
| Gigabyte P57X v6 | |
| MSI GT72VR 6RD-063US | |
| Gigabyte P57W | |
| Acer Predator 17 G9-793-77LG | |
| 3DMark 06 Standard Score | 25589 points | |
| 3DMark 11 Performance | 16231 points | |
| 3DMark Ice Storm Standard Score | 85198 points | |
| 3DMark Cloud Gate Standard Score | 23781 points | |
| 3DMark Fire Strike Extreme Score | 7559 points | |
Help | ||
| BioShock Infinite - 1920x1080 Ultra Preset, DX11 (DDOF) (sort by value) | |
| Gigabyte P57X v6 | |
| Lenovo IdeaPad Y900 | |
| MSI GT72VR 6RD-063US | |
| EVGA SC17 | |
| Asus G752VS-XB78K | |
| Metro: Last Light - 1920x1080 Very High (DX11) AF:16x (sort by value) | |
| Gigabyte P57X v6 | |
| Lenovo IdeaPad Y900 | |
| MSI GT72VR 6RD-063US | |
| EVGA SC17 | |
| Thief - 1920x1080 Very High Preset AA:FXAA & High SS AF:8x (sort by value) | |
| Gigabyte P57X v6 | |
| Lenovo IdeaPad Y900 | |
| MSI GT72VR 6RD-063US | |
| EVGA SC17 | |
| Asus G752VS-XB78K | |
| Batman: Arkham Knight - 1920x1080 High / On AA:SM AF:16x (sort by value) | |
| Gigabyte P57X v6 | |
| Lenovo IdeaPad Y900 | |
| MSI GT72VR 6RD-063US | |
| EVGA SC17 | |
| Asus G752VS-XB78K | |
| Fallout 4 - 1920x1080 Ultra Preset AA:T AF:16x (sort by value) | |
| Gigabyte P57X v6 | |
| Lenovo IdeaPad Y900 | |
| MSI GT72VR 6RD-063US | |
| EVGA SC17 | |
| Rise of the Tomb Raider - 1920x1080 Very High Preset AA:FX AF:16x (sort by value) | |
| Gigabyte P57X v6 | |
| Lenovo IdeaPad Y900 | |
| MSI GT72VR 6RD-063US | |
| Acer Predator 17 G9-793-77LG | |
| EVGA SC17 | |
| Asus G752VS-XB78K | |
| Gigabyte P57W | |
| Doom - 1920x1080 Ultra Preset AA:SM (sort by value) | |
| Gigabyte P57X v6 | |
| Lenovo IdeaPad Y900 | |
| MSI GT72VR 6RD-063US | |
| low | med. | high | ultra | |
|---|---|---|---|---|
| BioShock Infinite (2013) | 123.8 | |||
| Metro: Last Light (2013) | 99 | |||
| Thief (2014) | 88.5 | |||
| Batman: Arkham Knight (2015) | 78 | |||
| Fallout 4 (2015) | 96 | |||
| Rise of the Tomb Raider (2016) | 90 | |||
| Doom (2016) | 104 |
Noise level
| Idle |
| 33.2 / 33.2 / 33.2 dB(A) |
| Load |
| 47.5 / 52.5 dB(A) |
 | ||
30 dB silent 40 dB(A) audible 50 dB(A) loud |
||
min: | ||
| Gigabyte P57X v6 GeForce GTX 1070 Mobile, 6700HQ, Transcend MTS800 256GB M.2 (TS256GMTS800) | Lenovo IdeaPad Y900 GeForce GTX 980M, 6820HK, Samsung SM951 MZVPV256 m.2 | Acer Predator 17 G9-793-77LG GeForce GTX 1070 Mobile, 6700HQ, Toshiba NVMe THNSN5256GPU7 | Asus G752VS-XB78K GeForce GTX 1070 Mobile, 6820HK, Toshiba NVMe THNSN5512GPU7 | Gigabyte P57W GeForce GTX 970M, 6700HQ, Lite-On IT L8T-256L9G | |
|---|---|---|---|---|---|
| Noise | -2% | -2% | 6% | 4% | |
| off / environment * (dB) | 29.7 | 28.8 3% | 31 -4% | 30 -1% | 30 -1% |
| Idle Minimum * (dB) | 33.2 | 29.4 11% | 33 1% | 31 7% | 32 4% |
| Idle Average * (dB) | 33.2 | 32.4 2% | 34 -2% | 32 4% | 33 1% |
| Idle Maximum * (dB) | 33.2 | 48 -45% | 40 -20% | 33 1% | 37 -11% |
| Load Average * (dB) | 47.5 | 42.5 11% | 44 7% | 40 16% | 37 22% |
| Load Maximum * (dB) | 52.5 | 48.5 8% | 50 5% | 47 10% | 47 10% |
* ... smaller is better
(-) The maximum temperature on the upper side is 59 °C / 138 F, compared to the average of 40.4 °C / 105 F, ranging from 21.2 to 68.8 °C for the class Gaming.
(-) The bottom heats up to a maximum of 66 °C / 151 F, compared to the average of 43.2 °C / 110 F
(+) In idle usage, the average temperature for the upper side is 28 °C / 82 F, compared to the device average of 33.9 °C / 93 F.
(+) The palmrests and touchpad are cooler than skin temperature with a maximum of 27.2 °C / 81 F and are therefore cool to the touch.
(±) The average temperature of the palmrest area of similar devices was 28.8 °C / 83.8 F (+1.6 °C / 2.8 F).
Gigabyte P57X v6 audio analysis
(±) | speaker loudness is average but good (72.7 dB)
Bass 100 - 315 Hz
(-) | nearly no bass - on average 15.5% lower than median
(±) | linearity of bass is average (9.2% delta to prev. frequency)
Mids 400 - 2000 Hz
(+) | balanced mids - only 1.9% away from median
(+) | mids are linear (5.2% delta to prev. frequency)
Highs 2 - 16 kHz
(±) | higher highs - on average 7.1% higher than median
(±) | linearity of highs is average (8.9% delta to prev. frequency)
Overall 100 - 16.000 Hz
(±) | linearity of overall sound is average (27.4% difference to median)
Compared to same class
» 93% of all tested devices in this class were better, 1% similar, 5% worse
» The best had a delta of 6%, average was 18%, worst was 132%
Compared to all devices tested
» 84% of all tested devices were better, 4% similar, 13% worse
» The best had a delta of 4%, average was 23%, worst was 134%
Apple MacBook 12 (Early 2016) 1.1 GHz audio analysis
(+) | speakers can play relatively loud (83.6 dB)
Bass 100 - 315 Hz
(±) | reduced bass - on average 11.3% lower than median
(±) | linearity of bass is average (14.2% delta to prev. frequency)
Mids 400 - 2000 Hz
(+) | balanced mids - only 2.4% away from median
(+) | mids are linear (5.5% delta to prev. frequency)
Highs 2 - 16 kHz
(+) | balanced highs - only 2% away from median
(+) | highs are linear (4.5% delta to prev. frequency)
Overall 100 - 16.000 Hz
(+) | overall sound is linear (10.2% difference to median)
Compared to same class
» 7% of all tested devices in this class were better, 2% similar, 90% worse
» The best had a delta of 5%, average was 18%, worst was 53%
Compared to all devices tested
» 5% of all tested devices were better, 1% similar, 94% worse
» The best had a delta of 4%, average was 23%, worst was 134%
| Off / Standby | |
| Idle | |
| Load |
|
Key:
min: | |
| Gigabyte P57X v6 6700HQ, GeForce GTX 1070 Mobile, Transcend MTS800 256GB M.2 (TS256GMTS800), IPS, 1920x1080, 17.3" | Lenovo IdeaPad Y900 6820HK, GeForce GTX 980M, Samsung SM951 MZVPV256 m.2, , 1920x1080, 17.3" | Acer Predator 17 G9-793-77LG 6700HQ, GeForce GTX 1070 Mobile, Toshiba NVMe THNSN5256GPU7, IPS, 3840x2160, 17.3" | Asus G752VS-XB78K 6820HK, GeForce GTX 1070 Mobile, Toshiba NVMe THNSN5512GPU7, IPS, 1920x1080, 17.3" | Gigabyte P57W 6700HQ, GeForce GTX 970M, Lite-On IT L8T-256L9G, IPS, 1920x1080, 17.3" | |
|---|---|---|---|---|---|
| Power Consumption | -5% | -28% | -12% | 29% | |
| Idle Minimum * (Watt) | 18.4 | 24.3 -32% | 25 -36% | 24 -30% | 11 40% |
| Idle Average * (Watt) | 22.8 | 29.6 -30% | 35 -54% | 31 -36% | 17 25% |
| Idle Maximum * (Watt) | 24 | 29.9 -25% | 46 -92% | 36 -50% | 22 8% |
| Load Average * (Watt) | 175.5 | 110.1 37% | 103 41% | 94 46% | 85 52% |
| Load Maximum * (Watt) | 229.5 | 171.4 25% | 223 3% | 204 11% | 178 22% |
* ... smaller is better
| Gigabyte P57X v6 6700HQ, GeForce GTX 1070 Mobile, 75.81 Wh | Lenovo IdeaPad Y900 6820HK, GeForce GTX 980M, 90 Wh | MSI GT72VR 6RD-063US 6700HQ, GeForce GTX 1060 Mobile, 83 Wh | Acer Predator 17 G9-793-77LG 6700HQ, GeForce GTX 1070 Mobile, 88 Wh | EVGA SC17 6820HK, GeForce GTX 980M, 74.48 Wh | Asus G752VS-XB78K 6820HK, GeForce GTX 1070 Mobile, 90 Wh | Gigabyte P57W 6700HQ, GeForce GTX 970M, 75.81 Wh | |
|---|---|---|---|---|---|---|---|
| Battery runtime | 13% | -7% | -16% | -17% | -14% | 25% | |
| Reader / Idle (h) | 7 | 5.8 -17% | 5.4 -23% | 4.6 -34% | 5.2 -26% | 5.2 -26% | 7.7 10% |
| WiFi v1.3 (h) | 3.4 | 4.1 21% | 3.7 9% | 3.3 -3% | 3.4 0% | 3.5 3% | 5.6 65% |
| Load (h) | 1.7 | 2.3 35% | 1.6 -6% | 1.5 -12% | 1.3 -24% | 1.4 -18% | 1.7 0% |
Pros
Cons
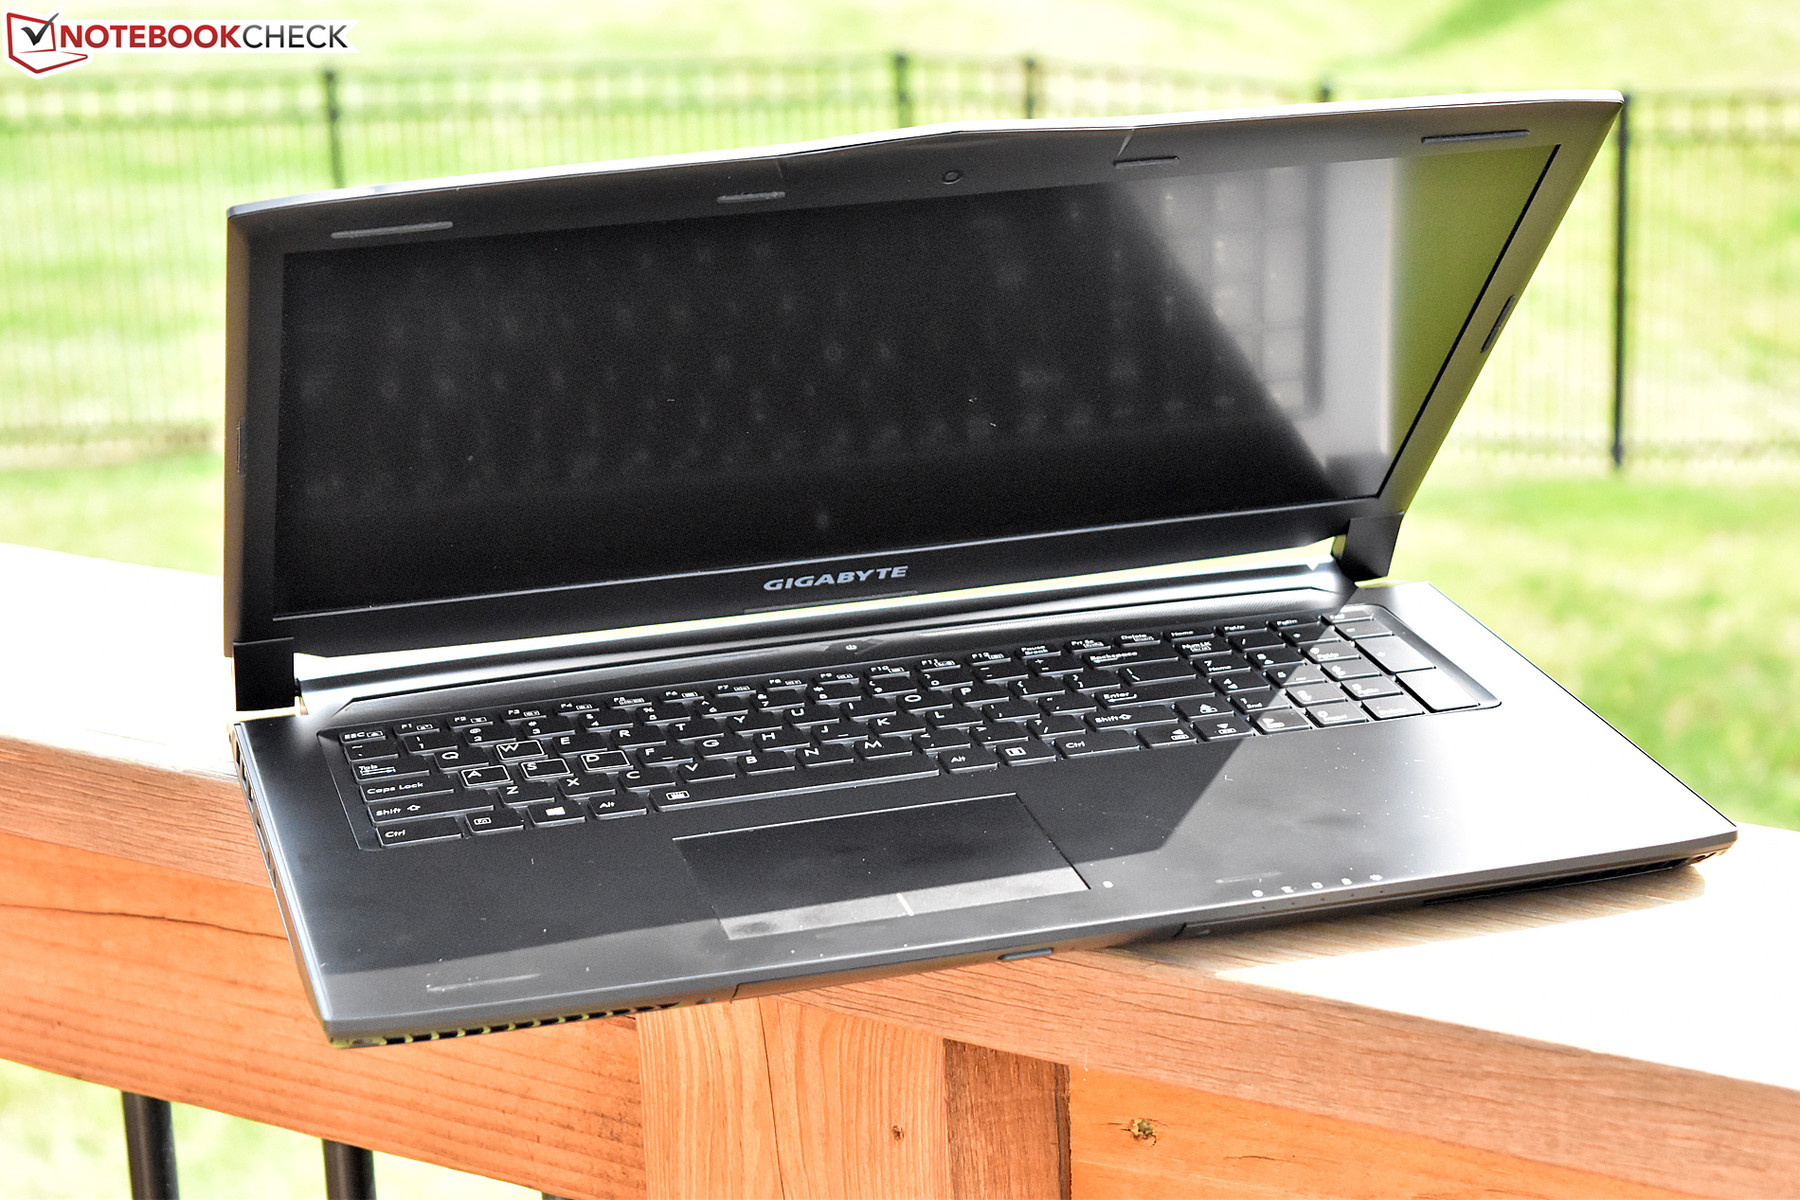
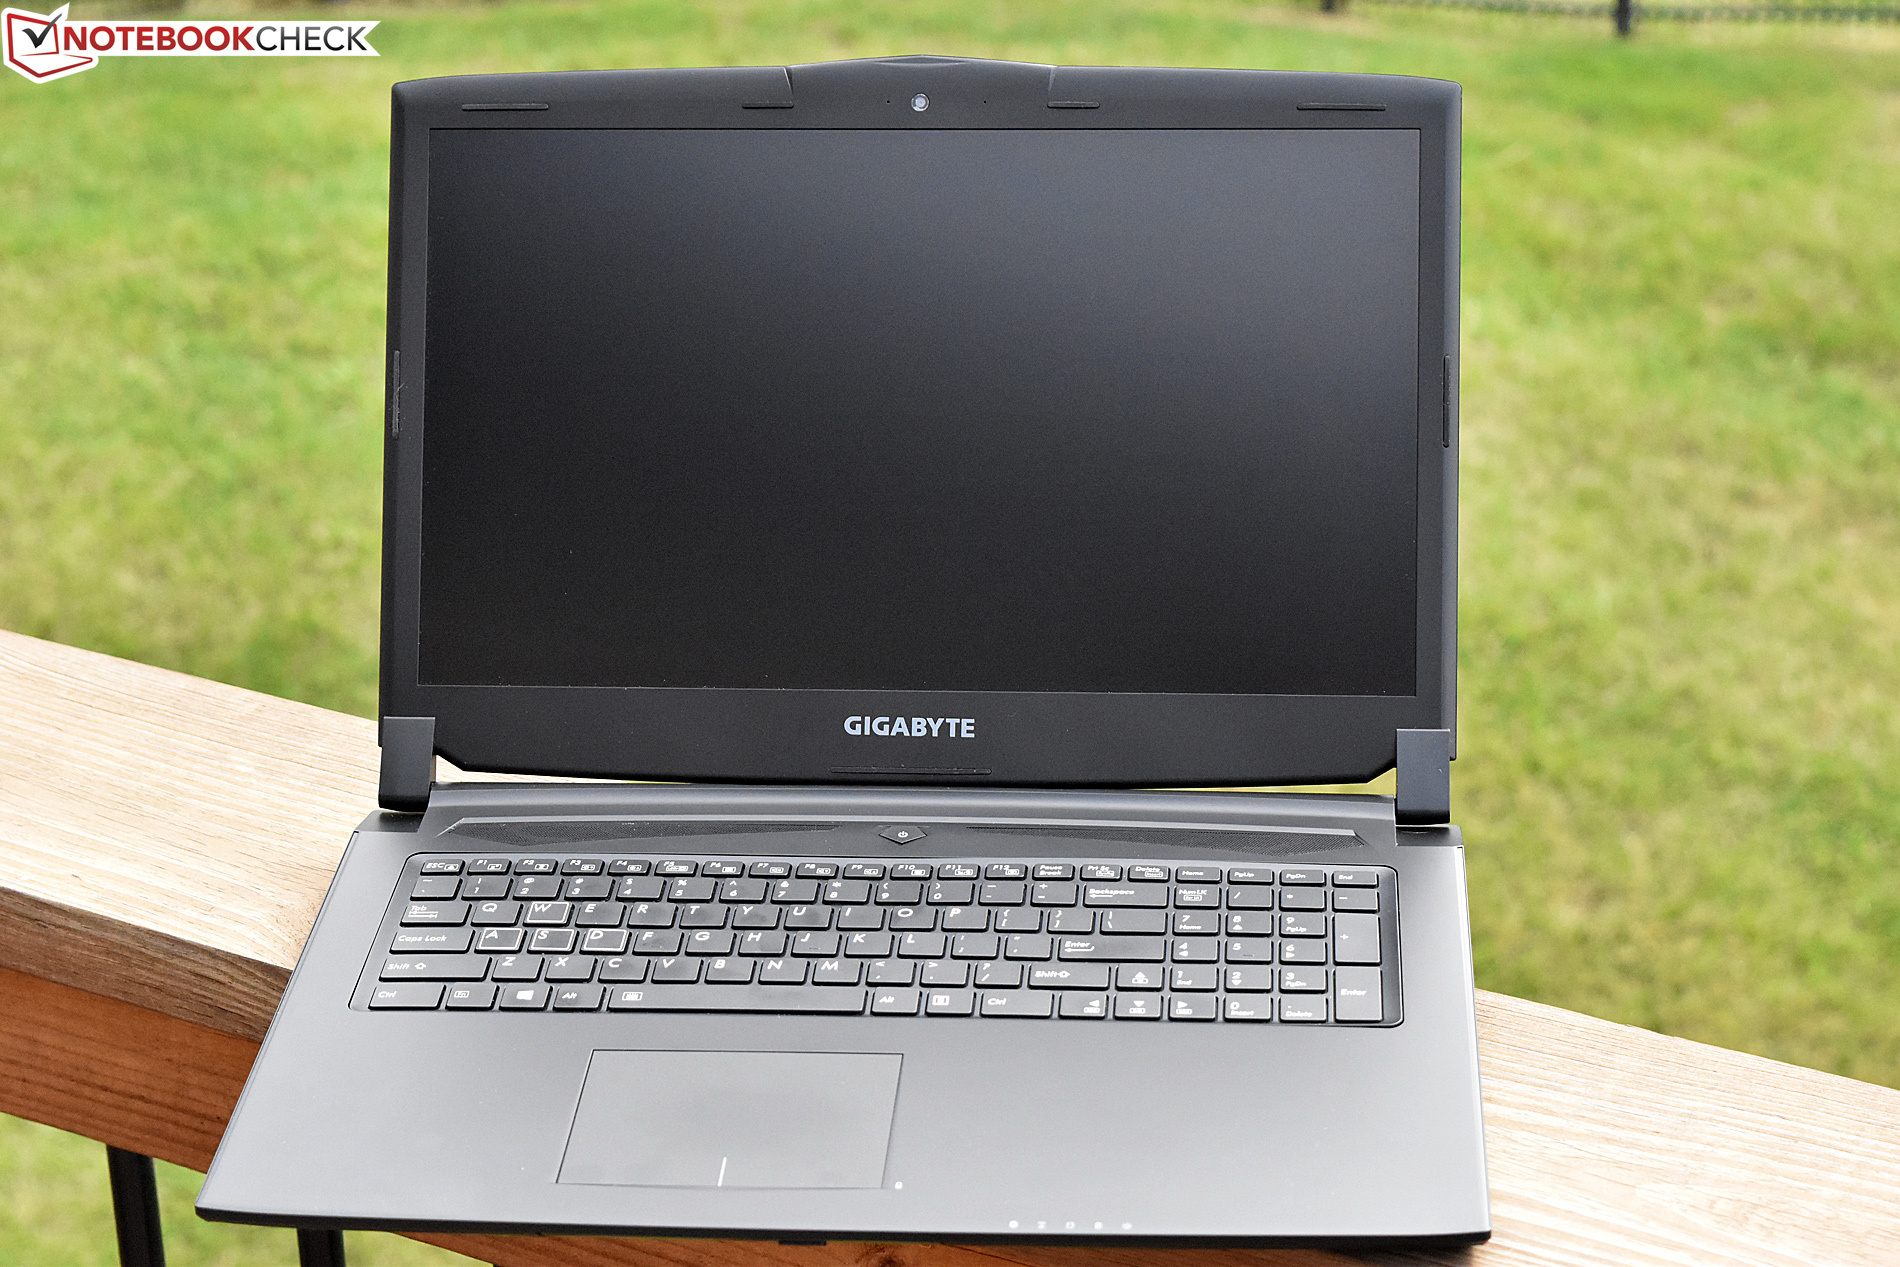
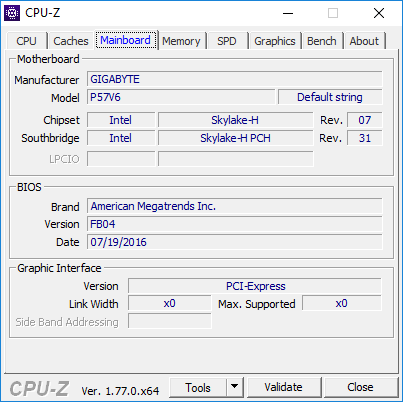
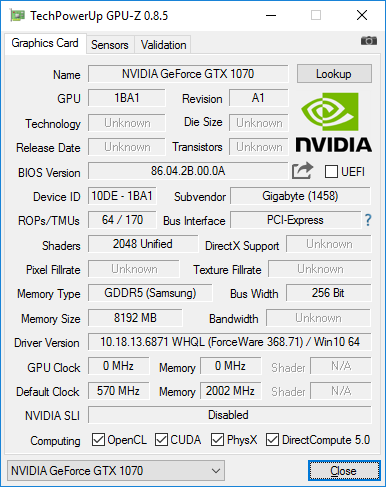
尽管它和前代机型P57W如出一辙,技嘉的P57X v6仍然凭借强劲的英伟达 GeForce GTX 1070给游戏本排行榜带来了不小的冲击。在合理的1999美元(约13300人民币)价位上,它是目前最快的游戏本,可以在全高清分辨率最高设置下流畅运行最新游戏,同时通过HDMI 2.0接口可以在外接显示器上提供不错的4K游戏性能表现。
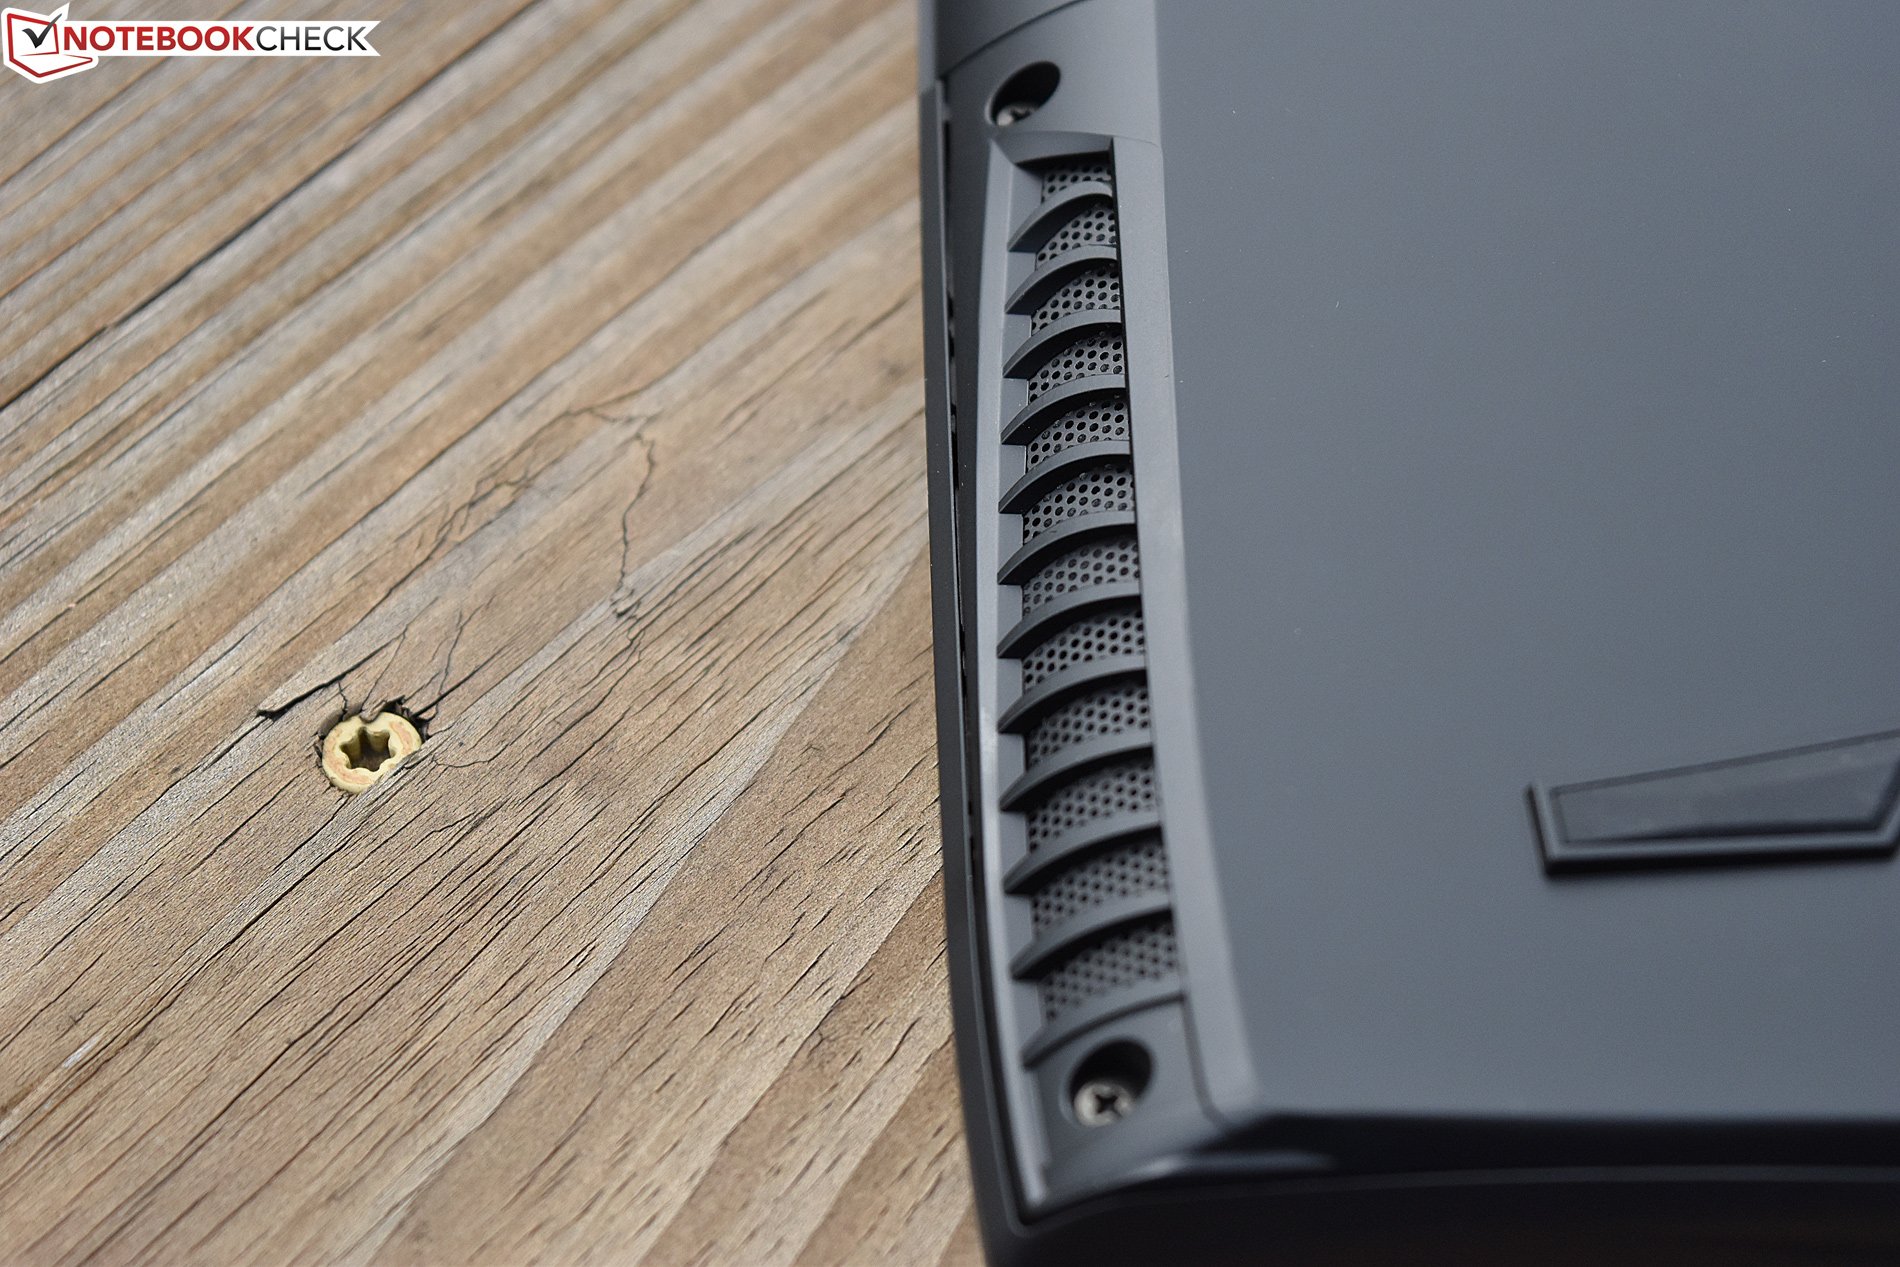
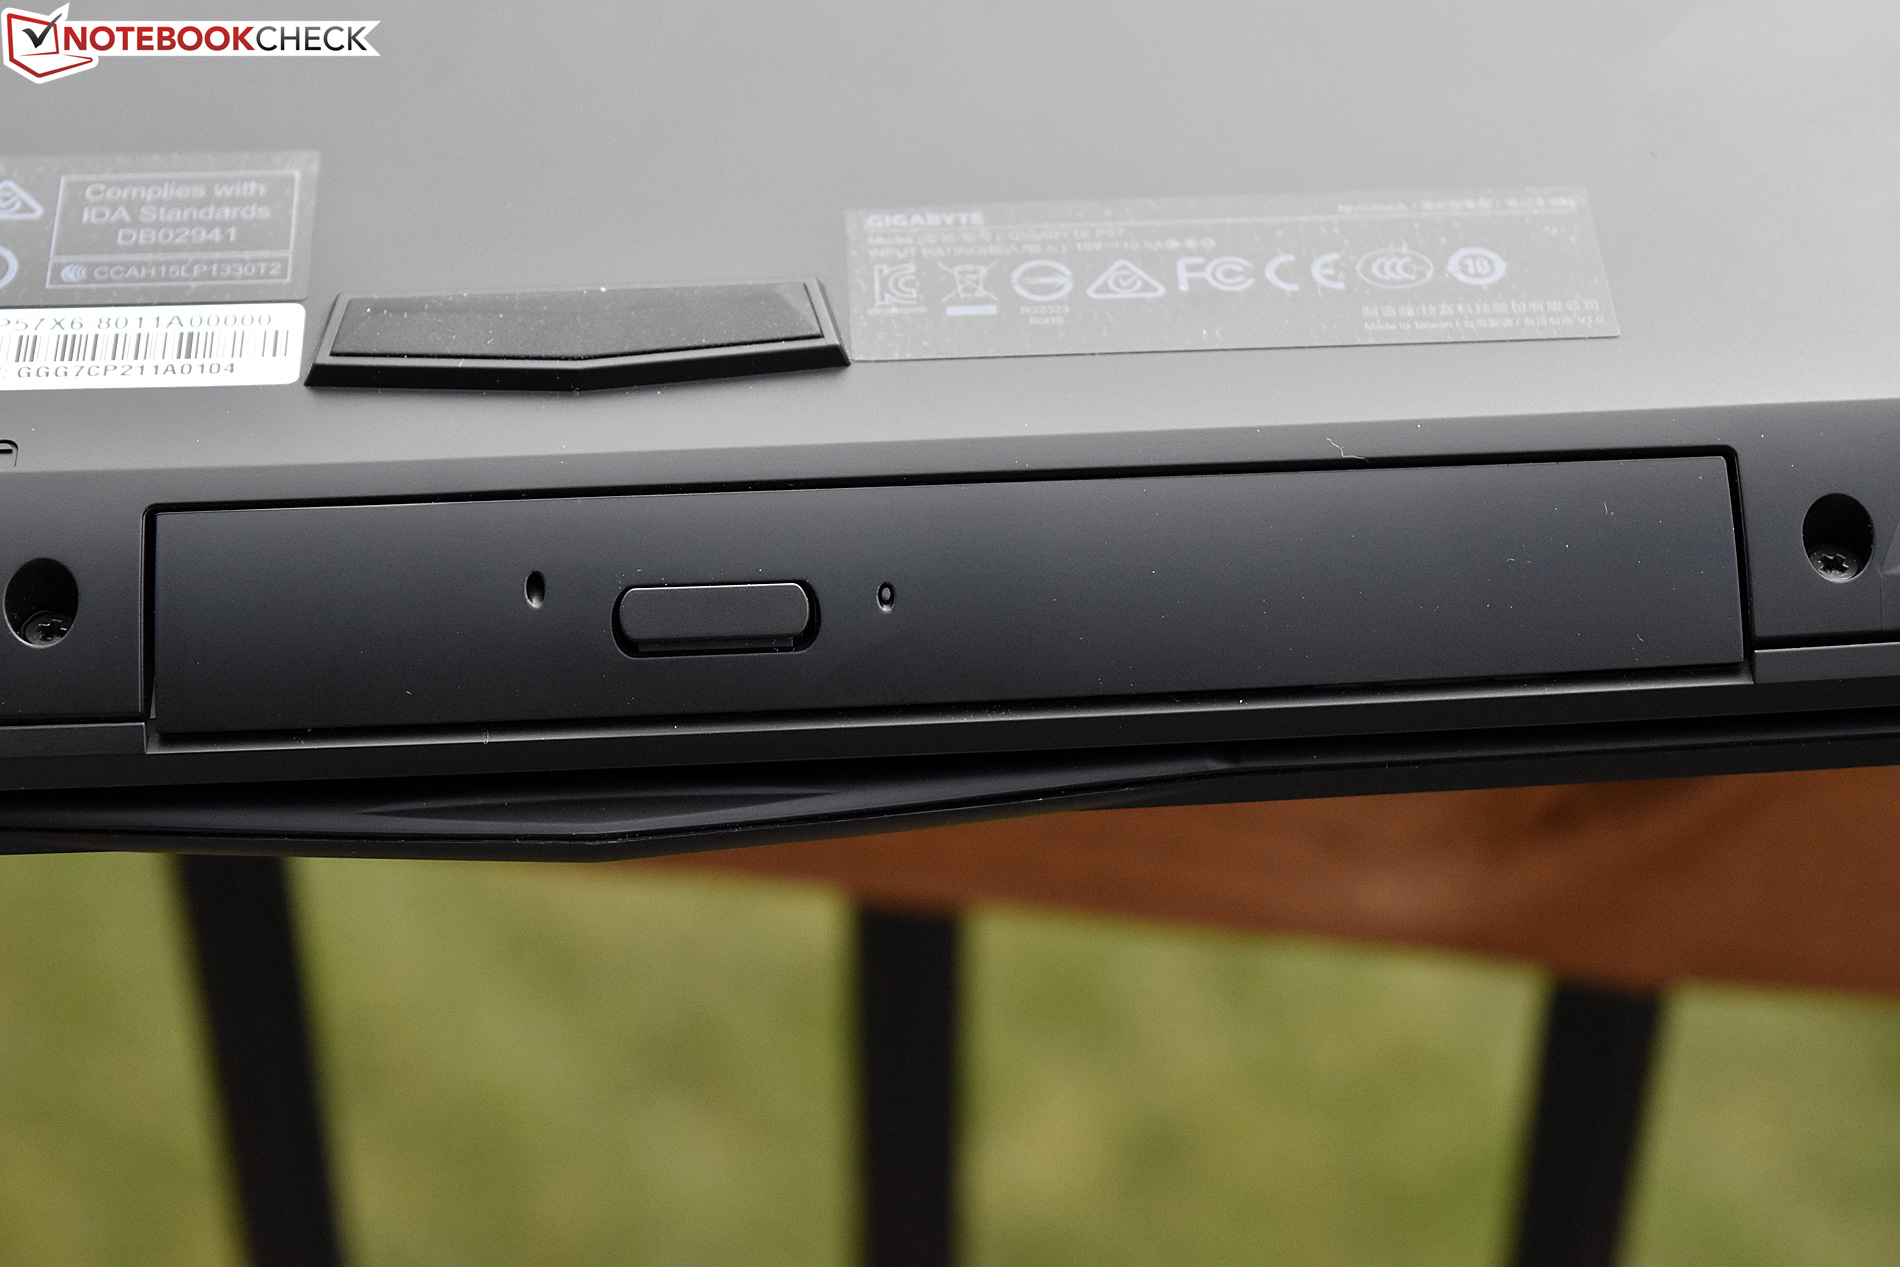
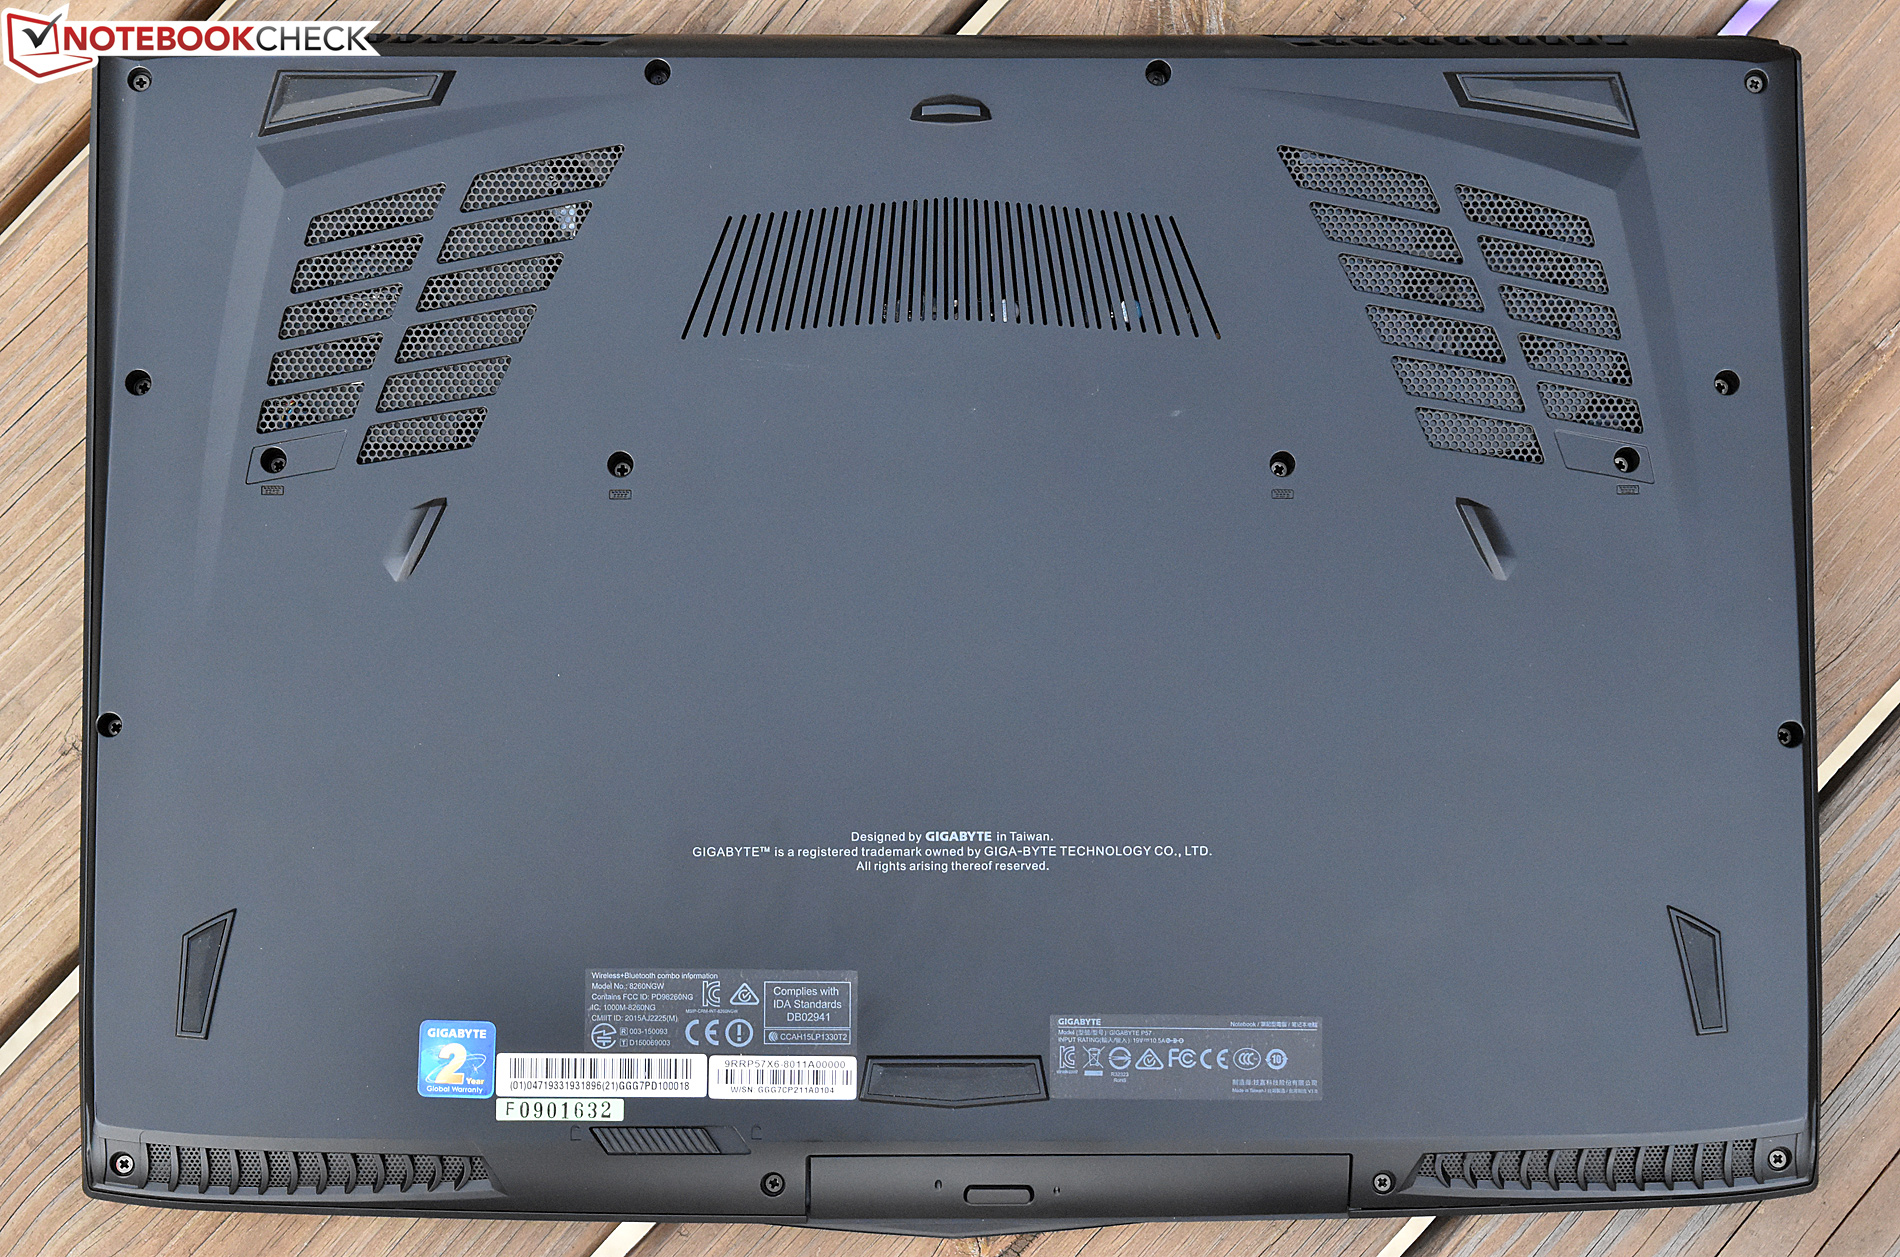
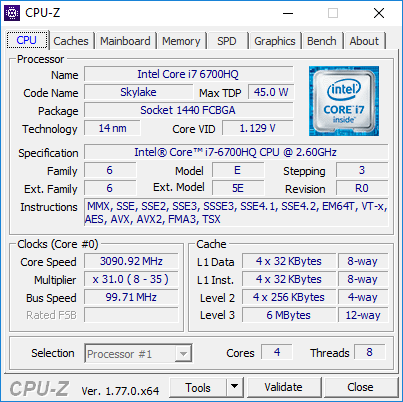
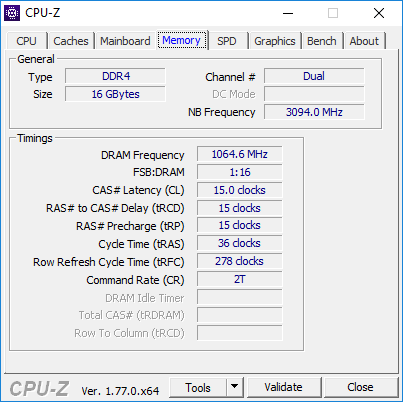
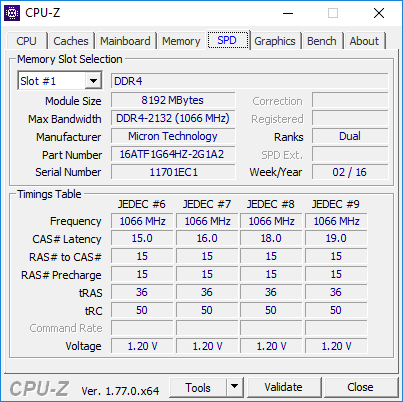
除了最新显卡之外,它的配置也同样强劲,这包括英特尔i7-6700HQ四核处理器,16GB DDR4-2133内存,256GB M.2固态硬盘和1TB 7200转传统硬盘以及1080p分辨率IPS防反光屏幕。技嘉也为它提供了易用的维护升级设计,几乎所有部件都可以打开底盖而更换。需要更高速度的用户可以自行升级NVMe固态硬盘,或者通过随机附带的转换器,取下光驱添加第三块硬盘。
P57X在控制软件上也提供了丰富的功能,如机身散热系统和显卡超频,驱动更新,以及一些其他小工具(屏幕色温控制,USB恢复盘创建工具等)。
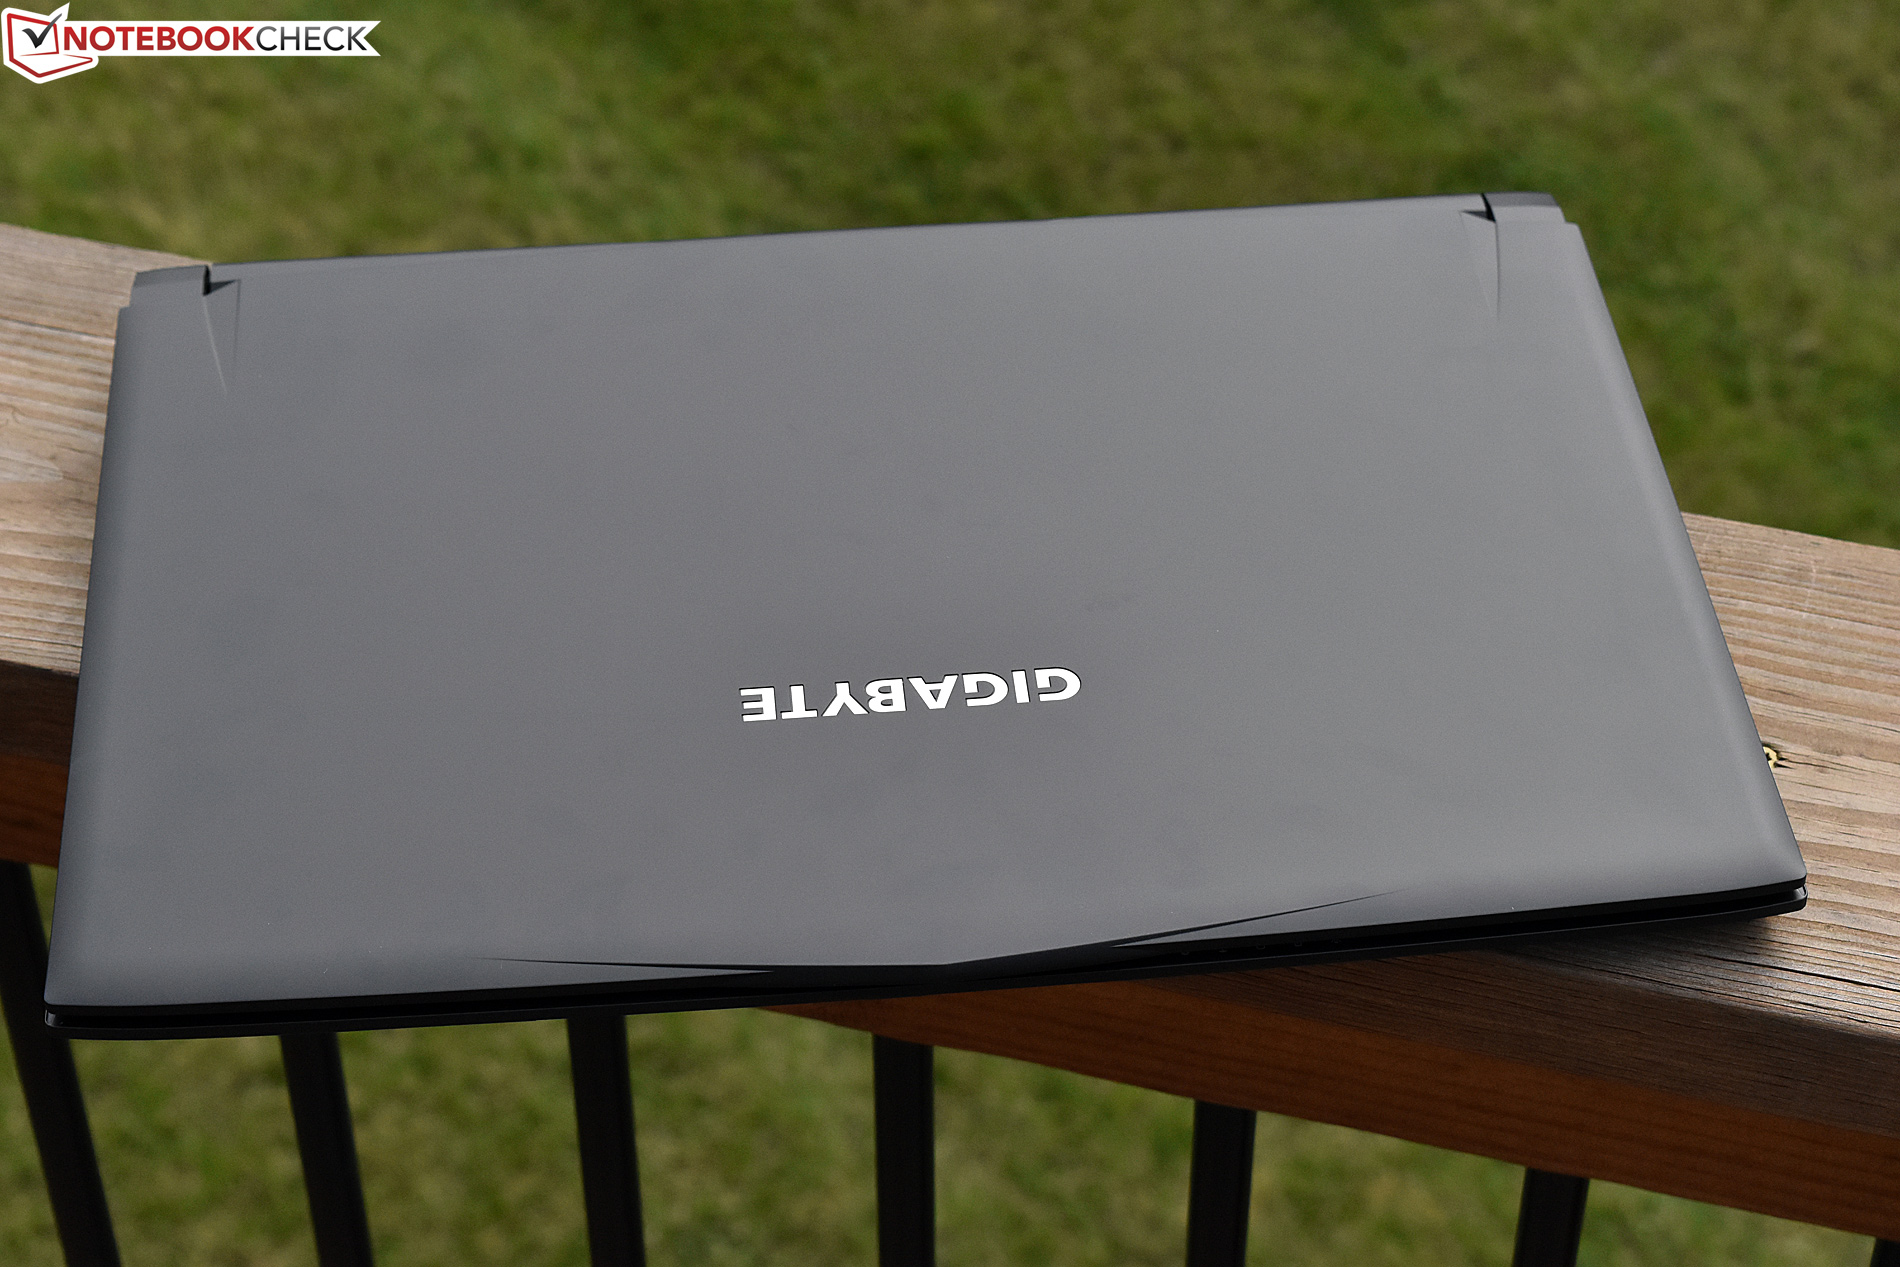
很明显,如果你希望让一台如此强大的游戏笔记本电脑可以贴上不足2000美元的价钱,就不得不做出一些妥协。对P57X来说,这包括塑料材质的机身和较高的发热量,键盘右半部分在游戏中不管如何调整散热风扇速度都会变的很热。它的噪音也相对较大,尽管两个散热风扇都安排在了机身后部(虽然也有一些帮助)。它的功耗相比P57W更高,而电池续航(虽然对于游戏本来说重要性不大)也相对的受到了影响。最后,它的触控版十分不好用,对它感兴趣的用户请一定提前准备好外置鼠标。一些用户可能也会对它没有4K屏幕的选项感到不解,不过这并不会影响它的超高性价比。如果它可以轻松用原生分辨率应对用户交给它的所有任务的话,这当然会是个不错的事情,不过目前看来它仍然对4K分辨率有些力不从心。当然用户仍然可以外接显示器实现4K游戏。
整体上,P57X是个设计还算合理,性能强劲的游戏笔记本电脑,设计重点在功能性,便携型和高性价比。如果你的预算充足,也不怕更高的重量的话,最好还是选择其他的机型。如果不是的话,除了较差的输入设备,散热系统和缺少4K屏幕等缺点,P57X明显是一个怪兽——它将可以在原生分辨率和最高设定下轻松应对甚至是不久未来的大部分游戏。
注:本文是基于完整评测的缩减版本,阅读完整的英文评测,请点击这里。
Gigabyte P57X v6
- 10/03/2016 v5.1 (old)
Steve Schardein
Price comparison
