苹果MacBook Air 2020笔记本电脑评测:你能买到的最好的MacBook?并非如此
Rating | Date | Model | Weight | Height | Size | Resolution | Price |
|---|---|---|---|---|---|---|---|
| 88 % v7 (old) | 06 / 2020 | Apple MacBook Air 2020 i5 i5-1030NG7, Iris Plus Graphics G7 (Ice Lake 64 EU) | 1.3 kg | 16.1 mm | 13.30" | 2560x1600 | |
| 85.6 % v7 (old) | 03 / 2020 | Apple Macbook Air 2019 i5-8210Y, UHD Graphics 617 | 1.3 kg | 15.6 mm | 13.30" | 2560x1600 | |
| 90.6 % v7 (old) | 02 / 2021 | Apple MacBook Pro 13 2019 2TB3 i5-8257U, Iris Plus Graphics 645 | 1.4 kg | 14.9 mm | 13.30" | 2560x1600 | |
| 84 % v7 (old) | 03 / 2020 | Microsoft Surface Laptop 3 13 Core i5-1035G7 i5-1035G7, Iris Plus Graphics G7 (Ice Lake 64 EU) | 1.3 kg | 14.5 mm | 13.50" | 2256x1504 | |
| 87 % v7 (old) | 04 / 2020 | Acer Swift 3 SF313-52-71Y7 i7-1065G7, Iris Plus Graphics G7 (Ice Lake 64 EU) | 1.2 kg | 16.6 mm | 13.50" | 2256x1504 | |
| 88.8 % v7 (old) | 05 / 2020 | Dell XPS 13 9300 i5 FHD i5-1035G1, UHD Graphics G1 (Ice Lake 32 EU) | 1.2 kg | 14.8 mm | 13.40" | 1920x1200 |


, i5-1030NG7, Apple SSD AP0512")
, i5-1030NG7, Apple SSD AP0512")
| |||||||||||||||||||||||||
Brightness Distribution: 89 %
Center on Battery: 427 cd/m²
Contrast: 1344:1 (Black: 0.32 cd/m²)
ΔE ColorChecker Calman: 1.8 | ∀{0.5-29.43 Ø4.72}
calibrated: 1.6
ΔE Greyscale Calman: 1.1 | ∀{0.09-98 Ø4.97}
98.3% sRGB (Calman 2D)
97.6% sRGB (Argyll 1.6.3 3D)
64.2% AdobeRGB 1998 (Argyll 1.6.3 3D)
71.7% AdobeRGB 1998 (Argyll 3D)
97.7% sRGB (Argyll 3D)
70.4% Display P3 (Argyll 3D)
CCT: 6644 K
| Apple MacBook Air 2020 i5 APPA042, IPS, 2560x1600, 13.3" | Apple Macbook Air 2019 APPA041, IPS, 2560x1600, 13.3" | Apple MacBook Pro 13 2019 2TB3 APPA03D, IPS, 2560x1600, 13.3" | Microsoft Surface Laptop 3 13 Core i5-1035G7 Sharp LQ135P1JX51, IPS, 2256x1504, 13.5" | Acer Swift 3 SF313-52-71Y7 BOE, NE135FBM-N41, IPS, 2256x1504, 13.5" | Dell XPS 13 9300 i5 FHD SHP14CB, IPS, 1920x1200, 13.4" | |
|---|---|---|---|---|---|---|
| Display | -4% | 19% | -4% | 0% | 2% | |
| Display P3 Coverage (%) | 70.4 | 67.4 -4% | 96.1 37% | 65.7 -7% | 70.1 0% | 71.5 2% |
| sRGB Coverage (%) | 97.7 | 94.7 -3% | 99.4 2% | 98.6 1% | 99.8 2% | 99.4 2% |
| AdobeRGB 1998 Coverage (%) | 71.7 | 69.1 -4% | 85.6 19% | 67.8 -5% | 71.2 -1% | 73.5 3% |
| Response Times | -4% | -23% | -45% | -22% | -32% | |
| Response Time Grey 50% / Grey 80% * (ms) | 38.7 ? | 42.4 ? -10% | 50.4 ? -30% | 59.2 ? -53% | 55 ? -42% | 60 ? -55% |
| Response Time Black / White * (ms) | 30.44 ? | 29.6 ? 3% | 35.2 ? -16% | 41.6 ? -37% | 31 ? -2% | 33.2 ? -9% |
| PWM Frequency (Hz) | 117000 ? | 111100 ? | 116300 ? | 21740 ? | 208 ? | 2500 ? |
| Screen | -0% | 12% | 10% | -30% | -33% | |
| Brightness middle (cd/m²) | 430 | 421 -2% | 603 40% | 403.4 -6% | 474 10% | 619 44% |
| Brightness (cd/m²) | 405 | 393 -3% | 577 42% | 397 -2% | 426 5% | 591 46% |
| Brightness Distribution (%) | 89 | 88 -1% | 92 3% | 89 0% | 82 -8% | 91 2% |
| Black Level * (cd/m²) | 0.32 | 0.34 -6% | 0.35 -9% | 0.34 -6% | 0.29 9% | 0.35 -9% |
| Contrast (:1) | 1344 | 1238 -8% | 1723 28% | 1186 -12% | 1634 22% | 1769 32% |
| Colorchecker dE 2000 * | 1.8 | 1.5 17% | 1.7 6% | 0.94 48% | 2.38 -32% | 3 -67% |
| Colorchecker dE 2000 max. * | 4.6 | 3.8 17% | 3.1 33% | 2.92 37% | 5.88 -28% | 8.2 -78% |
| Colorchecker dE 2000 calibrated * | 1.6 | 0.7 56% | 0.99 38% | 2.69 -68% | 1 37% | |
| Greyscale dE 2000 * | 1.1 | 1.2 -9% | 2.1 -91% | 0.9 18% | 3.75 -241% | 5.2 -373% |
| CCT | 6644 98% | 6694 97% | 6843 95% | 6620 98% | 6466 101% | 6340 103% |
| Color Space (Percent of AdobeRGB 1998) (%) | 64.2 | 61.3 -5% | 76.7 19% | 62.3 -3% | 65 1% | 66.9 4% |
| Color Space (Percent of sRGB) (%) | 97.6 | 94.6 -3% | 99.4 2% | 98.7 1% | 100 2% | 99.3 2% |
| Gamma | 2.21 100% | 2.18 101% | 2.13 103% | 2.37 93% | 2.14 103% | |
| Total Average (Program / Settings) | -3% /
-1% | 3% /
9% | -13% /
1% | -17% /
-23% | -21% /
-26% |
* ... smaller is better

Display Response Times
| ↔ Response Time Black to White | ||
|---|---|---|
| 30.44 ms ... rise ↗ and fall ↘ combined | ↗ 17.9 ms rise | 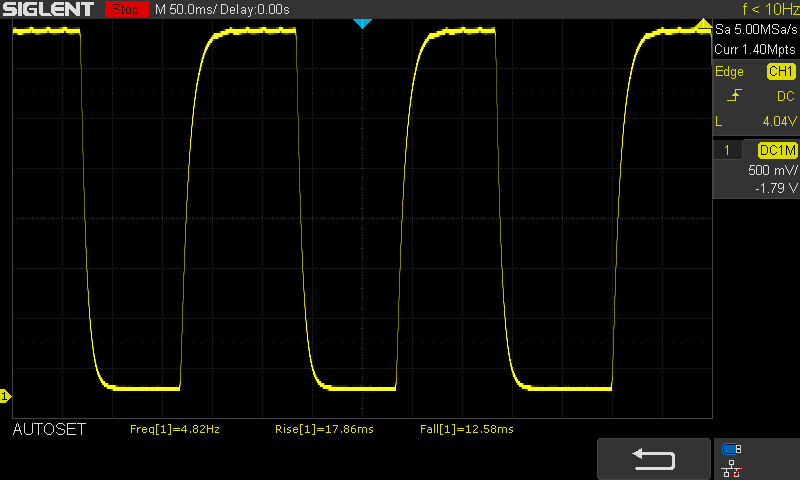 |
| ↘ 12.6 ms fall | ||
| The screen shows slow response rates in our tests and will be unsatisfactory for gamers. In comparison, all tested devices range from 0.1 (minimum) to 240 (maximum) ms. » 83 % of all devices are better. This means that the measured response time is worse than the average of all tested devices (19.8 ms). | ||
| ↔ Response Time 50% Grey to 80% Grey | ||
| 38.7 ms ... rise ↗ and fall ↘ combined | ↗ 19.6 ms rise | 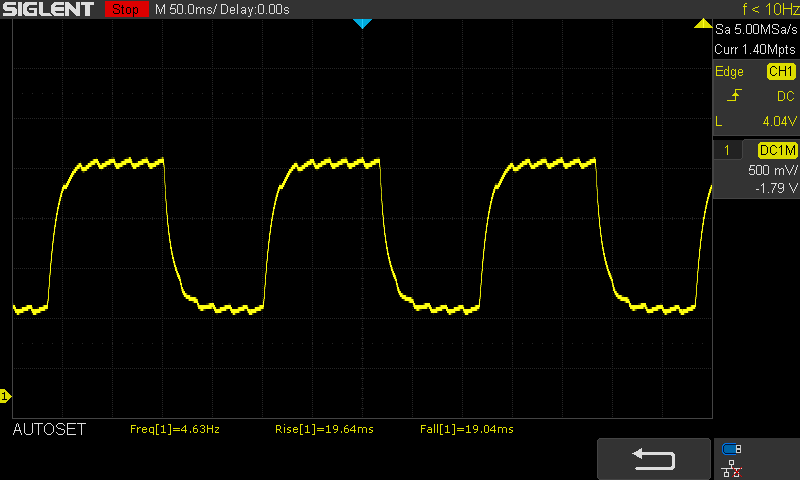 |
| ↘ 19 ms fall | ||
| The screen shows slow response rates in our tests and will be unsatisfactory for gamers. In comparison, all tested devices range from 0.165 (minimum) to 636 (maximum) ms. » 58 % of all devices are better. This means that the measured response time is worse than the average of all tested devices (31 ms). | ||
Screen Flickering / PWM (Pulse-Width Modulation)
| Screen flickering / PWM detected | 117000 Hz | ≤ 75 % brightness setting | 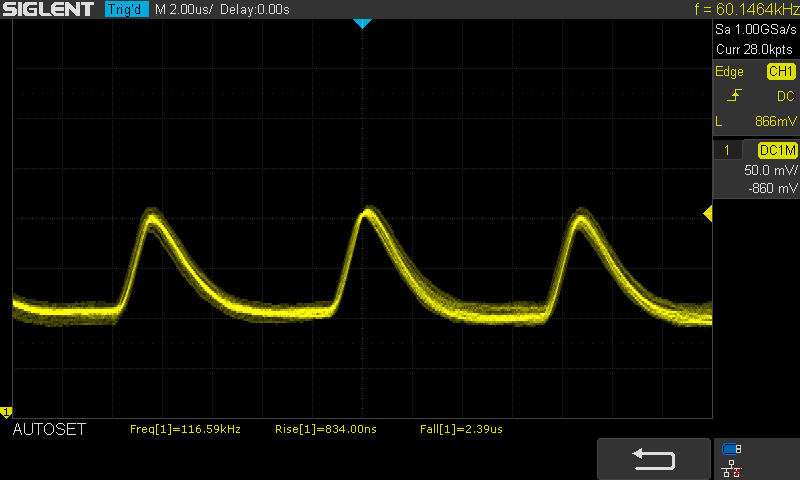 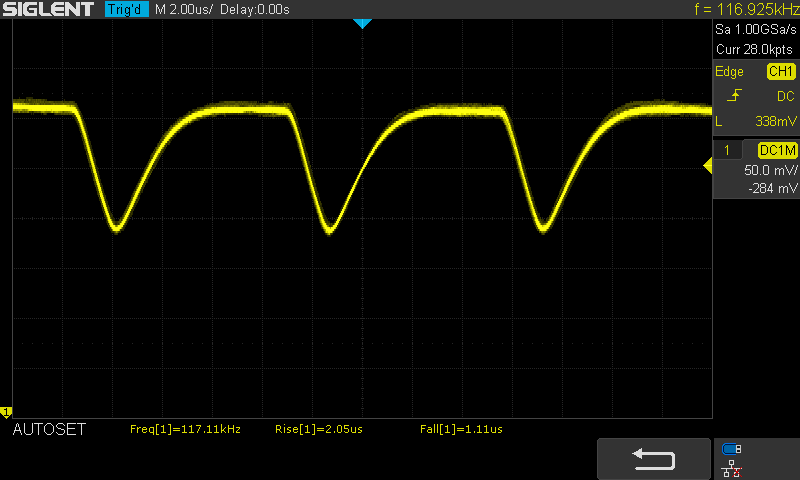 |
The display backlight flickers at 117000 Hz (worst case, e.g., utilizing PWM) Flickering detected at a brightness setting of 75 % and below. There should be no flickering or PWM above this brightness setting. The frequency of 117000 Hz is quite high, so most users sensitive to PWM should not notice any flickering. In comparison: 52 % of all tested devices do not use PWM to dim the display. If PWM was detected, an average of 7778 (minimum: 5 - maximum: 343500) Hz was measured. | |||
| Blackmagic RAW Speed Test - 12:1 8K CPU | |
| Average of class Subnotebook (22 - 49, n=5, last 2 years) | |
| Apple MacBook Pro 16 2019 i9 5500M | |
| Apple MacBook Air 2020 i5 | |
| R Benchmark 2.5 - Overall mean | |
| Apple MacBook Air 2020 i5 (macOS) | |
| Apple MacBook Air 2020 i5 (Win 10) | |
| Dell XPS 13 9300 i5 FHD | |
| Acer Swift 3 SF313-52-71Y7 | |
| Apple MacBook Pro 16 2019 i9 5500M (macOS) | |
| Apple MacBook Pro 16 2019 i9 5500M (Win 10) | |
| Average of class Subnotebook (0.4024 - 1.456, n=57, last 2 years) | |
* ... smaller is better
| DPC Latencies / LatencyMon - interrupt to process latency (max), Web, Youtube, Prime95 | |
| Dell XPS 13 9300 Core i7-1065G7 | |
| Lenovo ThinkPad X1 Carbon G7 20R1-000YUS | |
| Eve-Tech Eve V i7 | |
| Asus Zephyrus G14 GA401IV | |
| Apple MacBook Air 2020 i5 | |
| Schenker VIA 14 | |
| BMAX MaxBook Y11 H1M6 | |
| Average of class Subnotebook (316 - 8148, n=39, last 2 years) | |
| Dell XPS 13 9300 i5 FHD | |
| LG Gram 14T90N | |
| Dell XPS 13 2016 9350 (FHD, i7-6560U) | |
* ... smaller is better
| Apple MacBook Air 2020 i5 Apple SSD AP0512 | Apple Macbook Air 2019 Apple SSD AP0256 | Apple MacBook Pro 13 2019 2TB3 Apple SSD AP0256 | Microsoft Surface Laptop 3 13 Core i5-1035G7 SK hynix BC501 HFM256GDGTNG | Acer Swift 3 SF313-52-71Y7 Intel SSD 660p 1TB SSDPEKNW010T8 | Dell XPS 13 9300 i5 FHD Toshiba XG6 KXG60ZNV512G | Apple MacBook Pro 16 2019 i9 5500M Apple SSD AP1024 7171 | Average of class Subnotebook | |
|---|---|---|---|---|---|---|---|---|
| AS SSD | -16% | -4% | 50% | 139% | 218% | 194% | 294% | |
| Seq Read (MB/s) | 1153 | 933 -19% | 974 -16% | 1387 20% | 1703 48% | 2328 102% | 2531 120% | 4499 ? 290% |
| Seq Write (MB/s) | 1367 | 1139 -17% | 1340 -2% | 504 -63% | 1373 0% | 1137 -17% | 2289 67% | 2974 ? 118% |
| 4K Read (MB/s) | 12.95 | 10.53 -19% | 11.35 -12% | 42.35 227% | 56.8 339% | 48.07 271% | 15.85 22% | 59.5 ? 359% |
| 4K Write (MB/s) | 24.52 | 15.03 -39% | 15.95 -35% | 120 389% | 164.4 570% | 120.6 392% | 39.88 63% | 168.1 ? 586% |
| 4K-64 Read (MB/s) | 665 | 534 -20% | 643 -3% | 497.4 -25% | 584 -12% | 899 35% | 1267 91% | 862 ? 30% |
| 4K-64 Write (MB/s) | 159.5 | 181.6 14% | 163 2% | 354.9 123% | 783 391% | 1220 665% | 1749 997% | 1701 ? 966% |
| Score Read (Points) | 793 | 638 -20% | 752 -5% | 678 -15% | 811 2% | 1180 49% | 1536 94% | 1370 ? 73% |
| Score Write (Points) | 321 | 311 -3% | 313 -2% | 525 64% | 1085 238% | 1455 353% | 2018 529% | 2166 ? 575% |
| Score Total (Points) | 1528 | 1283 -16% | 1465 -4% | 1520 -1% | 2313 51% | 3189 109% | 4317 183% | 4175 ? 173% |
| Copy ISO MB/s (MB/s) | 1433 | 1205 -16% | 1404 -2% | 764 -47% | 1401 -2% | 1995 39% | 2594 ? 81% | |
| Copy Program MB/s (MB/s) | 363 | 302.1 -17% | 406.9 12% | 256.1 -29% | 480.4 32% | 584 61% | 829 ? 128% | |
| Copy Game MB/s (MB/s) | 725 | 627 -14% | 850 17% | 368.4 -49% | 820 13% | 1135 57% | 1783 ? 146% |

| Unigine Valley 1.0 - 1920x1080 Extreme HD Preset OpenGL AA:x8 | |
| Apple MacBook Pro 16 2019 i9 5500M | |
| Average of class Subnotebook (4.7 - 26.2, n=5, last 2 years) | |
| Apple MacBook Pro 13 2018 Touchbar i5 | |
| Apple MacBook Pro 13 2017 Touchbar i5 | |
| Apple MacBook Air 2020 i5 | |
| Average Intel Iris Plus Graphics G7 (Ice Lake 64 EU) (n=1) | |
| Basemark GPU 1.2 | |
| 3840x2160 Metal High Offscreen | |
| Apple iPad Pro 11 2020 | |
| Apple MacBook Pro 16 2019 i9 5500M | |
| Apple MacBook Air 2020 i5 | |
| Average Intel Iris Plus Graphics G7 (Ice Lake 64 EU) (n=1) | |
| 1920x1080 Metal Medium Offscreen | |
| Apple MacBook Pro 16 2019 i9 5500M | |
| Apple iPad Pro 11 2018 | |
| Apple iPad Pro 11 2020 | |
| Apple MacBook Air 2020 i5 | |
| Average Intel Iris Plus Graphics G7 (Ice Lake 64 EU) (n=1) | |
| 3DMark 06 Standard Score | 8821 points | |
| 3DMark 11 Performance | 2848 points | |
| 3DMark Fire Strike Score | 1605 points | |
| 3DMark Time Spy Score | 587 points | |
Help | ||
| The Witcher 3 - 1024x768 Low Graphics & Postprocessing | |
| Average of class Subnotebook (38.8 - 176, n=13, last 2 years) | |
| Microsoft Surface Laptop 3 13 Core i5-1035G7 | |
| Average Intel Iris Plus Graphics G7 (Ice Lake 64 EU) (28.2 - 58, n=20) | |
| Apple MacBook Air 2020 i5 | |
| Shadow of the Tomb Raider - 1280x720 Lowest Preset | |
| Average of class Subnotebook (41 - 109, n=7, last 2 years) | |
| Average Intel Iris Plus Graphics G7 (Ice Lake 64 EU) (15.6 - 33, n=13) | |
| Microsoft Surface Laptop 3 13 Core i5-1035G7 | |
| Apple MacBook Air 2020 i5 | |
| low | med. | high | ultra | |
|---|---|---|---|---|
| BioShock Infinite (2013) | 55.6 | 33.5 | 29.1 | 10.9 |
| GTA V (2015) | 24.8 | |||
| The Witcher 3 (2015) | 28.2 | 5.13 | ||
| Dota 2 Reborn (2015) | 59.4 | 30.7 | 20.5 | 19.8 |
| Rocket League (2017) | 22.1 | 24.9 | ||
| X-Plane 11.11 (2018) | 24 | 11.6 | 10.8 | |
| World of Tanks enCore (2018) | 92.9 | 14.6 | ||
| Far Cry 5 (2018) | 11 | |||
| Shadow of the Tomb Raider (2018) | 15.6 | |||
| Battlefield V (2018) | 7.87 | |||
| Anno 1800 (2019) | 19 | |||
| FIFA 20 (2019) | 0 game wont start |
Noise level
| Idle |
| 30 / 30 / 30 dB(A) |
| Load |
| 45.5 / 45.8 dB(A) |
 | ||
30 dB silent 40 dB(A) audible 50 dB(A) loud |
||
min: | ||
| Apple MacBook Air 2020 i5 Iris Plus Graphics G7 (Ice Lake 64 EU), i5-1030NG7, Apple SSD AP0512 | Apple Macbook Air 2019 UHD Graphics 617, i5-8210Y, Apple SSD AP0256 | Apple MacBook Pro 13 2019 2TB3 Iris Plus Graphics 645, i5-8257U, Apple SSD AP0256 | Microsoft Surface Laptop 3 13 Core i5-1035G7 Iris Plus Graphics G7 (Ice Lake 64 EU), i5-1035G7, SK hynix BC501 HFM256GDGTNG | Acer Swift 3 SF313-52-71Y7 Iris Plus Graphics G7 (Ice Lake 64 EU), i7-1065G7, Intel SSD 660p 1TB SSDPEKNW010T8 | Dell XPS 13 9300 i5 FHD UHD Graphics G1 (Ice Lake 32 EU), i5-1035G1, Toshiba XG6 KXG60ZNV512G | |
|---|---|---|---|---|---|---|
| Noise | 7% | 9% | 12% | 9% | 12% | |
| off / environment * (dB) | 30 | 29.5 2% | 29.5 2% | 28.5 5% | 30.3 -1% | 29.3 2% |
| Idle Minimum * (dB) | 30 | 29.5 2% | 29.5 2% | 28.5 5% | 30.3 -1% | 29.3 2% |
| Idle Average * (dB) | 30 | 29.5 2% | 29.5 2% | 28.5 5% | 30.3 -1% | 29.3 2% |
| Idle Maximum * (dB) | 30 | 29.5 2% | 29.5 2% | 28.5 5% | 30.3 -1% | 29.3 2% |
| Load Average * (dB) | 45.5 | 34 25% | 31.1 32% | 28.5 37% | 31.7 30% | 30 34% |
| Load Maximum * (dB) | 45.8 | 41 10% | 39.3 14% | 40.4 12% | 32.7 29% | 32.4 29% |
| Witcher 3 ultra * (dB) | 40.4 |
* ... smaller is better
(-) The maximum temperature on the upper side is 48 °C / 118 F, compared to the average of 35.9 °C / 97 F, ranging from 21.4 to 59 °C for the class Subnotebook.
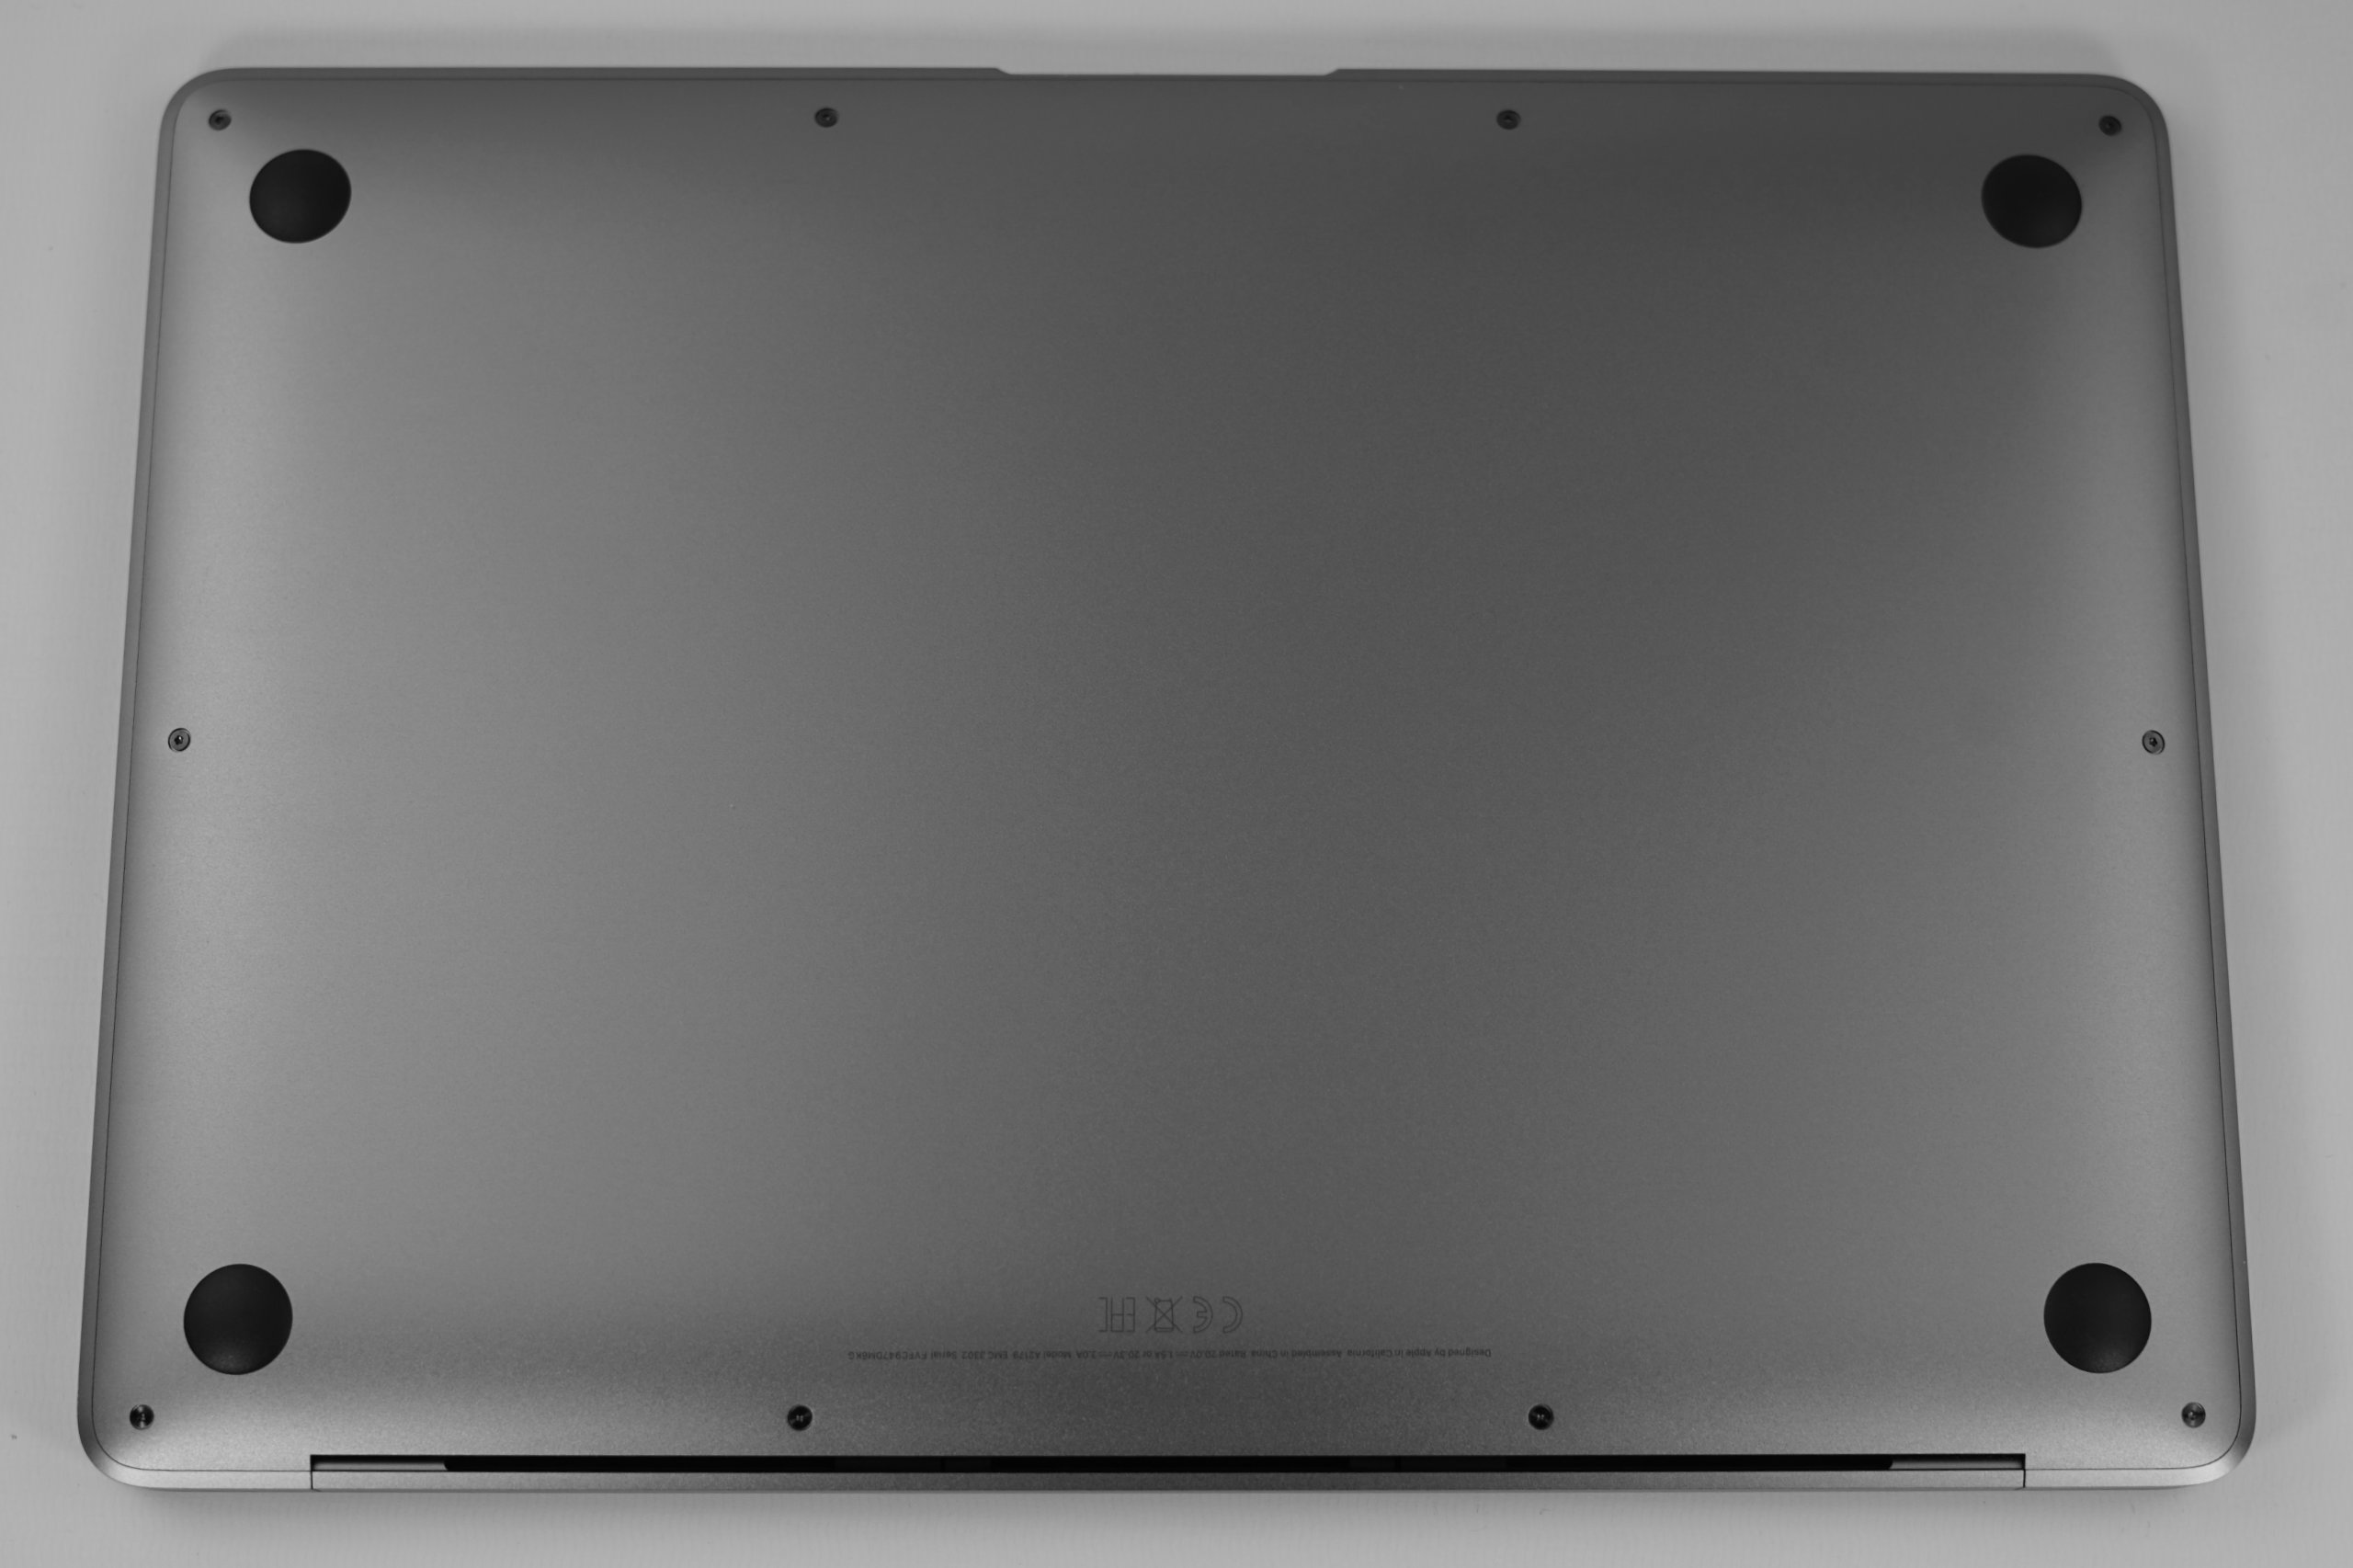
(±) The bottom heats up to a maximum of 40 °C / 104 F, compared to the average of 39.2 °C / 103 F
(+) In idle usage, the average temperature for the upper side is 27.7 °C / 82 F, compared to the device average of 30.8 °C / 87 F.
(±) Playing The Witcher 3, the average temperature for the upper side is 32.8 °C / 91 F, compared to the device average of 30.8 °C / 87 F.
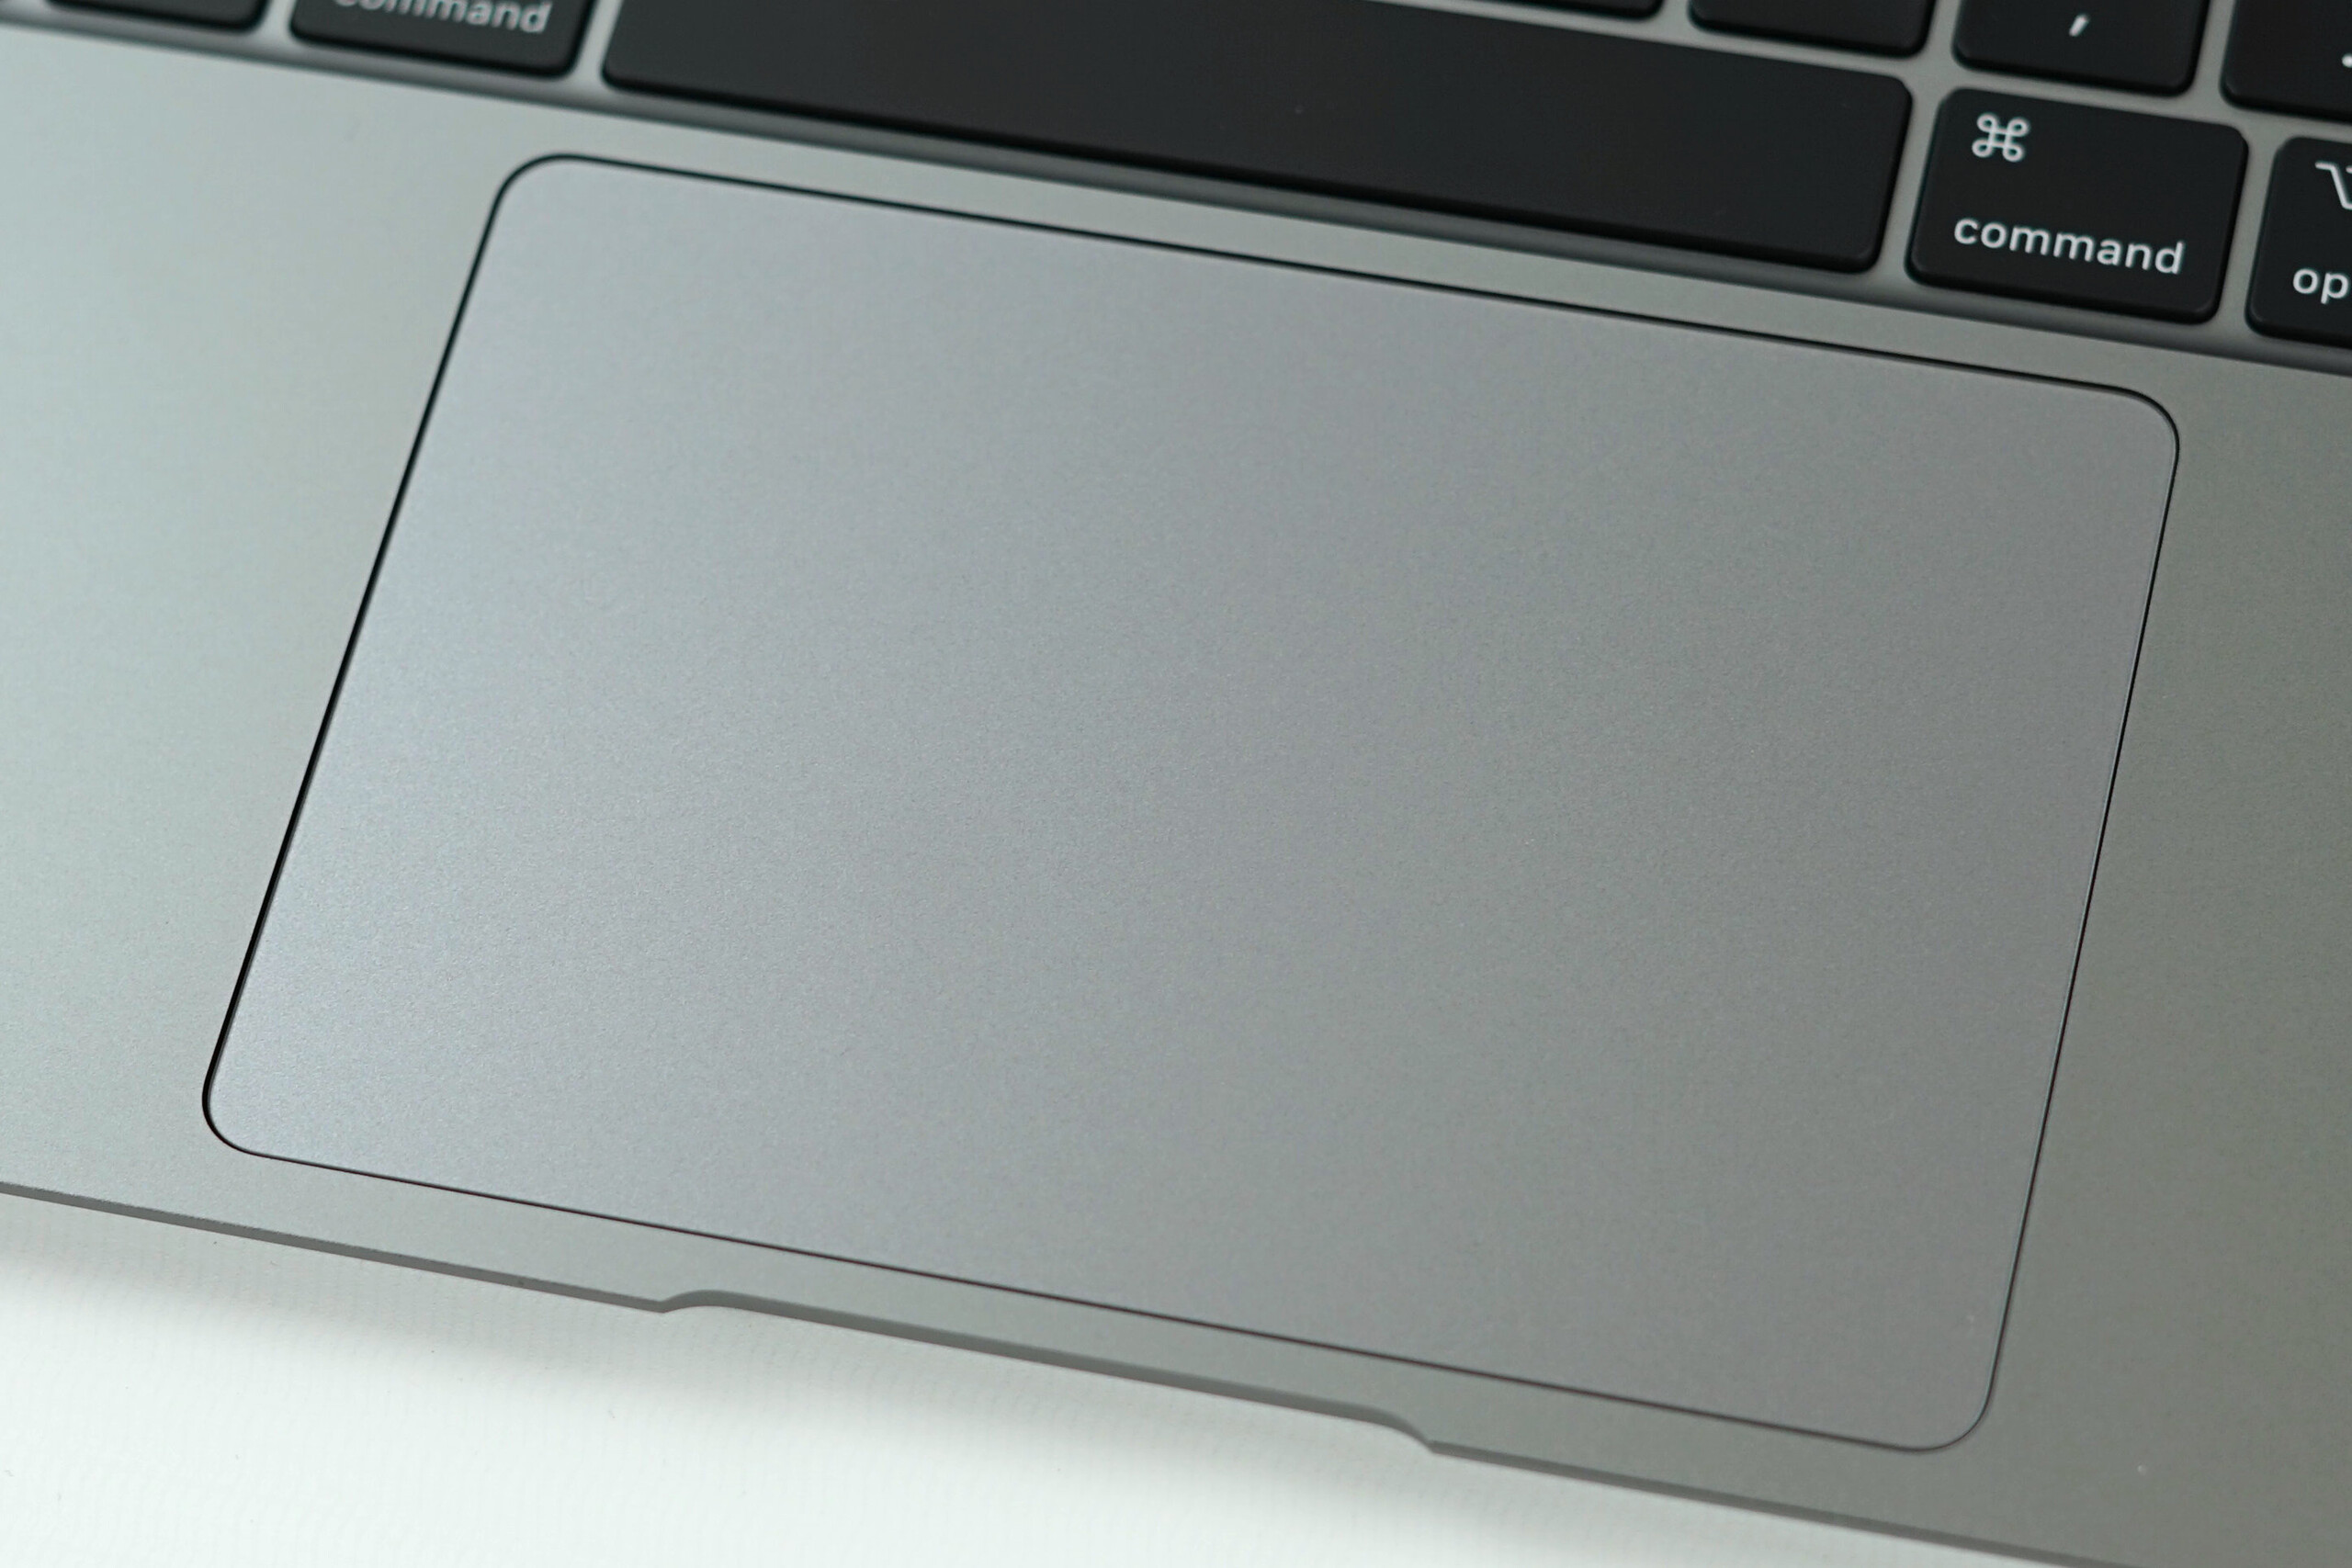
(+) The palmrests and touchpad are cooler than skin temperature with a maximum of 29 °C / 84.2 F and are therefore cool to the touch.
(±) The average temperature of the palmrest area of similar devices was 28.2 °C / 82.8 F (-0.8 °C / -1.4 F).
Apple MacBook Air 2020 i5 audio analysis
(±) | speaker loudness is average but good (78.1 dB)
Bass 100 - 315 Hz
(+) | good bass - only 4.3% away from median
(±) | linearity of bass is average (11.5% delta to prev. frequency)
Mids 400 - 2000 Hz
(+) | balanced mids - only 3.4% away from median
(+) | mids are linear (6.2% delta to prev. frequency)
Highs 2 - 16 kHz
(+) | balanced highs - only 2% away from median
(+) | highs are linear (3.7% delta to prev. frequency)
Overall 100 - 16.000 Hz
(+) | overall sound is linear (9.9% difference to median)
Compared to same class
» 7% of all tested devices in this class were better, 1% similar, 92% worse
» The best had a delta of 5%, average was 18%, worst was 53%
Compared to all devices tested
» 4% of all tested devices were better, 1% similar, 95% worse
» The best had a delta of 4%, average was 24%, worst was 134%
Apple Macbook Air 2019 audio analysis
(±) | speaker loudness is average but good (75.8 dB)
Bass 100 - 315 Hz
(±) | reduced bass - on average 8.9% lower than median
(±) | linearity of bass is average (11.6% delta to prev. frequency)
Mids 400 - 2000 Hz
(+) | balanced mids - only 3% away from median
(+) | mids are linear (5.1% delta to prev. frequency)
Highs 2 - 16 kHz
(+) | balanced highs - only 2.9% away from median
(+) | highs are linear (4.7% delta to prev. frequency)
Overall 100 - 16.000 Hz
(+) | overall sound is linear (14.3% difference to median)
Compared to same class
» 28% of all tested devices in this class were better, 6% similar, 66% worse
» The best had a delta of 5%, average was 18%, worst was 53%
Compared to all devices tested
» 17% of all tested devices were better, 4% similar, 79% worse
» The best had a delta of 4%, average was 24%, worst was 134%
Apple MacBook Pro 16 2019 i9 5500M audio analysis
(+) | speakers can play relatively loud (82.3 dB)
Bass 100 - 315 Hz
(+) | good bass - only 2.3% away from median
(+) | bass is linear (5% delta to prev. frequency)
Mids 400 - 2000 Hz
(+) | balanced mids - only 2.7% away from median
(+) | mids are linear (3.4% delta to prev. frequency)
Highs 2 - 16 kHz
(+) | balanced highs - only 2.1% away from median
(+) | highs are linear (2.6% delta to prev. frequency)
Overall 100 - 16.000 Hz
(+) | overall sound is linear (6.9% difference to median)
Compared to same class
» 5% of all tested devices in this class were better, 1% similar, 94% worse
» The best had a delta of 5%, average was 17%, worst was 45%
Compared to all devices tested
» 1% of all tested devices were better, 0% similar, 99% worse
» The best had a delta of 4%, average was 24%, worst was 134%
Microsoft Surface Laptop 3 13 Core i5-1035G7 audio analysis
(±) | speaker loudness is average but good (79 dB)
Bass 100 - 315 Hz
(+) | good bass - only 4.2% away from median
(±) | linearity of bass is average (10.5% delta to prev. frequency)
Mids 400 - 2000 Hz
(+) | balanced mids - only 3.6% away from median
(±) | linearity of mids is average (7.1% delta to prev. frequency)
Highs 2 - 16 kHz
(+) | balanced highs - only 1.8% away from median
(+) | highs are linear (6.5% delta to prev. frequency)
Overall 100 - 16.000 Hz
(+) | overall sound is linear (11.4% difference to median)
Compared to same class
» 3% of all tested devices in this class were better, 2% similar, 95% worse
» The best had a delta of 7%, average was 21%, worst was 53%
Compared to all devices tested
» 7% of all tested devices were better, 2% similar, 91% worse
» The best had a delta of 4%, average was 24%, worst was 134%
Dell XPS 13 9300 i5 FHD audio analysis
(±) | speaker loudness is average but good (78.4 dB)
Bass 100 - 315 Hz
(±) | reduced bass - on average 9.4% lower than median
(±) | linearity of bass is average (12.5% delta to prev. frequency)
Mids 400 - 2000 Hz
(±) | higher mids - on average 6.7% higher than median
(+) | mids are linear (5.6% delta to prev. frequency)
Highs 2 - 16 kHz
(+) | balanced highs - only 4% away from median
(+) | highs are linear (5% delta to prev. frequency)
Overall 100 - 16.000 Hz
(±) | linearity of overall sound is average (19.8% difference to median)
Compared to same class
» 62% of all tested devices in this class were better, 7% similar, 31% worse
» The best had a delta of 5%, average was 18%, worst was 53%
Compared to all devices tested
» 50% of all tested devices were better, 7% similar, 43% worse
» The best had a delta of 4%, average was 24%, worst was 134%
| Off / Standby | |
| Idle | |
| Load |
|
Key:
min: | |
| Apple MacBook Air 2020 i5 i5-1030NG7, Iris Plus Graphics G7 (Ice Lake 64 EU), Apple SSD AP0512, IPS, 2560x1600, 13.3" | Apple MacBook Air 2018 i5-8210Y, UHD Graphics 617, Apple SSD AP0256, IPS, 2560x1600, 13.3" | Apple MacBook Pro 13 2019 2TB3 i5-8257U, Iris Plus Graphics 645, Apple SSD AP0256, IPS, 2560x1600, 13.3" | Microsoft Surface Laptop 3 13 Core i5-1035G7 i5-1035G7, Iris Plus Graphics G7 (Ice Lake 64 EU), SK hynix BC501 HFM256GDGTNG, IPS, 2256x1504, 13.5" | Acer Swift 3 SF313-52-71Y7 i7-1065G7, Iris Plus Graphics G7 (Ice Lake 64 EU), Intel SSD 660p 1TB SSDPEKNW010T8, IPS, 2256x1504, 13.5" | Dell XPS 13 9300 i5 FHD i5-1035G1, UHD Graphics G1 (Ice Lake 32 EU), Toshiba XG6 KXG60ZNV512G, IPS, 1920x1200, 13.4" | Average Intel Iris Plus Graphics G7 (Ice Lake 64 EU) | Average of class Subnotebook | |
|---|---|---|---|---|---|---|---|---|
| Power Consumption | 5% | -28% | -51% | 21% | -26% | -35% | -42% | |
| Idle Minimum * (Watt) | 2.4 | 2.2 8% | 2.1 12% | 4.4 -83% | 1.8 25% | 3.4 -42% | 3.91 ? -63% | 3.86 ? -61% |
| Idle Average * (Watt) | 6.8 | 5.7 16% | 6.9 -1% | 7.5 -10% | 4.6 32% | 6 12% | 7.33 ? -8% | 6.61 ? 3% |
| Idle Maximum * (Watt) | 10.5 | 10.3 2% | 7.8 26% | 7.8 26% | 6.1 42% | 10.2 3% | 9.16 ? 13% | 8 ? 24% |
| Load Average * (Watt) | 25.7 | 25.6 -0% | 42 -63% | 41.9 -63% | 27.4 -7% | 36.6 -42% | 39.2 ? -53% | 42.2 ? -64% |
| Witcher 3 ultra * (Watt) | 24.5 | 40.8 -67% | ||||||
| Load Maximum * (Watt) | 30.4 | 30.6 -1% | 64.5 -112% | 63.9 -110% | 27 11% | 49.3 -62% | 49.8 ? -64% | 64.5 ? -112% |
* ... smaller is better
| Apple MacBook Air 2020 i5 i5-1030NG7, Iris Plus Graphics G7 (Ice Lake 64 EU), 49.9 Wh | Apple MacBook Air 2018 i5-8210Y, UHD Graphics 617, 50.3 Wh | Apple Macbook Air 2019 i5-8210Y, UHD Graphics 617, 49.9 Wh | Apple MacBook Pro 13 2019 2TB3 i5-8257U, Iris Plus Graphics 645, 58.2 Wh | Microsoft Surface Laptop 3 13 Core i5-1035G7 i5-1035G7, Iris Plus Graphics G7 (Ice Lake 64 EU), 45 Wh | Acer Swift 3 SF313-52-71Y7 i7-1065G7, Iris Plus Graphics G7 (Ice Lake 64 EU), 54.5 Wh | Dell XPS 13 9300 i5 FHD i5-1035G1, UHD Graphics G1 (Ice Lake 32 EU), 52 Wh | Average of class Subnotebook | |
|---|---|---|---|---|---|---|---|---|
| Battery runtime | -0% | 12% | 26% | -27% | -8% | 22% | 16% | |
| H.264 (h) | 10.7 | 12.3 15% | 10.5 -2% | 14.4 35% | 15.4 ? 44% | |||
| WiFi v1.3 (h) | 10.3 | 11.1 8% | 11.5 12% | 13 26% | 8.3 -19% | 10.3 0% | 11.7 14% | 14 ? 36% |
| Load (h) | 2.9 | 2.2 -24% | 1.9 -34% | 2.3 -21% | 3.4 17% | 1.969 ? -32% | ||
| Reader / Idle (h) | 34.4 | 21.4 | 28.6 ? |
Pros
Cons
Verdict – Performance is still the Achilles heel of the MacBook Air

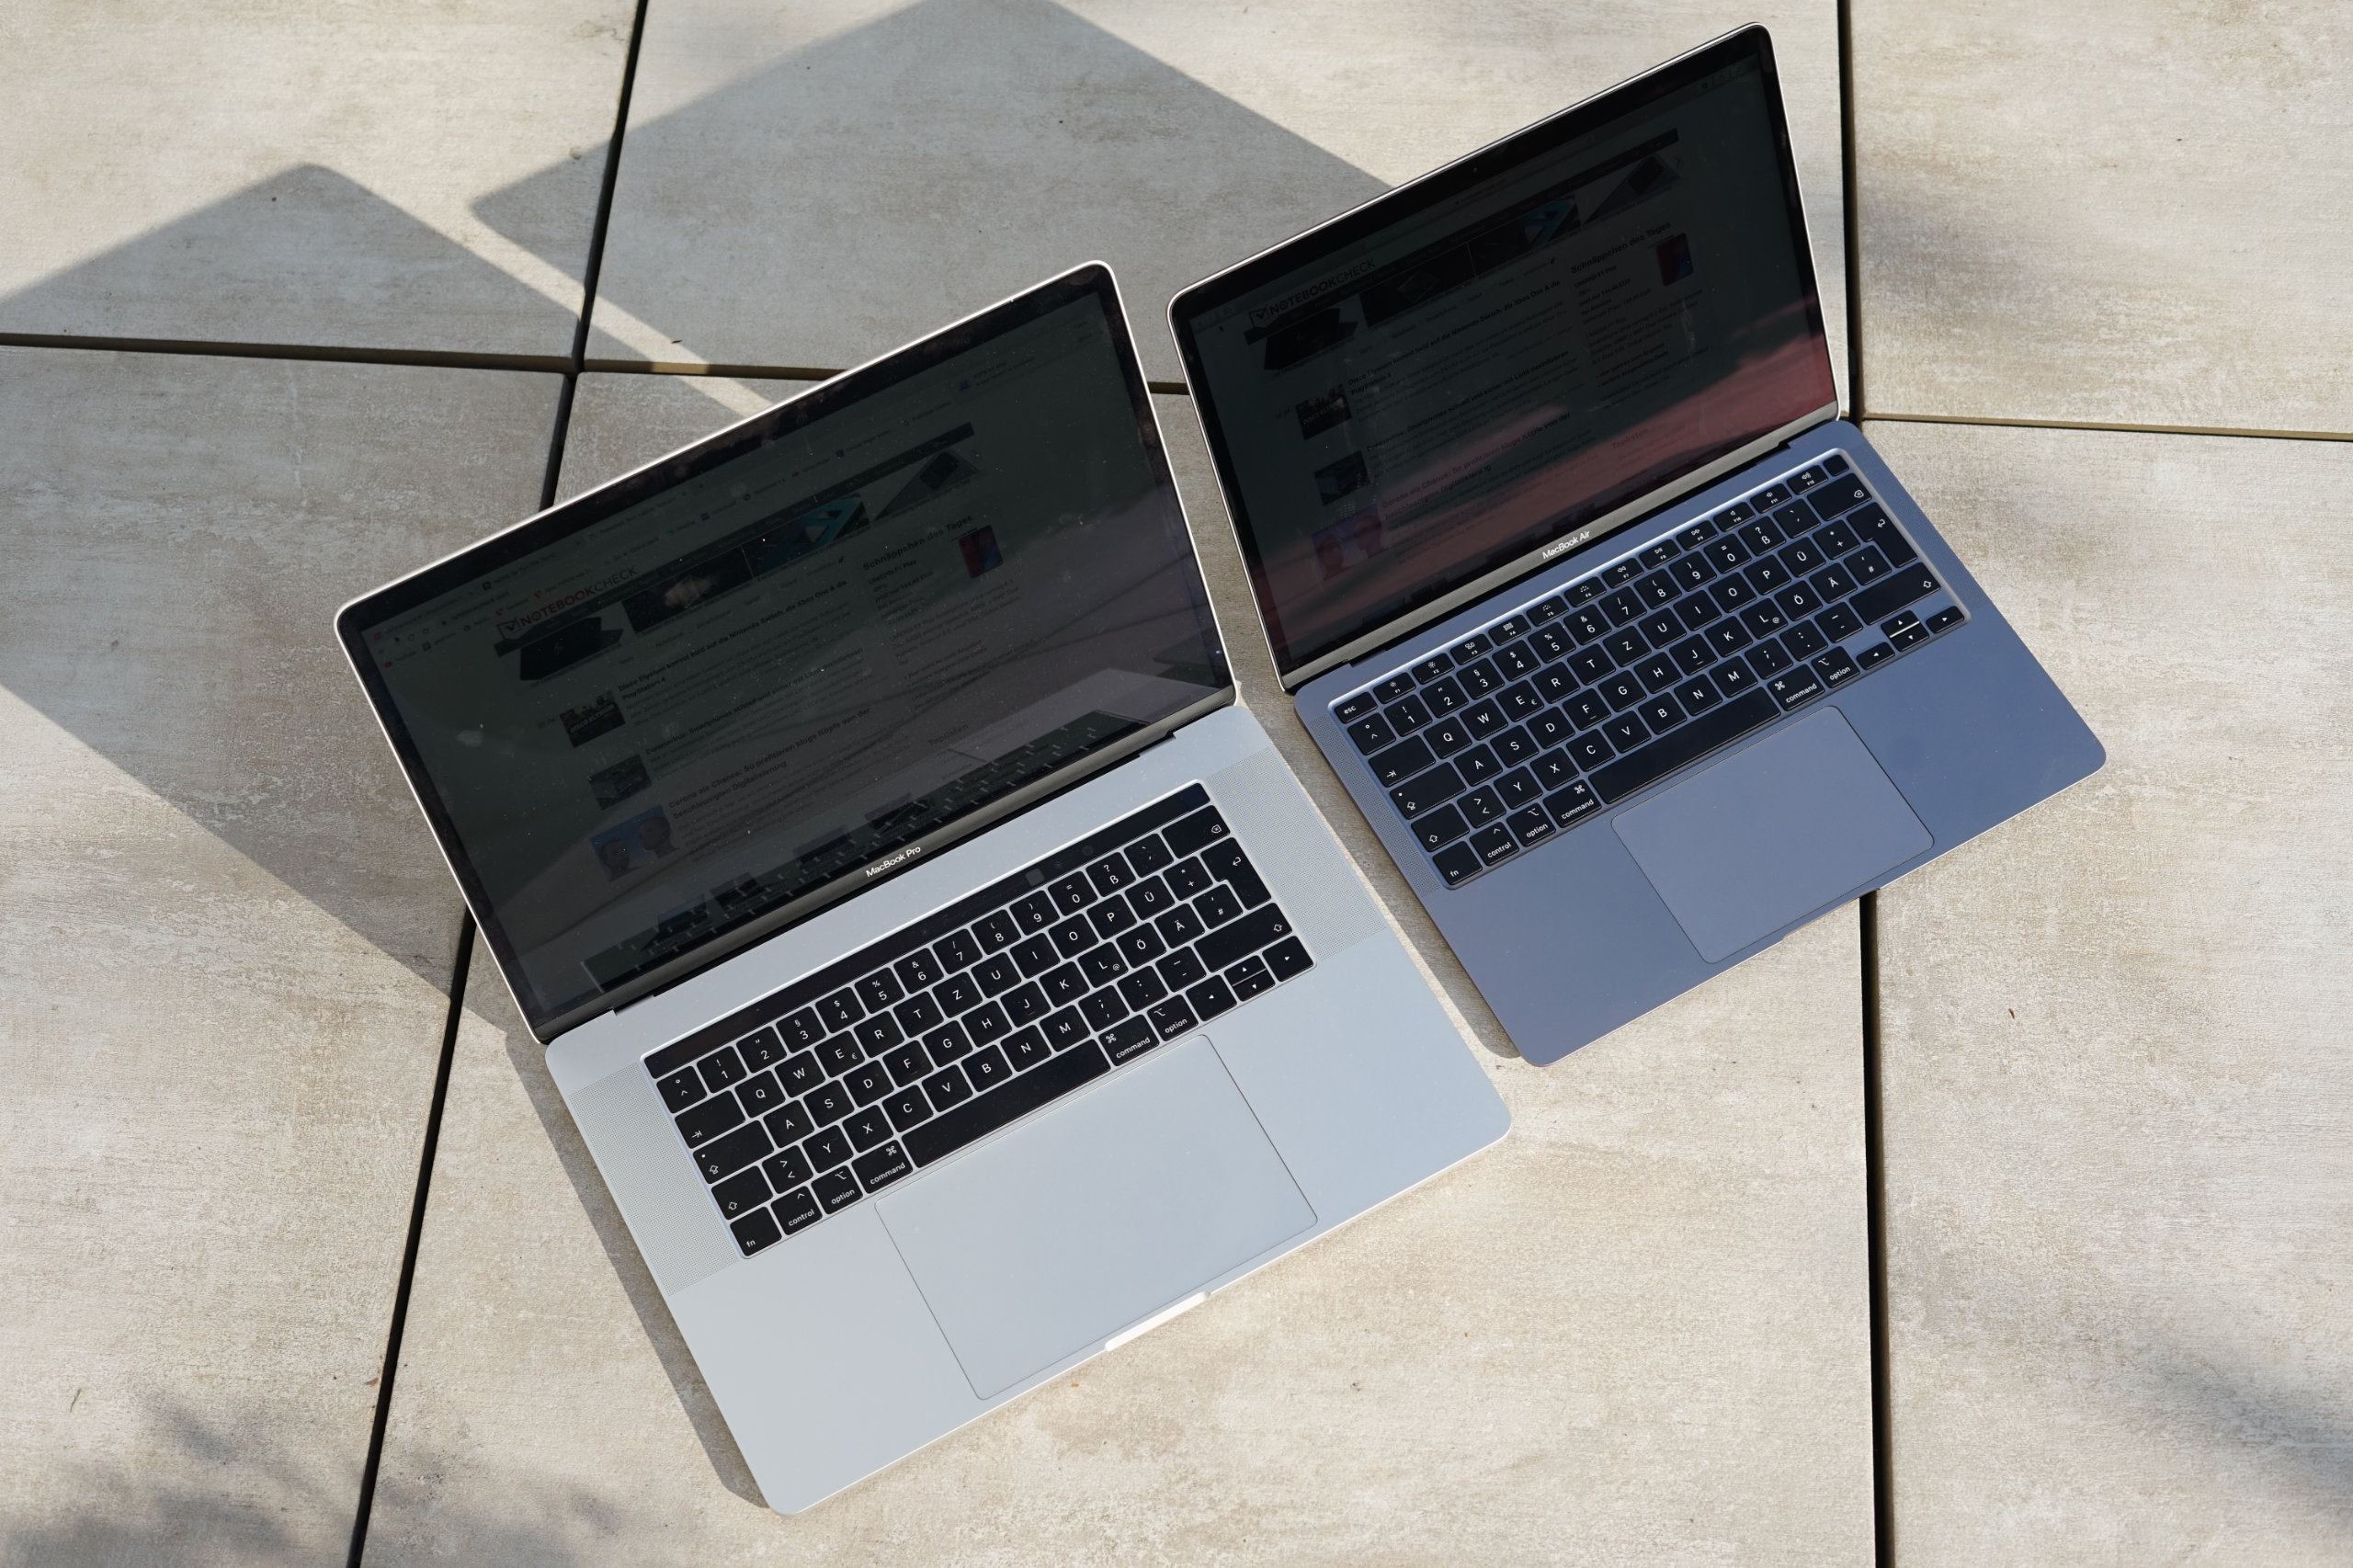
您目前可以读到很多评测,说新款MacBook Air是您现在可以买到的最好的MacBook。经过全面审查,我们无法确认这些陈述。是的,现在的键盘更好,性能也更高,但是Apple仍然(不必要地)限制了冷却系统的性能。小型机身风扇效率不高,因为它无法防止性能下降。在要求更高的工作负载下,它的声音也很大。
实际上,对于苹果公司来说,采用速度较慢的处理器并与MacBook Pro 13保持一定距离很有意义。这通常不是一件坏事,因为性能足以满足基本任务而无需执行多任务处理。但是,我们希望看到一个完全被动冷却的设备。完全静音的设备将使接受较低的性能变得容易得多。也许苹果公司希望通过自己的ARM处理器(传闻已久)将这一步改进保留给下一代。
价格太高了:新款MacBook Air的处理器在万元左右的机器中没有竞争力,并且散热系统在负载下过于嘈杂。如果您仍然需要新的MacBook Air,我们建议您等待特别优惠。
问题在于价格高昂,因为您可以以同样的价格获得功能更强大的笔记本电脑,包括苹果自己的MacBook Pro13。但是Windows竞品,例如新的Dell XPS 13 9300或Acer Swift 3提供更高性能的数据,甚至提供更多功能,例如Wi-Fi 6。
如果您可以忍受MacBook Air的性能并且只需要基本的功能,但又需要出色的机身,优秀的显示屏和较长的续航时间,那么您可以考虑新款MacBook Air。
新款2020 MacBook Air肯定也有很多令人喜欢的地方,仅产品名称便会吸引许多客户。目前,对于基本设备,显示器和机箱来说,性能已经完全足够了,键盘终于得到了改进,可靠性问题已成为过去。如果必须是新的MacBook Air,我们建议您等待特殊优惠或折扣,苹果后期肯定会提供。
Apple MacBook Air 2020 i5
- 04/08/2020 v7 (old)
Klaus Hinum, Andreas Osthoff
Price comparison

