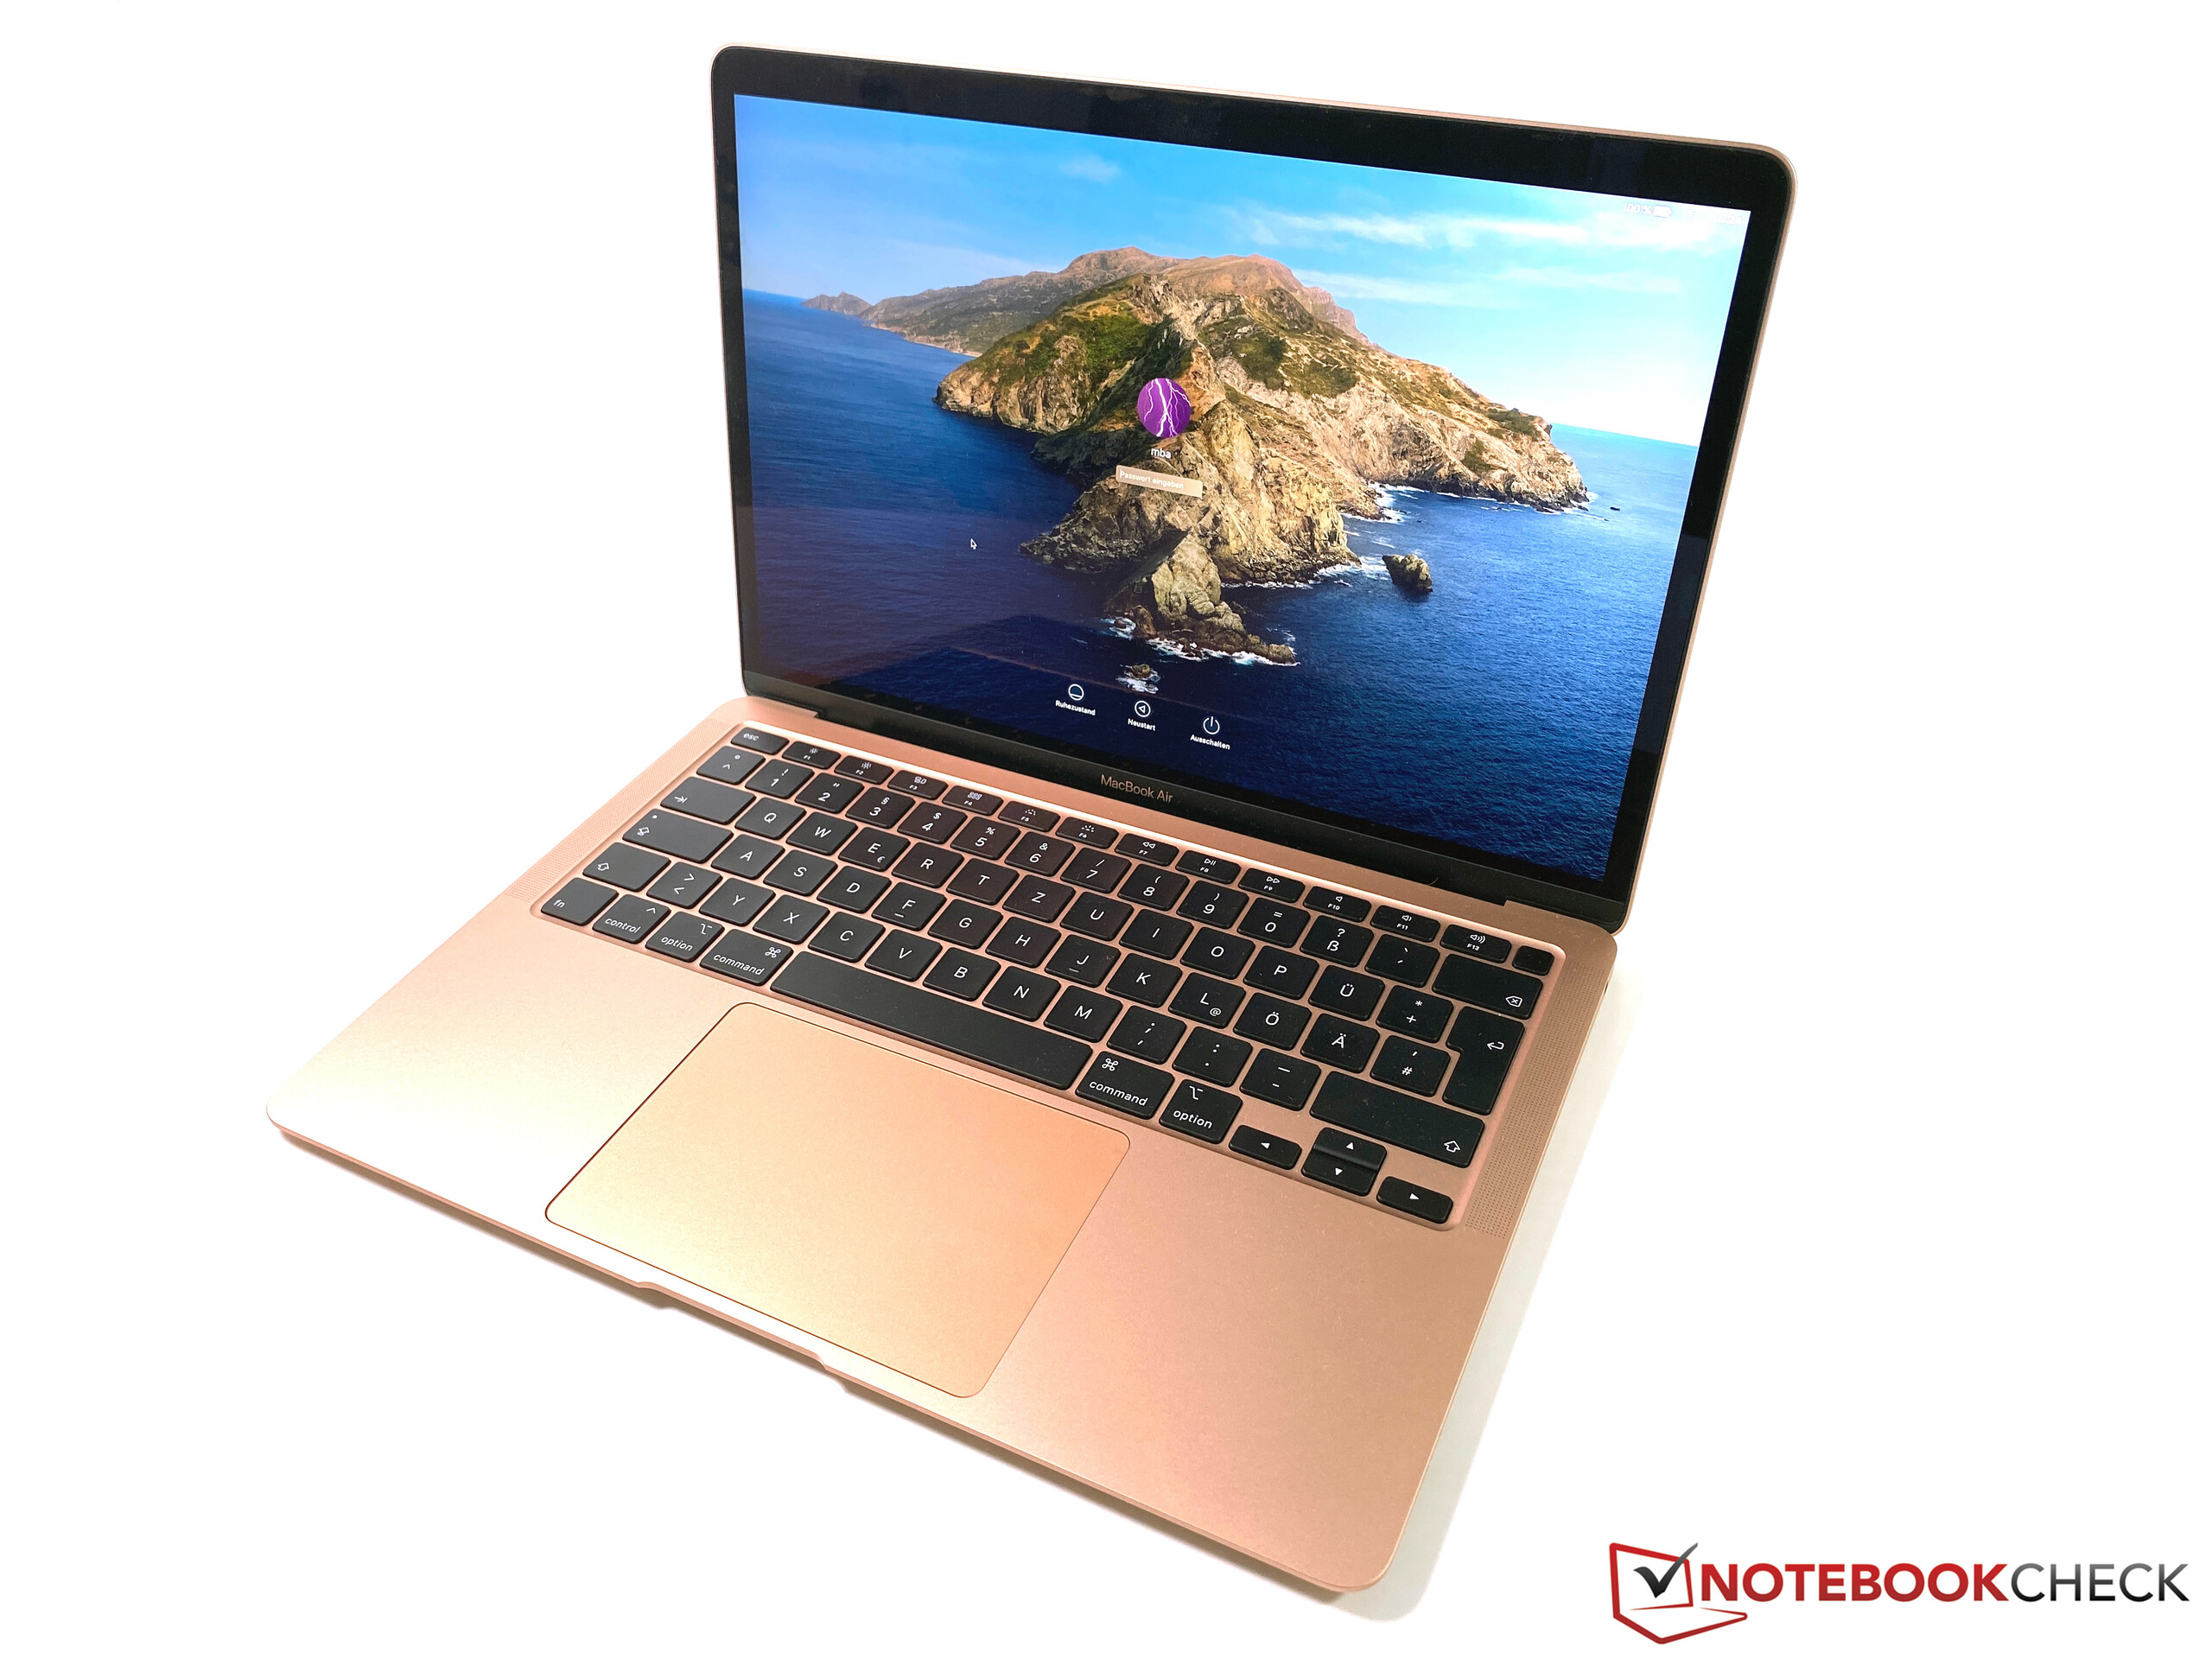
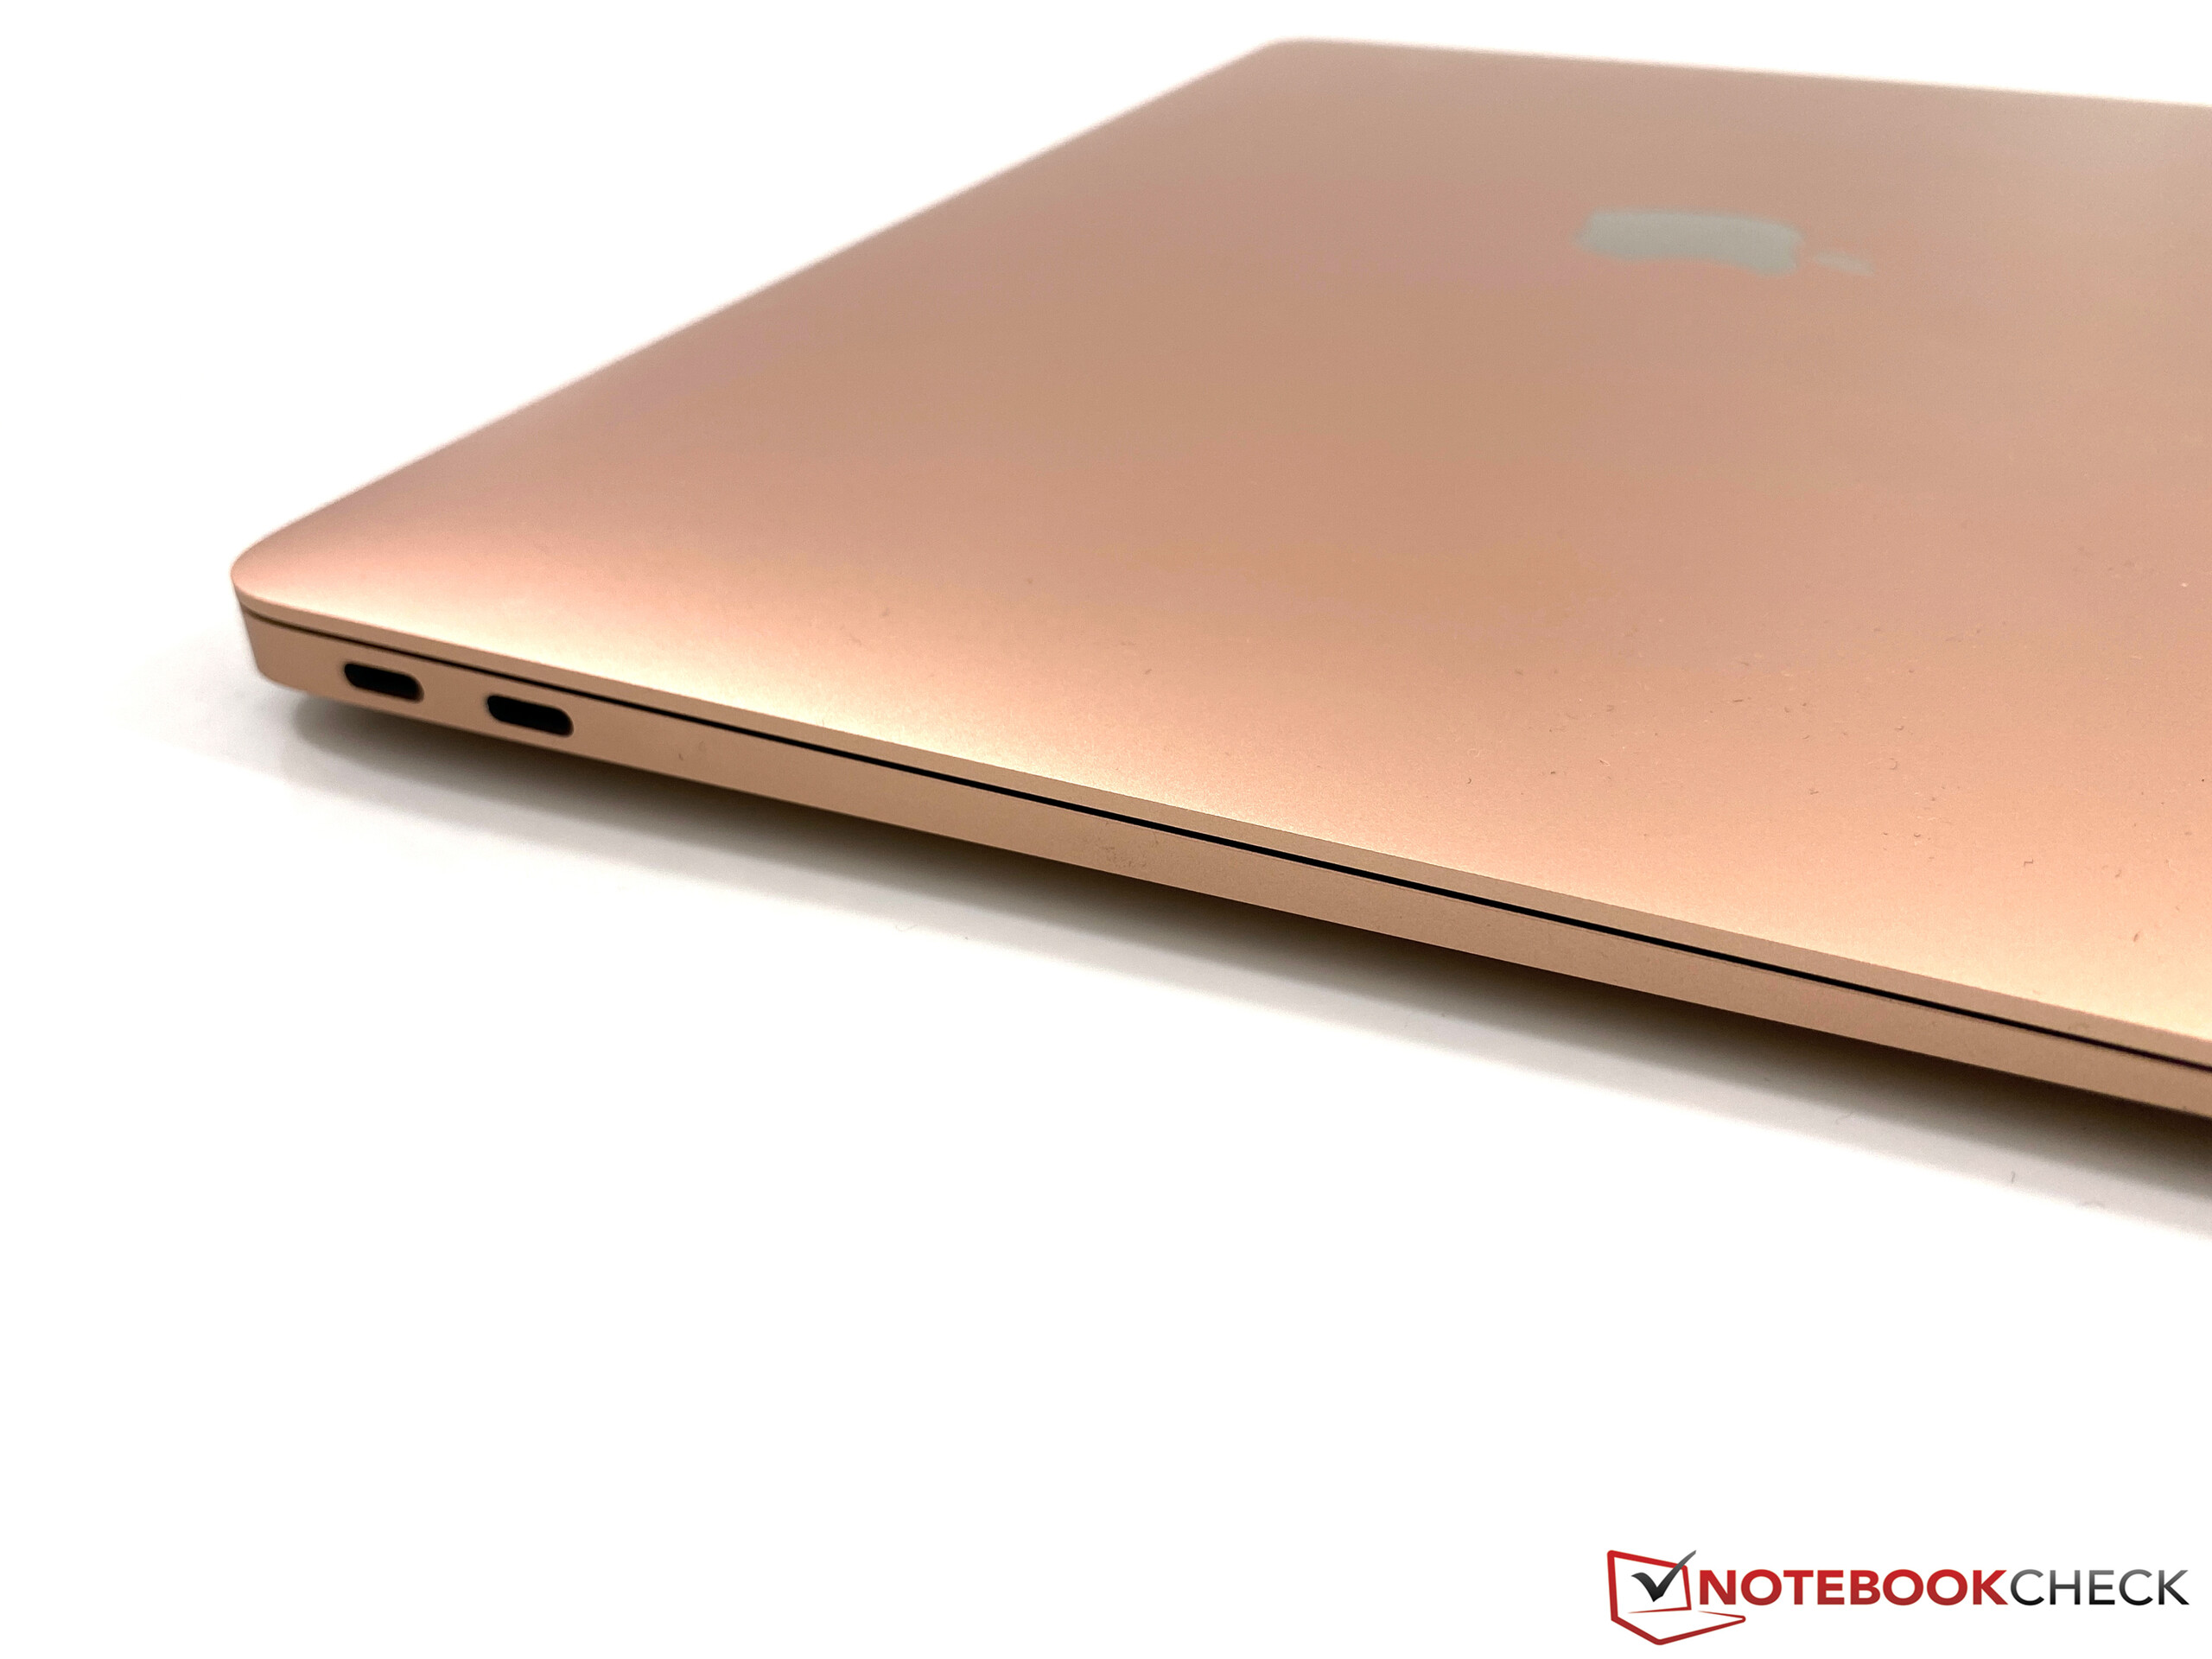
苹果MacBook Air 2020笔记本电脑评测:i3是更好的选择?
Rating | Date | Model | Weight | Height | Size | Resolution | Price |
|---|---|---|---|---|---|---|---|
| 89.6 % v7 (old) | 06 / 2020 | Apple MacBook Air 2020 i3 i3-1000NG4, Iris Plus Graphics G4 (Ice Lake 48 EU) | 1.3 kg | 16.1 mm | 13.30" | 2560x1600 | |
| 88 % v7 (old) | 06 / 2020 | Apple MacBook Air 2020 i5 i5-1030NG7, Iris Plus Graphics G7 (Ice Lake 64 EU) | 1.3 kg | 16.1 mm | 13.30" | 2560x1600 | |
| 85.6 % v7 (old) | 03 / 2020 | Apple Macbook Air 2019 i5-8210Y, UHD Graphics 617 | 1.3 kg | 15.6 mm | 13.30" | 2560x1600 | |
| 88.8 % v7 (old) | 05 / 2020 | Dell XPS 13 9300 i5 FHD i5-1035G1, UHD Graphics G1 (Ice Lake 32 EU) | 1.2 kg | 14.8 mm | 13.40" | 1920x1200 | |
| 87 % v7 (old) | 04 / 2020 | Acer Swift 3 SF313-52-71Y7 i7-1065G7, Iris Plus Graphics G7 (Ice Lake 64 EU) | 1.2 kg | 16.6 mm | 13.50" | 2256x1504 | |
| 84 % v7 (old) | 03 / 2020 | Microsoft Surface Laptop 3 13 Core i5-1035G7 i5-1035G7, Iris Plus Graphics G7 (Ice Lake 64 EU) | 1.3 kg | 14.5 mm | 13.50" | 2256x1504 |
| |||||||||||||||||||||||||
Brightness Distribution: 95 %
Center on Battery: 414 cd/m²
Contrast: 1224:1 (Black: 0.34 cd/m²)
ΔE ColorChecker Calman: 0.9 | ∀{0.5-29.43 Ø4.71}
calibrated: 0.6
ΔE Greyscale Calman: 1 | ∀{0.09-98 Ø4.96}
97.6% sRGB (Argyll 1.6.3 3D)
63.9% AdobeRGB 1998 (Argyll 1.6.3 3D)
71.6% AdobeRGB 1998 (Argyll 3D)
98% sRGB (Argyll 3D)
70.3% Display P3 (Argyll 3D)
Gamma: 2.2
CCT: 6629 K
| Apple MacBook Air 2020 i3 APPA042, IPS, 2560x1600, 13.3" | Apple MacBook Air 2020 i5 APPA042, IPS, 2560x1600, 13.3" | Apple Macbook Air 2019 APPA041, IPS, 2560x1600, 13.3" | Dell XPS 13 9300 i5 FHD SHP14CB, IPS, 1920x1200, 13.4" | Acer Swift 3 SF313-52-71Y7 BOE, NE135FBM-N41, IPS, 2256x1504, 13.5" | Microsoft Surface Laptop 3 13 Core i5-1035G7 Sharp LQ135P1JX51, IPS, 2256x1504, 13.5" | |
|---|---|---|---|---|---|---|
| Display | 0% | -3% | 2% | 0% | -4% | |
| Display P3 Coverage (%) | 70.3 | 70.4 0% | 67.4 -4% | 71.5 2% | 70.1 0% | 65.7 -7% |
| sRGB Coverage (%) | 98 | 97.7 0% | 94.7 -3% | 99.4 1% | 99.8 2% | 98.6 1% |
| AdobeRGB 1998 Coverage (%) | 71.6 | 71.7 0% | 69.1 -3% | 73.5 3% | 71.2 -1% | 67.8 -5% |
| Response Times | -4% | -7% | -37% | -26% | -50% | |
| Response Time Grey 50% / Grey 80% * (ms) | 38.4 ? | 38.7 ? -1% | 42.4 ? -10% | 60 ? -56% | 55 ? -43% | 59.2 ? -54% |
| Response Time Black / White * (ms) | 28.4 ? | 30.44 ? -7% | 29.6 ? -4% | 33.2 ? -17% | 31 ? -9% | 41.6 ? -46% |
| PWM Frequency (Hz) | 119000 ? | 117000 ? | 111100 ? | 2500 ? | 208 ? | 21740 ? |
| Screen | -45% | -27% | -97% | -95% | -17% | |
| Brightness middle (cd/m²) | 416 | 430 3% | 421 1% | 619 49% | 474 14% | 403.4 -3% |
| Brightness (cd/m²) | 403 | 405 0% | 393 -2% | 591 47% | 426 6% | 397 -1% |
| Brightness Distribution (%) | 95 | 89 -6% | 88 -7% | 91 -4% | 82 -14% | 89 -6% |
| Black Level * (cd/m²) | 0.34 | 0.32 6% | 0.34 -0% | 0.35 -3% | 0.29 15% | 0.34 -0% |
| Contrast (:1) | 1224 | 1344 10% | 1238 1% | 1769 45% | 1634 33% | 1186 -3% |
| Colorchecker dE 2000 * | 0.9 | 1.8 -100% | 1.5 -67% | 3 -233% | 2.38 -164% | 0.94 -4% |
| Colorchecker dE 2000 max. * | 1.4 | 4.6 -229% | 3.8 -171% | 8.2 -486% | 5.88 -320% | 2.92 -109% |
| Colorchecker dE 2000 calibrated * | 0.6 | 1.6 -167% | 1 -67% | 2.69 -348% | 0.99 -65% | |
| Greyscale dE 2000 * | 1 | 1.1 -10% | 1.2 -20% | 5.2 -420% | 3.75 -275% | 0.9 10% |
| Gamma | 2.2 100% | 2.21 100% | 2.14 103% | 2.37 93% | 2.13 103% | |
| CCT | 6629 98% | 6644 98% | 6694 97% | 6340 103% | 6466 101% | 6620 98% |
| Color Space (Percent of AdobeRGB 1998) (%) | 63.9 | 64.2 0% | 61.3 -4% | 66.9 5% | 65 2% | 62.3 -3% |
| Color Space (Percent of sRGB) (%) | 97.6 | 97.6 0% | 94.6 -3% | 99.3 2% | 100 2% | 98.7 1% |
| Total Average (Program / Settings) | -16% /
-31% | -12% /
-20% | -44% /
-71% | -40% /
-69% | -24% /
-18% |
* ... smaller is better
Display Response Times
| ↔ Response Time Black to White | ||
|---|---|---|
| 28.4 ms ... rise ↗ and fall ↘ combined | ↗ 16 ms rise | 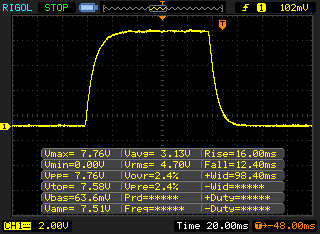 |
| ↘ 12.4 ms fall | ||
| The screen shows relatively slow response rates in our tests and may be too slow for gamers. In comparison, all tested devices range from 0.1 (minimum) to 240 (maximum) ms. » 75 % of all devices are better. This means that the measured response time is worse than the average of all tested devices (19.8 ms). | ||
| ↔ Response Time 50% Grey to 80% Grey | ||
| 38.4 ms ... rise ↗ and fall ↘ combined | ↗ 20.4 ms rise | 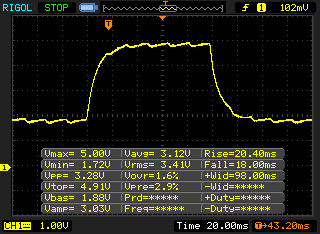 |
| ↘ 18 ms fall | ||
| The screen shows slow response rates in our tests and will be unsatisfactory for gamers. In comparison, all tested devices range from 0.165 (minimum) to 636 (maximum) ms. » 58 % of all devices are better. This means that the measured response time is worse than the average of all tested devices (30.9 ms). | ||
Screen Flickering / PWM (Pulse-Width Modulation)
| Screen flickering / PWM detected | 119000 Hz | ≤ 75 % brightness setting | 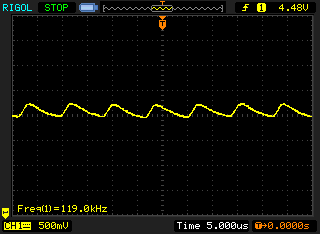 |
The display backlight flickers at 119000 Hz (worst case, e.g., utilizing PWM) Flickering detected at a brightness setting of 75 % and below. There should be no flickering or PWM above this brightness setting. The frequency of 119000 Hz is quite high, so most users sensitive to PWM should not notice any flickering. In comparison: 52 % of all tested devices do not use PWM to dim the display. If PWM was detected, an average of 7744 (minimum: 5 - maximum: 343500) Hz was measured. | |||
Cinebench R15: CPU Single 64Bit | CPU Multi 64Bit
Blender: v2.79 BMW27 CPU
7-Zip 18.03: 7z b 4 -mmt1 | 7z b 4
Geekbench 5.5: Single-Core | Multi-Core
HWBOT x265 Benchmark v2.2: 4k Preset
LibreOffice : 20 Documents To PDF
R Benchmark 2.5: Overall mean
| Cinebench R20 / CPU (Single Core) | |
| Average of class Subnotebook (128 - 832, n=56, last 2 years) | |
| Acer Swift 3 SF313-52-71Y7 | |
| Microsoft Surface Laptop 3 13 Core i5-1035G7 | |
| Dell XPS 13 9300 i5 FHD | |
| Apple MacBook Air 2020 i5 | |
| Apple MacBook Air 2020 i5 | |
| Apple MacBook Air 2020 i3 | |
| Average Intel Core i3-1000NG4 (n=1) | |
| Apple Macbook Air 2019 | |
| Cinebench R20 / CPU (Multi Core) | |
| Average of class Subnotebook (579 - 8541, n=56, last 2 years) | |
| Microsoft Surface Laptop 3 13 Core i5-1035G7 | |
| Dell XPS 13 9300 i5 FHD | |
| Acer Swift 3 SF313-52-71Y7 | |
| Apple MacBook Air 2020 i5 | |
| Apple MacBook Air 2020 i5 | |
| Apple Macbook Air 2019 | |
| Apple MacBook Air 2020 i3 | |
| Average Intel Core i3-1000NG4 (n=1) | |
| Cinebench R15 / CPU Single 64Bit | |
| Average of class Subnotebook (72.4 - 322, n=56, last 2 years) | |
| Acer Swift 3 SF313-52-71Y7 | |
| Microsoft Surface Laptop 3 13 Core i5-1035G7 | |
| Dell XPS 13 9300 i5 FHD | |
| Apple MacBook Air 2020 i3 | |
| Average Intel Core i3-1000NG4 (n=1) | |
| Apple MacBook Air 2020 i5 | |
| Apple Macbook Air 2019 | |
| Cinebench R15 / CPU Multi 64Bit | |
| Average of class Subnotebook (327 - 3345, n=56, last 2 years) | |
| Microsoft Surface Laptop 3 13 Core i5-1035G7 | |
| Dell XPS 13 9300 i5 FHD | |
| Dell XPS 13 9300 i5 FHD | |
| Acer Swift 3 SF313-52-71Y7 | |
| Apple MacBook Air 2020 i5 | |
| Apple MacBook Air 2020 i3 | |
| Average Intel Core i3-1000NG4 (n=1) | |
| Apple Macbook Air 2019 | |
| Blender / v2.79 BMW27 CPU | |
| Apple MacBook Air 2020 i3 | |
| Average Intel Core i3-1000NG4 (n=1) | |
| Apple Macbook Air 2019 | |
| Apple MacBook Air 2020 i5 | |
| Acer Swift 3 SF313-52-71Y7 | |
| Microsoft Surface Laptop 3 13 Core i5-1035G7 | |
| Dell XPS 13 9300 i5 FHD | |
| Average of class Subnotebook (159 - 2271, n=57, last 2 years) | |
| 7-Zip 18.03 / 7z b 4 -mmt1 | |
| Average of class Subnotebook (2643 - 6699, n=58, last 2 years) | |
| Acer Swift 3 SF313-52-71Y7 | |
| Microsoft Surface Laptop 3 13 Core i5-1035G7 | |
| Dell XPS 13 9300 i5 FHD | |
| Apple MacBook Air 2020 i5 | |
| Apple MacBook Air 2020 i3 | |
| Average Intel Core i3-1000NG4 (n=1) | |
| Apple Macbook Air 2019 | |
| 7-Zip 18.03 / 7z b 4 | |
| Average of class Subnotebook (11668 - 77867, n=56, last 2 years) | |
| Microsoft Surface Laptop 3 13 Core i5-1035G7 | |
| Dell XPS 13 9300 i5 FHD | |
| Acer Swift 3 SF313-52-71Y7 | |
| Apple MacBook Air 2020 i5 | |
| Apple Macbook Air 2019 | |
| Apple MacBook Air 2020 i3 | |
| Average Intel Core i3-1000NG4 (n=1) | |
| Geekbench 5.5 / Single-Core | |
| Average of class Subnotebook (726 - 2224, n=49, last 2 years) | |
| Acer Swift 3 SF313-52-71Y7 | |
| Dell XPS 13 9300 i5 FHD | |
| Apple MacBook Air 2020 i5 | |
| Apple MacBook Air 2020 i5 | |
| Apple MacBook Air 2020 i3 | |
| Average Intel Core i3-1000NG4 (n=1) | |
| Geekbench 5.5 / Multi-Core | |
| Average of class Subnotebook (2557 - 17218, n=49, last 2 years) | |
| Acer Swift 3 SF313-52-71Y7 | |
| Dell XPS 13 9300 i5 FHD | |
| Apple MacBook Air 2020 i5 | |
| Apple MacBook Air 2020 i5 | |
| Apple MacBook Air 2020 i3 | |
| Average Intel Core i3-1000NG4 (n=1) | |
| HWBOT x265 Benchmark v2.2 / 4k Preset | |
| Average of class Subnotebook (0.97 - 25.1, n=56, last 2 years) | |
| Acer Swift 3 SF313-52-71Y7 | |
| Microsoft Surface Laptop 3 13 Core i5-1035G7 | |
| Dell XPS 13 9300 i5 FHD | |
| Apple MacBook Air 2020 i5 | |
| Apple Macbook Air 2019 | |
| Apple MacBook Air 2020 i3 | |
| Average Intel Core i3-1000NG4 (n=1) | |
| LibreOffice / 20 Documents To PDF | |
| Apple MacBook Air 2020 i5 | |
| Apple MacBook Air 2020 i3 | |
| Average Intel Core i3-1000NG4 (n=1) | |
| Average of class Subnotebook (39.9 - 220, n=55, last 2 years) | |
| R Benchmark 2.5 / Overall mean | |
| Apple MacBook Air 2020 i5 | |
| Apple MacBook Air 2020 i5 | |
| Apple MacBook Air 2020 i3 | |
| Average Intel Core i3-1000NG4 (n=1) | |
| Dell XPS 13 9300 i5 FHD | |
| Acer Swift 3 SF313-52-71Y7 | |
| Average of class Subnotebook (0.4024 - 1.456, n=57, last 2 years) | |
* ... smaller is better
| PCMark 8 Home Score Accelerated v2 | 2701 points | |
| PCMark 8 Creative Score Accelerated v2 | 3619 points | |
| PCMark 10 Score | 2229 points | |
Help | ||

| Unigine Valley 1.0 - 1920x1080 Extreme HD Preset OpenGL AA:x8 | |
| Average of class Subnotebook (4.7 - 26.2, n=6, last 2 years) | |
| Apple MacBook Air 2020 i5 | |
| Average Intel Iris Plus Graphics G4 (Ice Lake 48 EU) (7.1 - 9.3, n=2) | |
| Apple MacBook Air 2020 i3 | |
| Unigine Heaven 4.0 - Extreme Preset OpenGL | |
| Average of class Subnotebook (7 - 35.7, n=4, last 2 years) | |
| Average Intel Iris Plus Graphics G4 (Ice Lake 48 EU) (8.1 - 11.8, n=2) | |
| Apple MacBook Air 2020 i5 | |
| Apple MacBook Air 2020 i3 | |
| 3DMark 06 Standard Score | 6413 points | |
| 3DMark Vantage P Result | 5516 points | |
| 3DMark 11 Performance | 1980 points | |
| 3DMark Fire Strike Score | 839 points | |
Help | ||
| low | med. | high | ultra | |
|---|---|---|---|---|
| BioShock Infinite (2013) | 34 | 22.6 | 20.3 | 9.1 |
| The Witcher 3 (2015) | 9.1 | |||
| Dota 2 Reborn (2015) | 48.2 | 23.4 | 14.7 | 14.1 |
| Rise of the Tomb Raider (2016) | 10.2 | |||
| Overwatch (2016) | 8 | |||
| Rocket League (2017) | 53.2 | 22.7 | ||
| X-Plane 11.11 (2018) | 17.8 | 9.32 | 9.16 | |
| Shadow of the Tomb Raider (2018) | 9 |
Noise level
| Idle |
| 29 / 29 / 29 dB(A) |
| Load |
| 31.6 / 39.4 dB(A) |
 | ||
30 dB silent 40 dB(A) audible 50 dB(A) loud |
||
min: | ||
| Apple MacBook Air 2020 i3 Iris Plus Graphics G4 (Ice Lake 48 EU), i3-1000NG4, Apple SSD AP0256 | Apple MacBook Air 2020 i5 Iris Plus Graphics G7 (Ice Lake 64 EU), i5-1030NG7, Apple SSD AP0512 | Apple Macbook Air 2019 UHD Graphics 617, i5-8210Y, Apple SSD AP0256 | Dell XPS 13 9300 i5 FHD UHD Graphics G1 (Ice Lake 32 EU), i5-1035G1, Toshiba XG6 KXG60ZNV512G | Acer Swift 3 SF313-52-71Y7 Iris Plus Graphics G7 (Ice Lake 64 EU), i7-1065G7, Intel SSD 660p 1TB SSDPEKNW010T8 | Microsoft Surface Laptop 3 13 Core i5-1035G7 Iris Plus Graphics G7 (Ice Lake 64 EU), i5-1035G7, SK hynix BC501 HFM256GDGTNG | |
|---|---|---|---|---|---|---|
| Noise | -12% | -3% | 3% | 0% | 3% | |
| off / environment * (dB) | 29 | 30 -3% | 29.5 -2% | 29.3 -1% | 30.3 -4% | 28.5 2% |
| Idle Minimum * (dB) | 29 | 30 -3% | 29.5 -2% | 29.3 -1% | 30.3 -4% | 28.5 2% |
| Idle Average * (dB) | 29 | 30 -3% | 29.5 -2% | 29.3 -1% | 30.3 -4% | 28.5 2% |
| Idle Maximum * (dB) | 29 | 30 -3% | 29.5 -2% | 29.3 -1% | 30.3 -4% | 28.5 2% |
| Load Average * (dB) | 31.6 | 45.5 -44% | 34 -8% | 30 5% | 31.7 -0% | 28.5 10% |
| Load Maximum * (dB) | 39.4 | 45.8 -16% | 41 -4% | 32.4 18% | 32.7 17% | 40.4 -3% |
| Witcher 3 ultra * (dB) | 40.4 |
* ... smaller is better
(±) The maximum temperature on the upper side is 44.3 °C / 112 F, compared to the average of 35.9 °C / 97 F, ranging from 21.4 to 59 °C for the class Subnotebook.
(±) The bottom heats up to a maximum of 40.9 °C / 106 F, compared to the average of 39.2 °C / 103 F
(+) In idle usage, the average temperature for the upper side is 23.4 °C / 74 F, compared to the device average of 30.8 °C / 87 F.
(+) The palmrests and touchpad are cooler than skin temperature with a maximum of 29.1 °C / 84.4 F and are therefore cool to the touch.
(±) The average temperature of the palmrest area of similar devices was 28.2 °C / 82.8 F (-0.9 °C / -1.6 F).
| Off / Standby | |
| Idle | |
| Load |
|
Key:
min: | |
| Apple MacBook Air 2020 i3 i3-1000NG4, Iris Plus Graphics G4 (Ice Lake 48 EU), Apple SSD AP0256, IPS, 2560x1600, 13.3" | Apple MacBook Air 2020 i5 i5-1030NG7, Iris Plus Graphics G7 (Ice Lake 64 EU), Apple SSD AP0512, IPS, 2560x1600, 13.3" | Dell XPS 13 9300 i5 FHD i5-1035G1, UHD Graphics G1 (Ice Lake 32 EU), Toshiba XG6 KXG60ZNV512G, IPS, 1920x1200, 13.4" | Acer Swift 3 SF313-52-71Y7 i7-1065G7, Iris Plus Graphics G7 (Ice Lake 64 EU), Intel SSD 660p 1TB SSDPEKNW010T8, IPS, 2256x1504, 13.5" | Microsoft Surface Laptop 3 13 Core i5-1035G7 i5-1035G7, Iris Plus Graphics G7 (Ice Lake 64 EU), SK hynix BC501 HFM256GDGTNG, IPS, 2256x1504, 13.5" | Average Intel Iris Plus Graphics G4 (Ice Lake 48 EU) | Average of class Subnotebook | |
|---|---|---|---|---|---|---|---|
| Power Consumption | -15% | -43% | 11% | -64% | -32% | -56% | |
| Idle Minimum * (Watt) | 2.1 | 2.4 -14% | 3.4 -62% | 1.8 14% | 4.4 -110% | 3.26 ? -55% | 3.73 ? -78% |
| Idle Average * (Watt) | 6.2 | 6.8 -10% | 6 3% | 4.6 26% | 7.5 -21% | 7.28 ? -17% | 6.57 ? -6% |
| Idle Maximum * (Watt) | 7 | 10.5 -50% | 10.2 -46% | 6.1 13% | 7.8 -11% | 8.66 ? -24% | 7.93 ? -13% |
| Load Average * (Watt) | 24.7 | 25.7 -4% | 36.6 -48% | 27.4 -11% | 41.9 -70% | 34.4 ? -39% | 42.1 ? -70% |
| Load Maximum * (Watt) | 30.6 | 30.4 1% | 49.3 -61% | 27 12% | 63.9 -109% | 38.9 ? -27% | 65.1 ? -113% |
| Witcher 3 ultra * (Watt) | 24.5 | 40.8 |
* ... smaller is better
| Apple MacBook Air 2020 i3 i3-1000NG4, Iris Plus Graphics G4 (Ice Lake 48 EU), 49.9 Wh | Apple MacBook Air 2020 i5 i5-1030NG7, Iris Plus Graphics G7 (Ice Lake 64 EU), 49.9 Wh | Apple Macbook Air 2019 i5-8210Y, UHD Graphics 617, 49.9 Wh | Dell XPS 13 9300 i5 FHD i5-1035G1, UHD Graphics G1 (Ice Lake 32 EU), 52 Wh | Acer Swift 3 SF313-52-71Y7 i7-1065G7, Iris Plus Graphics G7 (Ice Lake 64 EU), 54.5 Wh | Microsoft Surface Laptop 3 13 Core i5-1035G7 i5-1035G7, Iris Plus Graphics G7 (Ice Lake 64 EU), 45 Wh | Average of class Subnotebook | |
|---|---|---|---|---|---|---|---|
| Battery runtime | -5% | 5% | 18% | -6% | -25% | 32% | |
| H.264 (h) | 11.1 | 10.7 -4% | 14.4 30% | 10.5 -5% | 15.3 ? 38% | ||
| WiFi v1.3 (h) | 11 | 10.3 -6% | 11.5 5% | 11.7 6% | 10.3 -6% | 8.3 -25% | 13.9 ? 26% |
| Load (h) | 2.9 | 3.4 | 2.3 | 1.9 | 2.04 ? | ||
| Reader / Idle (h) | 21.4 | 34.4 | 26.4 ? |
Pros
Cons
Verdict – The Core i3 is the better choice for everyday tasks
在进行了有关新四核CPU性能的所有评测之后,您不应忘记MacBook Air仍然主要是属于工作负载小的用户的设备。这包括基本内容,例如写邮件,播放视频或浏览网页。 MacBook Air非常适合这类工作,这也要归功于快速的SSD。由于TDP配置的限制,在单核性能方面,入门级MacBook Air甚至可以与四核i5相提并论,这对于日常任务仍然很重要。就噪音而言,还有明显的优势,尤其是风扇要安静得多,转速要低一些。这意味着i3 MacBook Air可以长时间保持安静,即使在负载下也是如此。
配备双核i3处理器的MacBook Air是用于基本工作负载的更好设备。在这些情况下,主观性能印象非常好,风扇更安静,您仍然可以享受良好的显示以及改进的键盘。
仍然存在缺点,因为总体性能水平非常低。这将不是一个大问题,但是为什么苹果公司无法创建完全被动冷却的设备?无声的MacBook Air会很棒,但是我们怀疑Apple故意限制了Air。对于高度推测的ARM SoC,将来的模型可能会保留此步骤。
价格是另一个问题,因为这个价位您可以获得更高性能的Windows笔记本电脑。尽管如此,由于采用了做工优良的机身,出色的面板以及对macOS的出色优化,MacBook Air还是一个非常平衡的设备,可以满足您的基本任务。但是,如果您需要更高的性能,我们认为您应该跳过价格更高的Air四核型号,而去购买MacBook Pro 13(或类似功能的型号) 。
Apple MacBook Air 2020 i3
- 05/13/2020 v7 (old)
Andreas Osthoff
Price comparison

