宏碁蜂鸟3 SF313笔记本电脑评测
Rating | Date | Model | Weight | Height | Size | Resolution | Price |
|---|---|---|---|---|---|---|---|
| 87 % v7 (old) | 04 / 2020 | Acer Swift 3 SF313-52-71Y7 i7-1065G7, Iris Plus Graphics G7 (Ice Lake 64 EU) | 1.2 kg | 16.6 mm | 13.50" | 2256x1504 | |
| 88.2 % v7 (old) | 10 / 2019 | Lenovo Yoga C940-14IIL i7-1065G7, Iris Plus Graphics G7 (Ice Lake 64 EU) | 1.4 kg | 14.95 mm | 14.00" | 1920x1080 | |
| 85.7 % v6 (old) | 02 / 2019 | Acer Swift 3 SF313-51-59SZ i5-8250U, UHD Graphics 620 | 1.3 kg | 16 mm | 13.30" | 1920x1080 | |
| 88 % v6 (old) | 02 / 2019 | Dell XPS 13 9380 2019 i5-8265U, UHD Graphics 620 | 1.2 kg | 11.6 mm | 13.30" | 3840x2160 | |
| 86 % v7 (old) | 10 / 2019 | Lenovo ThinkBook 13s-20R90071GE i5-8265U, UHD Graphics 620 | 1.3 kg | 15.9 mm | 13.30" | 1920x1080 | |
| 84.5 % v7 (old) | 08 / 2019 | HP Envy 13-aq0003ng i7-8565U, GeForce MX250 | 1.2 kg | 14.7 mm | 13.30" | 1920x1080 |
| |||||||||||||||||||||||||
Brightness Distribution: 82 %
Center on Battery: 466 cd/m²
Contrast: 1634:1 (Black: 0.29 cd/m²)
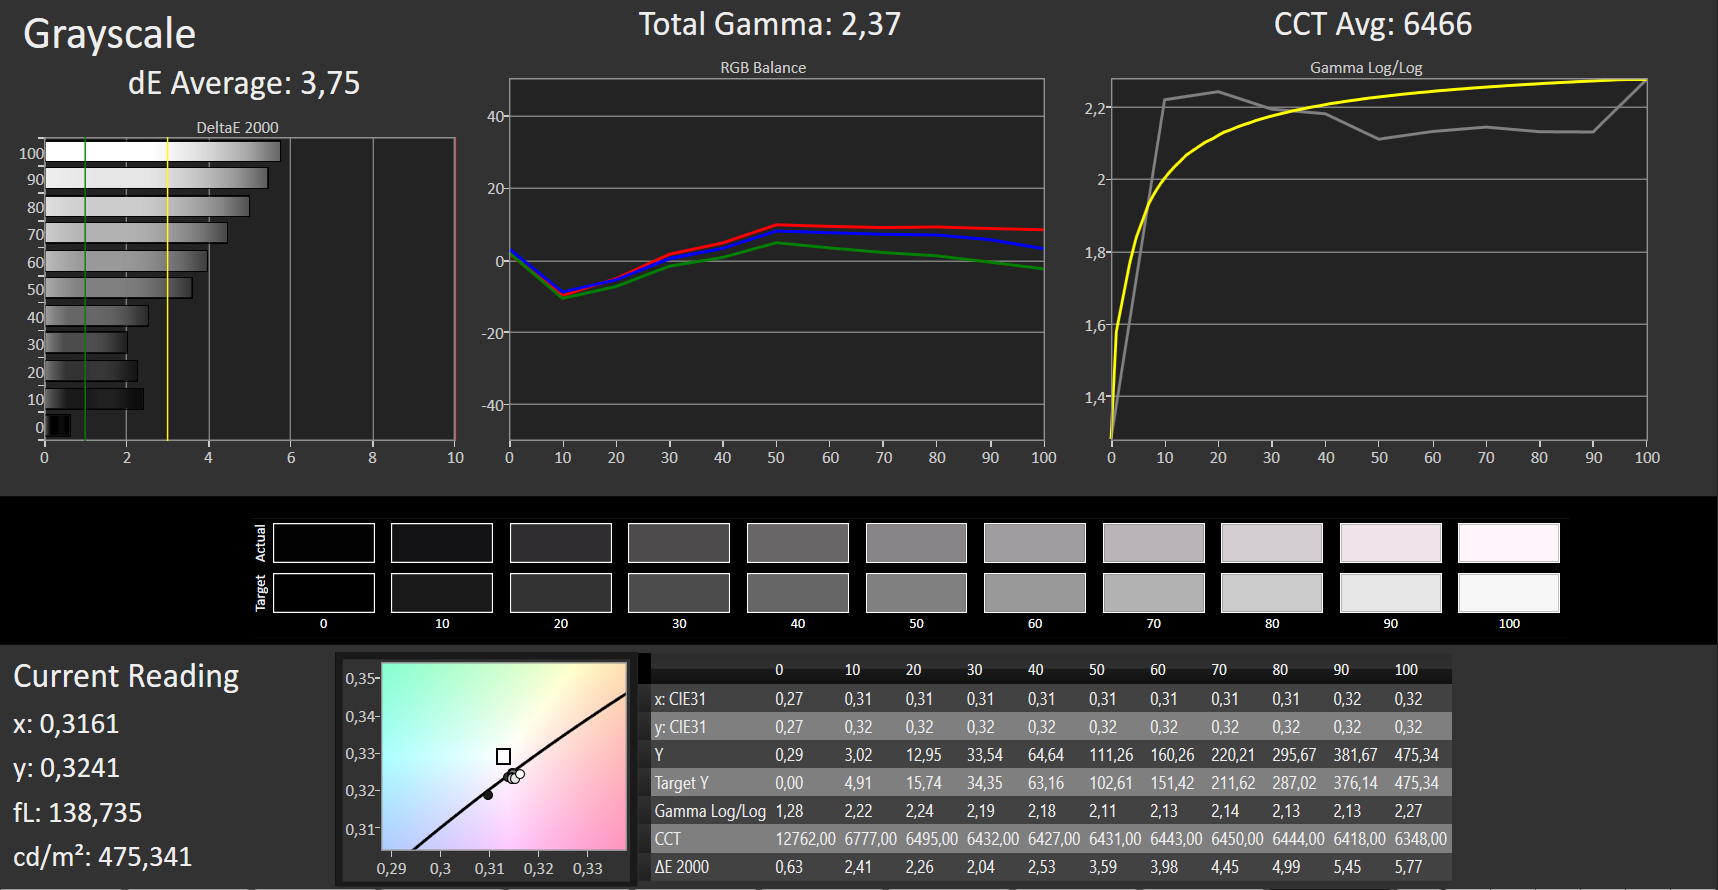
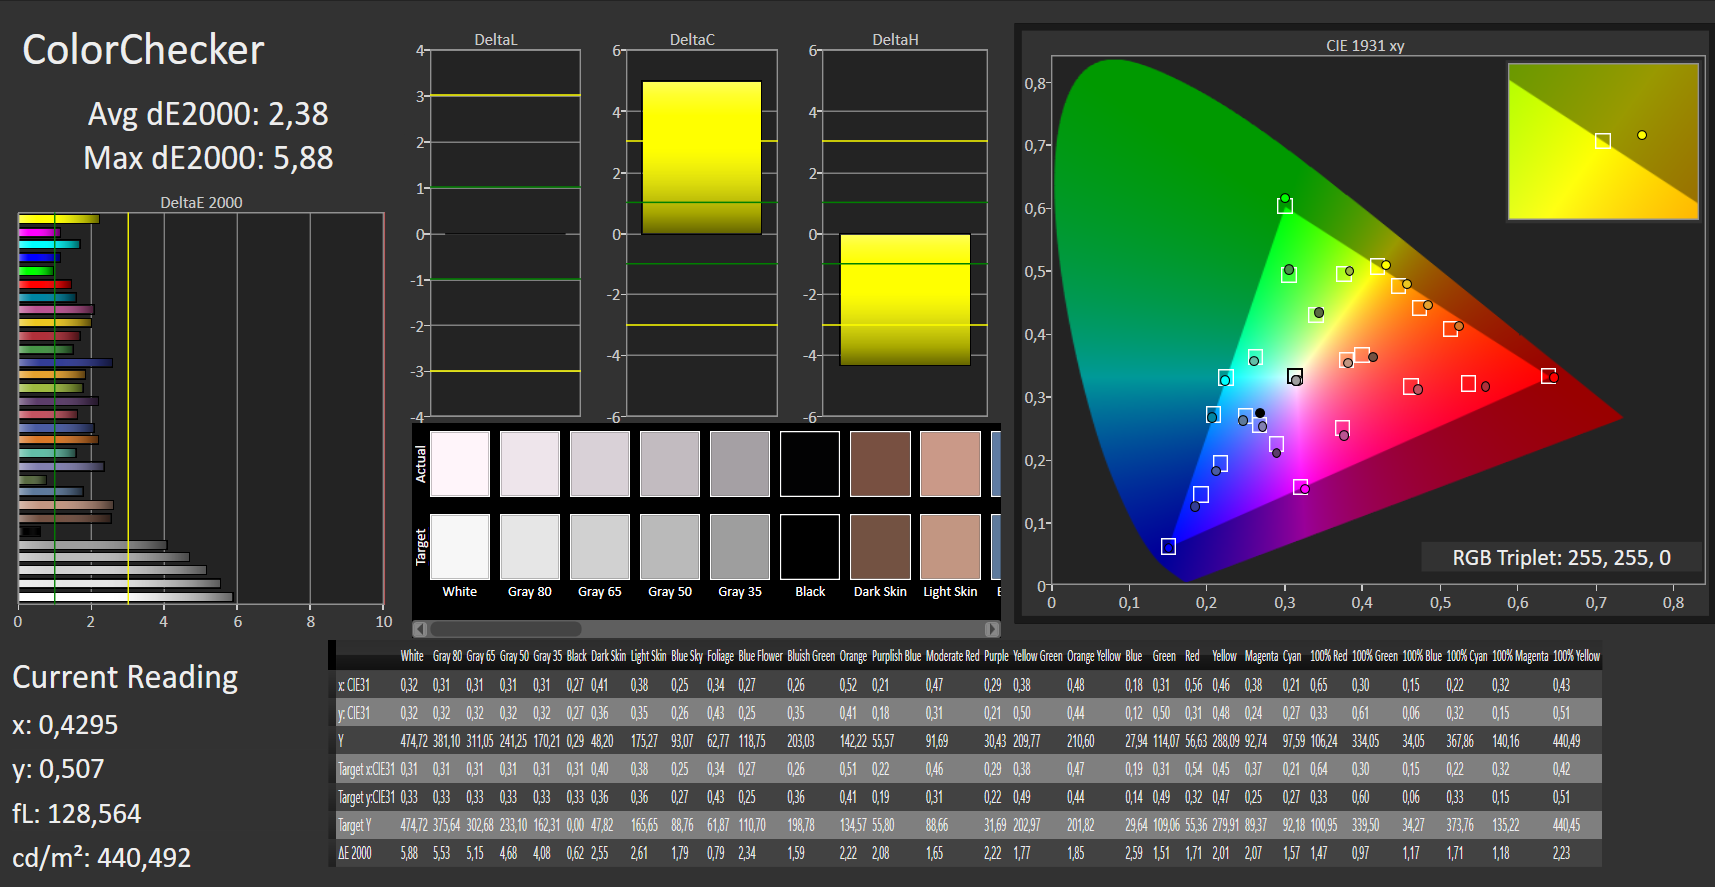
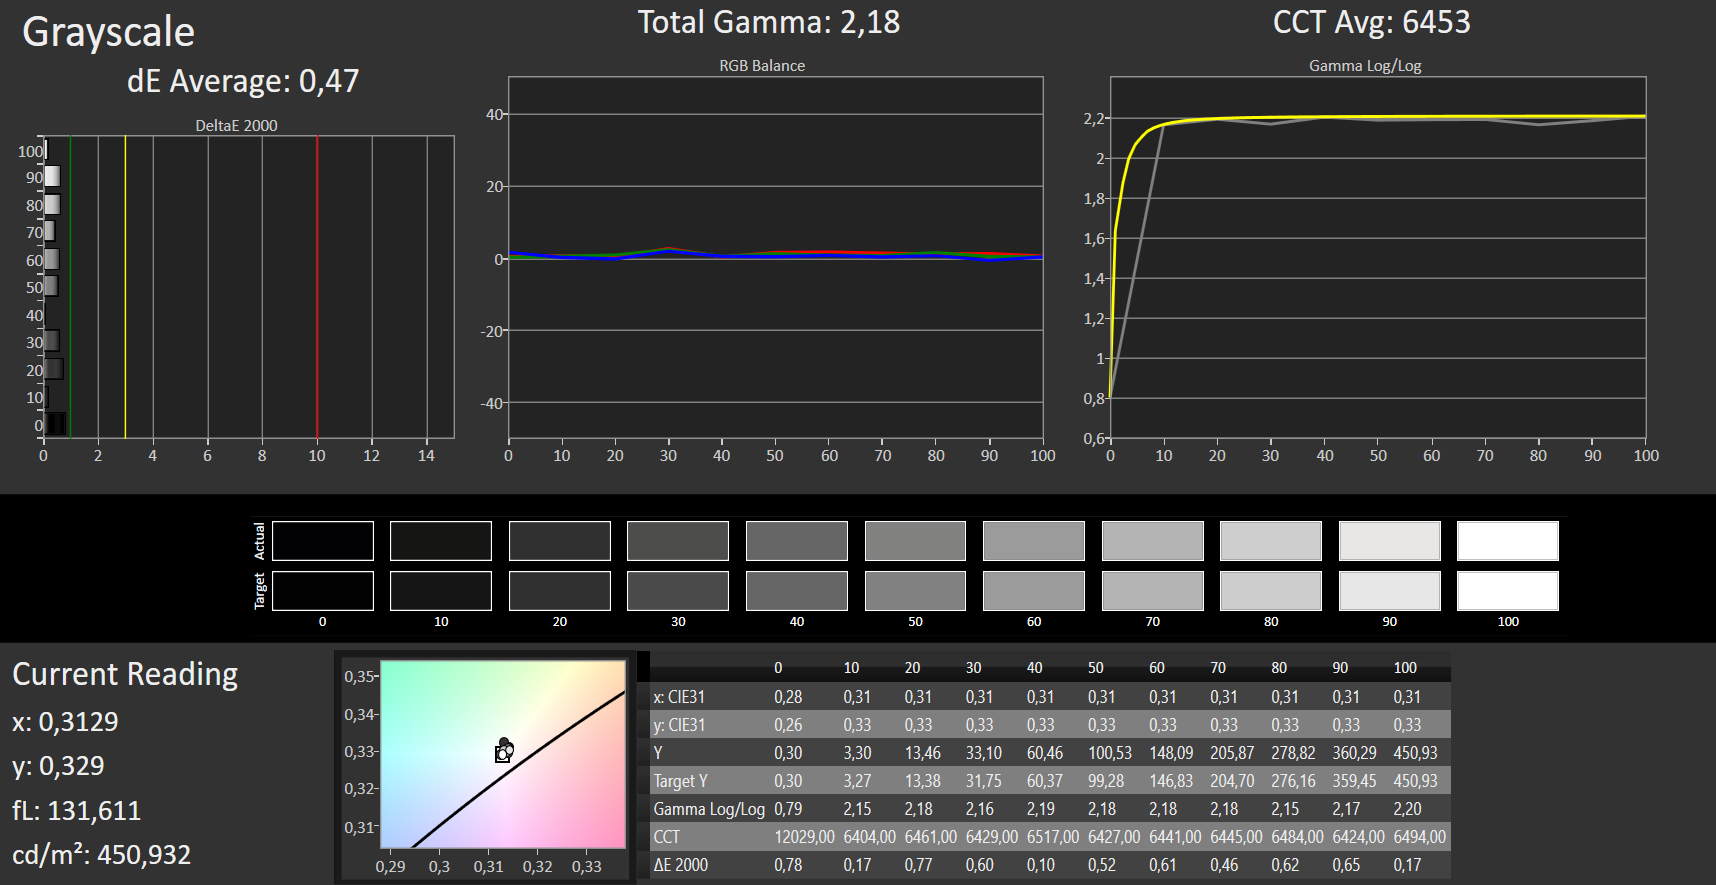
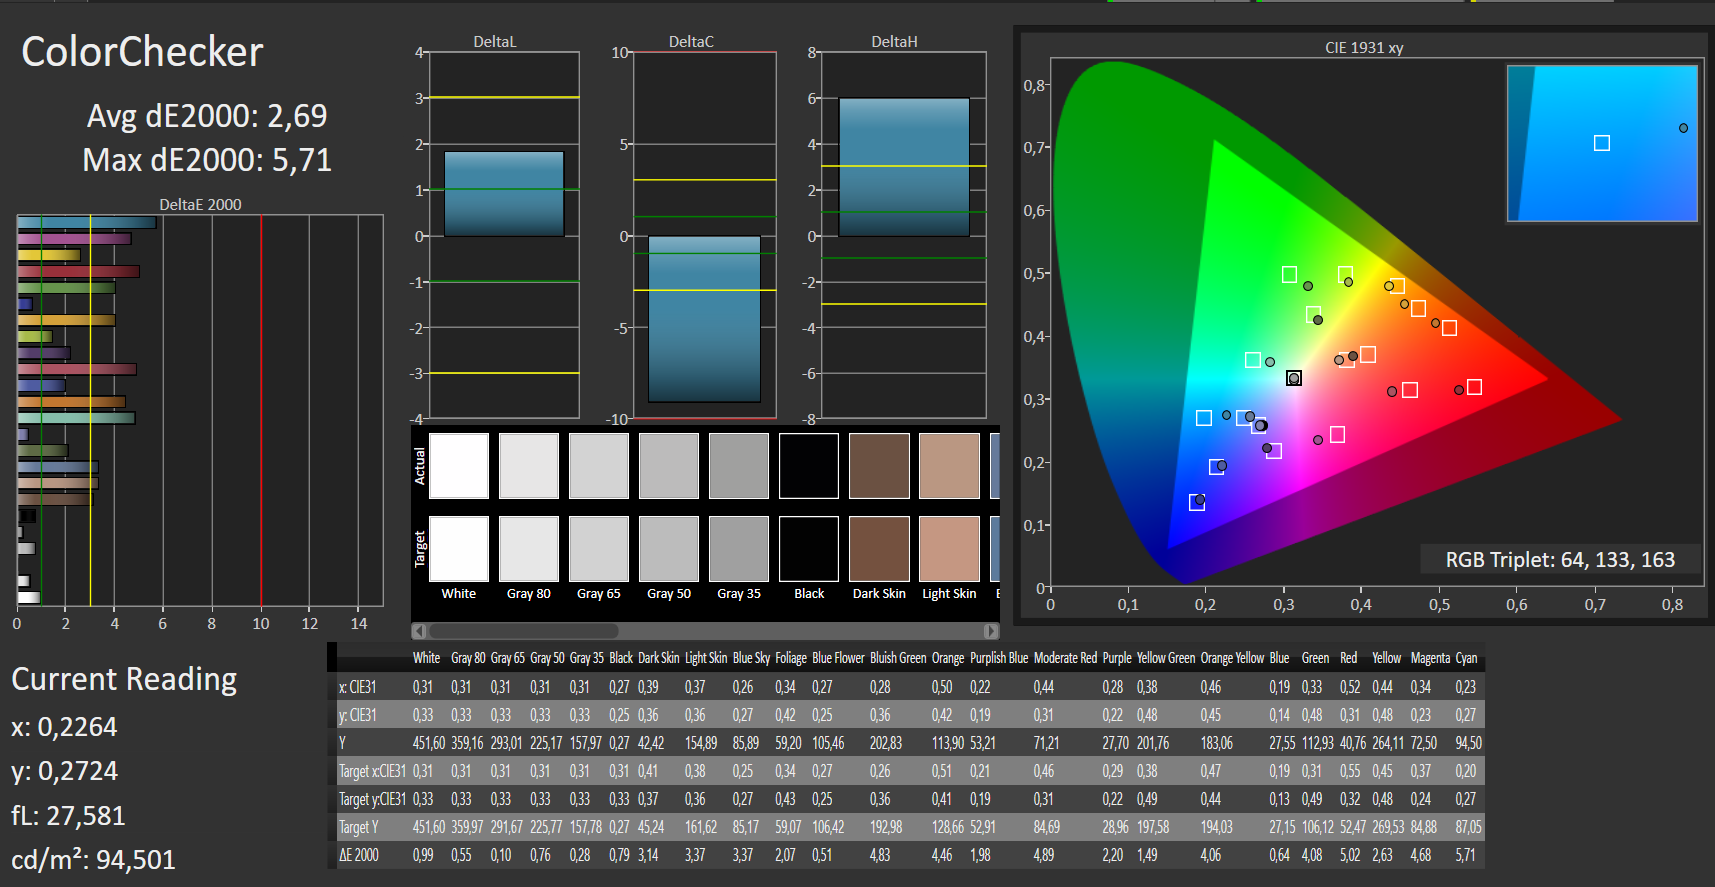
ΔE ColorChecker Calman: 2.38 | ∀{0.5-29.43 Ø4.71}
calibrated: 2.69
ΔE Greyscale Calman: 3.75 | ∀{0.09-98 Ø4.96}
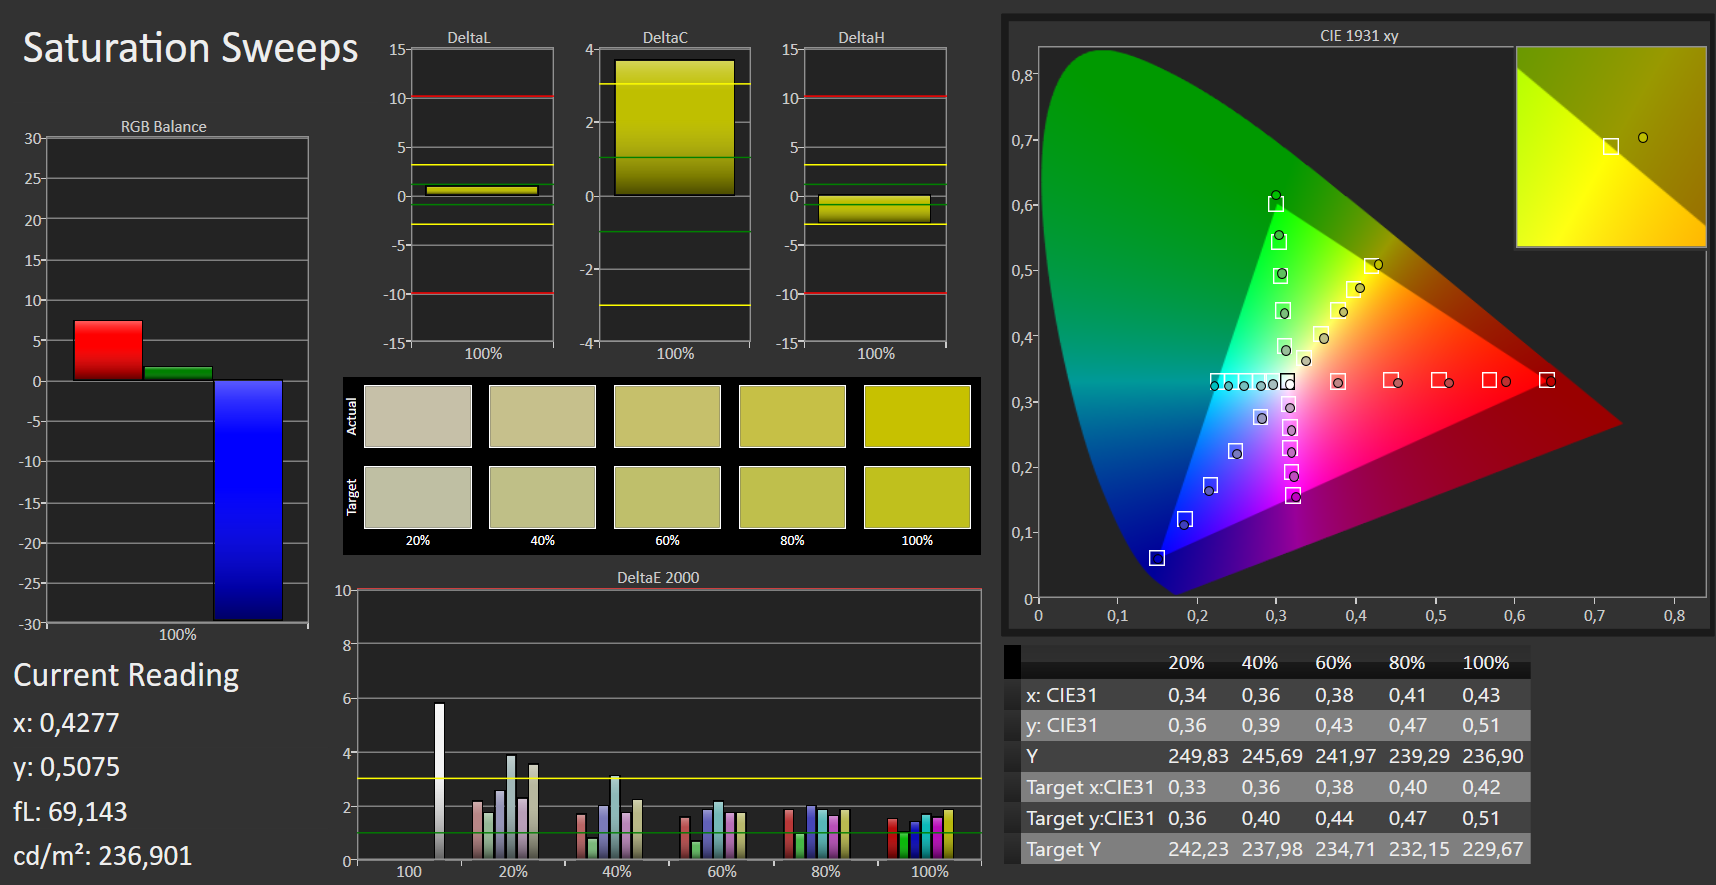
100% sRGB (Argyll 1.6.3 3D)
65% AdobeRGB 1998 (Argyll 1.6.3 3D)
71.2% AdobeRGB 1998 (Argyll 3D)
99.8% sRGB (Argyll 3D)
70.1% Display P3 (Argyll 3D)
Gamma: 2.37
CCT: 6466 K
| Acer Swift 3 SF313-52-71Y7 BOE, NE135FBM-N41, IPS, 2256x1504, 13.5" | Lenovo Yoga C940-14IIL LP140WF9-SPE2, IPS LED, 1920x1080, 14" | Acer Swift 3 SF313-51-59SZ BOE NV133FHM-N62, IPS, 1920x1080, 13.3" | Dell XPS 13 9380 2019 ID: AUO 282B B133ZAN Dell: 90NTH, IPS, 3840x2160, 13.3" | Lenovo ThinkBook 13s-20R90071GE N133HCE-EN2, a-Si IPS LED, 1920x1080, 13.3" | HP Envy 13-aq0003ng InfoVision M133NVF3 R2, IPS, 1920x1080, 13.3" | |
|---|---|---|---|---|---|---|
| Display | -4% | -9% | -8% | -3% | -8% | |
| Display P3 Coverage (%) | 70.1 | 66 -6% | 67 -4% | 64.7 -8% | 67 -4% | 64.4 -8% |
| sRGB Coverage (%) | 99.8 | 97.9 -2% | 88 -12% | 93.1 -7% | 99.1 -1% | 91.7 -8% |
| AdobeRGB 1998 Coverage (%) | 71.2 | 67.3 -5% | 64.3 -10% | 65.3 -8% | 69.2 -3% | 65.2 -8% |
| Response Times | 7% | 2% | -11% | 17% | 34% | |
| Response Time Grey 50% / Grey 80% * (ms) | 55 ? | 49.6 ? 10% | 44 ? 20% | 58 ? -5% | 40.4 ? 27% | 31 ? 44% |
| Response Time Black / White * (ms) | 31 ? | 30 ? 3% | 36 ? -16% | 36 ? -16% | 28.8 ? 7% | 24 ? 23% |
| PWM Frequency (Hz) | 208 ? | 500 ? | 25000 ? | 4000 ? | ||
| Screen | 4% | -40% | -16% | -1% | 0% | |
| Brightness middle (cd/m²) | 474 | 384 -19% | 300 -37% | 404 -15% | 319 -33% | 768 62% |
| Brightness (cd/m²) | 426 | 363 -15% | 277 -35% | 389 -9% | 309 -27% | 778 83% |
| Brightness Distribution (%) | 82 | 90 10% | 87 6% | 85 4% | 92 12% | 82 0% |
| Black Level * (cd/m²) | 0.29 | 0.17 41% | 0.26 10% | 0.37 -28% | 0.28 3% | 0.48 -66% |
| Contrast (:1) | 1634 | 2259 38% | 1154 -29% | 1092 -33% | 1139 -30% | 1600 -2% |
| Colorchecker dE 2000 * | 2.38 | 3.5 -47% | 5.96 -150% | 3.72 -56% | 2.4 -1% | 3.49 -47% |
| Colorchecker dE 2000 max. * | 5.88 | 5.5 6% | 10.6 -80% | 7.38 -26% | 6.3 -7% | 7.41 -26% |
| Colorchecker dE 2000 calibrated * | 2.69 | 1 63% | 2.47 8% | 2.06 23% | 0.6 78% | 2.07 23% |
| Greyscale dE 2000 * | 3.75 | 4.6 -23% | 7.64 -104% | 4.44 -18% | 3.8 -1% | 4.09 -9% |
| Gamma | 2.37 93% | 2.32 95% | 2.44 90% | 2.34 94% | 2.16 102% | 2.54 87% |
| CCT | 6466 101% | 6884 94% | 6877 95% | 7095 92% | 7335 89% | 6452 101% |
| Color Space (Percent of AdobeRGB 1998) (%) | 65 | 62 -5% | 57 -12% | 60 -8% | 63.5 -2% | 60 -8% |
| Color Space (Percent of sRGB) (%) | 100 | 97.7 -2% | 88 -12% | 93 -7% | 99.1 -1% | 92 -8% |
| Total Average (Program / Settings) | 2% /
3% | -16% /
-29% | -12% /
-14% | 4% /
1% | 9% /
3% |
* ... smaller is better
Display Response Times
| ↔ Response Time Black to White | ||
|---|---|---|
| 31 ms ... rise ↗ and fall ↘ combined | ↗ 17 ms rise | 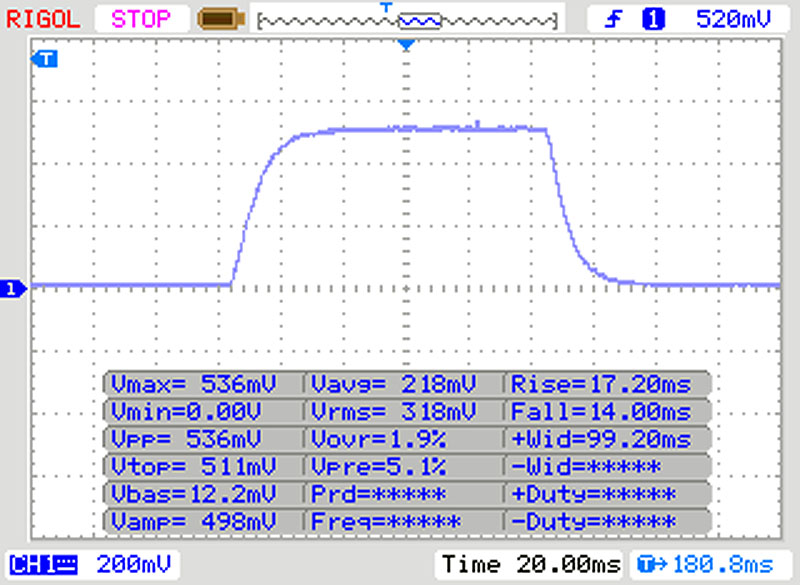 |
| ↘ 14 ms fall | ||
| The screen shows slow response rates in our tests and will be unsatisfactory for gamers. In comparison, all tested devices range from 0.1 (minimum) to 240 (maximum) ms. » 84 % of all devices are better. This means that the measured response time is worse than the average of all tested devices (19.8 ms). | ||
| ↔ Response Time 50% Grey to 80% Grey | ||
| 55 ms ... rise ↗ and fall ↘ combined | ↗ 25 ms rise | 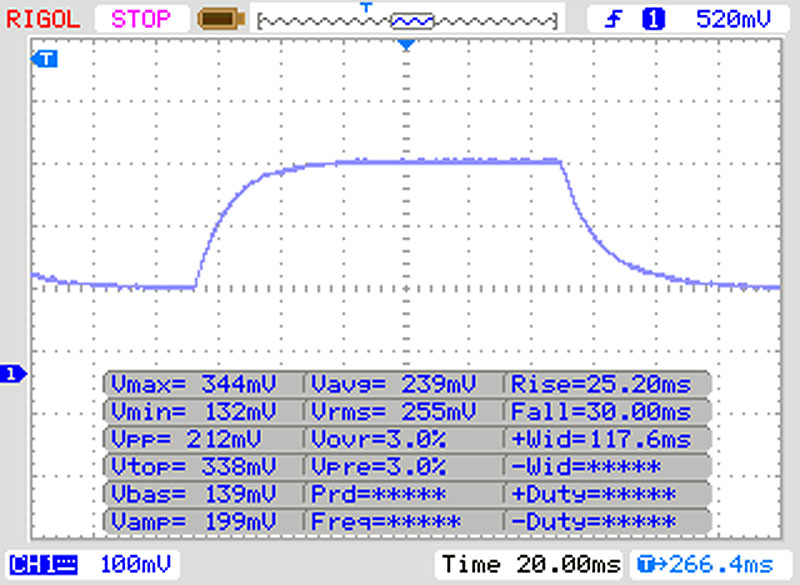 |
| ↘ 30 ms fall | ||
| The screen shows slow response rates in our tests and will be unsatisfactory for gamers. In comparison, all tested devices range from 0.165 (minimum) to 636 (maximum) ms. » 92 % of all devices are better. This means that the measured response time is worse than the average of all tested devices (30.9 ms). | ||
Screen Flickering / PWM (Pulse-Width Modulation)
| Screen flickering / PWM detected | 208 Hz | ≤ 90 % brightness setting | 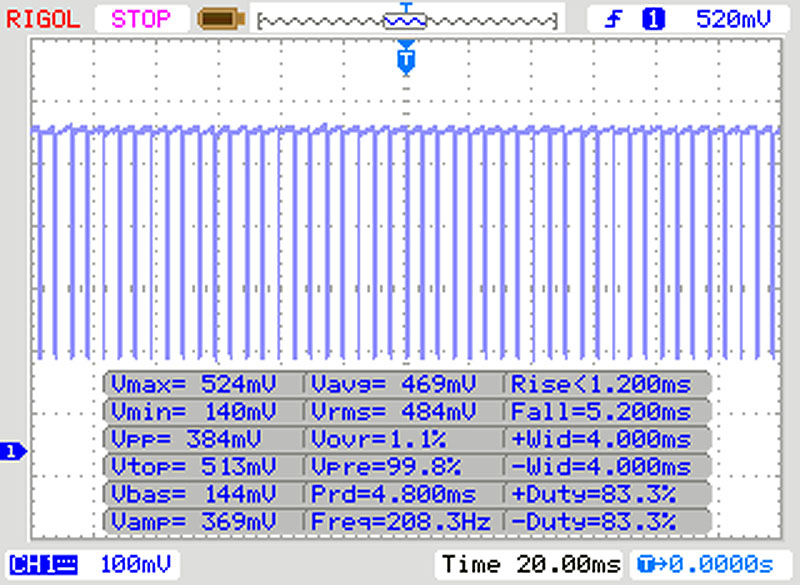 |
The display backlight flickers at 208 Hz (worst case, e.g., utilizing PWM) Flickering detected at a brightness setting of 90 % and below. There should be no flickering or PWM above this brightness setting. The frequency of 208 Hz is relatively low, so sensitive users will likely notice flickering and experience eyestrain at the stated brightness setting and below. In comparison: 52 % of all tested devices do not use PWM to dim the display. If PWM was detected, an average of 7744 (minimum: 5 - maximum: 343500) Hz was measured. | |||
* ... smaller is better
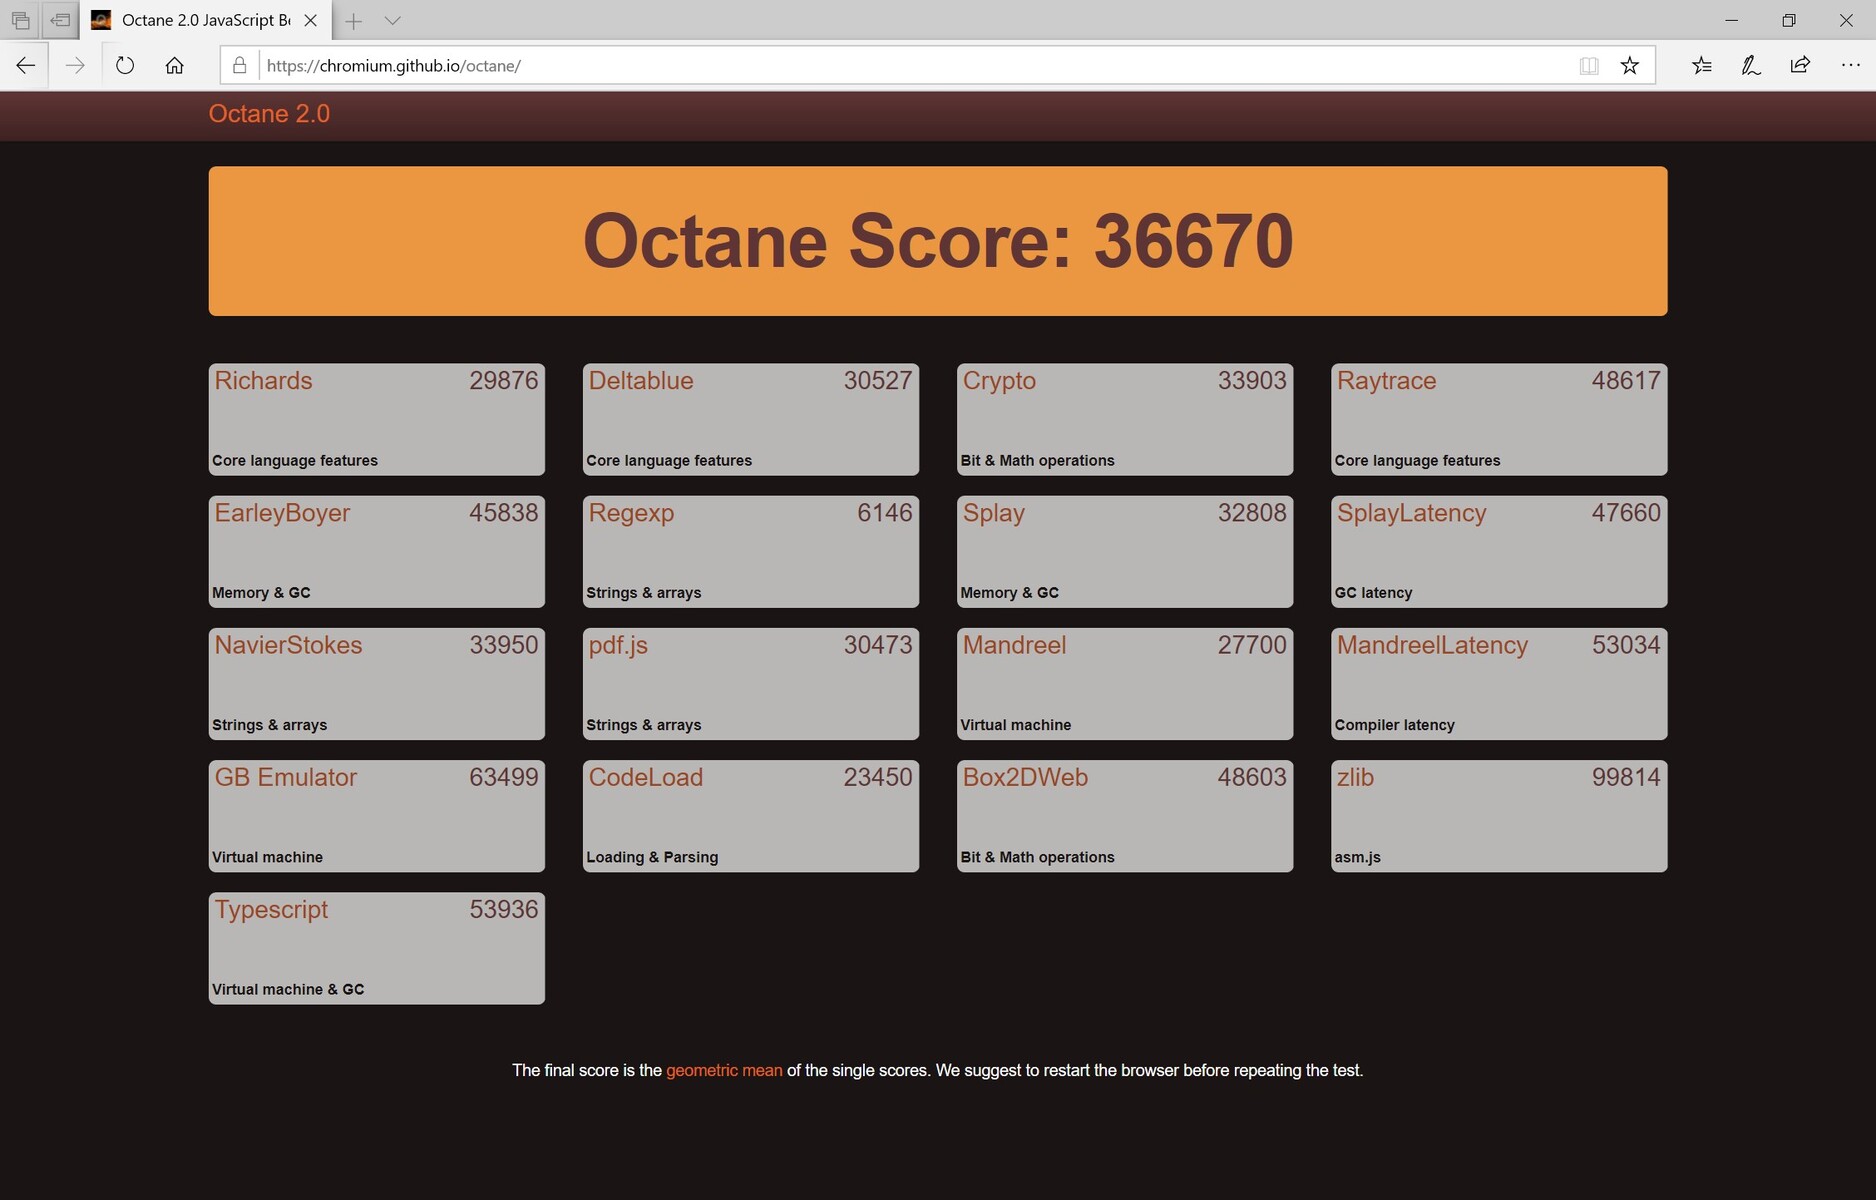
| PCMark 8 Home Score Accelerated v2 | 3759 points | |
| PCMark 8 Creative Score Accelerated v2 | 5979 points | |
| PCMark 8 Work Score Accelerated v2 | 4802 points | |
| PCMark 10 Score | 3975 points | |
Help | ||
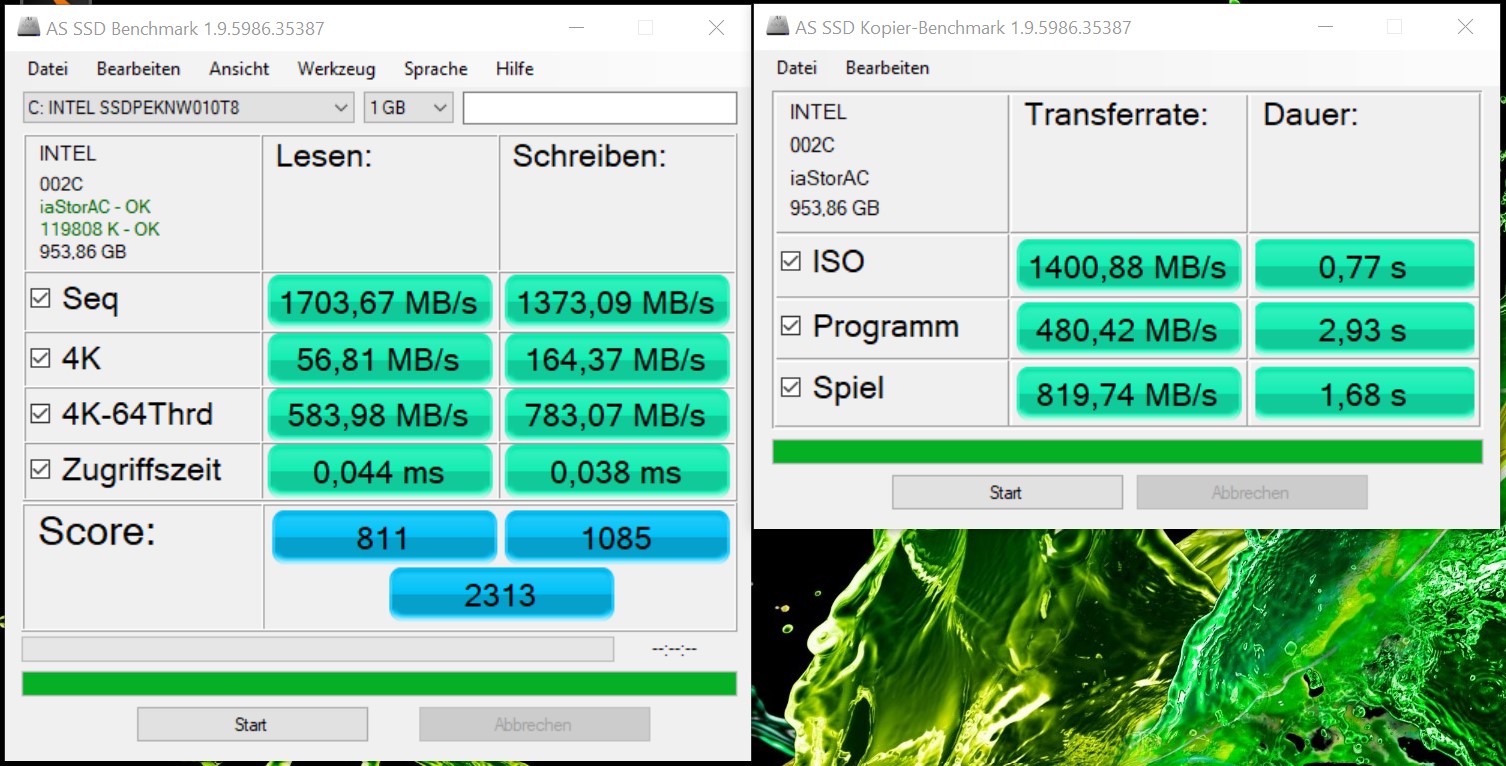
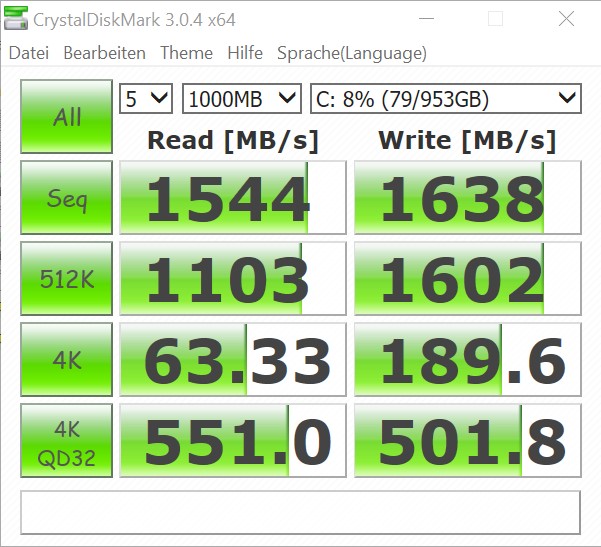
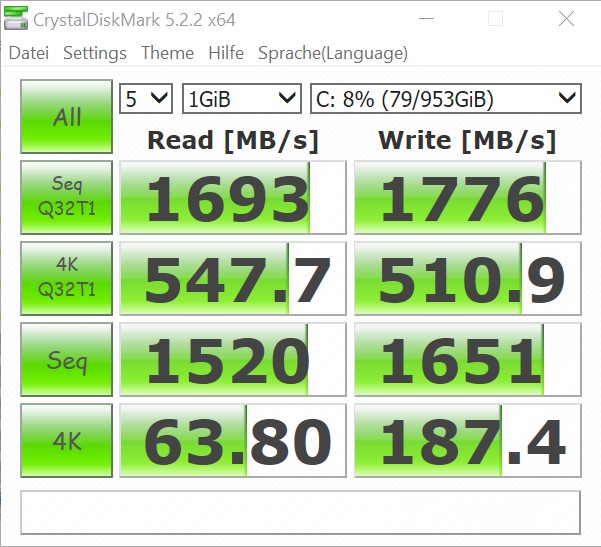
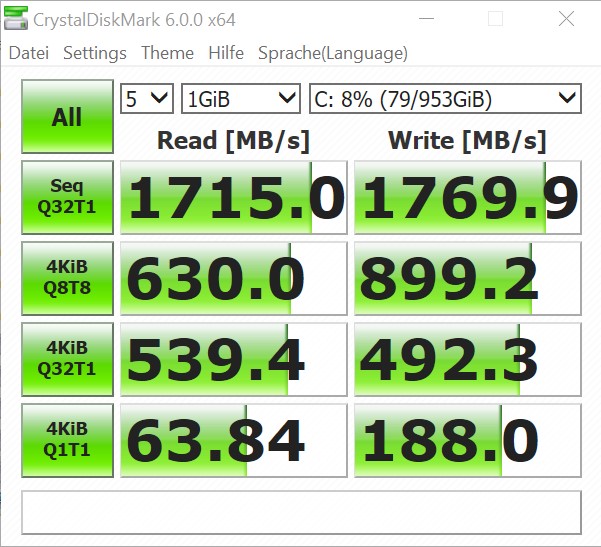
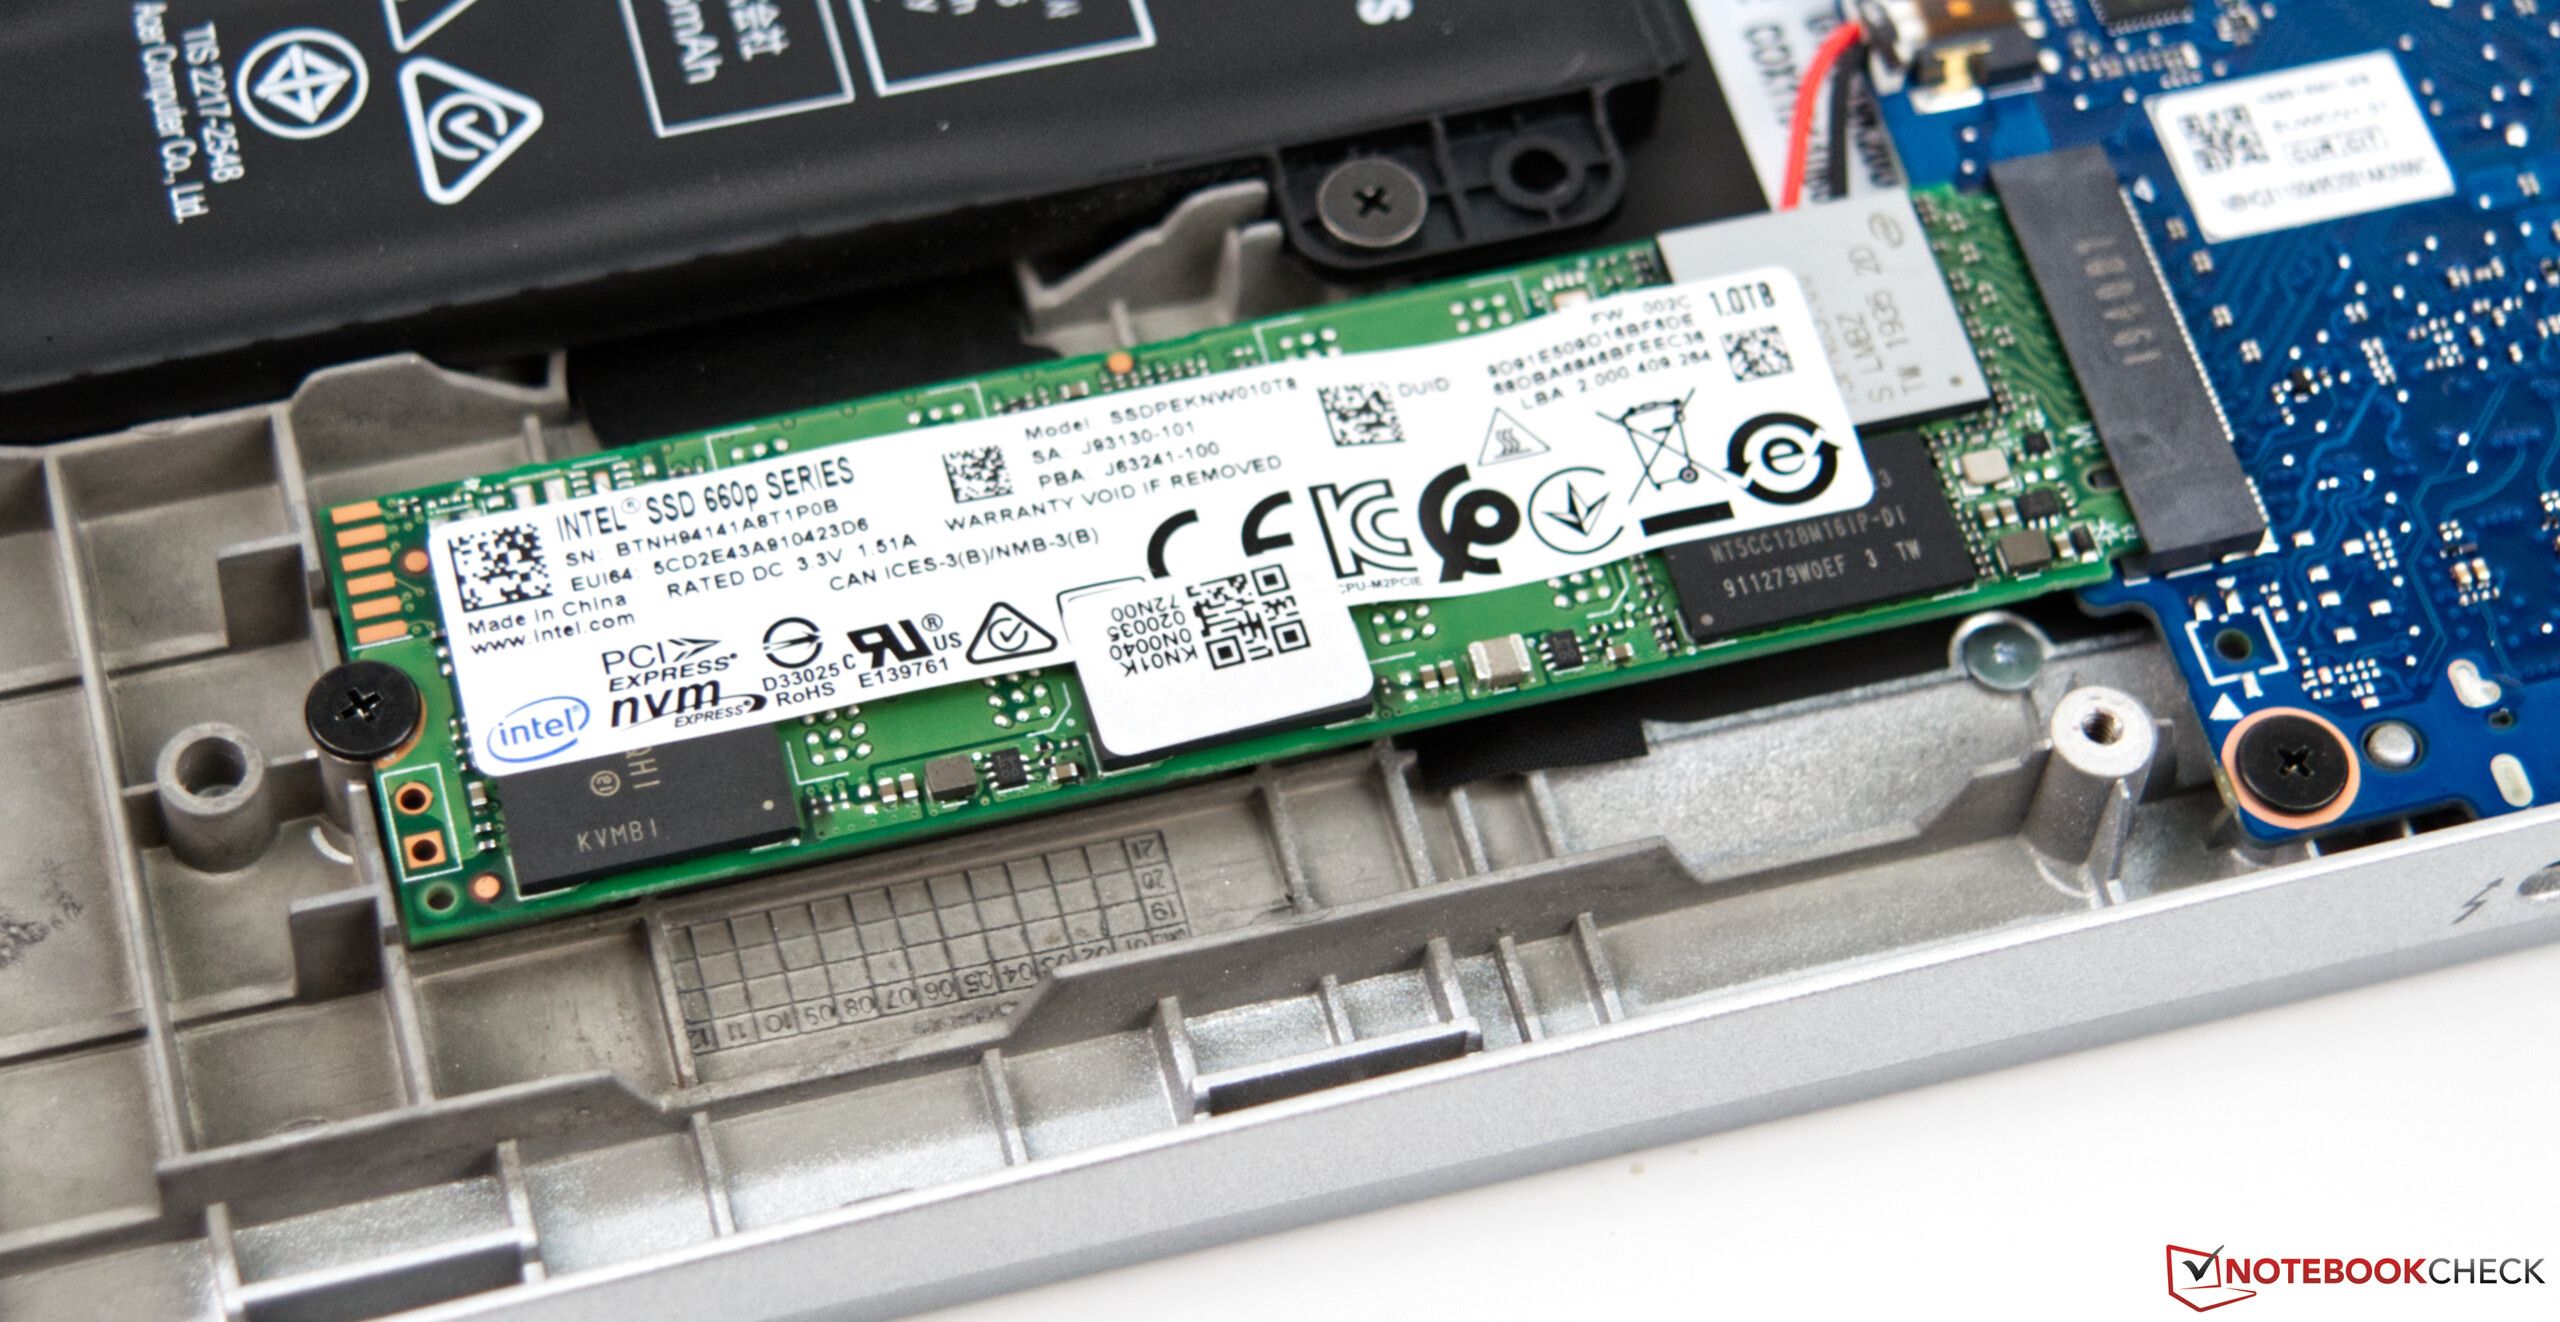
| Acer Swift 3 SF313-52-71Y7 Intel SSD 660p 1TB SSDPEKNW010T8 | Lenovo Yoga C940-14IIL Samsung SSD PM981 MZVLB512HAJQ | Acer Swift 3 SF313-51-59SZ Kingston RBUSNS8154P3256GJ1 | Dell XPS 13 9380 2019 SK hynix PC401 HFS256GD9TNG | Lenovo ThinkBook 13s-20R90071GE SK hynix BC501 HFM512GDHTNG-8310A | HP Envy 13-aq0003ng Toshiba KBG30ZMV512G | Average Intel SSD 660p 1TB SSDPEKNW010T8 | |
|---|---|---|---|---|---|---|---|
| CrystalDiskMark 5.2 / 6 | 8% | -7% | -36% | -34% | -42% | -11% | |
| Write 4K (MB/s) | 187.4 | 128.4 -31% | 113.7 -39% | 84.6 -55% | 89.3 -52% | 106.2 -43% | 144.5 ? -23% |
| Read 4K (MB/s) | 63.8 | 46.37 -27% | 40.6 -36% | 38.52 -40% | 37.4 -41% | 44.89 -30% | 54.1 ? -15% |
| Write Seq (MB/s) | 1776 | 1863 5% | 845 -52% | 557 -69% | 608 -66% | 639 -64% | 1445 ? -19% |
| Read Seq (MB/s) | 1693 | 2340 38% | 1137 -33% | 1393 -18% | 1019 -40% | 849 -50% | 1446 ? -15% |
| Write 4K Q32T1 (MB/s) | 492.3 | 451.1 -8% | 868 76% | 339.5 -31% | 487.9 -1% | 217.4 -56% | 427 ? -13% |
| Read 4K Q32T1 (MB/s) | 539 | 415.3 -23% | 1580 193% | 255.4 -53% | 284.8 -47% | 322.1 -40% | 456 ? -15% |
| Write Seq Q32T1 (MB/s) | 1770 | 2985 69% | 345.6 -80% | 558 -68% | 872 -51% | 865 -51% | 1650 ? -7% |
| Read Seq Q32T1 (MB/s) | 1715 | 2565 50% | 411.7 -76% | 2541 48% | 1635 -5% | 1630 -5% | 1728 ? 1% |
| Write 4K Q8T8 (MB/s) | 899 | 451.4 -50% | 647 -28% | 387.3 -57% | 880 ? -2% | ||
| Read 4K Q8T8 (MB/s) | 630 | 1004 59% | 685 9% | 757 20% | 629 ? 0% | ||
| AS SSD | 35% | -26% | -33% | -18% | -72% | -14% | |
| Seq Read (MB/s) | 1703 | 2525 48% | 1403 -18% | 2035 19% | 1264 -26% | 1295 -24% | 1456 ? -15% |
| Seq Write (MB/s) | 1373 | 1253 -9% | 836 -39% | 658 -52% | 518 -62% | 593 -57% | 1404 ? 2% |
| 4K Read (MB/s) | 56.8 | 59.1 4% | 42.19 -26% | 39.74 -30% | 40.31 -29% | 45.58 -20% | 48.7 ? -14% |
| 4K Write (MB/s) | 164.4 | 134.1 -18% | 99.7 -39% | 105.7 -36% | 119.1 -28% | 118.8 -28% | 131.6 ? -20% |
| 4K-64 Read (MB/s) | 584 | 1010 73% | 738 26% | 461 -21% | 772 32% | 604 3% | 586 ? 0% |
| 4K-64 Write (MB/s) | 783 | 1461 87% | 606 -23% | 300.1 -62% | 672 -14% | 272.4 -65% | 788 ? 1% |
| Access Time Read * (ms) | 0.044 | 0.052 -18% | 0.074 -68% | 0.061 -39% | 0.046 -5% | 0.147 -234% | 0.07236 ? -64% |
| Access Time Write * (ms) | 0.038 | 0.029 24% | 0.045 -18% | 0.051 -34% | 0.031 18% | 0.168 -342% | 0.07731 ? -103% |
| Score Read (Points) | 811 | 1322 63% | 921 14% | 704 -13% | 939 16% | 779 -4% | 780 ? -4% |
| Score Write (Points) | 1085 | 1721 59% | 789 -27% | 471 -57% | 843 -22% | 450 -59% | 1060 ? -2% |
| Score Total (Points) | 2313 | 3670 59% | 2163 -6% | 1479 -36% | 2234 -3% | 1607 -31% | 2252 ? -3% |
| Copy ISO MB/s (MB/s) | 1401 | 2016 44% | 586 -58% | 893 -36% | 943 -33% | 593 -58% | 1469 ? 5% |
| Copy Program MB/s (MB/s) | 480.4 | 542 13% | 315.2 -34% | 287.9 -40% | 292.2 -39% | 277.6 -42% | 484 ? 1% |
| Copy Game MB/s (MB/s) | 820 | 1278 56% | 478.5 -42% | 618 -25% | 374.1 -54% | 452.7 -45% | 997 ? 22% |
| Total Average (Program / Settings) | 22% /
24% | -17% /
-18% | -35% /
-34% | -26% /
-25% | -57% /
-61% | -13% /
-13% |
* ... smaller is better

| 3DMark 11 Performance | 4308 points | |
| 3DMark Ice Storm Standard Score | 63796 points | |
| 3DMark Cloud Gate Standard Score | 11959 points | |
| 3DMark Fire Strike Score | 2508 points | |
| 3DMark Fire Strike Extreme Score | 1252 points | |
Help | ||
| low | med. | high | ultra | |
|---|---|---|---|---|
| BioShock Infinite (2013) | 91.6 | 58.6 | 50.9 | 19.4 |
| Dota 2 Reborn (2015) | 82.7 | 52.7 | 32.8 | 30 |
| Rise of the Tomb Raider (2016) | 38.9 | 23.4 | 13.6 | |
| Rocket League (2017) | 100 | 52.8 | 39.6 | |
| X-Plane 11.11 (2018) | 28.2 | 12.5 | 12.1 | |
| Borderlands 3 (2019) | 26.7 | 11.7 | 7.73 |
Noise level
| Idle |
| 30.3 / 30.3 / 30.3 dB(A) |
| Load |
| 31.7 / 32.7 dB(A) |
 | ||
30 dB silent 40 dB(A) audible 50 dB(A) loud |
||
min: | ||
| Acer Swift 3 SF313-52-71Y7 Iris Plus Graphics G7 (Ice Lake 64 EU), i7-1065G7, Intel SSD 660p 1TB SSDPEKNW010T8 | Lenovo Yoga C940-14IIL Iris Plus Graphics G7 (Ice Lake 64 EU), i7-1065G7, Samsung SSD PM981 MZVLB512HAJQ | Acer Swift 3 SF313-51-59SZ UHD Graphics 620, i5-8250U, Kingston RBUSNS8154P3256GJ1 | Dell XPS 13 9380 2019 UHD Graphics 620, i5-8265U, SK hynix PC401 HFS256GD9TNG | Lenovo ThinkBook 13s-20R90071GE UHD Graphics 620, i5-8265U, SK hynix BC501 HFM512GDHTNG-8310A | HP Envy 13-aq0003ng GeForce MX250, i7-8565U, Toshiba KBG30ZMV512G | |
|---|---|---|---|---|---|---|
| Noise | 1% | -2% | -3% | 1% | -3% | |
| off / environment * (dB) | 30.3 | 29.3 3% | 30.4 -0% | 30.4 -0% | 28.8 5% | 30 1% |
| Idle Minimum * (dB) | 30.3 | 29.3 3% | 30.4 -0% | 30.4 -0% | 28.8 5% | 30 1% |
| Idle Average * (dB) | 30.3 | 29.3 3% | 30.4 -0% | 30.4 -0% | 28.8 5% | 30 1% |
| Idle Maximum * (dB) | 30.3 | 29.3 3% | 30.7 -1% | 30.4 -0% | 29.7 2% | 30 1% |
| Load Average * (dB) | 31.7 | 33.3 -5% | 33.7 -6% | 31.7 -0% | 30.7 3% | |
| Load Maximum * (dB) | 32.7 | 33.3 -2% | 34 -4% | 38.1 -17% | 38.3 -17% | 39.5 -21% |
* ... smaller is better
(+) The maximum temperature on the upper side is 33.5 °C / 92 F, compared to the average of 35.9 °C / 97 F, ranging from 21.4 to 59 °C for the class Subnotebook.
(+) The bottom heats up to a maximum of 35.6 °C / 96 F, compared to the average of 39.2 °C / 103 F
(+) In idle usage, the average temperature for the upper side is 23.9 °C / 75 F, compared to the device average of 30.8 °C / 87 F.
(+) The palmrests and touchpad are cooler than skin temperature with a maximum of 26.1 °C / 79 F and are therefore cool to the touch.
(+) The average temperature of the palmrest area of similar devices was 28.2 °C / 82.8 F (+2.1 °C / 3.8 F).
| Acer Swift 3 SF313-52-71Y7 Iris Plus Graphics G7 (Ice Lake 64 EU), i7-1065G7, Intel SSD 660p 1TB SSDPEKNW010T8 | Lenovo Yoga C940-14IIL Iris Plus Graphics G7 (Ice Lake 64 EU), i7-1065G7, Samsung SSD PM981 MZVLB512HAJQ | Acer Swift 3 SF313-51-59SZ UHD Graphics 620, i5-8250U, Kingston RBUSNS8154P3256GJ1 | Dell XPS 13 9380 2019 UHD Graphics 620, i5-8265U, SK hynix PC401 HFS256GD9TNG | Lenovo ThinkBook 13s-20R90071GE UHD Graphics 620, i5-8265U, SK hynix BC501 HFM512GDHTNG-8310A | HP Envy 13-aq0003ng GeForce MX250, i7-8565U, Toshiba KBG30ZMV512G | |
|---|---|---|---|---|---|---|
| Heat | -11% | -12% | -22% | -10% | -20% | |
| Maximum Upper Side * (°C) | 33.5 | 41 -22% | 40.4 -21% | 47.2 -41% | 40.3 -20% | 41 -22% |
| Maximum Bottom * (°C) | 35.6 | 44.6 -25% | 42.1 -18% | 43.3 -22% | 44.6 -25% | 42.9 -21% |
| Idle Upper Side * (°C) | 24.9 | 24.4 2% | 26.2 -5% | 27.6 -11% | 24.3 2% | 29.3 -18% |
| Idle Bottom * (°C) | 25.4 | 25 2% | 26 -2% | 28.6 -13% | 24.4 4% | 30.2 -19% |
* ... smaller is better
Acer Swift 3 SF313-52-71Y7 audio analysis
(-) | not very loud speakers (71.7 dB)
Bass 100 - 315 Hz
(-) | nearly no bass - on average 26.5% lower than median
(±) | linearity of bass is average (9.8% delta to prev. frequency)
Mids 400 - 2000 Hz
(+) | balanced mids - only 3.7% away from median
(±) | linearity of mids is average (8.8% delta to prev. frequency)
Highs 2 - 16 kHz
(±) | higher highs - on average 5% higher than median
(+) | highs are linear (5.7% delta to prev. frequency)
Overall 100 - 16.000 Hz
(±) | linearity of overall sound is average (27.4% difference to median)
Compared to same class
» 89% of all tested devices in this class were better, 3% similar, 8% worse
» The best had a delta of 5%, average was 18%, worst was 53%
Compared to all devices tested
» 83% of all tested devices were better, 4% similar, 13% worse
» The best had a delta of 4%, average was 23%, worst was 134%
Lenovo Yoga C940-14IIL audio analysis
(±) | speaker loudness is average but good (76.8 dB)
Bass 100 - 315 Hz
(±) | reduced bass - on average 6% lower than median
(±) | linearity of bass is average (9.9% delta to prev. frequency)
Mids 400 - 2000 Hz
(+) | balanced mids - only 3.9% away from median
(+) | mids are linear (3.6% delta to prev. frequency)
Highs 2 - 16 kHz
(±) | reduced highs - on average 7.6% lower than median
(+) | highs are linear (6.1% delta to prev. frequency)
Overall 100 - 16.000 Hz
(±) | linearity of overall sound is average (16.9% difference to median)
Compared to same class
» 32% of all tested devices in this class were better, 7% similar, 61% worse
» The best had a delta of 6%, average was 20%, worst was 57%
Compared to all devices tested
» 30% of all tested devices were better, 8% similar, 62% worse
» The best had a delta of 4%, average was 23%, worst was 134%
| Off / Standby | |
| Idle | |
| Load |
|
Key:
min: | |
| Acer Swift 3 SF313-52-71Y7 i7-1065G7, Iris Plus Graphics G7 (Ice Lake 64 EU), Intel SSD 660p 1TB SSDPEKNW010T8, IPS, 2256x1504, 13.5" | Lenovo Yoga C940-14IIL i7-1065G7, Iris Plus Graphics G7 (Ice Lake 64 EU), Samsung SSD PM981 MZVLB512HAJQ, IPS LED, 1920x1080, 14" | Acer Swift 3 SF313-51-59SZ i5-8250U, UHD Graphics 620, Kingston RBUSNS8154P3256GJ1, IPS, 1920x1080, 13.3" | Dell XPS 13 9380 2019 i5-8265U, UHD Graphics 620, SK hynix PC401 HFS256GD9TNG, IPS, 3840x2160, 13.3" | Lenovo ThinkBook 13s-20R90071GE i5-8265U, UHD Graphics 620, SK hynix BC501 HFM512GDHTNG-8310A, a-Si IPS LED, 1920x1080, 13.3" | HP Envy 13-aq0003ng i7-8565U, GeForce MX250, Toshiba KBG30ZMV512G, IPS, 1920x1080, 13.3" | Average Intel Iris Plus Graphics G7 (Ice Lake 64 EU) | Average of class Subnotebook | |
|---|---|---|---|---|---|---|---|---|
| Power Consumption | -77% | -48% | -88% | -42% | -98% | -71% | -75% | |
| Idle Minimum * (Watt) | 1.8 | 3.2 -78% | 3.4 -89% | 4.8 -167% | 3.1 -72% | 3.9 -117% | 3.91 ? -117% | 3.73 ? -107% |
| Idle Average * (Watt) | 4.6 | 7 -52% | 5.8 -26% | 8.6 -87% | 5.87 -28% | 7.8 -70% | 7.33 ? -59% | 6.57 ? -43% |
| Idle Maximum * (Watt) | 6.1 | 8.9 -46% | 8.8 -44% | 10.4 -70% | 6.6 -8% | 10.8 -77% | 9.16 ? -50% | 7.93 ? -30% |
| Load Average * (Watt) | 27.4 | 47.6 -74% | 34 -24% | 37.9 -38% | 35.3 -29% | 53 -93% | 39.2 ? -43% | 42.1 ? -54% |
| Load Maximum * (Watt) | 27 | 63.1 -134% | 42 -56% | 48.5 -80% | 46.5 -72% | 62.7 -132% | 49.8 ? -84% | 65.1 ? -141% |
* ... smaller is better

| Acer Swift 3 SF313-52-71Y7 i7-1065G7, Iris Plus Graphics G7 (Ice Lake 64 EU), 54.5 Wh | Lenovo Yoga C940-14IIL i7-1065G7, Iris Plus Graphics G7 (Ice Lake 64 EU), 60 Wh | Acer Swift 3 SF313-51-59SZ i5-8250U, UHD Graphics 620, 48.8 Wh | Dell XPS 13 9380 2019 i5-8265U, UHD Graphics 620, 52 Wh | Lenovo ThinkBook 13s-20R90071GE i5-8265U, UHD Graphics 620, 45 Wh | HP Envy 13-aq0003ng i7-8565U, GeForce MX250, 53.2 Wh | Average of class Subnotebook | |
|---|---|---|---|---|---|---|---|
| Battery runtime | -8% | -10% | -12% | -16% | -17% | 23% | |
| Reader / Idle (h) | 21.4 | 18.6 -13% | 17.2 -20% | 26.4 ? 23% | |||
| H.264 (h) | 10.5 | 13.2 26% | 8.3 -21% | 10.8 3% | 15.3 ? 46% | ||
| WiFi v1.3 (h) | 10.3 | 10.6 3% | 9.6 -7% | 8.3 -19% | 9.1 -12% | 8.5 -17% | 13.9 ? 35% |
| Load (h) | 2.3 | 1.1 -52% | 2.3 0% | 2.4 4% | 1.4 -39% | 2.04 ? -11% |
Pros
Cons
Verdict – A Good Subnotebook with some Minor Flaws

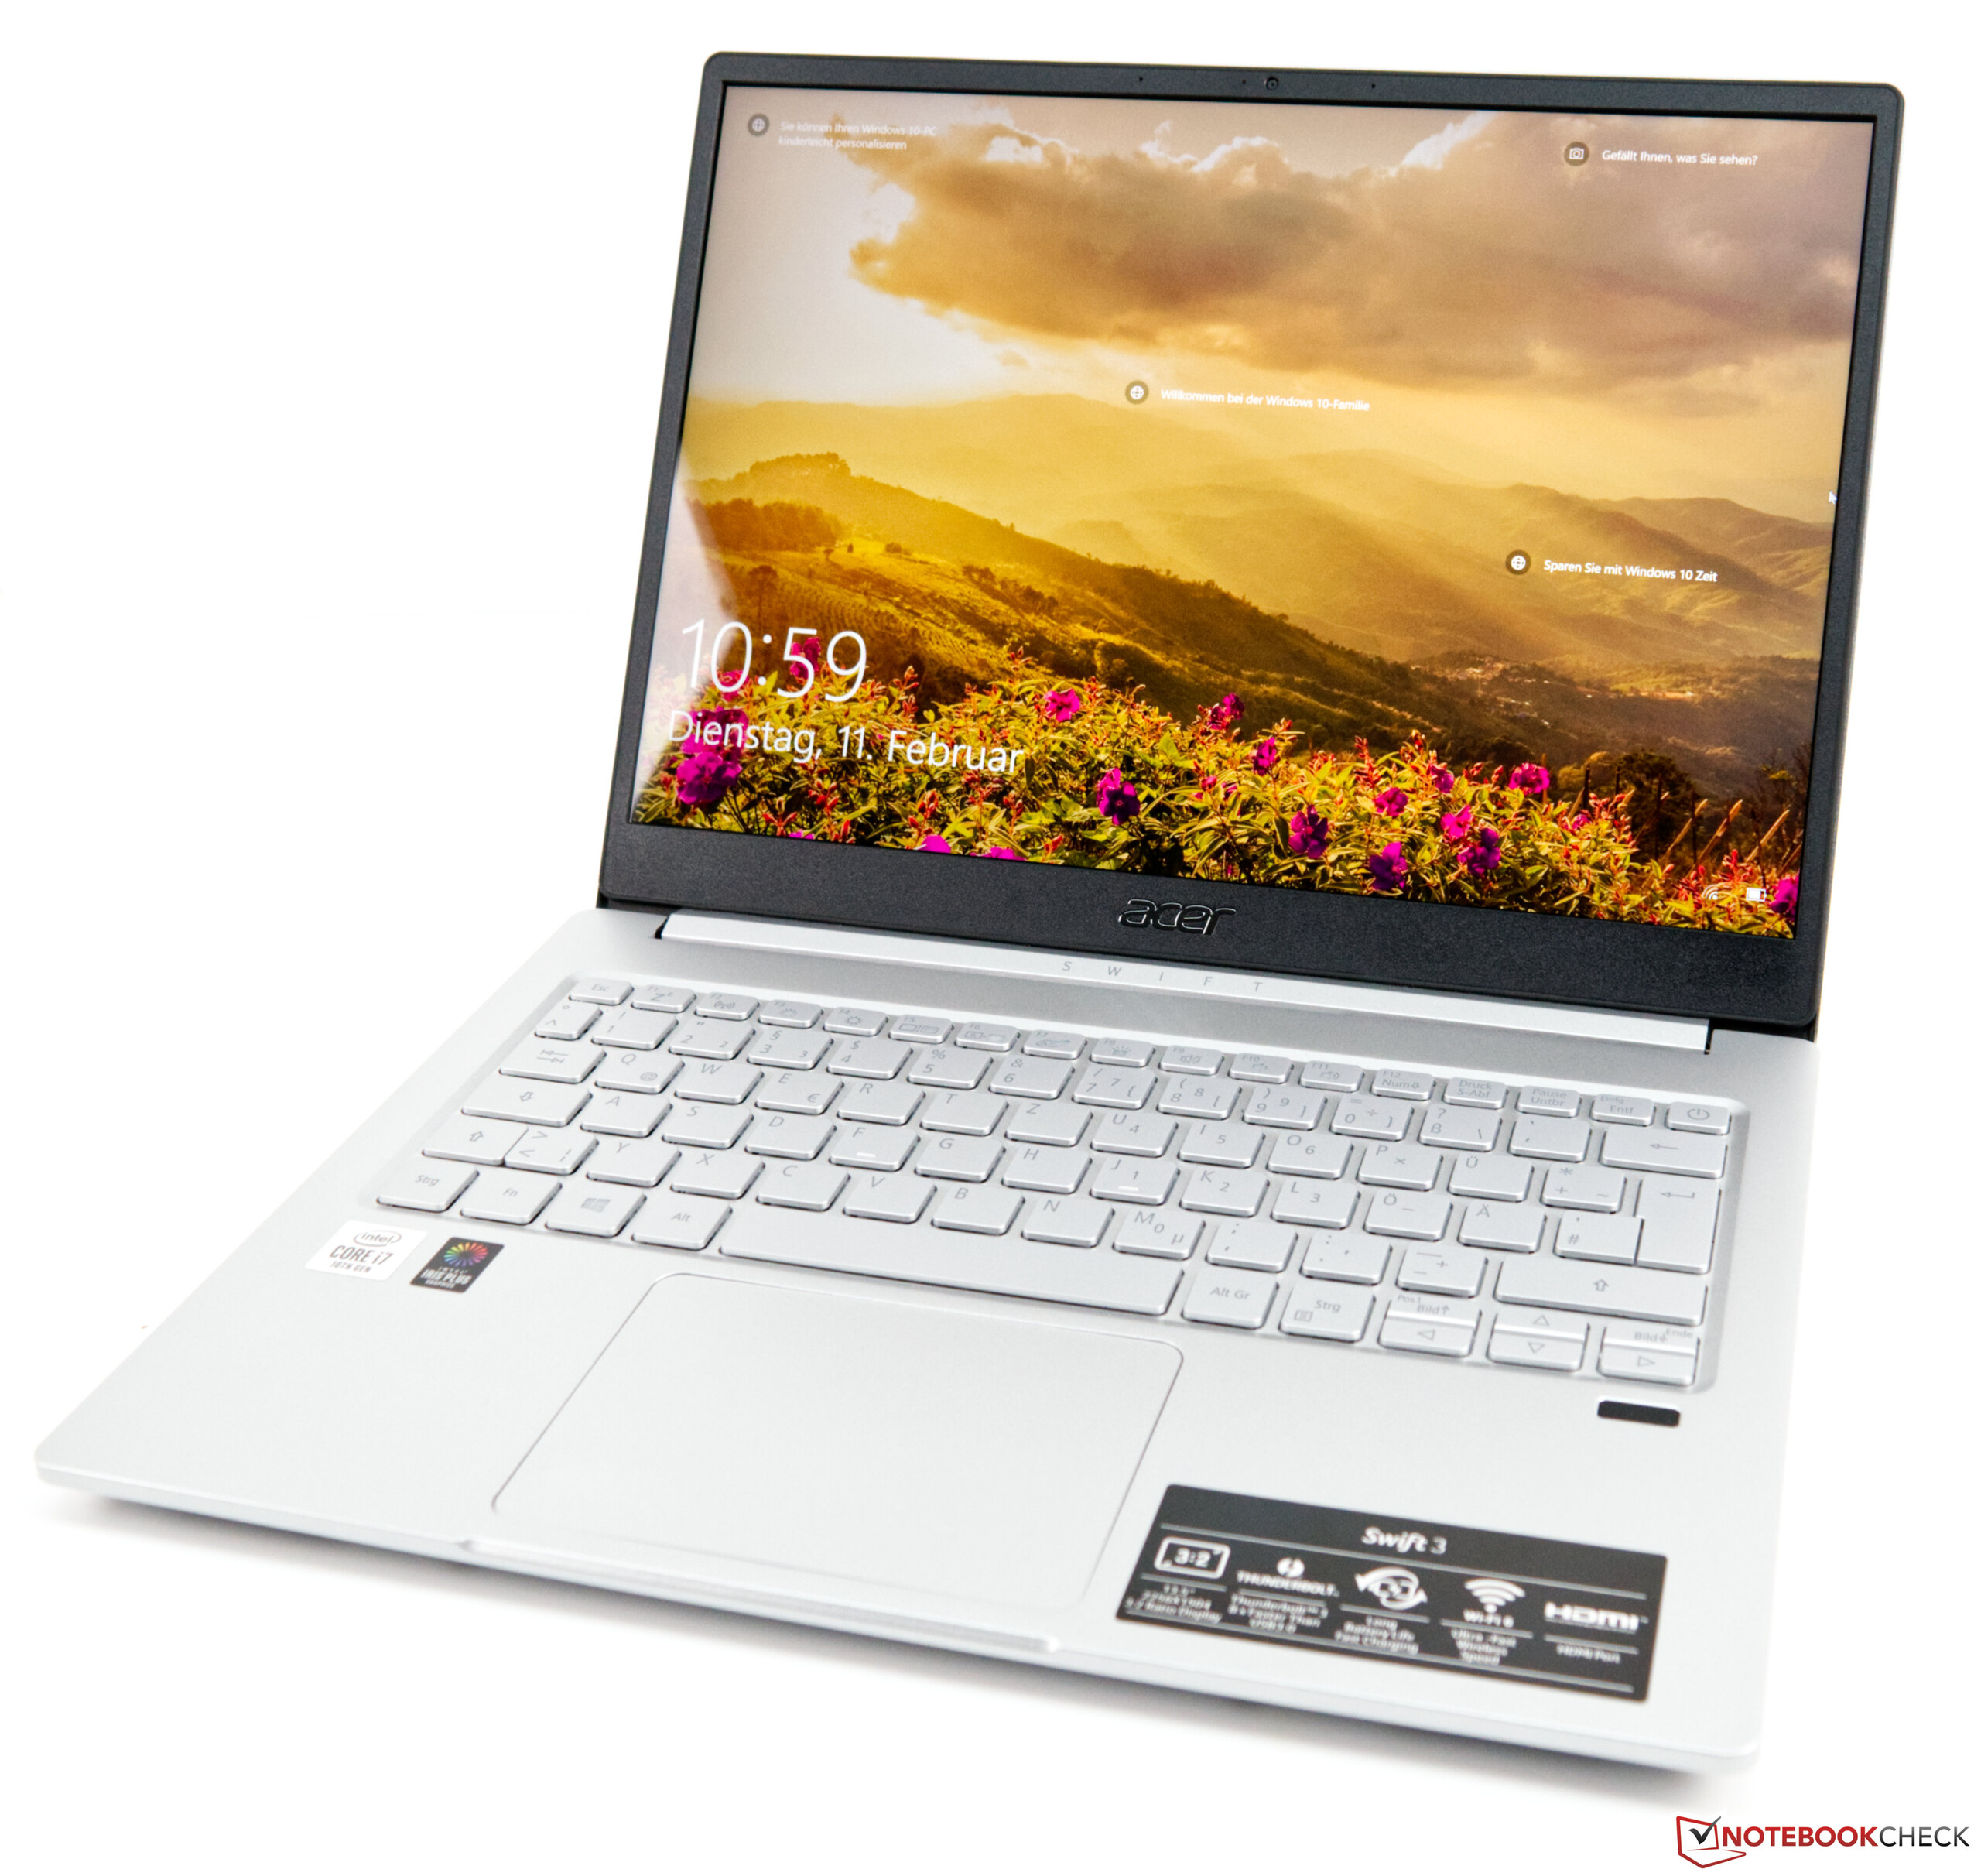
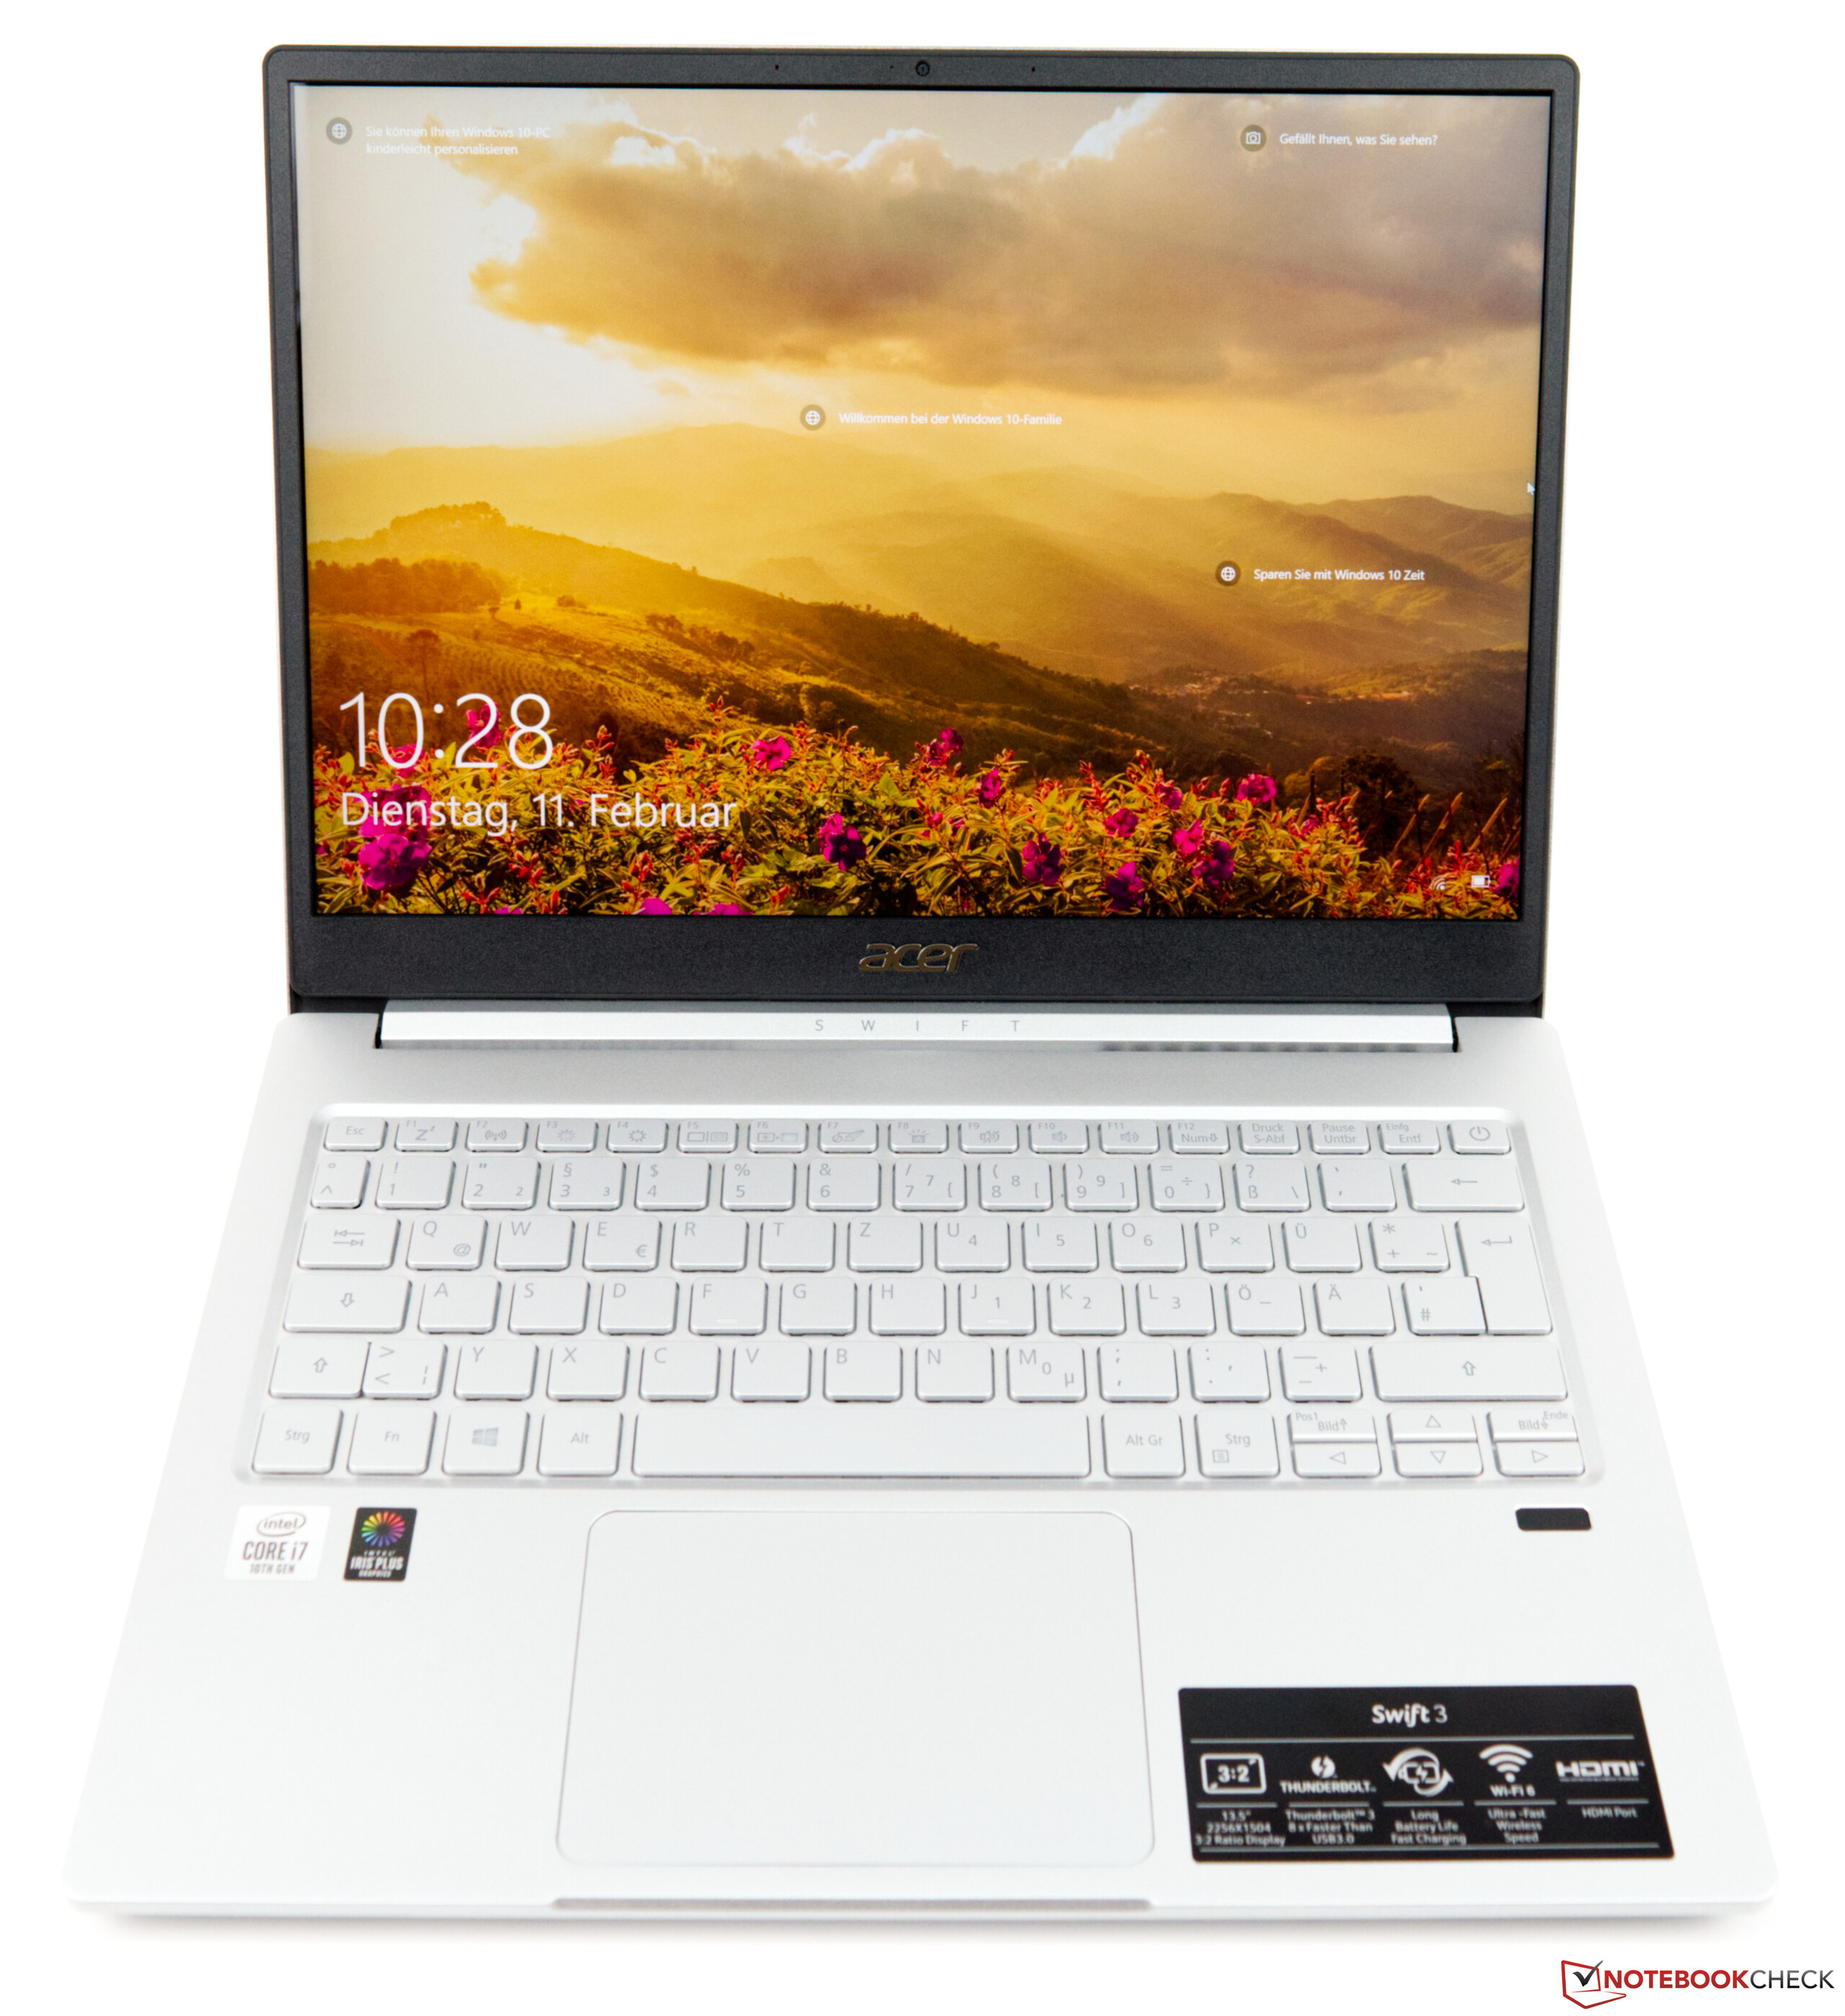
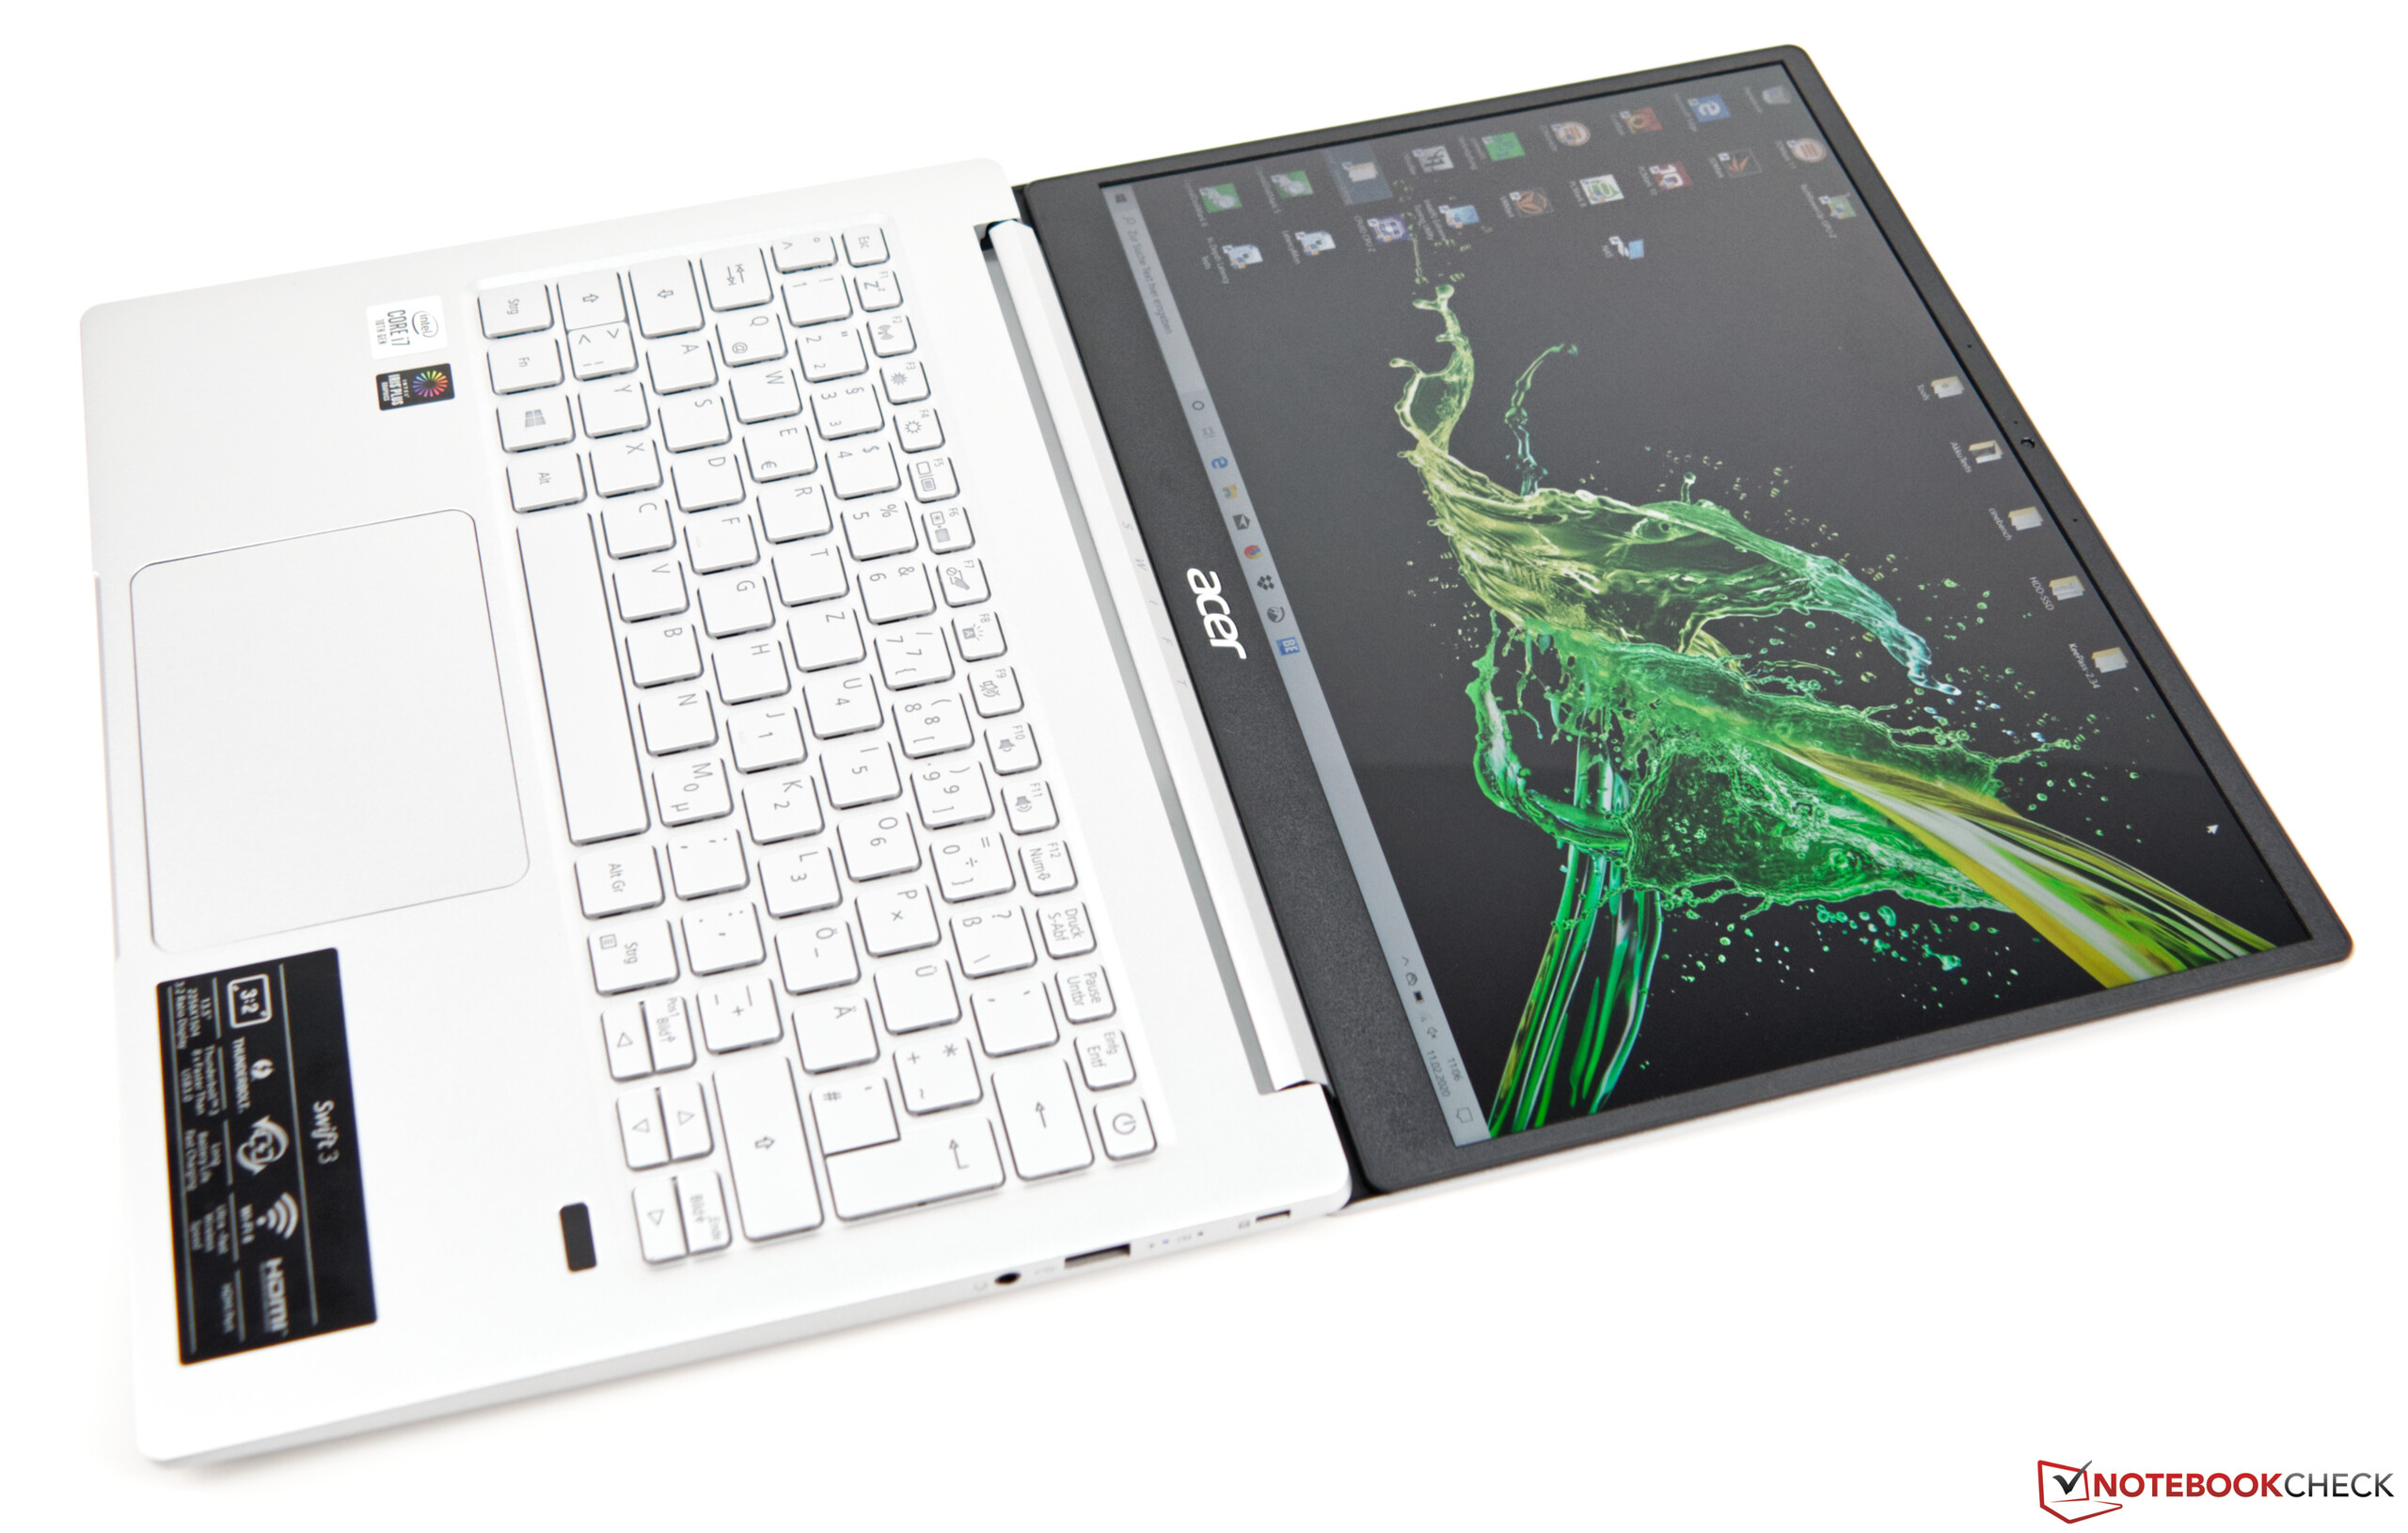
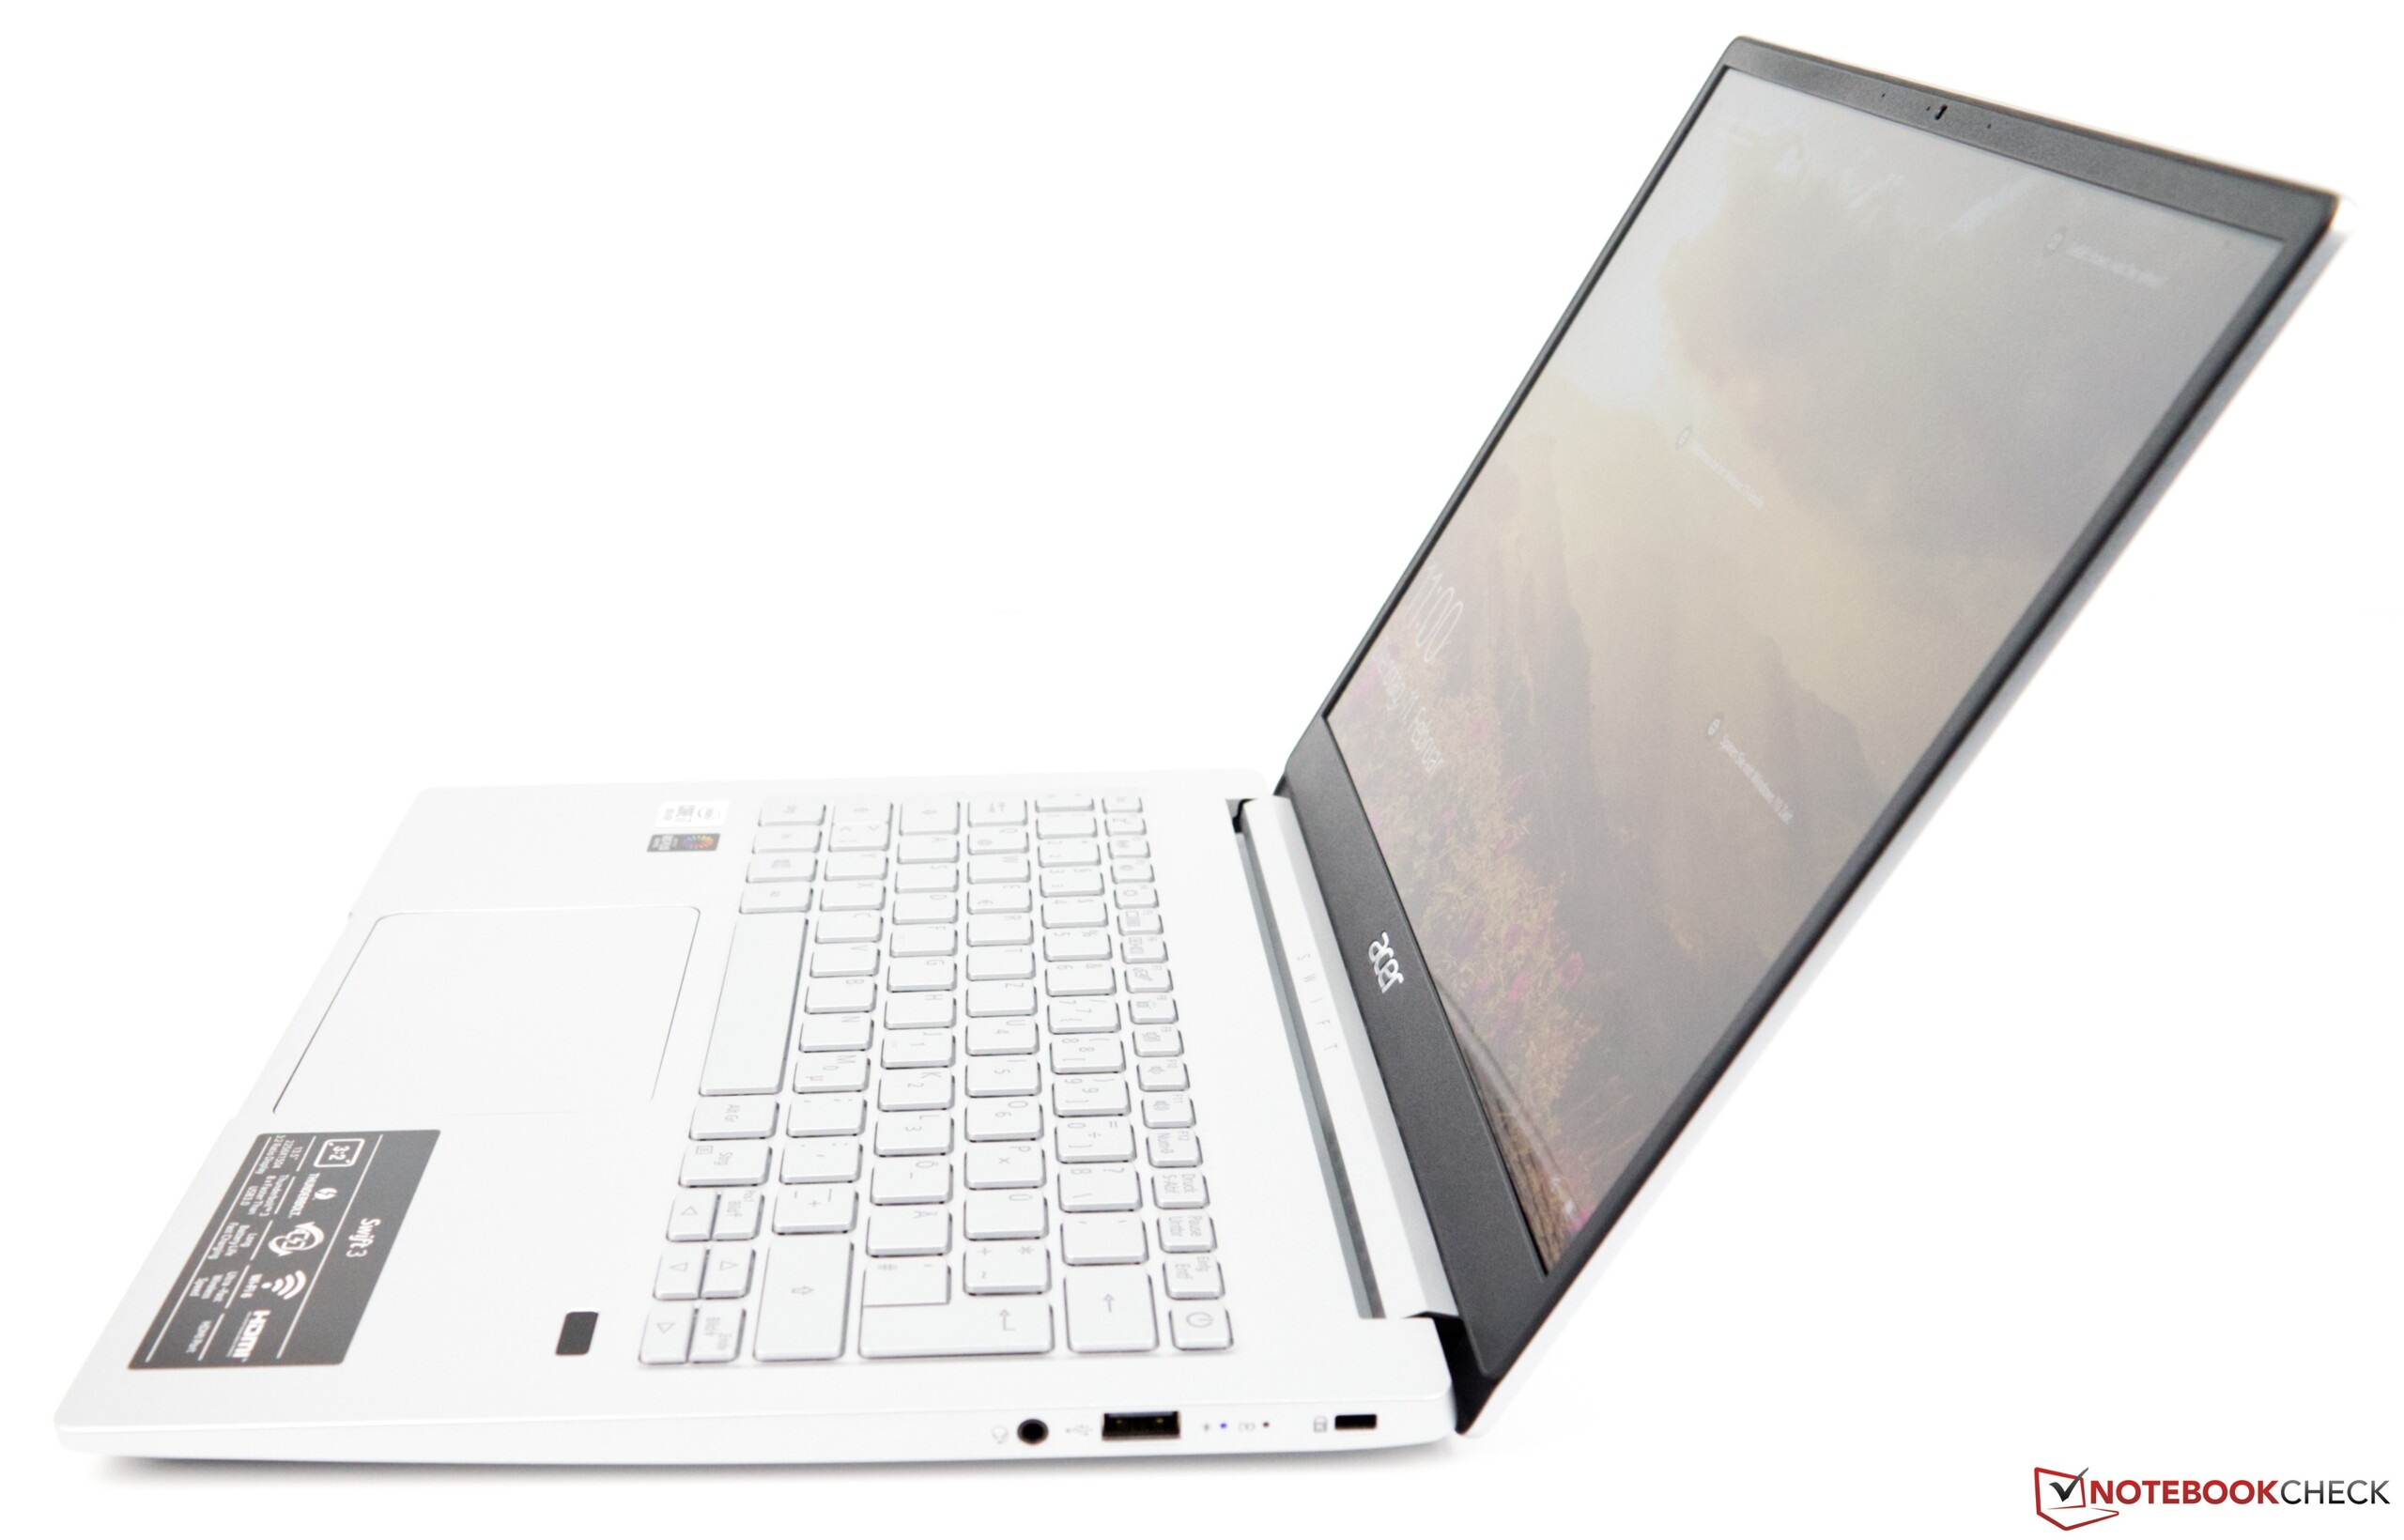
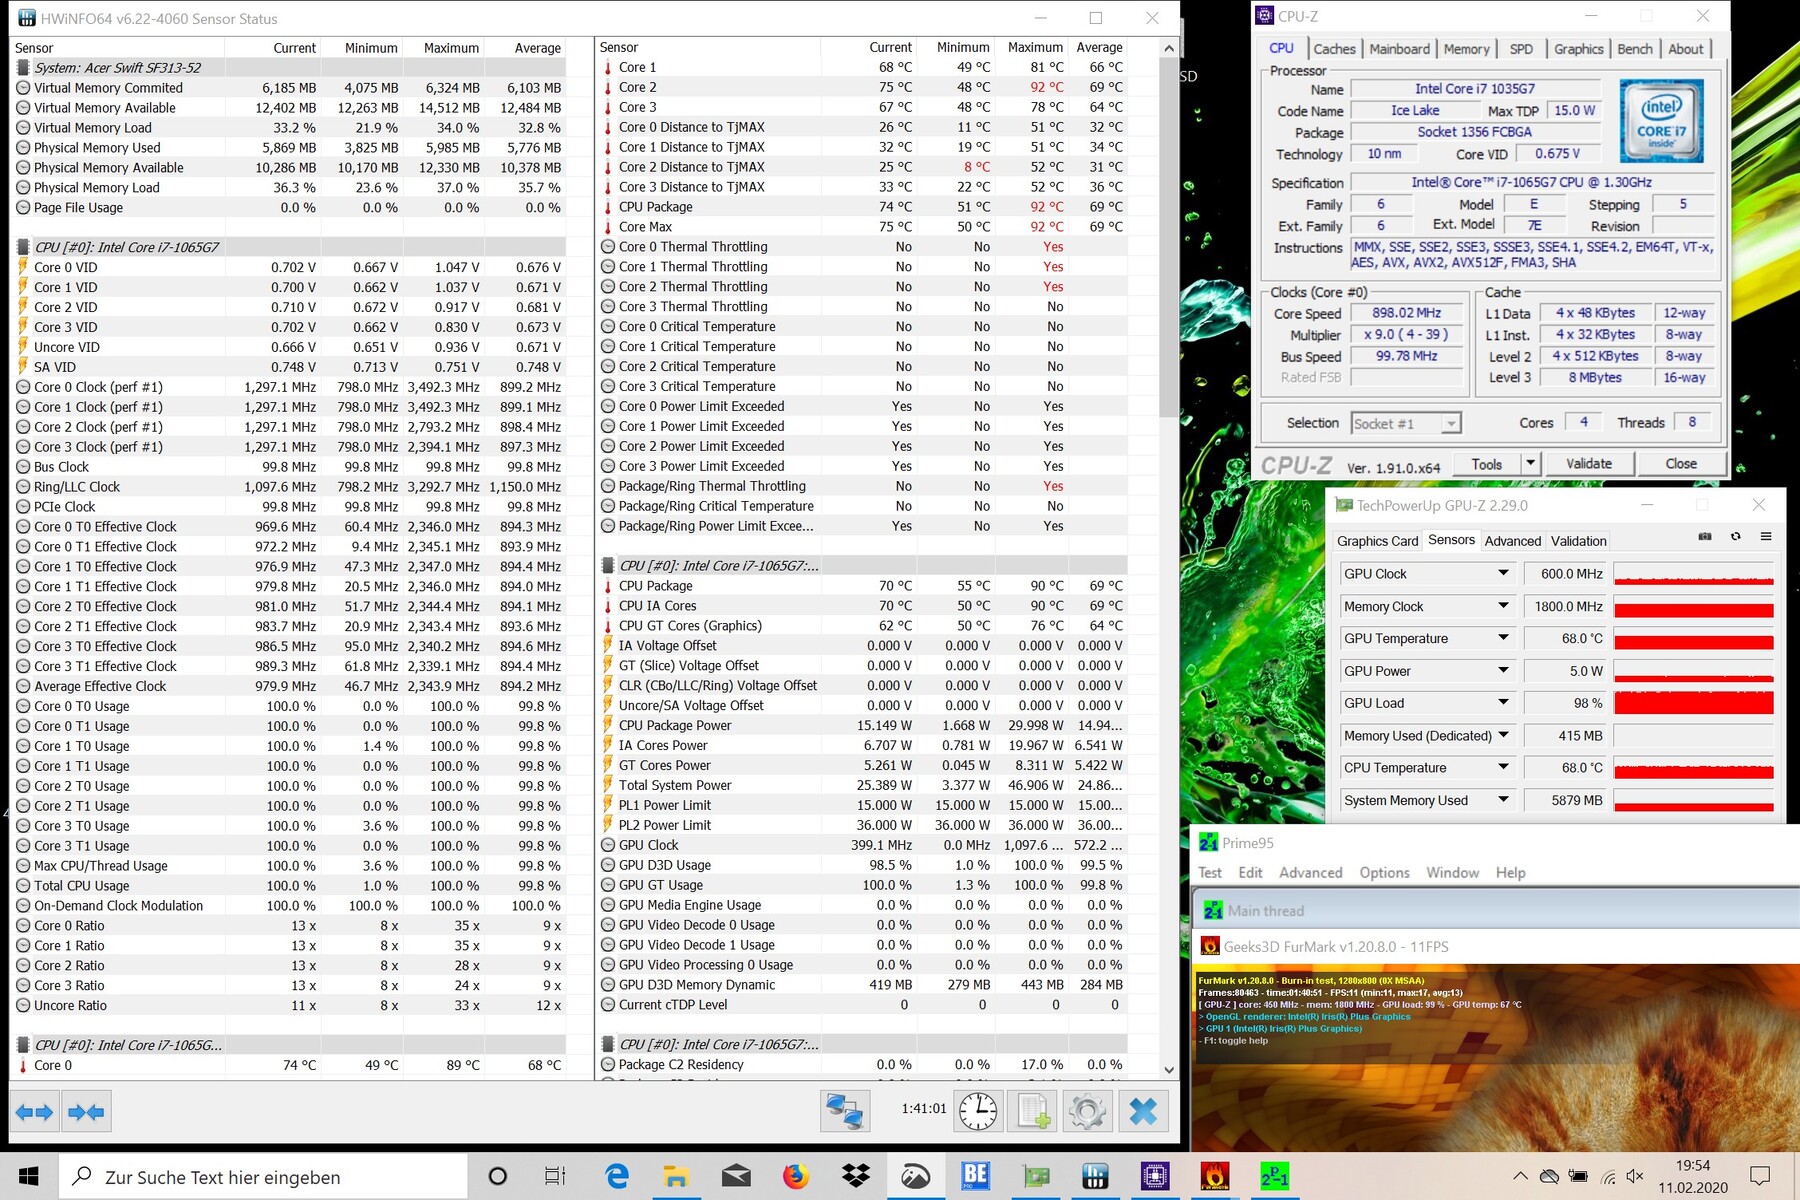
宏碁的全新Swift 3 SF313是经过全面改进的设备。它不仅经过了重新设计以使其看起来更好,而且还进行了重大的内部大改。英特尔最新的Ice Lake SoC在性能上做了微小的改进,说实在的,我们期望性能提升可以更大。英特尔酷睿i7-1065G7的性能优于其Kaby Lake的前代产品。但是,与其他类似配置的设备相比,Swift 3却落后了。它以出色的设计和坚固的制造质量而夺人眼球。明亮的IPS显示屏肯定会留下难忘的体验,其3:2的纵横比非常适合Swift的整体理念。
Acer Swift 3 SF313提供了不错的性能,较长的续航时间和出色的显示效果,而又不会花费太多。
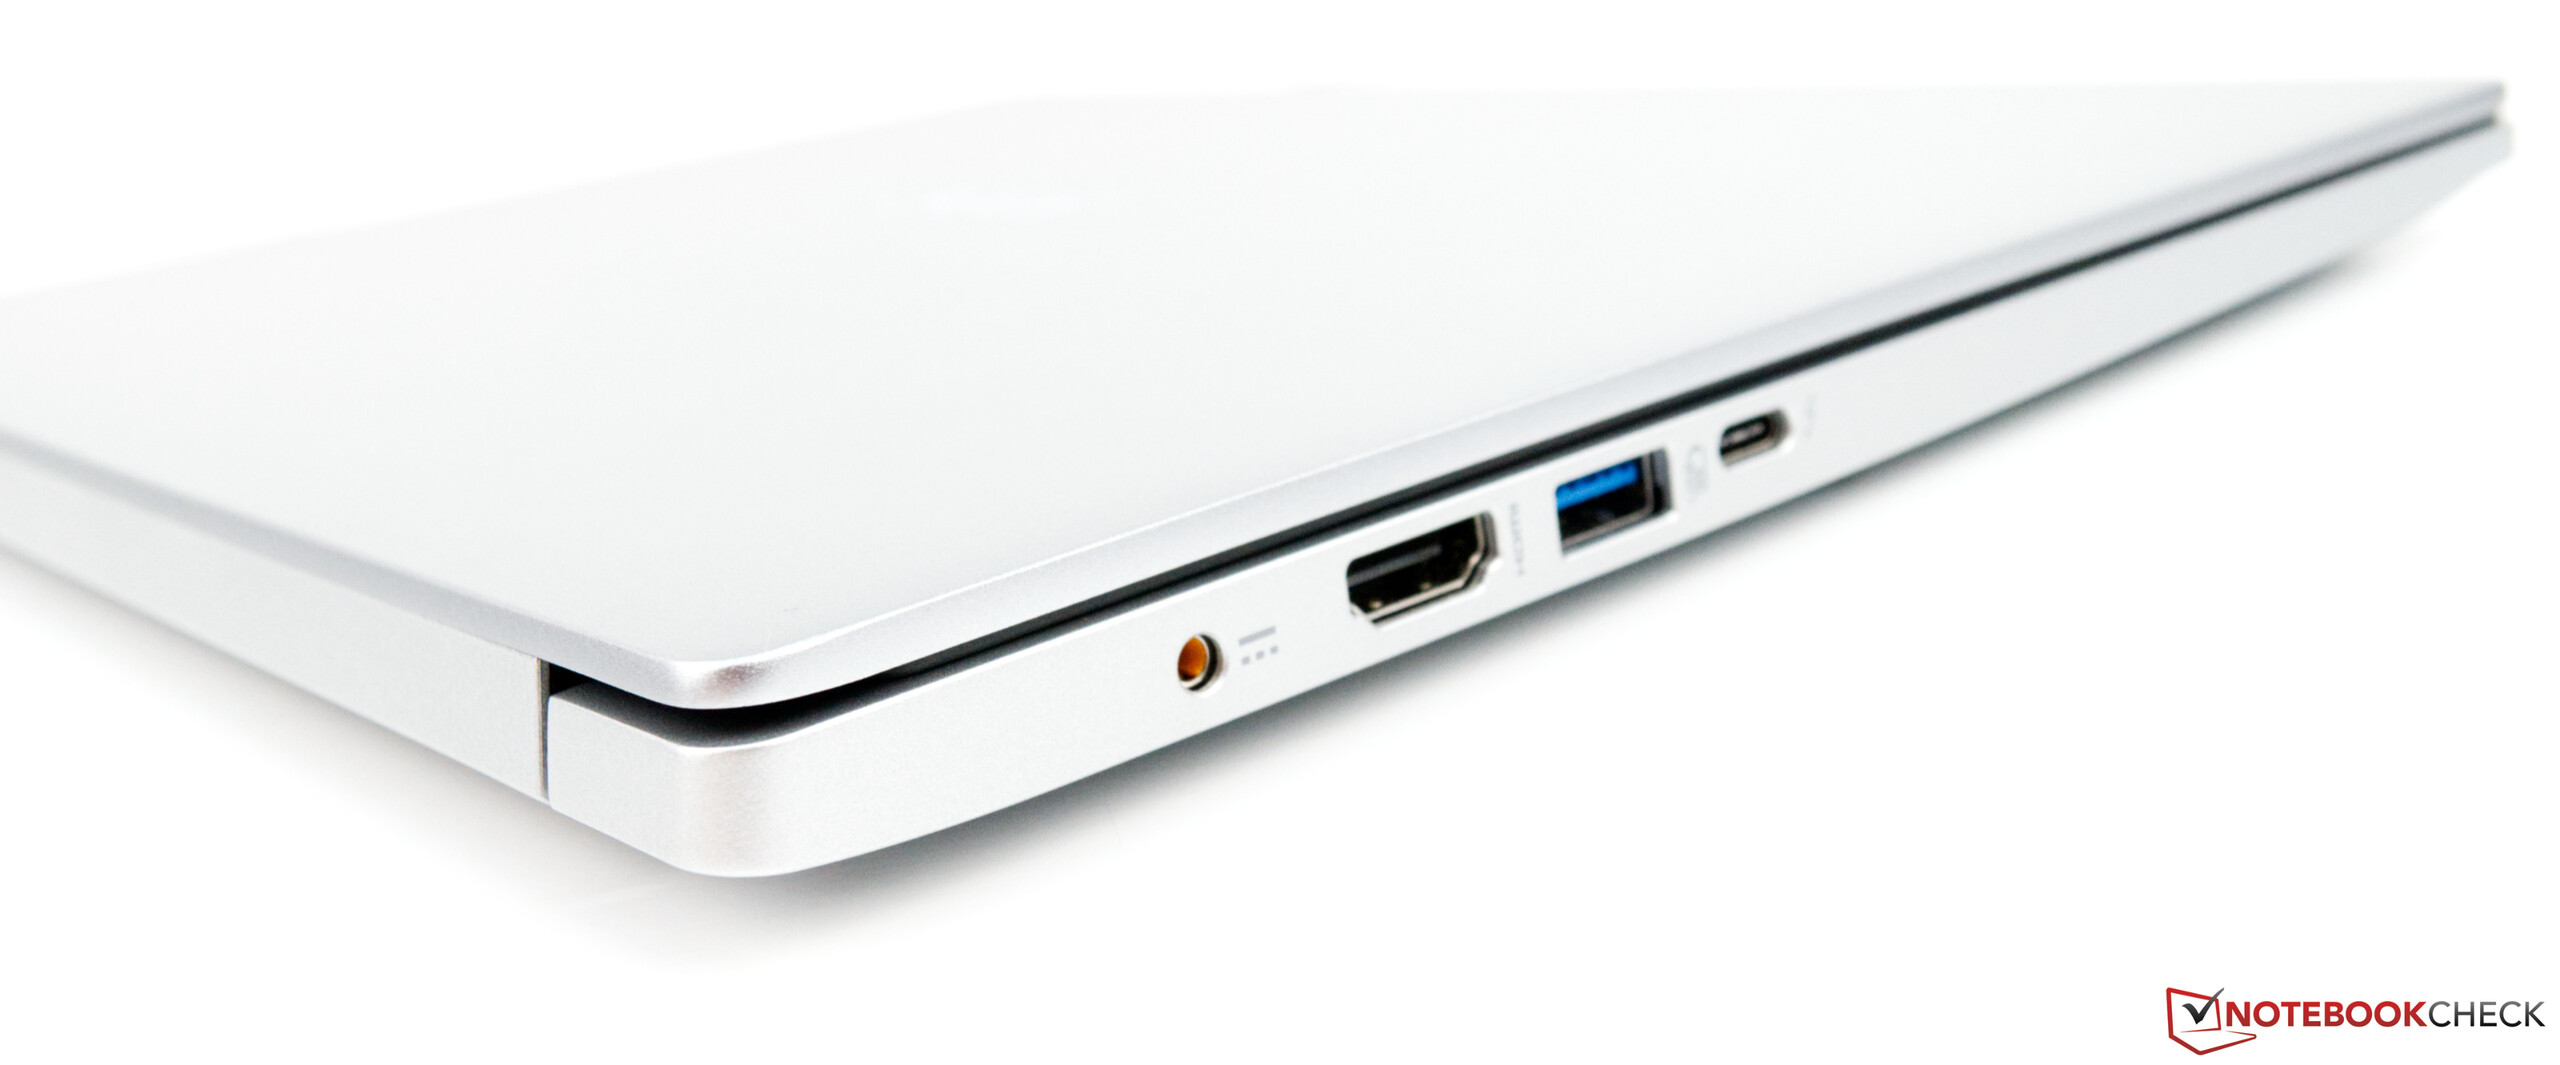
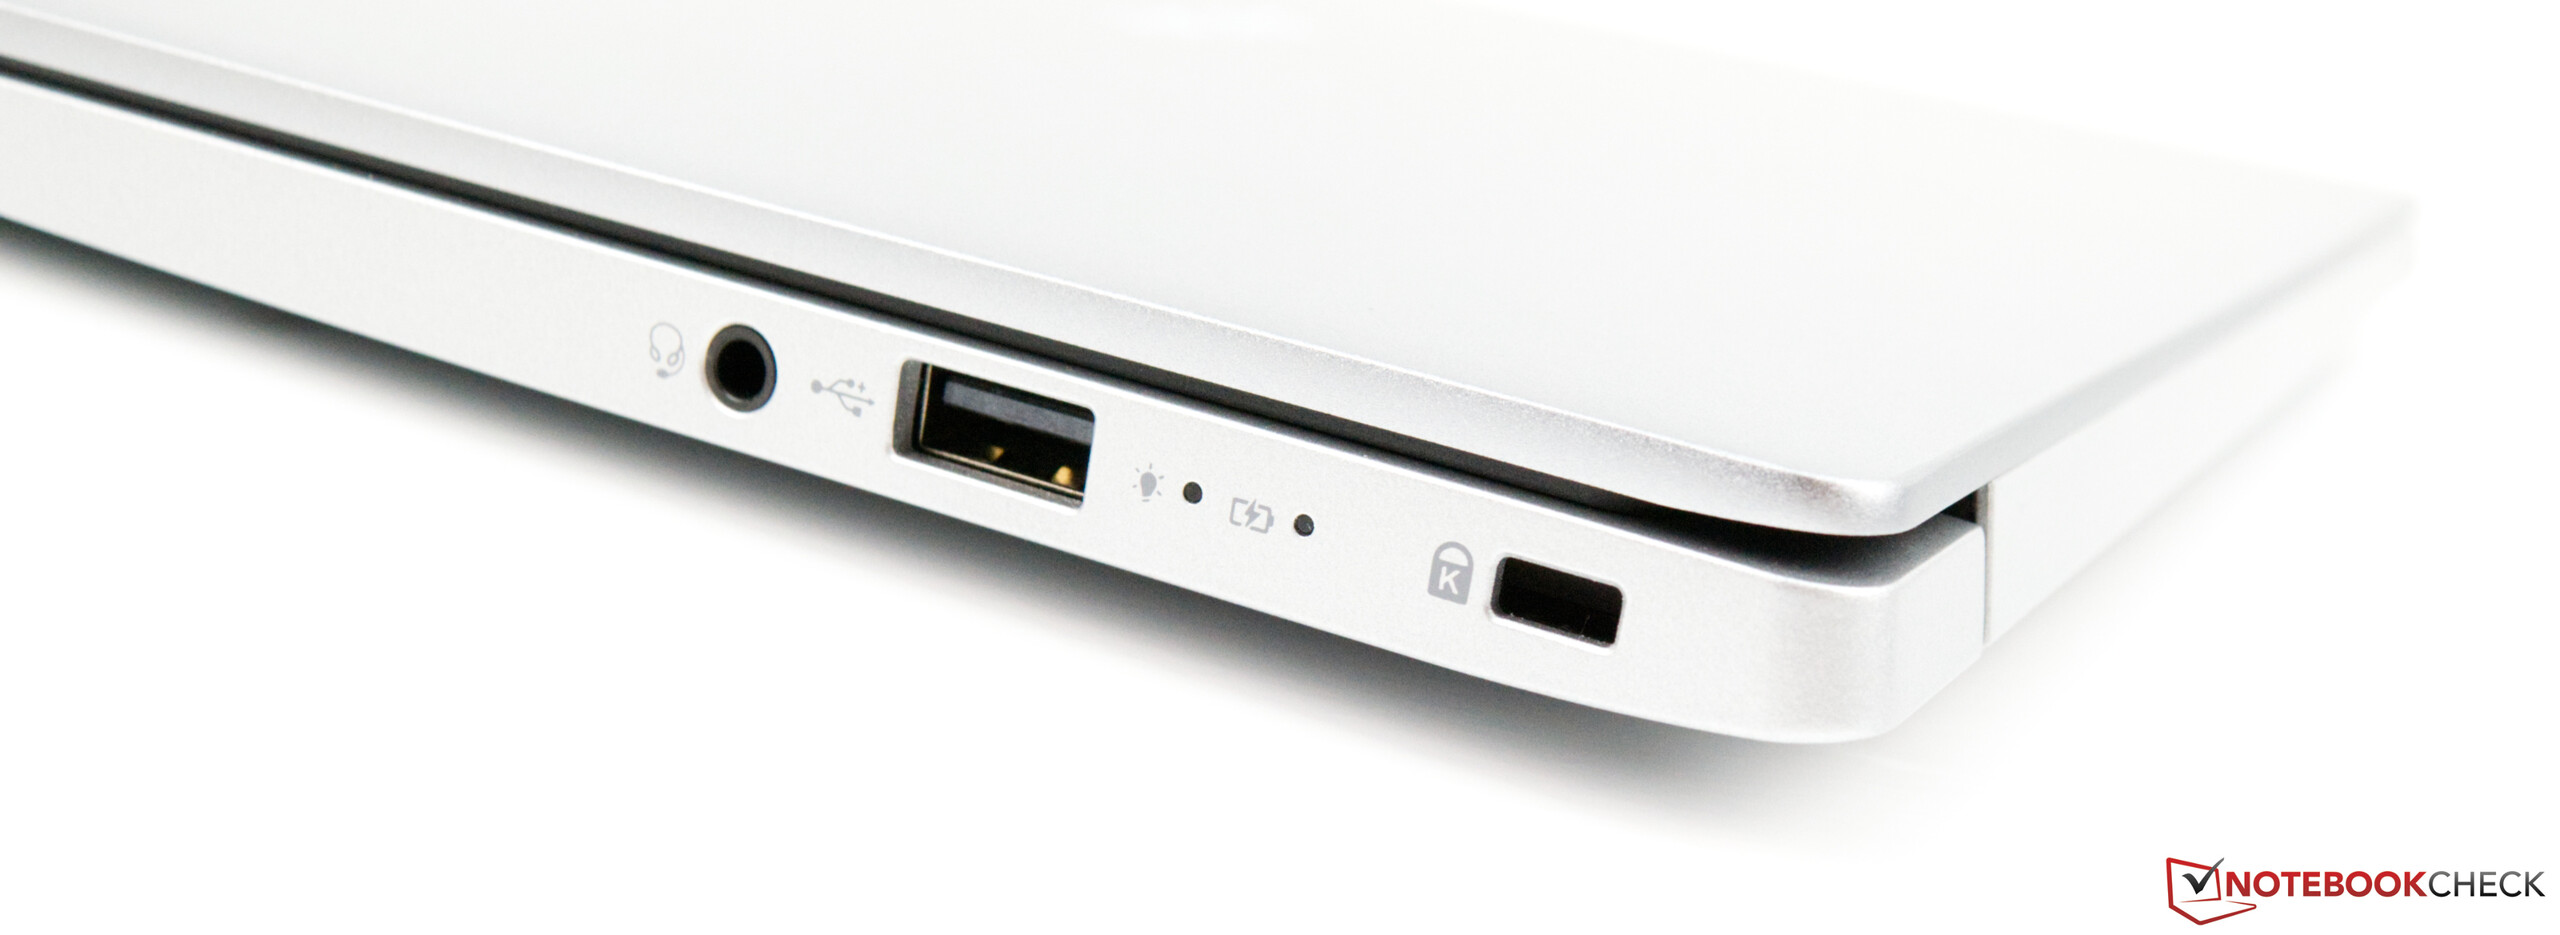
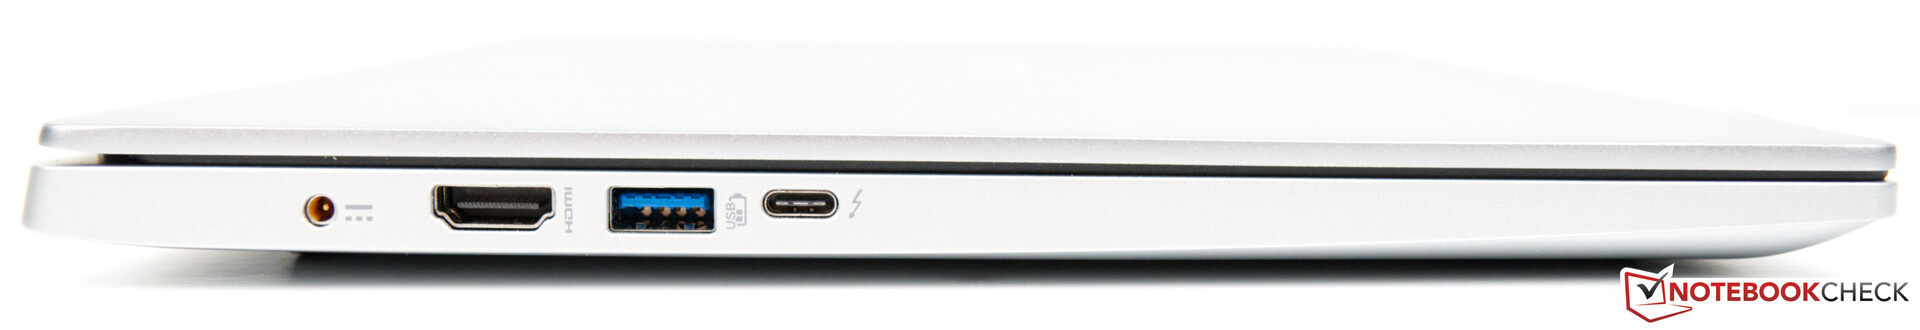
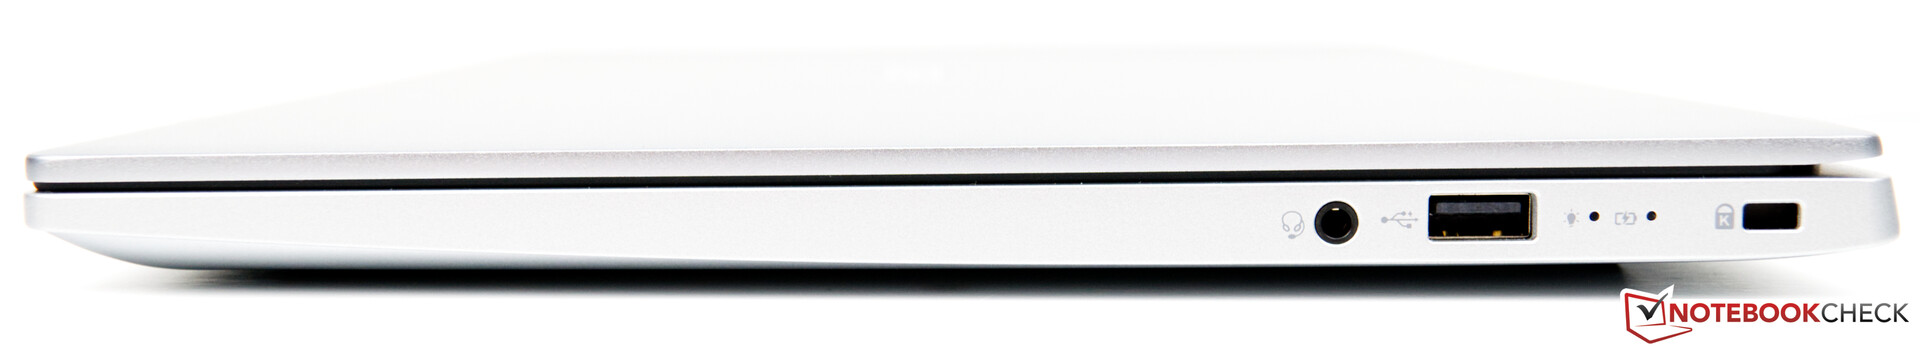
它的缺点包括Wi-Fi性能不佳和键盘由于其白色背光,很难在白天阅读。也就是说,在明亮的环境中禁用背光确实可以改善键盘的清晰度。接口很现代,但是添加第二个USB-C端口有利无弊。我们也不会抱怨读卡器或缺乏LTE选项。
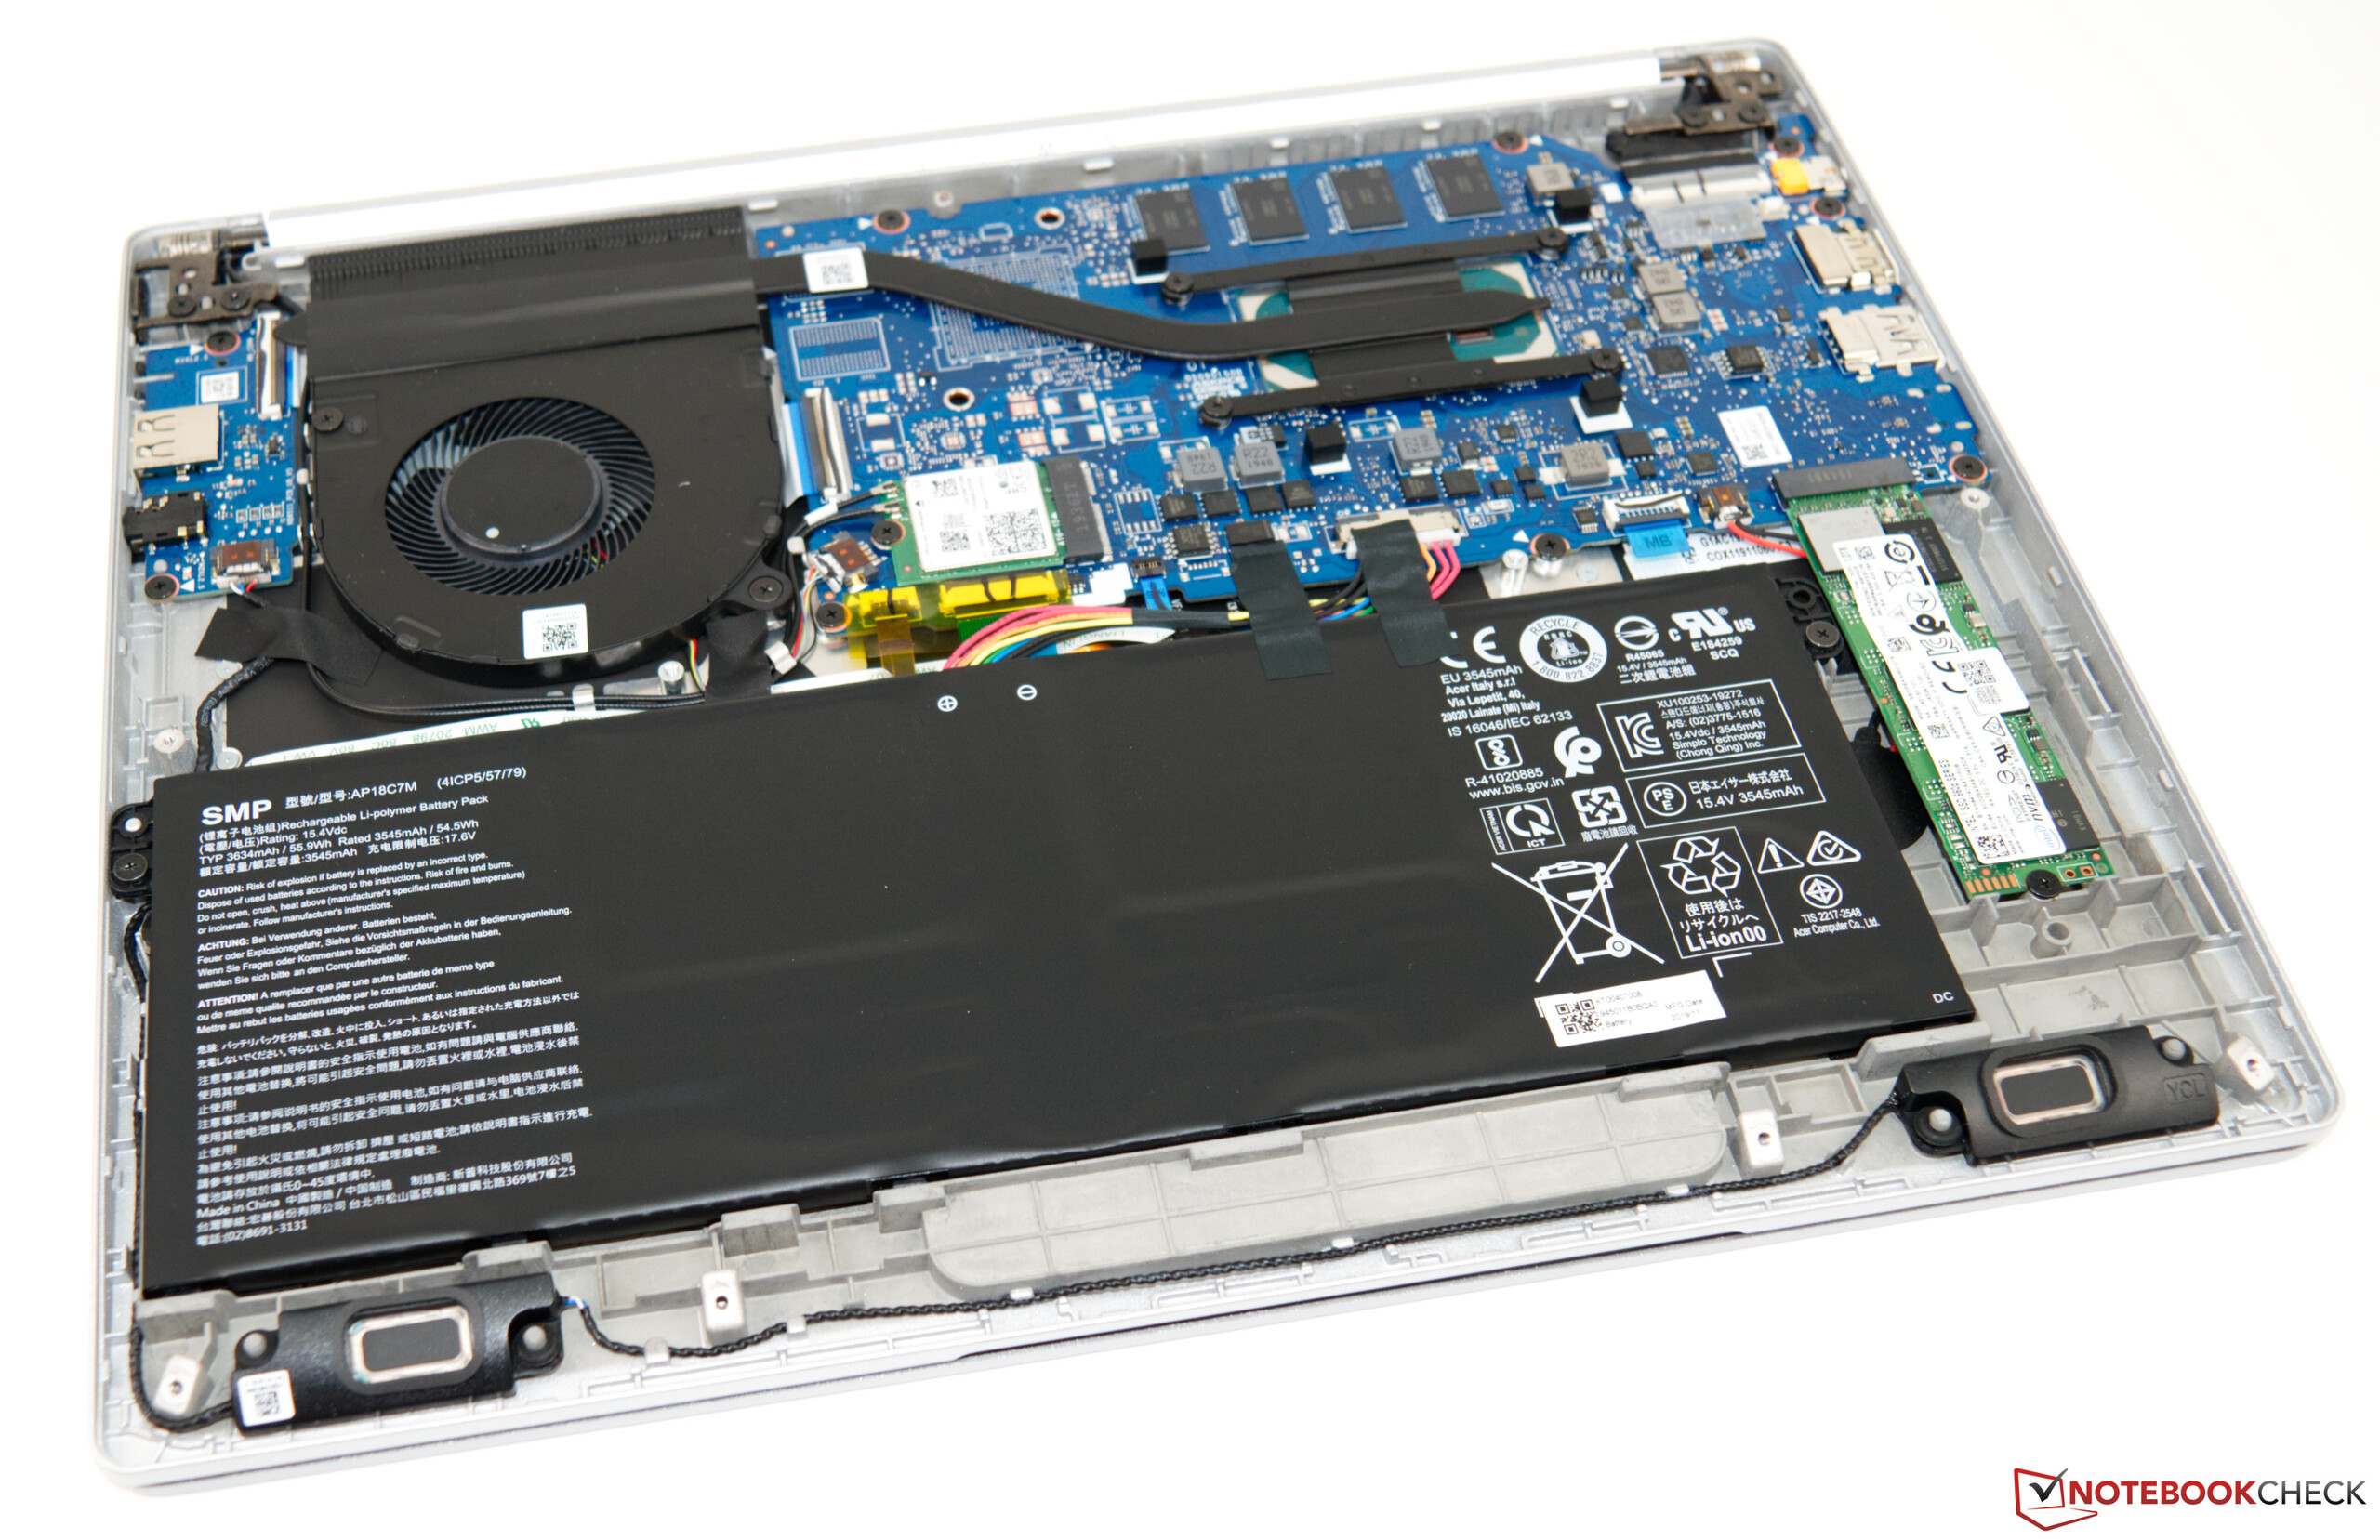
所有被认为是Swift 3的优点都是对它的前身的改进,形成了全能的超极本,作为多媒体设备也做得很好。添加辅助存储设备并使RAM可升级,会使该设备变得比以前更好。
Acer Swift 3 SF313-52-71Y7
- 02/17/2020 v7 (old)
Sebastian Bade
Price comparison

