惠普 EliteBook 850 G3 笔记本电脑简短评测

| |||||||||||||||||||||||||
Brightness Distribution: 85 %
Center on Battery: 294 cd/m²
Contrast: 537:1 (Black: 0.54 cd/m²)
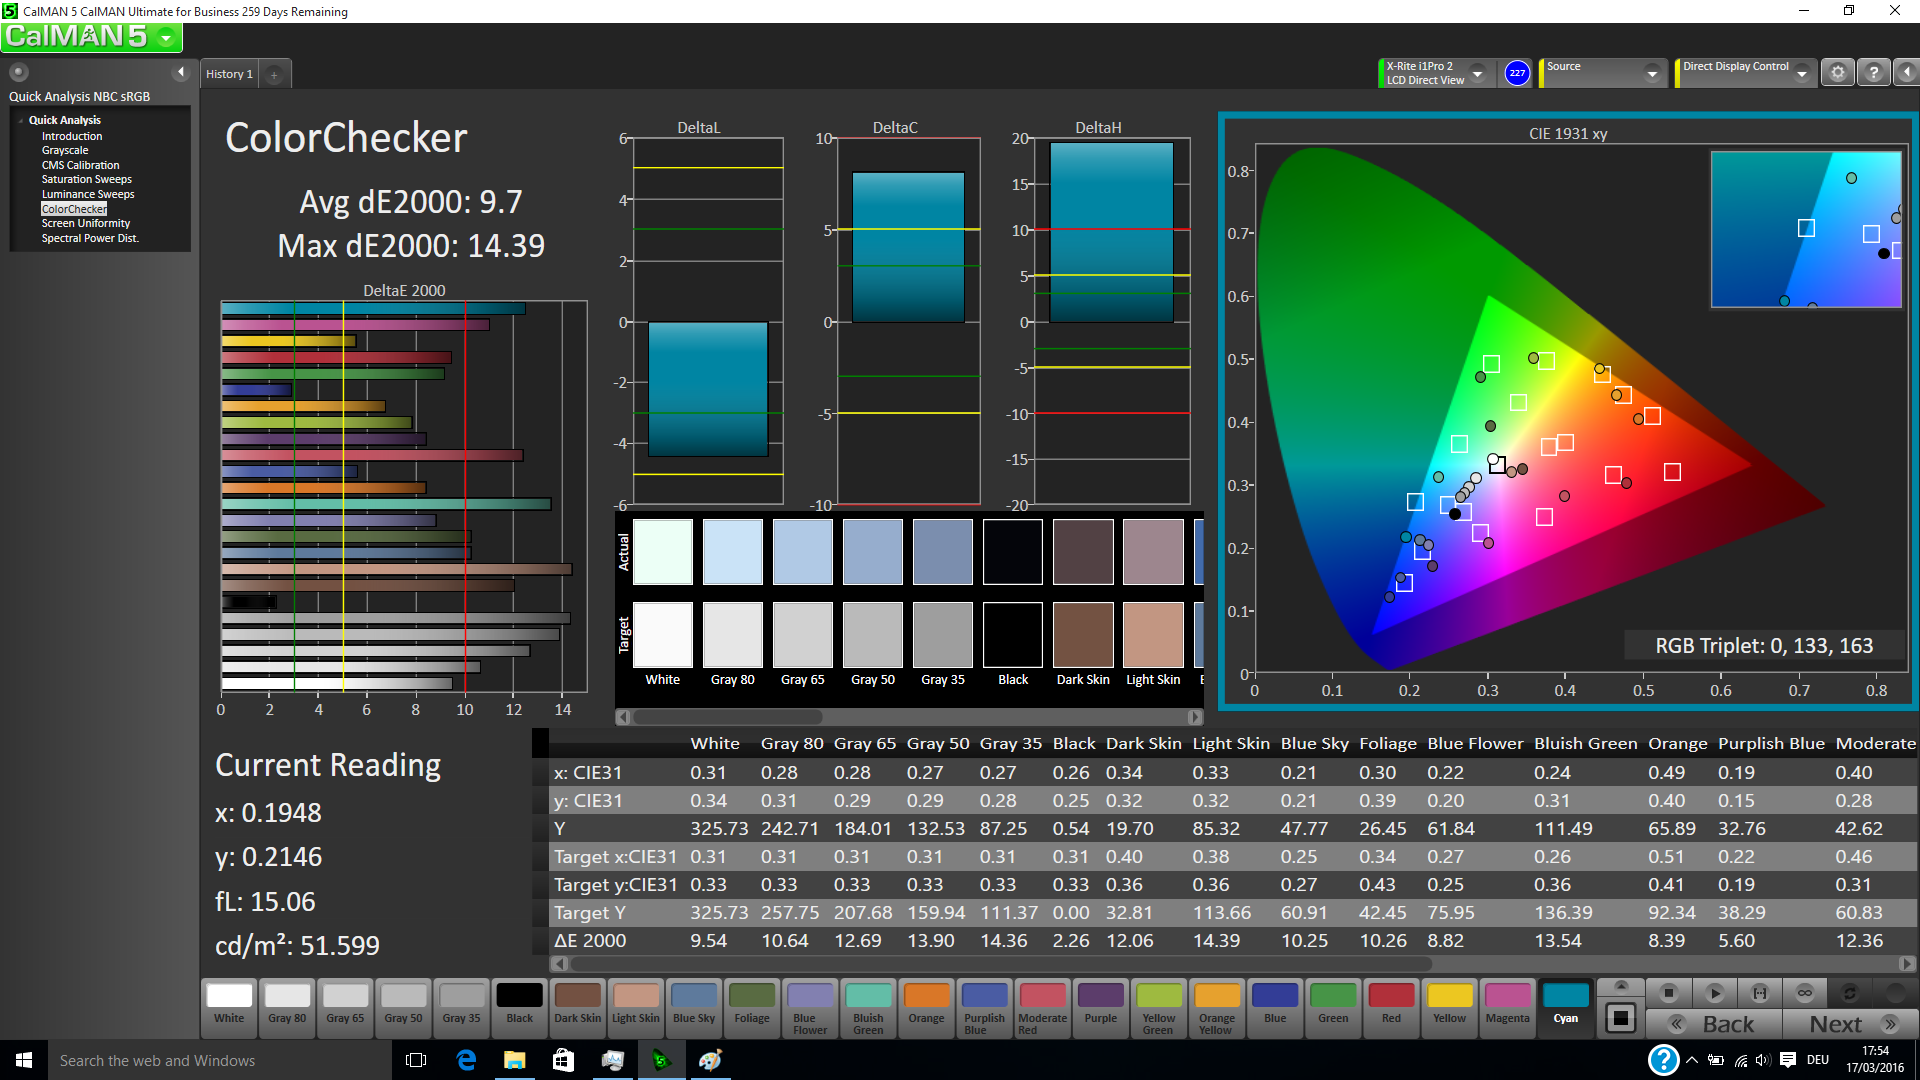
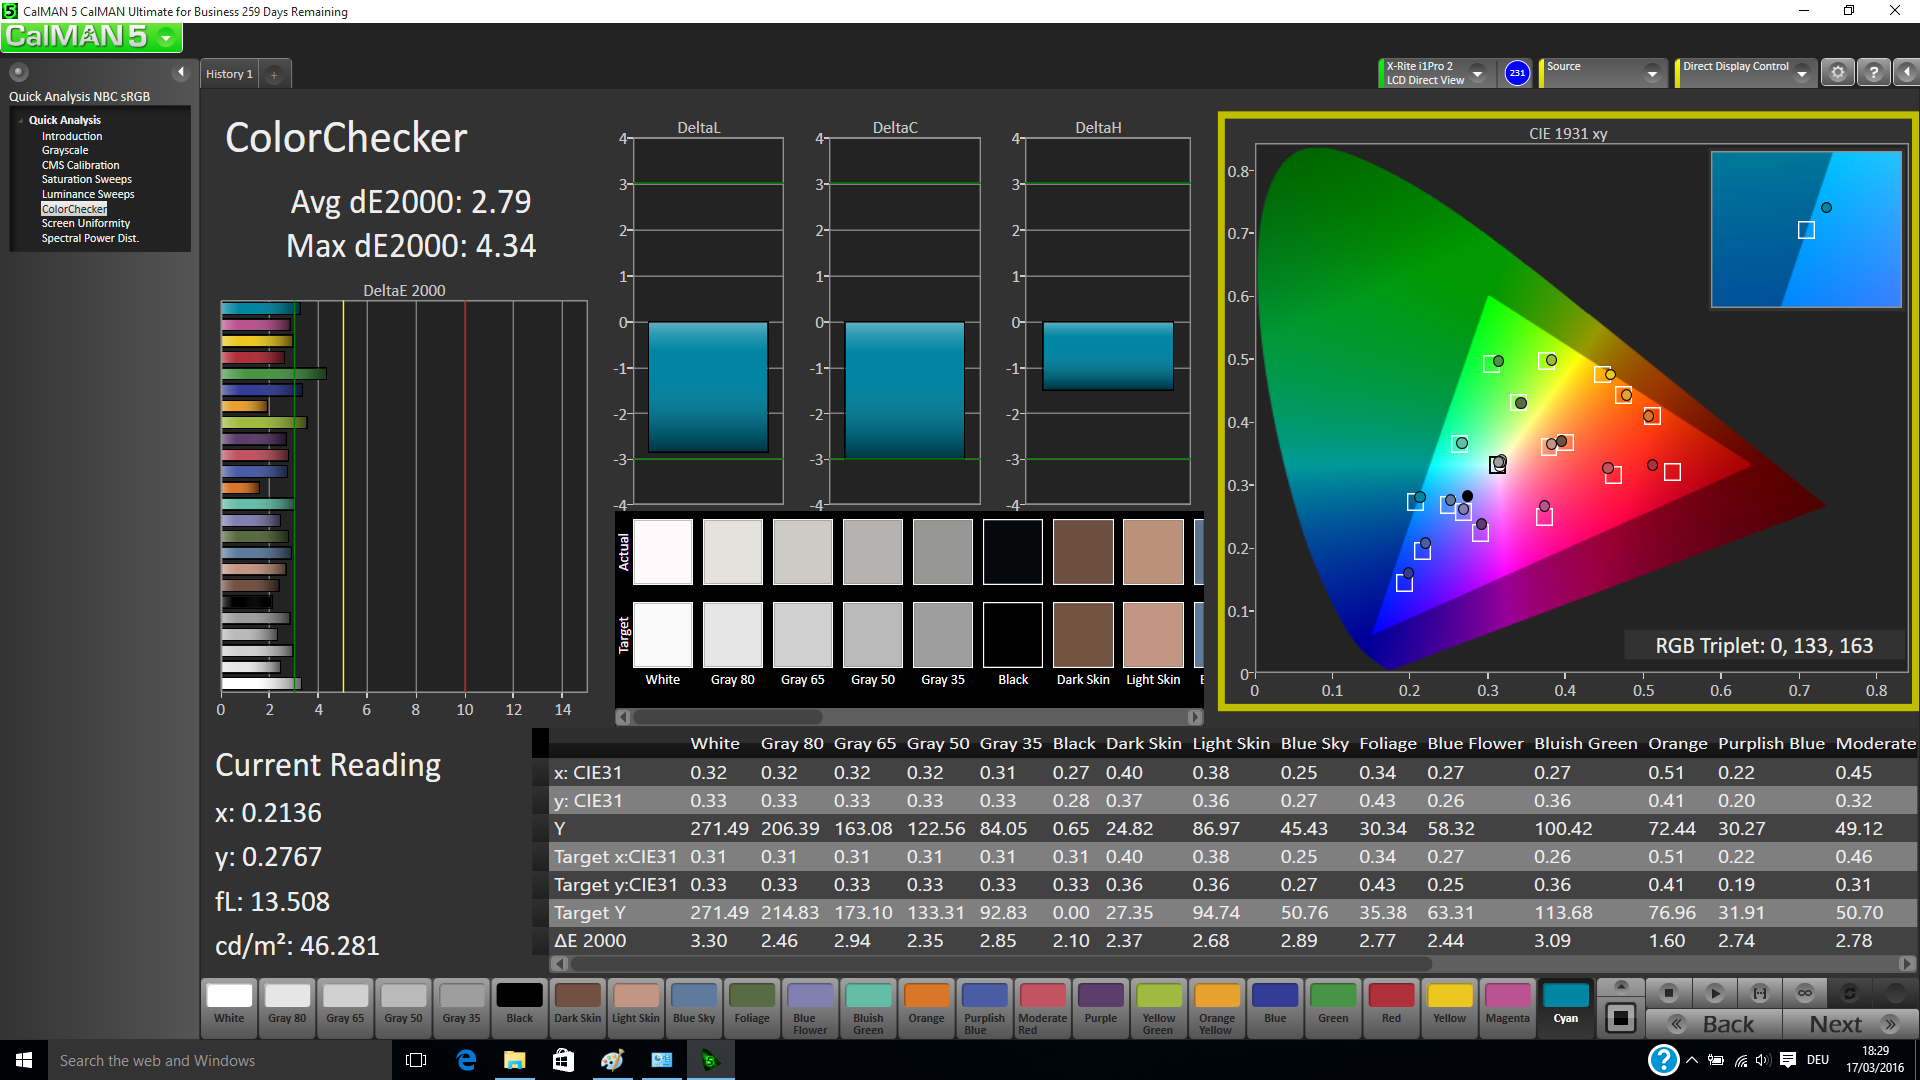
ΔE ColorChecker Calman: 9.7 | ∀{0.5-29.43 Ø4.71}
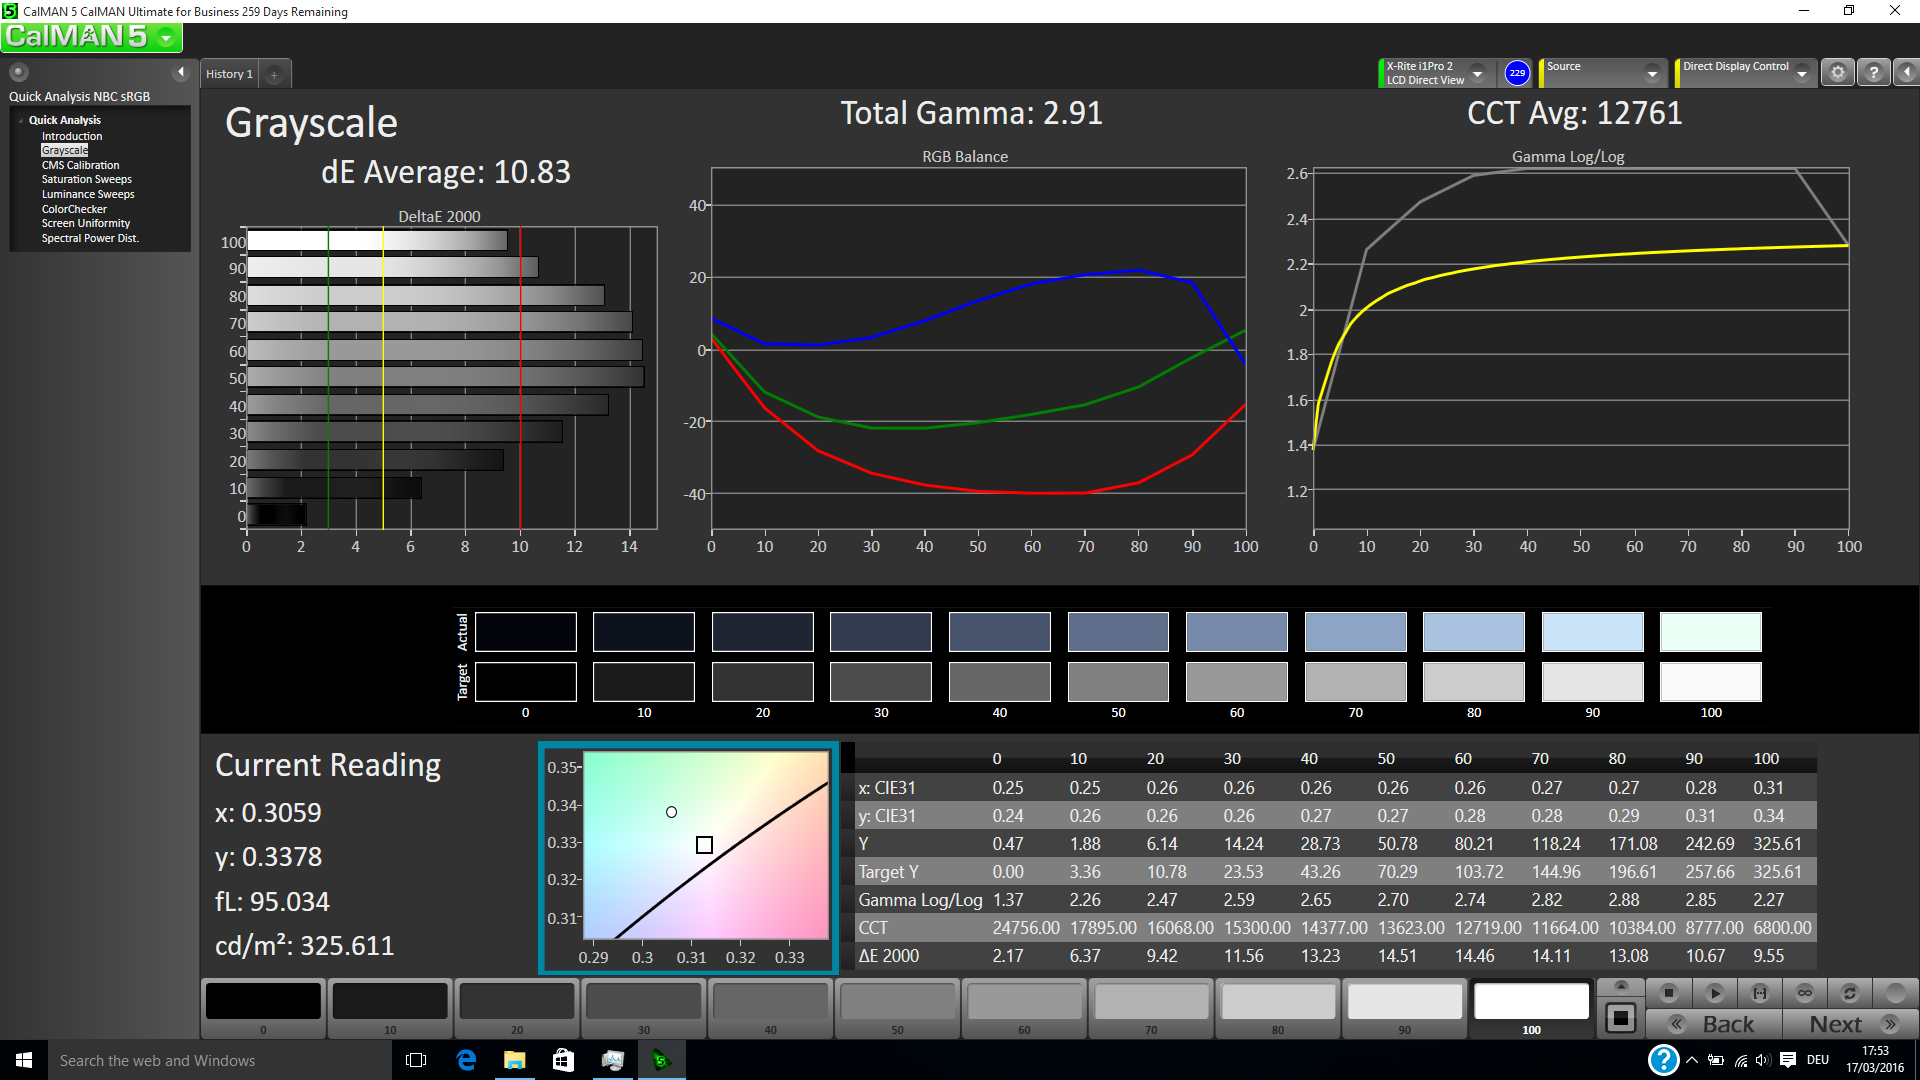
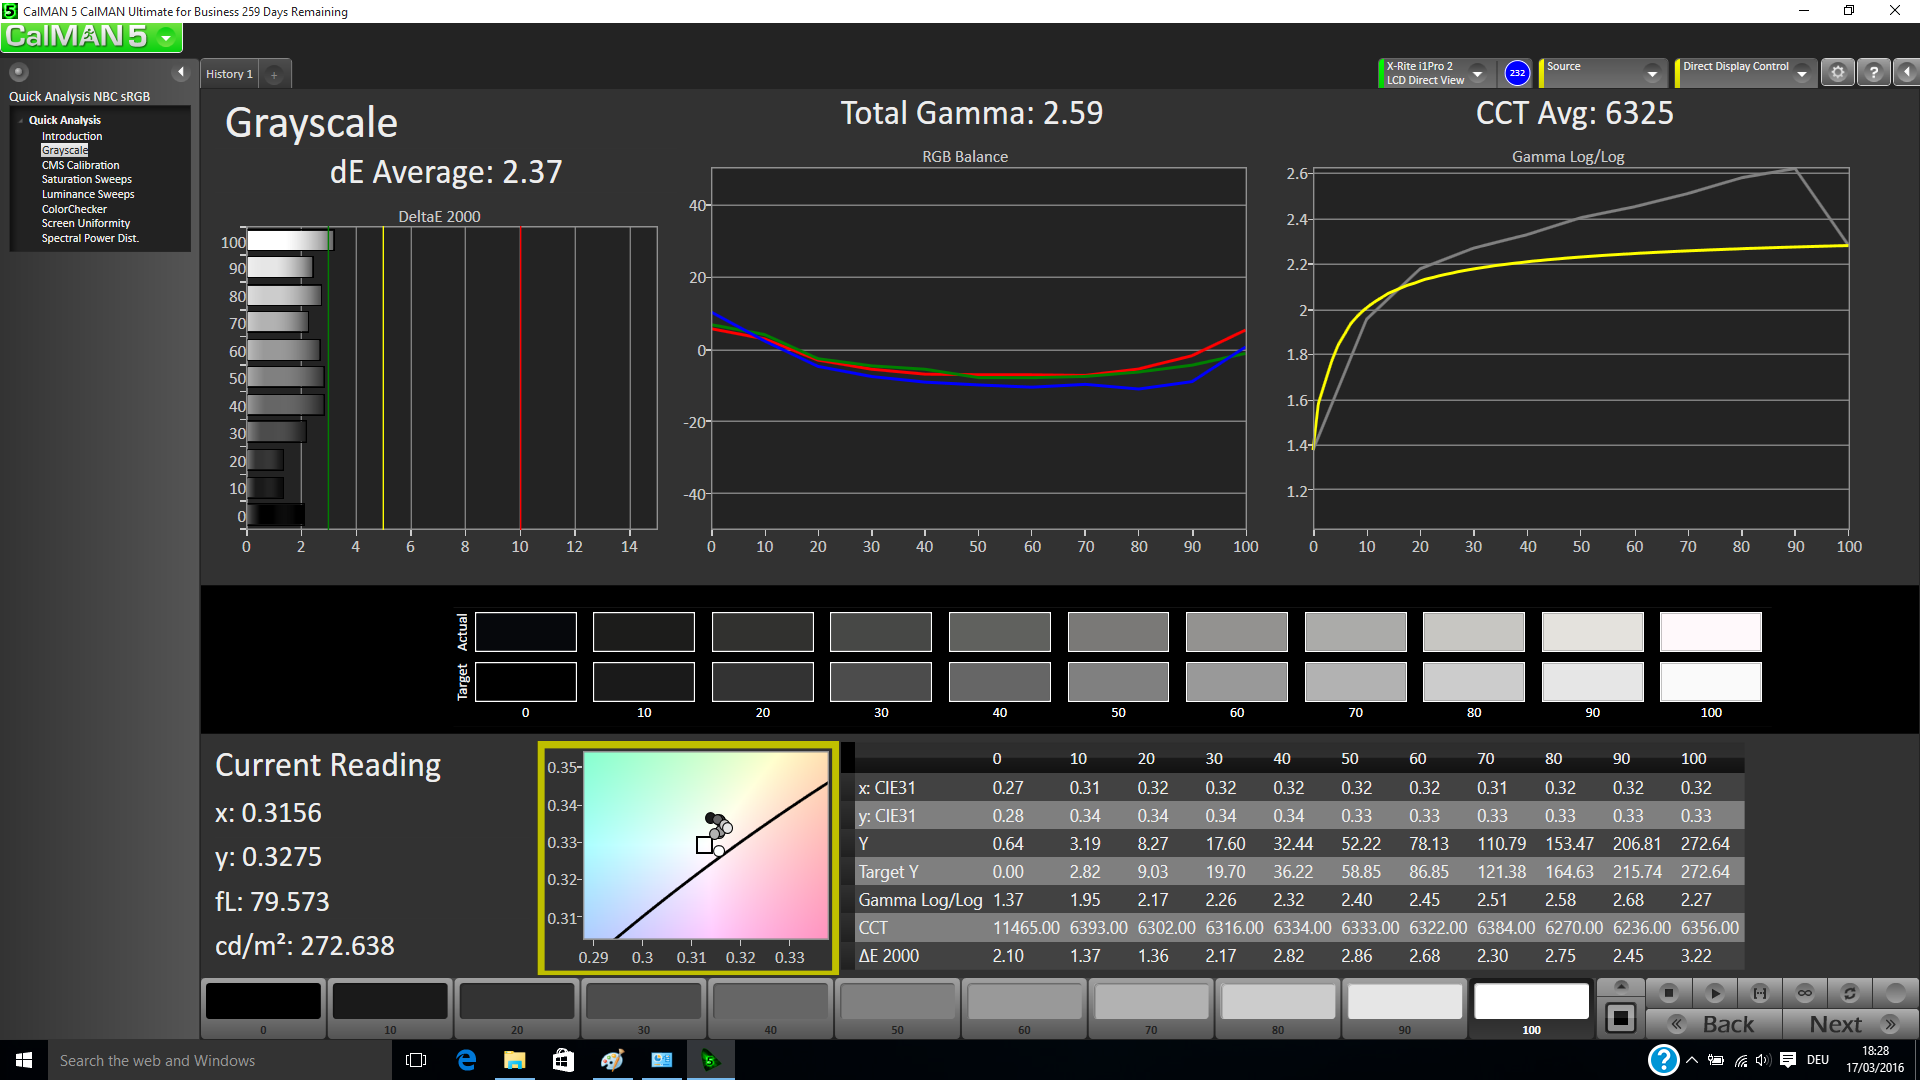
ΔE Greyscale Calman: 10.83 | ∀{0.09-98 Ø4.96}
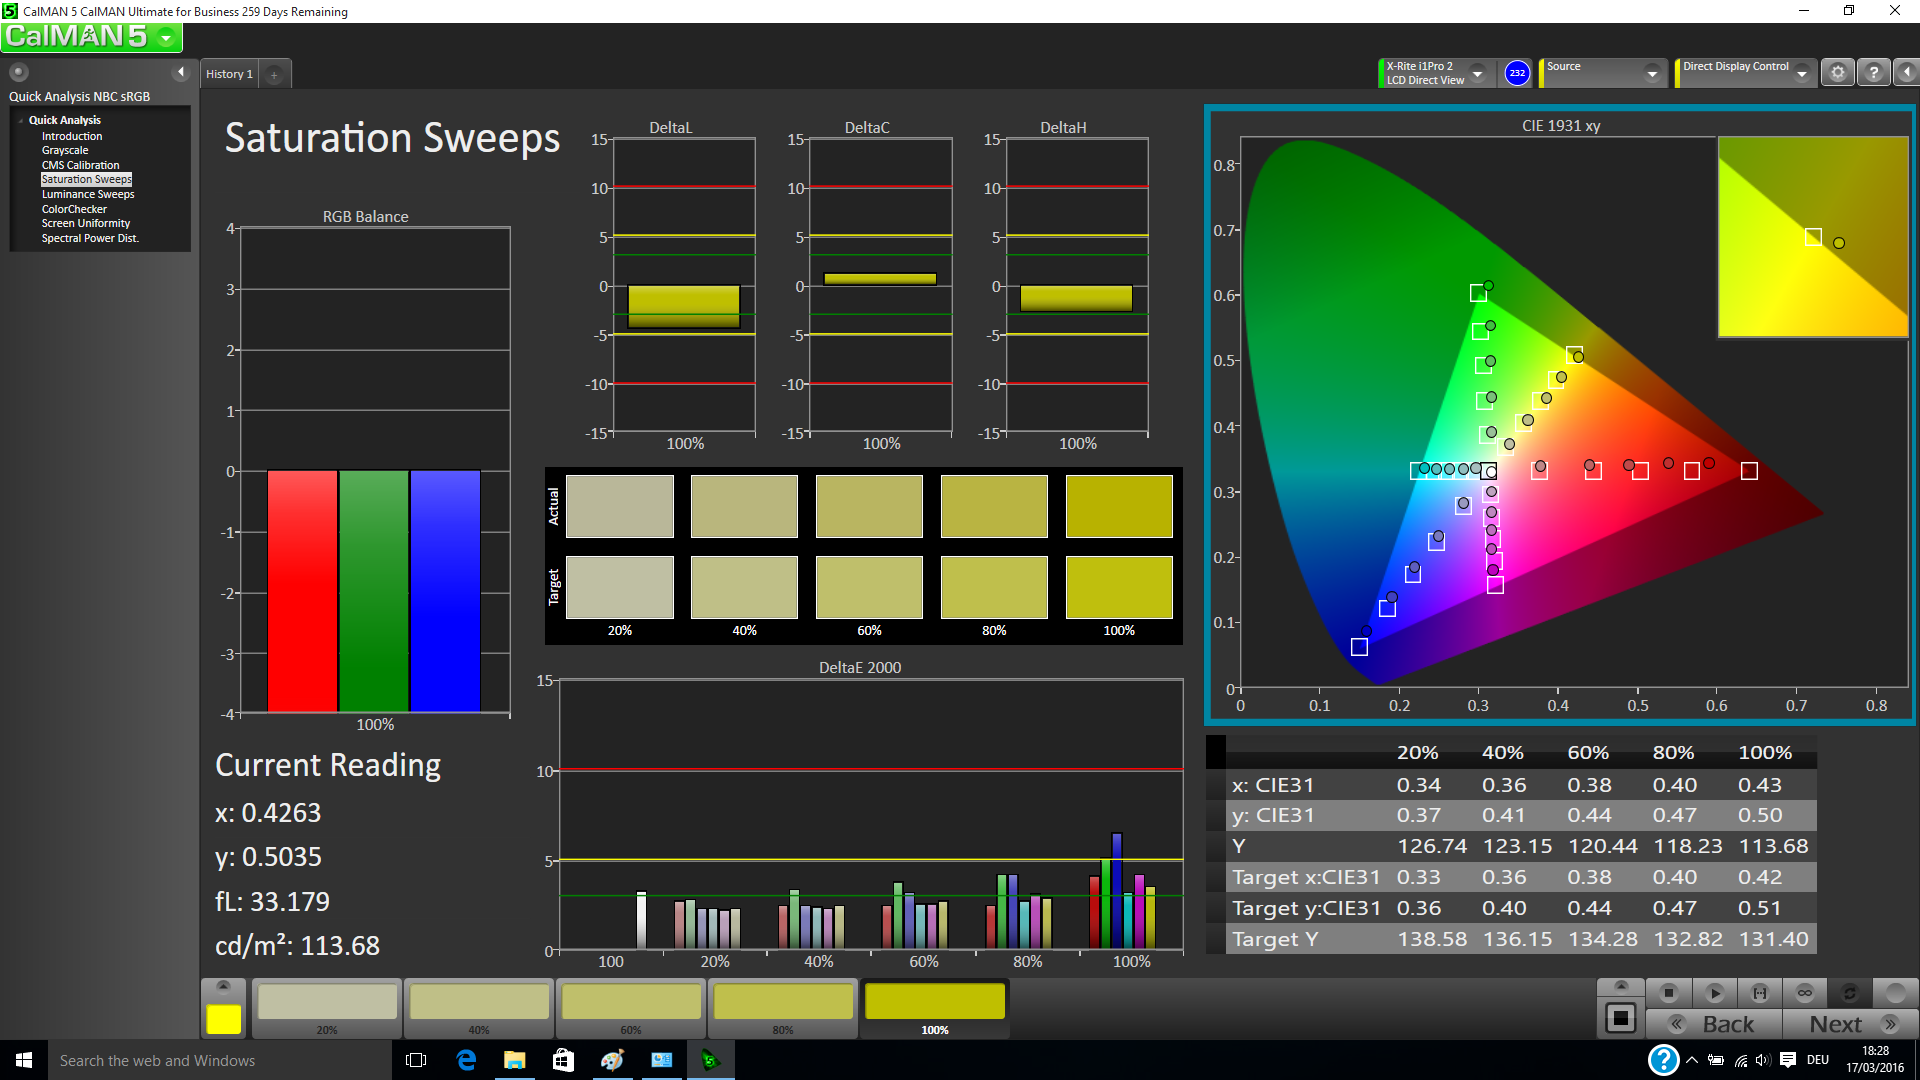
78.96% sRGB (Argyll 1.6.3 3D)
51.15% AdobeRGB 1998 (Argyll 1.6.3 3D)
56% AdobeRGB 1998 (Argyll 3D)
79.3% sRGB (Argyll 3D)
54.2% Display P3 (Argyll 3D)
Gamma: 2.91
CCT: 12761 K
Screen Flickering / PWM (Pulse-Width Modulation)
| Screen flickering / PWM detected | 200 Hz | ≤ 50 % brightness setting | 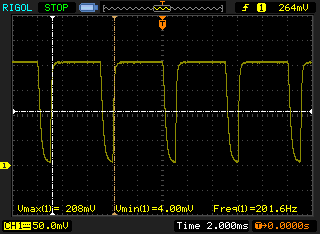 |
The display backlight flickers at 200 Hz (worst case, e.g., utilizing PWM) Flickering detected at a brightness setting of 50 % and below. There should be no flickering or PWM above this brightness setting. The frequency of 200 Hz is relatively low, so sensitive users will likely notice flickering and experience eyestrain at the stated brightness setting and below. In comparison: 52 % of all tested devices do not use PWM to dim the display. If PWM was detected, an average of 7748 (minimum: 5 - maximum: 343500) Hz was measured. | |||
Display Response Times
| ↔ Response Time Black to White | ||
|---|---|---|
| 27.2 ms ... rise ↗ and fall ↘ combined | ↗ 9.2 ms rise | 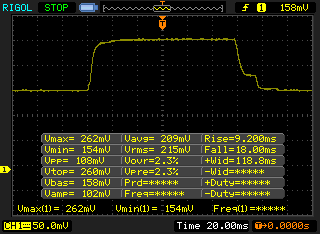 |
| ↘ 18 ms fall | ||
| The screen shows relatively slow response rates in our tests and may be too slow for gamers. In comparison, all tested devices range from 0.1 (minimum) to 240 (maximum) ms. » 69 % of all devices are better. This means that the measured response time is worse than the average of all tested devices (19.8 ms). | ||
| ↔ Response Time 50% Grey to 80% Grey | ||
| 46.4 ms ... rise ↗ and fall ↘ combined | ↗ 22.4 ms rise | 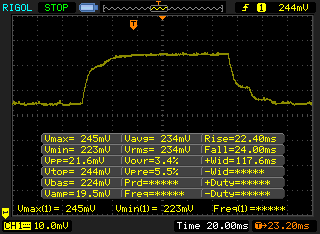 |
| ↘ 24 ms fall | ||
| The screen shows slow response rates in our tests and will be unsatisfactory for gamers. In comparison, all tested devices range from 0.165 (minimum) to 636 (maximum) ms. » 80 % of all devices are better. This means that the measured response time is worse than the average of all tested devices (30.9 ms). | ||
| HP EliteBook 850 G3 TN LED, 1920x1080 | HP EliteBook 850 G2 J8R68EA TN-Panel, 1920x1080 | Lenovo ThinkPad T560-20FH001FGE IPS-Panel, 1920x1080 | Toshiba Tecra Z50-C-10P IPS-Panel, 1920x1080 | Dell Latitude E5550 Broadwell IPS, 1920x1080 | |
|---|---|---|---|---|---|
| Display | 3% | -24% | 13% | 21% | |
| Display P3 Coverage (%) | 54.2 | 56.5 4% | 40.96 -24% | 65.4 21% | 65.6 21% |
| sRGB Coverage (%) | 79.3 | 80.7 2% | 61.3 -23% | 84.6 7% | 95.3 20% |
| AdobeRGB 1998 Coverage (%) | 56 | 58.4 4% | 42.36 -24% | 61.8 10% | 67.6 21% |
| Response Times | -29% | 31% | |||
| Response Time Grey 50% / Grey 80% * (ms) | 46.4 ? | 58 ? -25% | 20 ? 57% | ||
| Response Time Black / White * (ms) | 27.2 ? | 36 ? -32% | 26 ? 4% | ||
| PWM Frequency (Hz) | 200 ? | 220 ? | 50 ? | ||
| Screen | 3% | 8% | 32% | 18% | |
| Brightness middle (cd/m²) | 290 | 314 8% | 243 -16% | 288 -1% | 312 8% |
| Brightness (cd/m²) | 287 | 294 2% | 220 -23% | 277 -3% | 295 3% |
| Brightness Distribution (%) | 85 | 88 4% | 84 -1% | 83 -2% | 77 -9% |
| Black Level * (cd/m²) | 0.54 | 0.66 -22% | 0.27 50% | 0.27 50% | 0.53 2% |
| Contrast (:1) | 537 | 476 -11% | 900 68% | 1067 99% | 589 10% |
| Colorchecker dE 2000 * | 9.7 | 7.43 23% | 7.49 23% | 4.7 52% | 4.32 55% |
| Colorchecker dE 2000 max. * | 14.39 | 15.13 -5% | 11.7 19% | ||
| Greyscale dE 2000 * | 10.83 | 9.25 15% | 7.5 31% | 3.1 71% | 5.34 51% |
| Gamma | 2.91 76% | 2.49 88% | 2.35 94% | 2.7 81% | 2.71 81% |
| CCT | 12761 51% | 10786 60% | 6115 106% | 6603 98% | 6998 93% |
| Color Space (Percent of AdobeRGB 1998) (%) | 51.15 | 52.3 2% | 38.9 -24% | 61.9 21% | 62 21% |
| Color Space (Percent of sRGB) (%) | 78.96 | 60.9 -23% | 90.3 14% | ||
| Total Average (Program / Settings) | 3% /
3% | -15% /
-3% | 25% /
28% | 20% /
18% |
* ... smaller is better
| Cinebench R15 | |
| CPU Multi 64Bit | |
| HP EliteBook 850 G3 | |
| HP EliteBook 850 G2 J8R68EA | |
| Lenovo ThinkPad T560-20FH001FGE | |
| Toshiba Tecra Z50-C-10P | |
| Dell Latitude E5550 Broadwell | |
| CPU Single 64Bit | |
| HP EliteBook 850 G3 | |
| HP EliteBook 850 G2 J8R68EA | |
| Dell Latitude E5550 Broadwell | |
| Lenovo ThinkPad T560-20FH001FGE | |
| Toshiba Tecra Z50-C-10P | |
| Cinebench R10 | |
| Rendering Multiple CPUs 32Bit | |
| HP EliteBook 850 G3 | |
| HP EliteBook 850 G2 J8R68EA | |
| Lenovo ThinkPad T560-20FH001FGE | |
| Dell Latitude E5550 Broadwell | |
| Rendering Single 32Bit | |
| HP EliteBook 850 G3 | |
| HP EliteBook 850 G2 J8R68EA | |
| Dell Latitude E5550 Broadwell | |
| Lenovo ThinkPad T560-20FH001FGE | |
| Geekbench 3 | |
| 32 Bit Single-Core Score | |
| HP EliteBook 850 G3 | |
| HP EliteBook 850 G2 J8R68EA | |
| Dell Latitude E5550 Broadwell | |
| Lenovo ThinkPad T560-20FH001FGE | |
| 32 Bit Multi-Core Score | |
| HP EliteBook 850 G3 | |
| HP EliteBook 850 G2 J8R68EA | |
| Lenovo ThinkPad T560-20FH001FGE | |
| Dell Latitude E5550 Broadwell | |
| Sunspider - 1.0 Total Score | |
| Dell Latitude E5550 Broadwell | |
| HP EliteBook 850 G2 J8R68EA | |
| Lenovo ThinkPad T560-20FH001FGE | |
| HP EliteBook 850 G3 | |
| JetStream 1.1 - 1.1 Total | |
| HP EliteBook 850 G3 | |
| Lenovo ThinkPad T560-20FH001FGE | |
| Toshiba Tecra Z50-C-10P | |
| Mozilla Kraken 1.1 - Total | |
| Dell Latitude E5550 Broadwell | |
| HP EliteBook 850 G2 J8R68EA | |
| Lenovo ThinkPad T560-20FH001FGE | |
| HP EliteBook 850 G3 | |
| Octane V2 - Total Score | |
| HP EliteBook 850 G3 | |
| Lenovo ThinkPad T560-20FH001FGE | |
| HP EliteBook 850 G2 J8R68EA | |
| Dell Latitude E5550 Broadwell | |
| Peacekeeper - --- | |
| HP EliteBook 850 G3 | |
| HP EliteBook 850 G2 J8R68EA | |
| Dell Latitude E5550 Broadwell | |
| Lenovo ThinkPad T560-20FH001FGE | |
* ... smaller is better
| PCMark 7 Score | 5201 points | |
| PCMark 8 Home Score Accelerated v2 | 3202 points | |
| PCMark 8 Creative Score Accelerated v2 | 3932 points | |
| PCMark 8 Work Score Accelerated v2 | 4232 points | |
Help | ||
| PCMark 8 - Work Score Accelerated v2 | |
| HP EliteBook 850 G2 J8R68EA | |
| HP EliteBook 850 G3 | |
| Lenovo ThinkPad T560-20FH001FGE | |
| Dell Latitude E5550 Broadwell | |
| Toshiba Tecra Z50-C-10P | |
| PCMark 7 - Score | |
| HP EliteBook 850 G3 | |
| HP EliteBook 850 G2 J8R68EA | |
| Dell Latitude E5550 Broadwell | |
| Lenovo ThinkPad T560-20FH001FGE | |

| 3DMark 06 Standard Score | 8335 points | |
| 3DMark 11 Performance | 1461 points | |
| 3DMark Ice Storm Standard Score | 49073 points | |
| 3DMark Cloud Gate Standard Score | 5265 points | |
| 3DMark Fire Strike Score | 743 points | |
Help | ||
| 3DMark 11 - 1280x720 Performance | |
| HP EliteBook 850 G2 J8R68EA | |
| HP EliteBook 850 G3 | |
| Toshiba Tecra Z50-C-10P | |
| Lenovo ThinkPad T560-20FH001FGE | |
| Dell Latitude E5550 Broadwell | |
| 3DMark | |
| 1280x720 Ice Storm Standard Score | |
| HP EliteBook 850 G3 | |
| Dell Latitude E5550 Broadwell | |
| Toshiba Tecra Z50-C-10P | |
| Lenovo ThinkPad T560-20FH001FGE | |
| HP EliteBook 850 G2 J8R68EA | |
| 1280x720 Cloud Gate Standard Score | |
| HP EliteBook 850 G2 J8R68EA | |
| HP EliteBook 850 G3 | |
| Toshiba Tecra Z50-C-10P | |
| Dell Latitude E5550 Broadwell | |
| Lenovo ThinkPad T560-20FH001FGE | |
| 1280x720 Sky Diver Score | |
| HP EliteBook 850 G3 | |
| Dell Latitude E5550 Broadwell | |
| 1920x1080 Fire Strike Score | |
| HP EliteBook 850 G2 J8R68EA | |
| HP EliteBook 850 G3 | |
| Dell Latitude E5550 Broadwell | |
| Toshiba Tecra Z50-C-10P | |
| Lenovo ThinkPad T560-20FH001FGE | |
| 3DMark 06 - 1280x1024 Standard Score AA:0x AF:0x | |
| HP EliteBook 850 G2 J8R68EA | |
| HP EliteBook 850 G3 | |
| Lenovo ThinkPad T560-20FH001FGE | |
| Dell Latitude E5550 Broadwell | |
| low | med. | high | ultra | |
|---|---|---|---|---|
| Tomb Raider (2013) | 57 | 28 | 18.3 | 8.8 |
| BioShock Infinite (2013) | 37.4 | 21.7 | 18.2 | 5.5 |
| Battlefield 4 (2013) | 33.4 | 25.3 | 15.1 | 4.1 |
Noise level
| Idle |
| 29 / 29 / 29 dB(A) |
| Load |
| 32.6 / 34.6 dB(A) |
 | ||
30 dB silent 40 dB(A) audible 50 dB(A) loud |
||
min: | ||
| HP EliteBook 850 G3 6500U, HD Graphics 520 | HP EliteBook 850 G2 J8R68EA 5500U, Radeon R7 M260X | Lenovo ThinkPad T560-20FH001FGE 6200U, HD Graphics 520 | Toshiba Tecra Z50-C-10P 6200U, HD Graphics 520 | Dell Latitude E5550 Broadwell 5300U, HD Graphics 5500 | |
|---|---|---|---|---|---|
| Noise | -9% | -3% | -7% | -11% | |
| off / environment * (dB) | 29 | 29 -0% | 31.2 -8% | ||
| Idle Minimum * (dB) | 29 | 28.9 -0% | 30.8 -6% | 32.4 -12% | 29.6 -2% |
| Idle Average * (dB) | 29 | 28.9 -0% | 30.8 -6% | 32.4 -12% | 29.6 -2% |
| Idle Maximum * (dB) | 29 | 28.9 -0% | 30.8 -6% | 32.4 -12% | 29.6 -2% |
| Load Average * (dB) | 32.6 | 40.7 -25% | 33.1 -2% | 33.5 -3% | 38.1 -17% |
| Load Maximum * (dB) | 34.6 | 41.3 -19% | 34.4 1% | 33.5 3% | 46.4 -34% |
* ... smaller is better
(+) The maximum temperature on the upper side is 33.4 °C / 92 F, compared to the average of 34.3 °C / 94 F, ranging from 21.2 to 62.5 °C for the class Office.
(+) The bottom heats up to a maximum of 36.4 °C / 98 F, compared to the average of 36.8 °C / 98 F
(+) In idle usage, the average temperature for the upper side is 27.3 °C / 81 F, compared to the device average of 29.5 °C / 85 F.
(+) The palmrests and touchpad are cooler than skin temperature with a maximum of 26.7 °C / 80.1 F and are therefore cool to the touch.
(±) The average temperature of the palmrest area of similar devices was 27.5 °C / 81.5 F (+0.8 °C / 1.4 F).
| HP EliteBook 850 G3 6500U, HD Graphics 520 | HP EliteBook 850 G2 J8R68EA 5500U, Radeon R7 M260X | Lenovo ThinkPad T560-20FH001FGE 6200U, HD Graphics 520 | Toshiba Tecra Z50-C-10P 6200U, HD Graphics 520 | Dell Latitude E5550 Broadwell 5300U, HD Graphics 5500 | |
|---|---|---|---|---|---|
| Heat | -17% | 1% | 0% | -19% | |
| Maximum Upper Side * (°C) | 33.4 | 43.8 -31% | 33.3 -0% | 36 -8% | 42.3 -27% |
| Maximum Bottom * (°C) | 36.4 | 46.5 -28% | 40.1 -10% | 50 -37% | 48 -32% |
| Idle Upper Side * (°C) | 31.4 | 31.7 -1% | 27.4 13% | 23.9 24% | 33.5 -7% |
| Idle Bottom * (°C) | 30.2 | 32.9 -9% | 29.6 2% | 23.8 21% | 33.1 -10% |
* ... smaller is better
| Off / Standby | |
| Idle | |
| Load |
|
Key:
min: | |
| HP EliteBook 850 G3 6500U, HD Graphics 520 | HP EliteBook 850 G2 J8R68EA 5500U, Radeon R7 M260X | Lenovo ThinkPad T560-20FH001FGE 6200U, HD Graphics 520 | Toshiba Tecra Z50-C-10P 6200U, HD Graphics 520 | Dell Latitude E5550 Broadwell 5300U, HD Graphics 5500 | |
|---|---|---|---|---|---|
| Power Consumption | -5% | 12% | 1% | -12% | |
| Idle Minimum * (Watt) | 5 | 3 40% | 4.3 14% | 4.7 6% | 4.7 6% |
| Idle Average * (Watt) | 7.8 | 6.3 19% | 7.3 6% | 8 -3% | 8 -3% |
| Idle Maximum * (Watt) | 8.4 | 7 17% | 7.8 7% | 9.8 -17% | 10.3 -23% |
| Load Average * (Watt) | 28.8 | 43.7 -52% | 26.3 9% | 29.7 -3% | 40.3 -40% |
| Load Maximum * (Watt) | 43 | 63.7 -48% | 32 26% | 32.6 24% | 43.5 -1% |
* ... smaller is better
| HP EliteBook 850 G3 46 Wh | HP EliteBook 850 G2 J8R68EA 50 Wh | Lenovo ThinkPad T560-20FH001FGE 67 Wh | Dell Latitude E5550 Broadwell 51 Wh | |
|---|---|---|---|---|
| Battery runtime | -14% | 41% | -29% | |
| Reader / Idle (h) | 15.3 | 14.6 -5% | 18.1 18% | 12 -22% |
| H.264 (h) | 7.2 | 5.5 -24% | 9.5 32% | 6.5 -10% |
| WiFi v1.3 (h) | 7 | 6.6 -6% | 11 57% | |
| Load (h) | 2.4 | 1.9 -21% | 3.8 58% | 1.1 -54% |
| WiFi (h) | 6.4 |
Pros
Cons
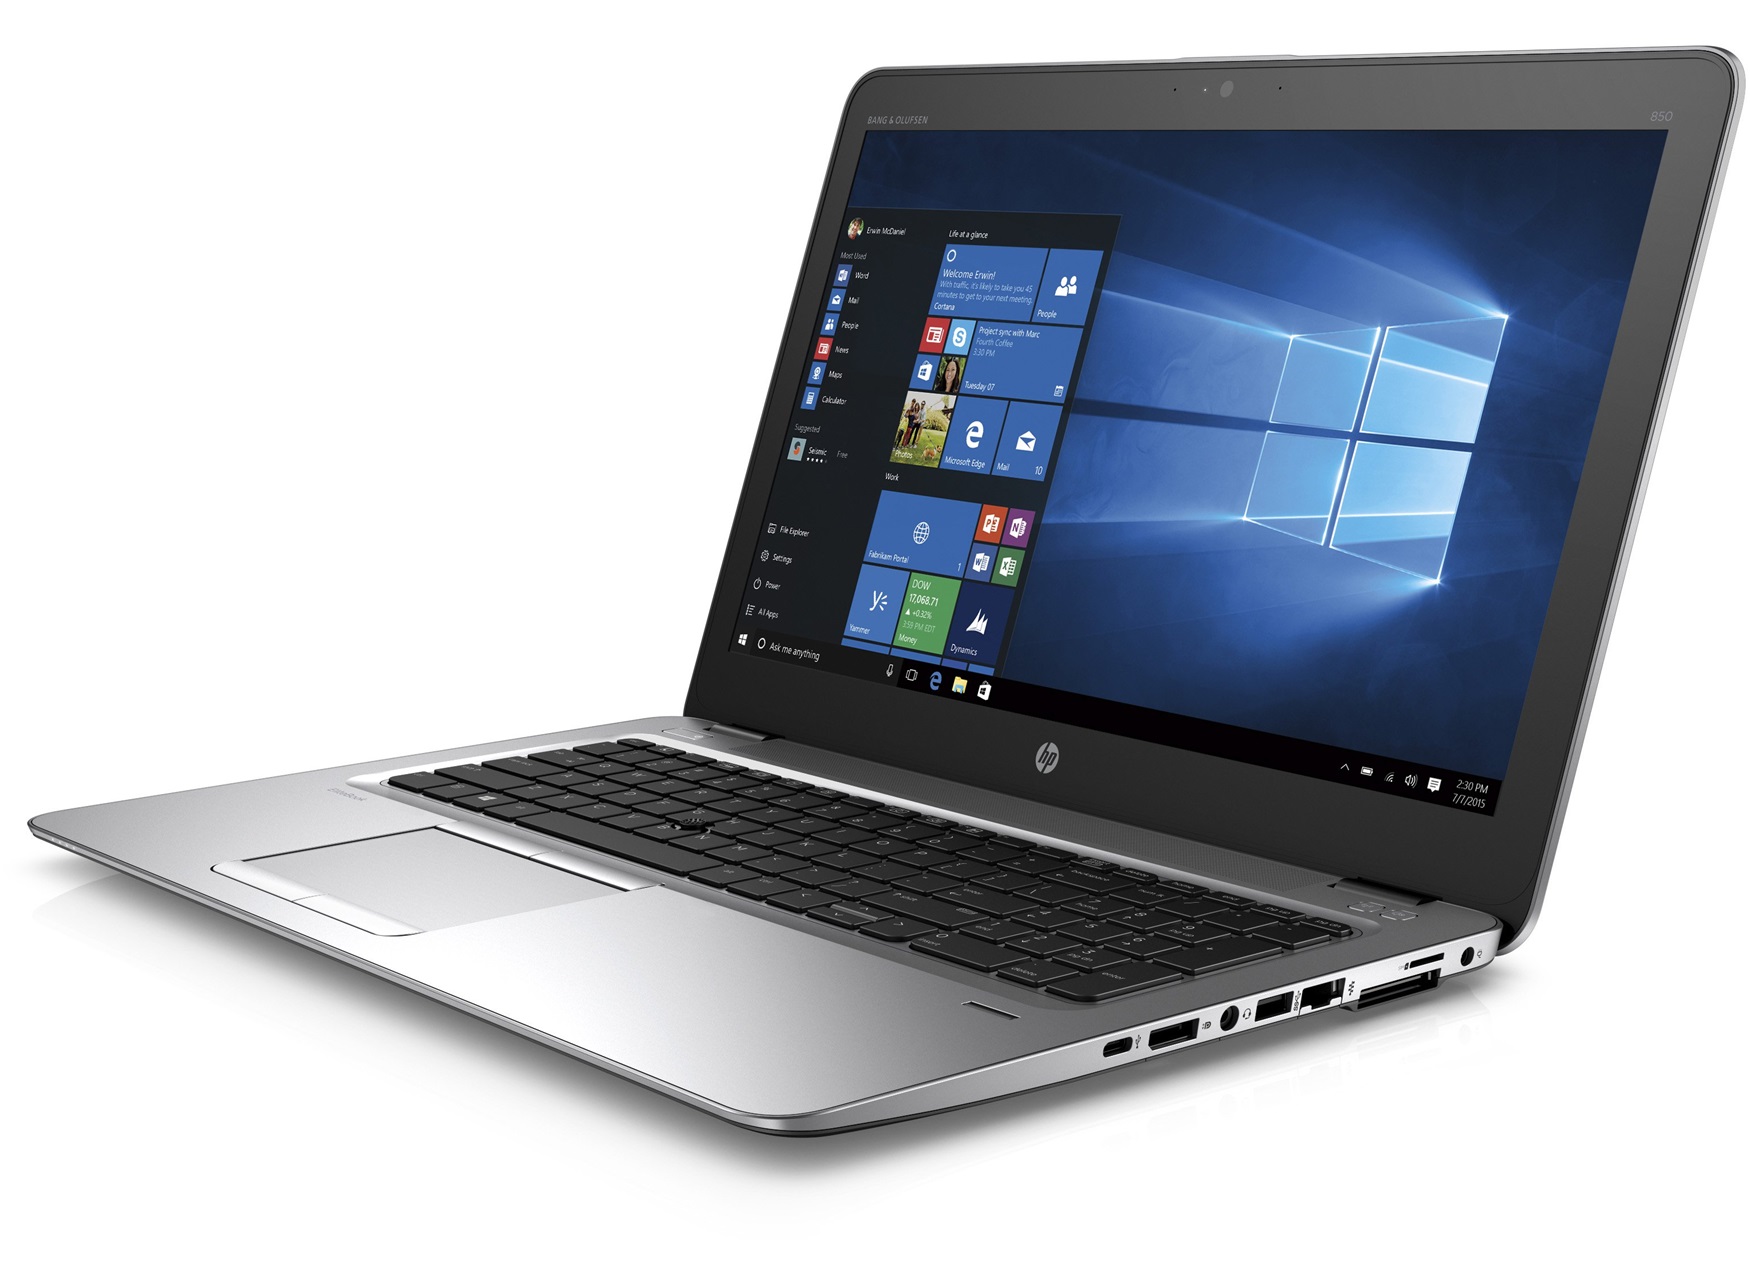
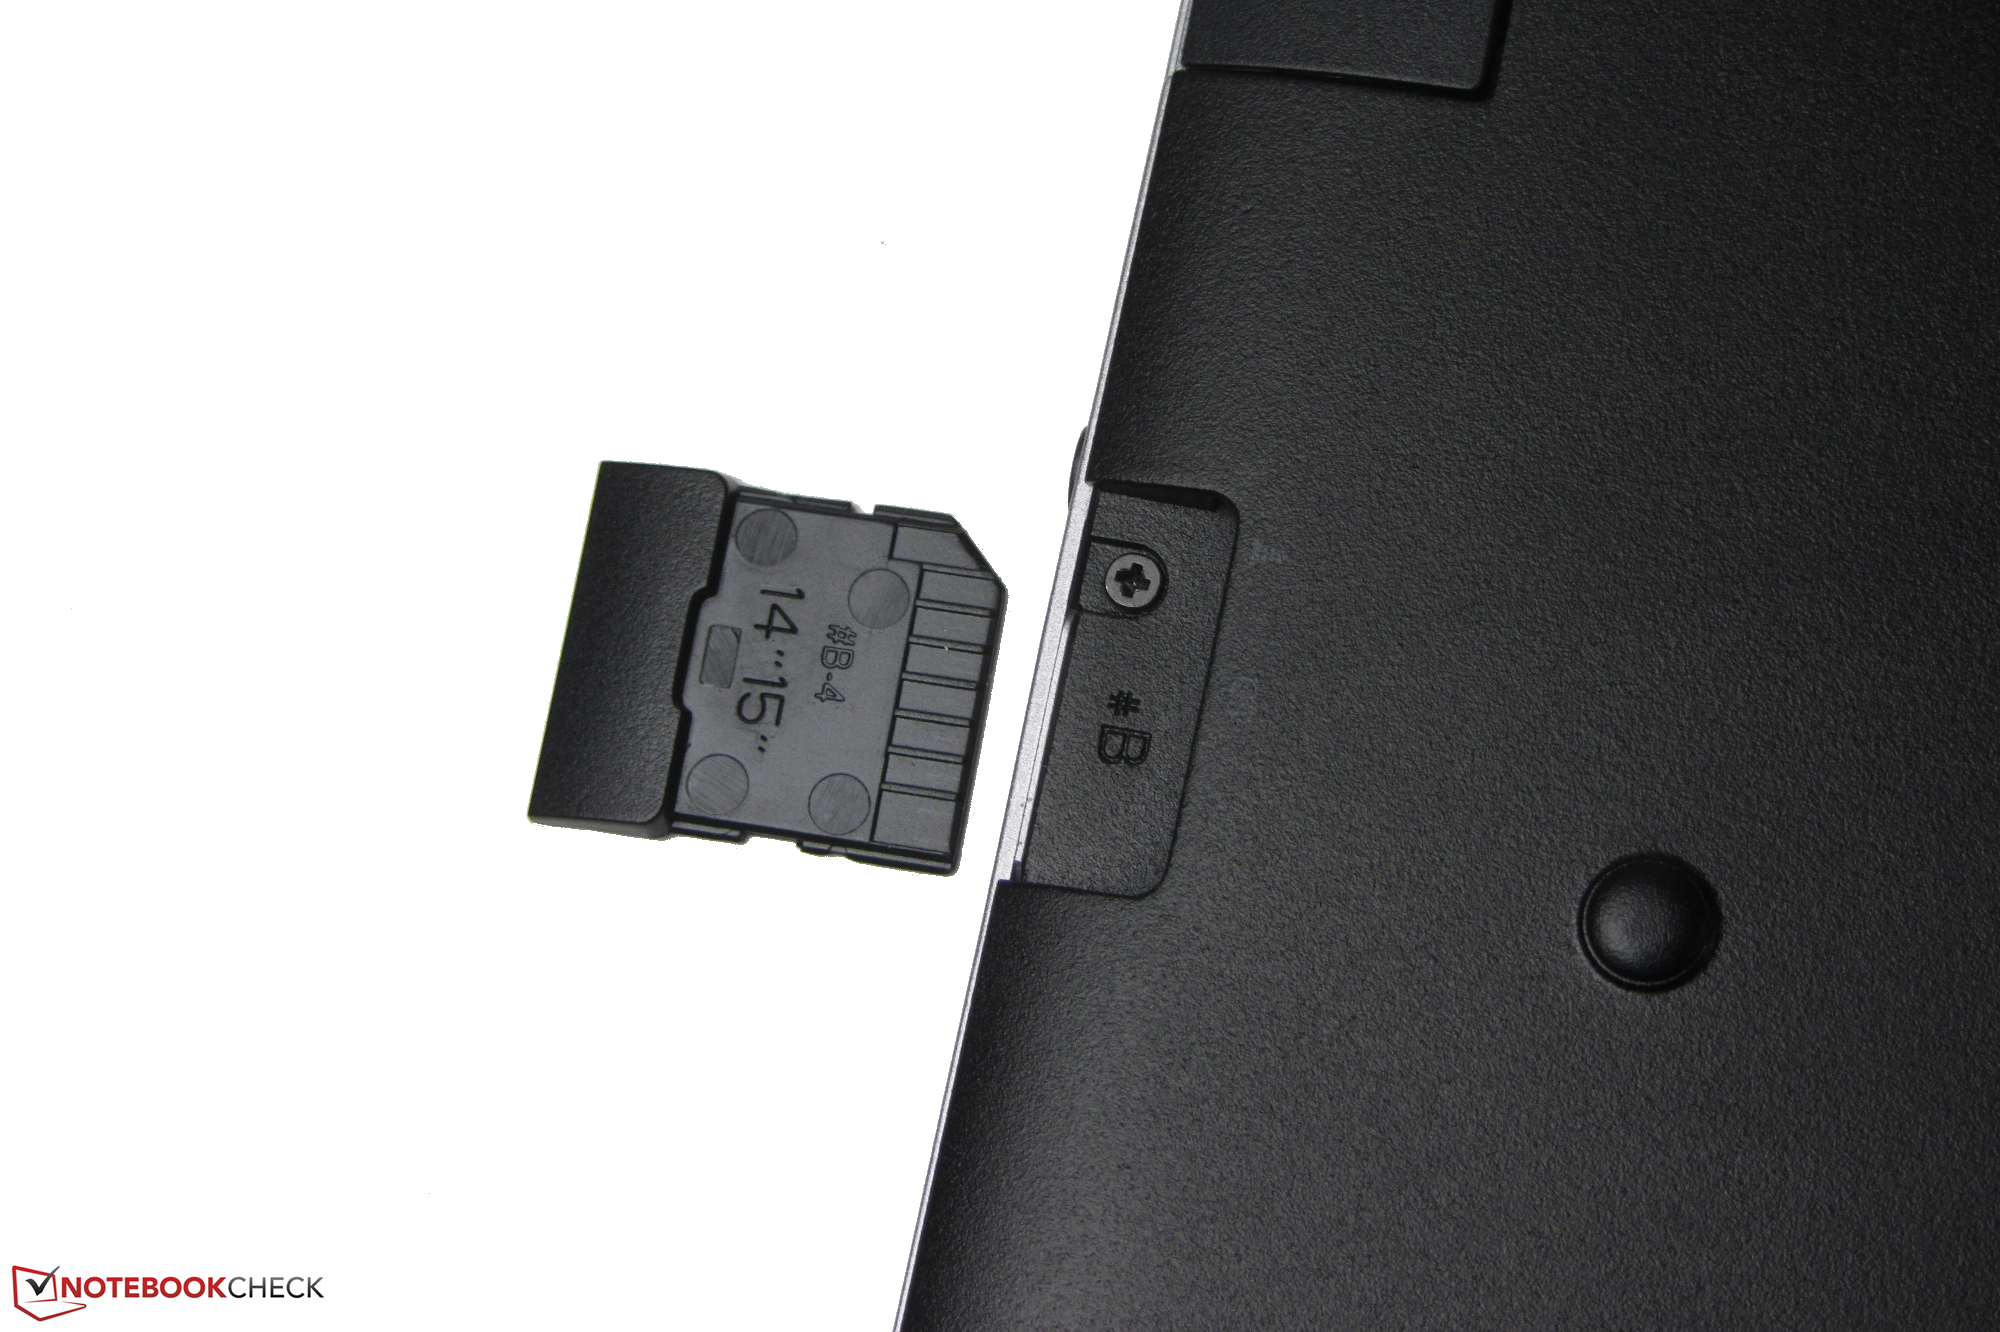
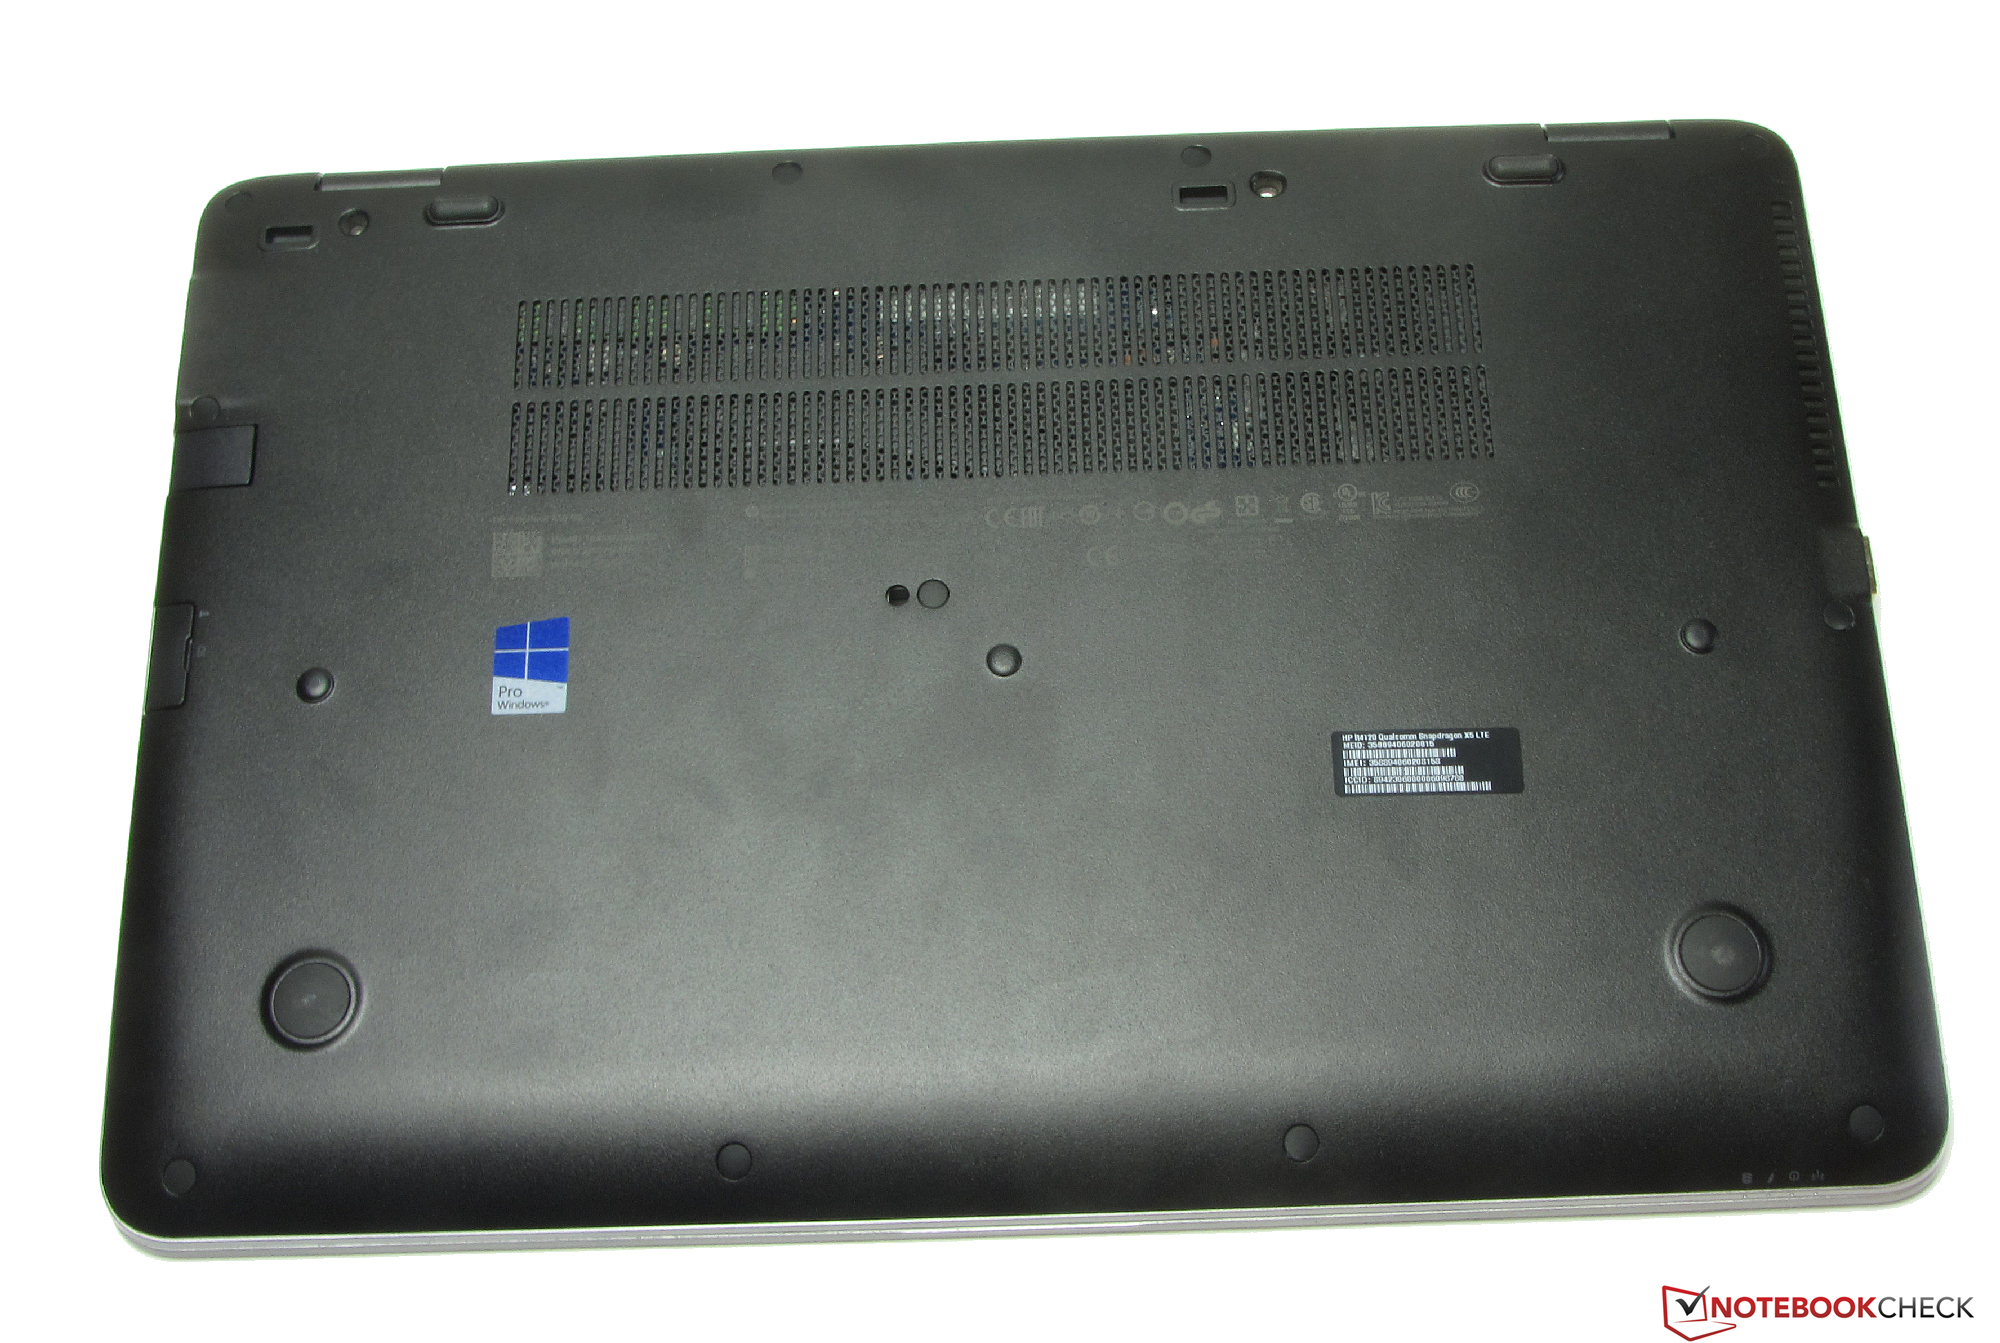
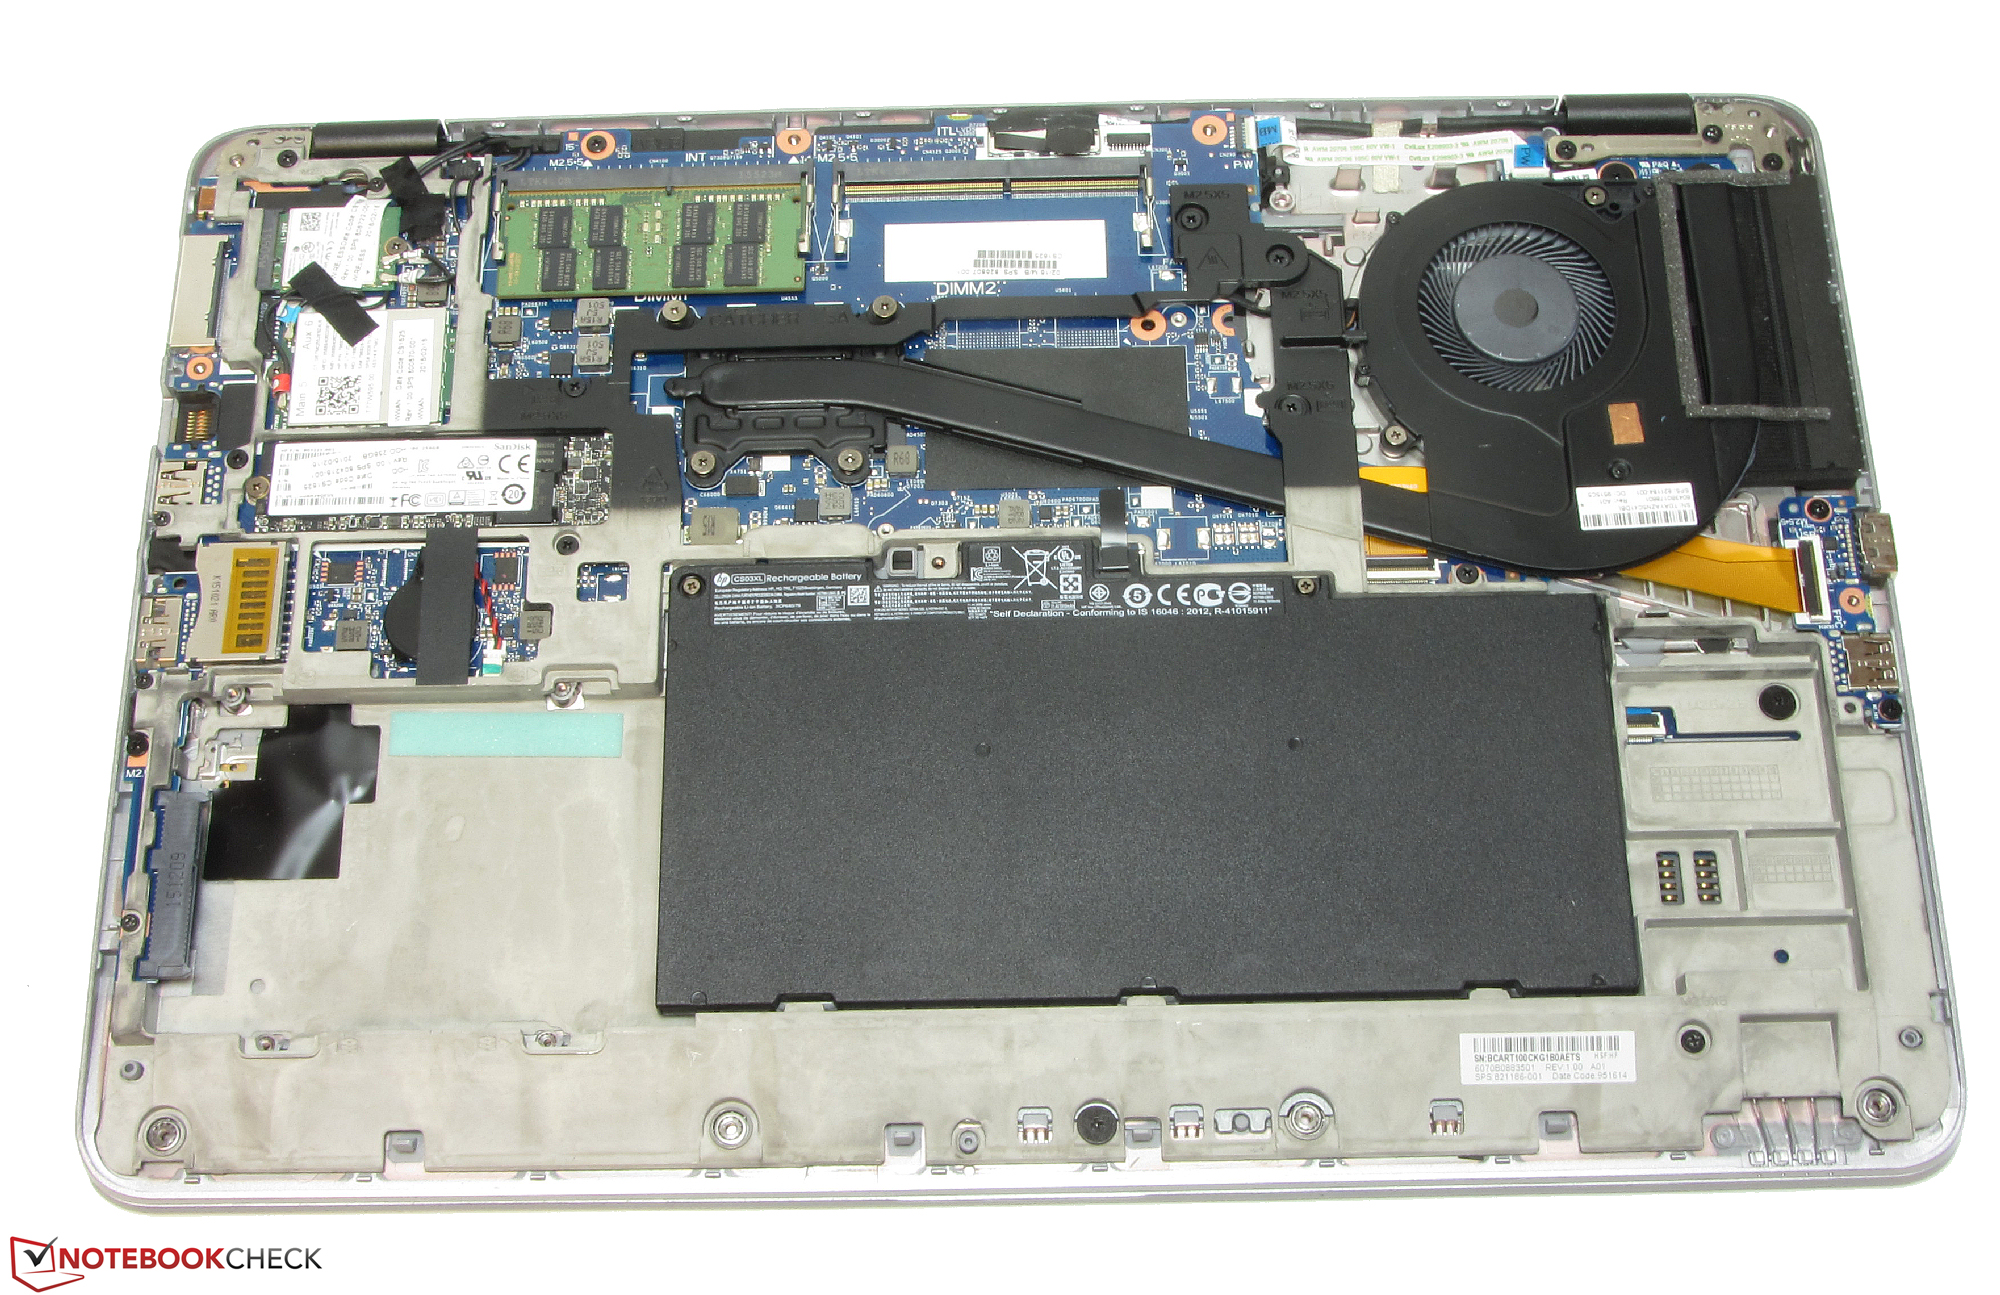
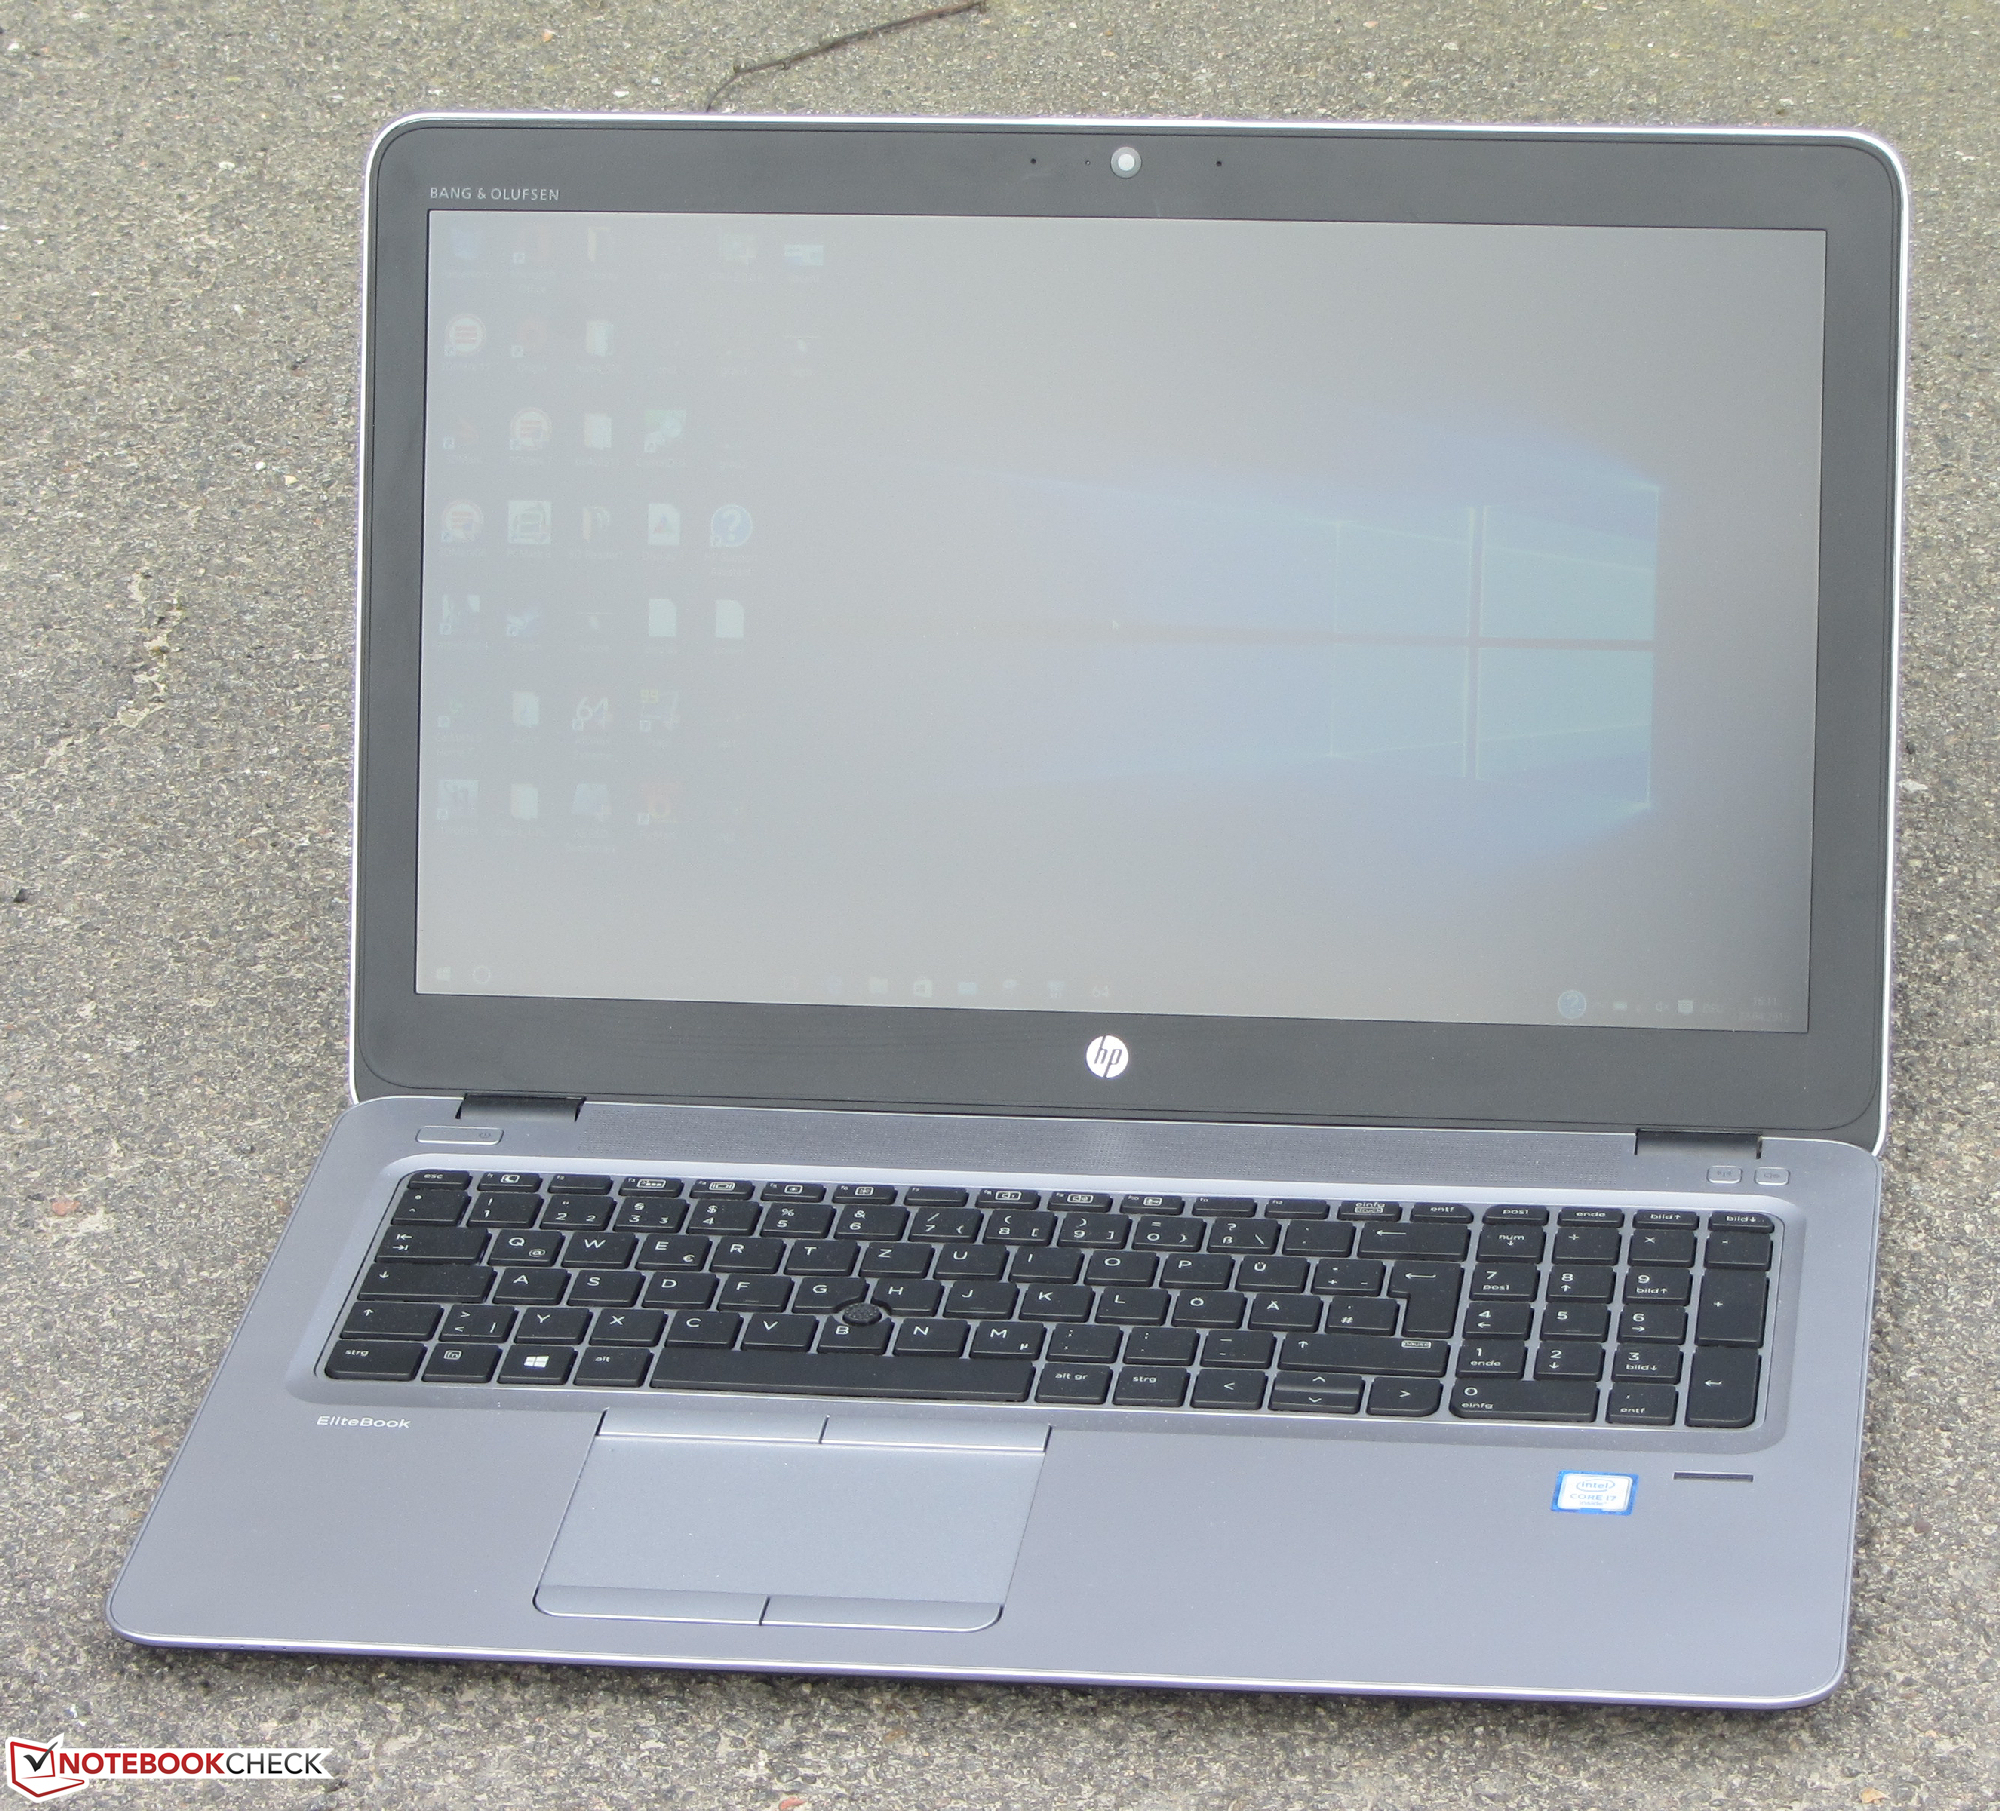
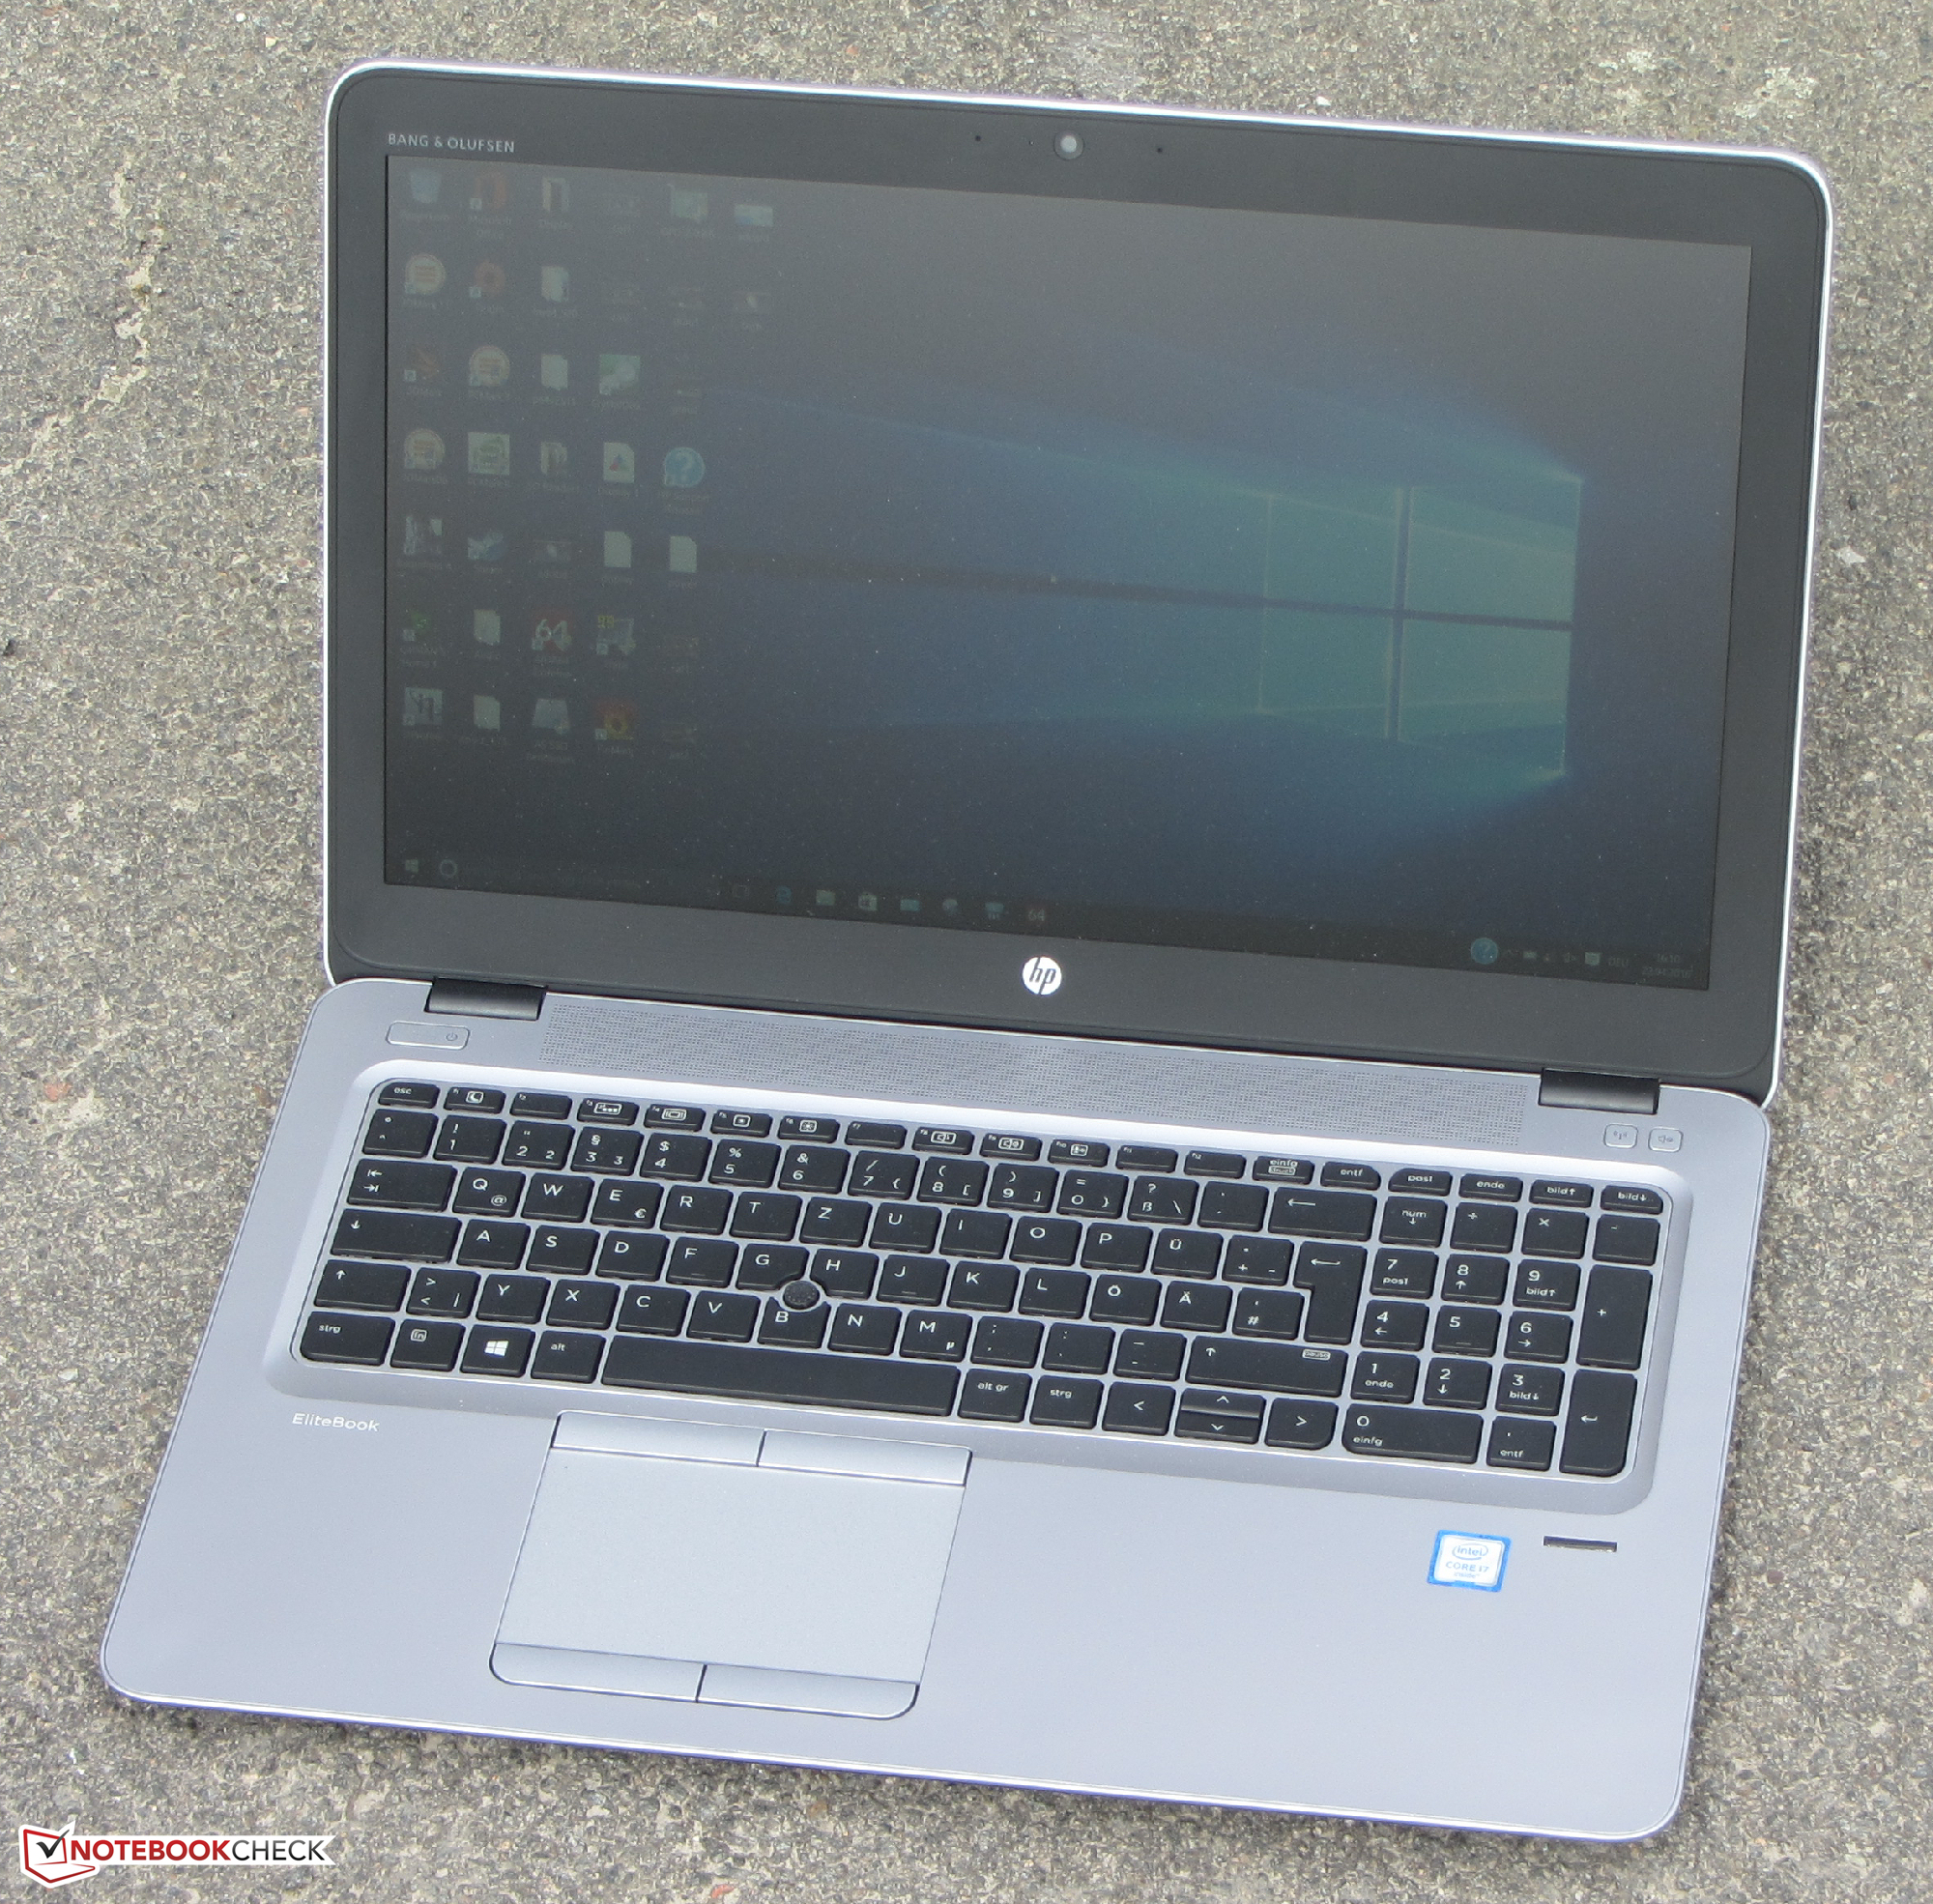
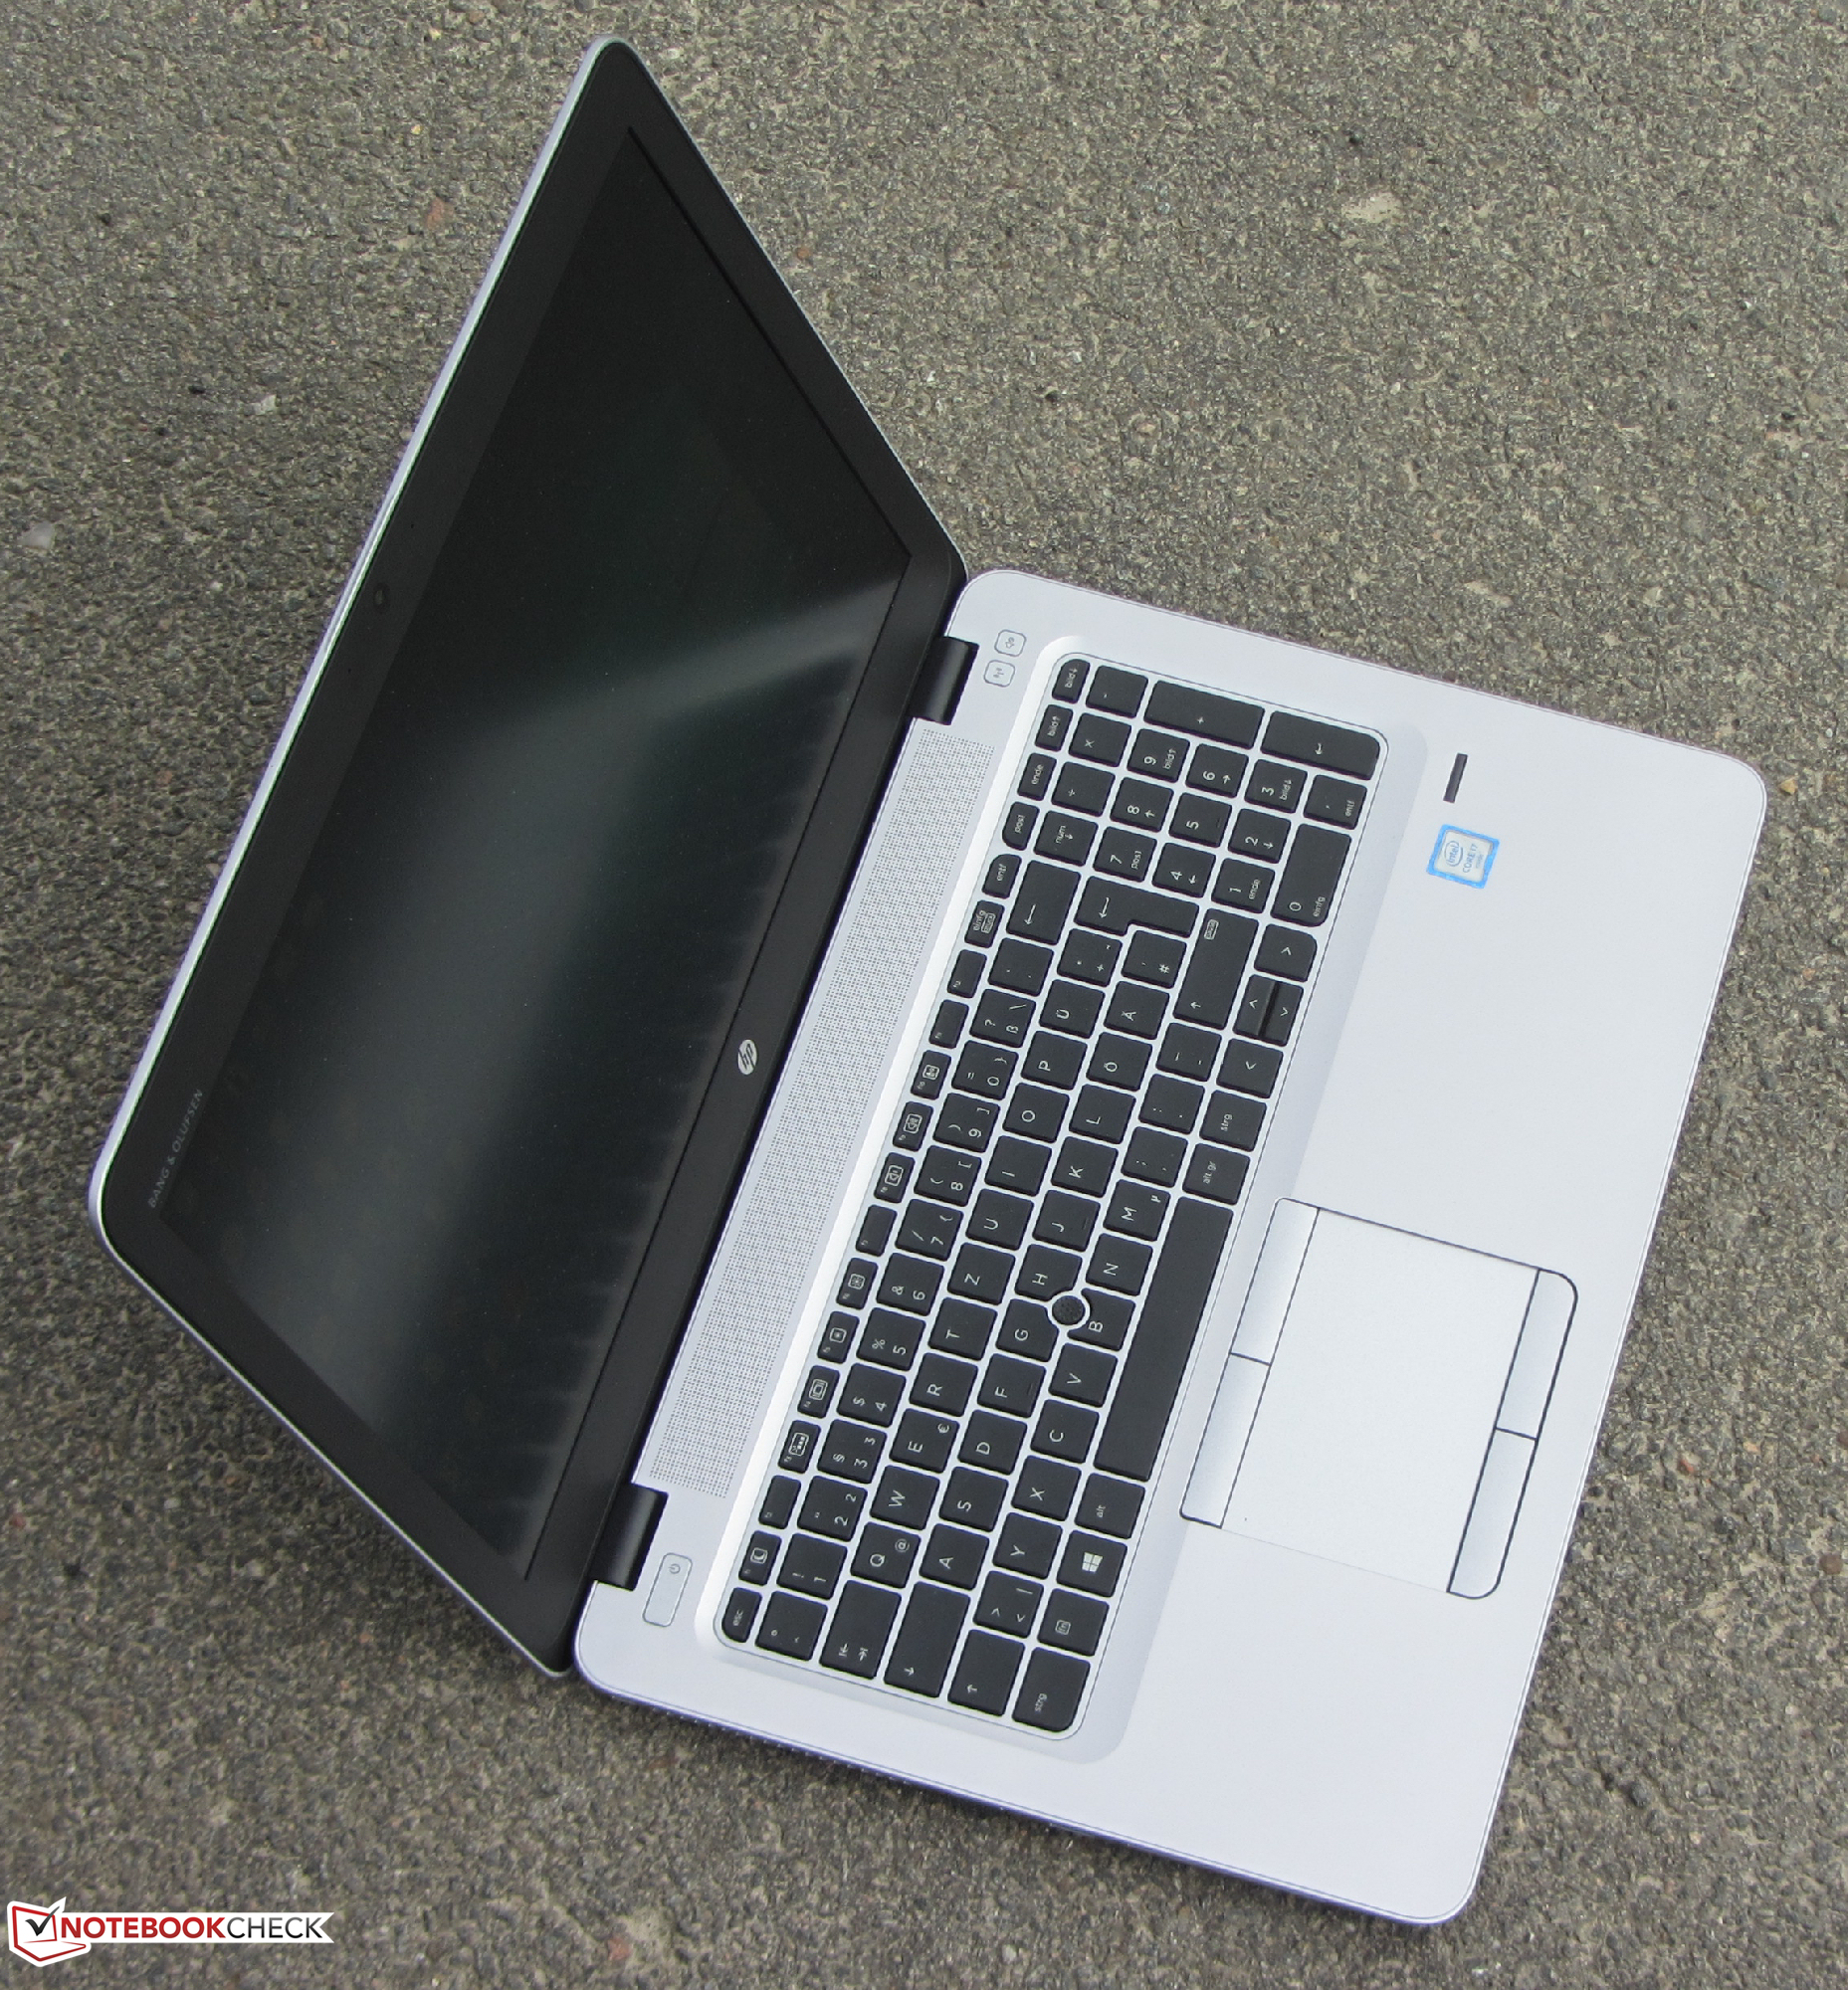
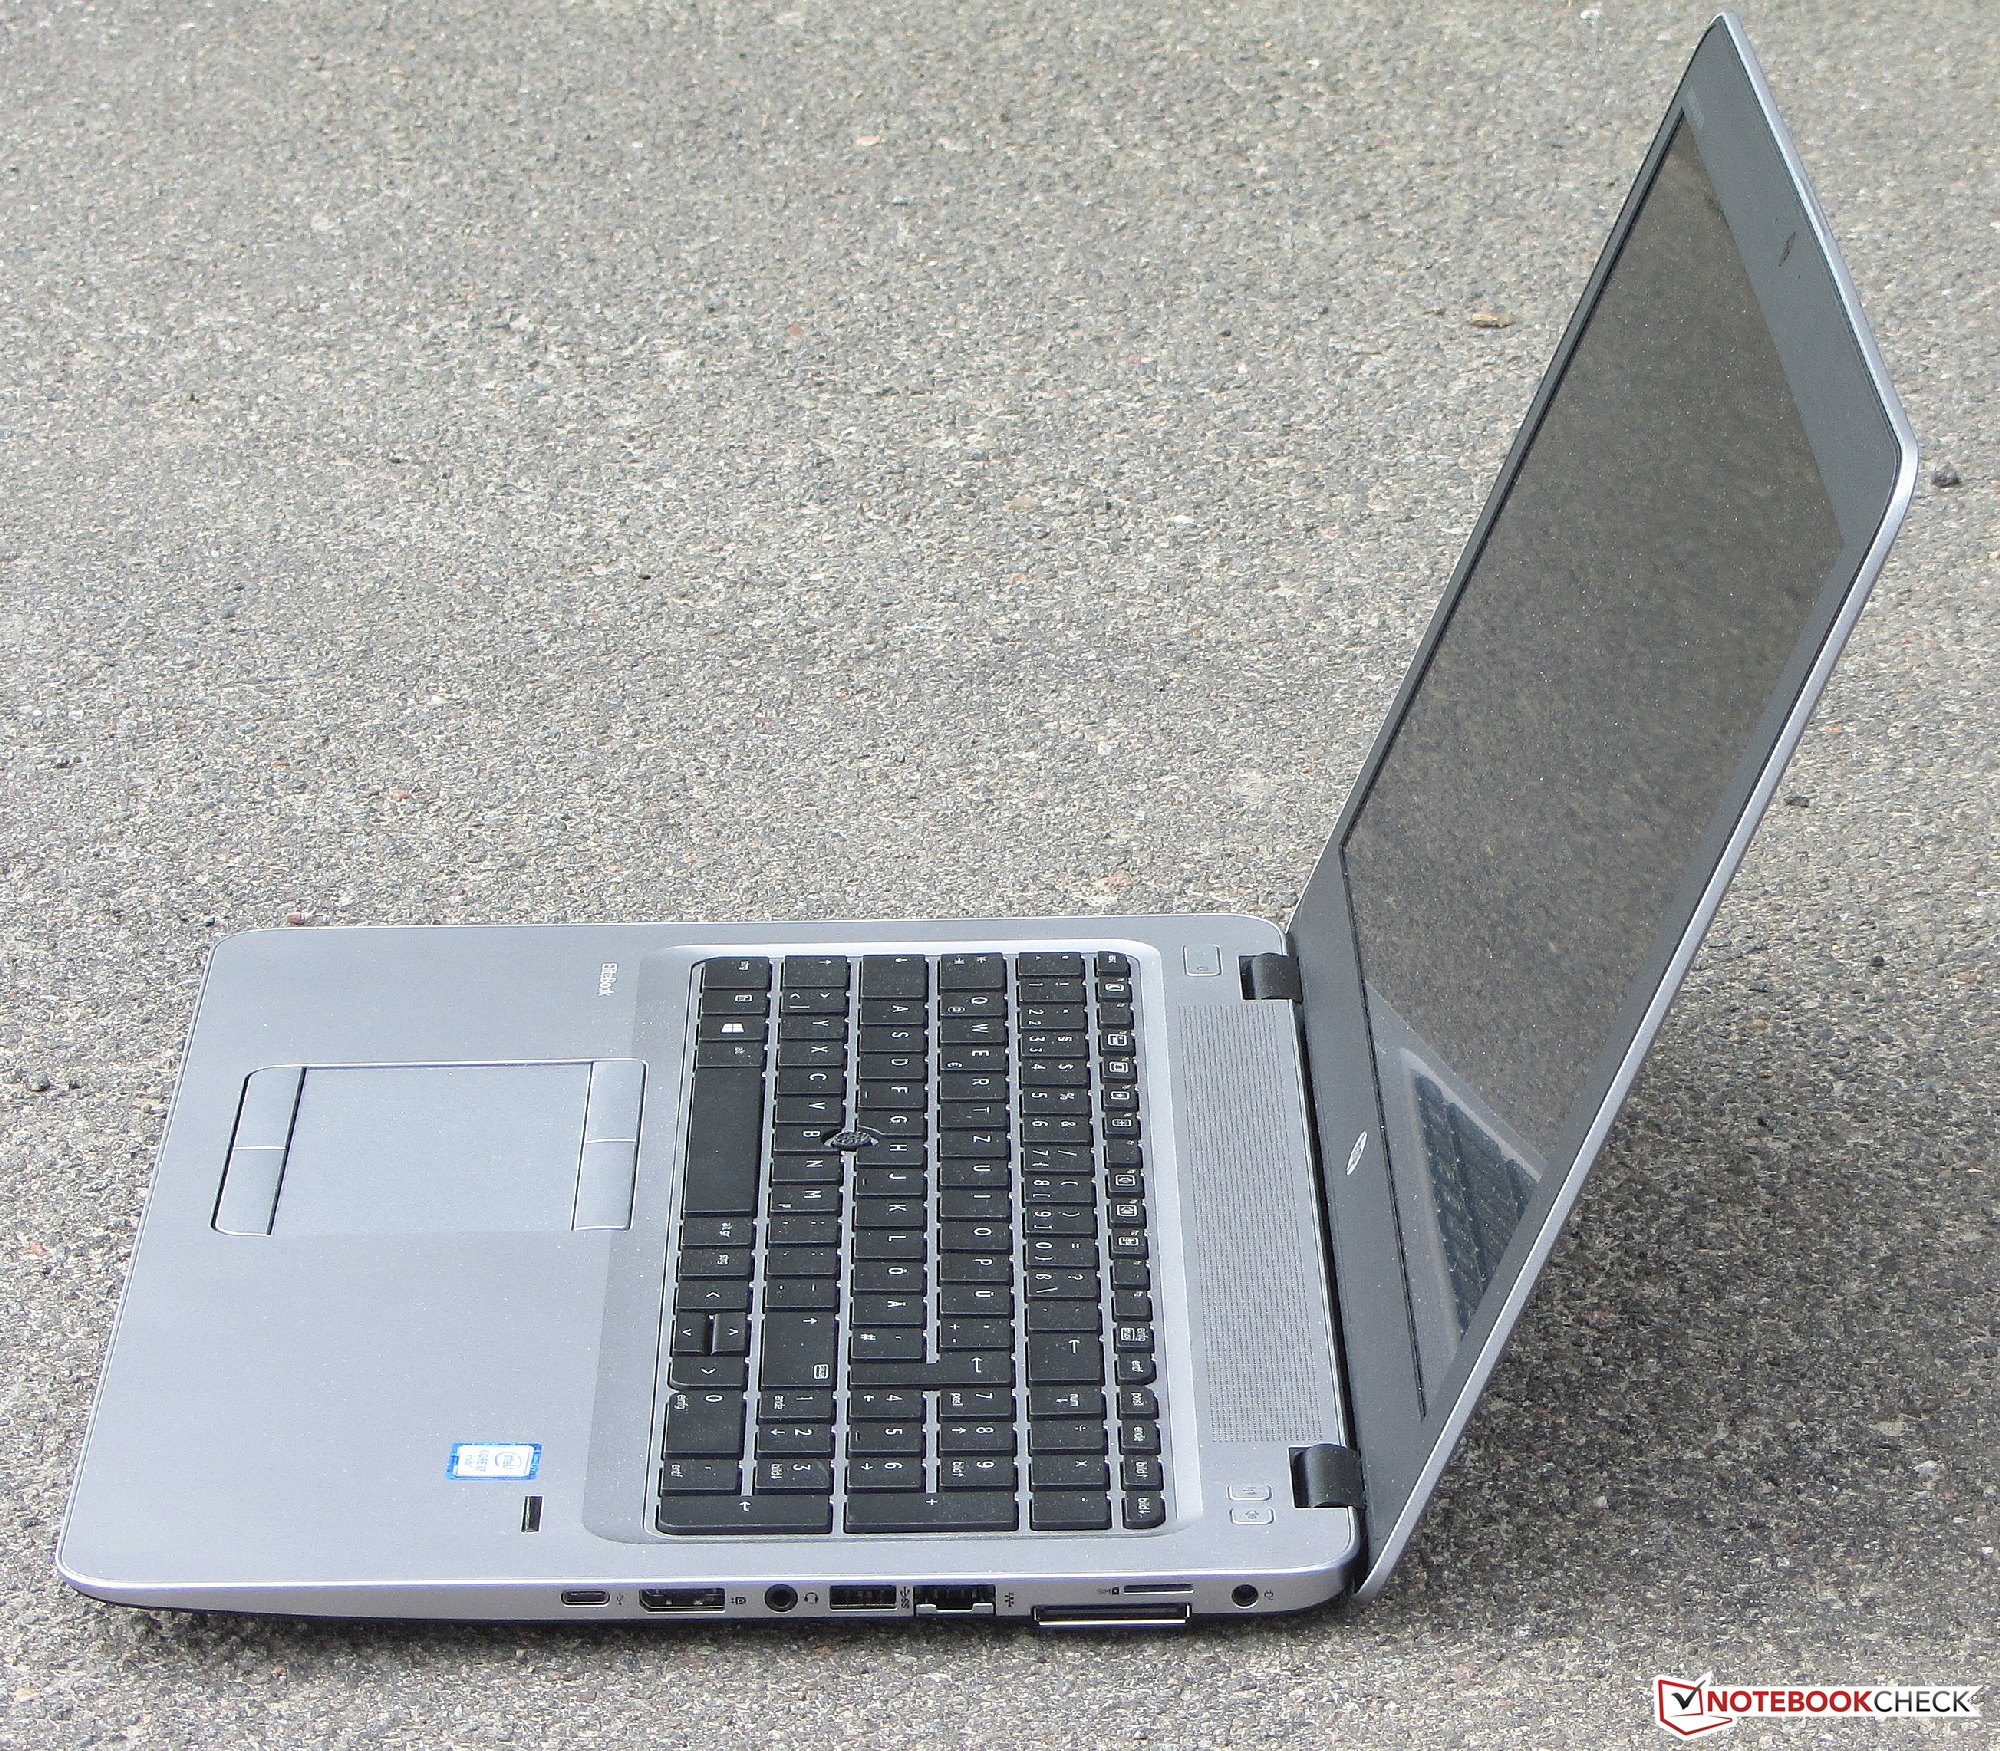
惠普将最新科技带到了EliteBook 850 G3之中。由于厚度的降低,这台设备相比前代产品看起来更加雅致。不过它的瘦身食谱也带来了副作用:维护底盖不复存在,升级更换部件需要打开整个底盖。这台笔记本电脑运行安静同时几乎不会变热。用户可以通过额外的2.5寸硬盘槽扩展存储空间。EliteBook G3 的输入设备十分优秀,它可以满足打字较多的办公用户的需要。而优秀的电池续航则让它更加全面。不过,相比前代产品的一大区别是它不再支持额外的电池底座了。
EliteBook 850 G3是一台高品质办公设备,适合运算充足的用户。不过尽管售价不菲,这台笔记本电脑也有一些弱点。需要更好升级维护空间和外置电池的用户可能也会更喜欢EliteBook 850 G2。
遗憾的是,惠普仍然没有摆脱传统弱项——屏幕。用户在支付1500欧元(约11116人民币)时会期待得到一块出色的屏幕。但是,它无法满足这一点。它屏幕的最大优点是磨砂表面。亮度可以说是中规中矩,但色彩还原和对比度则只能说是让人失望了。除此之外,它的可视角度范围也很窄。
注:本文是基于完整评测的缩减版本,阅读完整的英文评测,请点击这里。
HP EliteBook 850 G3
- 04/25/2016 v5.1 (old)
Sascha Mölck