戴尔 Inspiron 13 7368 变形本简短评测
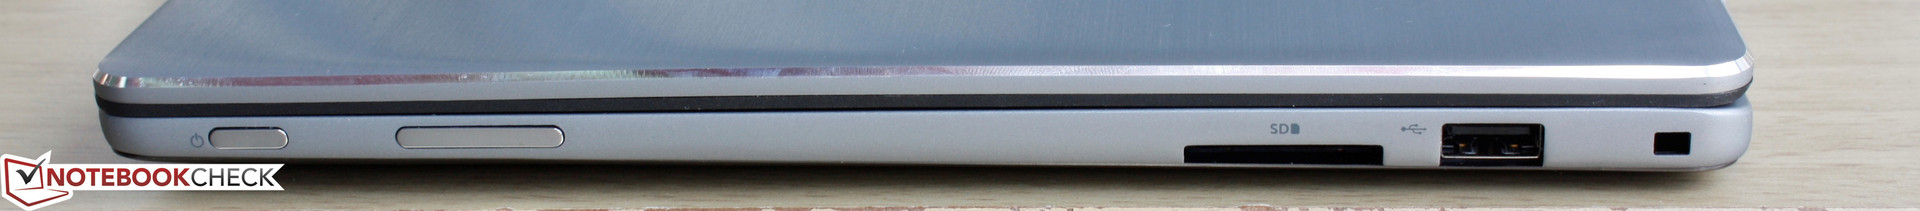
| SD Card Reader | |
| average JPG Copy Test (av. of 3 runs) | |
| Dell XPS 13 2016 9350 (FHD, i7-6560U) | |
| Apple MacBook Pro Retina 13 inch 2013-10 | |
| Lenovo IdeaPad 710S-13ISK 80SW0031US | |
| Dell Inspiron 13 7386 | |
| maximum AS SSD Seq Read Test (1GB) | |
| Dell XPS 13 2016 9350 (FHD, i7-6560U) | |
| Lenovo IdeaPad 710S-13ISK 80SW0031US | |
| Dell Inspiron 13 7386 | |
| |||||||||||||||||||||||||
Brightness Distribution: 91 %
Center on Battery: 226.4 cd/m²
Contrast: 858:1 (Black: 0.264 cd/m²)
ΔE ColorChecker Calman: 4.96 | ∀{0.5-29.43 Ø4.71}
ΔE Greyscale Calman: 3.71 | ∀{0.09-98 Ø4.96}
60.5% sRGB (Argyll 1.6.3 3D)
38.6% AdobeRGB 1998 (Argyll 1.6.3 3D)
42.19% AdobeRGB 1998 (Argyll 3D)
61.1% sRGB (Argyll 3D)
40.82% Display P3 (Argyll 3D)
Gamma: 2.18
CCT: 7215 K
| Dell Inspiron 13 7386 IPS, 13.3", 1920x1080 | Acer Aspire R13 R7-372T-746N Sharp LQ133T1JW02, IPS, 13.3", 2560x1440 | Dell Inspiron 13-7348 IPS, 13.3", 1920x1080 | HP Spectre x360 13-4104ng LG Philips LGD0000, IPS, 13.3", 2560x1440 | Lenovo Yoga 900-13ISK 80MK IPS, 13.3", 3200x1800 | Microsoft Surface Book Core i5 IPS, 13.5", 3000x2000 | |
|---|---|---|---|---|---|---|
| Display | 66% | 57% | 59% | 51% | 61% | |
| Display P3 Coverage (%) | 40.82 | 69.6 71% | 65.2 60% | 66.8 64% | 63.2 55% | 67 64% |
| sRGB Coverage (%) | 61.1 | 98 60% | 93.5 53% | 92.8 52% | 88.7 45% | 95.8 57% |
| AdobeRGB 1998 Coverage (%) | 42.19 | 70.7 68% | 67.1 59% | 67.3 60% | 64.9 54% | 68.9 63% |
| Response Times | 17% | 46% | 27% | 1% | ||
| Response Time Grey 50% / Grey 80% * (ms) | 56 ? | 36 ? 36% | 24 ? 57% | 38.8 ? 31% | 48.4 ? 14% | |
| Response Time Black / White * (ms) | 29.2 ? | 30 ? -3% | 19 ? 35% | 22.4 ? 23% | 32.8 ? -12% | |
| PWM Frequency (Hz) | 203.3 ? | 1000 ? | 1316 | |||
| Screen | 42% | -11% | 19% | -2% | 56% | |
| Brightness middle (cd/m²) | 226.4 | 320 41% | 375 66% | 324 43% | 319.8 41% | 430.9 90% |
| Brightness (cd/m²) | 218 | 308 41% | 351 61% | 324 49% | 302 39% | 410 88% |
| Brightness Distribution (%) | 91 | 91 0% | 89 -2% | 90 -1% | 88 -3% | 93 2% |
| Black Level * (cd/m²) | 0.264 | 0.17 36% | 0.44 -67% | 0.34 -29% | 0.835 -216% | 0.254 4% |
| Contrast (:1) | 858 | 1882 119% | 852 -1% | 953 11% | 383 -55% | 1696 98% |
| Colorchecker dE 2000 * | 4.96 | 3.18 36% | 7.37 -49% | 4.36 12% | 2.68 46% | 2.06 58% |
| Colorchecker dE 2000 max. * | 13 | 9.91 24% | ||||
| Greyscale dE 2000 * | 3.71 | 4.13 -11% | 9.54 -157% | 4.62 -25% | 2.35 37% | 2.22 40% |
| Gamma | 2.18 101% | 2.03 108% | 2.69 82% | 2.18 101% | 2.09 105% | 2.13 103% |
| CCT | 7215 90% | 6752 96% | 6685 97% | 6857 95% | 6975 93% | 6520 100% |
| Color Space (Percent of AdobeRGB 1998) (%) | 38.6 | 65 68% | 61 58% | 60 55% | 57 48% | 64 66% |
| Color Space (Percent of sRGB) (%) | 60.5 | 98 62% | 93 54% | 88 45% | 96 59% | |
| Total Average (Program / Settings) | 42% /
43% | 23% /
7% | 41% /
31% | 25% /
14% | 39% /
49% |
* ... smaller is better
Display Response Times
| ↔ Response Time Black to White | ||
|---|---|---|
| 29.2 ms ... rise ↗ and fall ↘ combined | ↗ 7.6 ms rise | 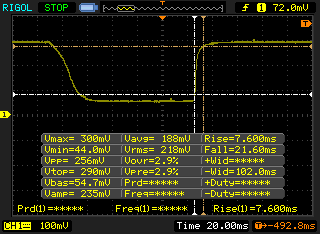 |
| ↘ 21.6 ms fall | ||
| The screen shows relatively slow response rates in our tests and may be too slow for gamers. In comparison, all tested devices range from 0.1 (minimum) to 240 (maximum) ms. » 78 % of all devices are better. This means that the measured response time is worse than the average of all tested devices (19.8 ms). | ||
| ↔ Response Time 50% Grey to 80% Grey | ||
| 56 ms ... rise ↗ and fall ↘ combined | ↗ 22.8 ms rise | 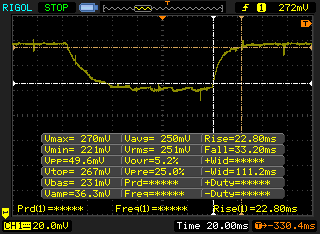 |
| ↘ 33.2 ms fall | ||
| The screen shows slow response rates in our tests and will be unsatisfactory for gamers. In comparison, all tested devices range from 0.165 (minimum) to 636 (maximum) ms. » 93 % of all devices are better. This means that the measured response time is worse than the average of all tested devices (31 ms). | ||
Screen Flickering / PWM (Pulse-Width Modulation)
| Screen flickering / PWM detected | 203.3 Hz | ≤ 99 % brightness setting | 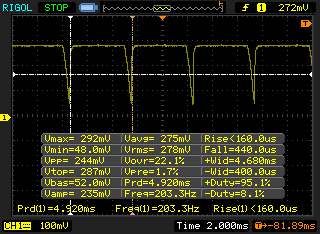 |
The display backlight flickers at 203.3 Hz (worst case, e.g., utilizing PWM) Flickering detected at a brightness setting of 99 % and below. There should be no flickering or PWM above this brightness setting. The frequency of 203.3 Hz is relatively low, so sensitive users will likely notice flickering and experience eyestrain at the stated brightness setting and below. In comparison: 52 % of all tested devices do not use PWM to dim the display. If PWM was detected, an average of 7754 (minimum: 5 - maximum: 343500) Hz was measured. | |||
* ... smaller is better
| PCMark 8 Home Score Accelerated v2 | 3223 points | |
| PCMark 8 Creative Score Accelerated v2 | 4072 points | |
| PCMark 8 Work Score Accelerated v2 | 4343 points | |
Help | ||
| Dell Inspiron 13 7386 SanDisk Z400s 256 GB M.2 2280 | Acer Aspire R13 R7-372T-746N Lite-On CV1-8B256 | Dell Inspiron 13-7348 Samsung PM851 Series MZMTE256HMHP | HP Spectre 13-4001ng x360 ADATA AXNS381E-256GM-B | Lenovo Yoga 900-13ISK 80MK Samsung SSD PM871 MZNLN512HCJH | Microsoft Surface Book Core i7 Samsung MZFLV512 NVMe | |
|---|---|---|---|---|---|---|
| CrystalDiskMark 3.0 | 27% | 22% | 22% | 37% | 120% | |
| Read Seq (MB/s) | 493.5 | 507 3% | 514 4% | 475.6 -4% | 514 4% | 953 93% |
| Write Seq (MB/s) | 329.4 | 354.4 8% | 268 -19% | 288.6 -12% | 459.5 39% | 592 80% |
| Read 512 (MB/s) | 289.8 | 355.3 23% | 411.8 42% | 322.9 11% | 413.4 43% | 520 79% |
| Write 512 (MB/s) | 304.1 | 353.9 16% | 268.6 -12% | 285.2 -6% | 424.5 40% | 591 94% |
| Read 4k (MB/s) | 19.62 | 32.66 66% | 26.94 37% | 31.87 62% | 36.34 85% | 42.66 117% |
| Write 4k (MB/s) | 72.3 | 81.6 13% | 74.5 3% | 102.7 42% | 100.1 38% | 136.3 89% |
| Read 4k QD32 (MB/s) | 147.8 | 277.6 88% | 325.9 121% | 276.7 87% | 313.8 112% | 615 316% |
| Write 4k QD32 (MB/s) | 268 | 261.2 -3% | 266.7 0% | 261.6 -2% | 96.8 -64% | 517 93% |

| 3DMark 11 | |
| 1280x720 Performance GPU (sort by value) | |
| Dell Inspiron 13 7386 | |
| Acer TravelMate P278-MG-76L2 | |
| Toshiba Tecra Z40-C-11F | |
| Dell Latitude 3470 N2P7L347014EMEA | |
| Fujitsu Lifebook E544 | |
| Asus Transformer Book T300LA-C4006H | |
| 1280x720 Performance Combined (sort by value) | |
| Dell Inspiron 13 7386 | |
| Acer TravelMate P278-MG-76L2 | |
| Toshiba Tecra Z40-C-11F | |
| Dell Latitude 3470 N2P7L347014EMEA | |
| Fujitsu Lifebook E544 | |
| Asus Transformer Book T300LA-C4006H | |
| 3DMark | |
| 1280x720 Cloud Gate Standard Graphics (sort by value) | |
| Dell Inspiron 13 7386 | |
| Acer TravelMate P278-MG-76L2 | |
| Toshiba Tecra Z40-C-11F | |
| Dell Latitude 3470 N2P7L347014EMEA | |
| Fujitsu Lifebook E544 | |
| Asus Transformer Book T300LA-C4006H | |
| 1920x1080 Fire Strike Graphics (sort by value) | |
| Dell Inspiron 13 7386 | |
| Acer TravelMate P278-MG-76L2 | |
| Toshiba Tecra Z40-C-11F | |
| Dell Latitude 3470 N2P7L347014EMEA | |
| Asus Transformer Book T300LA-C4006H | |
| 1920x1080 Ice Storm Extreme Graphics (sort by value) | |
| Dell Inspiron 13 7386 | |
| Acer TravelMate P278-MG-76L2 | |
| Toshiba Tecra Z40-C-11F | |
| Dell Latitude 3470 N2P7L347014EMEA | |
| 3DMark 11 Performance | 1615 points | |
| 3DMark Ice Storm Standard Score | 55696 points | |
| 3DMark Cloud Gate Standard Score | 5941 points | |
| 3DMark Fire Strike Score | 882 points | |
| 3DMark Fire Strike Extreme Score | 401 points | |
Help | ||
| BioShock Infinite | |
| 1366x768 Medium Preset | |
| Acer TravelMate P278-MG-76L2 | |
| Intel NUC6i5SYH | |
| Dell Inspiron 13 7386 | |
| Dell Latitude 3470 N2P7L347014EMEA | |
| Lenovo B50-70 MCC2GGE | |
| Fujitsu Lifebook E544 | |
| 1366x768 High Preset | |
| Acer TravelMate P278-MG-76L2 | |
| Intel NUC6i5SYH | |
| Dell Inspiron 13 7386 | |
| Dell Latitude 3470 N2P7L347014EMEA | |
| Lenovo B50-70 MCC2GGE | |
| Fujitsu Lifebook E544 | |
| low | med. | high | ultra | |
|---|---|---|---|---|
| StarCraft II: Heart of the Swarm (2013) | 156.2 | 52.5 | 35.5 | 18.4 |
| BioShock Infinite (2013) | 31.3 | 19.5 | 16.7 | 7.1 |
| Overwatch (2016) | 34.1 | 24.8 | 15.8 |
Noise level
| Idle |
| 29.4 / 29.4 / 29.4 dB(A) |
| Load |
| 32.2 / 35 dB(A) |
 | ||
30 dB silent 40 dB(A) audible 50 dB(A) loud |
||
min: | ||
| Dell Inspiron 13 7386 HD Graphics 520, 6200U, SanDisk Z400s 256 GB M.2 2280 | Acer Aspire R13 R7-372T-746N HD Graphics 520, 6500U, Lite-On CV1-8B256 | Dell Inspiron 13-7348 HD Graphics 5500, 5500U, Samsung PM851 Series MZMTE256HMHP | HP Spectre x360 13-4104ng HD Graphics 520, 6200U, Samsung SSD PM851 256 GB MZNTE256HMHP | Lenovo Yoga 900-13ISK 80MK HD Graphics 520, 6500U, Samsung SSD PM871 MZNLN512HCJH | Microsoft Surface Book Core i7 Maxwell GPU (940M, GDDR5), 6600U, Samsung MZFLV512 NVMe | |
|---|---|---|---|---|---|---|
| Noise | -10% | -6% | -7% | -3% | -10% | |
| off / environment * (dB) | 29.4 | 31.3 -6% | 31.3 -6% | |||
| Idle Minimum * (dB) | 29.4 | 31.3 -6% | 29.6 -1% | 29.6 -1% | 29.7 -1% | 31.3 -6% |
| Idle Average * (dB) | 29.4 | 31.3 -6% | 29.6 -1% | 29.6 -1% | 29.8 -1% | 31.3 -6% |
| Idle Maximum * (dB) | 29.4 | 31.8 -8% | 29.6 -1% | 34.6 -18% | 30 -2% | 31.3 -6% |
| Load Average * (dB) | 32.2 | 39.2 -22% | 35.4 -10% | 34.7 -8% | 32 1% | 38 -18% |
| Load Maximum * (dB) | 35 | 39.1 -12% | 41.4 -18% | 37.9 -8% | 38.5 -10% | 40.5 -16% |
* ... smaller is better
(±) The maximum temperature on the upper side is 43.2 °C / 110 F, compared to the average of 35.4 °C / 96 F, ranging from 19.6 to 60 °C for the class Convertible.
(-) The bottom heats up to a maximum of 45.2 °C / 113 F, compared to the average of 36.9 °C / 98 F
(+) In idle usage, the average temperature for the upper side is 26.3 °C / 79 F, compared to the device average of 30.3 °C / 87 F.
(+) The palmrests and touchpad are reaching skin temperature as a maximum (33.6 °C / 92.5 F) and are therefore not hot.
(-) The average temperature of the palmrest area of similar devices was 28 °C / 82.4 F (-5.6 °C / -10.1 F).
| Off / Standby | |
| Idle | |
| Load |
|
Key:
min: | |
| Dell Inspiron 13 7386 6200U, HD Graphics 520, SanDisk Z400s 256 GB M.2 2280, IPS, 1920x1080, 13.3" | Acer Aspire R13 R7-372T-746N 6500U, HD Graphics 520, Lite-On CV1-8B256, IPS, 2560x1440, 13.3" | Dell Inspiron 13-7348 5500U, HD Graphics 5500, Samsung PM851 Series MZMTE256HMHP, IPS, 1920x1080, 13.3" | HP Spectre x360 13-4104ng 6200U, HD Graphics 520, Samsung SSD PM851 256 GB MZNTE256HMHP, IPS, 2560x1440, 13.3" | HP Spectre 13 6500U, HD Graphics 520, Samsung PM951 NVMe MZVLV256, IPS UWVA, 1920x1080, 13.3" | Microsoft Surface Book Core i7 6600U, Maxwell GPU (940M, GDDR5), Samsung MZFLV512 NVMe, IPS, 3000x2000, 13.5" | |
|---|---|---|---|---|---|---|
| Power Consumption | -37% | 8% | -3% | -50% | -54% | |
| Idle Minimum * (Watt) | 4.6 | 6.2 -35% | 3.5 24% | 3.9 15% | 8.6 -87% | 4.5 2% |
| Idle Average * (Watt) | 7 | 8 -14% | 5.6 20% | 7.4 -6% | 11 -57% | 9.8 -40% |
| Idle Maximum * (Watt) | 7.7 | 11.6 -51% | 7.6 1% | 9.2 -19% | 11.3 -47% | 12.2 -58% |
| Load Average * (Watt) | 24.8 | 40 -61% | 26.3 -6% | 28.1 -13% | 33.8 -36% | 46 -85% |
| Load Maximum * (Watt) | 29.3 | 36.6 -25% | 29 1% | 27.6 6% | 36.2 -24% | 56 -91% |
* ... smaller is better
| Dell Inspiron 13 7386 6200U, HD Graphics 520, 42 Wh | Acer Aspire R13 R7-372T-746N 6500U, HD Graphics 520, 49 Wh | Dell Inspiron 13-7348 5500U, HD Graphics 5500, 43 Wh | HP Spectre x360 13-4104ng 6200U, HD Graphics 520, 56 Wh | Lenovo Yoga 900-13ISK 80MK 6500U, HD Graphics 520, 66 Wh | Microsoft Surface Book Core i5 6300U, Maxwell GPU (940M, GDDR5), 78 Wh | |
|---|---|---|---|---|---|---|
| Battery runtime | -9% | -19% | 32% | 14% | 33% | |
| Reader / Idle (h) | 12.6 | 11.2 -11% | 8.7 -31% | 14.1 12% | 17.8 41% | |
| WiFi v1.3 (h) | 6.3 | 6.4 2% | 8.3 32% | 6.7 6% | 6.7 6% | |
| Load (h) | 1.7 | 1.4 -18% | 1.6 -6% | 2.1 24% | 2.6 53% | |
| WiFi (h) | 6.6 |
Pros
Cons
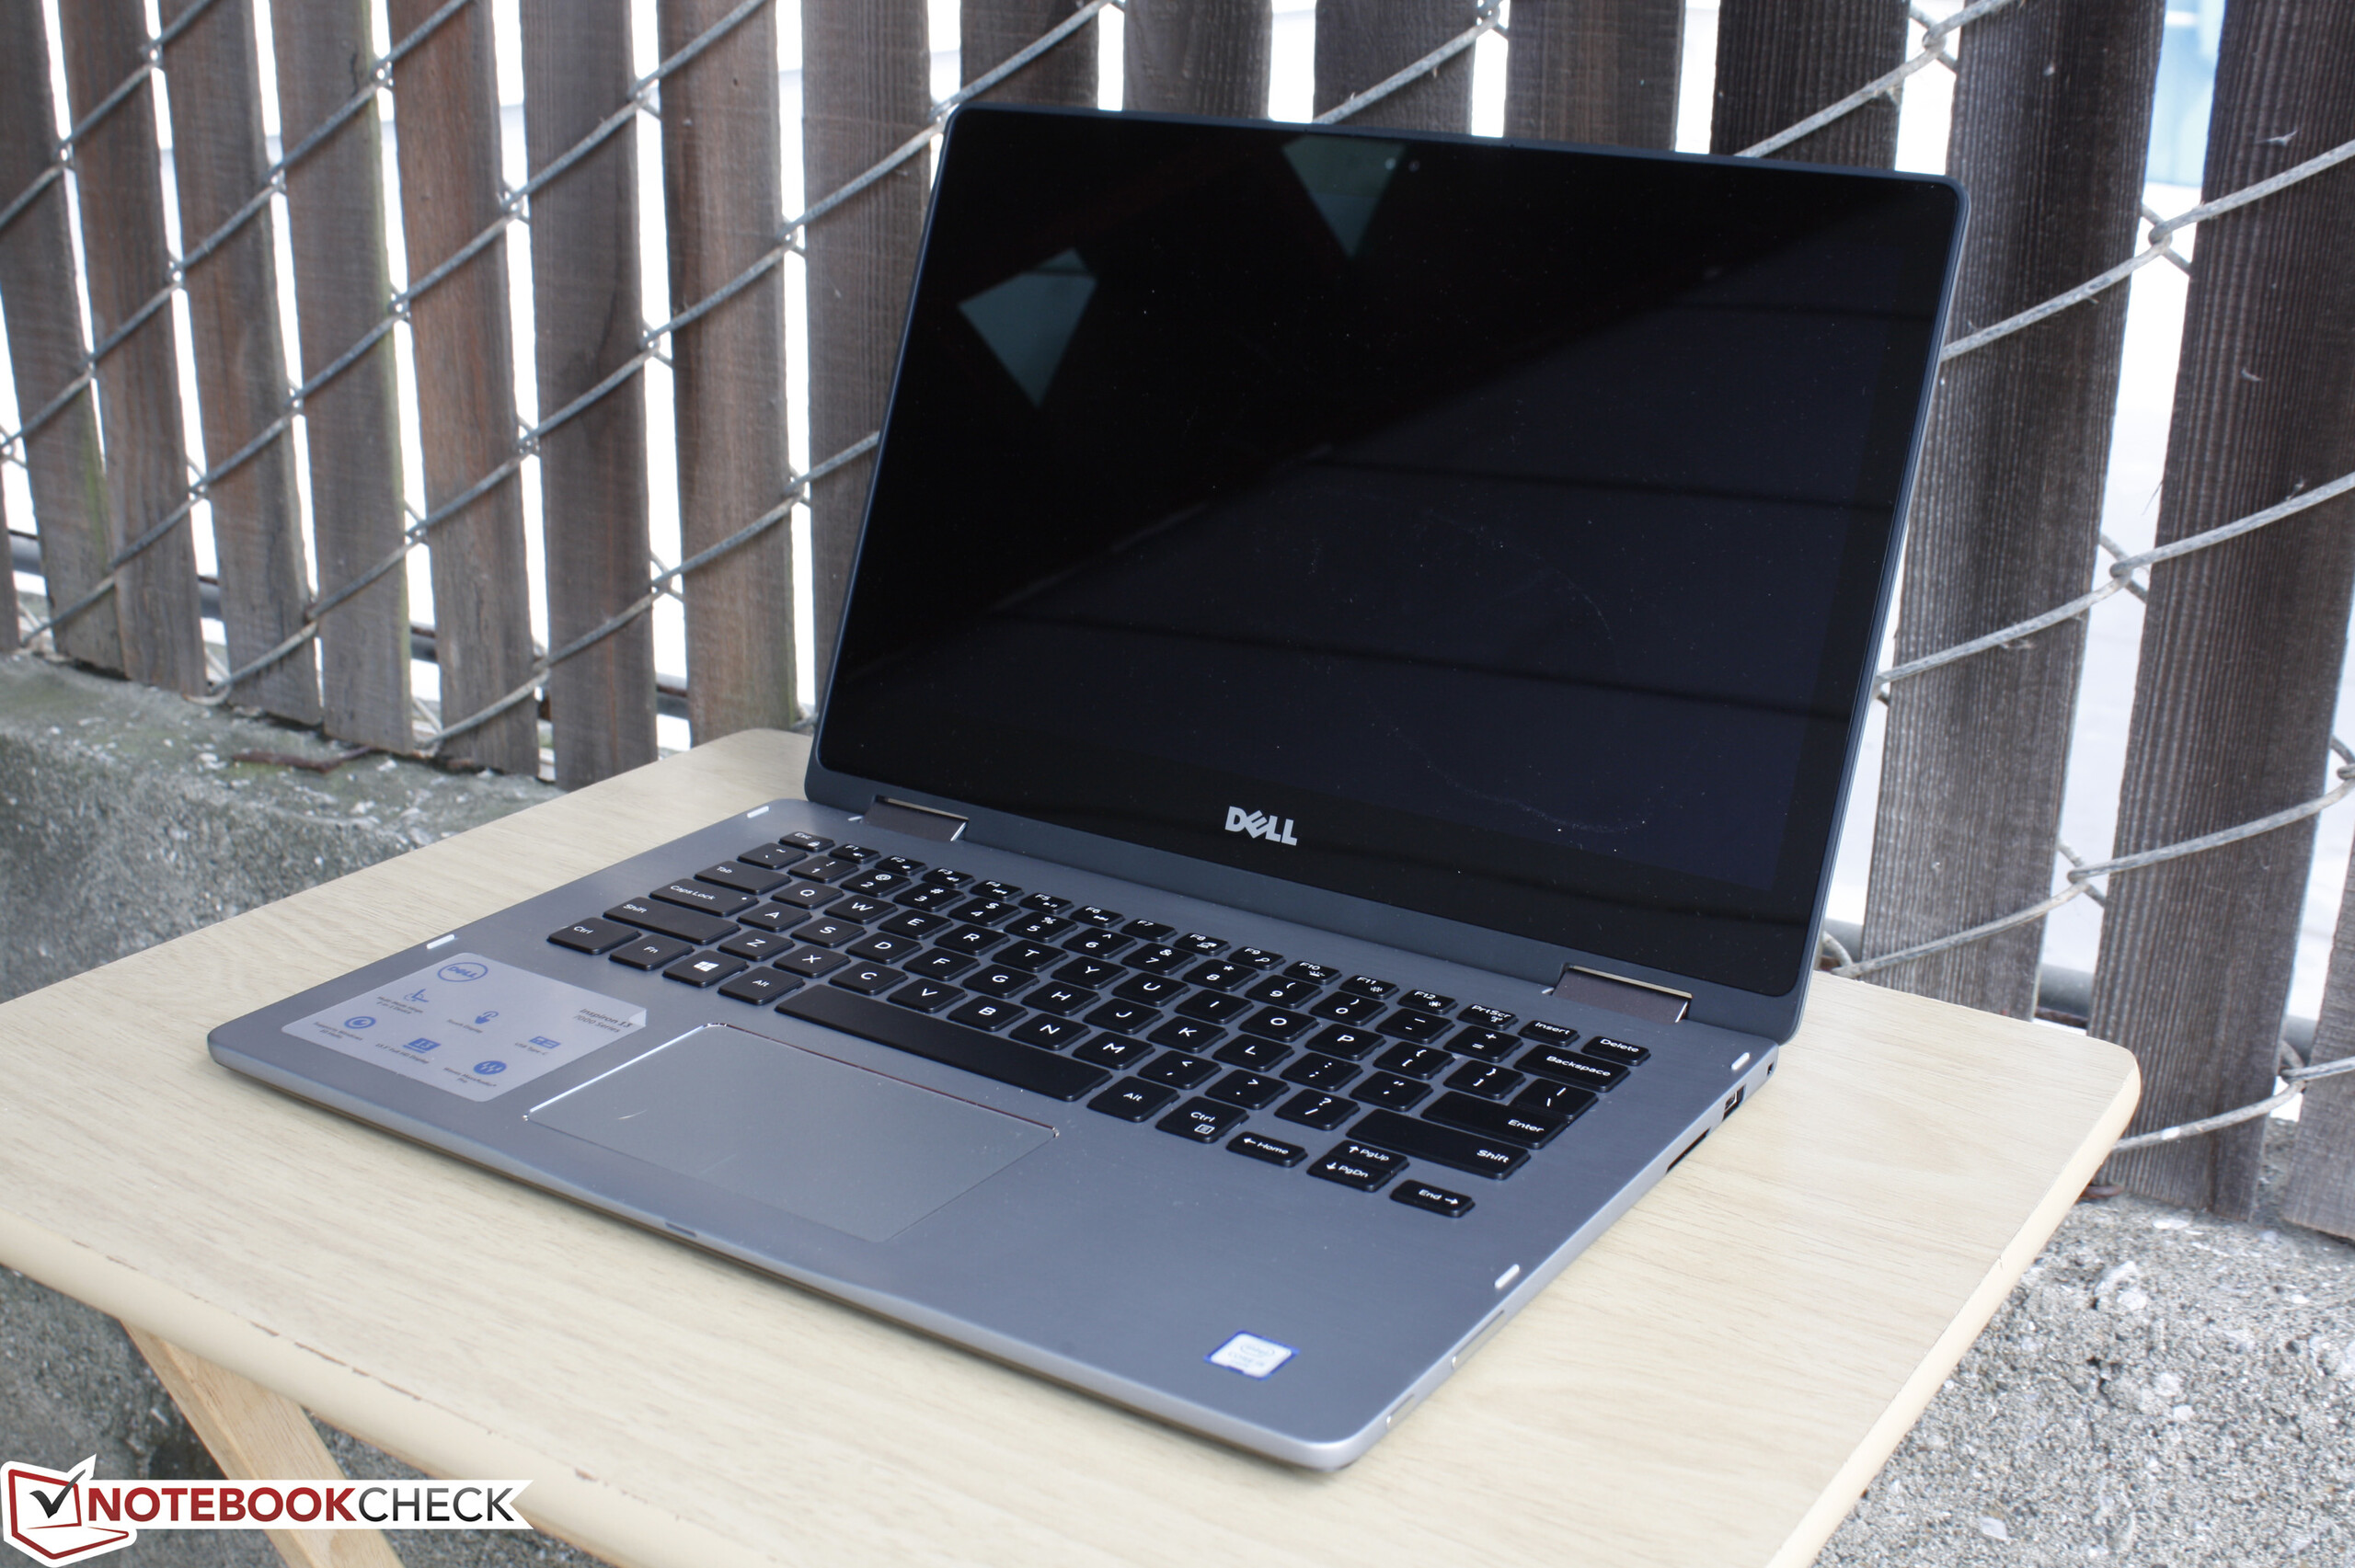
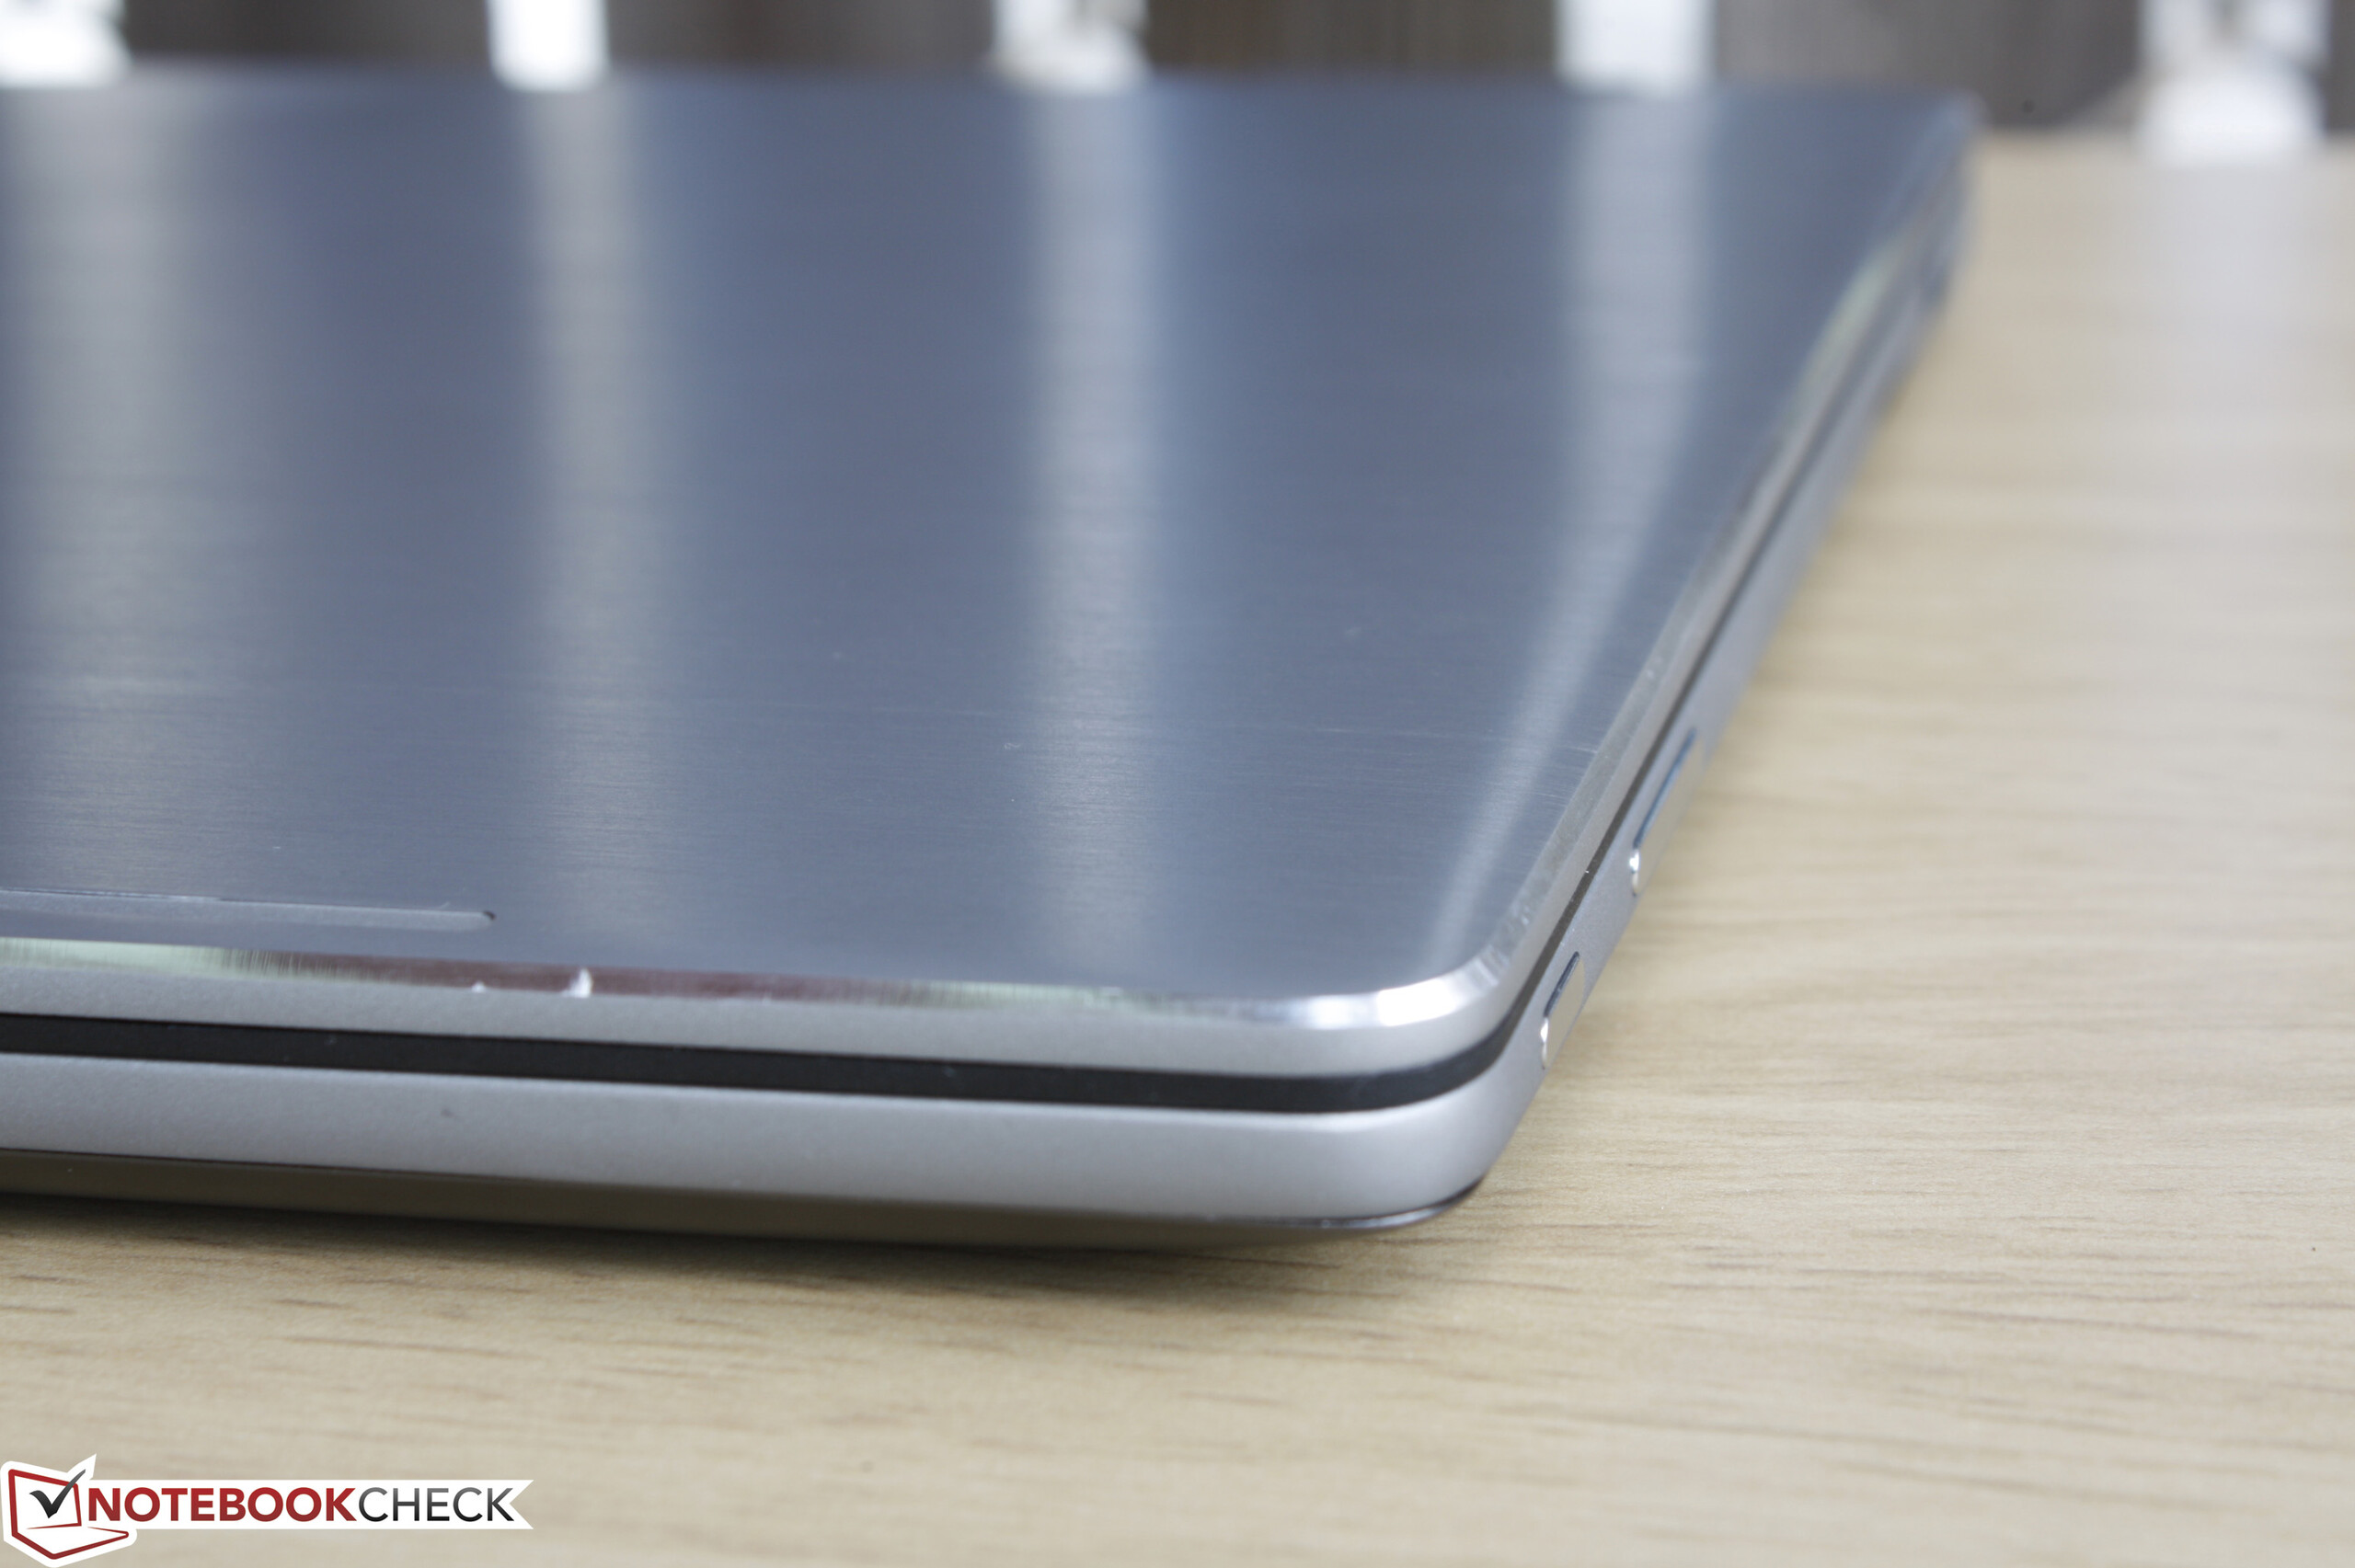
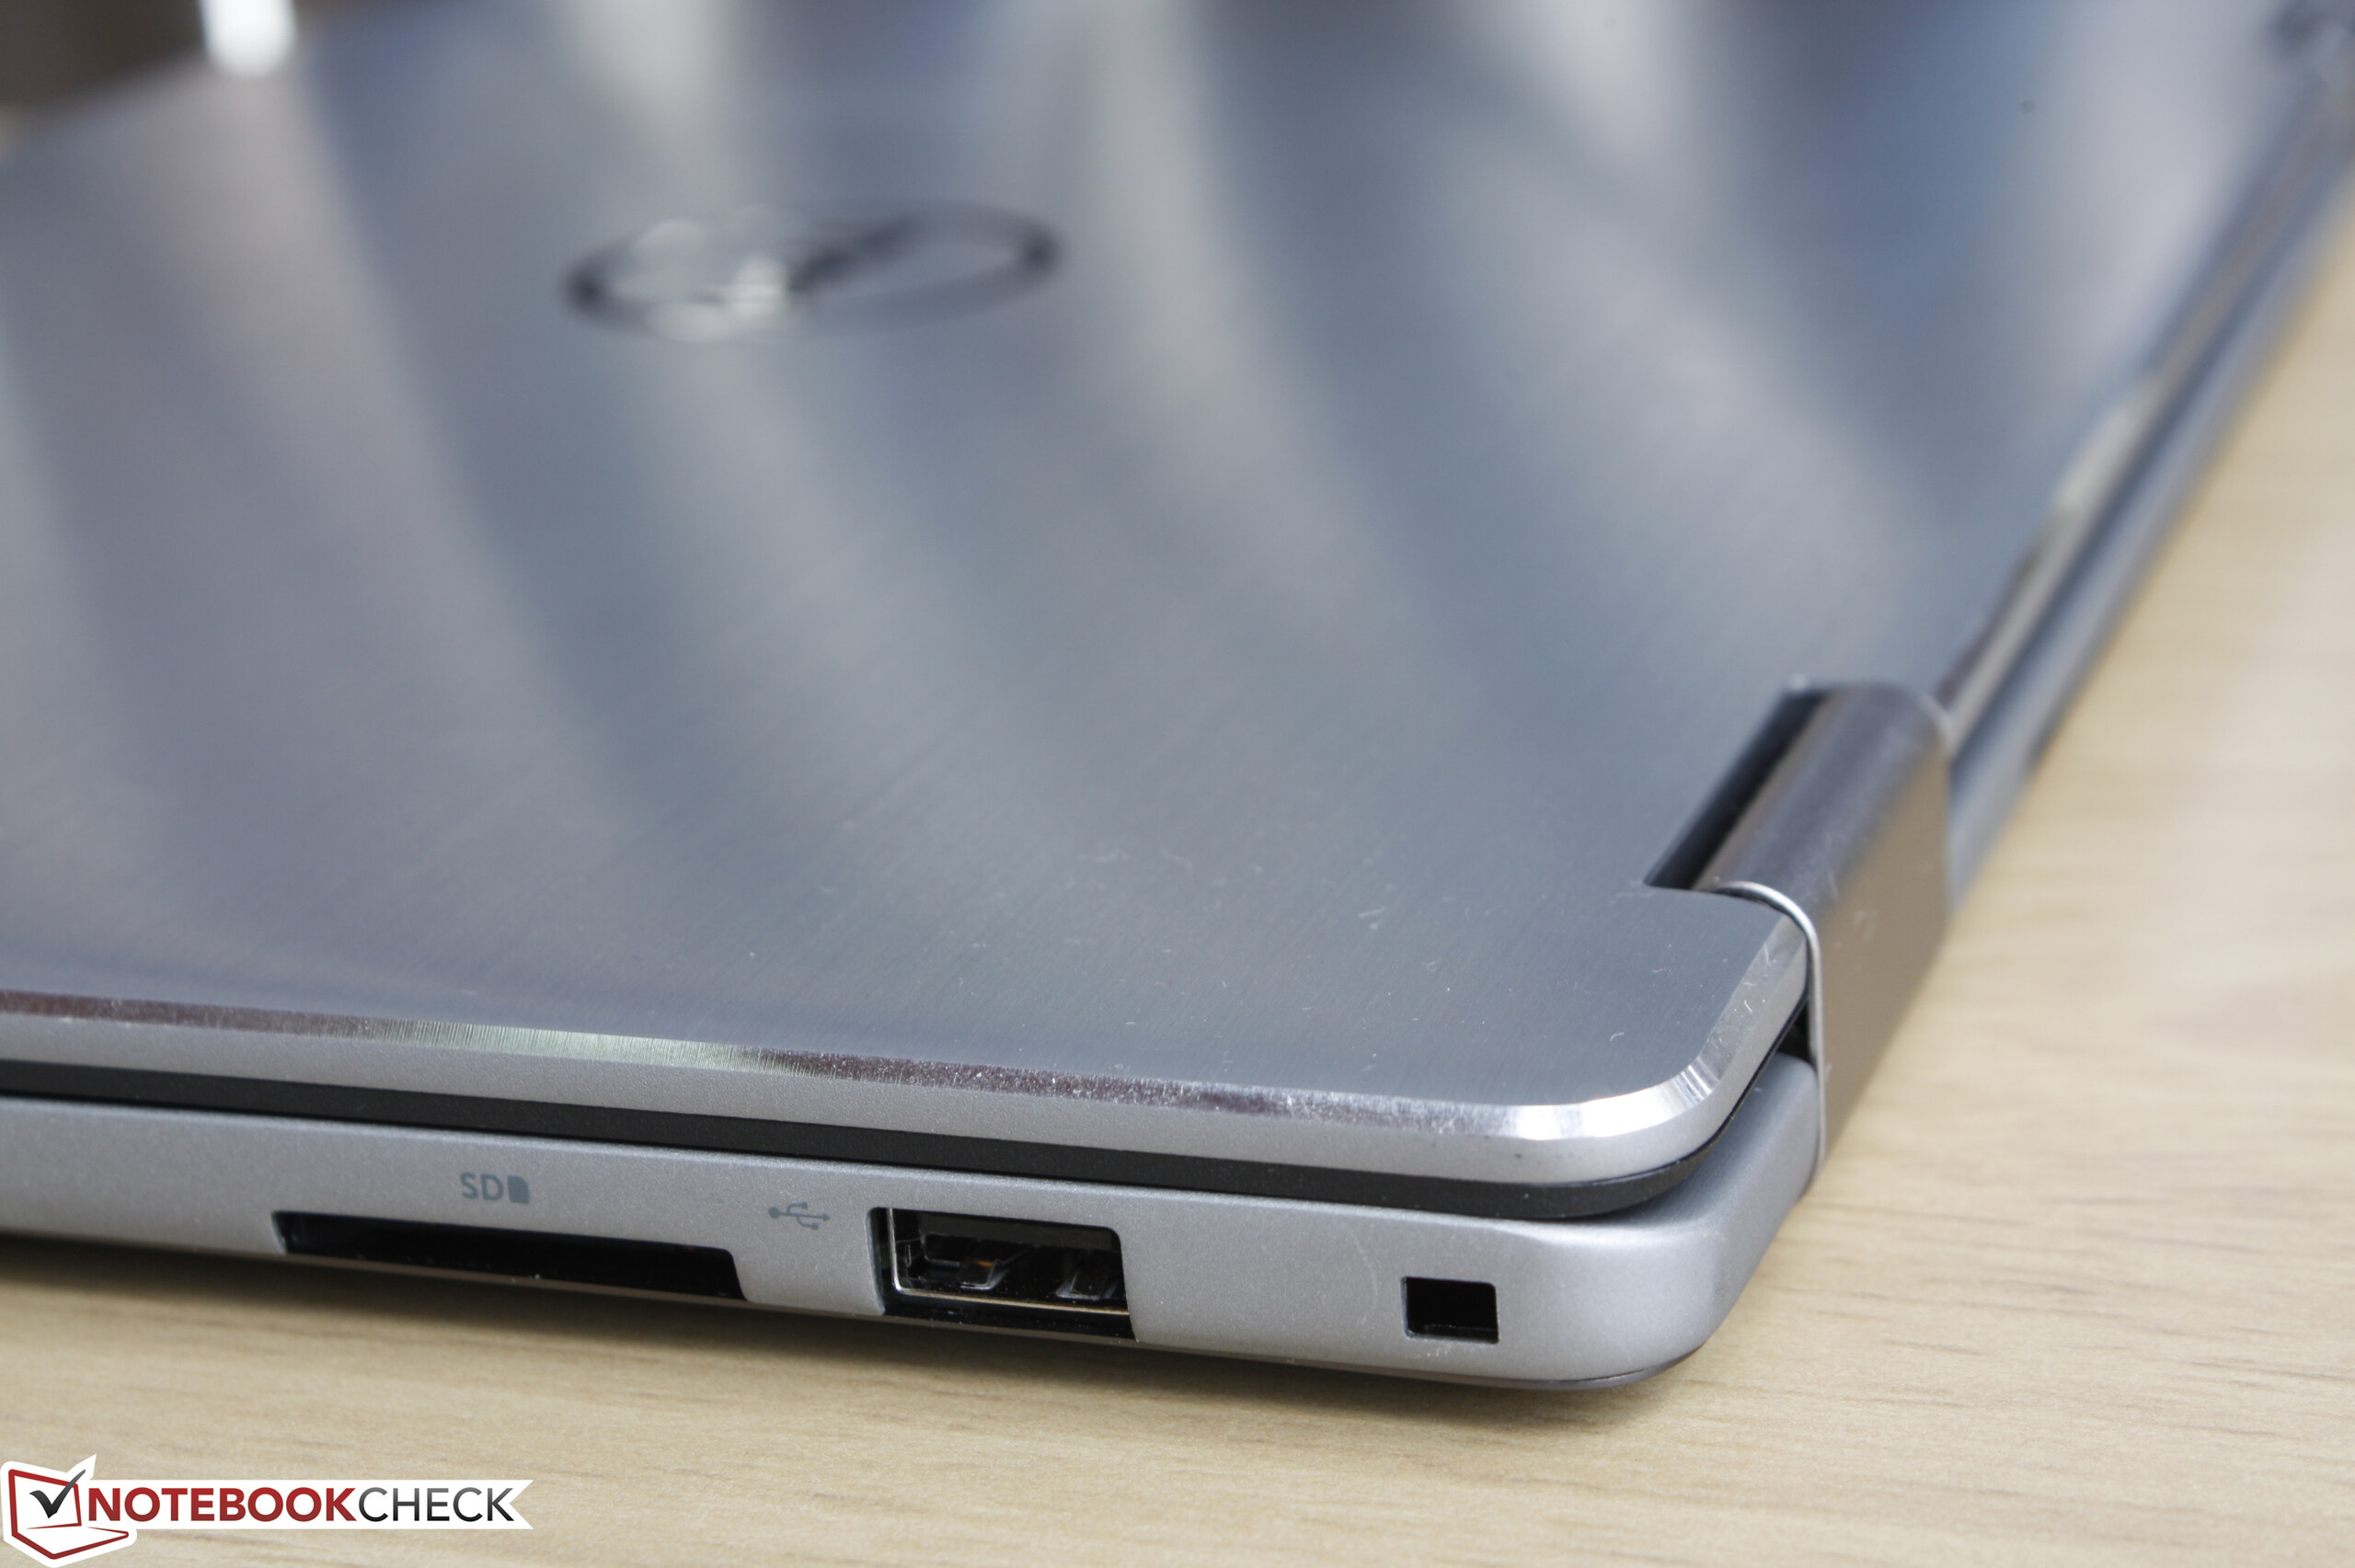
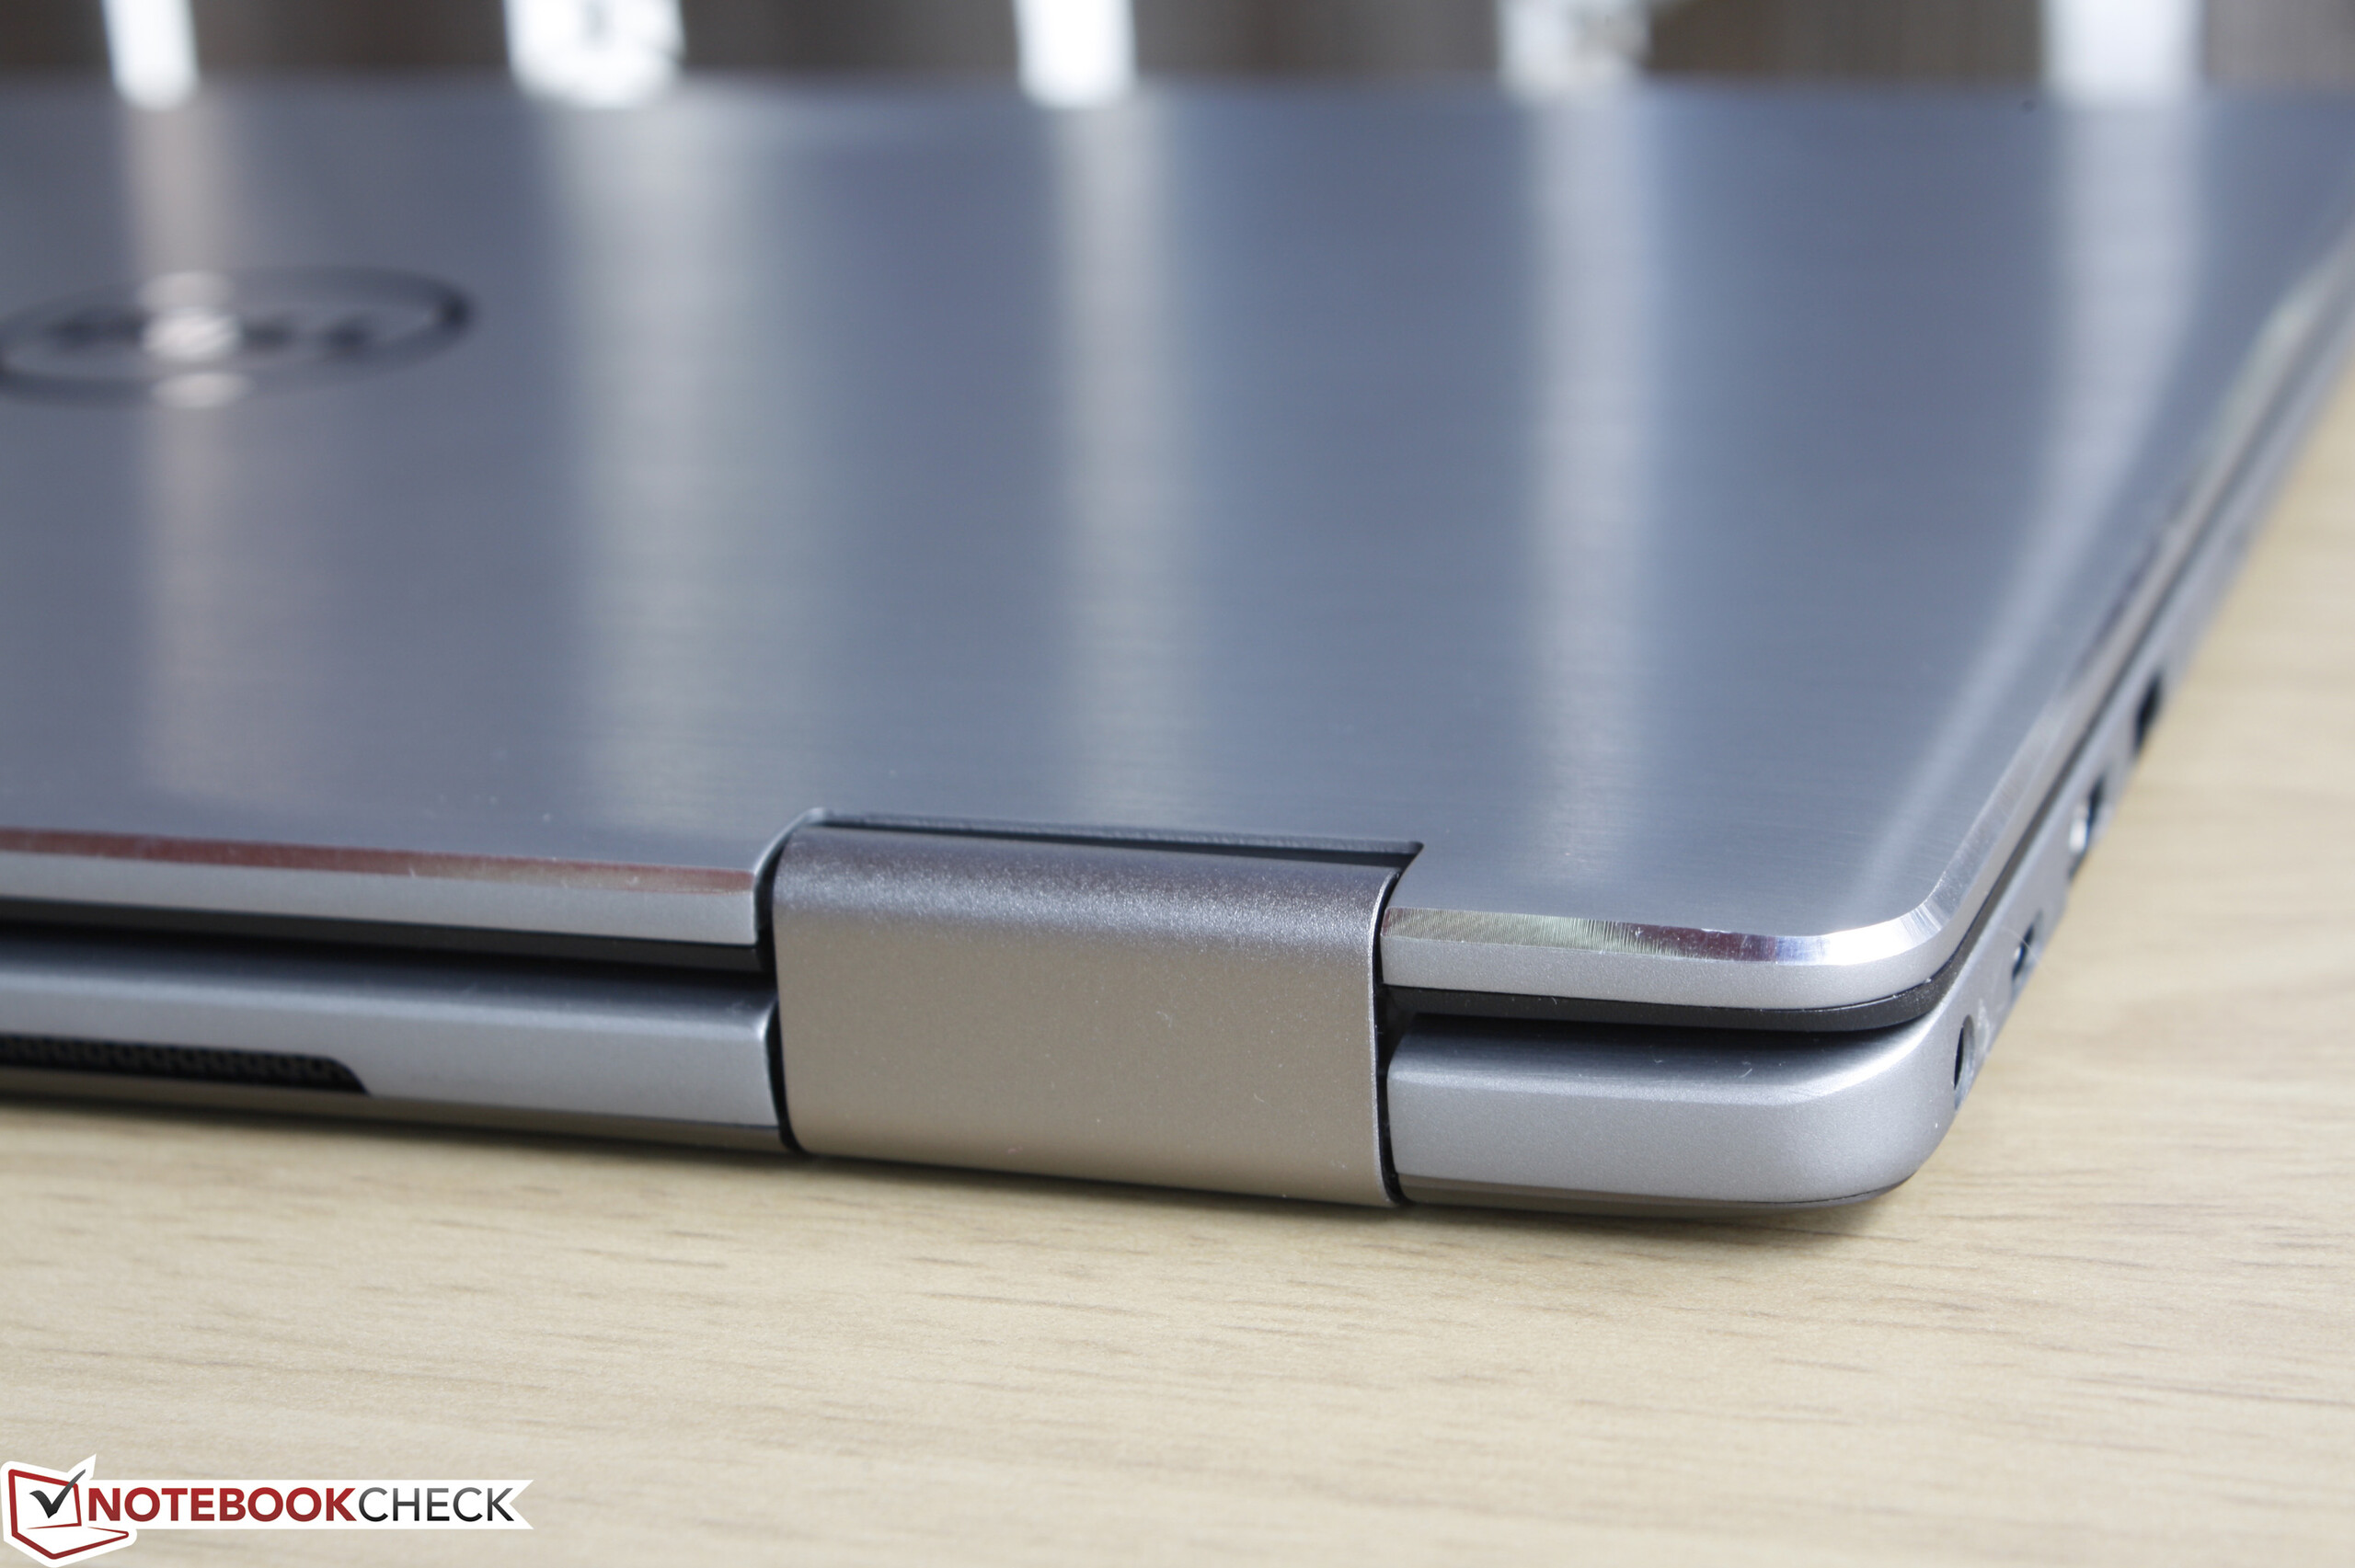
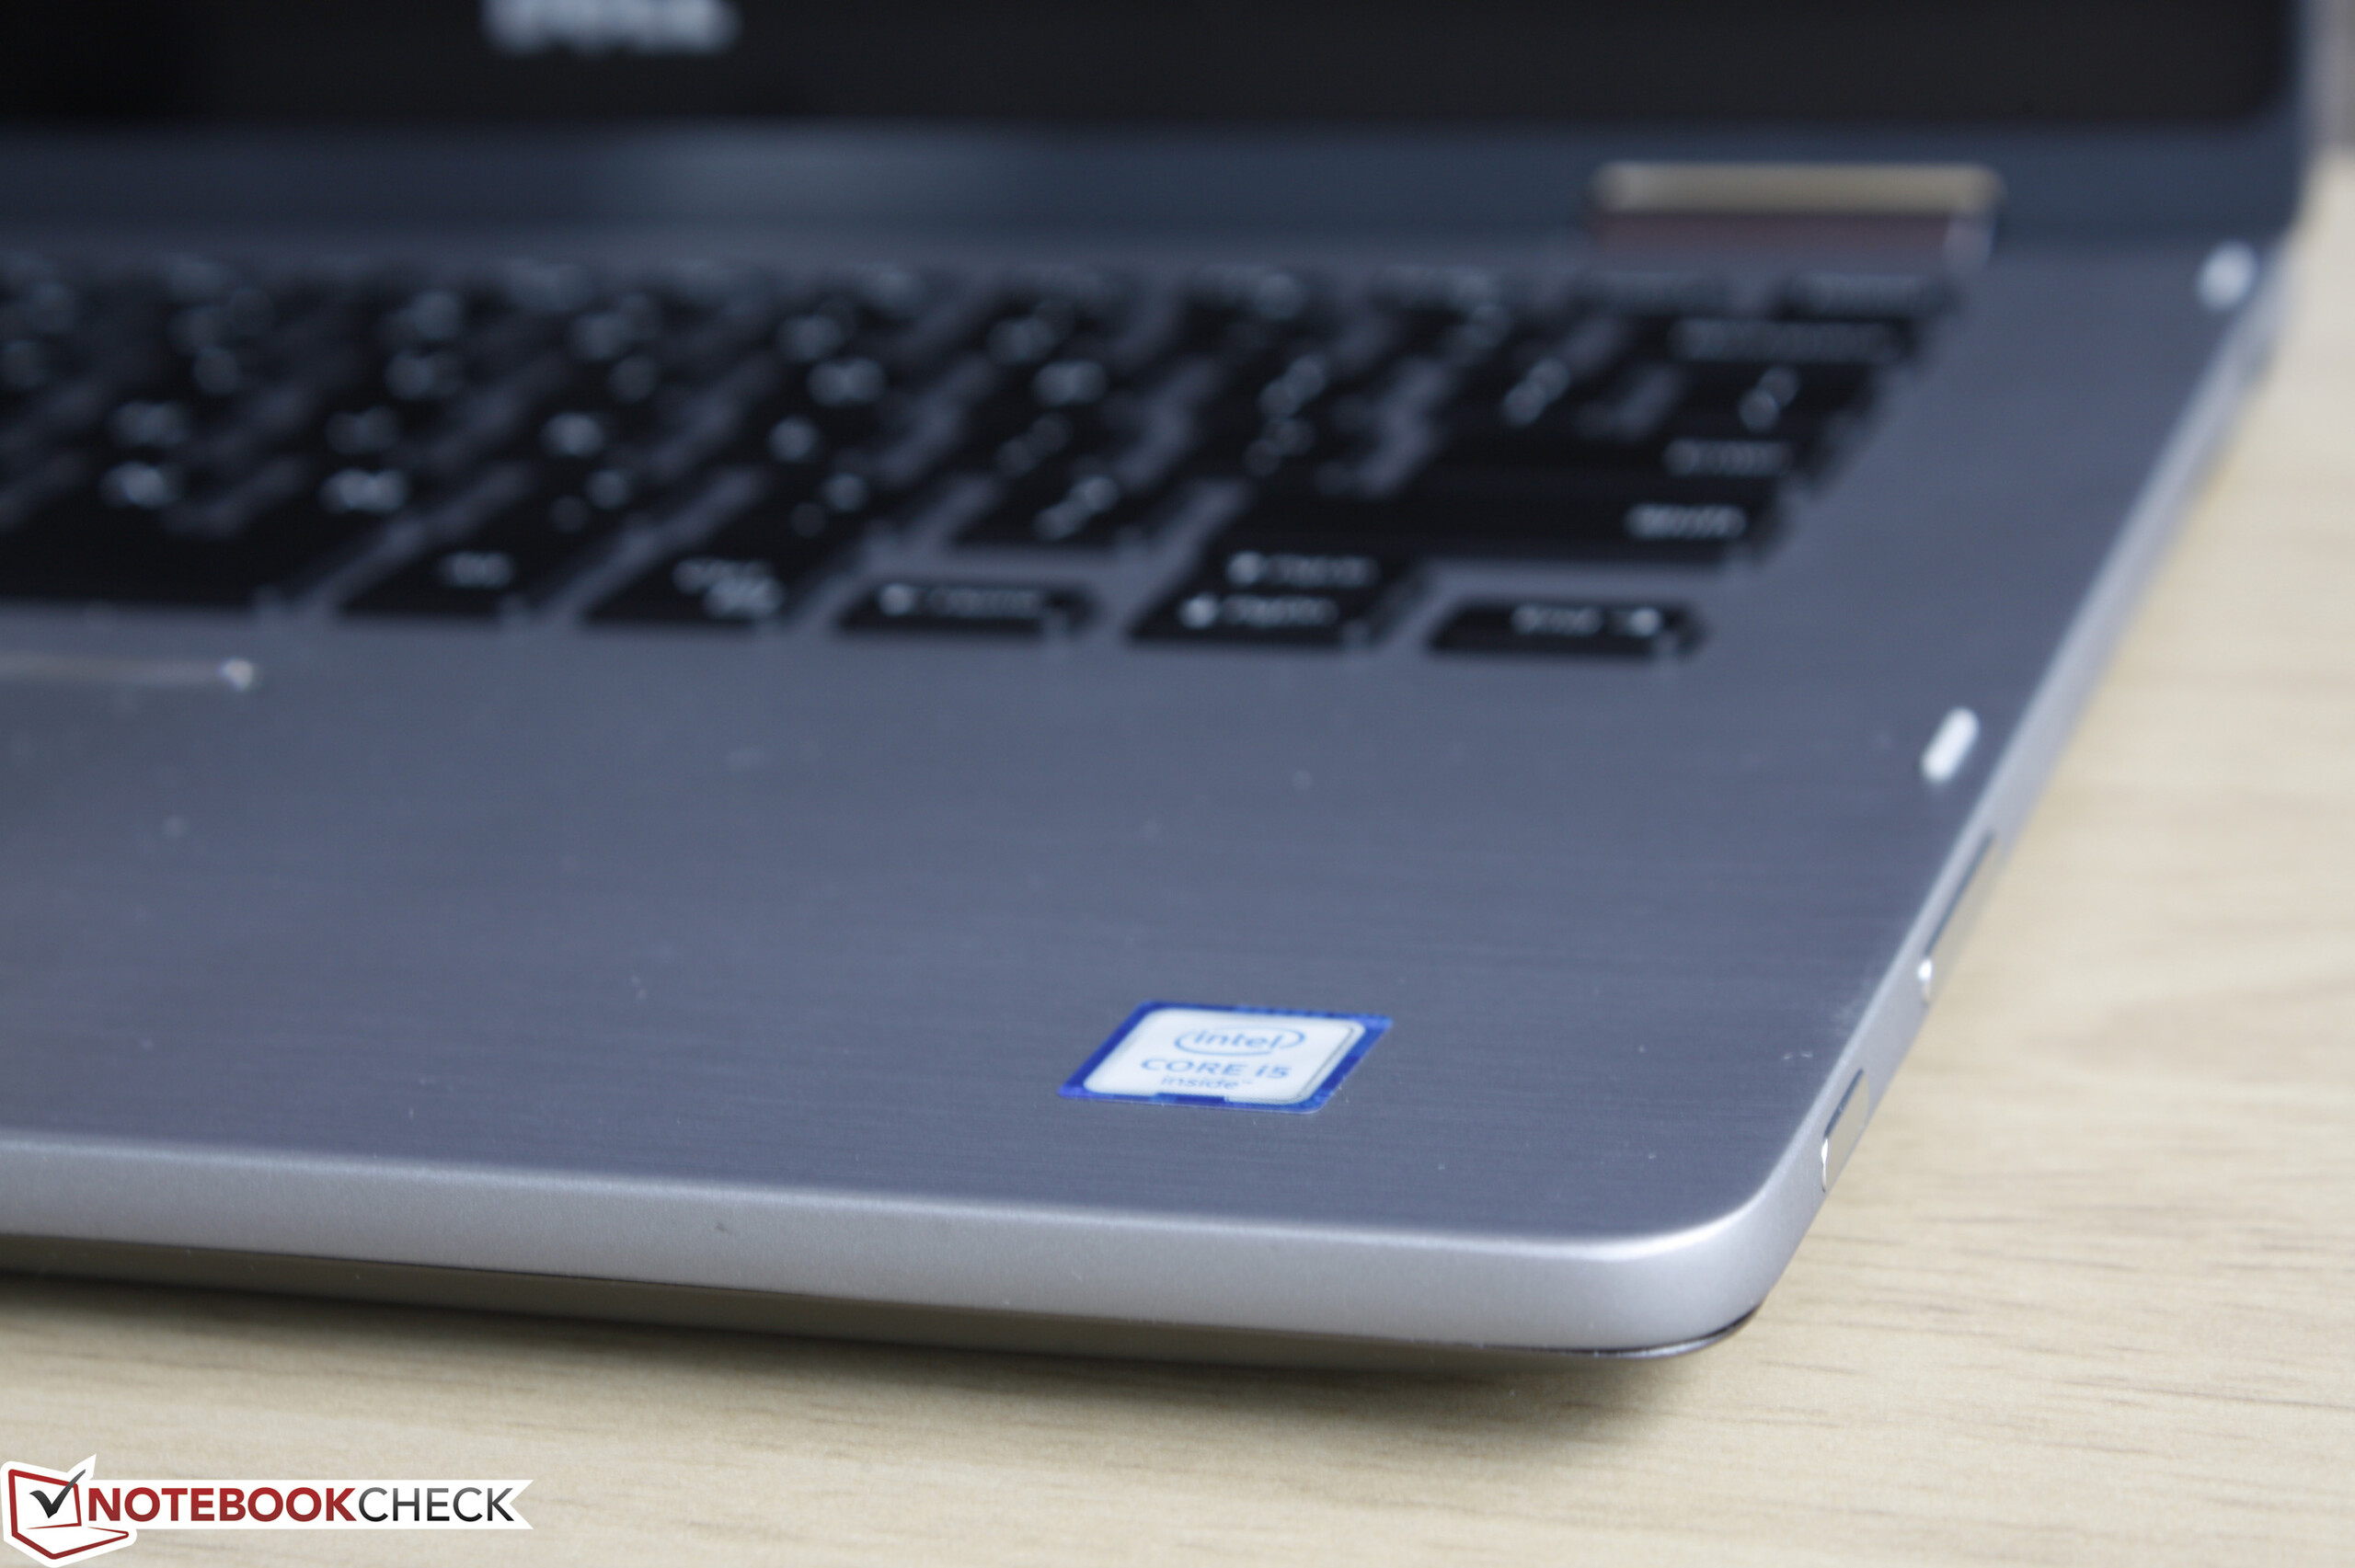
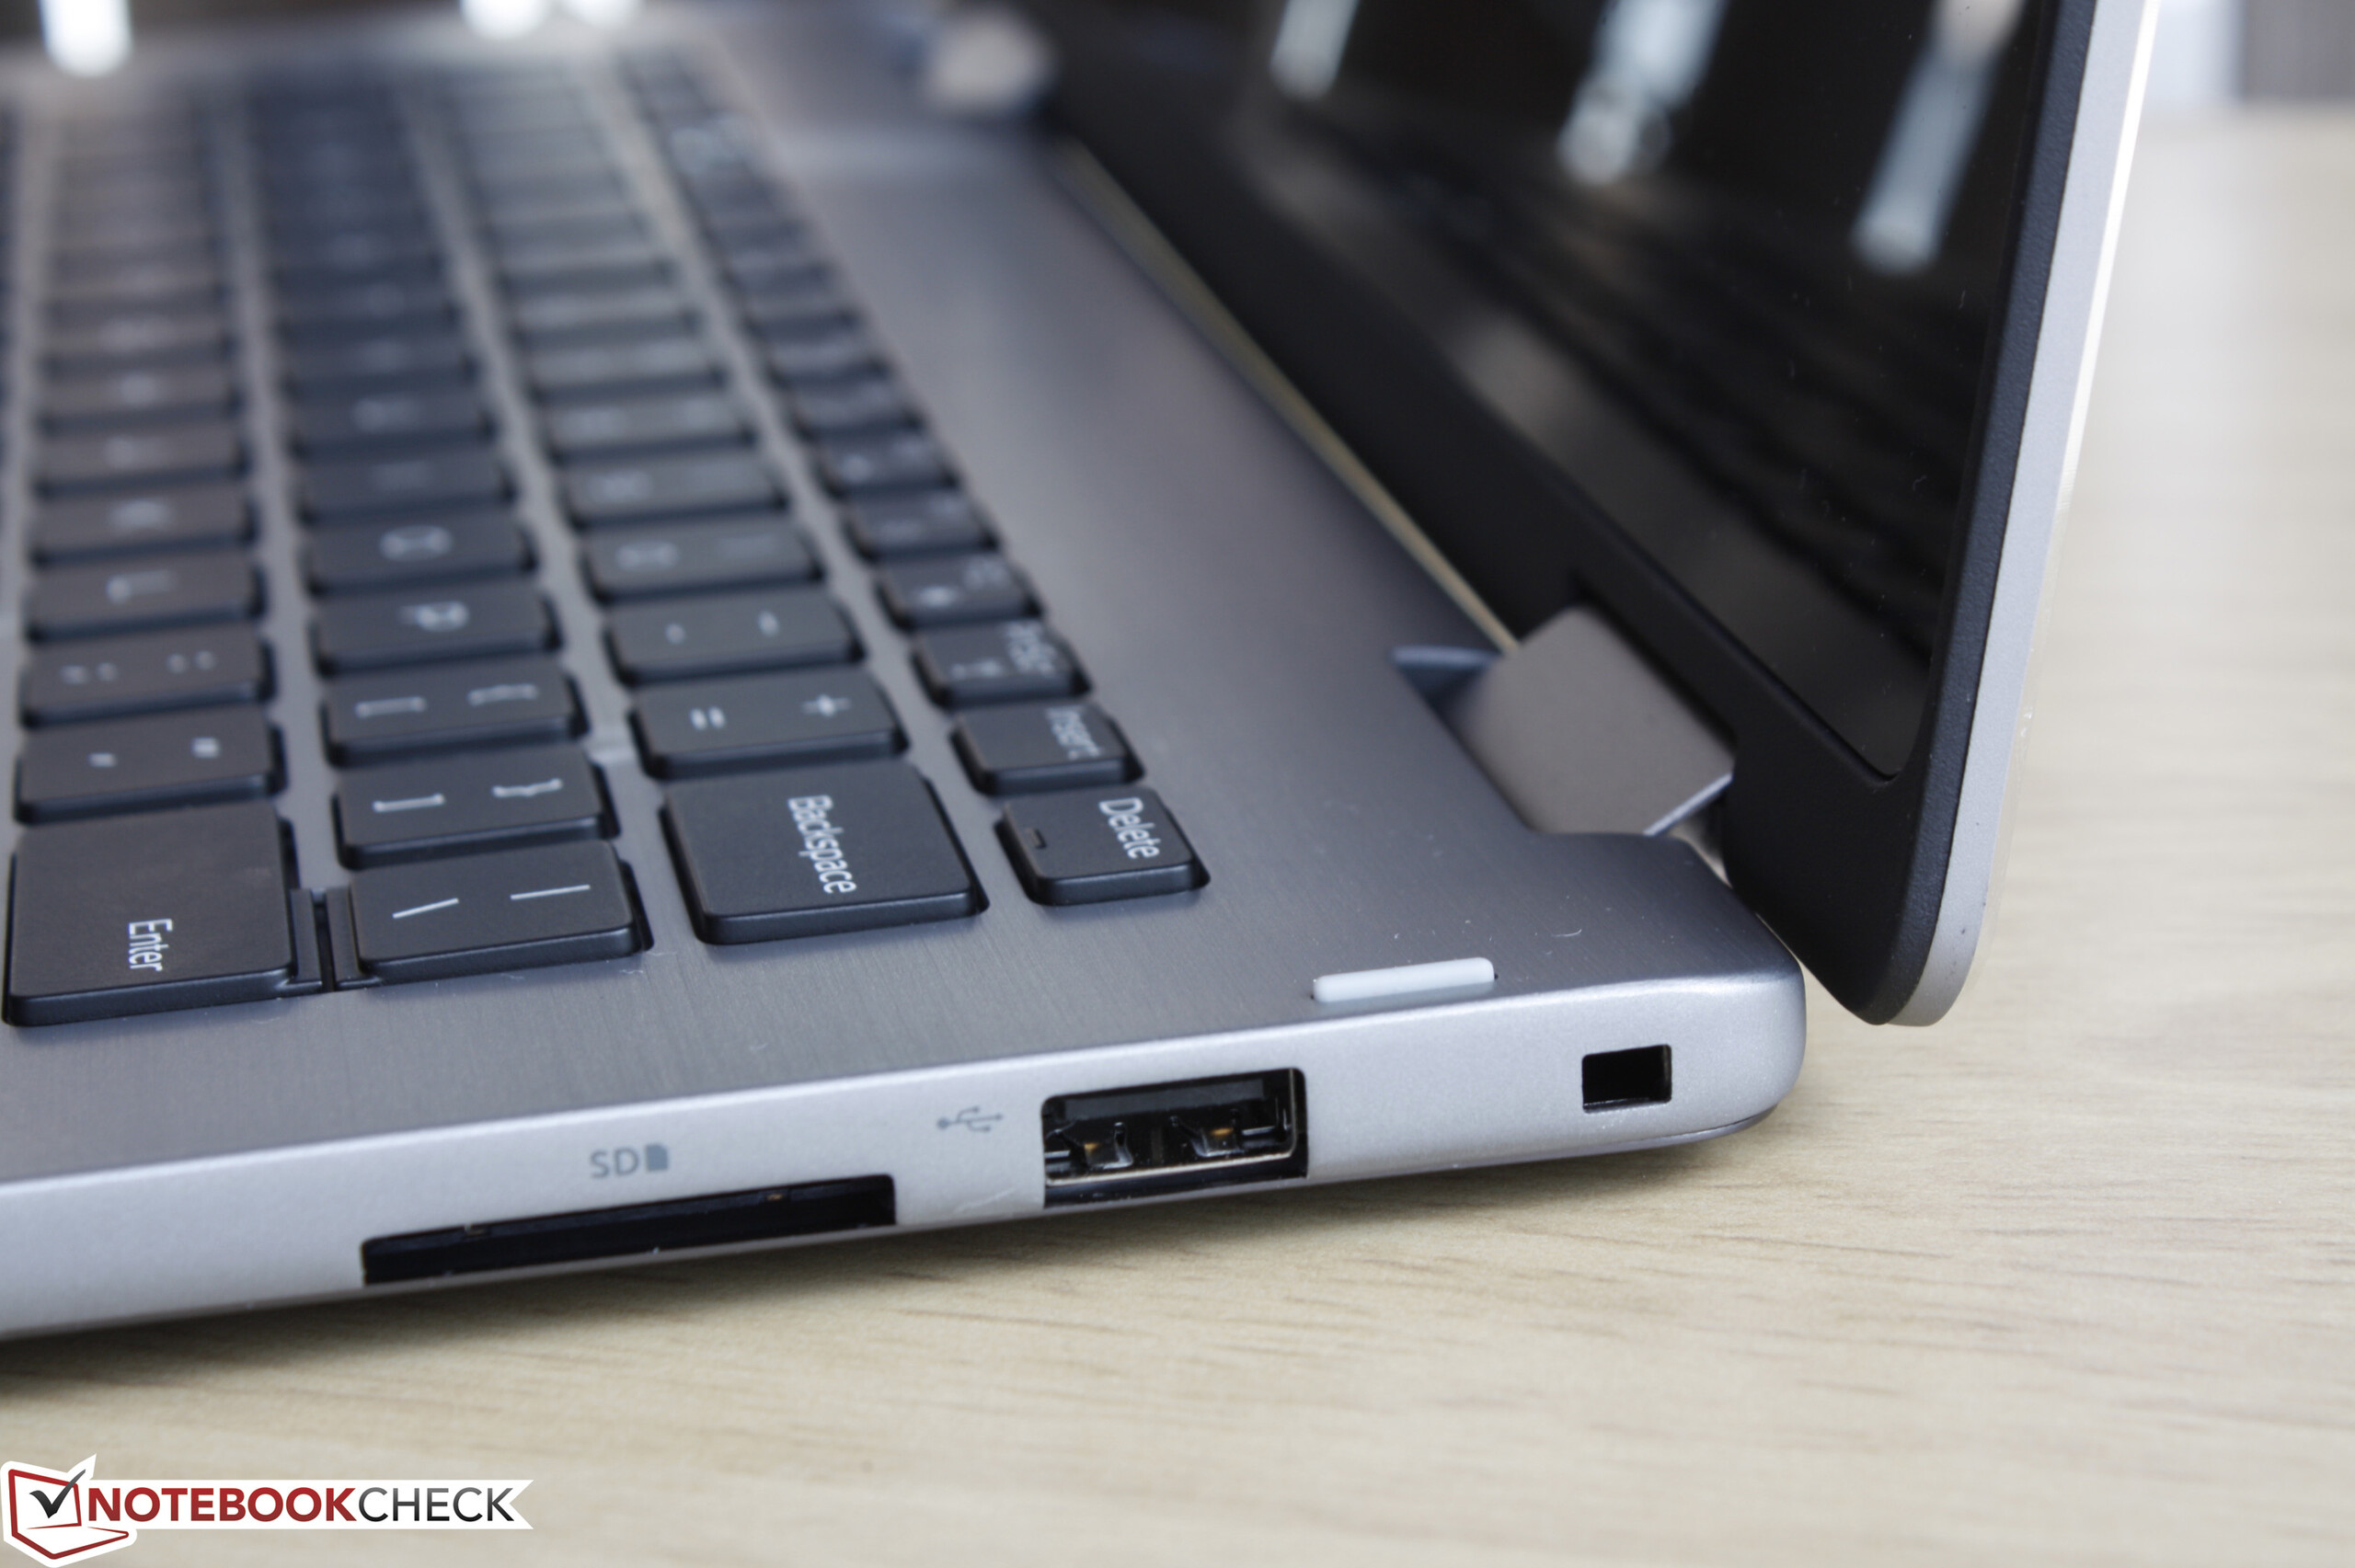
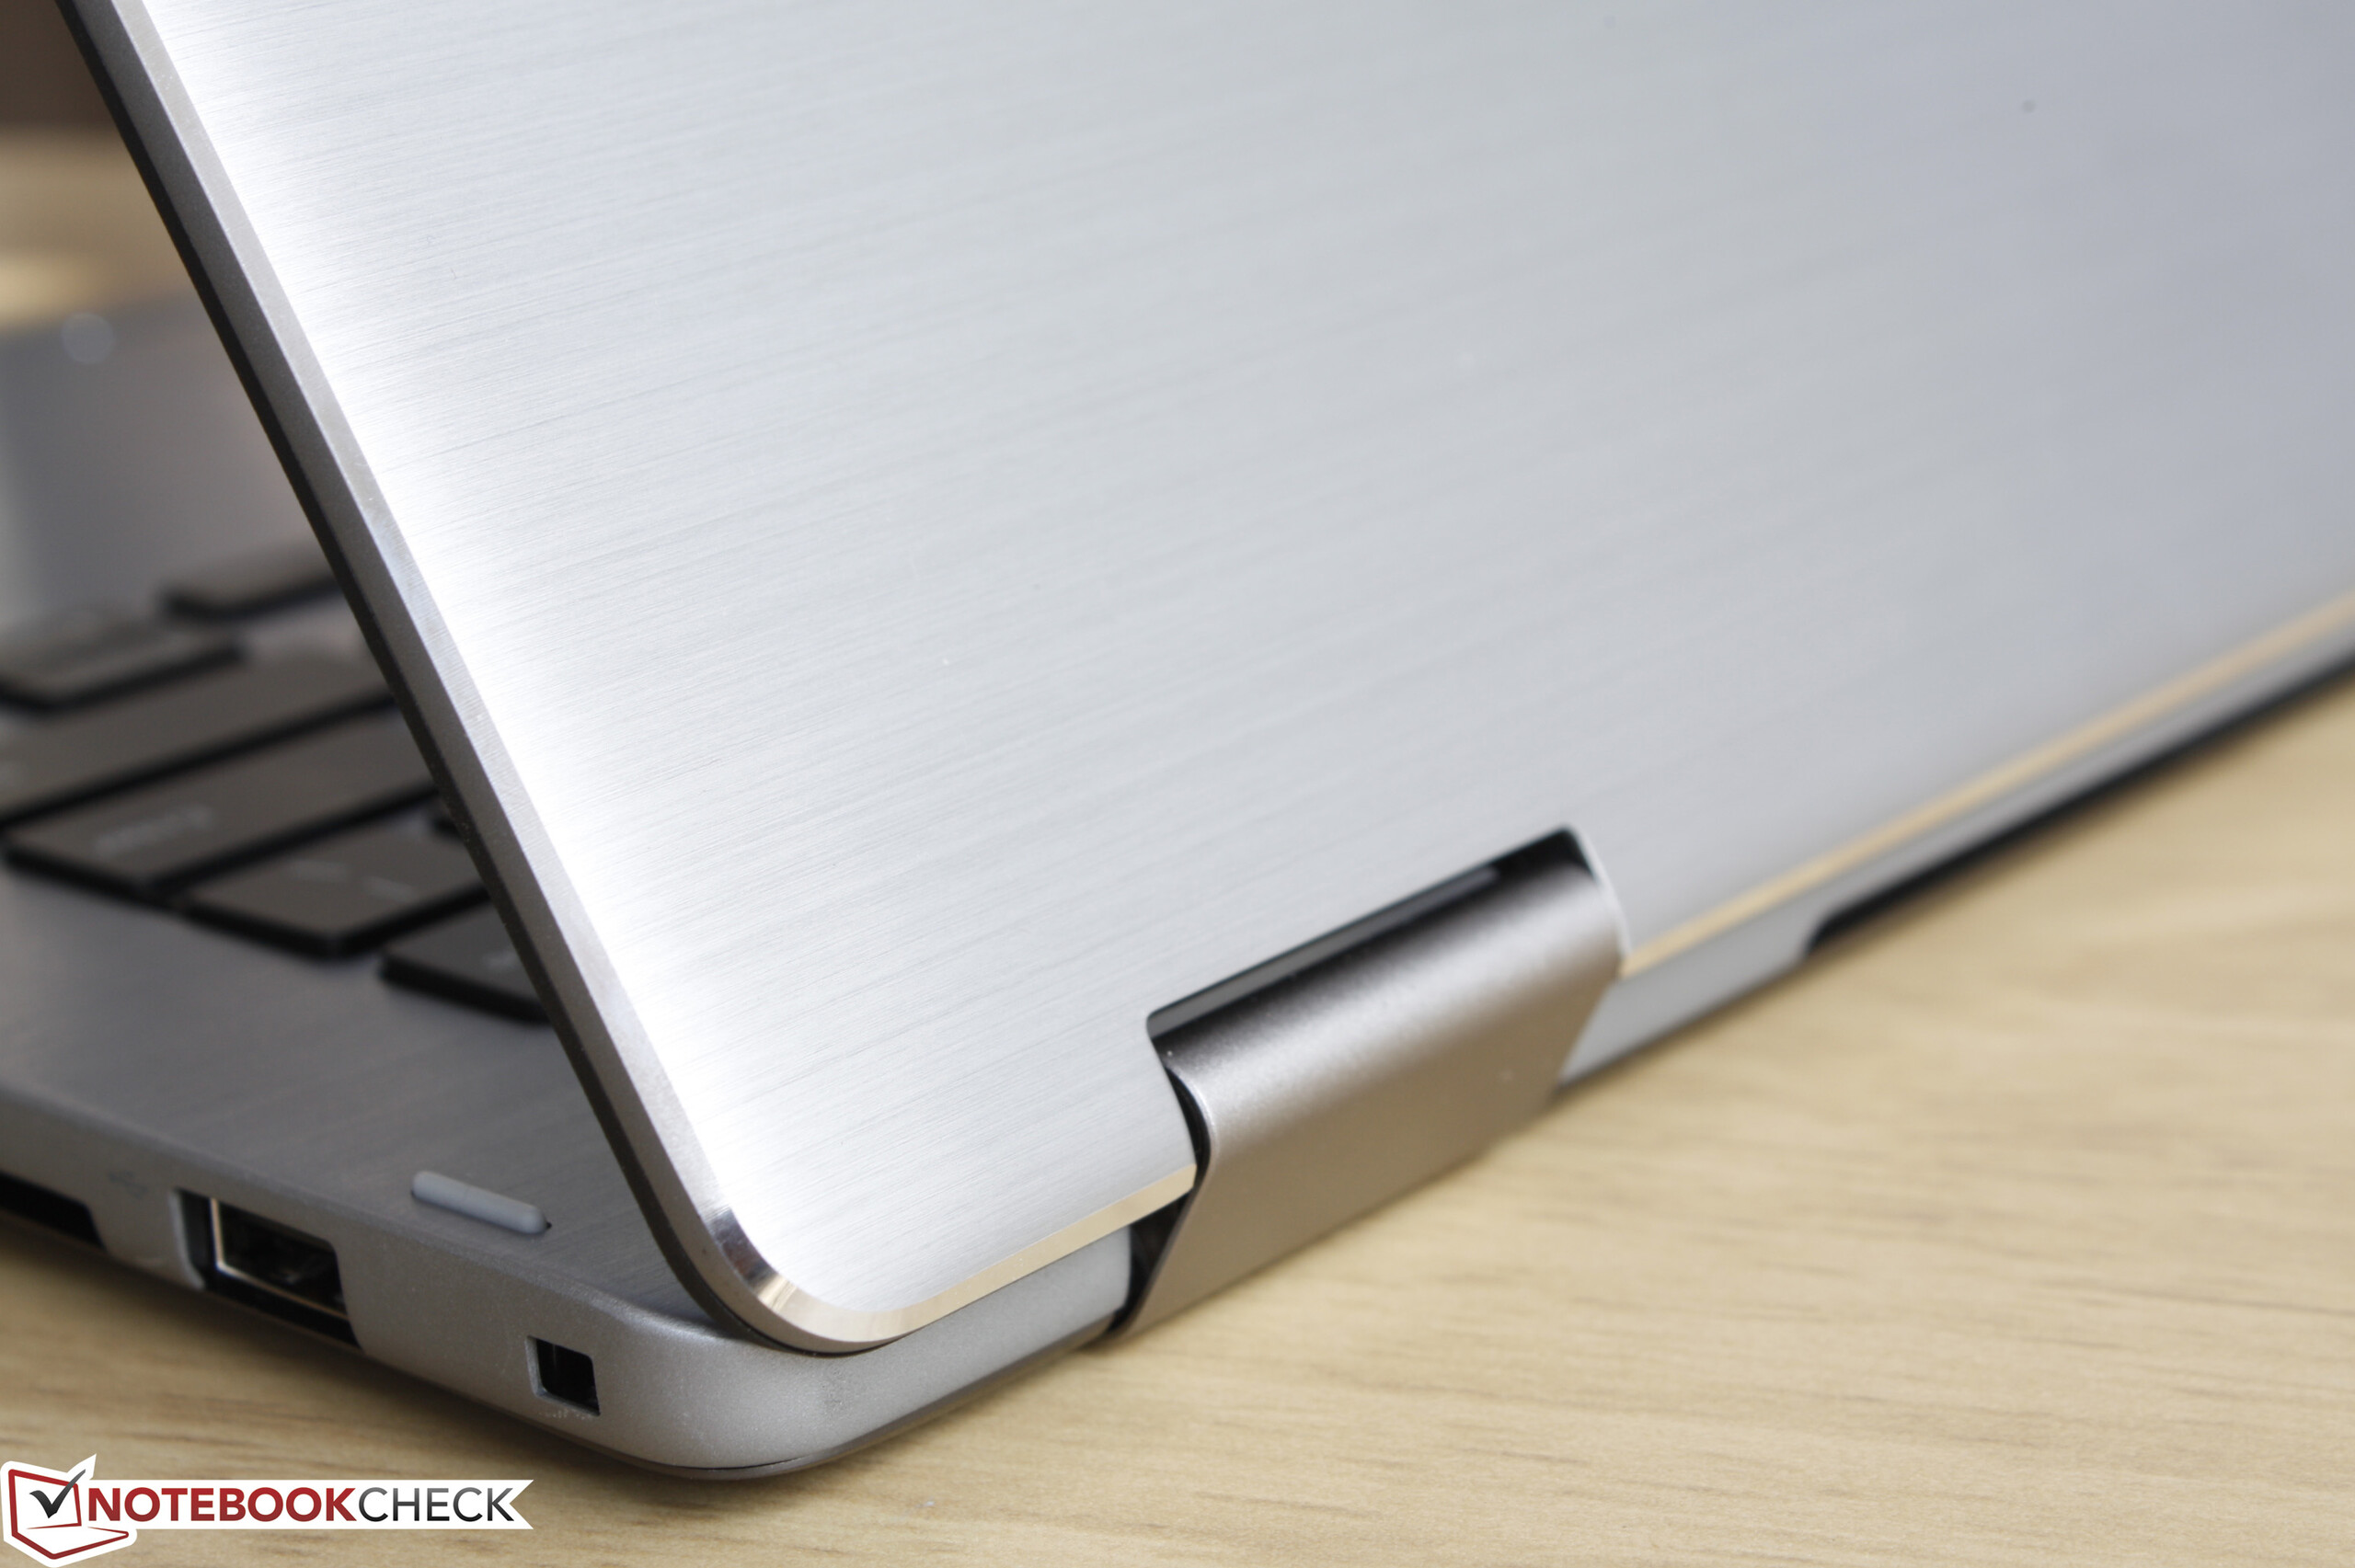
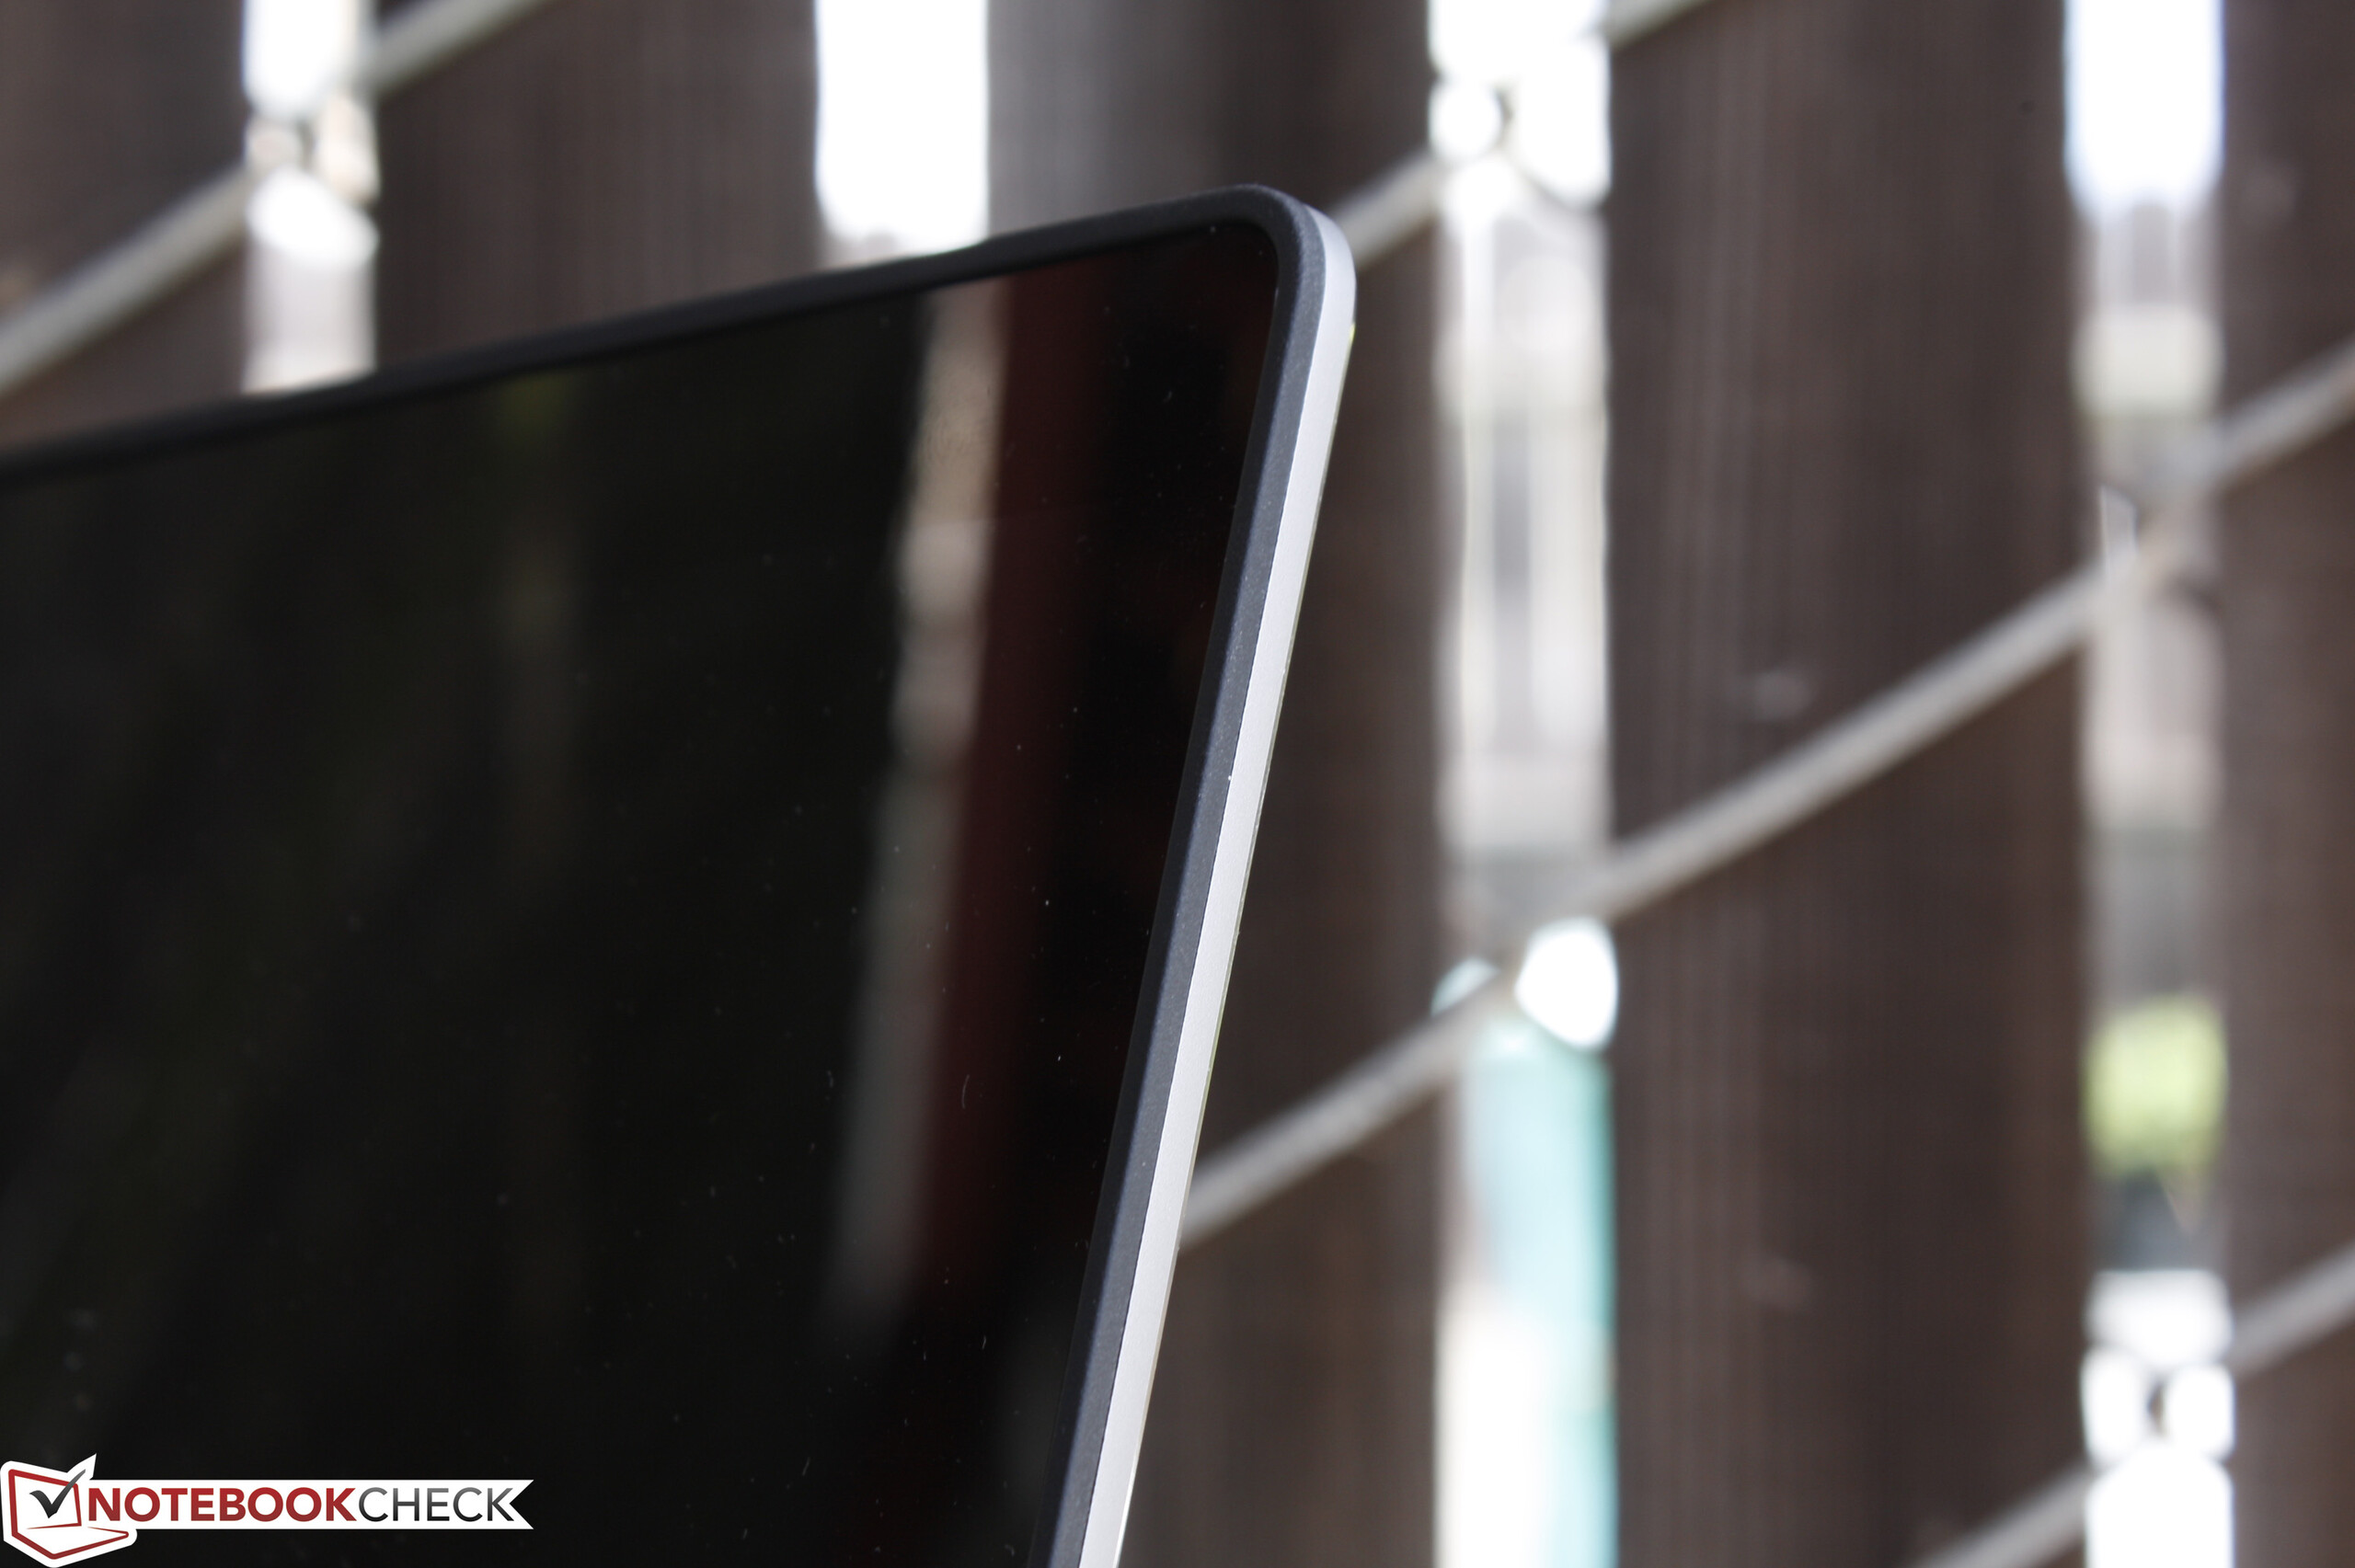
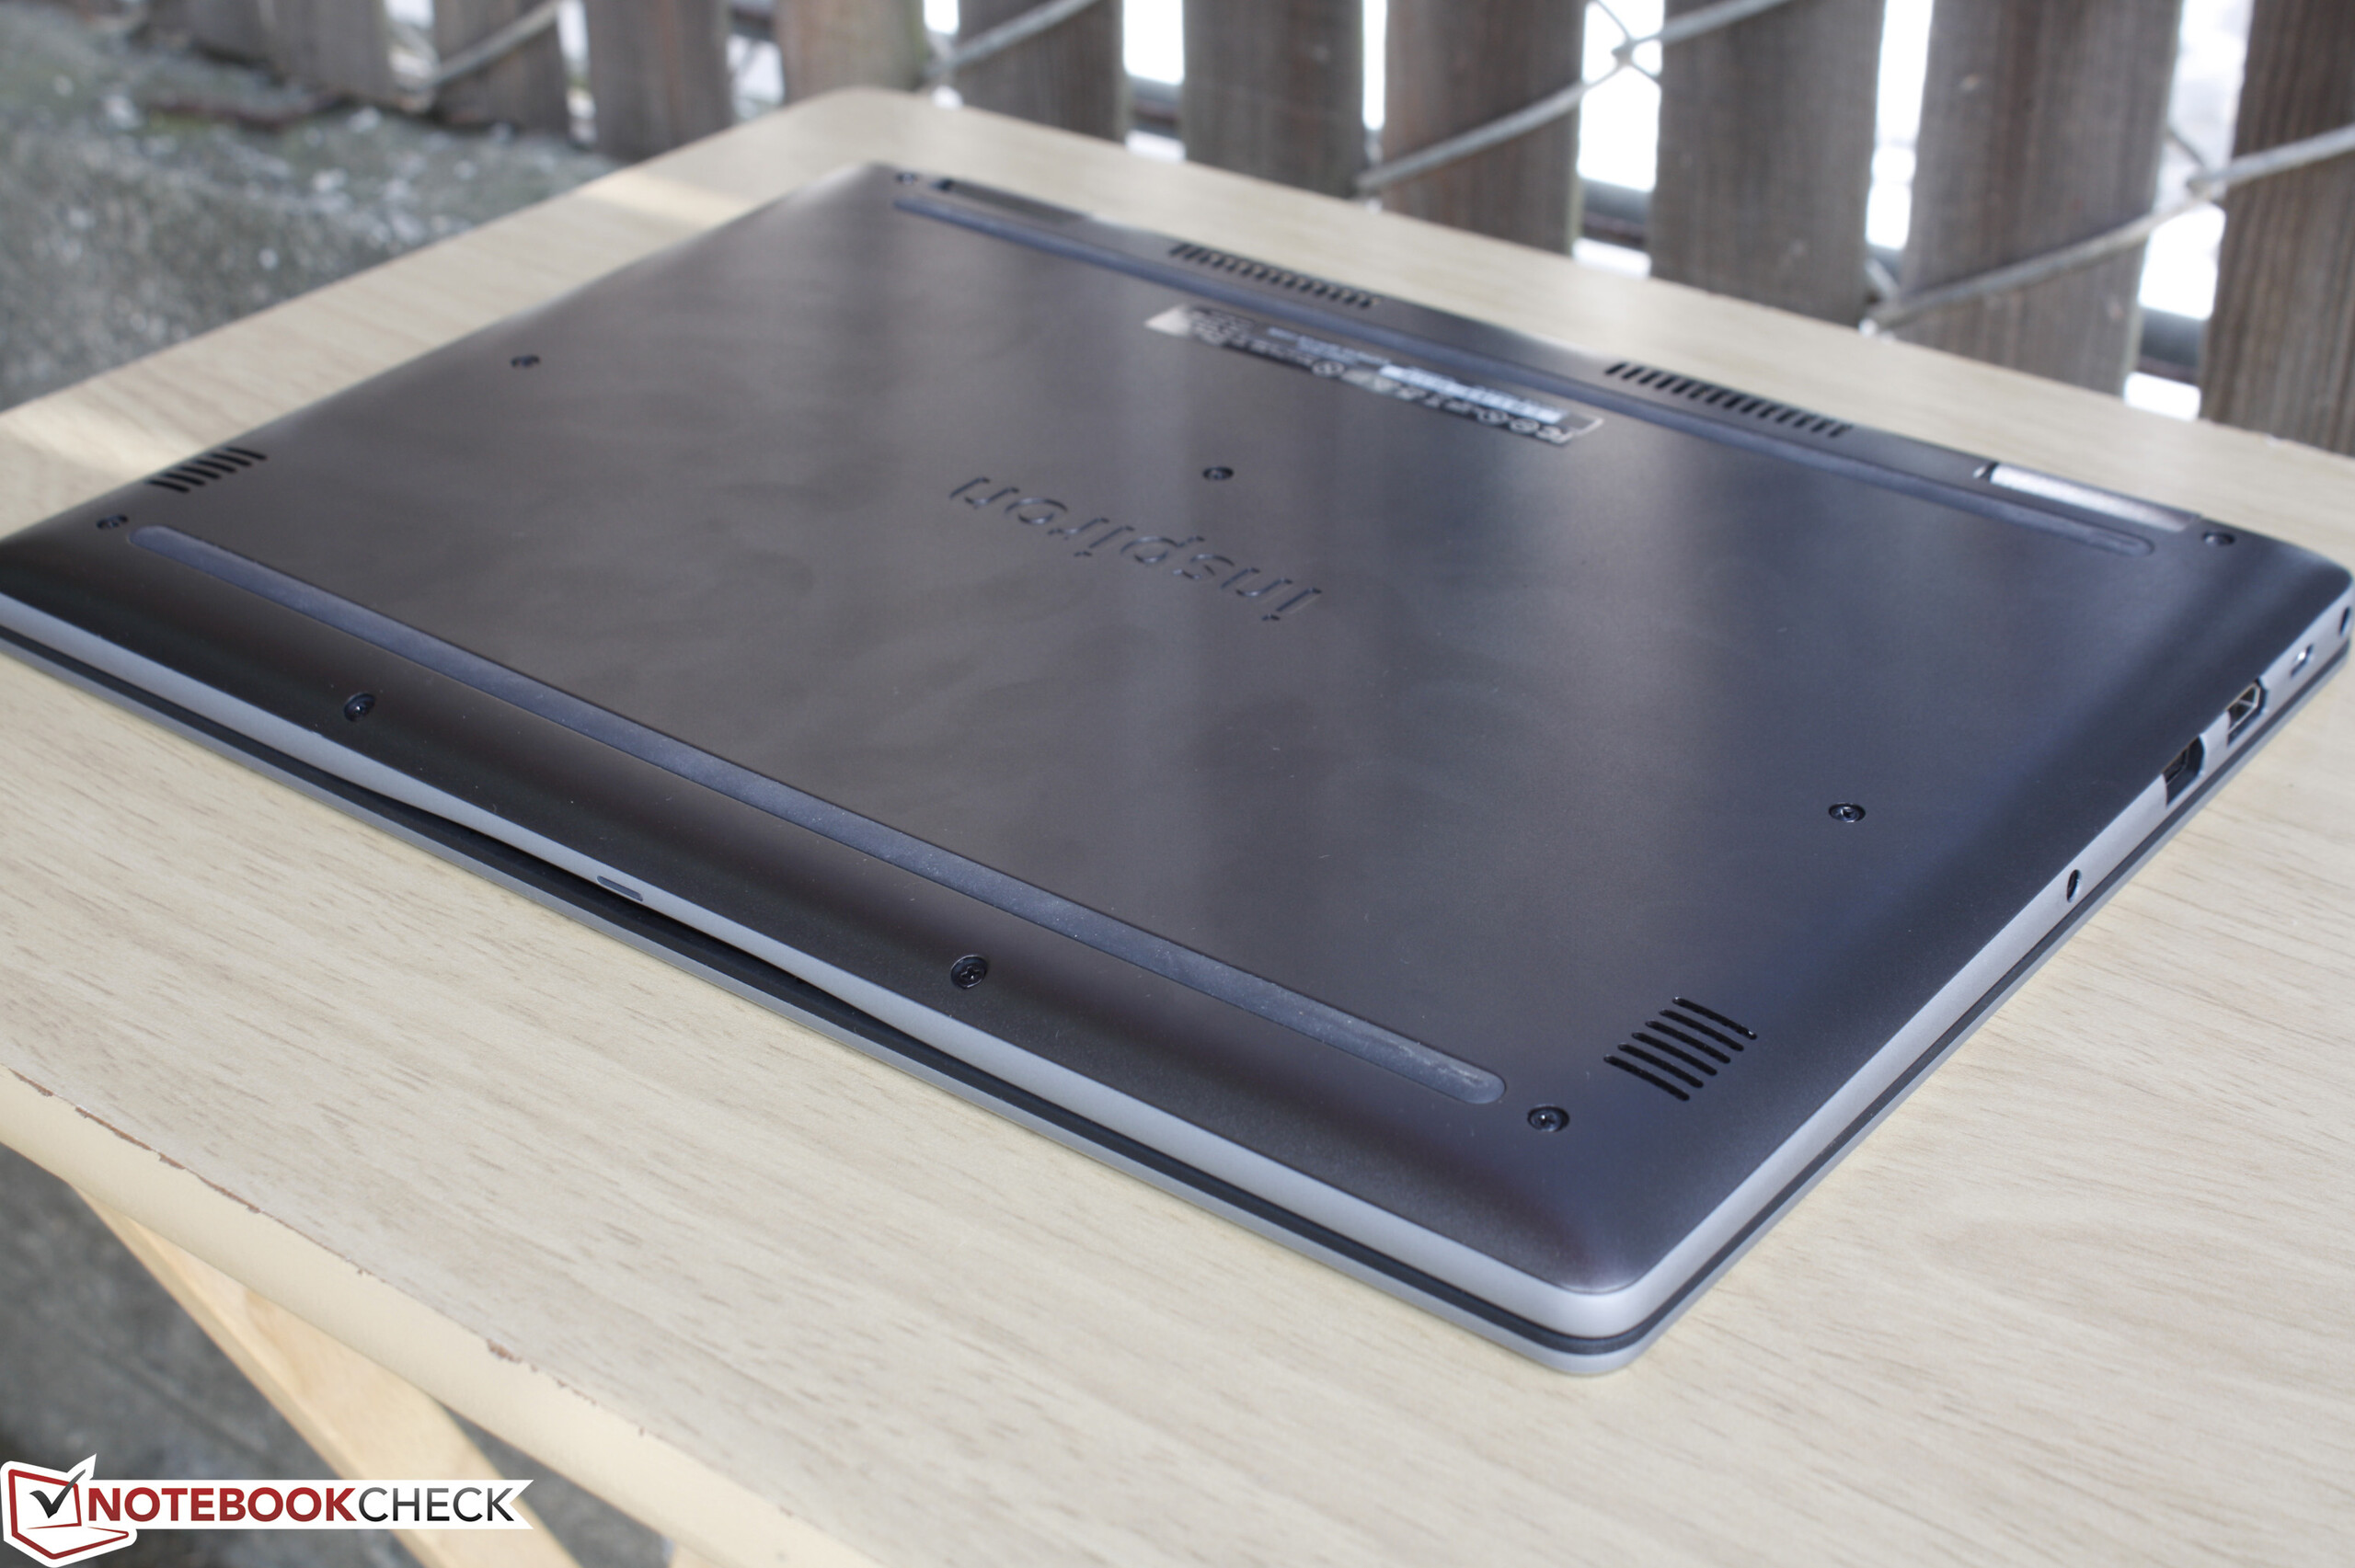
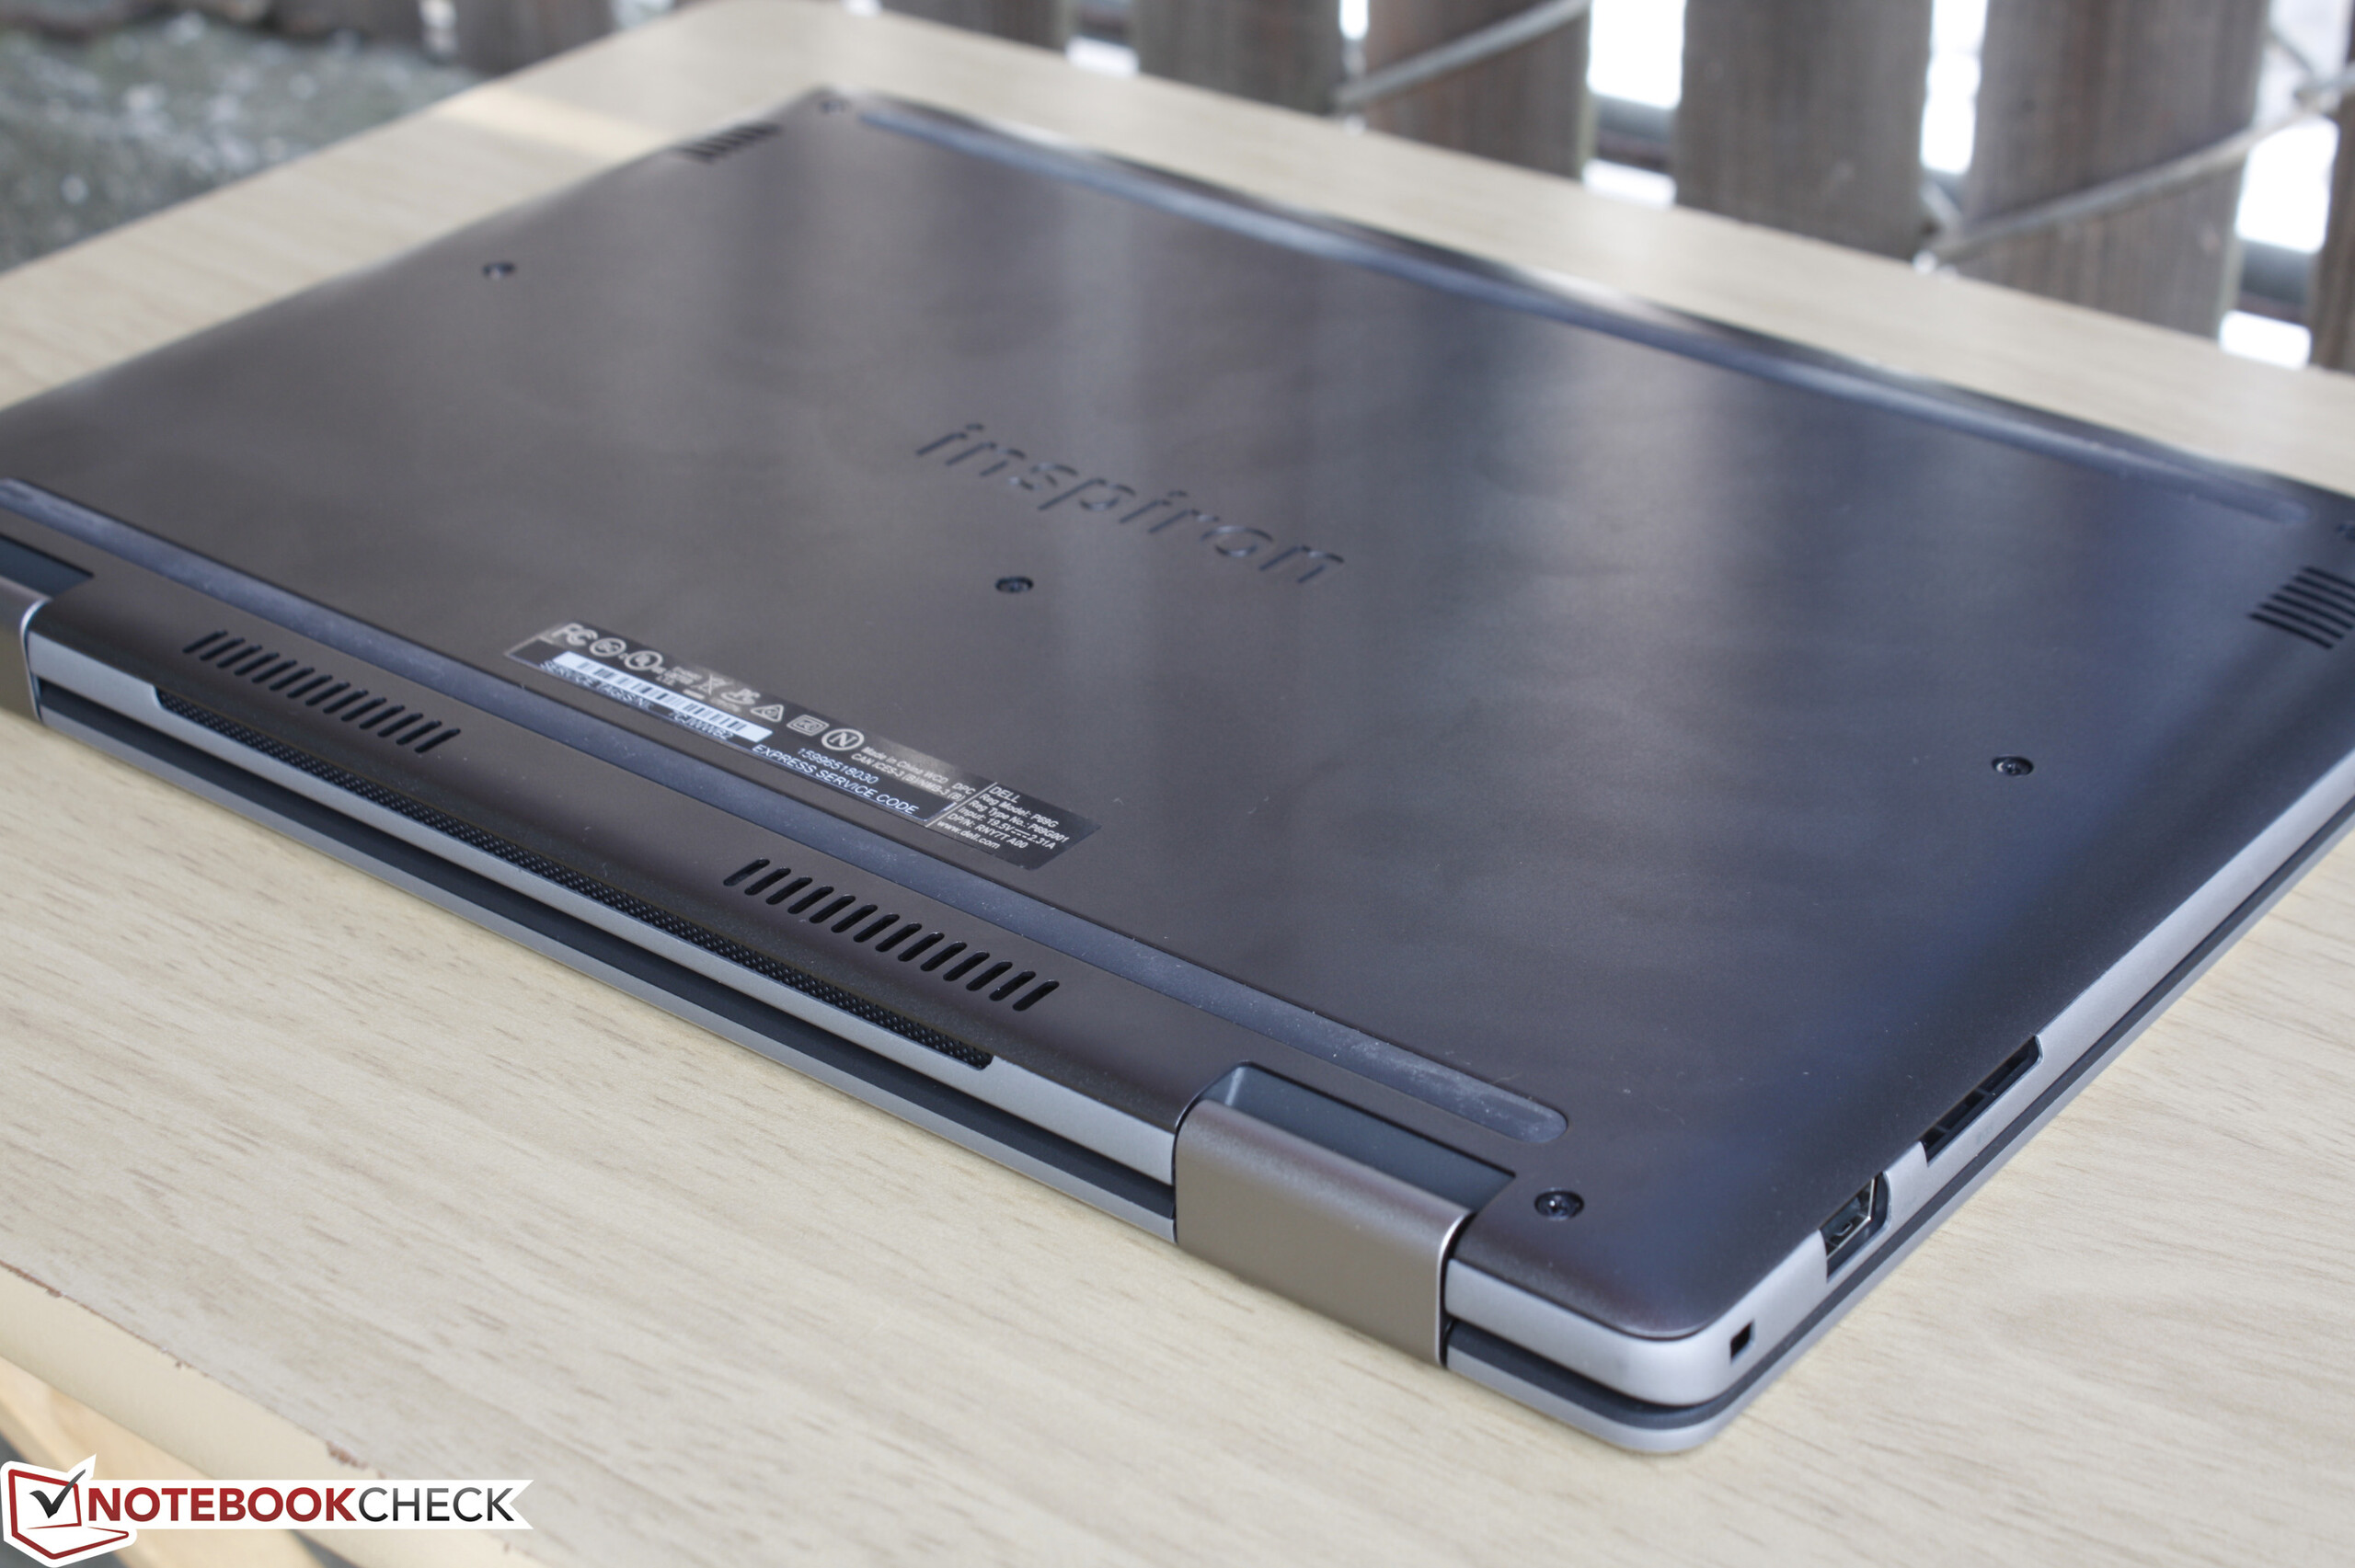
Inspiron 13 7368相比前代机型Inspiron 7348运行更安静,外观设计也更新颖。遗憾的是,它的机身仍然有些沉重,屏幕的亮度相比即将停产的机型甚至更暗,因此它作为Windows平板电脑的使用只限于室内环境。它的键盘按键略软,同时提供了更少的全尺寸USB接口。它的小幅设计改变和对USB-C型第一代接口的支持并不足以成为相比前代机型更值得推荐的理由。
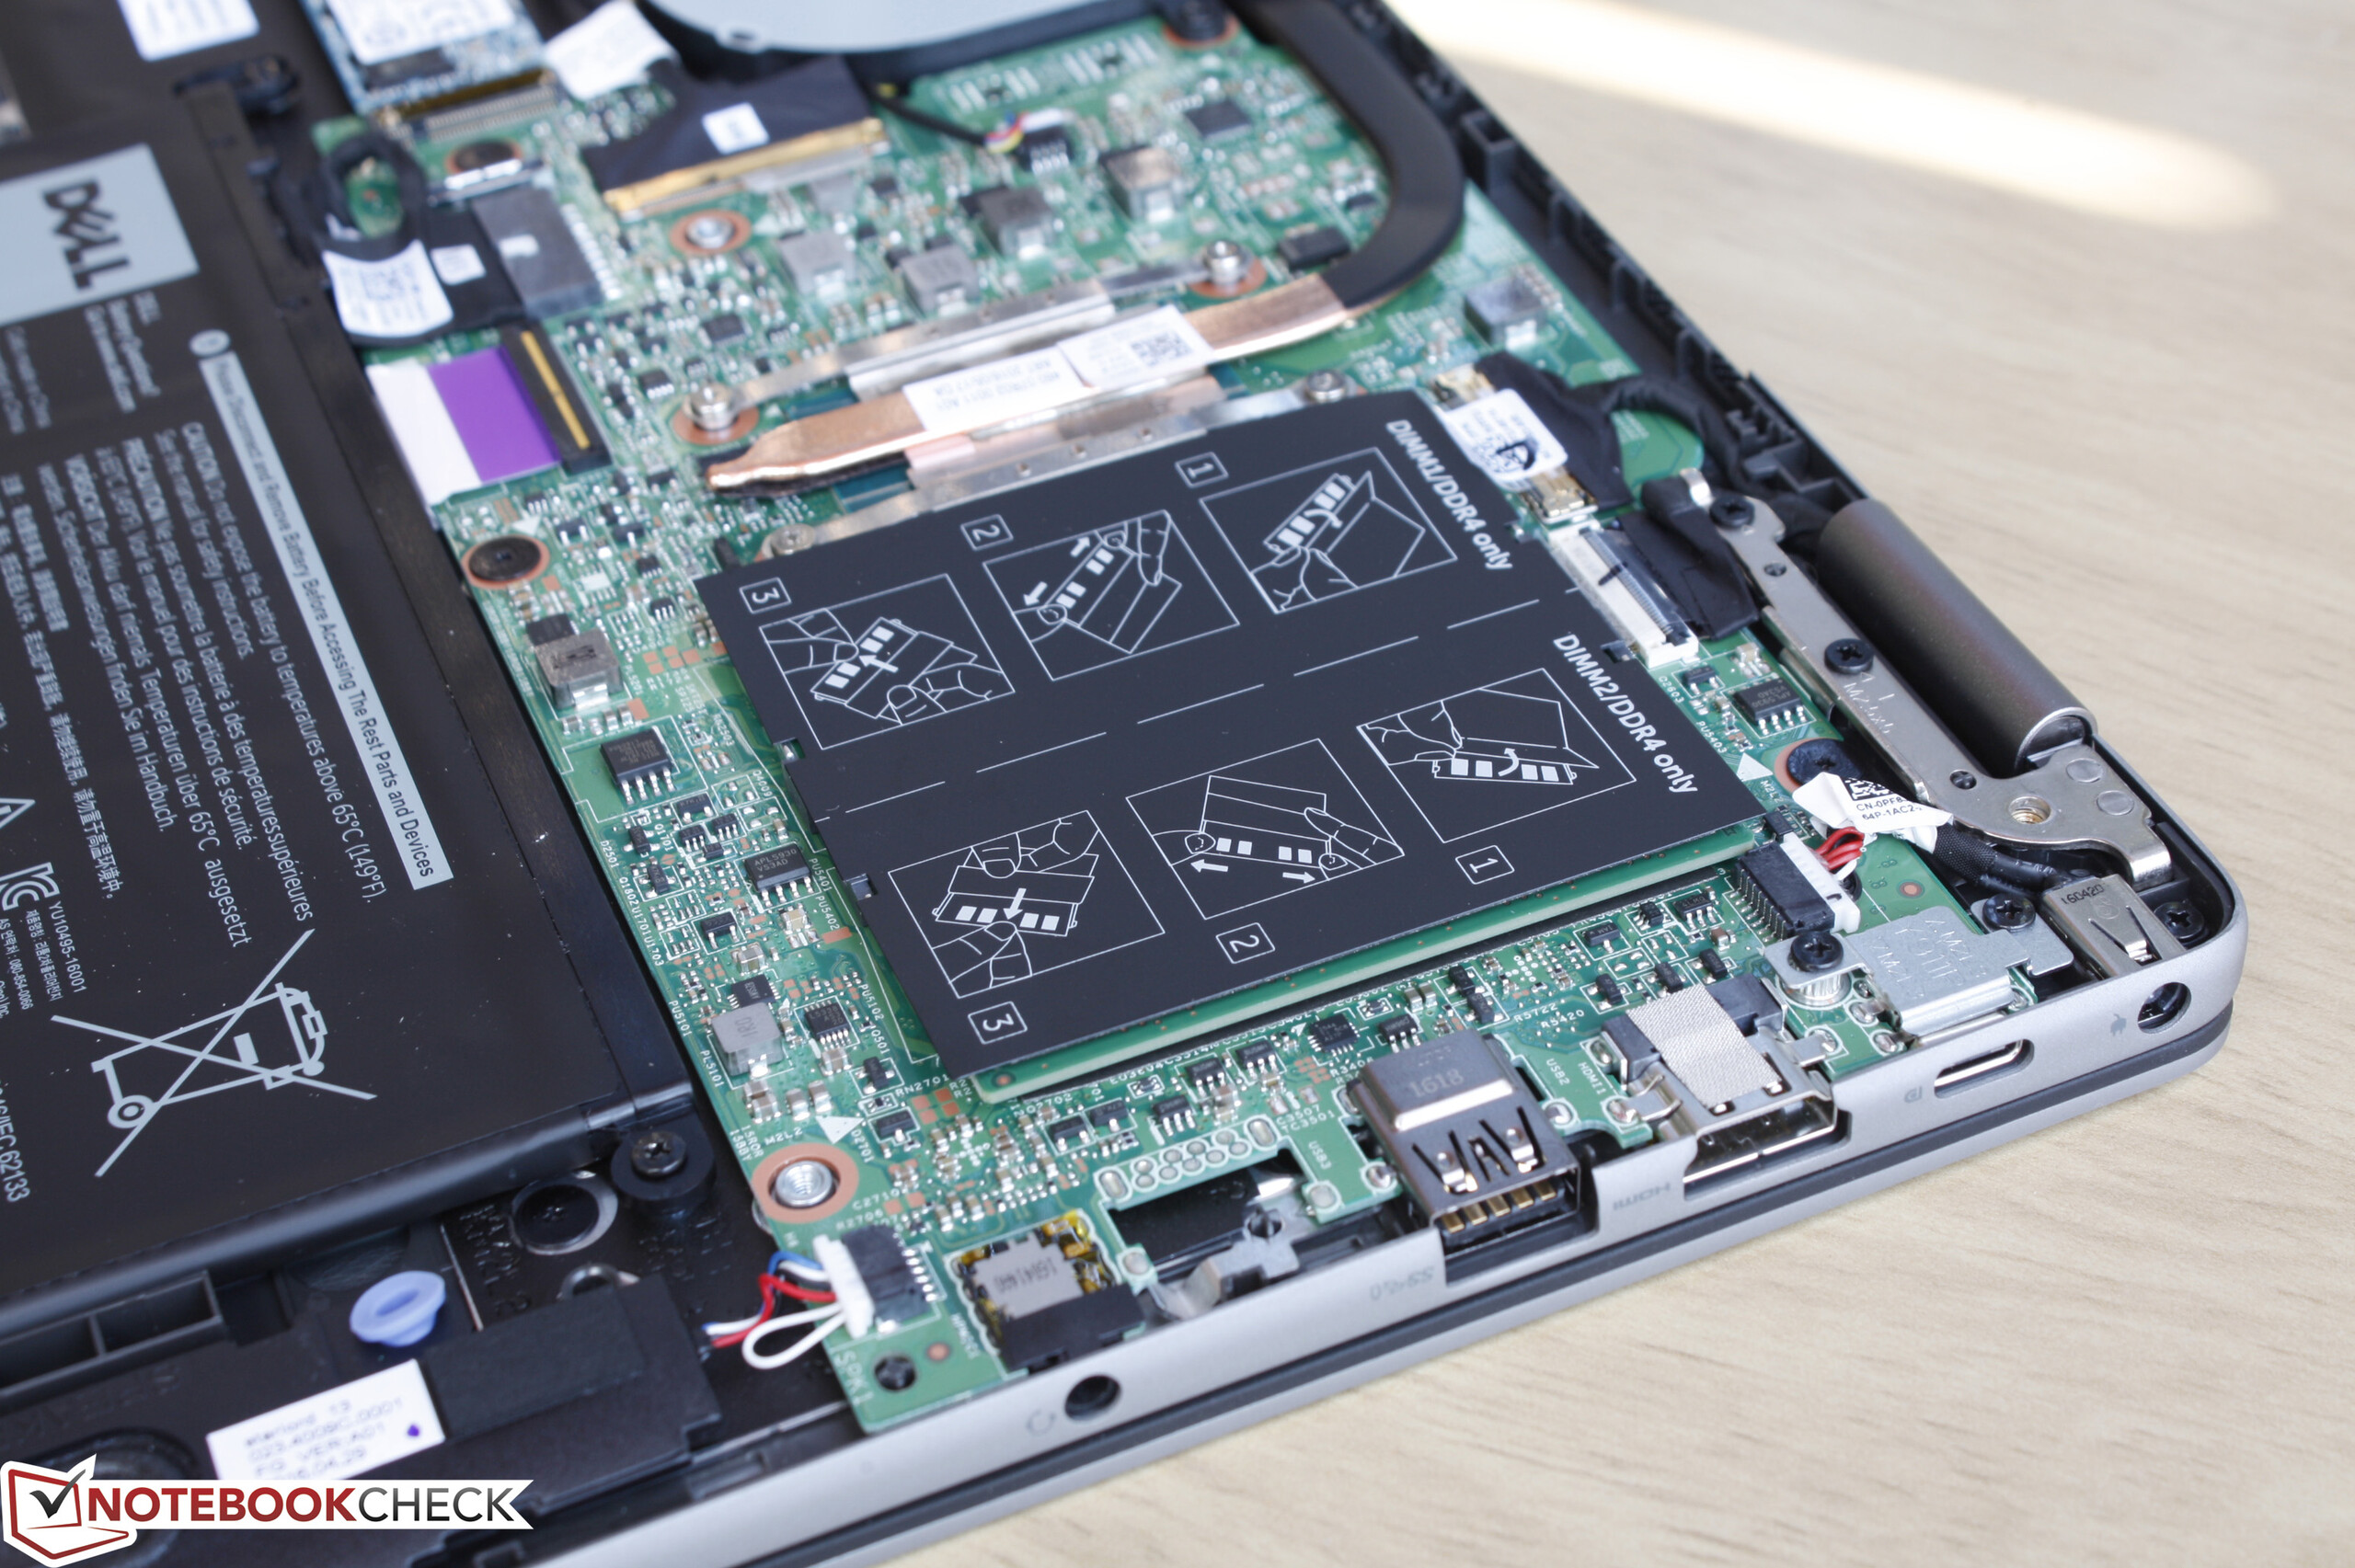
尽管有一些不足,但它仍然是一台坚固美观易于维护的变形本,同时它搭配了响亮的扬声器。它可以很好的替代一台老笔记本电脑,不过不需要平版功能的用户可能会更喜欢XPS 13的便携性和实用性。同样的,需要一台13寸变形本的用户可能会更喜欢竞争产品的更轻重量更小巧体型。
Inspiron 13 7368并没有实现我们所期待的大幅度的更新。它的重量和尺寸仍然让它局限于室内使用,同时市场上也有更多13寸超极本可以提供相似的性能和功能。
注:本文是基于完整评测的缩减版本,阅读完整的英文评测,请点击这里。
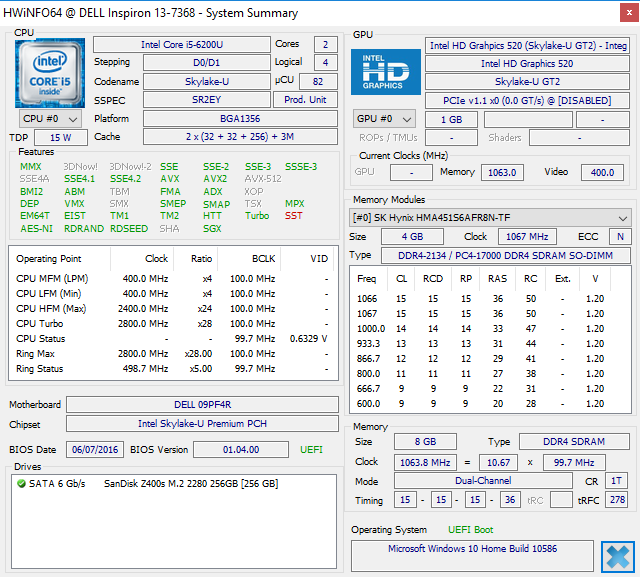
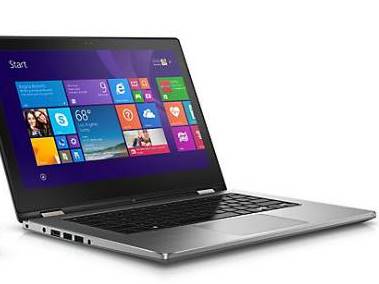
Dell Inspiron 13 7386
- 07/15/2016 v5.1 (old)
Allen Ngo
Price comparison
