戴尔灵越13 7386 二合一 Black Edition (i7-8565U, 16 GB RAM, 512 GB SSD) 翻转本评测

| SD Card Reader | |
| average JPG Copy Test (av. of 3 runs) | |
| HP ProBook x360 440 G1 (Toshiba Exceria Pro M501 microSDXC 64GB) | |
| Lenovo ThinkPad L380 Yoga-20M7001BGE (Toshiba Exceria Pro M501 microSDXC 64GB) | |
| Average of class Convertible (28.1 - 197, n=23, last 2 years) | |
| Lenovo Yoga 530-14IKB-81EK00CWGE (Toshiba Exceria Pro SDXC 64 GB UHS-II) | |
| maximum AS SSD Seq Read Test (1GB) | |
| Average of class Convertible (28.9 - 254, n=22, last 2 years) | |
| Lenovo ThinkPad L380 Yoga-20M7001BGE (Toshiba Exceria Pro M501 microSDXC 64GB) | |
| HP ProBook x360 440 G1 (Toshiba Exceria Pro M501 microSDXC 64GB) | |
| Dell Inspiron 13 7386 (Toshiba Exceria Pro M501 microSDXC 64GB) | |
| Lenovo Yoga 530-14IKB-81EK00CWGE (Toshiba Exceria Pro SDXC 64 GB UHS-II) | |
| Networking | |
| iperf3 transmit AX12 | |
| Lenovo ThinkPad L380 Yoga-20M7001BGE | |
| Dell Inspiron 13 7386 | |
| HP ProBook x360 440 G1 | |
| Lenovo Yoga 530-14IKB-81EK00CWGE | |
| iperf3 receive AX12 | |
| Dell Inspiron 13 7386 | |
| HP ProBook x360 440 G1 | |
| Lenovo ThinkPad L380 Yoga-20M7001BGE | |
| Lenovo Yoga 530-14IKB-81EK00CWGE | |
| |||||||||||||||||||||||||
Brightness Distribution: 81 %
Center on Battery: 281 cd/m²
Contrast: 1767:1 (Black: 0.18 cd/m²)
ΔE ColorChecker Calman: 2.91 | ∀{0.5-29.43 Ø4.73}
calibrated: 2.91
ΔE Greyscale Calman: 4.37 | ∀{0.09-98 Ø4.97}
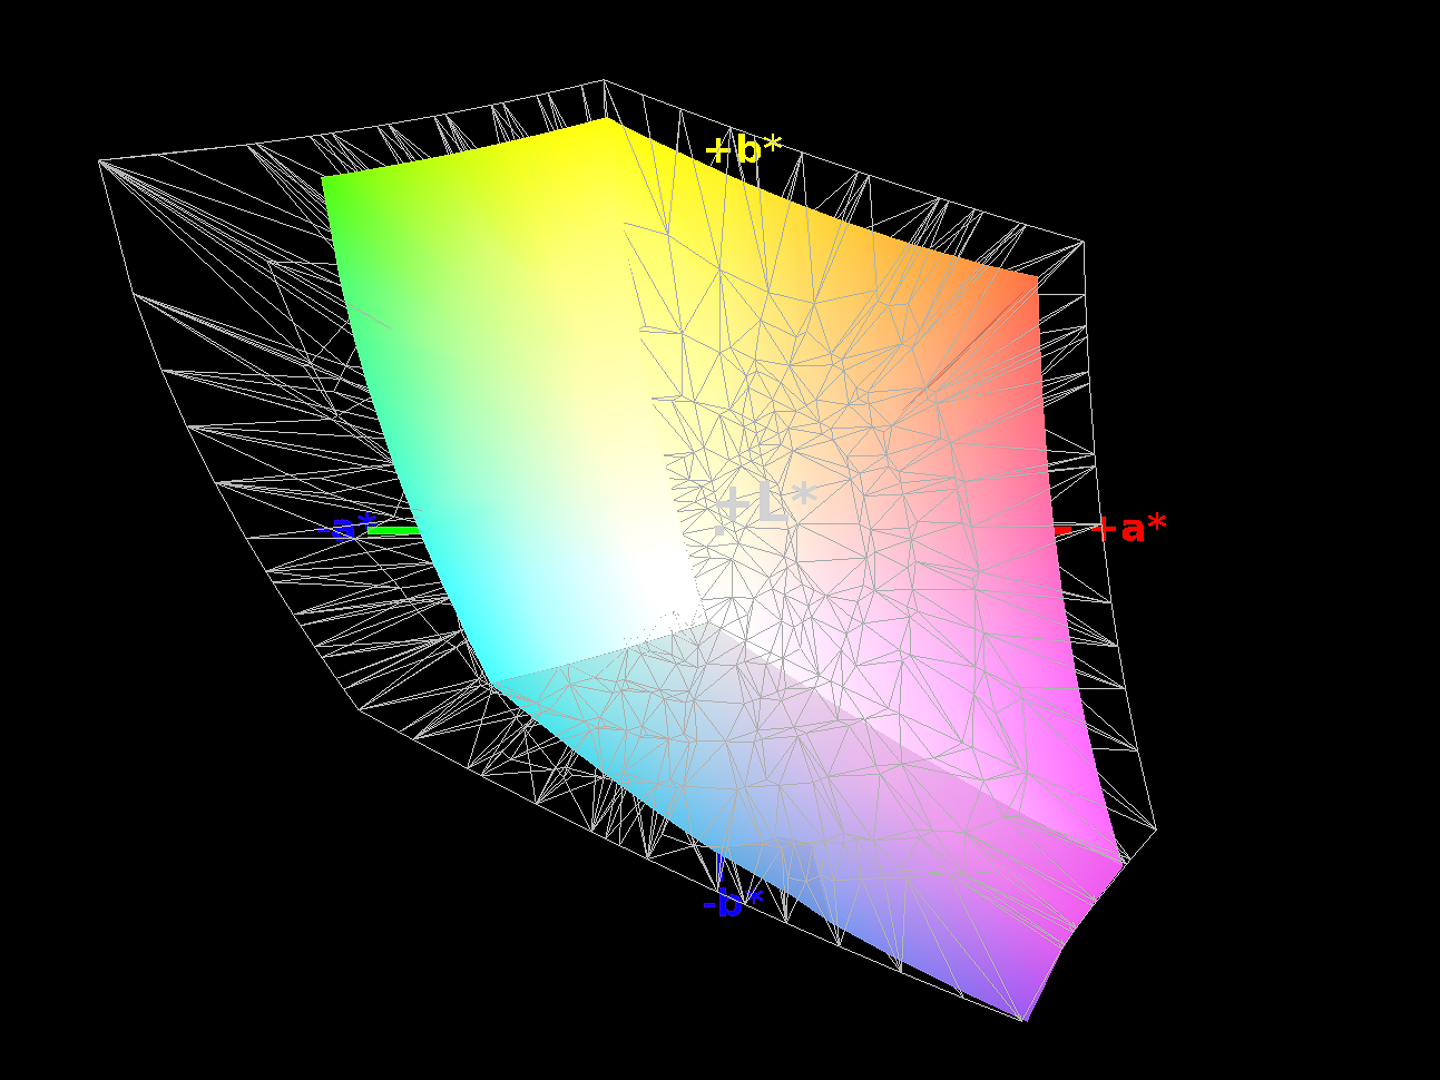
93% sRGB (Argyll 1.6.3 3D)
70% AdobeRGB 1998 (Argyll 1.6.3 3D)
70% AdobeRGB 1998 (Argyll 3D)
99.8% sRGB (Argyll 3D)
68.2% Display P3 (Argyll 3D)
Gamma: 2.26
CCT: 6448 K
| Dell Inspiron 13 7386 Chi Mei CMN1385 / 133DCE / Dell 3GRT6, , 3840x2160, 13.3" | Lenovo Yoga 530-14IKB-81EK00CWGE InfoVision M140NWF5 R2, , 1920x1080, 14" | HP ProBook x360 440 G1 Chi MEi, CMN14E0, , 1920x1080, 14" | Lenovo ThinkPad L380 Yoga-20M7001BGE M133NWF4-R3, , 1920x1080, 13.3" | |
|---|---|---|---|---|
| Display | -39% | -3% | -4% | |
| Display P3 Coverage (%) | 68.2 | 41.52 -39% | 65.8 -4% | 65.1 -5% |
| sRGB Coverage (%) | 99.8 | 62.1 -38% | 98.2 -2% | 95.5 -4% |
| AdobeRGB 1998 Coverage (%) | 70 | 42.92 -39% | 67.8 -3% | 66.9 -4% |
| Response Times | 11% | 37% | 13% | |
| Response Time Grey 50% / Grey 80% * (ms) | 57 ? | 45 ? 21% | 34 ? 40% | 47 ? 18% |
| Response Time Black / White * (ms) | 30 ? | 30 ? -0% | 20 ? 33% | 28 ? 7% |
| PWM Frequency (Hz) | 26000 ? | 520 ? | 26000 ? | 217 ? |
| Screen | -16% | 20% | -21% | |
| Brightness middle (cd/m²) | 318 | 240 -25% | 408 28% | 323 2% |
| Brightness (cd/m²) | 278 | 234 -16% | 375 35% | 310 12% |
| Brightness Distribution (%) | 81 | 93 15% | 87 7% | 88 9% |
| Black Level * (cd/m²) | 0.18 | 0.11 39% | 0.34 -89% | 0.22 -22% |
| Contrast (:1) | 1767 | 2182 23% | 1200 -32% | 1468 -17% |
| Colorchecker dE 2000 * | 2.91 | 4.98 -71% | 1.2 59% | 5 -72% |
| Colorchecker dE 2000 max. * | 6.11 | 10.75 -76% | 2.44 60% | 9.56 -56% |
| Colorchecker dE 2000 calibrated * | 2.91 | 3.33 -14% | 0.67 77% | |
| Greyscale dE 2000 * | 4.37 | 3.51 20% | 0.98 78% | 6.64 -52% |
| Gamma | 2.26 97% | 2.2 100% | 2.32 95% | 2.2 100% |
| CCT | 6448 101% | 6606 98% | 6485 100% | 6638 98% |
| Color Space (Percent of AdobeRGB 1998) (%) | 70 | 40 -43% | 62 -11% | 61 -13% |
| Color Space (Percent of sRGB) (%) | 93 | 62 -33% | 98 5% | 95 2% |
| Total Average (Program / Settings) | -15% /
-17% | 18% /
18% | -4% /
-13% |
* ... smaller is better

Display Response Times
| ↔ Response Time Black to White | ||
|---|---|---|
| 30 ms ... rise ↗ and fall ↘ combined | ↗ 15 ms rise | 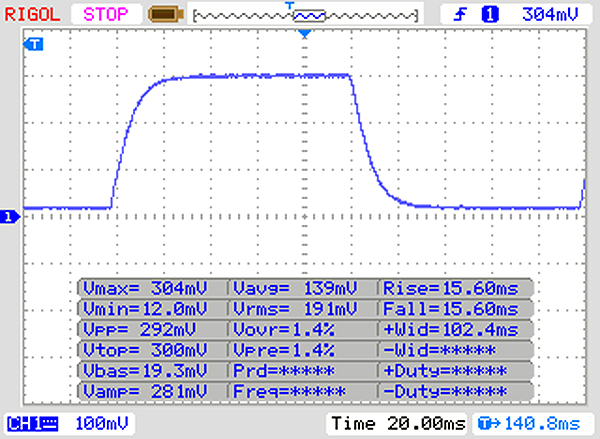 |
| ↘ 15 ms fall | ||
| The screen shows slow response rates in our tests and will be unsatisfactory for gamers. In comparison, all tested devices range from 0.1 (minimum) to 240 (maximum) ms. » 80 % of all devices are better. This means that the measured response time is worse than the average of all tested devices (19.9 ms). | ||
| ↔ Response Time 50% Grey to 80% Grey | ||
| 57 ms ... rise ↗ and fall ↘ combined | ↗ 27 ms rise | 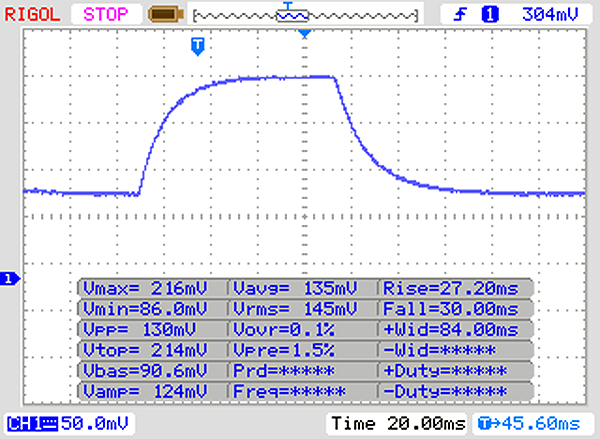 |
| ↘ 30 ms fall | ||
| The screen shows slow response rates in our tests and will be unsatisfactory for gamers. In comparison, all tested devices range from 0.165 (minimum) to 636 (maximum) ms. » 94 % of all devices are better. This means that the measured response time is worse than the average of all tested devices (31.1 ms). | ||
Screen Flickering / PWM (Pulse-Width Modulation)
| Screen flickering / PWM detected | 26000 Hz | ≤ 20 % brightness setting | 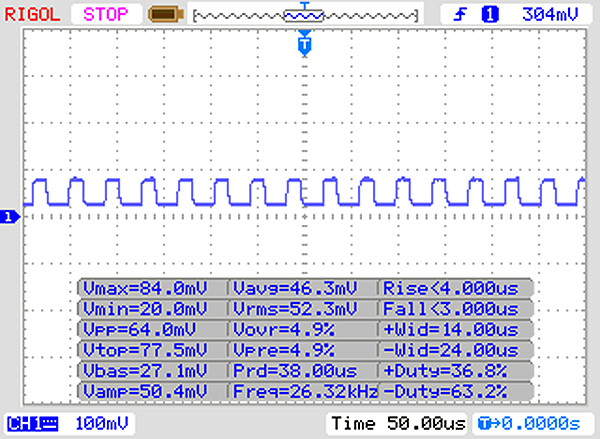 |
The display backlight flickers at 26000 Hz (worst case, e.g., utilizing PWM) Flickering detected at a brightness setting of 20 % and below. There should be no flickering or PWM above this brightness setting. The frequency of 26000 Hz is quite high, so most users sensitive to PWM should not notice any flickering. In comparison: 52 % of all tested devices do not use PWM to dim the display. If PWM was detected, an average of 7784 (minimum: 5 - maximum: 343500) Hz was measured. | |||
| Cinebench R15 | |
| CPU Single 64Bit | |
| Average of class Convertible (149.8 - 317, n=49, last 2 years) | |
| Average Intel Core i7-8565U (138.3 - 193, n=51) | |
| Dell Inspiron 13 7386 | |
| HP ProBook x360 440 G1 | |
| Lenovo Yoga 530-14IKB-81EK00CWGE | |
| Lenovo ThinkPad L380 Yoga-20M7001BGE | |
| CPU Multi 64Bit | |
| Average of class Convertible (478 - 4940, n=49, last 2 years) | |
| Average Intel Core i7-8565U (452 - 815, n=52) | |
| Dell Inspiron 13 7386 | |
| HP ProBook x360 440 G1 | |
| Lenovo Yoga 530-14IKB-81EK00CWGE | |
| Lenovo ThinkPad L380 Yoga-20M7001BGE | |
| Dell Inspiron 13 7386 SK Hynix BC501 HFM512GDJTNG | Lenovo Yoga 530-14IKB-81EK00CWGE SK hynix PC401 HFS256GD9TNG | HP ProBook x360 440 G1 Toshiba KBG30ZMV256G | Lenovo ThinkPad L380 Yoga-20M7001BGE Samsung PM961 MZVLW256HEHP | Average SK Hynix BC501 HFM512GDJTNG | |
|---|---|---|---|---|---|
| CrystalDiskMark 5.2 / 6 | 23% | -8% | 55% | 5% | |
| Write 4K (MB/s) | 97.4 | 123.1 26% | 98.8 1% | 123.4 27% | 95.5 ? -2% |
| Read 4K (MB/s) | 38.05 | 43.24 14% | 44.32 16% | 42.24 11% | 38.3 ? 1% |
| Write Seq (MB/s) | 656 | 763 16% | 685 4% | 920 40% | 759 ? 16% |
| Read Seq (MB/s) | 1043 | 1632 56% | 665 -36% | 1991 91% | 1022 ? -2% |
| Write 4K Q32T1 (MB/s) | 331.5 | 268.6 -19% | 278 -16% | 531 60% | 303 ? -9% |
| Read 4K Q32T1 (MB/s) | 253.8 | 345.2 36% | 307.3 21% | 373.6 47% | 317 ? 25% |
| Write Seq Q32T1 (MB/s) | 879 | 800 -9% | 657 -25% | 1360 55% | 885 ? 1% |
| Read Seq Q32T1 (MB/s) | 1639 | 2620 60% | 1202 -27% | 3394 107% | 1803 ? 10% |
| Write 4K Q8T8 (MB/s) | 536 | 306 ? | |||
| Read 4K Q8T8 (MB/s) | 560 | 698 ? | |||
| AS SSD | -19% | -82% | 1% | -4% | |
| Seq Read (MB/s) | 1122 | 2071 85% | 1255 12% | 1609 43% | 1323 ? 18% |
| Seq Write (MB/s) | 619 | 721 16% | 625 1% | 859 39% | 697 ? 13% |
| 4K Read (MB/s) | 39.58 | 34.44 -13% | 42.09 6% | 49.34 25% | 40.4 ? 2% |
| 4K Write (MB/s) | 108.5 | 91 -16% | 96.1 -11% | 117 8% | 100.8 ? -7% |
| 4K-64 Read (MB/s) | 776 | 448.2 -42% | 624 -20% | 774 0% | 686 ? -12% |
| 4K-64 Write (MB/s) | 671 | 268.9 -60% | 298.3 -56% | 299.9 -55% | 660 ? -2% |
| Access Time Read * (ms) | 0.045 | 0.046 -2% | 0.122 -171% | 0.049 -9% | 0.06071 ? -35% |
| Access Time Write * (ms) | 0.033 | 0.054 -64% | 0.224 -579% | 0.031 6% | 0.037 ? -12% |
| Score Read (Points) | 928 | 690 -26% | 791 -15% | 984 6% | 858 ? -8% |
| Score Write (Points) | 841 | 432 -49% | 457 -46% | 503 -40% | 830 ? -1% |
| Score Total (Points) | 2228 | 1416 -36% | 1634 -27% | 1966 -12% | 2107 ? -5% |
| Total Average (Program / Settings) | 2% /
-1% | -45% /
-51% | 28% /
24% | 1% /
-0% |
* ... smaller is better

| 3DMark 11 - 1280x720 Performance GPU | |
| Average of class Convertible (1505 - 40732, n=49, last 2 years) | |
| Dell Inspiron 13 7386 | |
| HP ProBook x360 440 G1 | |
| Average Intel UHD Graphics 620 (1144 - 3432, n=244) | |
| Lenovo Yoga 530-14IKB-81EK00CWGE | |
| Lenovo ThinkPad L380 Yoga-20M7001BGE | |
| 3DMark | |
| 1280x720 Cloud Gate Standard Graphics | |
| Average of class Convertible (7885 - 57566, n=33, last 2 years) | |
| Dell Inspiron 13 7386 | |
| HP ProBook x360 440 G1 | |
| Average Intel UHD Graphics 620 (6205 - 16400, n=225) | |
| Lenovo Yoga 530-14IKB-81EK00CWGE | |
| Lenovo ThinkPad L380 Yoga-20M7001BGE | |
| 1920x1080 Fire Strike Graphics | |
| Average of class Convertible (1185 - 27447, n=49, last 2 years) | |
| Dell Inspiron 13 7386 | |
| HP ProBook x360 440 G1 | |
| Average Intel UHD Graphics 620 (557 - 2608, n=213) | |
| Lenovo Yoga 530-14IKB-81EK00CWGE | |
| Lenovo ThinkPad L380 Yoga-20M7001BGE | |
| 3DMark 11 Performance | 2073 points | |
| 3DMark Cloud Gate Standard Score | 8917 points | |
| 3DMark Fire Strike Score | 1218 points | |
Help | ||
| BioShock Infinite | |
| 1280x720 Very Low Preset | |
| Dell Inspiron 13 7386 | |
| HP ProBook x360 440 G1 | |
| Average Intel UHD Graphics 620 (18.3 - 90.2, n=187) | |
| Lenovo Yoga 530-14IKB-81EK00CWGE | |
| Lenovo ThinkPad L380 Yoga-20M7001BGE | |
| 1366x768 Medium Preset | |
| HP ProBook x360 440 G1 | |
| Dell Inspiron 13 7386 | |
| Average Intel UHD Graphics 620 (11.5 - 45.5, n=187) | |
| Lenovo Yoga 530-14IKB-81EK00CWGE | |
| Lenovo ThinkPad L380 Yoga-20M7001BGE | |
| 1366x768 High Preset | |
| Dell Inspiron 13 7386 | |
| HP ProBook x360 440 G1 | |
| Average Intel UHD Graphics 620 (8.1 - 35.9, n=187) | |
| Lenovo Yoga 530-14IKB-81EK00CWGE | |
| Lenovo ThinkPad L380 Yoga-20M7001BGE | |
| 1920x1080 Ultra Preset, DX11 (DDOF) | |
| Lenovo Yoga 530-14IKB-81EK00CWGE | |
| HP ProBook x360 440 G1 | |
| Dell Inspiron 13 7386 | |
| Average Intel UHD Graphics 620 (4.5 - 17, n=176) | |
| Rainbow Six Siege | |
| 1024x768 Low Preset AA:T AF:Linear | |
| Dell Inspiron 13 7386 | |
| Average Intel UHD Graphics 620 (28.2 - 48.4, n=5) | |
| 1366x768 Medium Preset AA:T AF:2x | |
| Dell Inspiron 13 7386 | |
| Average Intel UHD Graphics 620 (16.1 - 29.4, n=5) | |
| 1920x1080 High Preset AA:T AF:4x | |
| Dell Inspiron 13 7386 | |
| Average Intel UHD Graphics 620 (14.5 - 16.2, n=2) | |
| Farming Simulator 19 | |
| 1280x720 Low Preset | |
| Dell Inspiron 13 7386 | |
| Average Intel UHD Graphics 620 (46.8 - 67.7, n=5) | |
| 1920x1080 Medium Preset | |
| Dell Inspiron 13 7386 | |
| Average Intel UHD Graphics 620 (17.4 - 60.9, n=5) | |
| 1920x1080 Very High Preset | |
| Dell Inspiron 13 7386 | |
| Average Intel UHD Graphics 620 (n=1) | |
| low | med. | high | ultra | |
|---|---|---|---|---|
| BioShock Infinite (2013) | 80.3 | 37.5 | 34.5 | 10.5 |
| Rainbow Six Siege (2015) | 47.1 | 29.4 | 16.2 | |
| Farming Simulator 19 (2018) | 67.7 | 60.9 | 25.2 | 12.9 |
Noise level
| Idle |
| 30.4 / 30.4 / 30.4 dB(A) |
| Load |
| 34.3 / 34.2 dB(A) |
 | ||
30 dB silent 40 dB(A) audible 50 dB(A) loud |
||
min: | ||
(±) The maximum temperature on the upper side is 40.5 °C / 105 F, compared to the average of 35.4 °C / 96 F, ranging from 19.6 to 60 °C for the class Convertible.
(±) The bottom heats up to a maximum of 41.6 °C / 107 F, compared to the average of 36.9 °C / 98 F
(+) In idle usage, the average temperature for the upper side is 24.8 °C / 77 F, compared to the device average of 30.3 °C / 87 F.
(+) The palmrests and touchpad are cooler than skin temperature with a maximum of 29.6 °C / 85.3 F and are therefore cool to the touch.
(±) The average temperature of the palmrest area of similar devices was 28 °C / 82.4 F (-1.6 °C / -2.9 F).
Dell Inspiron 13 7386 audio analysis
(-) | not very loud speakers (64.1 dB)
Bass 100 - 315 Hz
(±) | reduced bass - on average 9.5% lower than median
(+) | bass is linear (5.3% delta to prev. frequency)
Mids 400 - 2000 Hz
(±) | higher mids - on average 5.3% higher than median
(+) | mids are linear (5% delta to prev. frequency)
Highs 2 - 16 kHz
(+) | balanced highs - only 1.8% away from median
(+) | highs are linear (6.6% delta to prev. frequency)
Overall 100 - 16.000 Hz
(±) | linearity of overall sound is average (18.1% difference to median)
Compared to same class
» 39% of all tested devices in this class were better, 7% similar, 54% worse
» The best had a delta of 6%, average was 20%, worst was 57%
Compared to all devices tested
» 38% of all tested devices were better, 8% similar, 54% worse
» The best had a delta of 4%, average was 24%, worst was 134%
Lenovo Yoga 530-14IKB-81EK00CWGE audio analysis
(-) | not very loud speakers (69.9 dB)
Bass 100 - 315 Hz
(-) | nearly no bass - on average 23.6% lower than median
(±) | linearity of bass is average (13.4% delta to prev. frequency)
Mids 400 - 2000 Hz
(+) | balanced mids - only 3.5% away from median
(±) | linearity of mids is average (8.7% delta to prev. frequency)
Highs 2 - 16 kHz
(+) | balanced highs - only 2.6% away from median
(±) | linearity of highs is average (7.2% delta to prev. frequency)
Overall 100 - 16.000 Hz
(±) | linearity of overall sound is average (21.2% difference to median)
Compared to same class
» 57% of all tested devices in this class were better, 11% similar, 32% worse
» The best had a delta of 6%, average was 20%, worst was 57%
Compared to all devices tested
» 59% of all tested devices were better, 7% similar, 34% worse
» The best had a delta of 4%, average was 24%, worst was 134%
HP ProBook x360 440 G1 audio analysis
(±) | speaker loudness is average but good (73.3 dB)
Bass 100 - 315 Hz
(-) | nearly no bass - on average 26.8% lower than median
(±) | linearity of bass is average (8.9% delta to prev. frequency)
Mids 400 - 2000 Hz
(+) | balanced mids - only 3.7% away from median
(±) | linearity of mids is average (7.5% delta to prev. frequency)
Highs 2 - 16 kHz
(±) | higher highs - on average 5.6% higher than median
(±) | linearity of highs is average (7.1% delta to prev. frequency)
Overall 100 - 16.000 Hz
(±) | linearity of overall sound is average (24.6% difference to median)
Compared to same class
» 74% of all tested devices in this class were better, 6% similar, 19% worse
» The best had a delta of 6%, average was 20%, worst was 57%
Compared to all devices tested
» 75% of all tested devices were better, 5% similar, 20% worse
» The best had a delta of 4%, average was 24%, worst was 134%
Lenovo ThinkPad L380 Yoga-20M7001BGE audio analysis
(-) | not very loud speakers (66.7 dB)
Bass 100 - 315 Hz
(-) | nearly no bass - on average 17.5% lower than median
(±) | linearity of bass is average (13.8% delta to prev. frequency)
Mids 400 - 2000 Hz
(+) | balanced mids - only 2.9% away from median
(+) | mids are linear (5.1% delta to prev. frequency)
Highs 2 - 16 kHz
(+) | balanced highs - only 2.4% away from median
(±) | linearity of highs is average (8.7% delta to prev. frequency)
Overall 100 - 16.000 Hz
(±) | linearity of overall sound is average (17.3% difference to median)
Compared to same class
» 33% of all tested devices in this class were better, 8% similar, 59% worse
» The best had a delta of 6%, average was 20%, worst was 57%
Compared to all devices tested
» 32% of all tested devices were better, 8% similar, 59% worse
» The best had a delta of 4%, average was 24%, worst was 134%
| Off / Standby | |
| Idle | |
| Load |
|
Key:
min: | |
| Dell Inspiron 13 7386 i7-8565U, UHD Graphics 620, SK Hynix BC501 HFM512GDJTNG, IPS, 3840x2160, 13.3" | Lenovo Yoga 530-14IKB-81EK00CWGE i5-8250U, UHD Graphics 620, SK hynix PC401 HFS256GD9TNG, IPS, 1920x1080, 14" | HP ProBook x360 440 G1 i5-8250U, UHD Graphics 620, Toshiba KBG30ZMV256G, IPS, 1920x1080, 14" | Lenovo ThinkPad L380 Yoga-20M7001BGE i5-8250U, UHD Graphics 620, Samsung PM961 MZVLW256HEHP, IPS LED, 1920x1080, 13.3" | Average Intel UHD Graphics 620 | Average of class Convertible | |
|---|---|---|---|---|---|---|
| Power Consumption | 37% | 20% | 35% | 21% | 5% | |
| Idle Minimum * (Watt) | 6.5 | 3.3 49% | 4.6 29% | 3.44 47% | 3.81 ? 41% | 4.24 ? 35% |
| Idle Average * (Watt) | 12.2 | 5.8 52% | 7.5 39% | 6.9 43% | 6.94 ? 43% | 7.03 ? 42% |
| Idle Maximum * (Watt) | 12.7 | 8 37% | 9.6 24% | 9.2 28% | 8.75 ? 31% | 8.61 ? 32% |
| Load Average * (Watt) | 39 | 29.2 25% | 37 5% | 27.6 29% | 35 ? 10% | 43.9 ? -13% |
| Load Maximum * (Watt) | 39 | 31.1 20% | 38.8 1% | 29 26% | 47.5 ? -22% | 67.2 ? -72% |
* ... smaller is better
| Dell Inspiron 13 7386 i7-8565U, UHD Graphics 620, 38 Wh | Lenovo Yoga 530-14IKB-81EK00CWGE i5-8250U, UHD Graphics 620, 45 Wh | HP ProBook x360 440 G1 i5-8250U, UHD Graphics 620, 48 Wh | Lenovo ThinkPad L380 Yoga-20M7001BGE i5-8250U, UHD Graphics 620, 45 Wh | Average of class Convertible | |
|---|---|---|---|---|---|
| Battery runtime | 73% | 104% | 64% | 180% | |
| Reader / Idle (h) | 6.7 | 15.3 128% | 17.3 158% | 13.9 107% | 27.7 ? 313% |
| H.264 (h) | 5.5 | 9.1 65% | 8.3 51% | 8.5 55% | 15.3 ? 178% |
| WiFi v1.3 (h) | 3.9 | 7 79% | 8.9 128% | 7 79% | 12.1 ? 210% |
| Load (h) | 1.5 | 1.8 20% | 2.7 80% | 1.7 13% | 1.779 ? 19% |
Pros
Cons
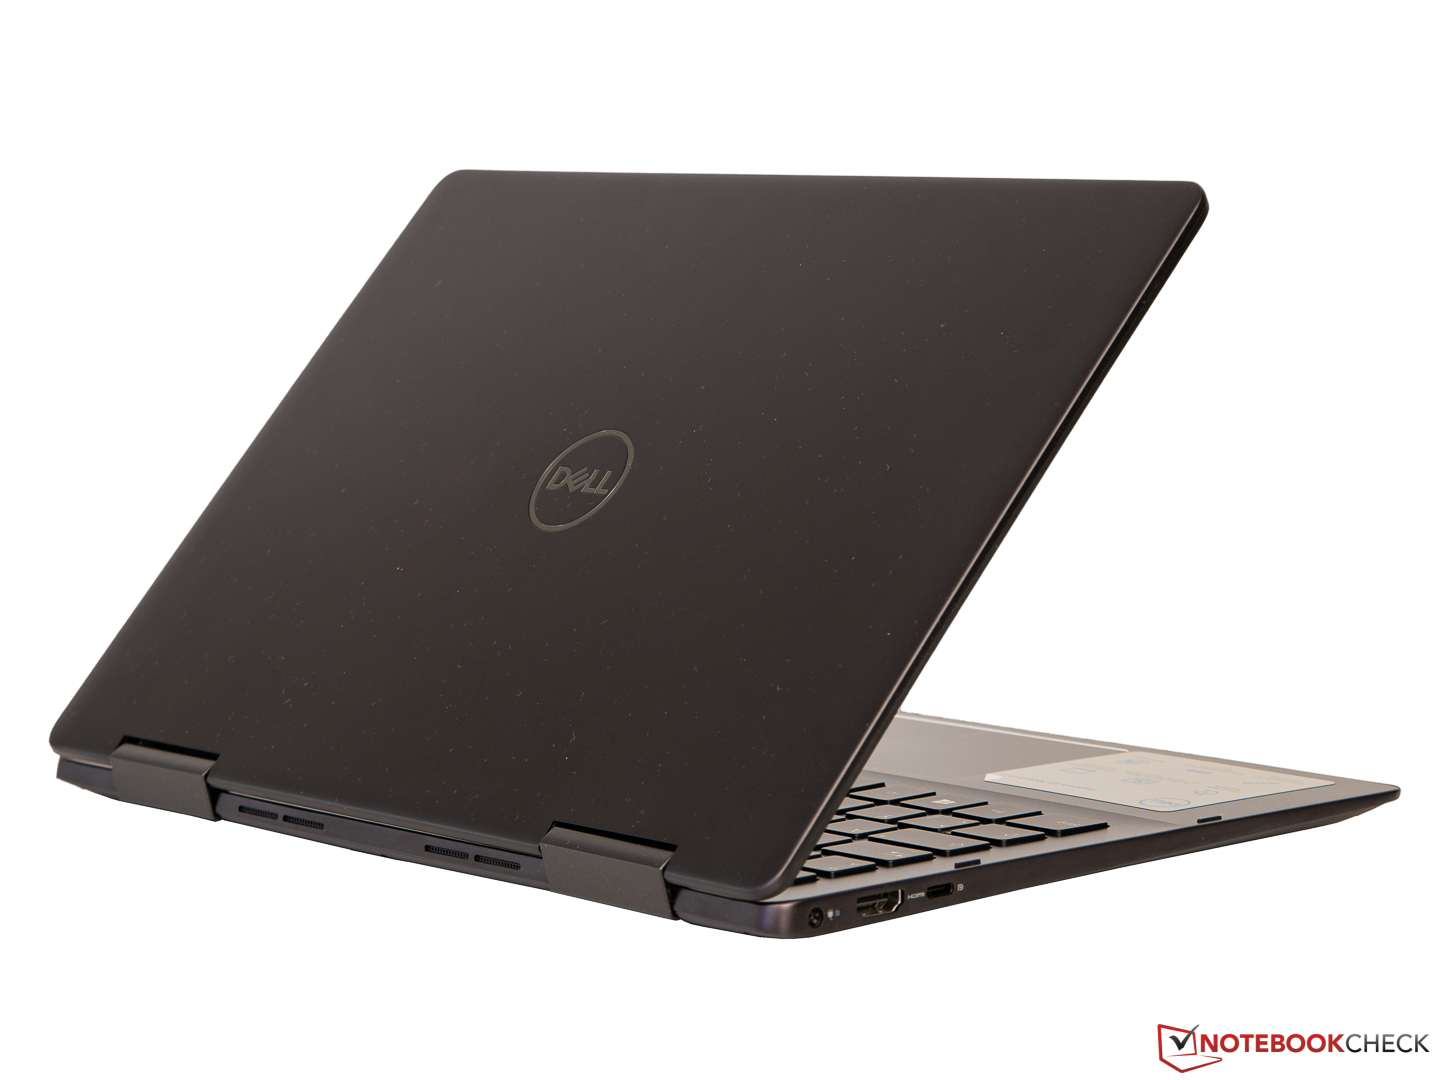
戴尔Inspiron 13 7386二合一黑色版从数据上看是一台不错的笔记本电脑。它包含强大的处理器,大量的RAM和大容量SSD。此外,它比竞品具有更高的分辨率显示,其铝制外壳看起来也•更优质。
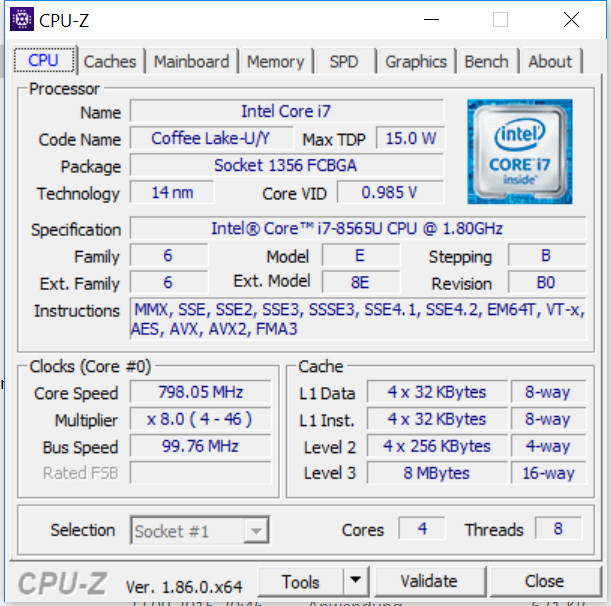
不幸的是,当我们开始测试时,这一切都显得不值得。i7-8565U在我们的对比设备中的性能比i5-8250U还要差,其SSD并不是特别快,而且与FHD相比,其UHD显示器不值得戴尔收取额外的1400元。外壳也是吸指纹利器,电池续航时间非常差。
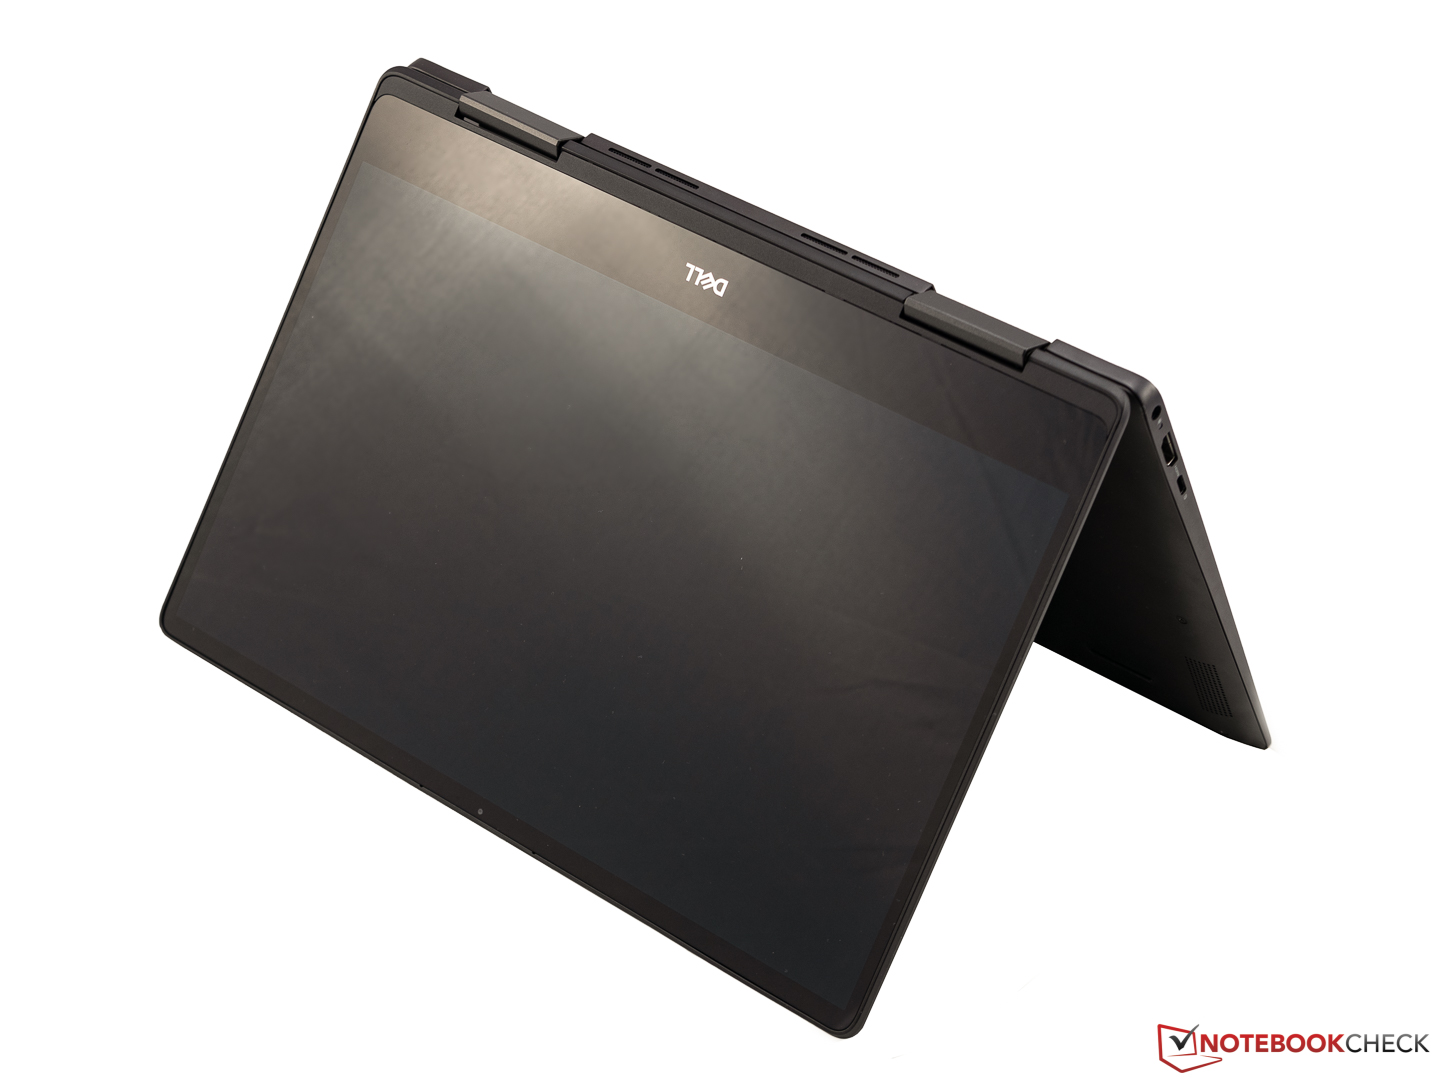
“戴尔Inspiron 13 7386二合一黑色版有可能成为一款出色的翻转本,但它的电池续航能力,高功耗以及差劲的性能令人失望。”
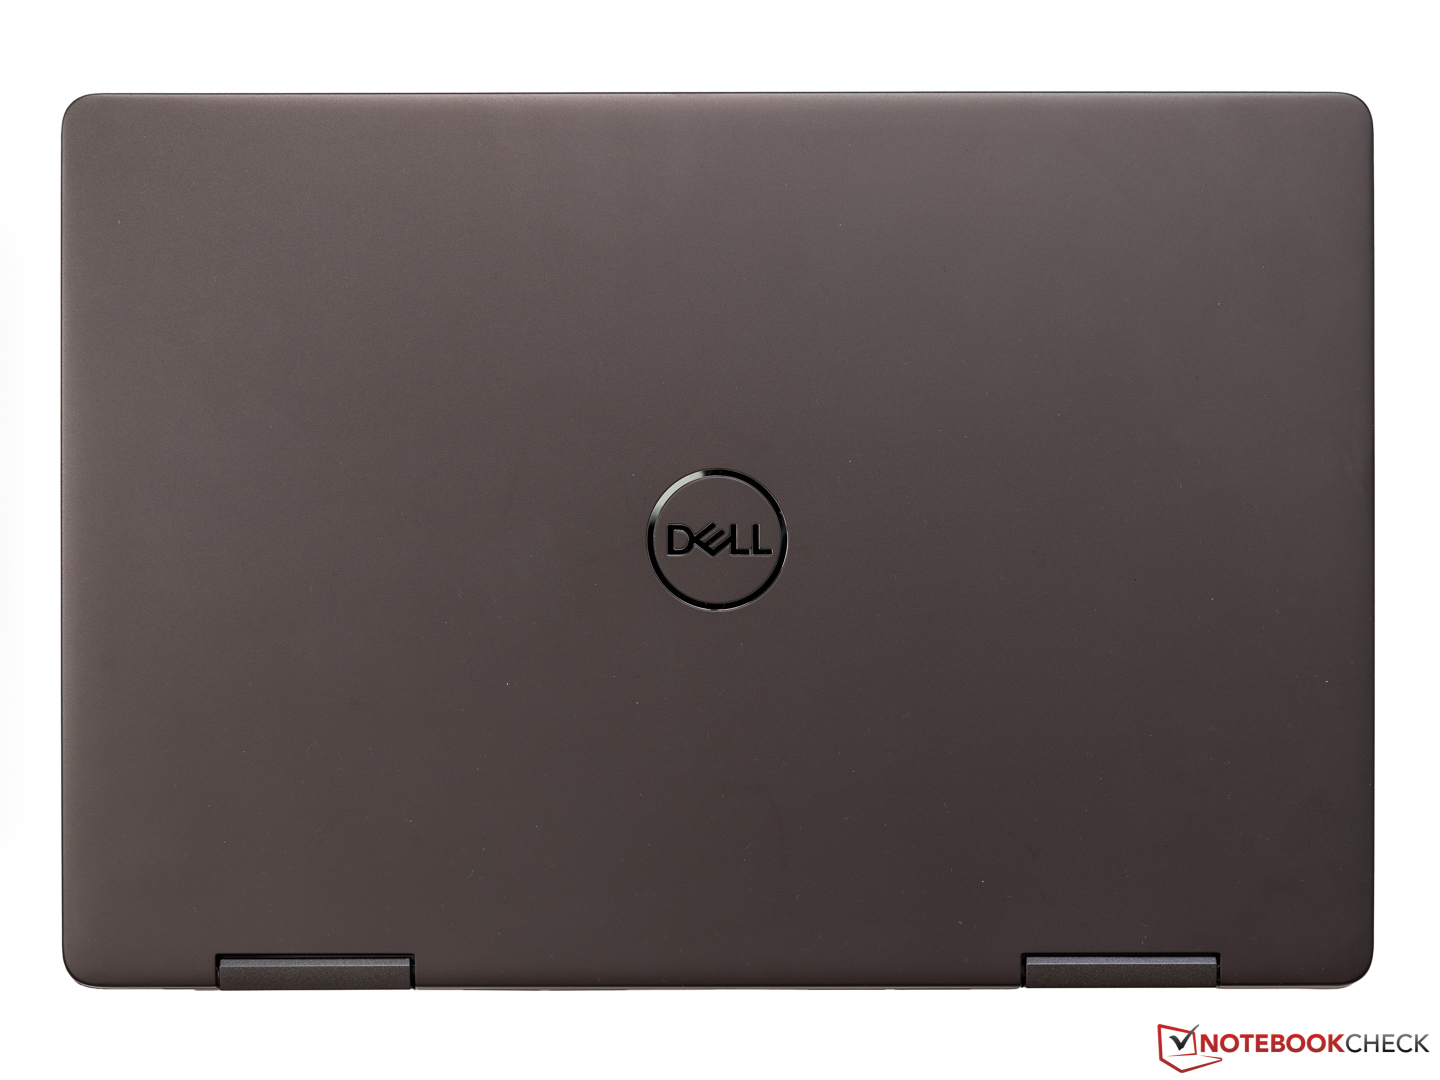
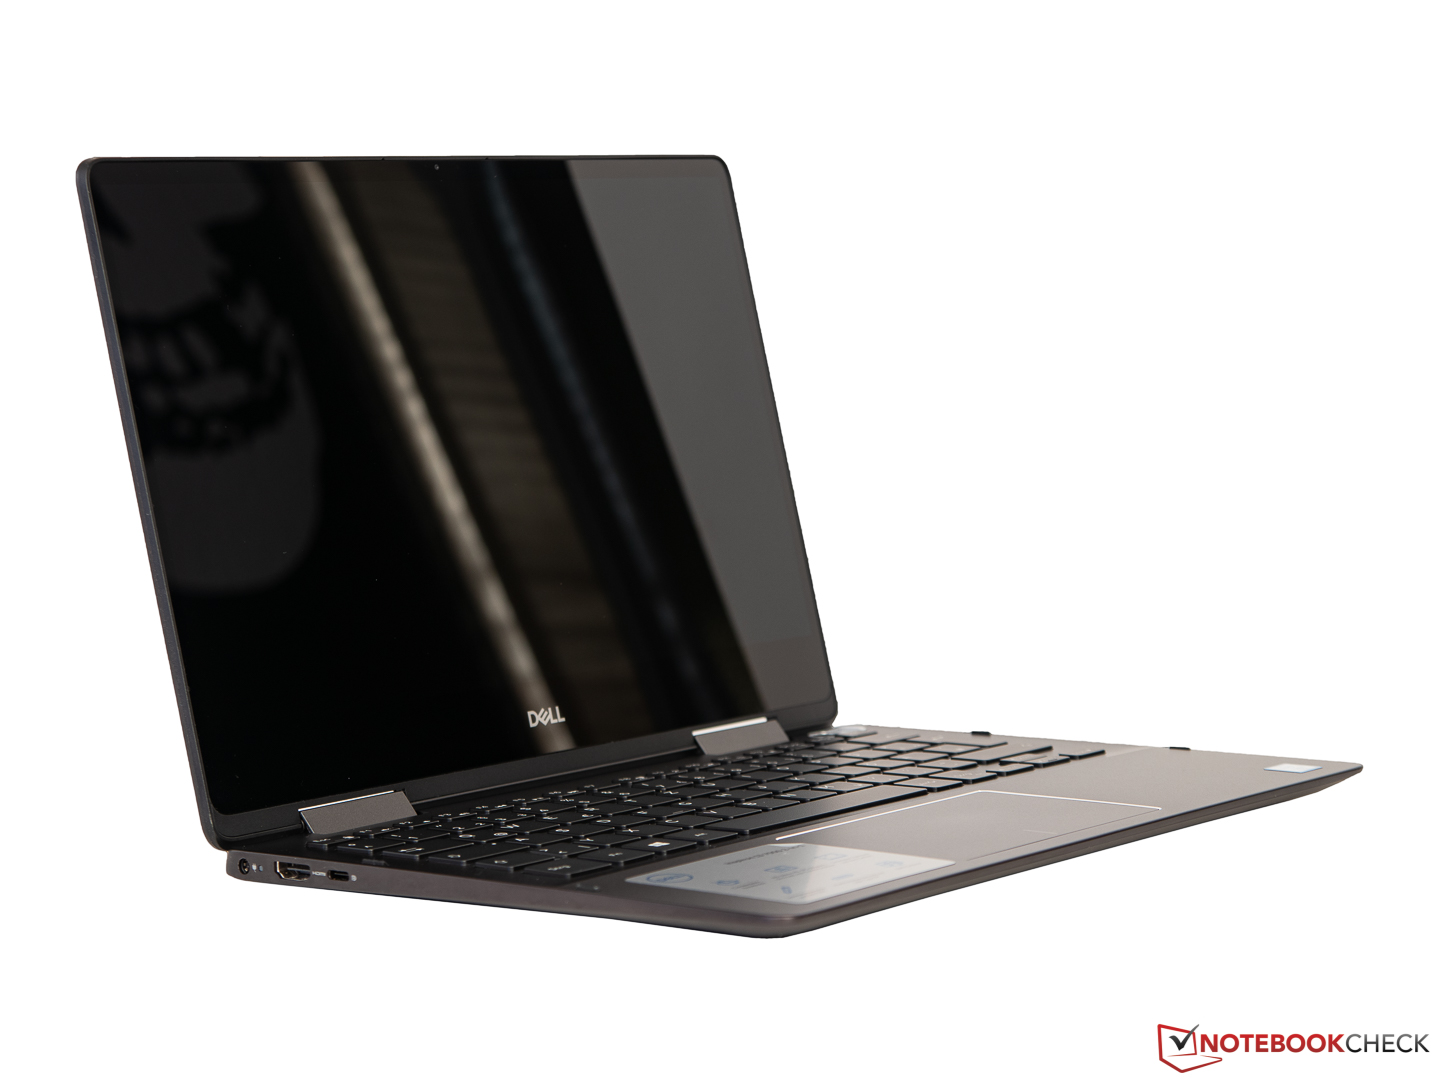
由于戴尔的工业素质,灵越7386制作精良,拥有坚固的输入设备。屏幕颜色准确的,尽管只适用于非专业图像工作。扬声器作为一台笔记本来说也让我们感到惊喜。您可以根据需要更改设备的众多配置选项。
请记住,有一些缺点仅限于我们的测试设备,如鼠标左键不工作。如果您喜欢Inspiron 13 7000 2合1系列,那么我们建议您考虑7386的基本型号,它更物有所值,它的i5-8265U处理器不会严重降频,它应该有更长的续航时间,它的FHD显示器也应该有助于降低功耗。
Dell Inspiron 13 7386
- 01/22/2019 v6 (old)
Sven Kloevekorn
Price comparison

