惠普 Spectre x2 12-a003ng (K3D42EA) 笔记本电脑简短评测
| |||||||||||||||||||||||||
Brightness Distribution: 91 %
Center on Battery: 353 cd/m²
Contrast: 802:1 (Black: 0.44 cd/m²)
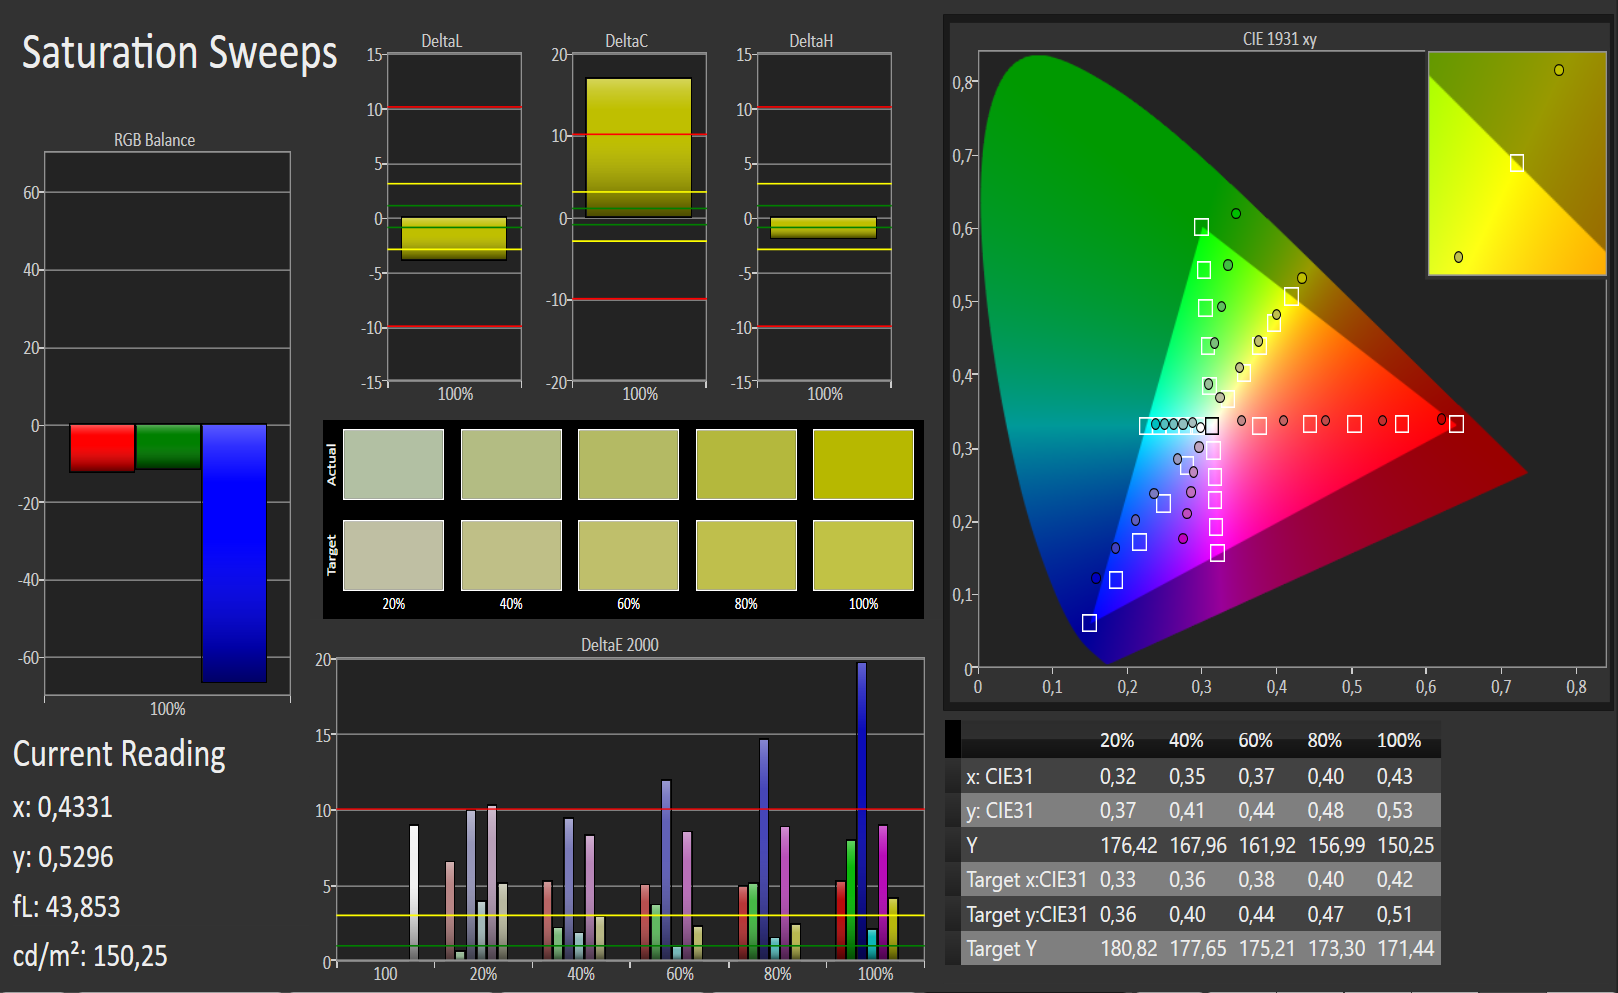
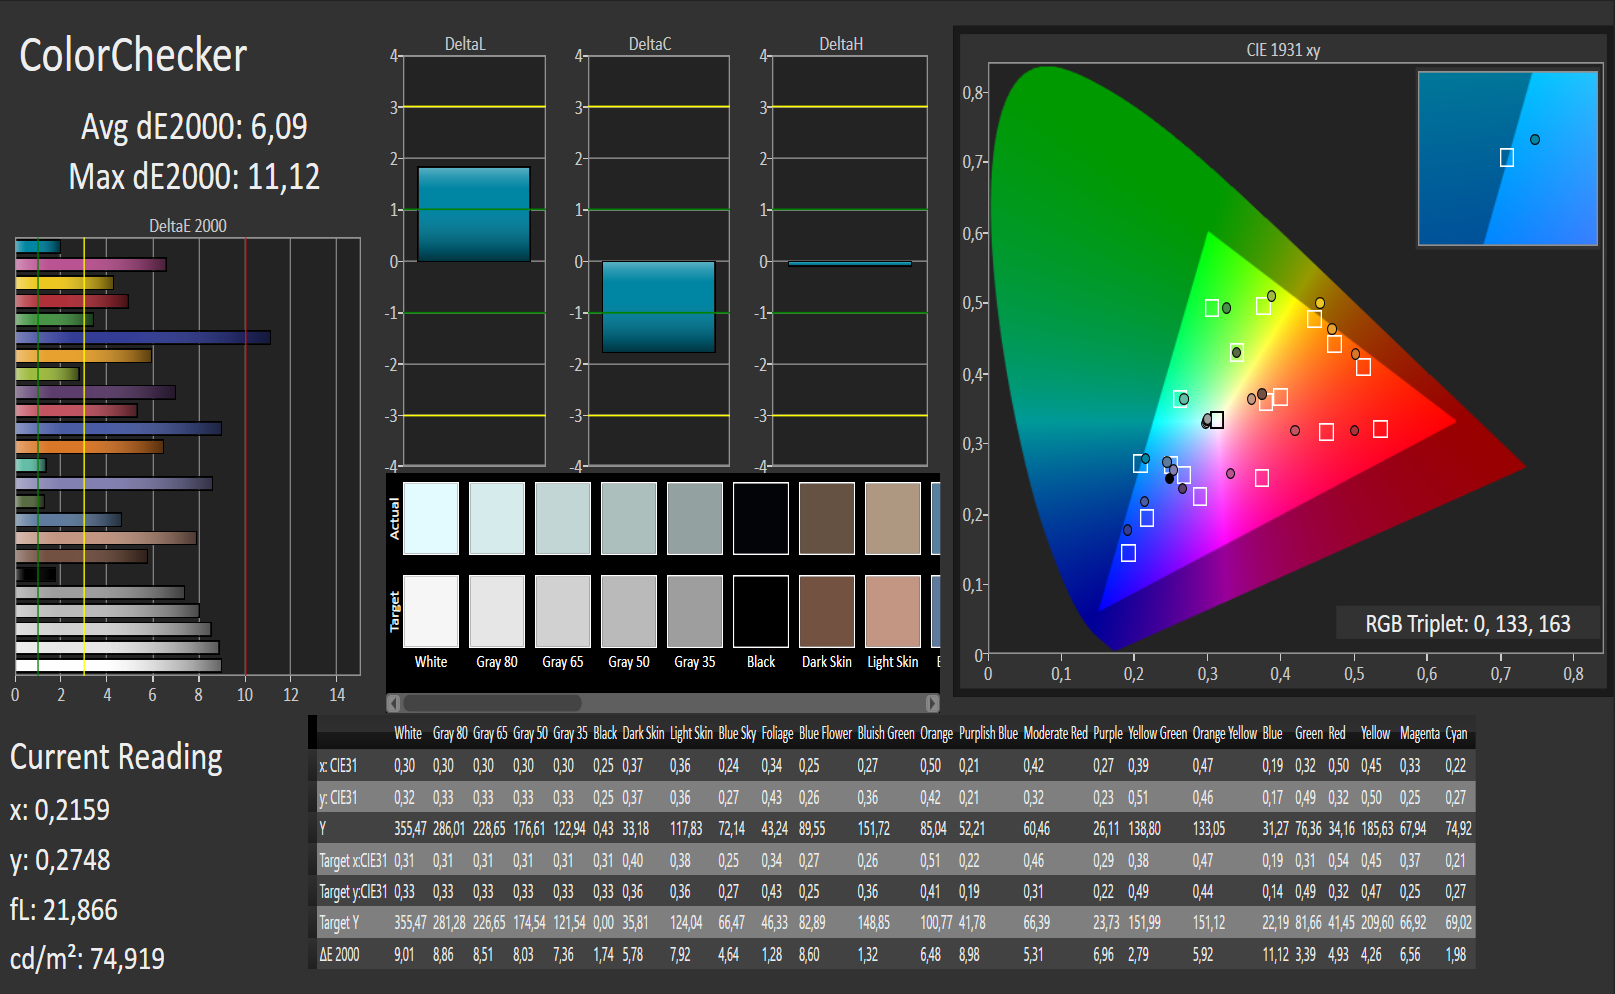
ΔE ColorChecker Calman: 6.09 | ∀{0.5-29.43 Ø4.72}
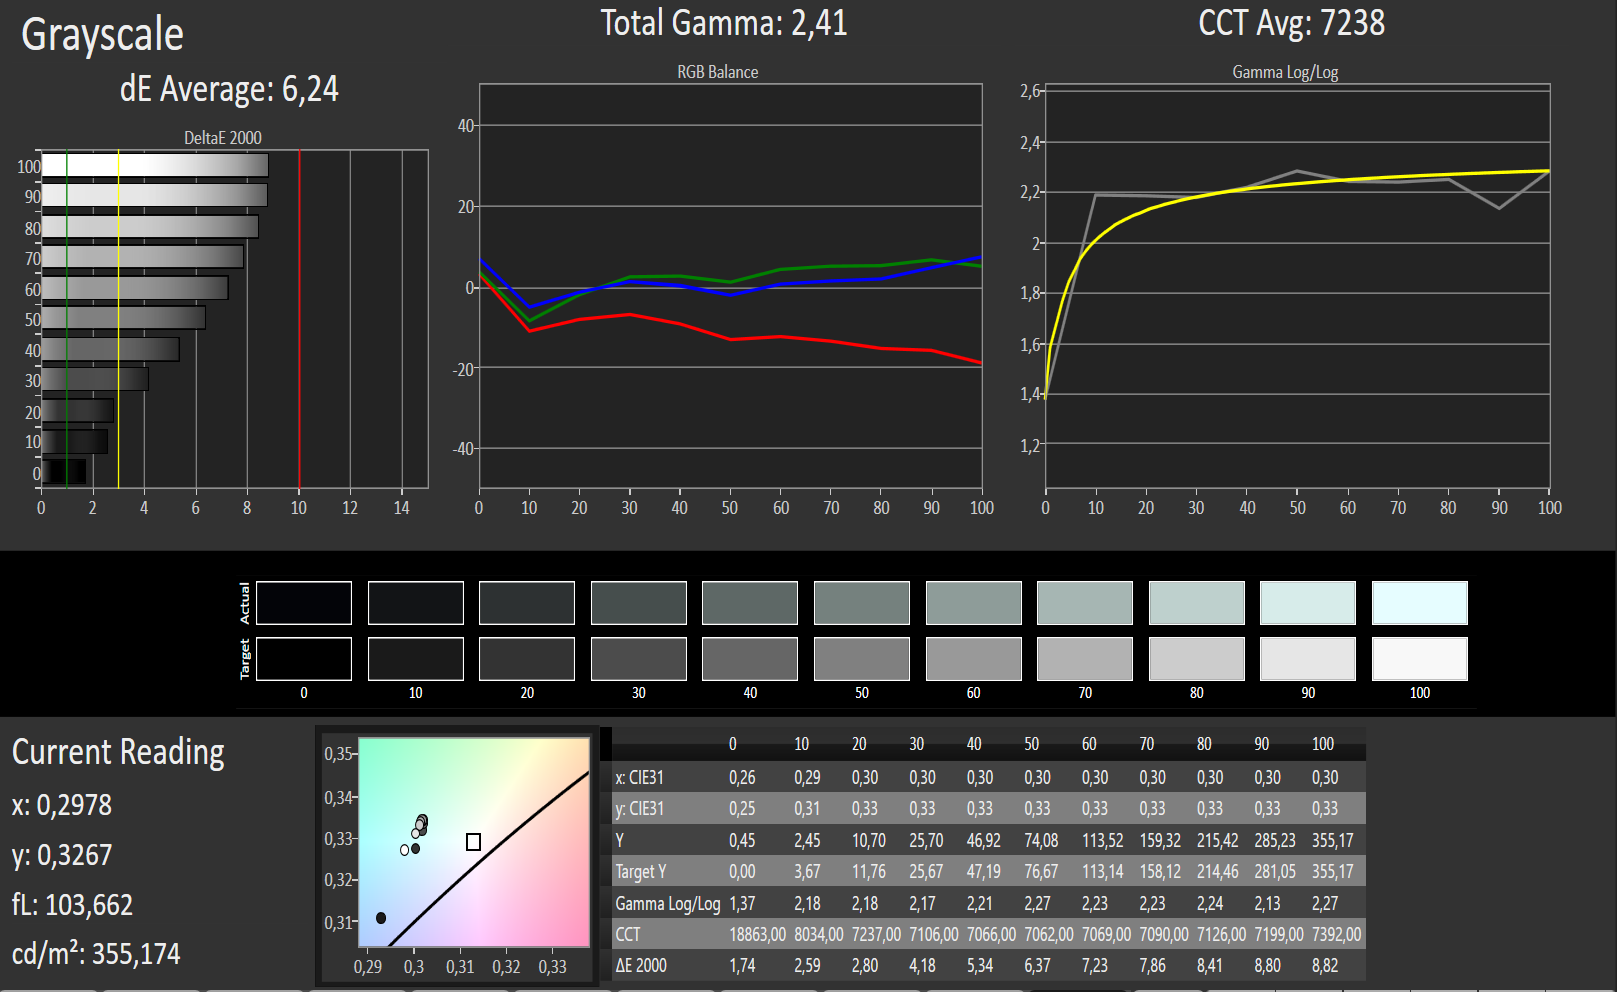
ΔE Greyscale Calman: 6.24 | ∀{0.09-98 Ø4.97}
71% sRGB (Argyll 1.6.3 3D)
46% AdobeRGB 1998 (Argyll 1.6.3 3D)
52.6% AdobeRGB 1998 (Argyll 3D)
71.8% sRGB (Argyll 3D)
52.9% Display P3 (Argyll 3D)
Gamma: 2.41
CCT: 7238 K
| HP Spectre x2 12 1920x1080 | MS Surface Pro 4 2736x1824 | Lenovo TP Helix 2 1920x1080 | Toshiba Z20t-B 1920x1080 | MS Surface Book i5 3000x2000 | Acer AS R7-371T 1920x1080 | Fujitsu Stylistic Q665 1920x1080 | |
|---|---|---|---|---|---|---|---|
| Display | 31% | -15% | 30% | 29% | |||
| Display P3 Coverage (%) | 52.9 | 67.5 28% | 42.63 -19% | 67 27% | 66.1 25% | ||
| sRGB Coverage (%) | 71.8 | 96.6 35% | 63.6 -11% | 95.8 33% | 96.4 34% | ||
| AdobeRGB 1998 Coverage (%) | 52.6 | 69 31% | 44.1 -16% | 68.9 31% | 68.1 29% | ||
| Response Times | -9% | -15% | -83% | ||||
| Response Time Grey 50% / Grey 80% * (ms) | 47 ? | 46 ? 2% | 48.4 ? -3% | 74 ? -57% | |||
| Response Time Black / White * (ms) | 26 ? | 31 ? -19% | 32.8 ? -26% | 54 ? -108% | |||
| PWM Frequency (Hz) | 50 ? | 211 ? | |||||
| Screen | 33% | 20% | -17% | 44% | 15% | 25% | |
| Brightness middle (cd/m²) | 353 | 389.2 10% | 365 3% | 342 -3% | 430.9 22% | 321 -9% | 332 -6% |
| Brightness (cd/m²) | 347 | 392 13% | 342 -1% | 301 -13% | 410 18% | 322 -7% | 321 -7% |
| Brightness Distribution (%) | 91 | 92 1% | 86 -5% | 76 -16% | 93 2% | 83 -9% | 86 -5% |
| Black Level * (cd/m²) | 0.44 | 0.27 39% | 0.329 25% | 0.393 11% | 0.254 42% | 0.32 27% | 0.19 57% |
| Contrast (:1) | 802 | 1441 80% | 1109 38% | 870 8% | 1696 111% | 1003 25% | 1747 118% |
| Colorchecker dE 2000 * | 6.09 | 3.61 41% | 4.37 28% | 9.69 -59% | 2.06 66% | 4.79 21% | 5.56 9% |
| Greyscale dE 2000 * | 6.24 | 3.8 39% | 2.8 55% | 9.27 -49% | 2.22 64% | 2.67 57% | 7.01 -12% |
| Gamma | 2.41 91% | 2.16 102% | 2.3 96% | 2.95 75% | 2.13 103% | 2.52 87% | 2.27 97% |
| CCT | 7238 90% | 5969 109% | 6595 99% | 6010 108% | 6520 100% | 6835 95% | 8459 77% |
| Color Space (Percent of AdobeRGB 1998) (%) | 46 | 63 37% | 40.4 -12% | 64 39% | 63 37% | ||
| Color Space (Percent of sRGB) (%) | 71 | 97 37% | 96 35% | 97 37% | |||
| Total Average (Program / Settings) | 18% /
27% | 20% /
20% | -16% /
-16% | 20% /
33% | 15% /
15% | -10% /
11% |
* ... smaller is better
Display Response Times
| ↔ Response Time Black to White | ||
|---|---|---|
| 26 ms ... rise ↗ and fall ↘ combined | ↗ 5 ms rise | 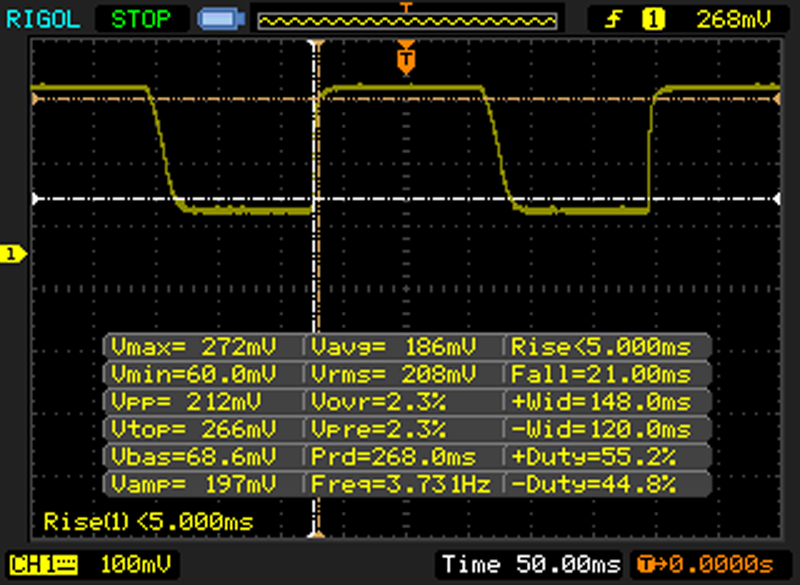 |
| ↘ 21 ms fall | ||
| The screen shows relatively slow response rates in our tests and may be too slow for gamers. In comparison, all tested devices range from 0.1 (minimum) to 240 (maximum) ms. » 63 % of all devices are better. This means that the measured response time is worse than the average of all tested devices (19.8 ms). | ||
| ↔ Response Time 50% Grey to 80% Grey | ||
| 47 ms ... rise ↗ and fall ↘ combined | ↗ 16 ms rise | 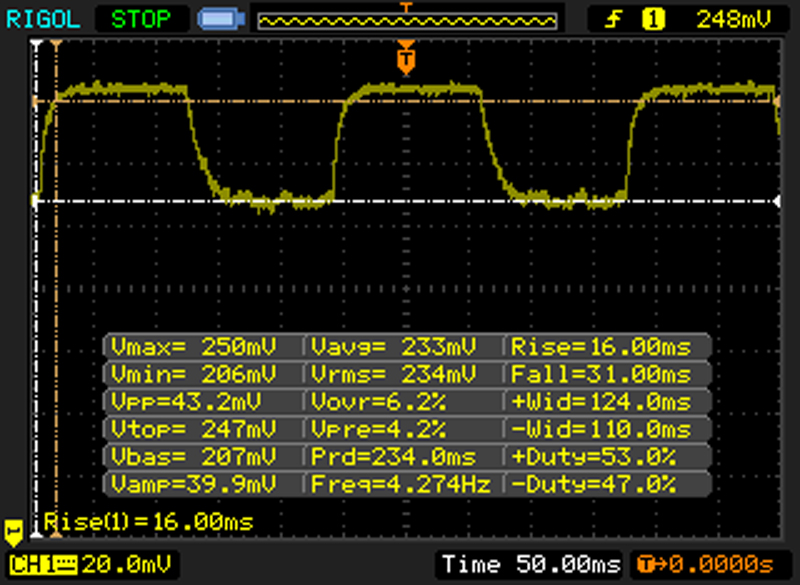 |
| ↘ 31 ms fall | ||
| The screen shows slow response rates in our tests and will be unsatisfactory for gamers. In comparison, all tested devices range from 0.165 (minimum) to 636 (maximum) ms. » 81 % of all devices are better. This means that the measured response time is worse than the average of all tested devices (31 ms). | ||
Screen Flickering / PWM (Pulse-Width Modulation)
| Screen flickering / PWM not detected | ||
In comparison: 52 % of all tested devices do not use PWM to dim the display. If PWM was detected, an average of 7747 (minimum: 5 - maximum: 343500) Hz was measured. | ||
| PCMark 8 Home Score Accelerated v2 | 2675 points | |
| PCMark 8 Creative Score Accelerated v2 | 3362 points | |
| PCMark 8 Work Score Accelerated v2 | 4078 points | |
Help | ||
| HP Spectre x2 12 Sandisk X300 SD7SN6S-256G | MS Surface Pro 4 m3 Samsung MZFLV128 NVMe | MS Surface Pro 4 i7 Samsung MZFLV256 NVMe | Lenovo TP Helix 2 Toshiba THNSFJ256GDNU | Toshiba Z20t-B Toshiba HG6 THNSNJ256GVNU | MS Surface Book i5 Samsung MZFLV256 NVMe | Fujitsu Stylistic Q665 Samsung PM851 MZNTE256HMHP | |
|---|---|---|---|---|---|---|---|
| AS SSD | 53% | 120% | 3% | 42% | 121% | 29% | |
| Seq Read (MB/s) | 439.1 | 845 92% | 1312 199% | 473.9 8% | 513 17% | 1223 179% | 509 16% |
| Seq Write (MB/s) | 216.9 | 138.1 -36% | 274.8 27% | 216.4 0% | 457.2 111% | 275.2 27% | 232.7 7% |
| 4K Read (MB/s) | 23.12 | 31.39 36% | 33.47 45% | 14.63 -37% | 21.4 -7% | 34.31 48% | 30.4 31% |
| 4K Write (MB/s) | 49.2 | 63.2 28% | 89.2 81% | 41.14 -16% | 76.8 56% | 85 73% | 77.6 58% |
| Score Total (Points) | 722 | 1759 144% | 2518 249% | 1152 60% | 954 32% | 2712 276% | 943 31% |
| CrystalDiskMark 3.0 | 12% | 62% | -17% | 32% | 25% | ||
| Read Seq (MB/s) | 410.1 | 663 62% | 834 103% | 422.7 3% | 530 29% | 526 28% | |
| Write Seq (MB/s) | 316 | 158.2 -50% | 304 -4% | 247.4 -22% | 473.3 50% | 242.1 -23% | |
| Read 4k (MB/s) | 27.4 | 30.14 10% | 40.75 49% | 19.44 -29% | 22.91 -16% | 34.32 25% | |
| Write 4k (MB/s) | 53.5 | 68 27% | 106.3 99% | 43.08 -19% | 88.2 65% | 90.6 69% | |
| Total Average (Program / Settings) | 33% /
35% | 91% /
94% | -7% /
-6% | 37% /
37% | 121% /
121% | 27% /
27% |

| 3DMark 06 Standard Score | 6293 points | |
| 3DMark 11 Performance | 1098 points | |
| 3DMark Ice Storm Standard Score | 42545 points | |
| 3DMark Cloud Gate Standard Score | 4546 points | |
| 3DMark Fire Strike Score | 660 points | |
Help | ||
| low | med. | high | ultra | |
|---|---|---|---|---|
| Crysis 3 (2013) | 20.2 | 12.9 | 8.3 | |
| Fifa 15 (2014) | 38.3 | 29.6 | 15.1 | |
| Battlefield Hardline (2015) | 25.9 | 20.5 | 8.3 |
| HP Spectre x2 12-a003ng K3D42EA HD Graphics 515, 6Y75, Sandisk X300 SD7SN6S-256G-1006 | Microsoft Surface Pro 4, Core m3 HD Graphics 515, 6Y30, Samsung MZFLV128 NVMe | Microsoft Surface Pro 4, Core i5, 128GB HD Graphics 520, 6300U, Samsung MZFLV128 NVMe | Microsoft Surface Pro 4 Core i7 Iris Graphics 540, 6650U, Samsung MZFLV256 NVMe | Lenovo ThinkPad Helix 2 HD Graphics 5300, 5Y71, Toshiba THNSFJ256GDNU 256 GB | Toshiba Portege Z20t-B-10C HD Graphics 5300, 5Y71, Toshiba HG6 THNSNJ256GVNU | Microsoft Surface Book Core i5 Maxwell GPU (940M, GDDR5), 6300U, Samsung MZFLV256 NVMe | Fujitsu Stylistic Q665 HD Graphics 5300, 5Y31, Samsung SSD PM851 256 GB MZNTE256HMHP | |
|---|---|---|---|---|---|---|---|---|
| Heat | -2% | -24% | 9% | 0% | 1% | 10% | -5% | |
| Maximum Upper Side * (°C) | 43.5 | 43.6 -0% | 52.3 -20% | 45.4 -4% | 42.1 3% | 48.3 -11% | 44.2 -2% | 50.8 -17% |
| Maximum Bottom * (°C) | 42 | 45.2 -8% | 51.4 -22% | 43.2 -3% | 42.3 -1% | 43.2 -3% | 41.2 2% | 45.1 -7% |
| Idle Upper Side * (°C) | 33 | 32.4 2% | 43.2 -31% | 25.2 24% | 31.3 5% | 28.9 12% | 26 21% | 33.1 -0% |
| Idle Bottom * (°C) | 29.3 | 29.6 -1% | 36 -23% | 24 18% | 31.3 -7% | 27.7 5% | 23.8 19% | 28.1 4% |
* ... smaller is better
(±) The maximum temperature on the upper side is 43.5 °C / 110 F, compared to the average of 35.4 °C / 96 F, ranging from 19.6 to 60 °C for the class Convertible.
(±) The bottom heats up to a maximum of 42 °C / 108 F, compared to the average of 36.9 °C / 98 F
(+) In idle usage, the average temperature for the upper side is 29.3 °C / 85 F, compared to the device average of 30.3 °C / 87 F.
(±) The palmrests and touchpad can get very hot to the touch with a maximum of 37.2 °C / 99 F.
(-) The average temperature of the palmrest area of similar devices was 28 °C / 82.4 F (-9.2 °C / -16.6 F).
| HP Spectre x2 12-a003ng K3D42EA HD Graphics 515, 6Y75, Sandisk X300 SD7SN6S-256G-1006 | Microsoft Surface Pro 4, Core i5, 128GB HD Graphics 520, 6300U, Samsung MZFLV128 NVMe | Lenovo ThinkPad Helix 2 HD Graphics 5300, 5Y71, Toshiba THNSFJ256GDNU 256 GB | Toshiba Portege Z20t-B-10C HD Graphics 5300, 5Y71, Toshiba HG6 THNSNJ256GVNU | Lenovo ThinkPad Yoga 12 HD Graphics 5500, 5200U, Seagate ST500LM000 Solid State Hybrid Drive | Fujitsu Stylistic Q665 HD Graphics 5300, 5Y31, Samsung SSD PM851 256 GB MZNTE256HMHP | |
|---|---|---|---|---|---|---|
| Power Consumption | -8% | 13% | 18% | -26% | 29% | |
| Idle Minimum * (Watt) | 4.5 | 4.4 2% | 2 56% | 2.4 47% | 3.6 20% | 3.3 27% |
| Idle Average * (Watt) | 7.7 | 9 -17% | 6 22% | 4.6 40% | 8 -4% | 5.2 32% |
| Idle Maximum * (Watt) | 8.3 | 10.7 -29% | 6.6 20% | 5.6 33% | 8.9 -7% | 6.4 23% |
| Load Average * (Watt) | 19.8 | 19.6 1% | 17.6 11% | 15.6 21% | 32.7 -65% | 13.6 31% |
| Load Maximum * (Watt) | 20.6 | 19.9 3% | 29.7 -44% | 30.7 -49% | 35.7 -73% | 14 32% |
* ... smaller is better
| Off / Standby | |
| Idle | |
| Load |
|
Key:
min: | |
| HP Spectre x2 12 42 Wh 1920x1080 | MS Surface Pro 4 m3 38 Wh 2736x1824 | MS Surface Pro 4 i5 38 Wh 2736x1824 | MS Surface Pro 4 i7 38 Wh 2736x1824 | Lenovo TP Helix 2 35 Wh 1920x1080 | Toshiba Z20t-B 72 Wh 1920x1080 | Fujitsu Stylistic Q665 38 Wh 1920x1080 | |
|---|---|---|---|---|---|---|---|
| Battery runtime | 0% | -7% | -34% | 10% | 96% | 38% | |
| Reader / Idle (h) | 15.9 | 13.2 -17% | 15 -6% | 10.9 -31% | 16.1 1% | 26.9 69% | |
| WiFi v1.3 (h) | 6 | 8.1 35% | 7.1 18% | 4.9 -18% | 12.7 112% | 8.3 38% | |
| Load (h) | 2.8 | 2.3 -18% | 1.9 -32% | 1.3 -54% | 3.3 18% | 5.8 107% | |
| H.264 (h) | 6 | 13.1 | |||||
| WiFi (h) | 6.6 |
Pros
Cons
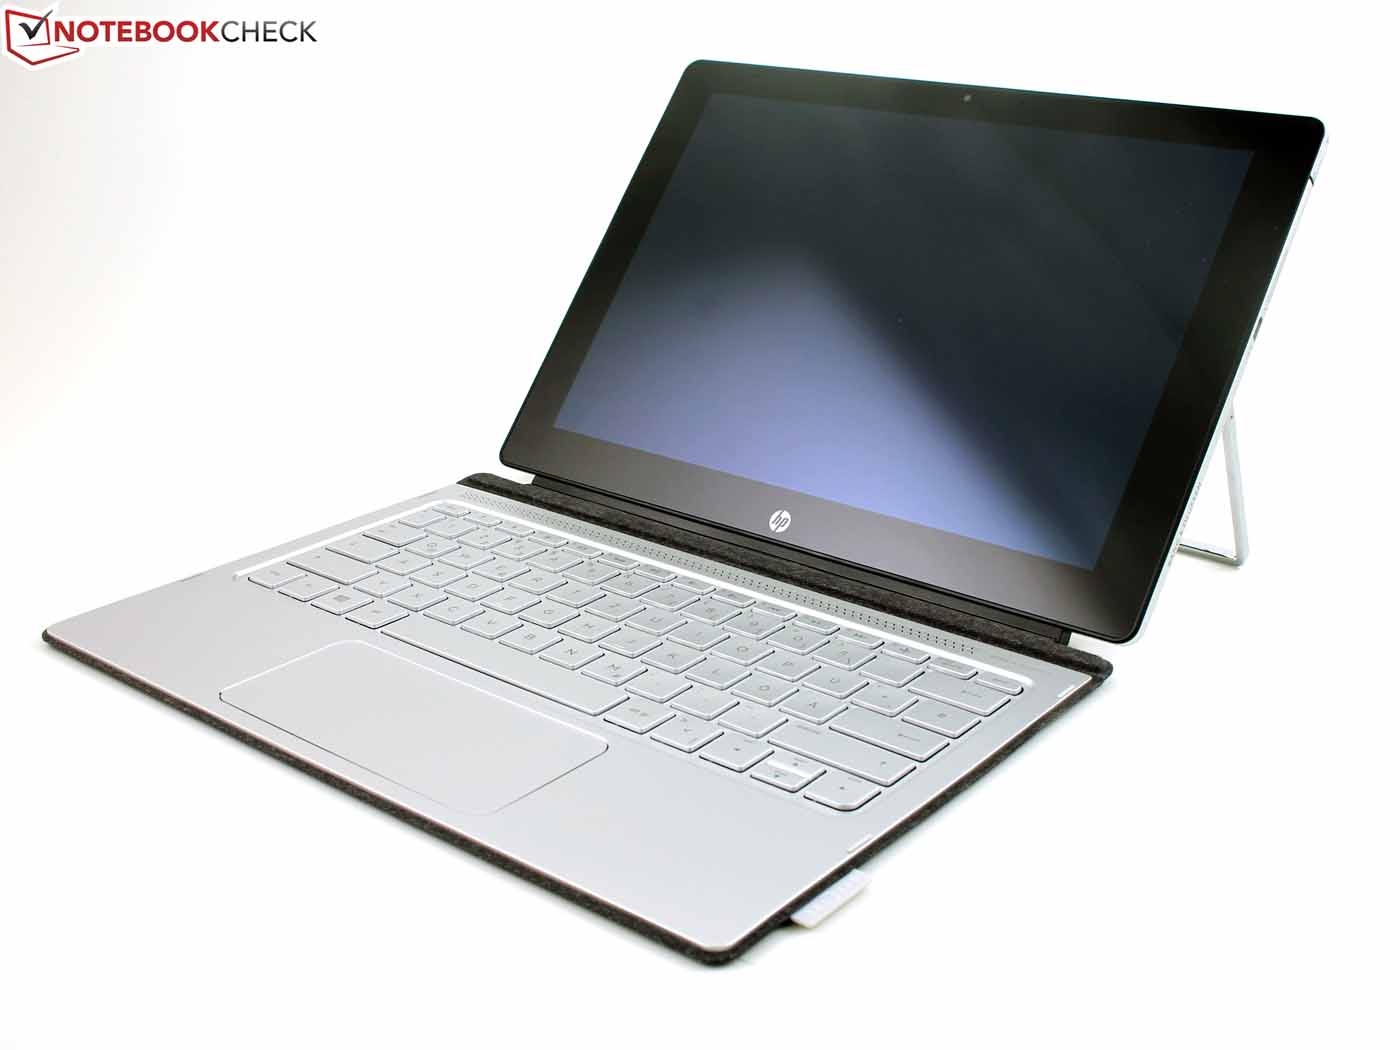
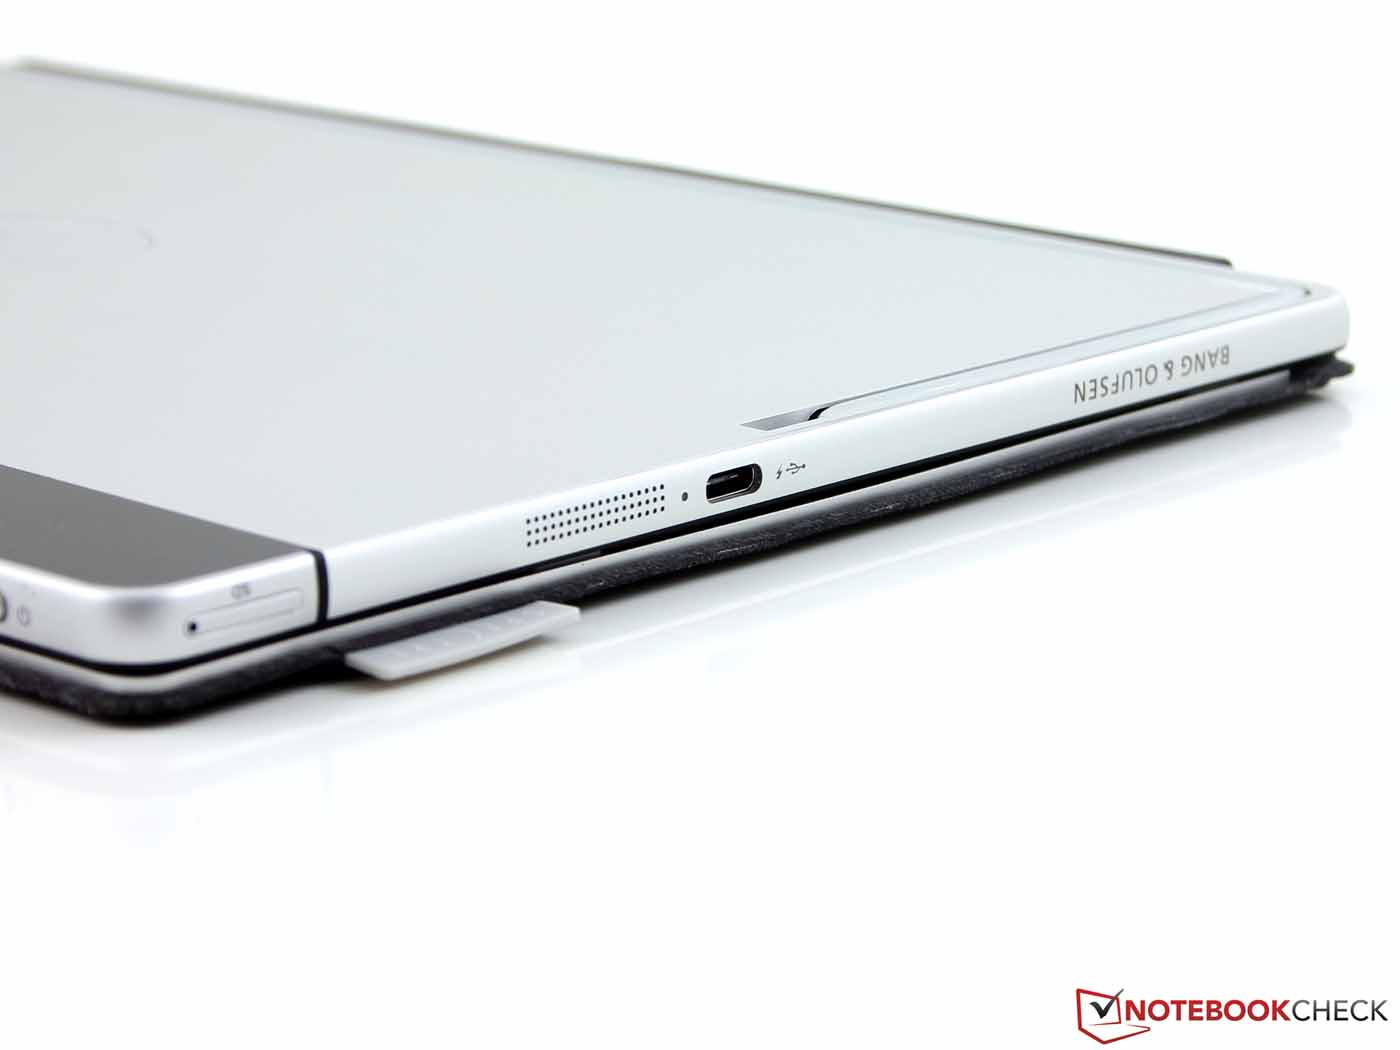
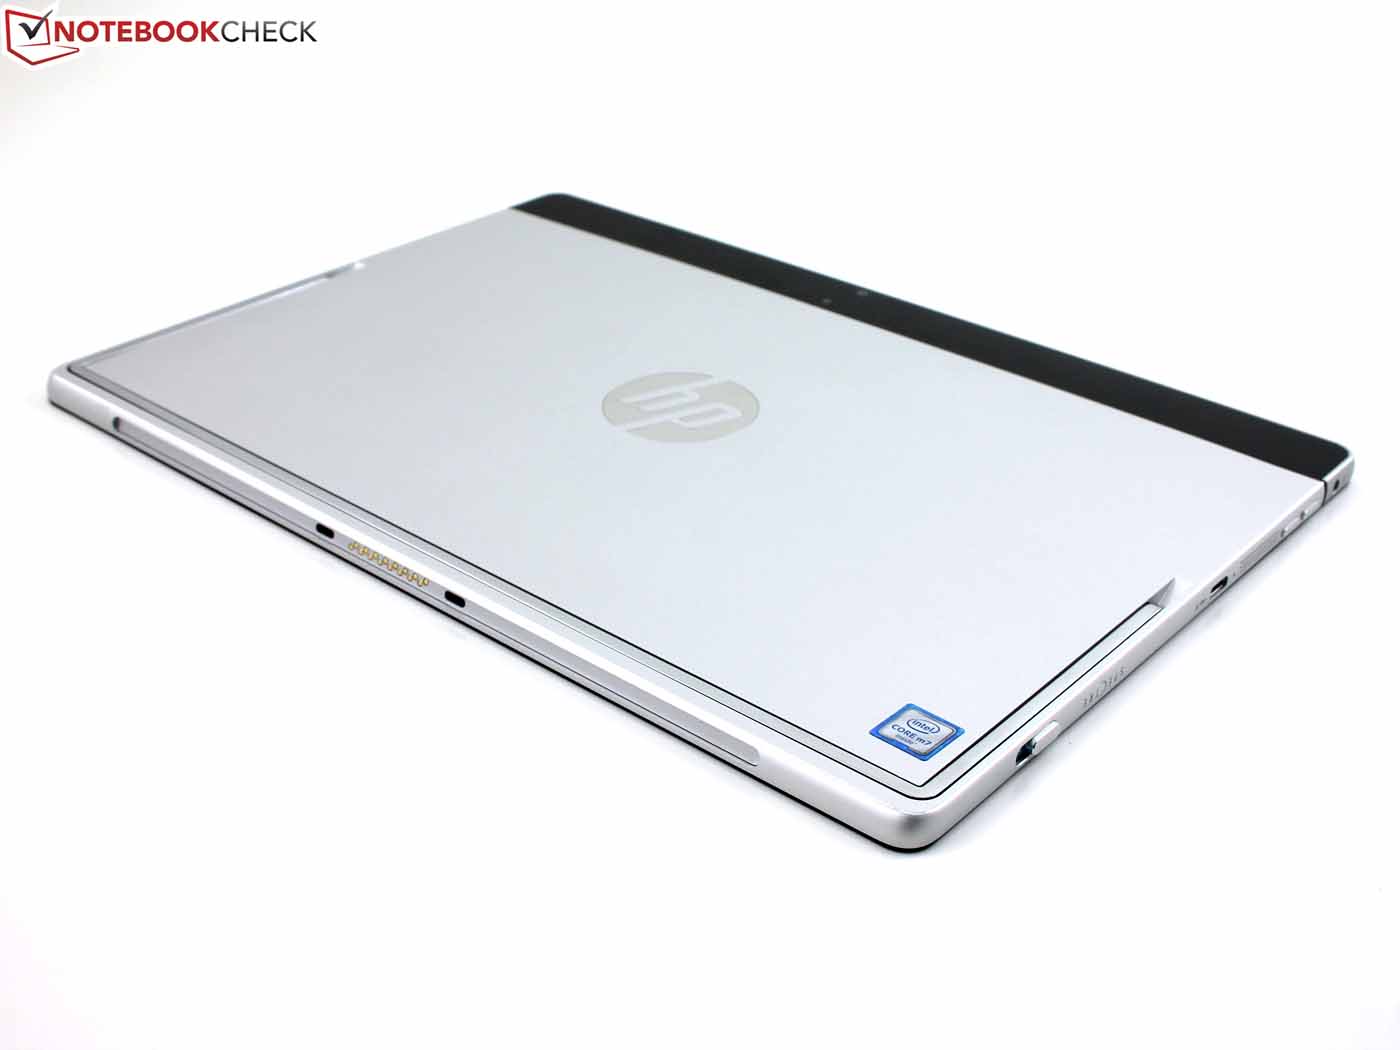
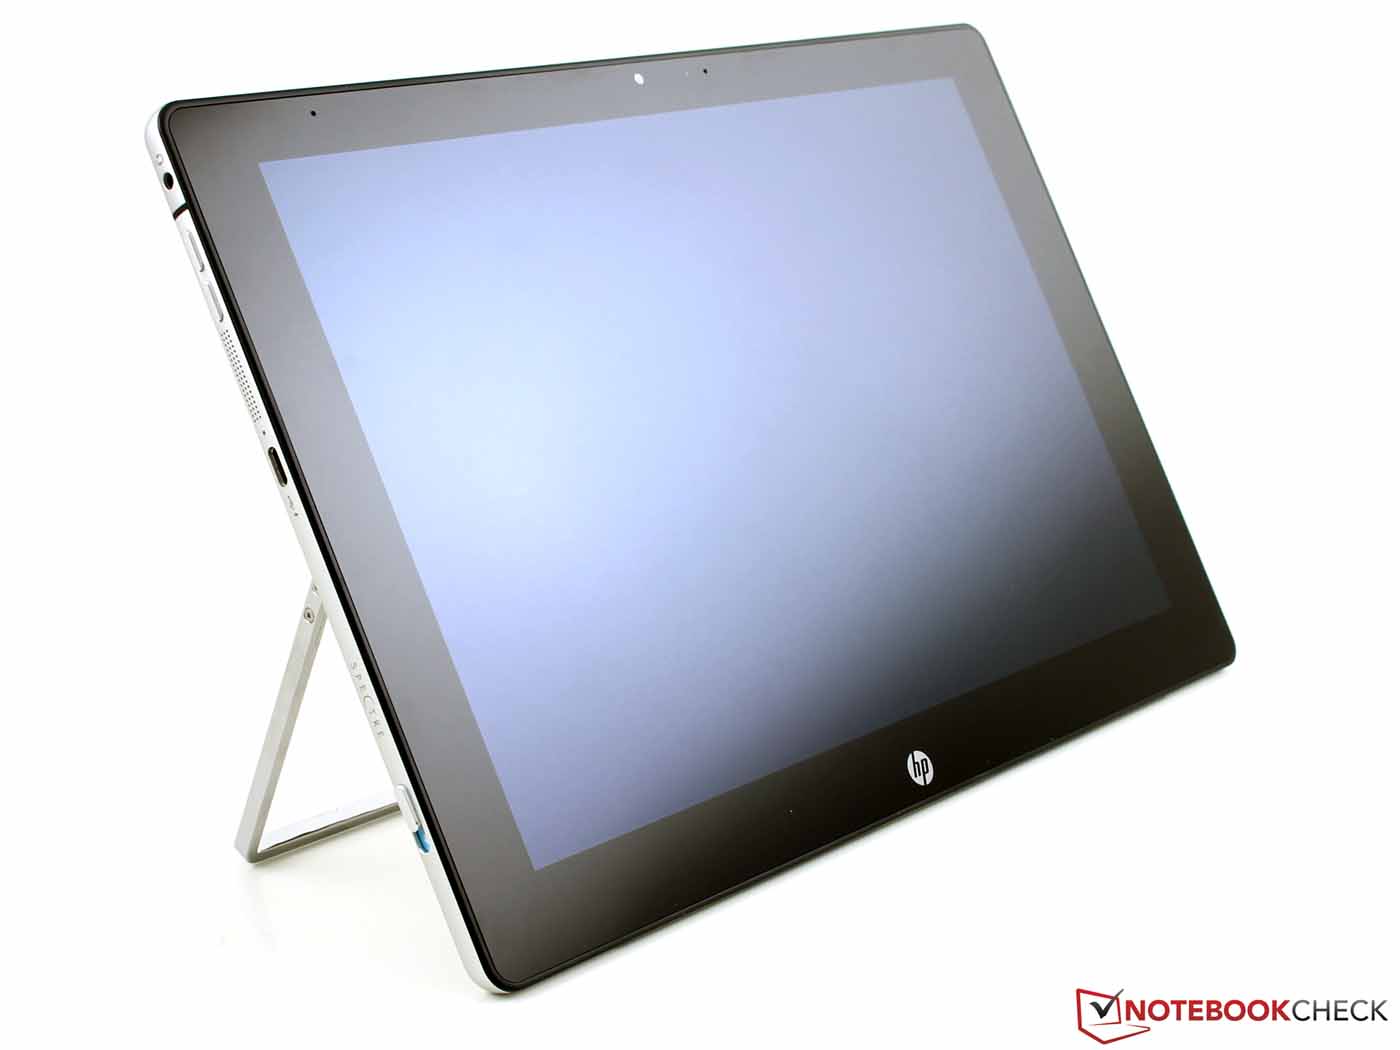
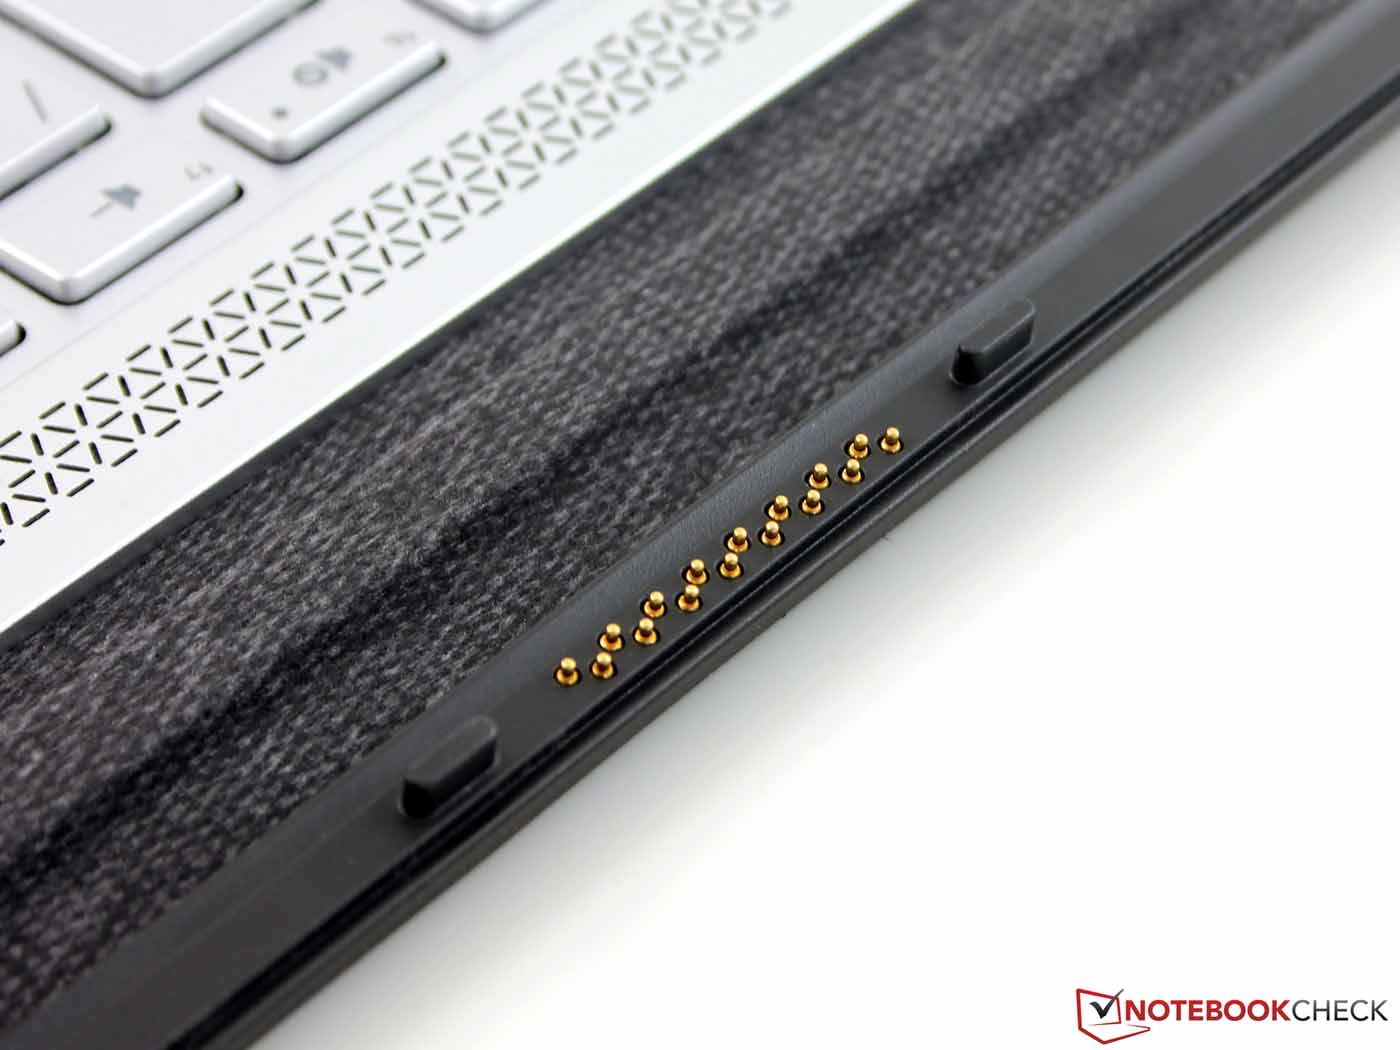
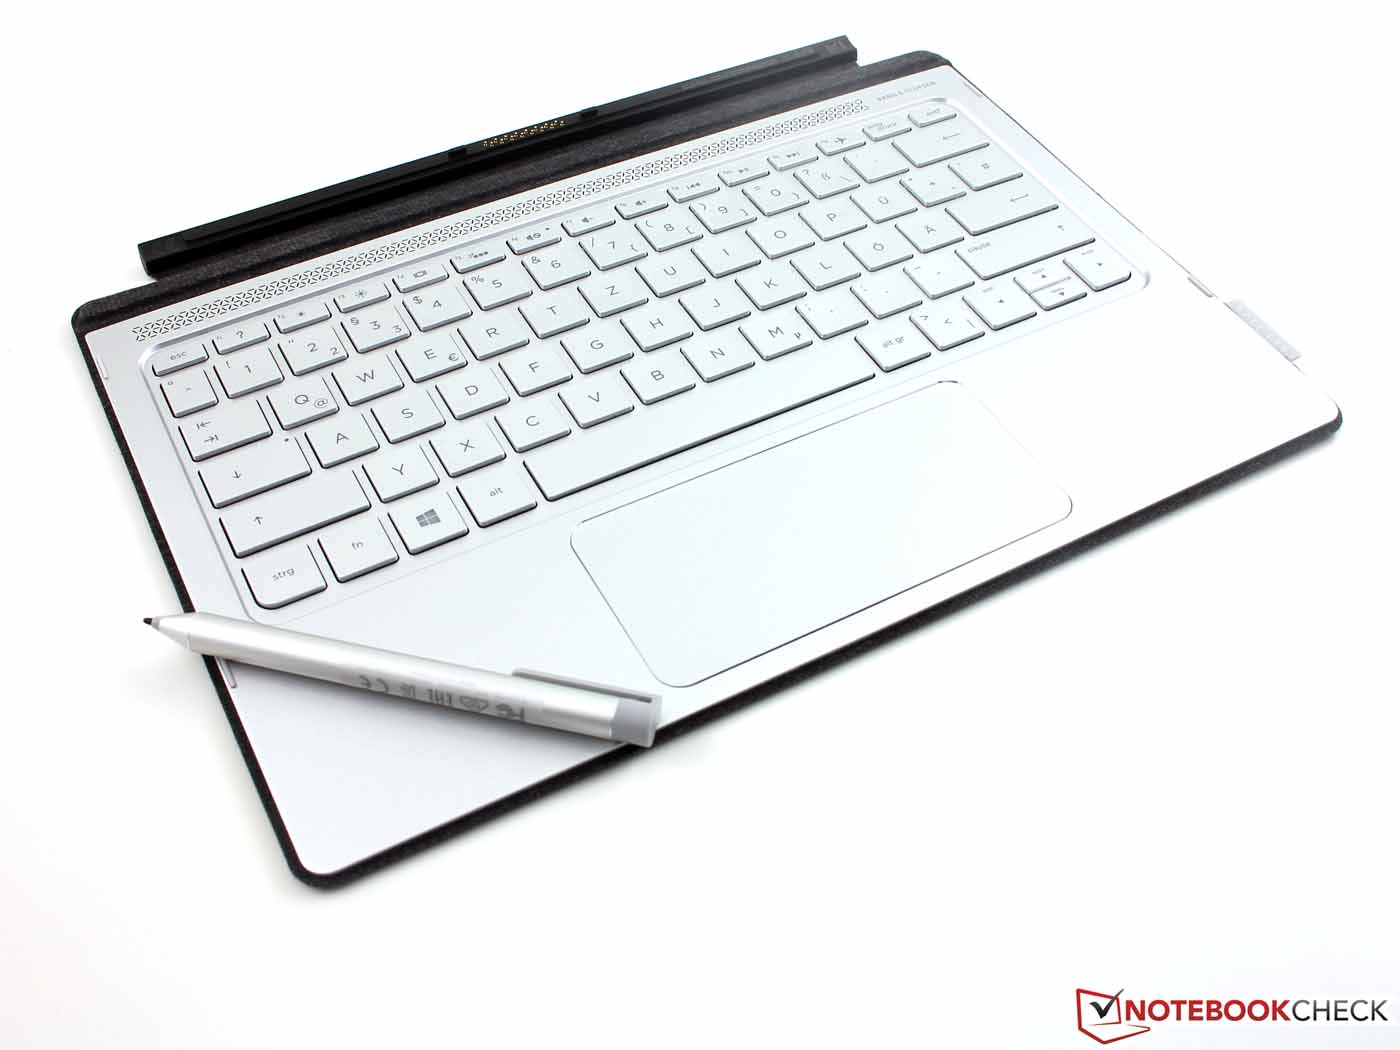
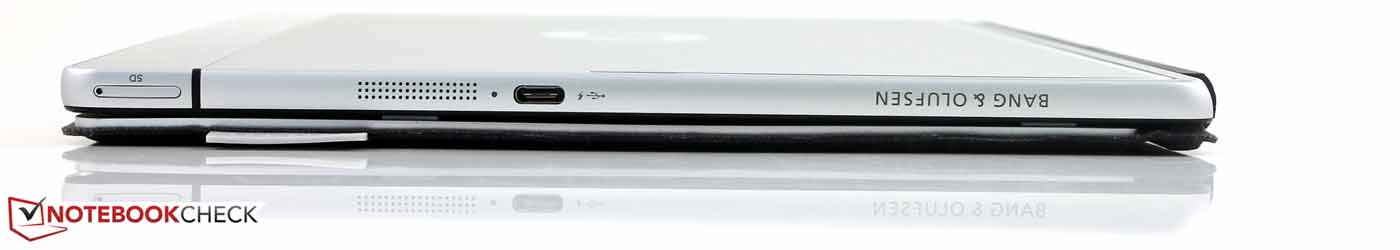
连接上时尚而不失坚固的键盘,Spectre x2可以有效的用作桌面笔记本电脑。USB C型接口被用作充电接口,它可以通过附带的转接埠连接现有的A型接口外置设备。平板背面的主相机可以拍摄非常不错的照片和视频。我们很久没有在Windows平板中感受到这一点了。另外,RealSense相机支持3D扫描——至少以后会。它可以用于测量结构深度,例如脸型。
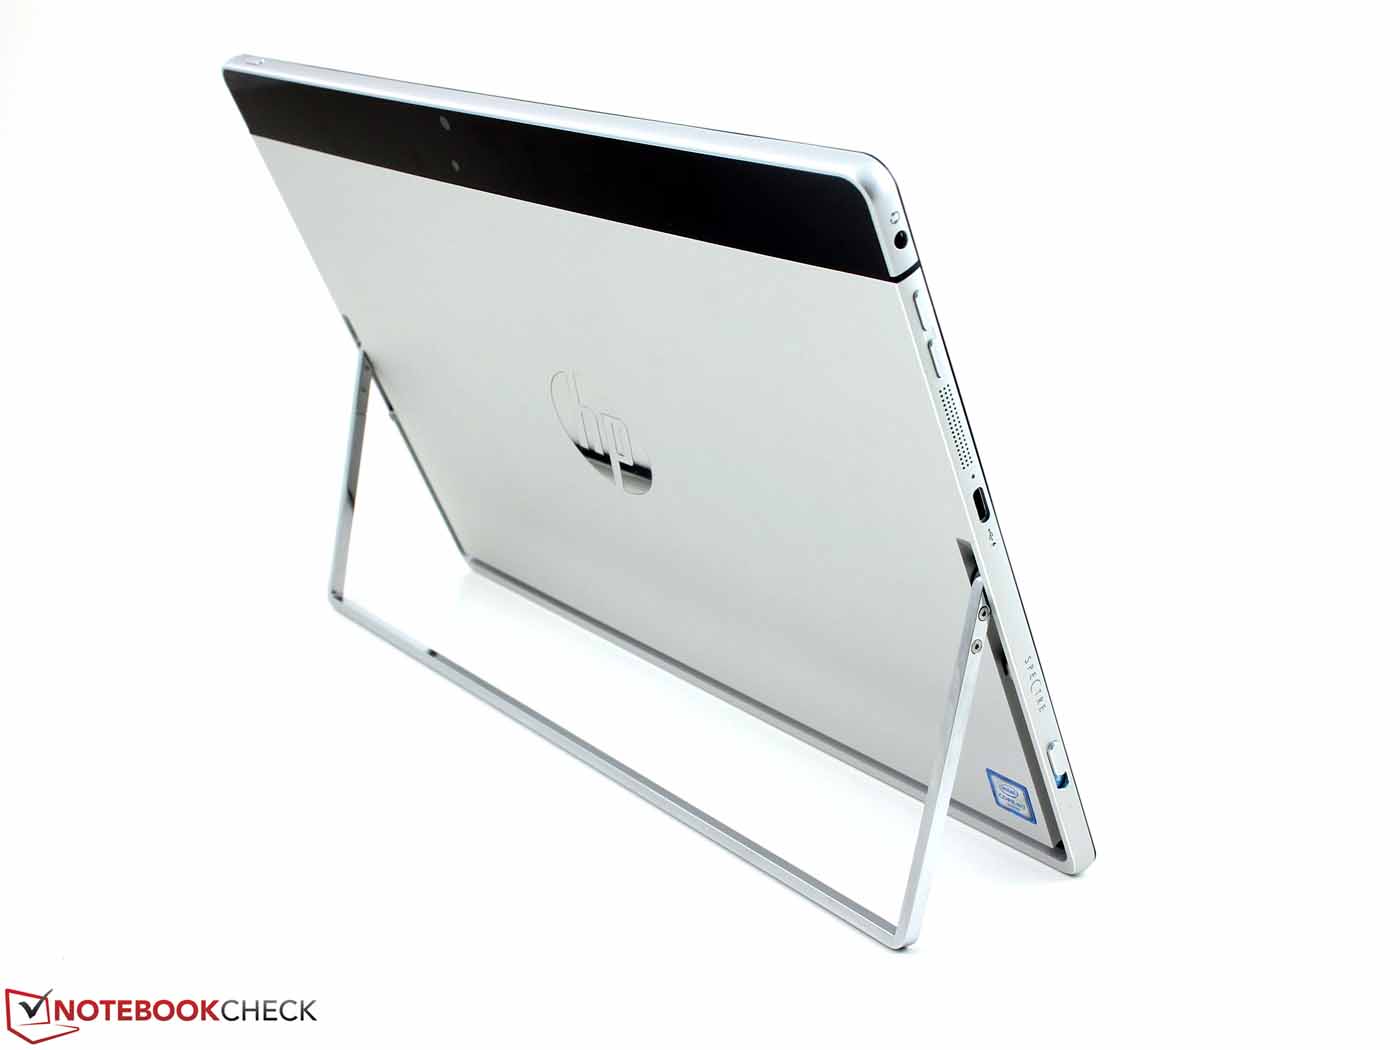
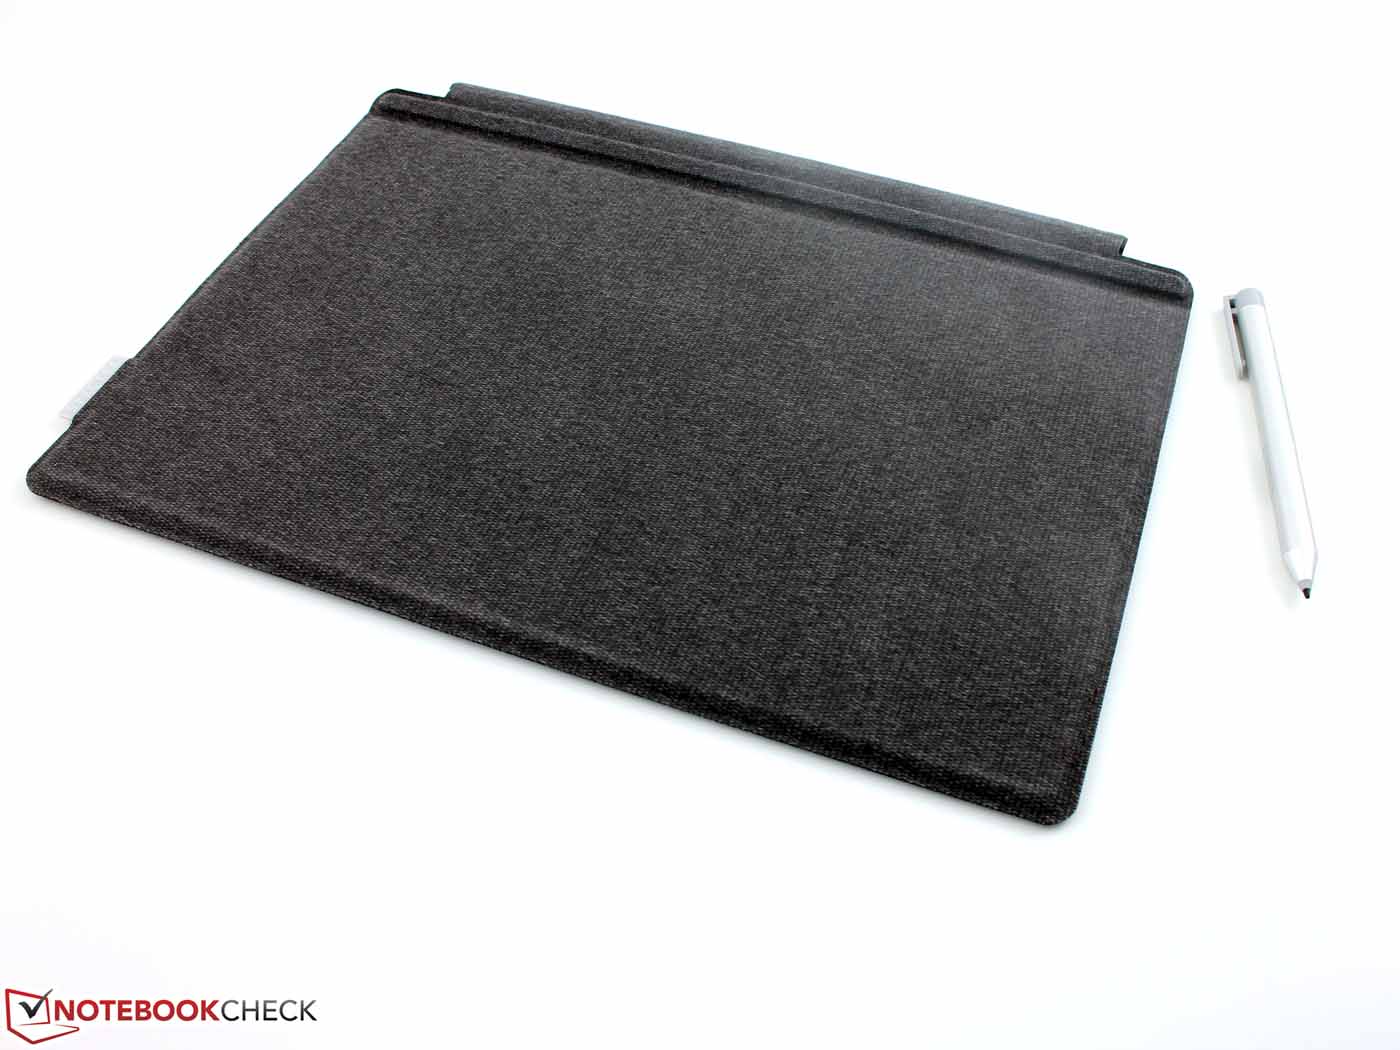
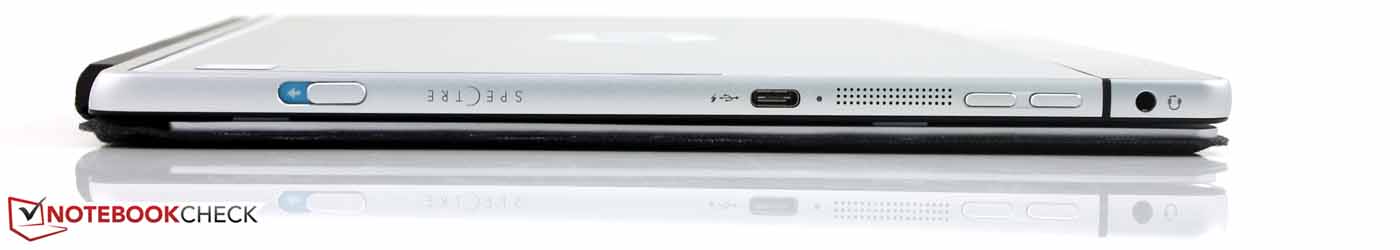
Spectre x2也有一些还算可以接受的缺点。一些用户可能会怀念标准SD卡的读卡器。如果倾斜一点平板它的支架会错位。它的电池续航还不错,不过考虑到售价和酷睿M处理器,它应该实现7到8小时的上网时间而不只是测试结果的6小时。
仅仅达到Surface Pro Core M3水平的运算性能让我们十分失望。潜在用户应该考虑它的m3-6Y30版本(2x 900 MHz),它应该在普通用途下提供更好的节能。它们的售价相同,不过较“弱”的机型搭配了LTE模组。如果需要性能的话,则需要考虑微软的Surface Pro 4酷睿i5/i7版本,它们也搭配了更快的NVMe固态硬盘。
实际上尺寸稍大的惠普 Spectre x360 13变形本搭配i5-6200U,性能更高,在我们的测试中得到了84%的分数。微软的Surface Book,Acer的Aspire R7-371T-52EL,联想的ThinkPad Yoga 12一级微软Surface Pro (i5/i7)都提供了相同水平的处理器性能。尽管需要高性能的用户可能需要考虑这些设备,不过也不一定就一定排除Spectre x2。它作为二合一设备十分实用。它的M7处理器的应用程序性能还有一定的竞争力。
注:本文是基于完整评测的缩减版本,阅读完整的英文评测,请点击这里。
HP Spectre x2 12-a003ng K3D42EA
- 04/18/2016 v5.1 (old)
Sebastian Jentsch