戴尔 XPS 12 9250 4K 变形本简短评测
| |||||||||||||||||||||||||
Brightness Distribution: 81 %
Center on Battery: 437 cd/m²
Contrast: 1249:1 (Black: 0.35 cd/m²)
ΔE ColorChecker Calman: 3.56 | ∀{0.5-29.43 Ø4.71}
ΔE Greyscale Calman: 2.67 | ∀{0.09-98 Ø4.96}
100% sRGB (Calman 2D)
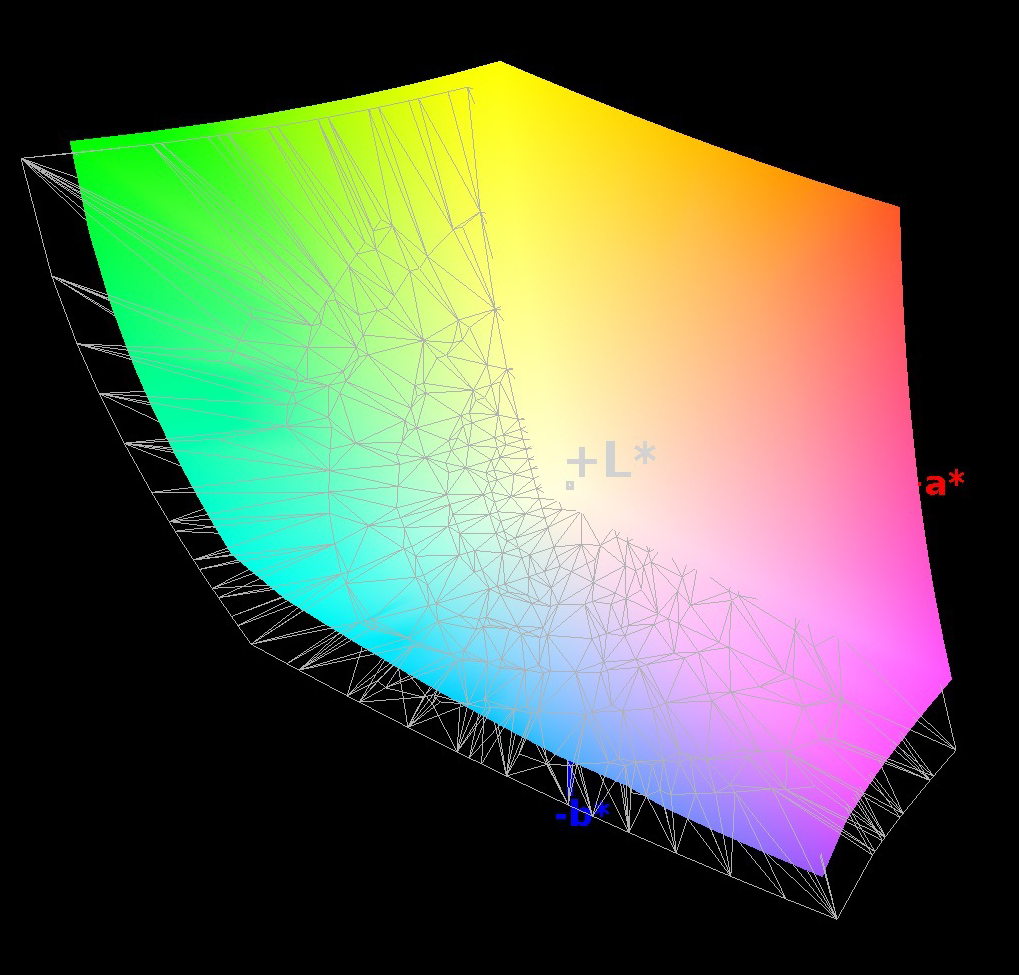
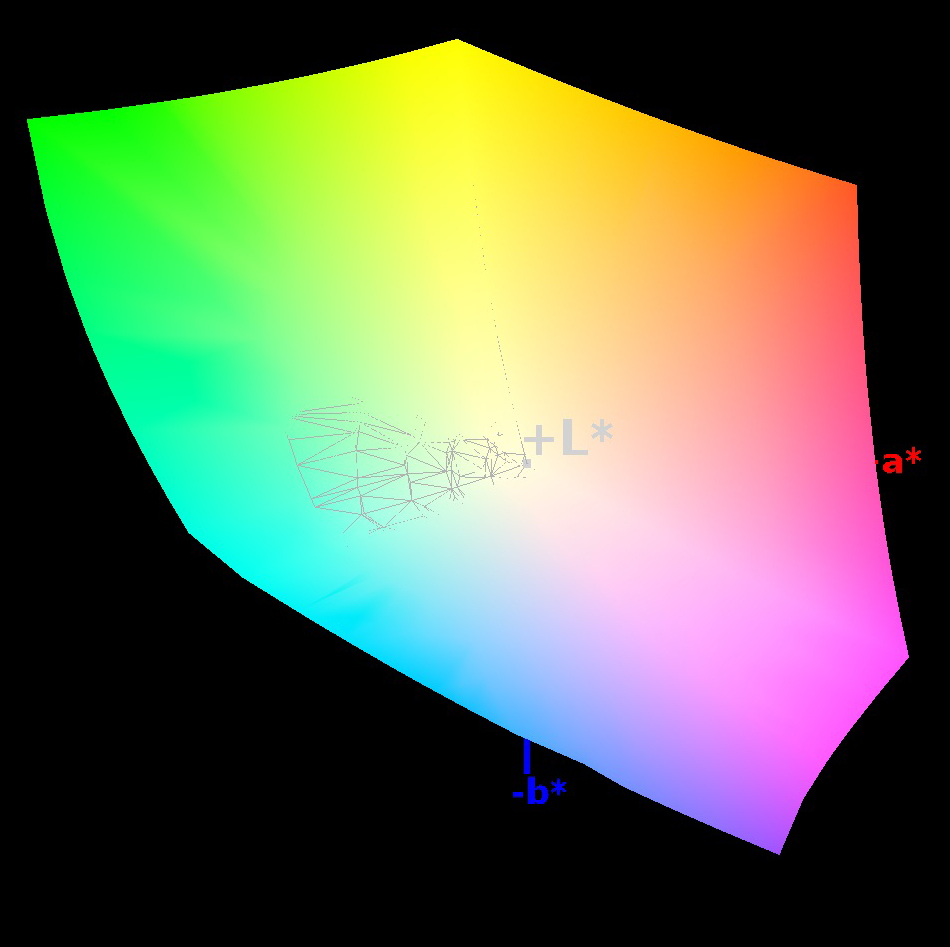
100% sRGB (Argyll 1.6.3 3D)
86% AdobeRGB 1998 (Argyll 1.6.3 3D)
98.1% AdobeRGB 1998 (Argyll 3D)
99.8% sRGB (Argyll 3D)
83.9% Display P3 (Argyll 3D)
Gamma: 2.17
CCT: 6681 K
| Dell XPS 12 9250 4K HD Graphics 515, 6Y75, Samsung PM951 NVMe 512 GB | HP Spectre x2 12-a003ng K3D42EA HD Graphics 515, 6Y75, Sandisk X300 SD7SN6S-256G-1006 | HP Elite x2 1011 G1 HD Graphics 5300, 5Y51, Samsung SSD PM851 256 GB MZNTE256HMHP | Microsoft Surface Pro 4, Core m3 HD Graphics 515, 6Y30, Samsung MZFLV128 NVMe | Asus Zenbook UX305CA-FB055T HD Graphics 515, 6Y75, Micron M600 MTFDDAV512MBF M.2 | Toshiba Portege Z20t-B-10C HD Graphics 5300, 5Y71, Toshiba HG6 THNSNJ256GVNU | |
|---|---|---|---|---|---|---|
| Display | -37% | -44% | -18% | -27% | -47% | |
| Display P3 Coverage (%) | 83.9 | 52.9 -37% | 44.4 -47% | 67.5 -20% | 59.1 -30% | 42.63 -49% |
| sRGB Coverage (%) | 99.8 | 71.8 -28% | 66.4 -33% | 96.6 -3% | 85.5 -14% | 63.6 -36% |
| AdobeRGB 1998 Coverage (%) | 98.1 | 52.6 -46% | 45.91 -53% | 69 -30% | 61 -38% | 44.1 -55% |
| Response Times | -3% | -9% | 9% | |||
| Response Time Grey 50% / Grey 80% * (ms) | 36 ? | 47 ? -31% | 46 ? -28% | 38 ? -6% | ||
| Response Time Black / White * (ms) | 35 ? | 26 ? 26% | 31 ? 11% | 27 ? 23% | ||
| PWM Frequency (Hz) | 1000 ? | 50 ? | 1429 ? | |||
| Screen | -40% | -51% | -4% | -19% | -71% | |
| Brightness middle (cd/m²) | 437 | 353 -19% | 364 -17% | 389.2 -11% | 390 -11% | 342 -22% |
| Brightness (cd/m²) | 399 | 347 -13% | 331 -17% | 392 -2% | 352 -12% | 301 -25% |
| Brightness Distribution (%) | 81 | 91 12% | 84 4% | 92 14% | 81 0% | 76 -6% |
| Black Level * (cd/m²) | 0.35 | 0.44 -26% | 0.44 -26% | 0.27 23% | 0.69 -97% | 0.393 -12% |
| Contrast (:1) | 1249 | 802 -36% | 827 -34% | 1441 15% | 565 -55% | 870 -30% |
| Colorchecker dE 2000 * | 3.56 | 6.09 -71% | 7.32 -106% | 3.61 -1% | 3.04 15% | 9.69 -172% |
| Colorchecker dE 2000 max. * | 9.3 | 7.01 25% | ||||
| Greyscale dE 2000 * | 2.67 | 6.24 -134% | 7.37 -176% | 3.8 -42% | 2.88 -8% | 9.27 -247% |
| Gamma | 2.17 101% | 2.41 91% | 2.03 108% | 2.16 102% | 2.43 91% | 2.95 75% |
| CCT | 6681 97% | 7238 90% | 6479 100% | 5969 109% | 6848 95% | 6010 108% |
| Color Space (Percent of AdobeRGB 1998) (%) | 86 | 46 -47% | 42.2 -51% | 63 -27% | 55 -36% | 40.4 -53% |
| Color Space (Percent of sRGB) (%) | 100 | 71 -29% | 66.1 -34% | 97 -3% | 85 -15% | |
| Total Average (Program / Settings) | -27% /
-34% | -48% /
-49% | -10% /
-7% | -12% /
-17% | -59% /
-64% |
* ... smaller is better
Display Response Times
| ↔ Response Time Black to White | ||
|---|---|---|
| 35 ms ... rise ↗ and fall ↘ combined | ↗ 8 ms rise | 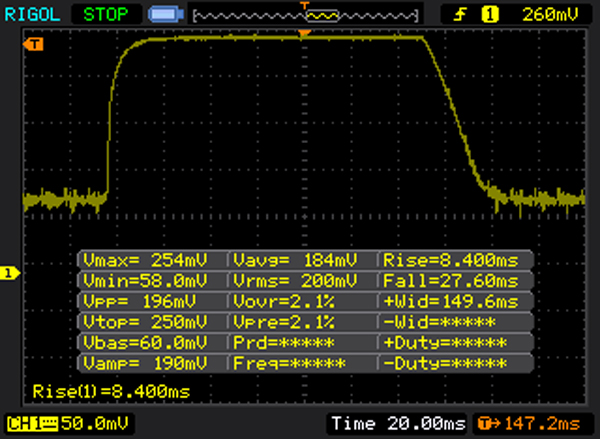 |
| ↘ 27 ms fall | ||
| The screen shows slow response rates in our tests and will be unsatisfactory for gamers. In comparison, all tested devices range from 0.1 (minimum) to 240 (maximum) ms. » 92 % of all devices are better. This means that the measured response time is worse than the average of all tested devices (19.8 ms). | ||
| ↔ Response Time 50% Grey to 80% Grey | ||
| 36 ms ... rise ↗ and fall ↘ combined | ↗ 19 ms rise | 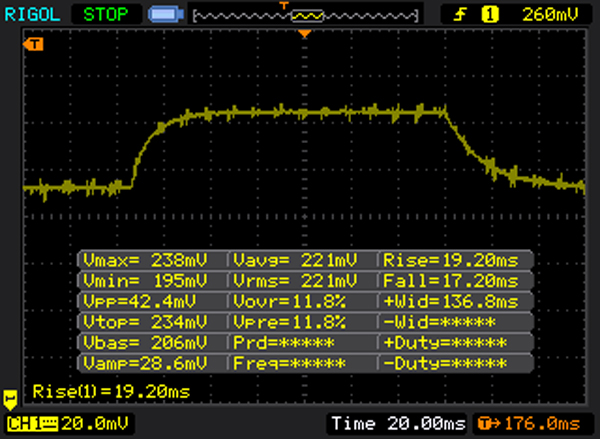 |
| ↘ 17 ms fall | ||
| The screen shows slow response rates in our tests and will be unsatisfactory for gamers. In comparison, all tested devices range from 0.165 (minimum) to 636 (maximum) ms. » 51 % of all devices are better. This means that the measured response time is worse than the average of all tested devices (31 ms). | ||
Screen Flickering / PWM (Pulse-Width Modulation)
| Screen flickering / PWM detected | 1000 Hz | ≤ 20 % brightness setting | 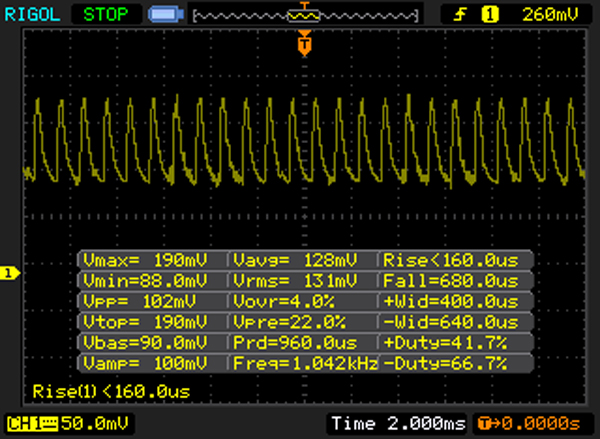 |
The display backlight flickers at 1000 Hz (worst case, e.g., utilizing PWM) Flickering detected at a brightness setting of 20 % and below. There should be no flickering or PWM above this brightness setting. The frequency of 1000 Hz is quite high, so most users sensitive to PWM should not notice any flickering. In comparison: 52 % of all tested devices do not use PWM to dim the display. If PWM was detected, an average of 7754 (minimum: 5 - maximum: 343500) Hz was measured. | |||
| Cinebench R15 | |
| CPU Single 64Bit | |
| Dell XPS 12 9250 4K | |
| Asus Zenbook UX305CA-FB055T | |
| Toshiba Portege Z20t-B-10C | |
| Microsoft Surface Pro 4, Core m3 | |
| HP Elite x2 1011 G1 | |
| HP Spectre x2 12-a003ng K3D42EA | |
| CPU Multi 64Bit | |
| Asus Zenbook UX305CA-FB055T | |
| Microsoft Surface Pro 4, Core m3 | |
| Dell XPS 12 9250 4K | |
| Toshiba Portege Z20t-B-10C | |
| HP Spectre x2 12-a003ng K3D42EA | |
| HP Elite x2 1011 G1 | |
| Cinebench R11.5 | |
| CPU Single 64Bit | |
| Asus Zenbook UX305CA-FB055T | |
| Toshiba Portege Z20t-B-10C | |
| HP Elite x2 1011 G1 | |
| Microsoft Surface Pro 4, Core m3 | |
| Dell XPS 12 9250 4K | |
| HP Spectre x2 12-a003ng K3D42EA | |
| CPU Multi 64Bit | |
| Asus Zenbook UX305CA-FB055T | |
| Microsoft Surface Pro 4, Core m3 | |
| Dell XPS 12 9250 4K | |
| HP Spectre x2 12-a003ng K3D42EA | |
| Toshiba Portege Z20t-B-10C | |
| HP Elite x2 1011 G1 | |
| Cinebench R10 | |
| Rendering Single 32Bit | |
| Asus Zenbook UX305CA-FB055T | |
| Dell XPS 12 9250 4K | |
| HP Spectre x2 12-a003ng K3D42EA | |
| Toshiba Portege Z20t-B-10C | |
| Microsoft Surface Pro 4, Core m3 | |
| HP Elite x2 1011 G1 | |
| Rendering Multiple CPUs 32Bit | |
| Asus Zenbook UX305CA-FB055T | |
| Microsoft Surface Pro 4, Core m3 | |
| Toshiba Portege Z20t-B-10C | |
| HP Spectre x2 12-a003ng K3D42EA | |
| HP Elite x2 1011 G1 | |
| Dell XPS 12 9250 4K | |
| PCMark 8 | |
| Home Score Accelerated v2 | |
| Toshiba Portege Z20t-B-10C | |
| HP Spectre x2 12-a003ng K3D42EA | |
| Asus Zenbook UX305CA-FB055T | |
| Microsoft Surface Pro 4, Core m3 | |
| HP Elite x2 1011 G1 | |
| Dell XPS 12 9250 4K | |
| Creative Score Accelerated v2 | |
| HP Spectre x2 12-a003ng K3D42EA | |
| Asus Zenbook UX305CA-FB055T | |
| Toshiba Portege Z20t-B-10C | |
| Microsoft Surface Pro 4, Core m3 | |
| Dell XPS 12 9250 4K | |
| HP Elite x2 1011 G1 | |
| Work Score Accelerated v2 | |
| HP Spectre x2 12-a003ng K3D42EA | |
| Toshiba Portege Z20t-B-10C | |
| HP Elite x2 1011 G1 | |
| Asus Zenbook UX305CA-FB055T | |
| Microsoft Surface Pro 4, Core m3 | |
| Dell XPS 12 9250 4K | |
| Storage Score v2 | |
| HP Spectre x2 12-a003ng K3D42EA | |
| Dell XPS 12 9250 4K | |
| PCMark 7 | |
| Score | |
| Asus Zenbook UX305CA-FB055T | |
| Toshiba Portege Z20t-B-10C | |
| Dell XPS 12 9250 4K | |
| Microsoft Surface Pro 4, Core m3 | |
| HP Elite x2 1011 G1 | |
| Productivity | |
| Asus Zenbook UX305CA-FB055T | |
| Toshiba Portege Z20t-B-10C | |
| HP Elite x2 1011 G1 | |
| Dell XPS 12 9250 4K | |
| Entertainment | |
| Toshiba Portege Z20t-B-10C | |
| Asus Zenbook UX305CA-FB055T | |
| HP Elite x2 1011 G1 | |
| Dell XPS 12 9250 4K | |
| System Storage | |
| Asus Zenbook UX305CA-FB055T | |
| Toshiba Portege Z20t-B-10C | |
| HP Elite x2 1011 G1 | |
| Dell XPS 12 9250 4K | |
| PCMark 7 Score | 4318 points | |
| PCMark 8 Home Score Accelerated v2 | 2277 points | |
| PCMark 8 Creative Score Accelerated v2 | 2903 points | |
| PCMark 8 Work Score Accelerated v2 | 3084 points | |
Help | ||

| 3DMark 11 | |
| 1280x720 Performance | |
| Microsoft Surface Book Core i5 | |
| Microsoft Surface Pro 4, Core m3 | |
| Asus Zenbook UX305CA-FB055T | |
| Dell XPS 12 9250 4K | |
| HP Spectre x2 12-a003ng K3D42EA | |
| Toshiba Portege Z20t-B-10C | |
| HP Elite x2 1011 G1 | |
| 1280x720 Performance GPU | |
| Microsoft Surface Book Core i5 | |
| Microsoft Surface Pro 4, Core m3 | |
| Asus Zenbook UX305CA-FB055T | |
| Dell XPS 12 9250 4K | |
| HP Spectre x2 12-a003ng K3D42EA | |
| Toshiba Portege Z20t-B-10C | |
| HP Elite x2 1011 G1 | |
| 3DMark | |
| 1280x720 Ice Storm Standard Score | |
| Microsoft Surface Book Core i5 | |
| HP Spectre x2 12-a003ng K3D42EA | |
| Microsoft Surface Pro 4, Core m3 | |
| Toshiba Portege Z20t-B-10C | |
| Asus Zenbook UX305CA-FB055T | |
| HP Elite x2 1011 G1 | |
| Dell XPS 12 9250 4K | |
| 1280x720 Cloud Gate Standard Score | |
| Microsoft Surface Book Core i5 | |
| Microsoft Surface Pro 4, Core m3 | |
| HP Spectre x2 12-a003ng K3D42EA | |
| Toshiba Portege Z20t-B-10C | |
| Dell XPS 12 9250 4K | |
| Asus Zenbook UX305CA-FB055T | |
| HP Elite x2 1011 G1 | |
| 1920x1080 Fire Strike Score | |
| Microsoft Surface Book Core i5 | |
| Microsoft Surface Pro 4, Core m3 | |
| HP Spectre x2 12-a003ng K3D42EA | |
| Dell XPS 12 9250 4K | |
| Asus Zenbook UX305CA-FB055T | |
| Toshiba Portege Z20t-B-10C | |
| HP Elite x2 1011 G1 | |
| 3DMark 11 Performance | 1115 points | |
| 3DMark Ice Storm Standard Score | 27409 points | |
| 3DMark Cloud Gate Standard Score | 3457 points | |
| 3DMark Fire Strike Score | 553 points | |
| 3DMark Fire Strike Extreme Score | 277 points | |
Help | ||
| low | med. | high | ultra | |
|---|---|---|---|---|
| BioShock Infinite (2013) | 33.28 | 17.37 | 20.1 | 4.67 |
| Battlefield 4 (2013) | 24.81 | 17.88 | 11.94 | 6.67 |
| Rise of the Tomb Raider (2016) | 8.3 | 5.67 |
(±) The maximum temperature on the upper side is 41.4 °C / 107 F, compared to the average of 35.4 °C / 96 F, ranging from 19.6 to 60 °C for the class Convertible.
(±) The bottom heats up to a maximum of 43.9 °C / 111 F, compared to the average of 36.9 °C / 98 F
(+) In idle usage, the average temperature for the upper side is 30.2 °C / 86 F, compared to the device average of 30.3 °C / 87 F.
(-) The palmrests and touchpad can get very hot to the touch with a maximum of 41.4 °C / 106.5 F.
(-) The average temperature of the palmrest area of similar devices was 28 °C / 82.4 F (-13.4 °C / -24.1 F).
| Dell XPS 12 9250 4K HD Graphics 515, 6Y75, Samsung PM951 NVMe 512 GB | HP Spectre x2 12-a003ng K3D42EA HD Graphics 515, 6Y75, Sandisk X300 SD7SN6S-256G-1006 | HP Elite x2 1011 G1 HD Graphics 5300, 5Y51, Samsung SSD PM851 256 GB MZNTE256HMHP | Asus Zenbook UX305CA-FB055T HD Graphics 515, 6Y75, Micron M600 MTFDDAV512MBF M.2 | Toshiba Portege Z20t-B-10C HD Graphics 5300, 5Y71, Toshiba HG6 THNSNJ256GVNU | |
|---|---|---|---|---|---|
| Power Consumption | 20% | 52% | 21% | 33% | |
| Idle Minimum * (Watt) | 5.4 | 4.5 17% | 1.5 72% | 4.2 22% | 2.4 56% |
| Idle Average * (Watt) | 10.2 | 7.7 25% | 4 61% | 8.4 18% | 4.6 55% |
| Idle Maximum * (Watt) | 12.5 | 8.3 34% | 5 60% | 8.9 29% | 5.6 55% |
| Load Average * (Watt) | 21.4 | 19.8 7% | 13.9 35% | 15.9 26% | 15.6 27% |
| Load Maximum * (Watt) | 24.4 | 20.6 16% | 16.9 31% | 22.5 8% | 30.7 -26% |
* ... smaller is better
| Off / Standby | |
| Idle | |
| Load |
|
Key:
min: | |
| Dell XPS 12 9250 4K 28 Wh | HP Spectre x2 12-a003ng K3D42EA 42 Wh | HP Elite x2 1011 G1 54 Wh | Microsoft Surface Pro 4, Core m3 38 Wh | Asus Zenbook UX305CA-FB055T 45 Wh | Toshiba Portege Z20t-B-10C 72 Wh | |
|---|---|---|---|---|---|---|
| Battery runtime | 92% | 187% | 85% | 108% | 269% | |
| Reader / Idle (h) | 6.2 | 15.9 156% | 17.7 185% | 13.2 113% | 16.9 173% | 26.9 334% |
| WiFi v1.3 (h) | 4.1 | 6 46% | 11.3 176% | 8.1 98% | 6.7 63% | 12.7 210% |
| Load (h) | 1.6 | 2.8 75% | 4.8 200% | 2.3 44% | 3 88% | 5.8 262% |
Pros
Cons
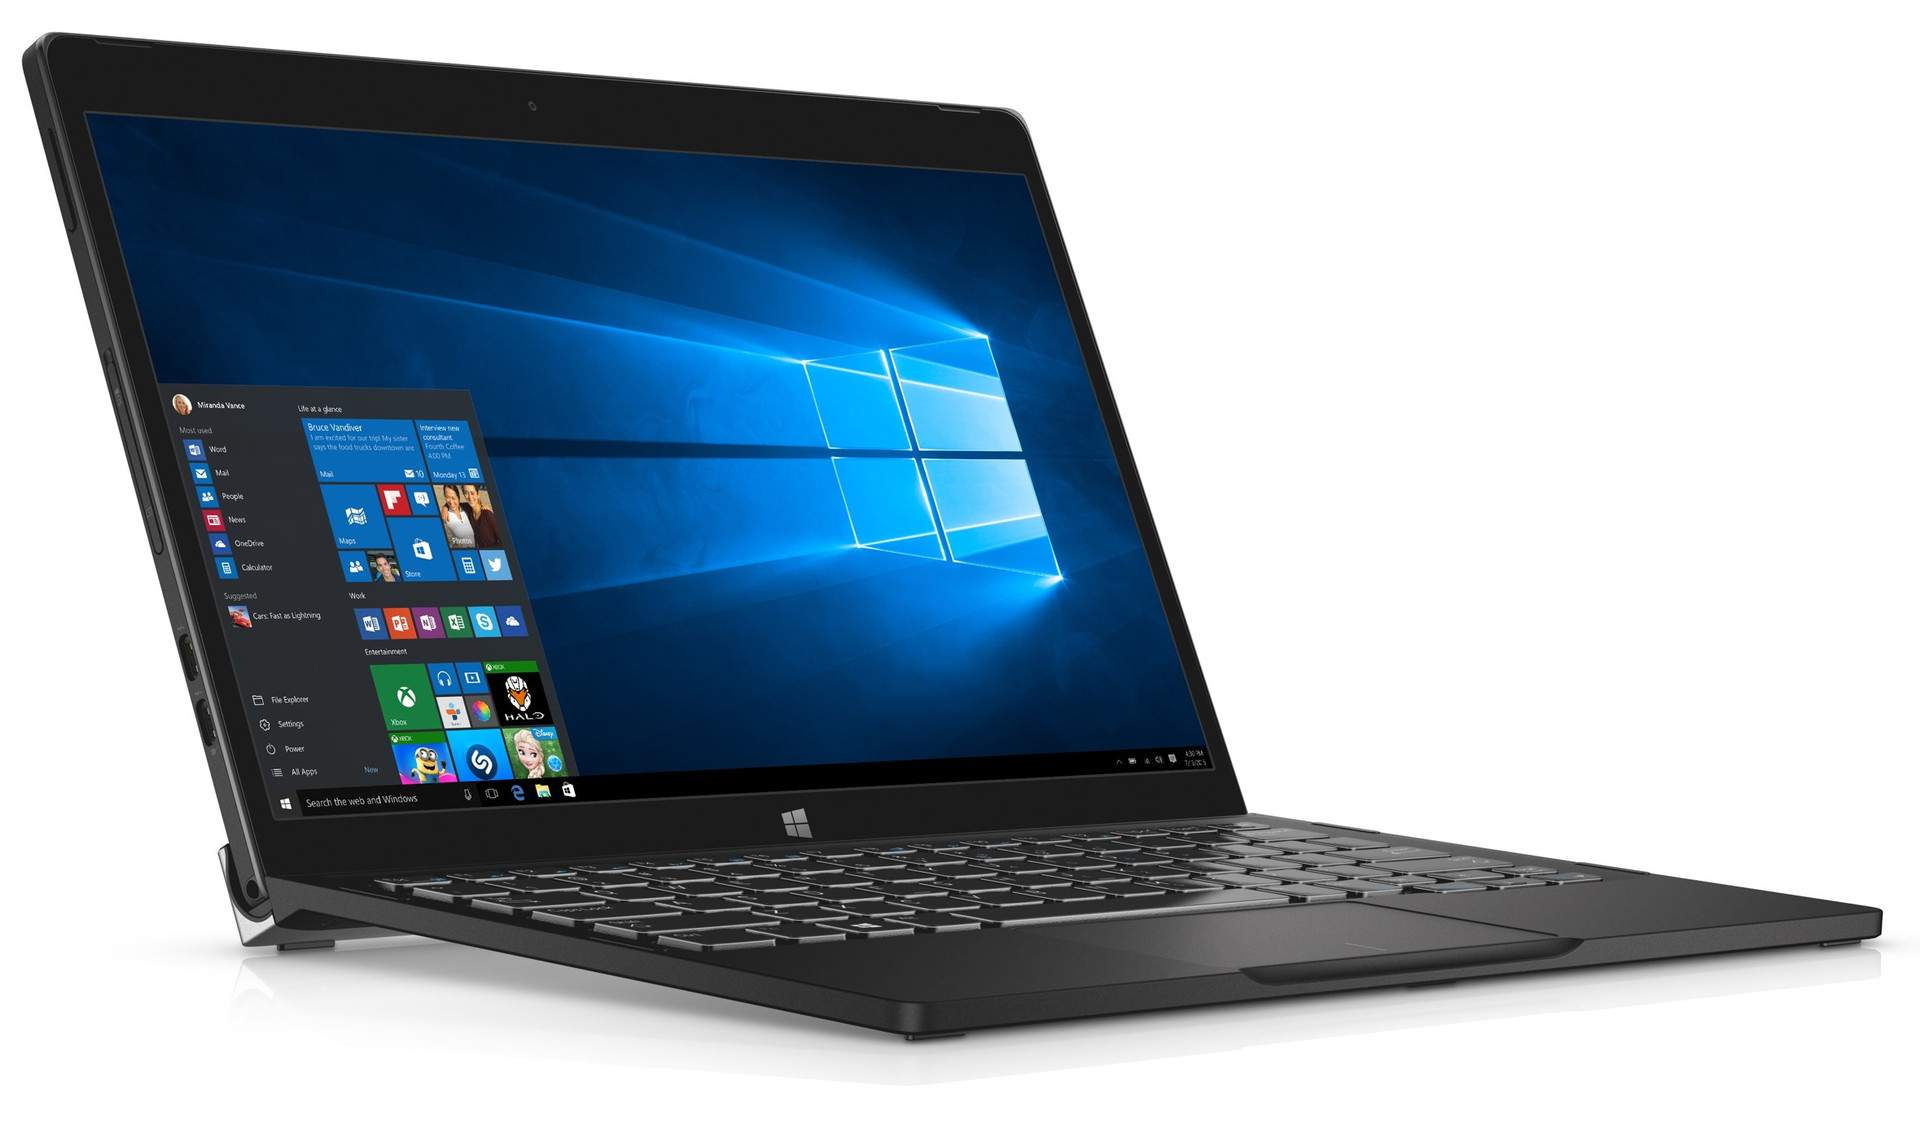
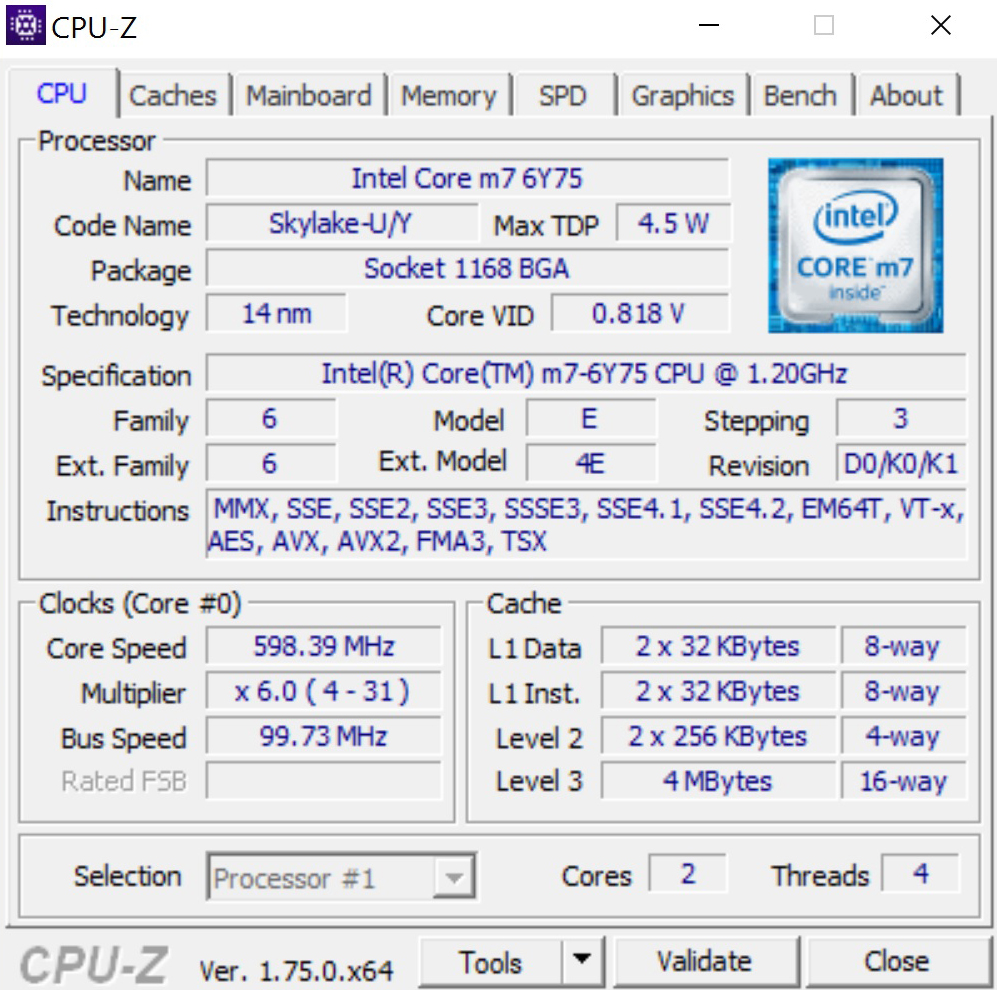
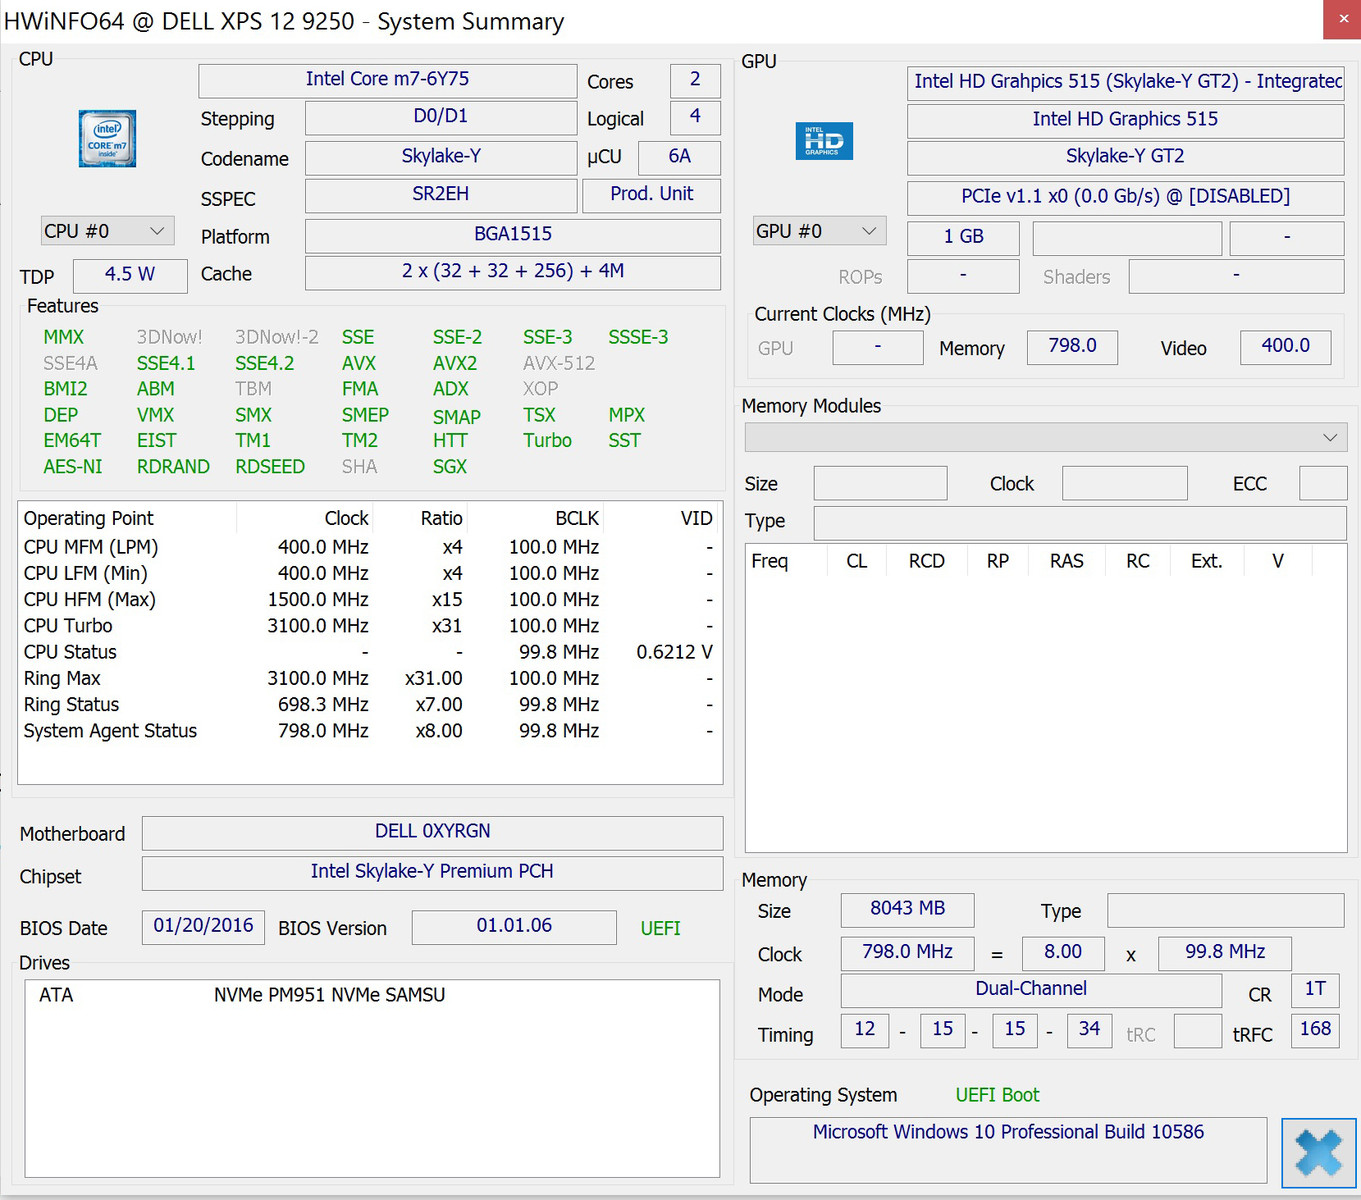
戴尔XPS 12 9250是一款纤薄的12.5寸变形本。它搭载的英特尔酷睿 m7 6Y75处理器足够应付日常任务,它的热设计功率可以实现被动散热。它的固态硬盘读取速度超高,可以保证系统响应快速。3840x2160像素的高分辨率12.5寸屏幕带来了高对比度,优秀的色域覆盖和宽广的可视角度范围。它同时还作为输入设备支持多点触控。它的键盘底座与平板十分协调,键盘的打字噪音小,触控板响应准确。
第一眼看上去它是一台雅致的变形本,提供了非常有吸引力的技术参数。剩下的问题就是戴尔为它设定的价码可能有些高不可攀。
除此之外,它还是有一些让我们不太满意的地方。键盘底座提供的屏幕角度无法改变,可能无法满足各种使用情况的需要。尽管我们的测试机采用了英特尔酷睿m系列的最强处理器,它的性能却无法得到完全发挥。因此,搭配酷睿m3的微软 Surface Pro 4在一些情况下甚至更快。我们也希望它能有更长的电池续航。它的电池表现对于商务用途来说还有待改进。
它到底值不值得推荐呢——正在考虑购买这类设备的用户需要谨慎考虑它的弱点和优势。戴尔为这个配置机型贴上了高昂的1799欧元(约13259人民币)价码。这绝不算便宜,不过它是有4K屏幕的为数不多的12.5寸设备——如果这是你的选购标准的话。或许搭配较弱处理器的型号可能更值得参考,因为无论如何酷睿m7无法提供实际的性能。
注:本文是基于完整评测的缩减版本,阅读完整的英文评测,请点击这里。
Dell XPS 12 9250 4K
- 04/18/2016 v5.1 (old)
Sebastian Bade