 Deutsch
 English
 Español
 Français
 Italiano
 Nederlands
 Polski
 Português
 Русский
 Türkçe
 Svenska
 Chinese
 Magyar
戴尔Surface Pro 8:XPS 13 9315二合一敞篷车评测
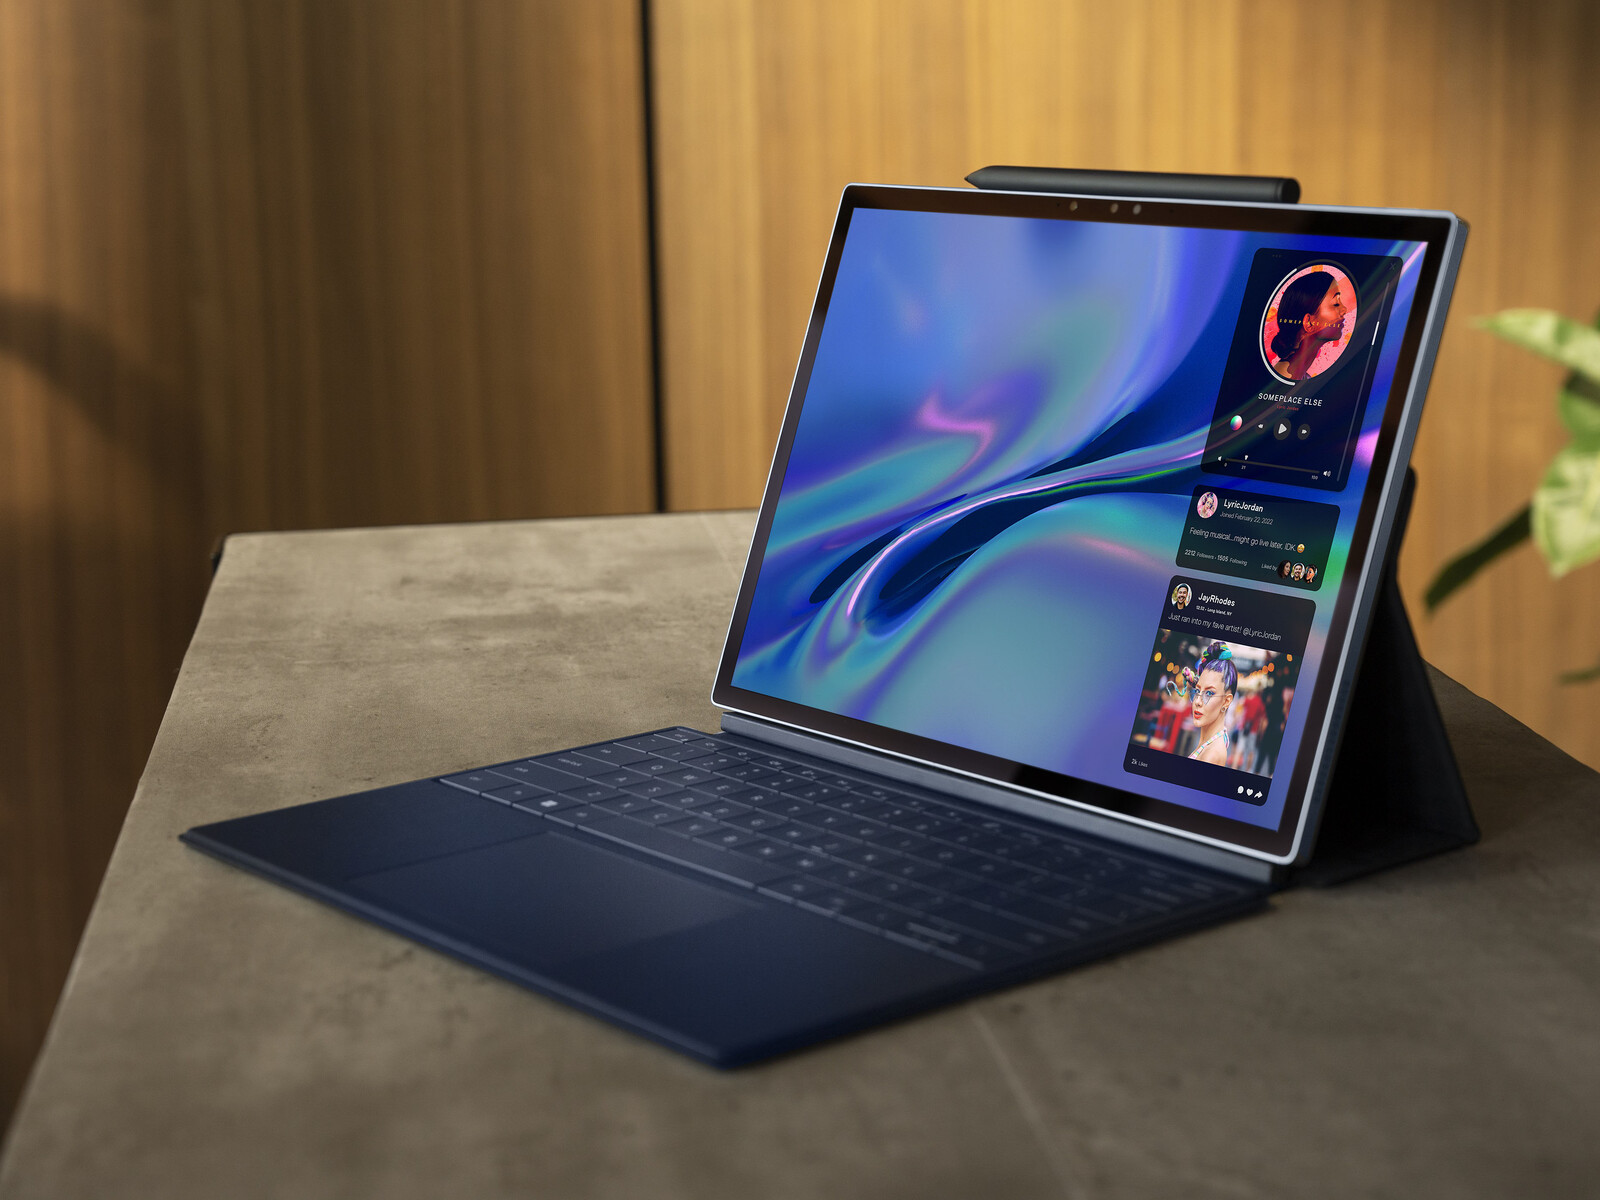
戴尔在2022年的CES上发布了三款不同的XPS 13机型,分别是 XPS 13 9320 Plus蚌壳, XPS 13 9315蛤壳,以及XPS 13 9315二合一。在回顾了两款蛤壳式机型之后,我们现在准备处理二合一机型,它恰好是 近十年来第一个可拆卸的XPS模型.
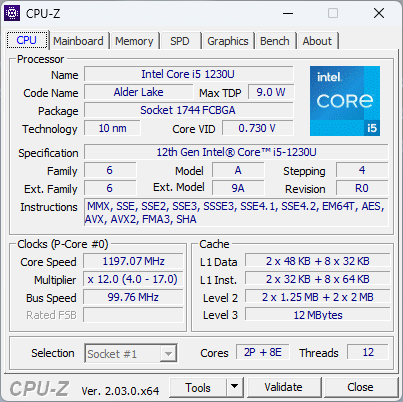
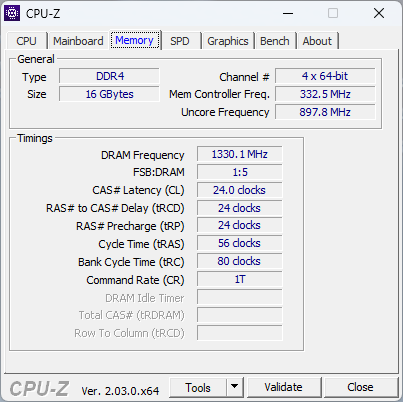
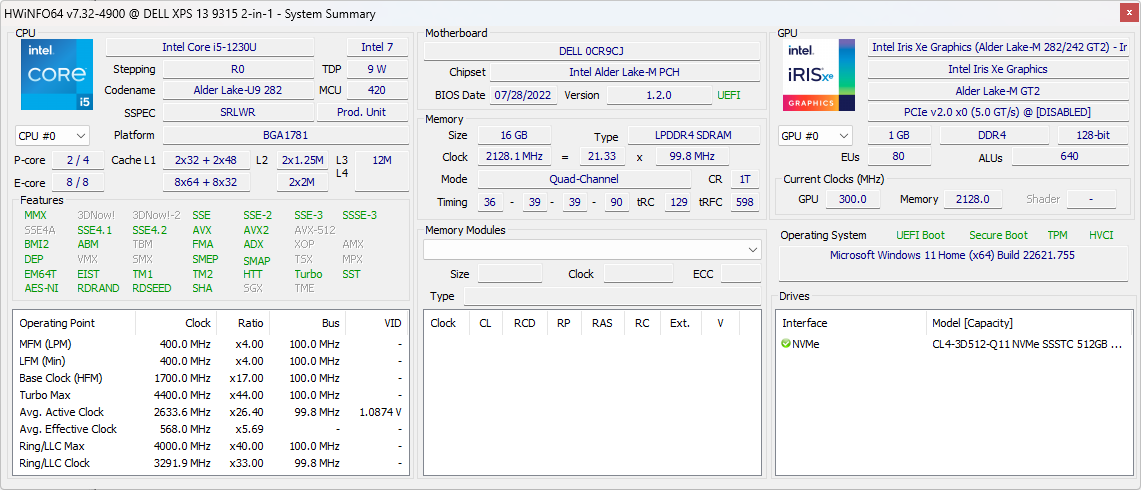
我们审查的配置配备了第12代Alder Lake Core i5-1230U CPU,16GB LPDDR4x内存和512GB NVMe SSD,价格约为1400美元。其他SKU配备酷睿i7-1250U CPU,5G eSIM,以及各种内存/SSD容量,但所有选项都配备相同的3:2 2880 x 1920 IPS触摸屏。
这一领域的直接竞争对手包括其他Windows平板电脑或可拆卸式设备,其中最引人注目的是 微软Surface Pro 8和更昂贵的 HP Elite x2系列,但程度较轻。
更多戴尔评论。
潜在的竞争对手比较
Rating | Date | Model | Weight | Height | Size | Resolution | Best Price |
|---|---|---|---|---|---|---|---|
| 90.1 % | 11/2022 | Dell XPS 13 9315 2-in-1 Core i5-1230U i5-1230U, Iris Xe G7 80EUs | 764 g | 7.4 mm | 13.00" | 2880x1920 | |
| 87.3 % | 09/2022 | Dell XPS 13 Plus 9320 i7-1280P OLED i7-1280P, Iris Xe G7 96EUs | 1.3 kg | 15.28 mm | 13.40" | 3456x2160 | |
| 89.1 % | 11/2021 | Microsoft Surface Pro 8, i7-1185G7 i7-1185G7, Iris Xe G7 96EUs | 891 g | 8.5 mm | 13.00" | 2880x1920 | |
| 90.3 % | 08/2022 | HP Spectre x360 13.5 14t-ef000 i7-1255U, Iris Xe G7 96EUs | 1.4 kg | 17 mm | 13.50" | 3000x2000 | |
| 86.1 % | 10/2021 | Lenovo ThinkBook Plus Gen2 Core i5 i5-1130G7, Iris Xe G7 80EUs | 1.2 kg | 13.9 mm | 13.30" | 2560x1600 | |
| 92.3 % | 07/2022 | Apple MacBook Air M2 Entry M2, M2 8-Core GPU | 1.2 kg | 11.3 mm | 13.60" | 2560x1664 |
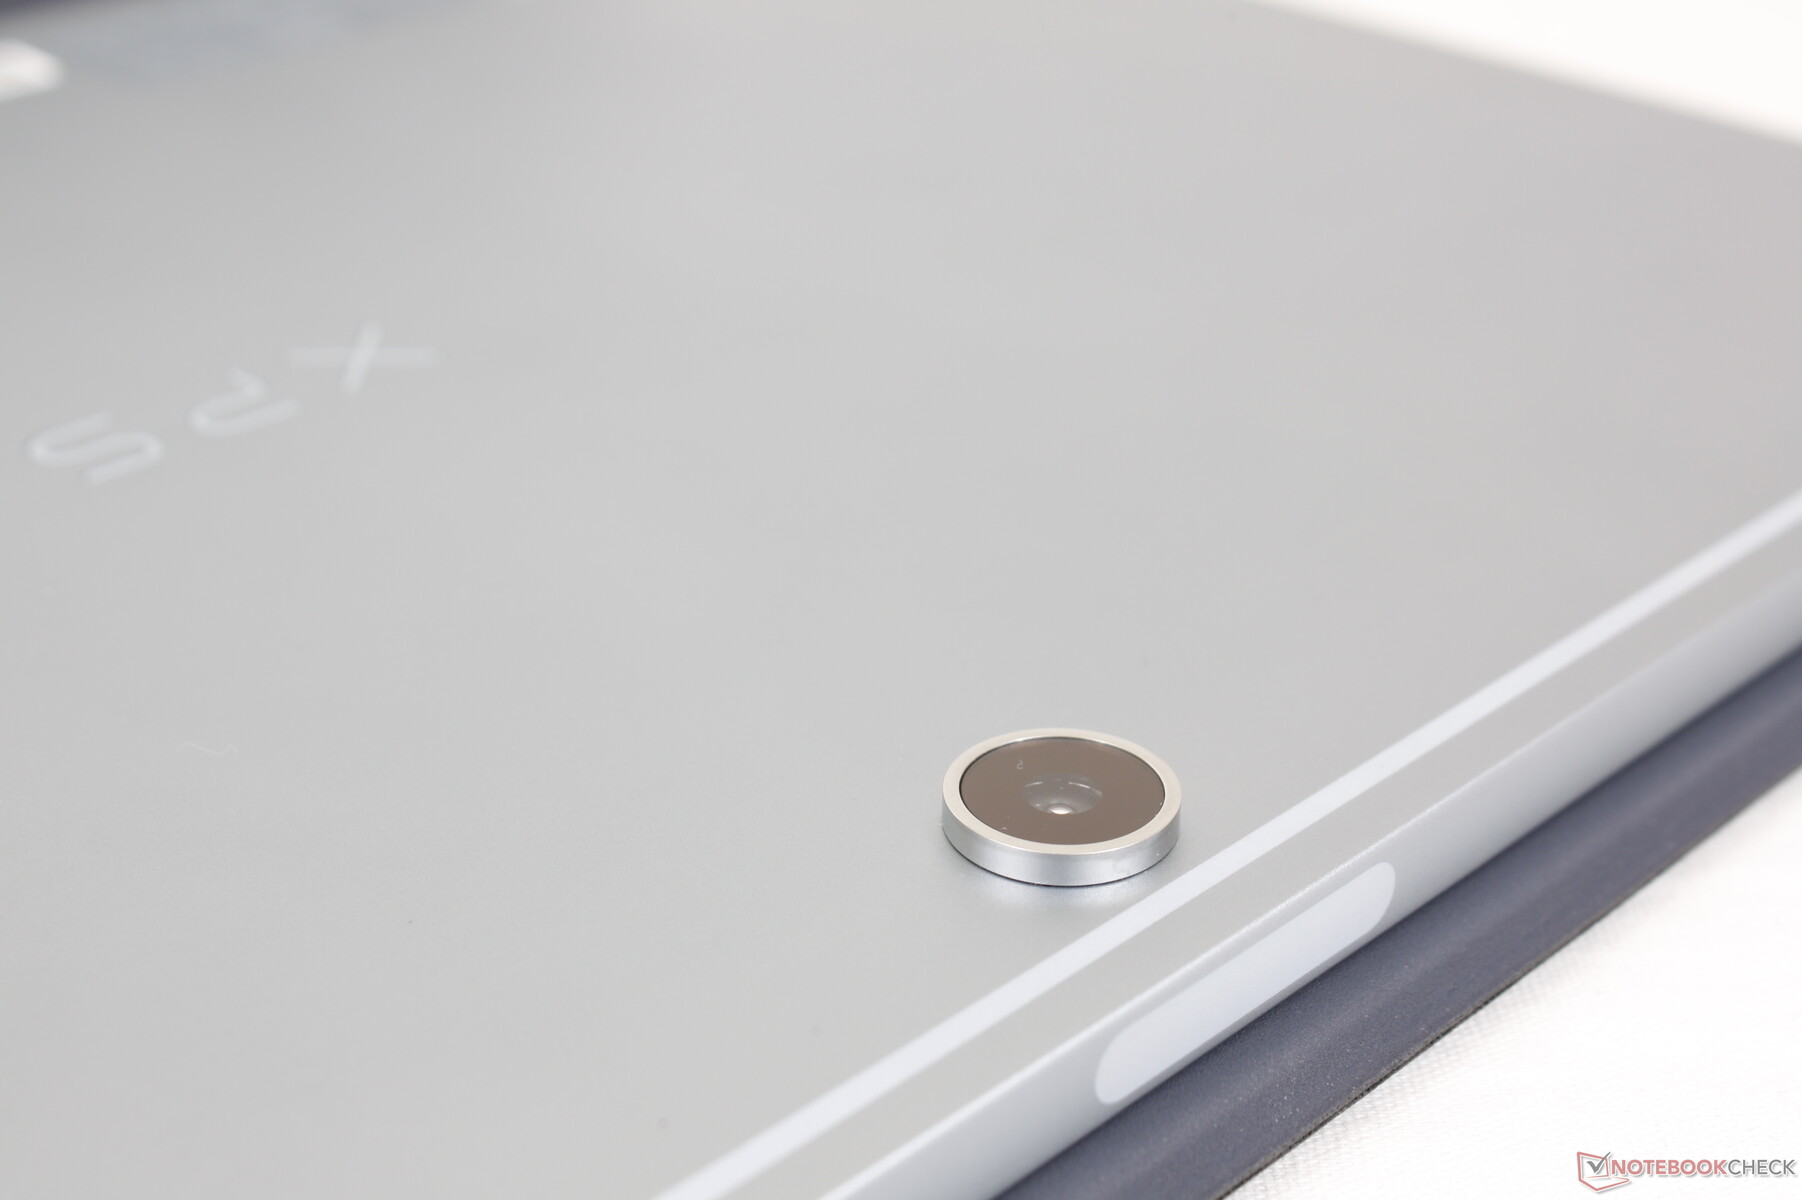
外壳 - 比Surface Pro 8更轻
骨架的背面和边缘是铝,而正面是边缘到边缘的大猩猩玻璃。这是一个坚固的,高质量的磨砂表面,正如人们所期望的那样,其颜色和纹理类似于XPS 13 9300的外盖。 XPS 13 9300或XPS 15系列的外盖。当试图扭转该设备时,有非常轻微的翘曲,但这还不足以让人担心。
在背部中央施加压力会导致轻微的凹陷和可听到的噪音。这可能是由于外壳和内部组件之间的小空气间隙造成的,这也没什么可担心的。
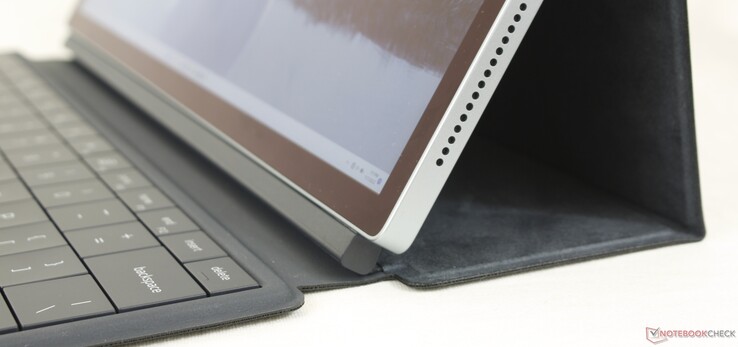
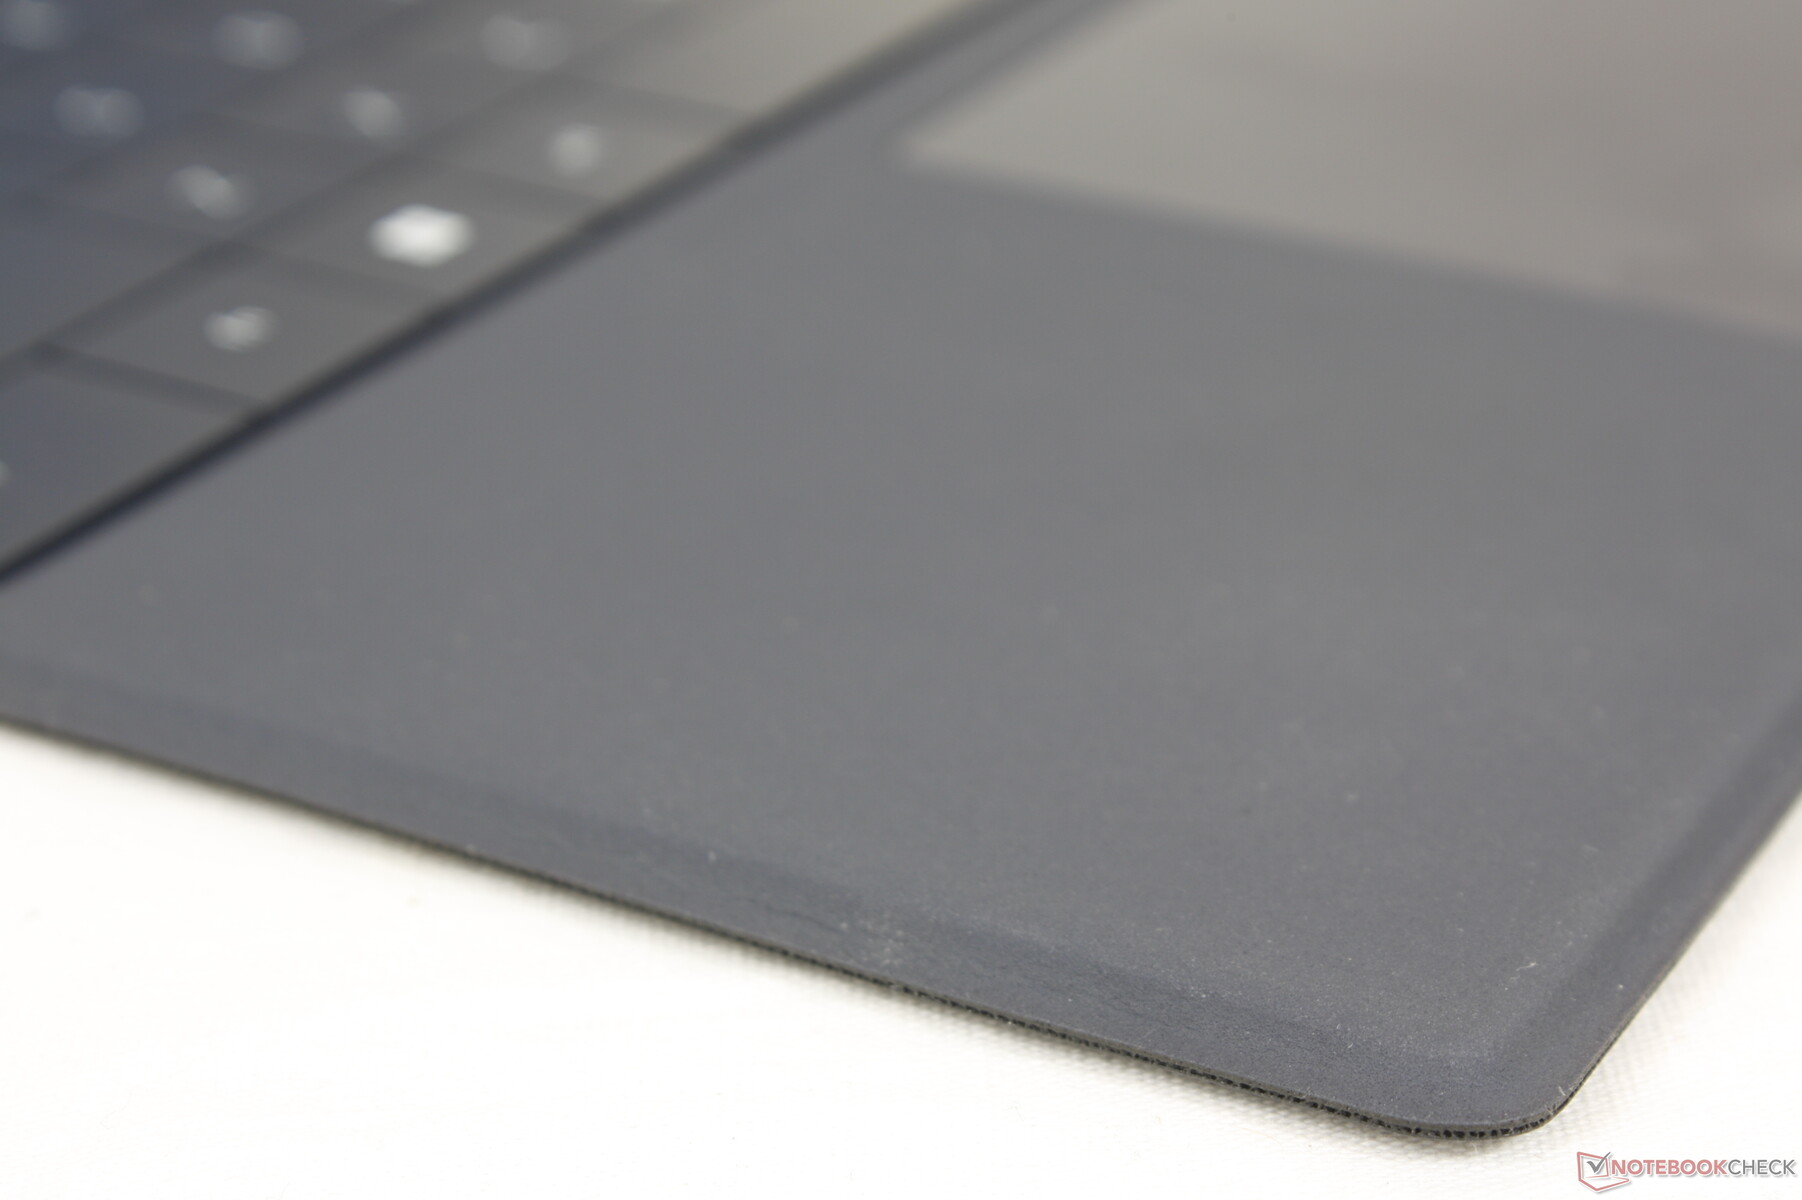
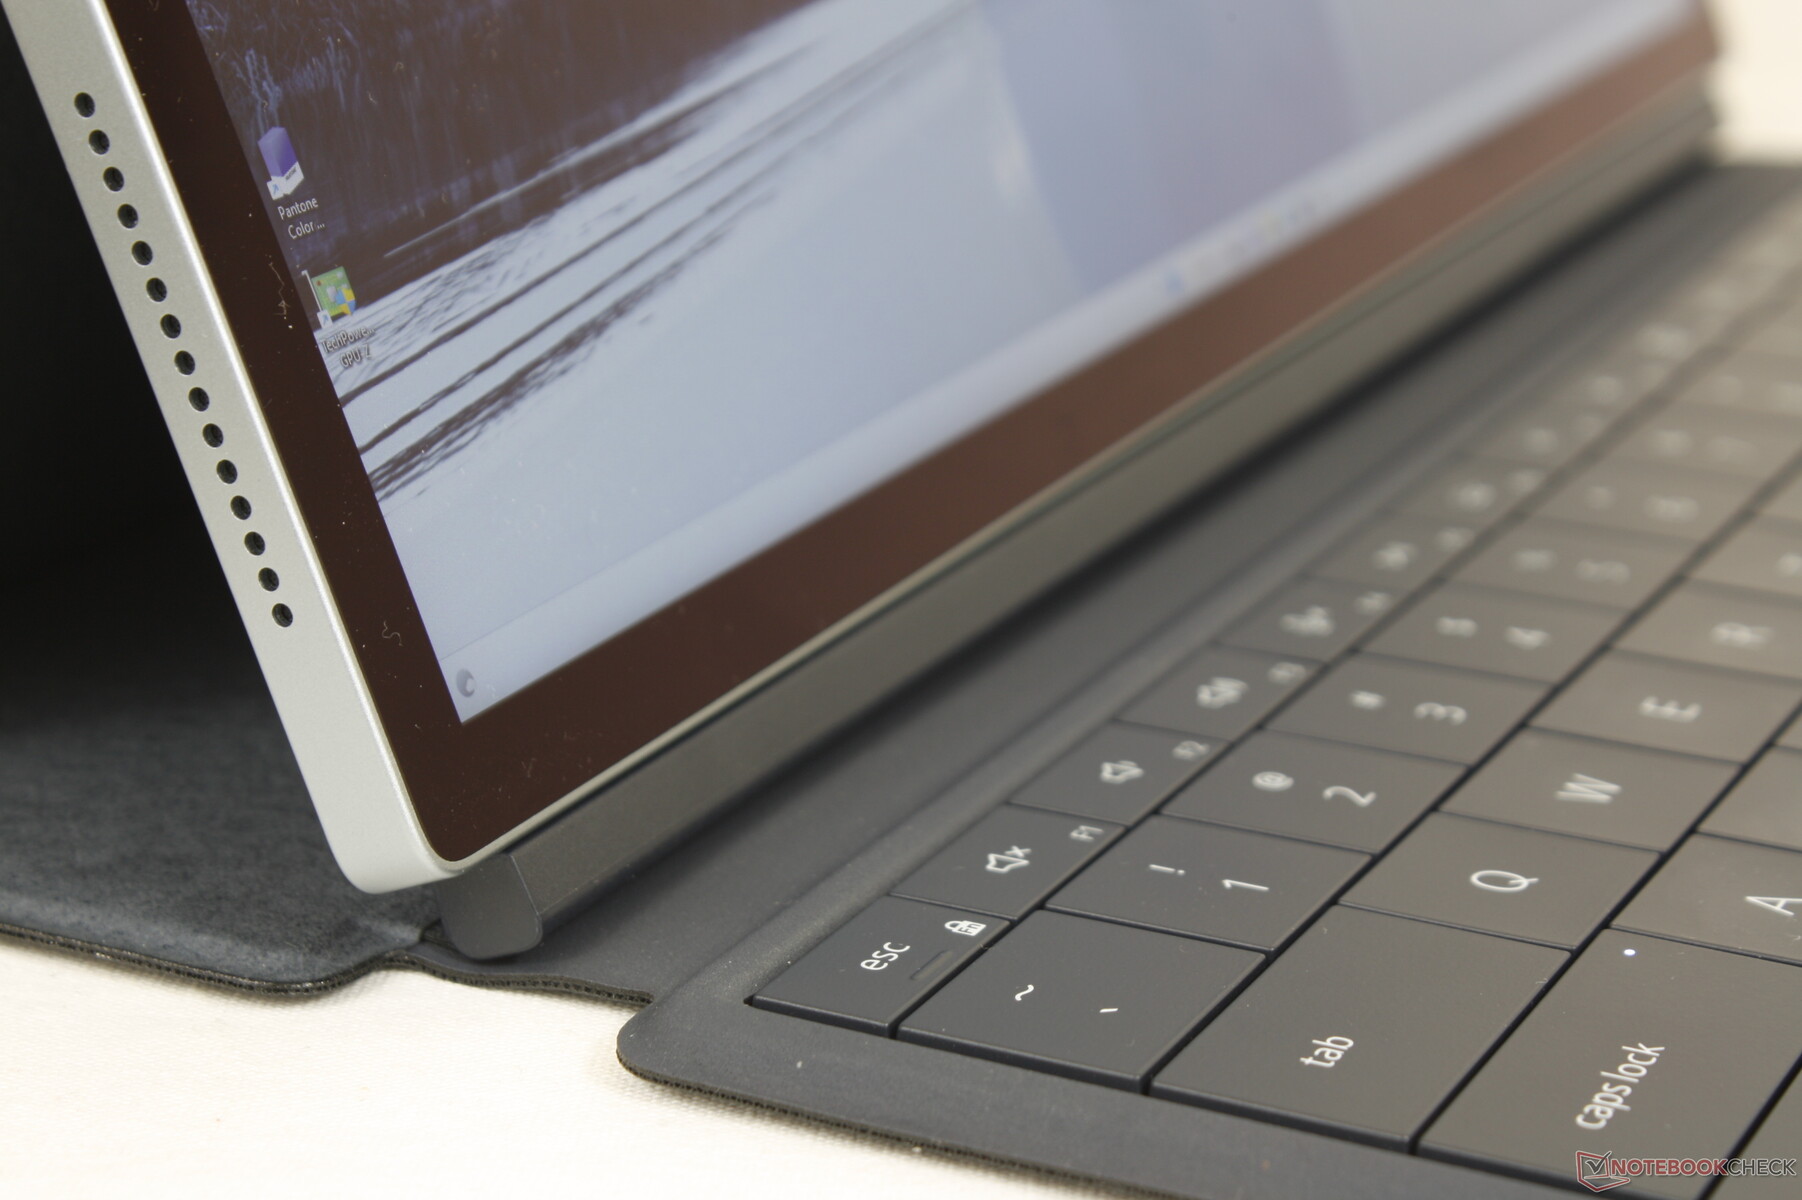
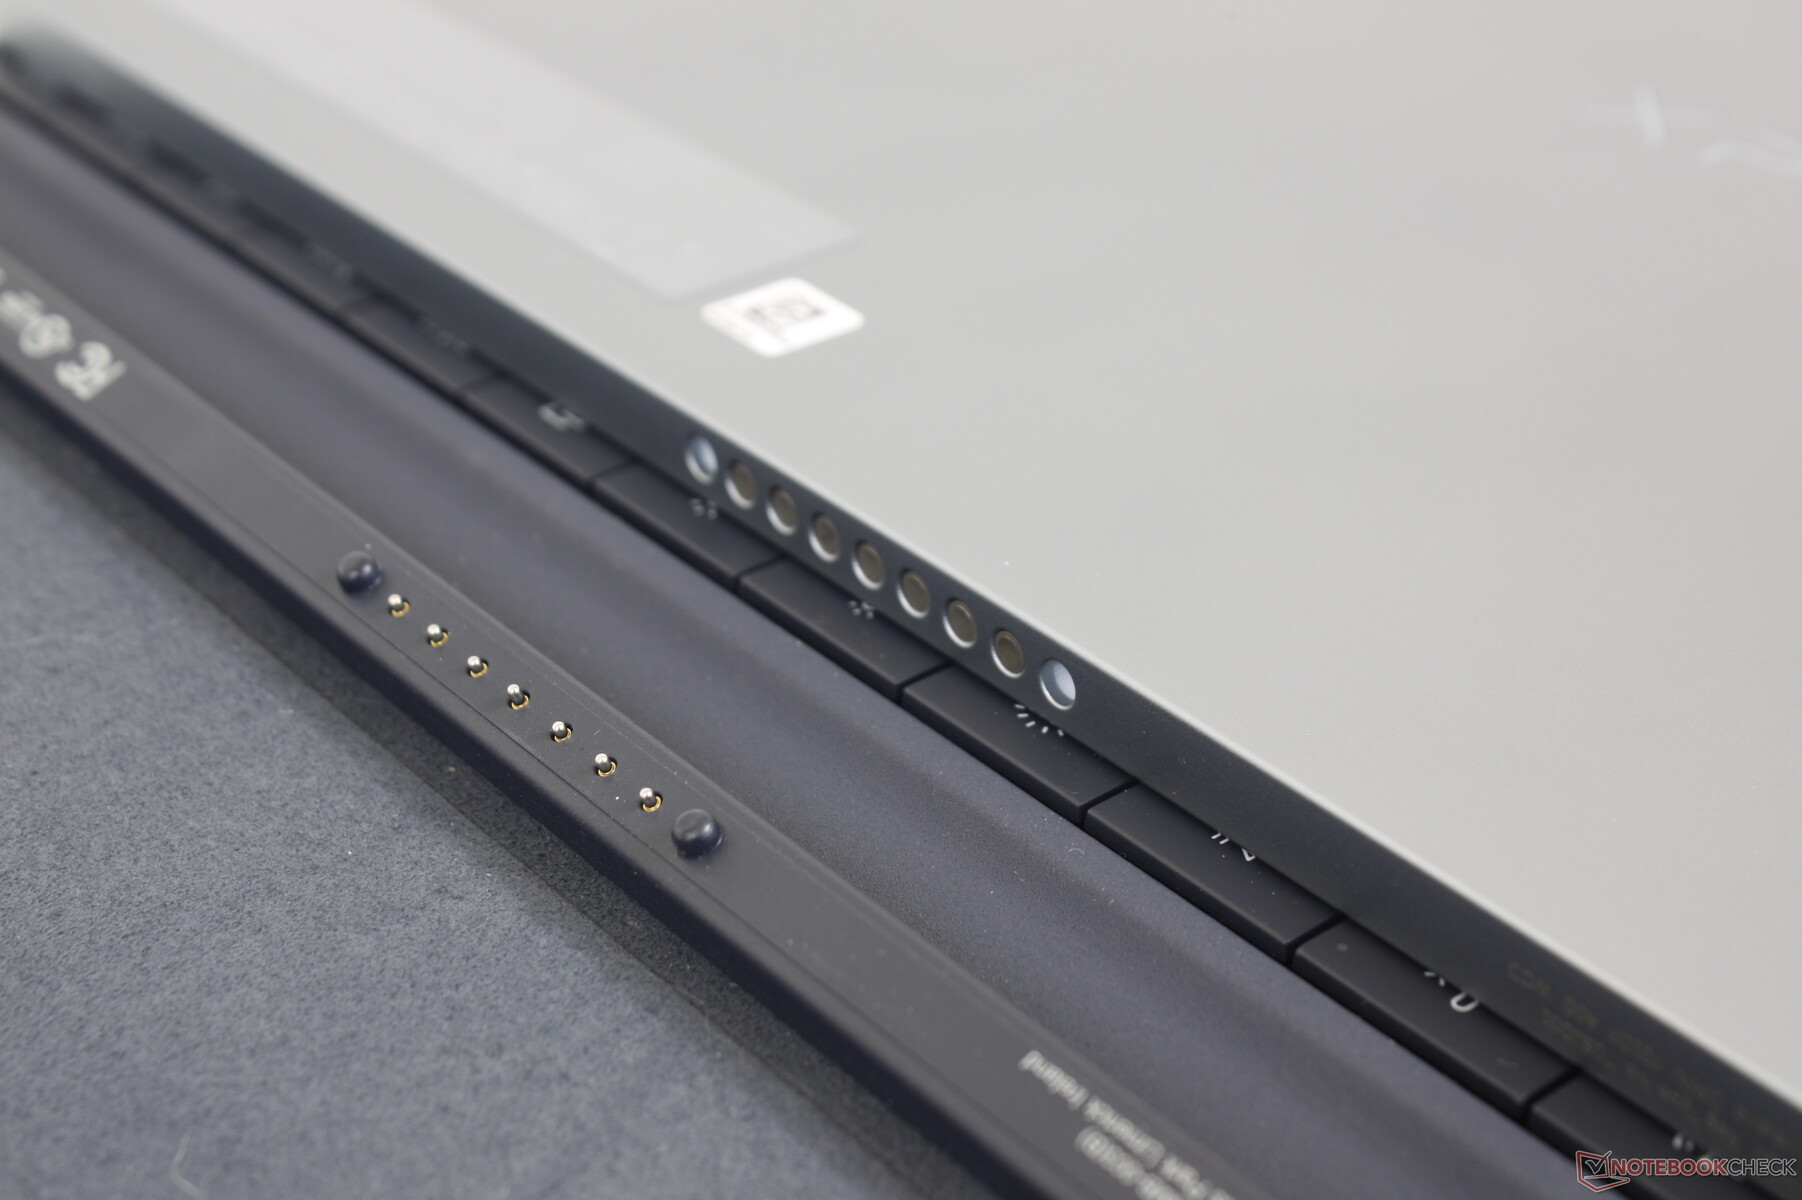
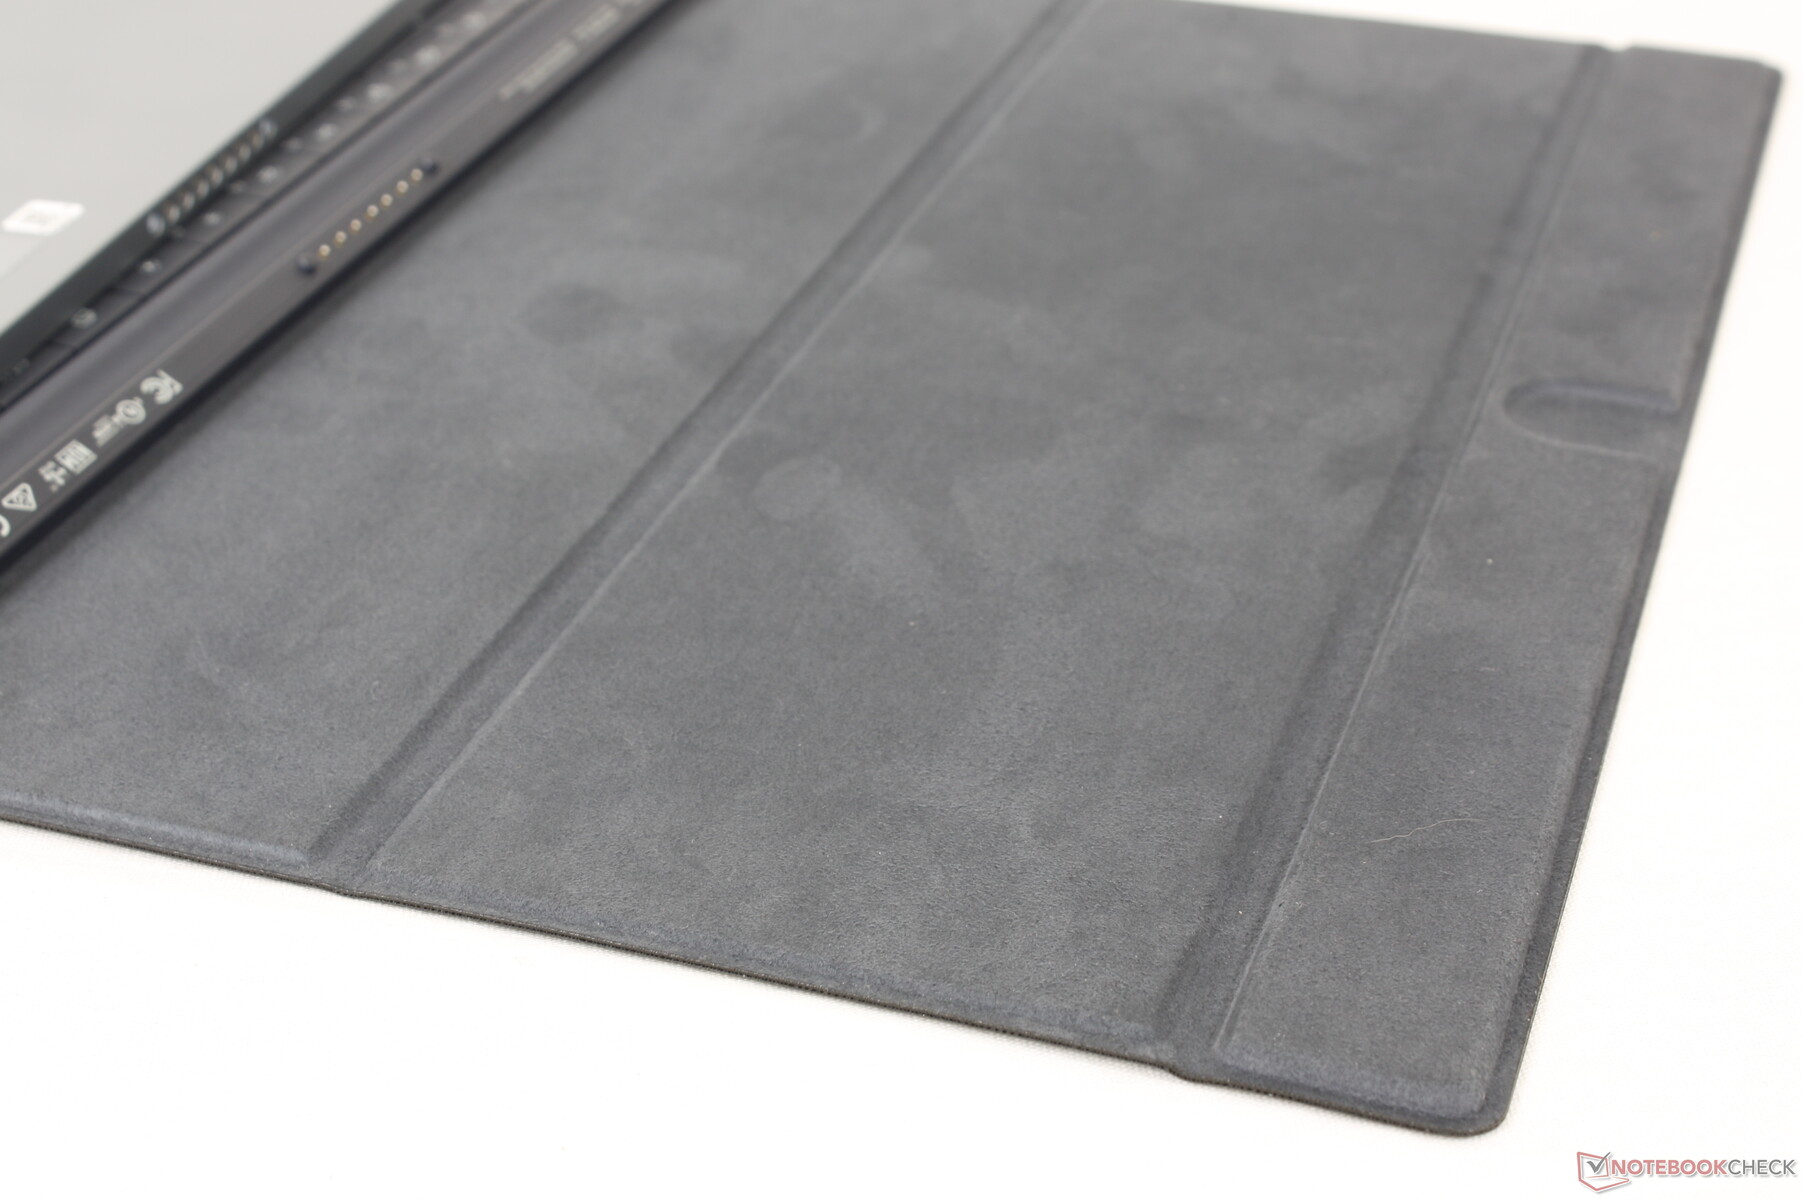
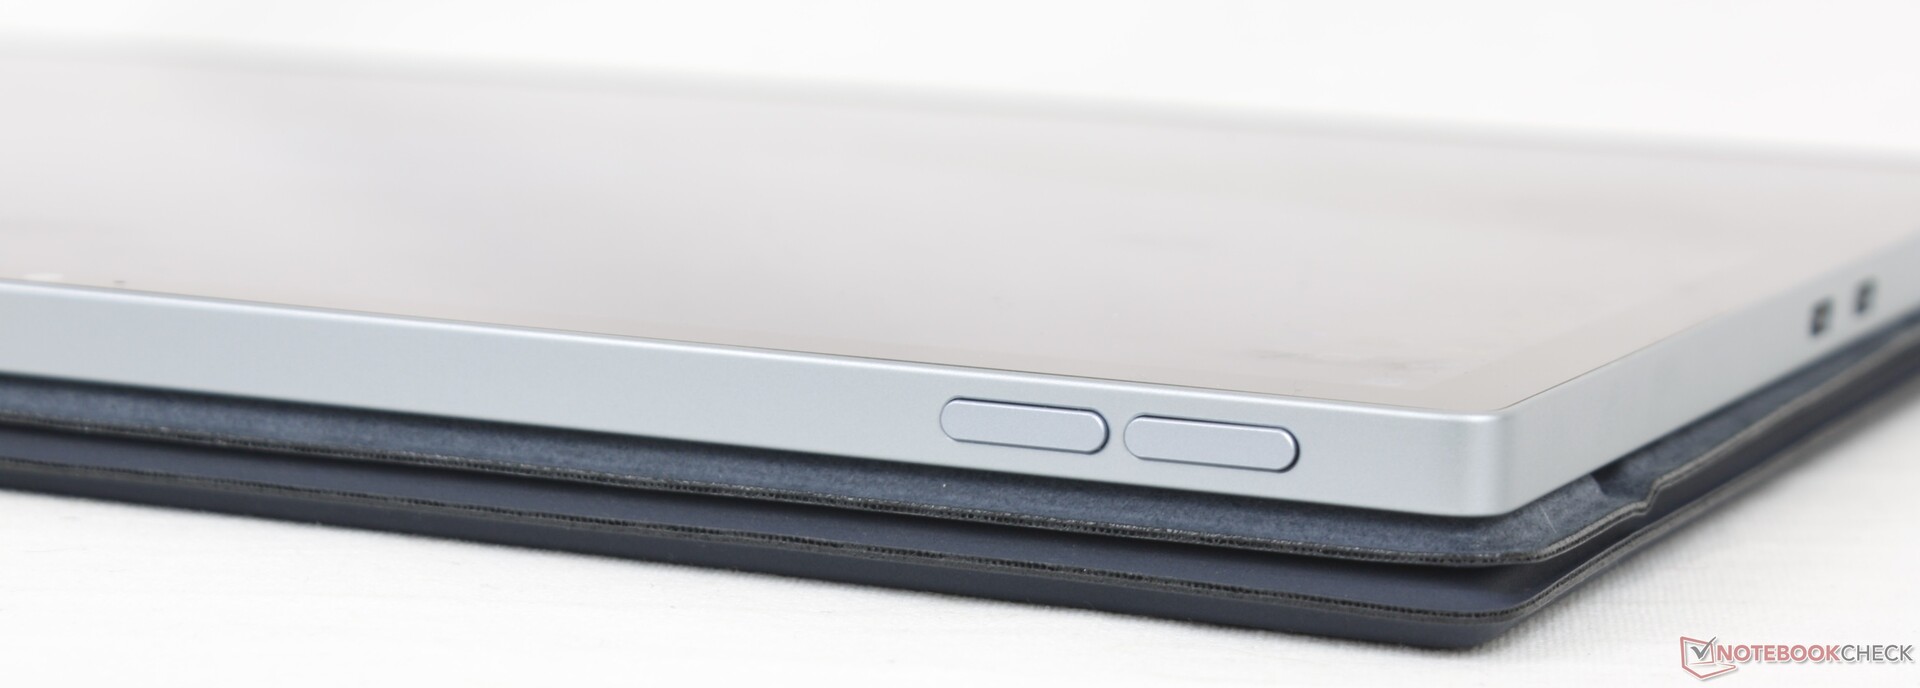
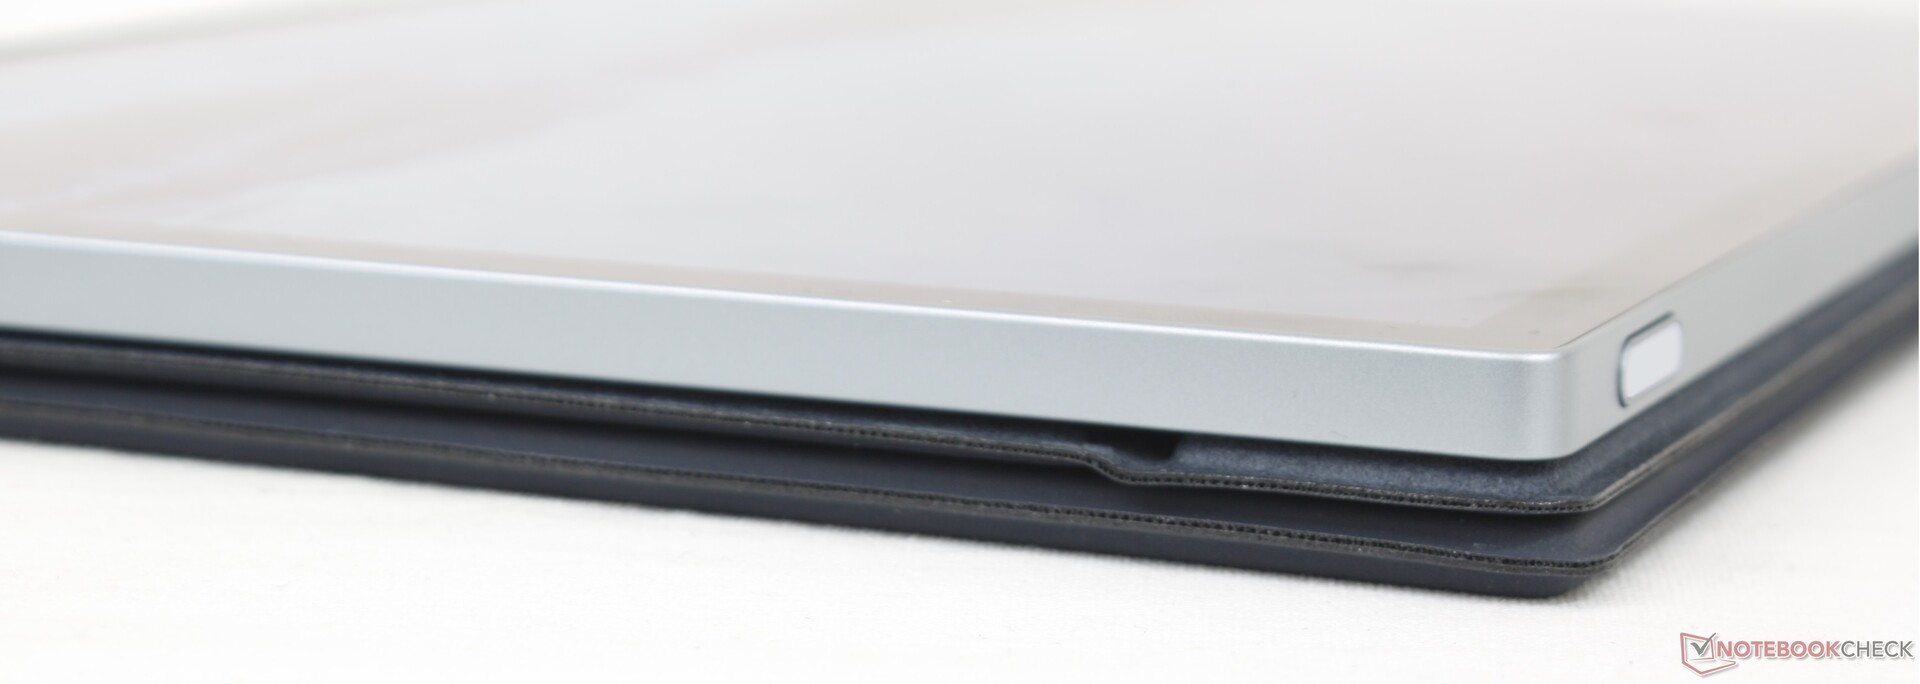
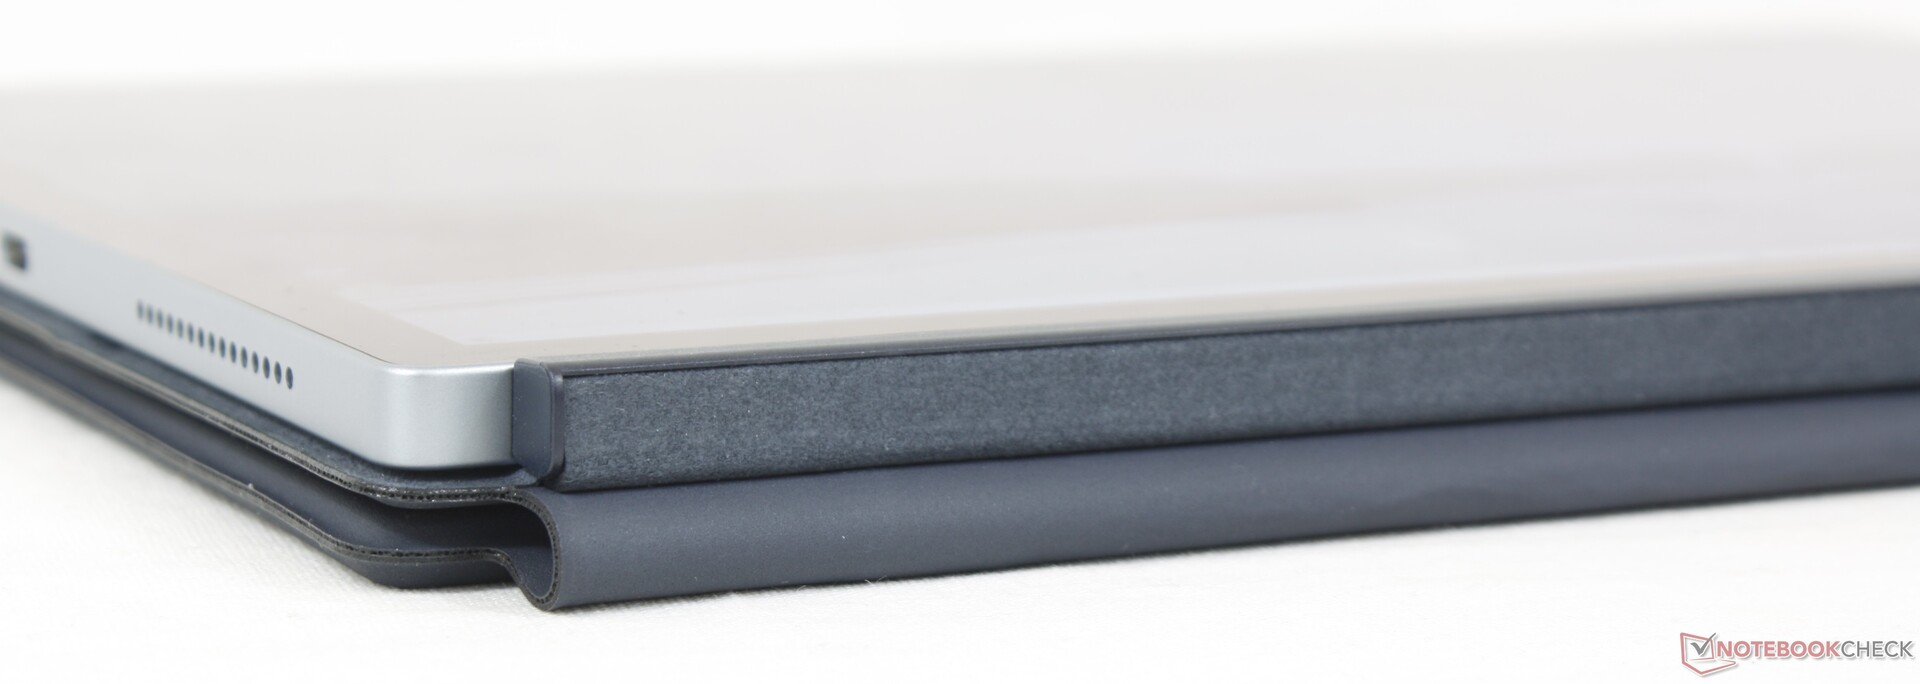
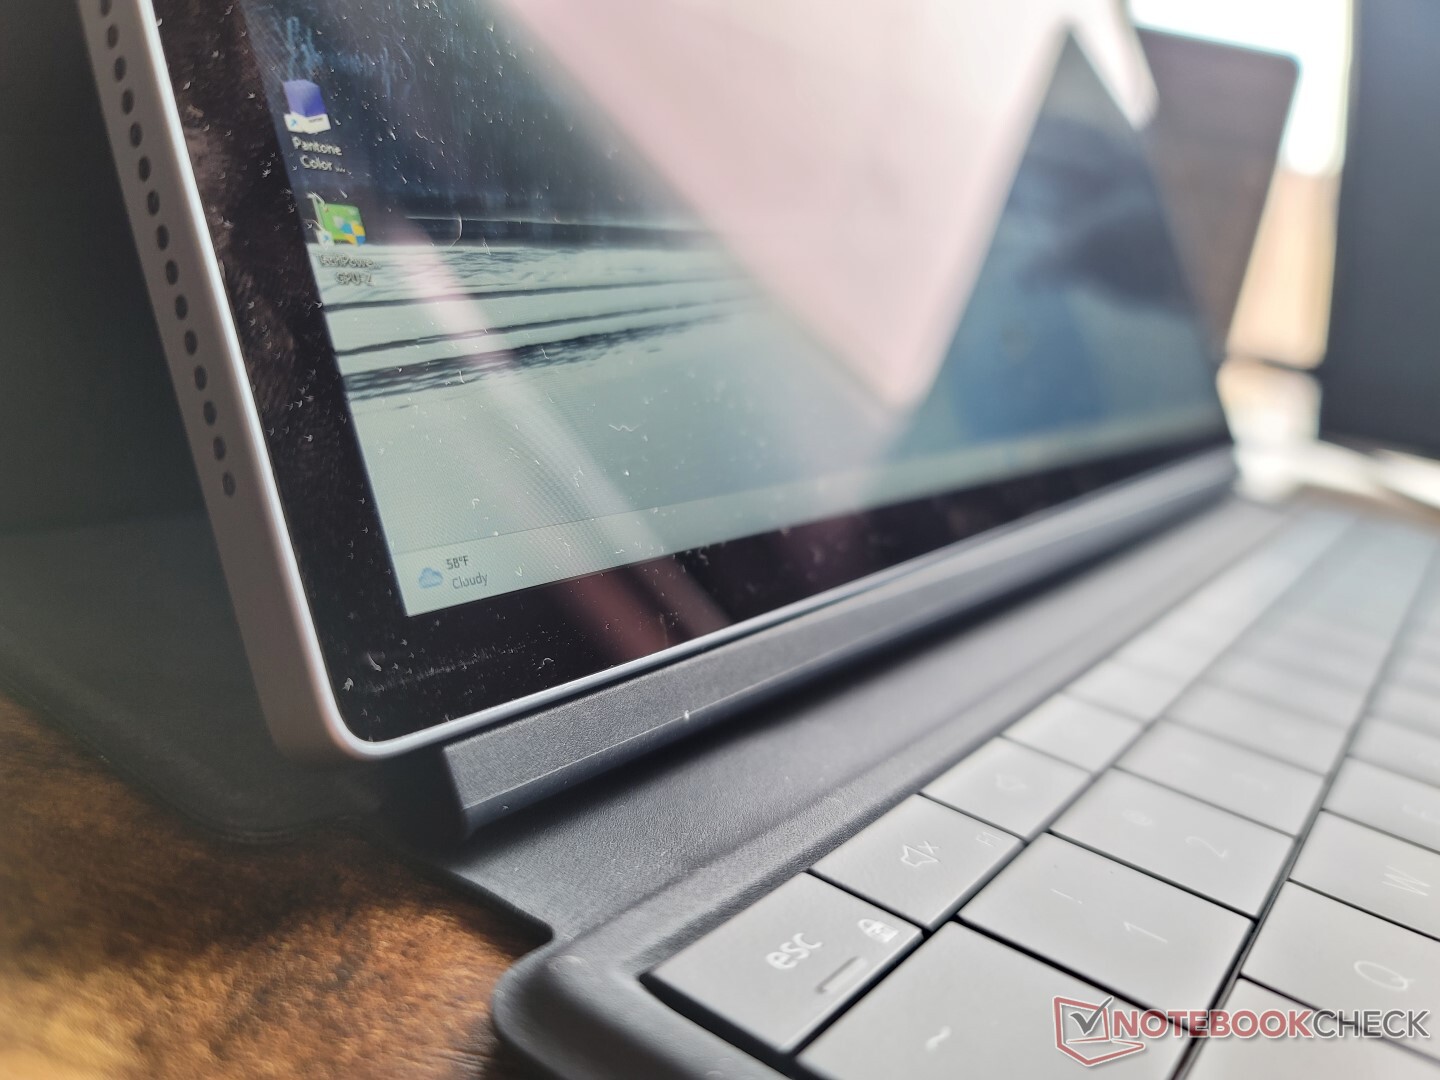
磁性键盘底座(或对开式)是一种软触材料,与Surface Pro 8键盘底座的Alcantara表面并无不同。然而,戴尔的解决方案与微软的版本有很大不同,因为它包括一个后盖,而Surface Pro Type Cover只有一个键盘和触摸板。这个后盖提供了额外的保护,防止擦伤和划伤,代价是增加了重量。
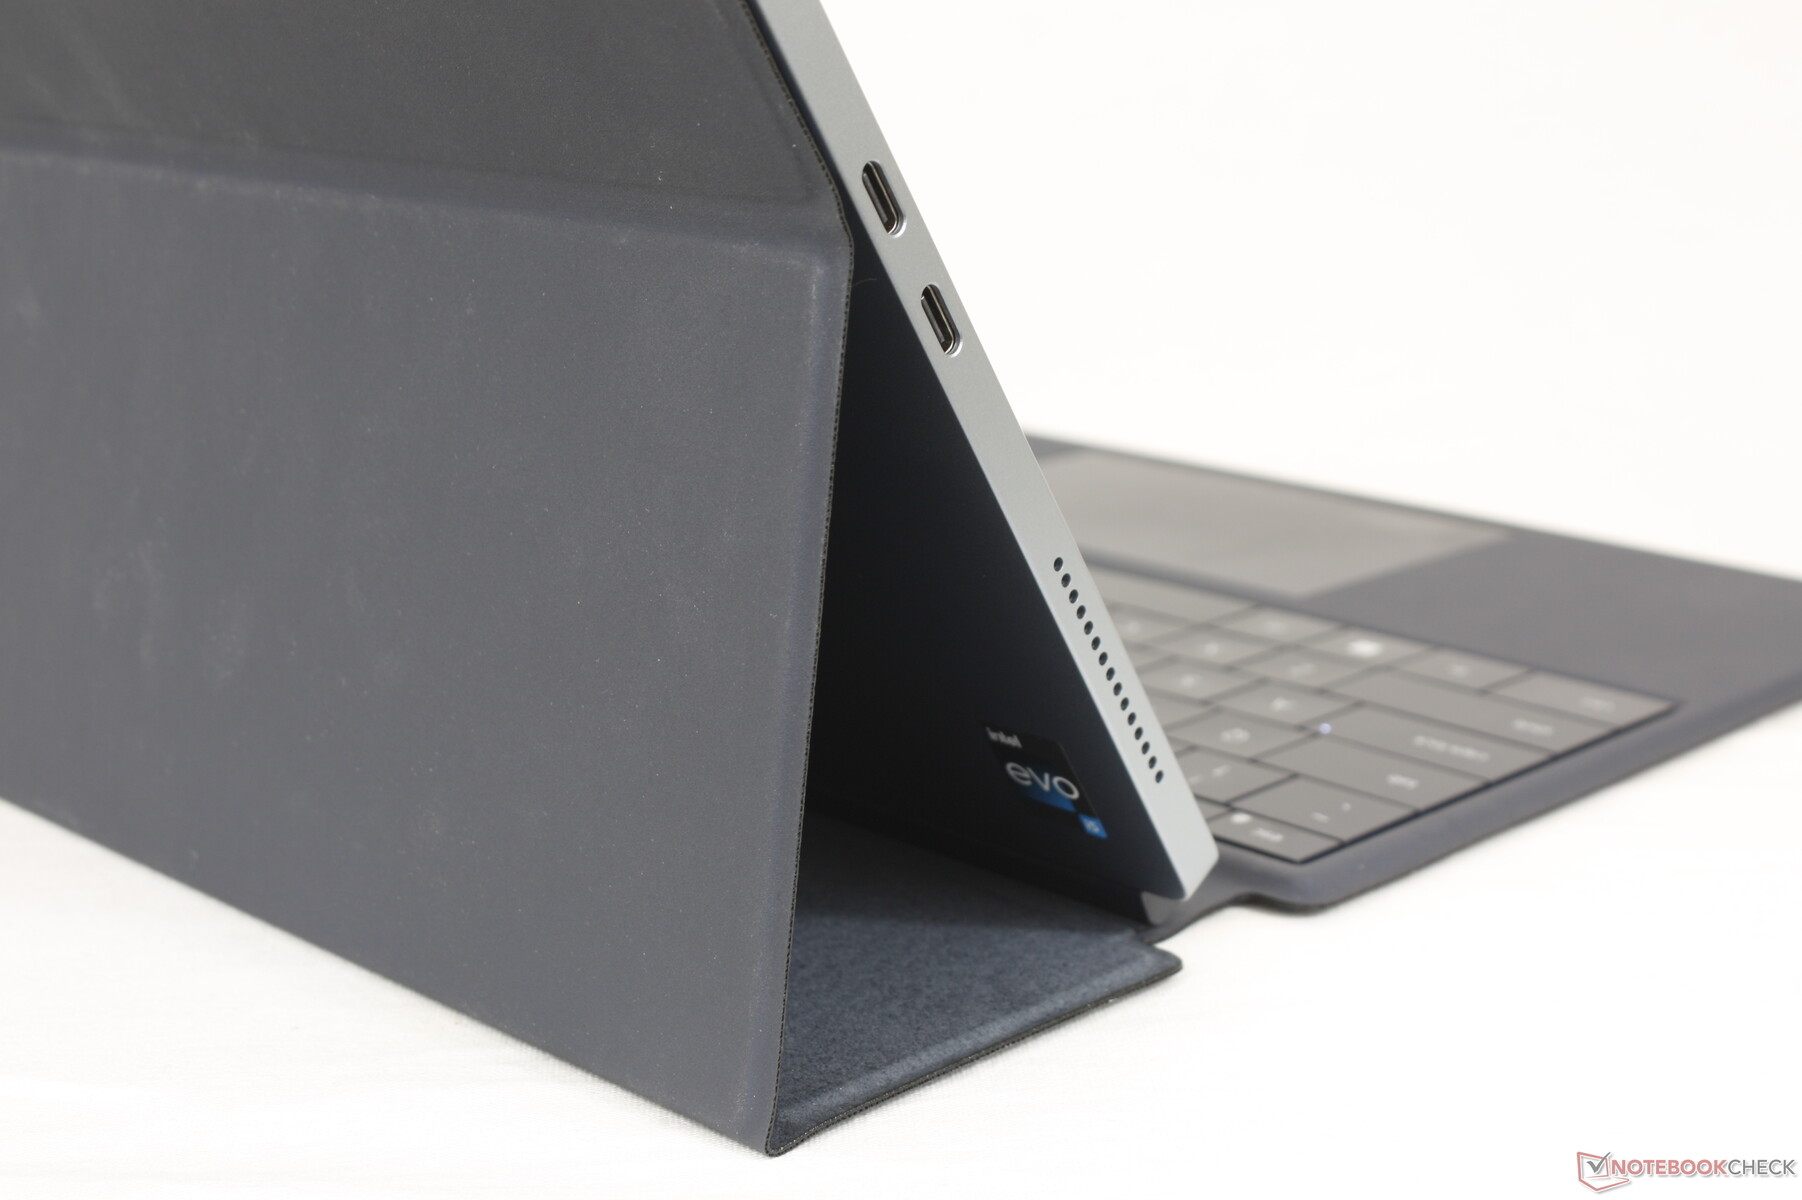
为了将戴尔平板电脑固定在笔记本电脑模式下,对开的背面只能调整到100、115和125度,而Surface Pro 8的铰链可以更自由地移动。换句话说,XPS 13 9315二合一需要可选的对开式底座来支撑自己,而Surface Pro 8有一个更方便的内置支架。
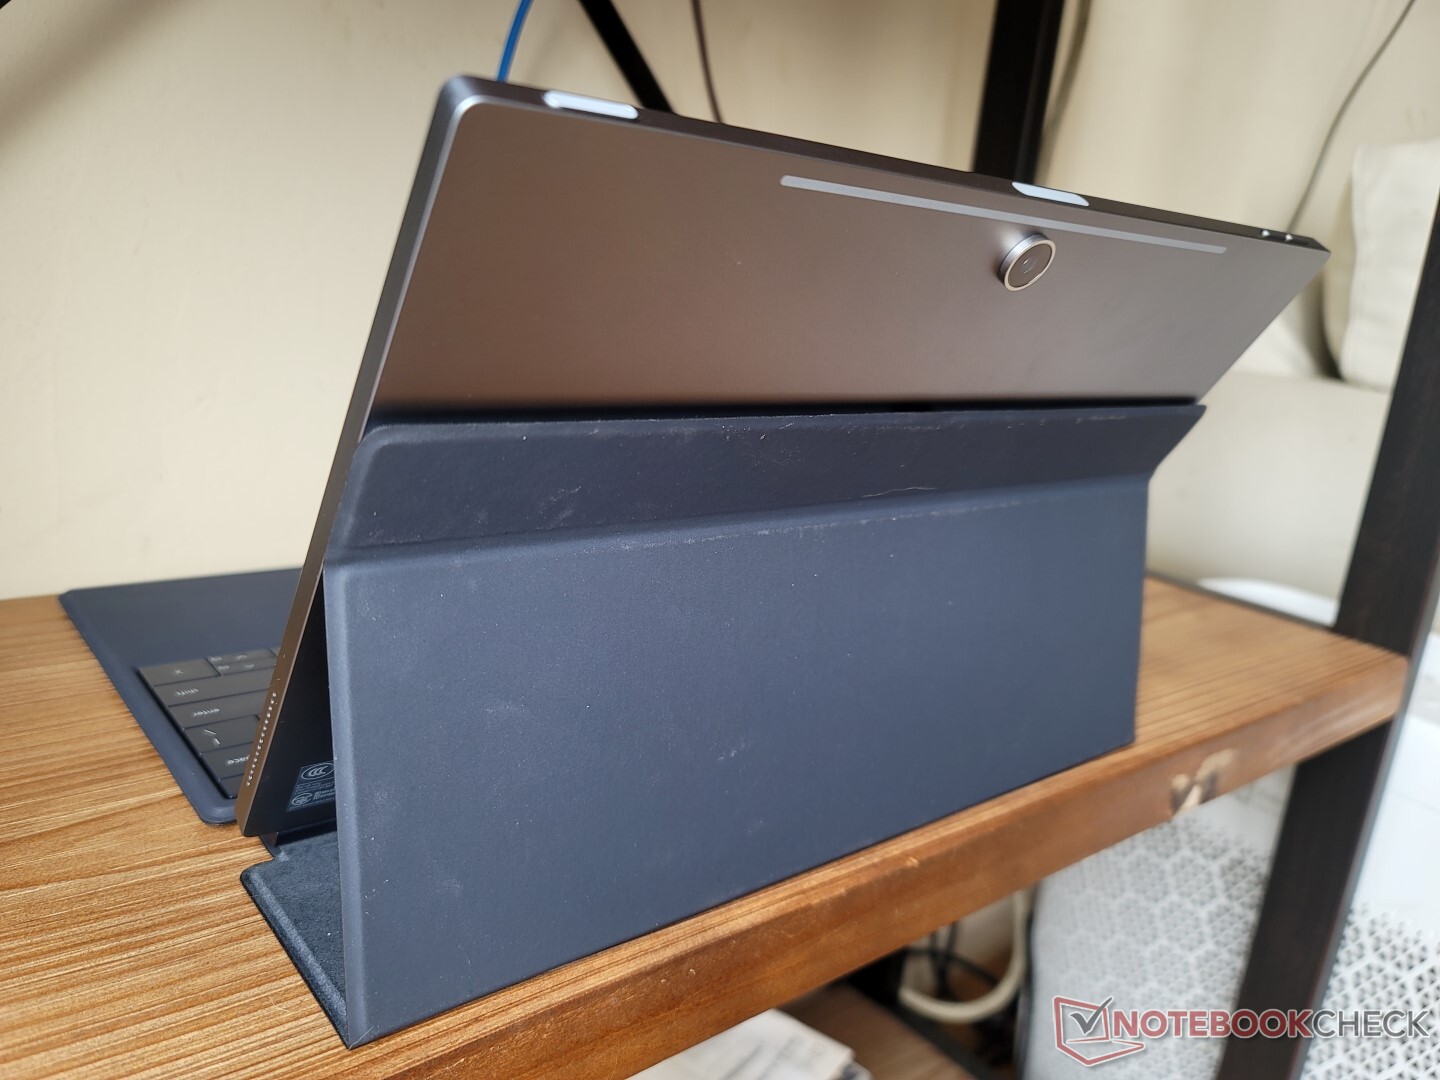
这款平板电脑本身非常轻,仅有764克,相比之下,它的重量接近900克。 笔记本电脑.重量的减轻在很大程度上可以归功于戴尔的无风扇设计,而微软的模型则包含了一个风扇,可以更好地散热。平板电脑和外壳的综合重量为1305克,接近许多13.5英寸的蛤壳,如惠普Spectre x360 13.5.
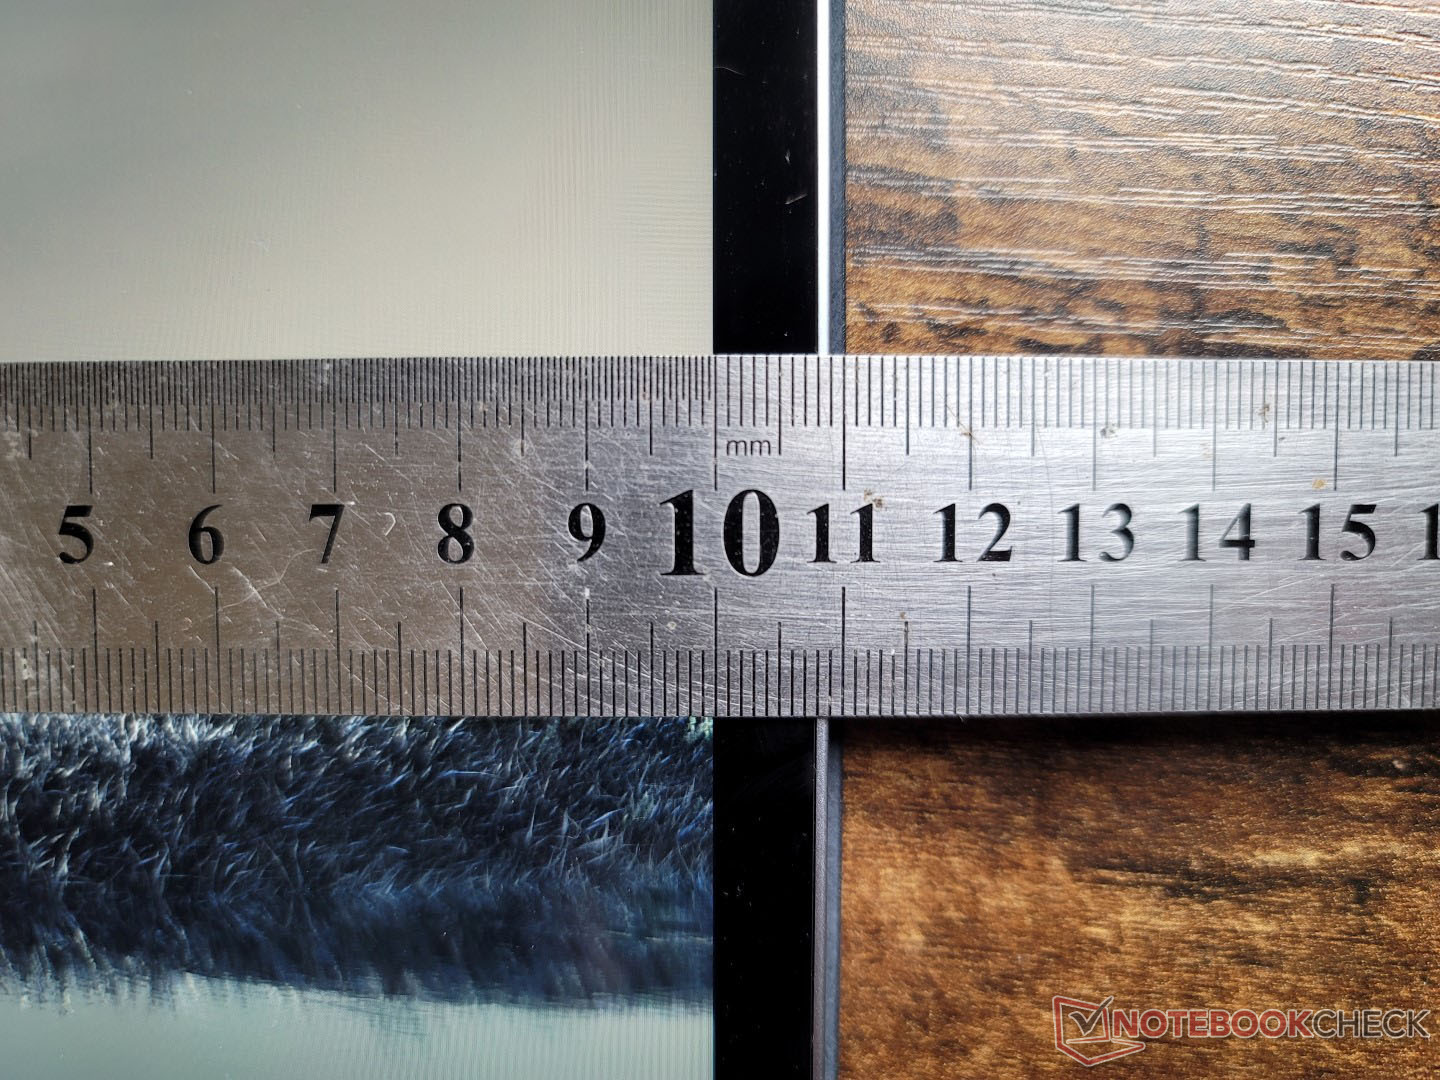
XPS 13 9315二合一的5G配置稍微厚了4/10毫米(7.8对7.4毫米)。所有选项仍然比Surface Pro 8薄了一截,而在长度和宽度上几乎相同。
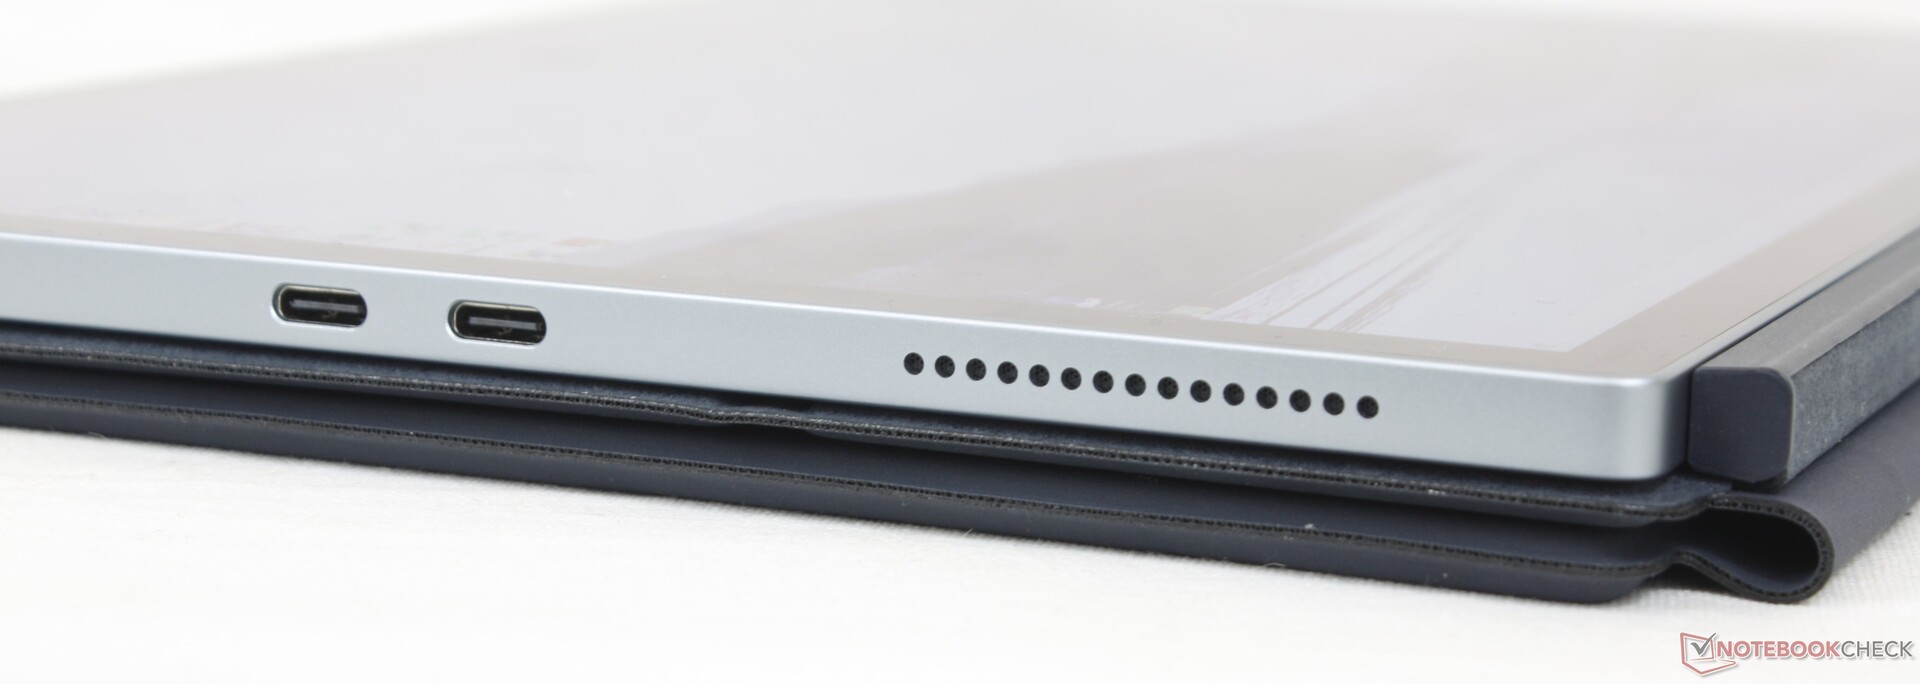
连接性 - 无音频插孔
沿着左侧边缘只有两个USB-C端口,每个都与雷电4设备兼容。预计用户将准备好对接站和适配器,以更好地利用这两个端口。请记住,甚至没有一个3.5毫米的音频插孔,而Surface Pro 8则包括一个。
沟通
一个英特尔1675 AX211是Wi-Fi 6E和蓝牙5.2兼容性的标准配置。当与我们的6GHz网络配对时,传输率快速而稳定,但平均接收率比预期的要慢一点。
| Networking | |
| iperf3 transmit AX12 | |
| Microsoft Surface Pro 8, i7-1185G7 | |
| Lenovo ThinkBook Plus Gen2 Core i5 | |
| iperf3 receive AX12 | |
| Microsoft Surface Pro 8, i7-1185G7 | |
| Lenovo ThinkBook Plus Gen2 Core i5 | |
| iperf3 receive AXE11000 6GHz | |
| HP Spectre x360 13.5 14t-ef000 | |
| Dell XPS 13 9315 2-in-1 Core i5-1230U | |
| iperf3 receive AXE11000 | |
| Apple MacBook Air M2 Entry | |
| iperf3 transmit AXE11000 | |
| Apple MacBook Air M2 Entry | |
| iperf3 transmit AXE11000 6GHz | |
| HP Spectre x360 13.5 14t-ef000 | |
| Dell XPS 13 9315 2-in-1 Core i5-1230U | |
网络摄像头
后置摄像头为1100万像素,也许不是巧合,比Surface Pro 8上的摄像头多了100万像素。图像质量明显比笔记本网络摄像头上的任何东西都要清晰,即使色彩准确性还有很长的路要走。
红外线用于支持Windows Hello。不幸的是,出于隐私考虑,没有网络摄像头快门。


配件和保修
零售盒中包括两个方便的USB-C适配器,用于转换为USB-A和3.5毫米音频。然而,与微软及其Surface Pro平板电脑系列一样,可拆卸的键盘底座和磁性主动式手写笔是单独出售的,每只需加100美元。换句话说,如果你想要键盘底座和笔,你必须在初始价格的基础上增加200美元。
如果在美国购买,标准的一年有限制造商保修期适用。
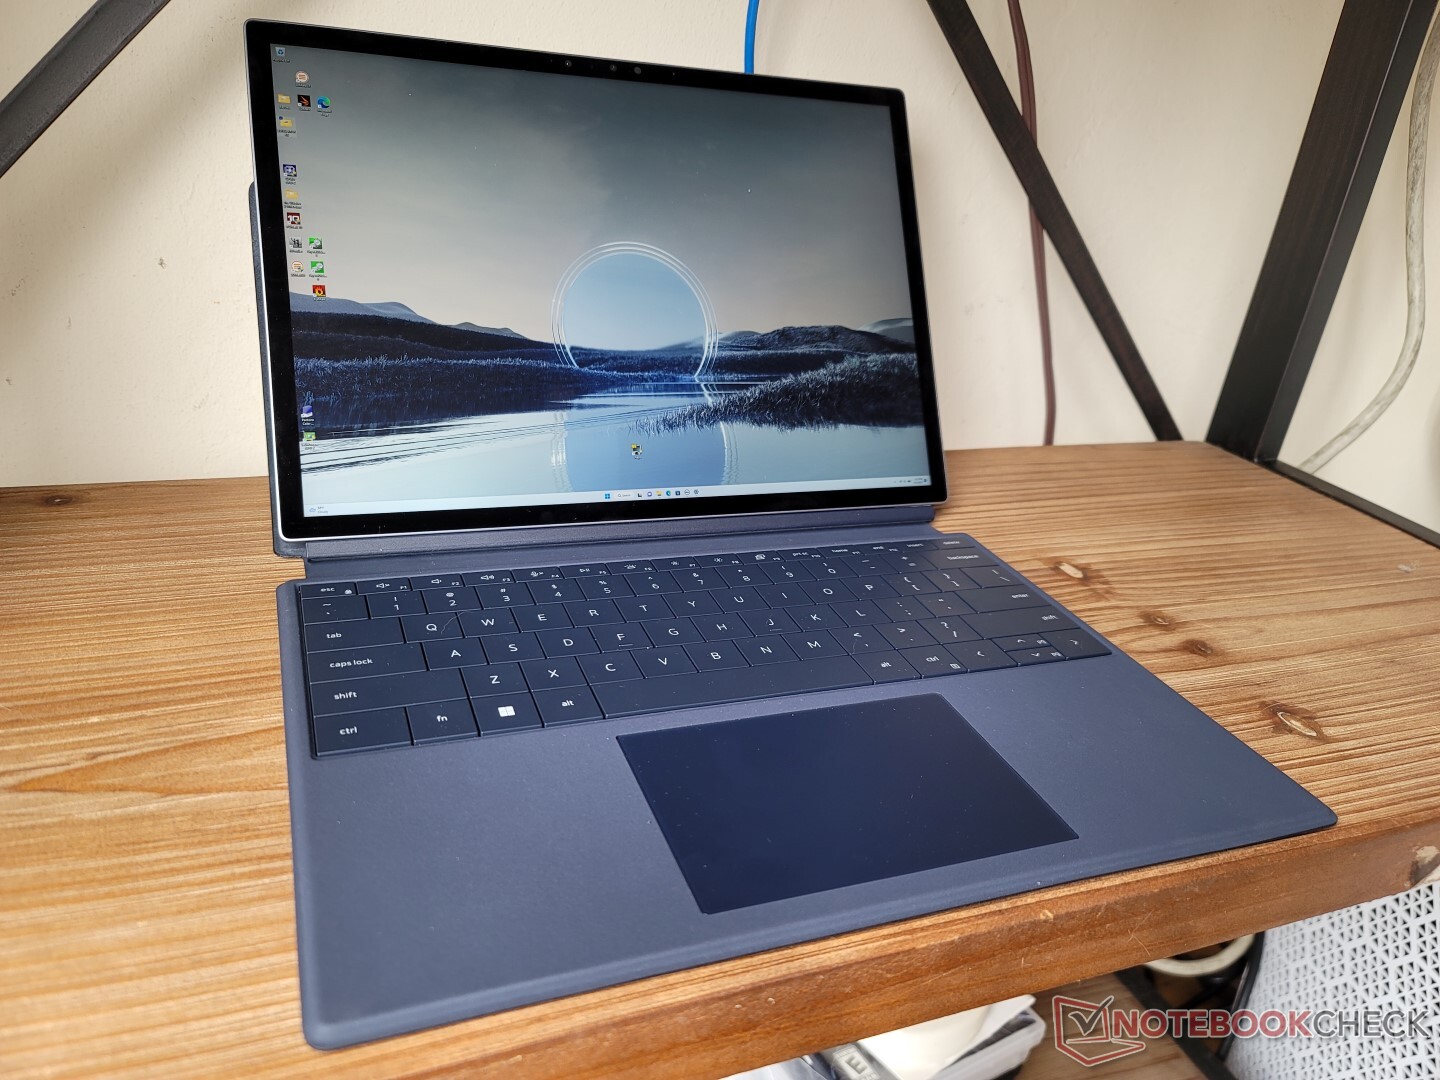
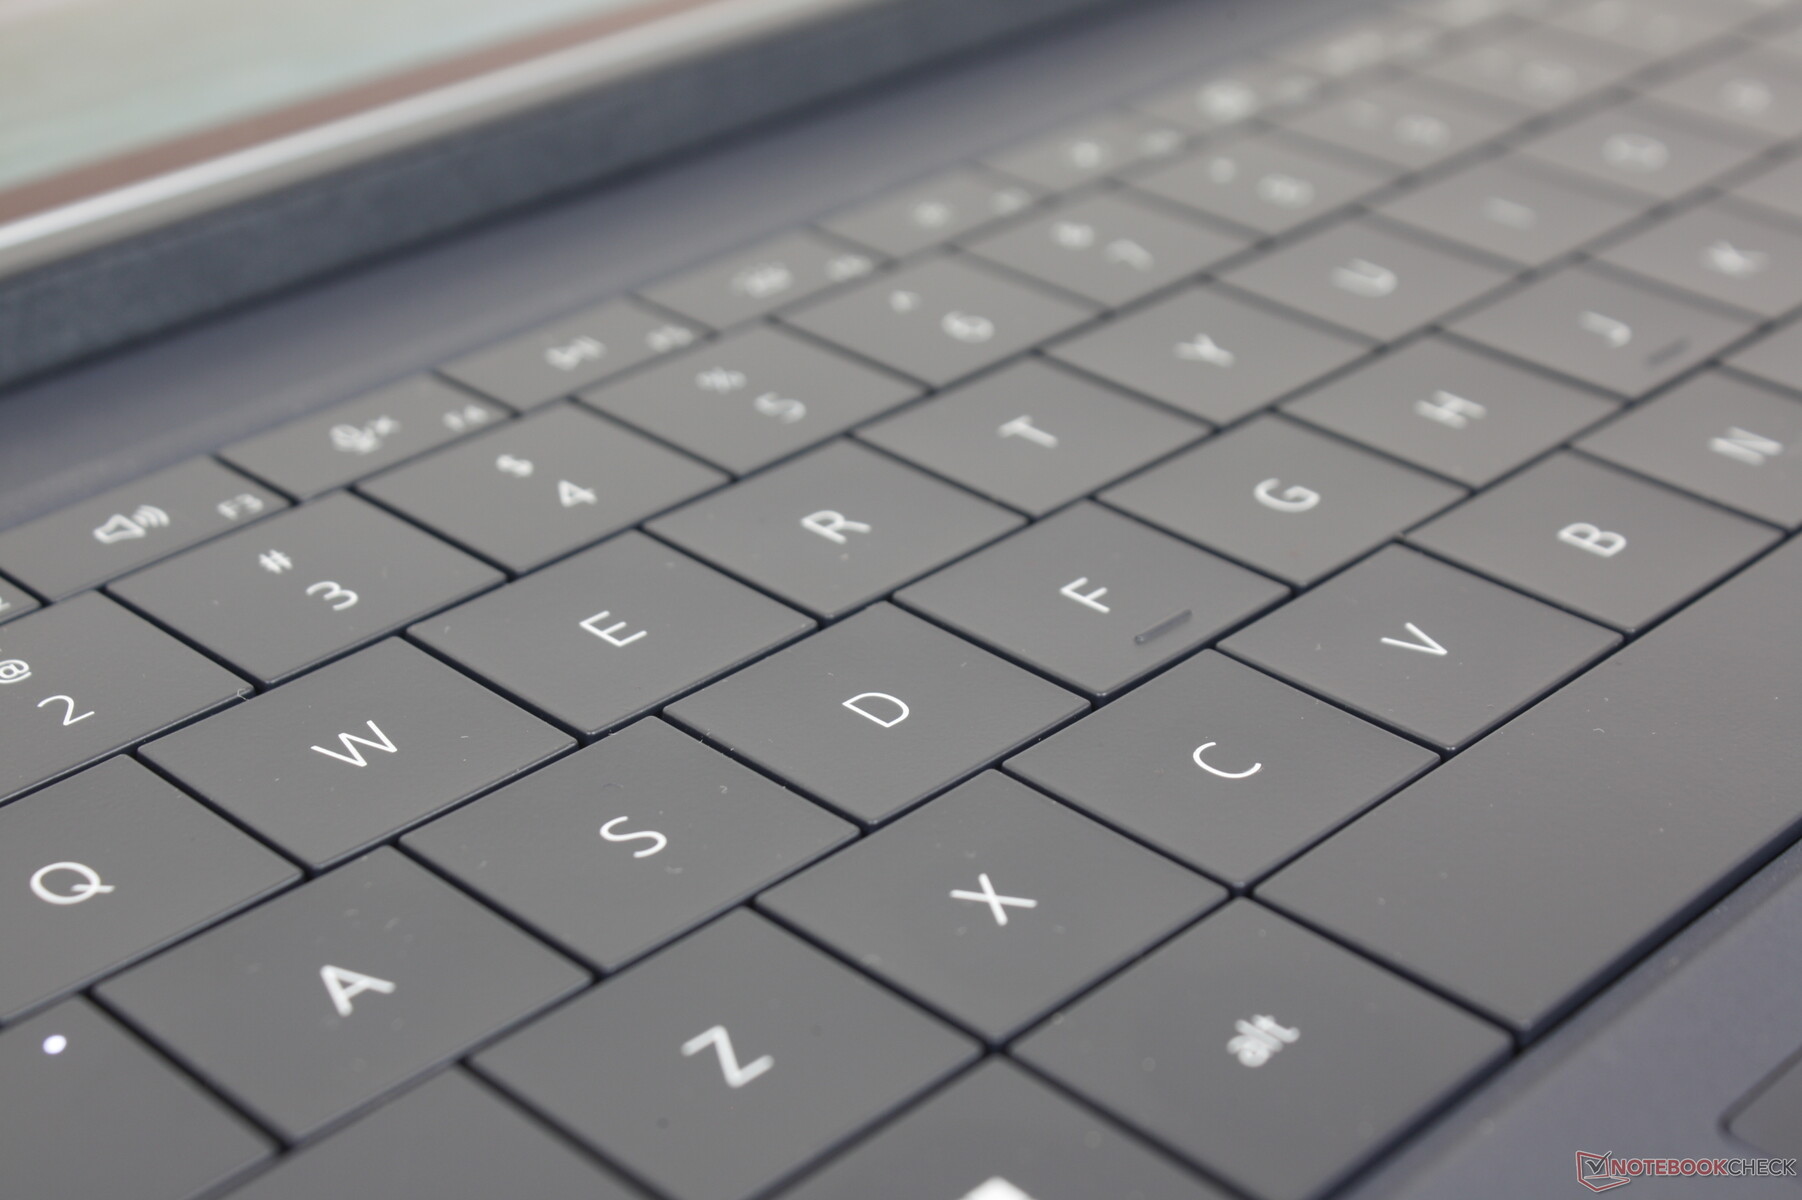
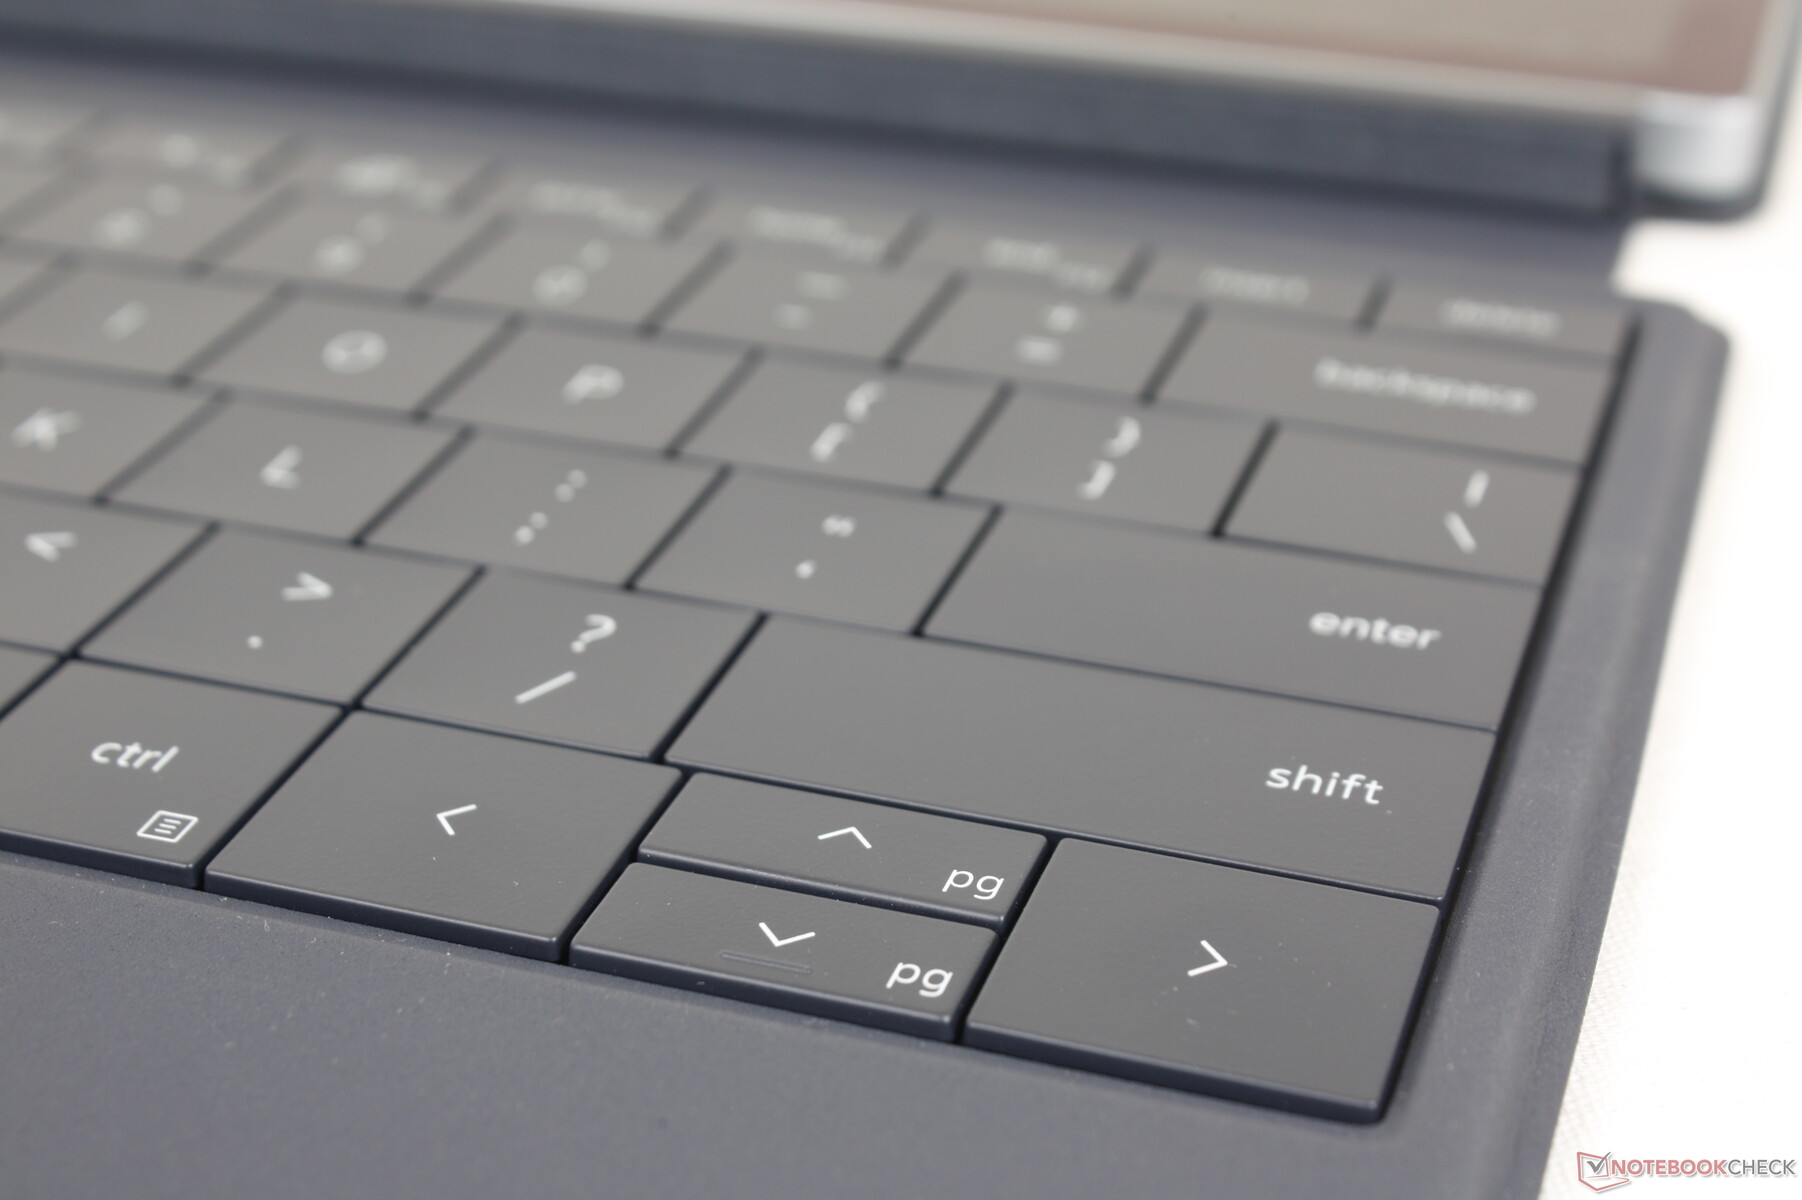
输入设备 - 最舒适的可拆卸式键盘之一
键盘
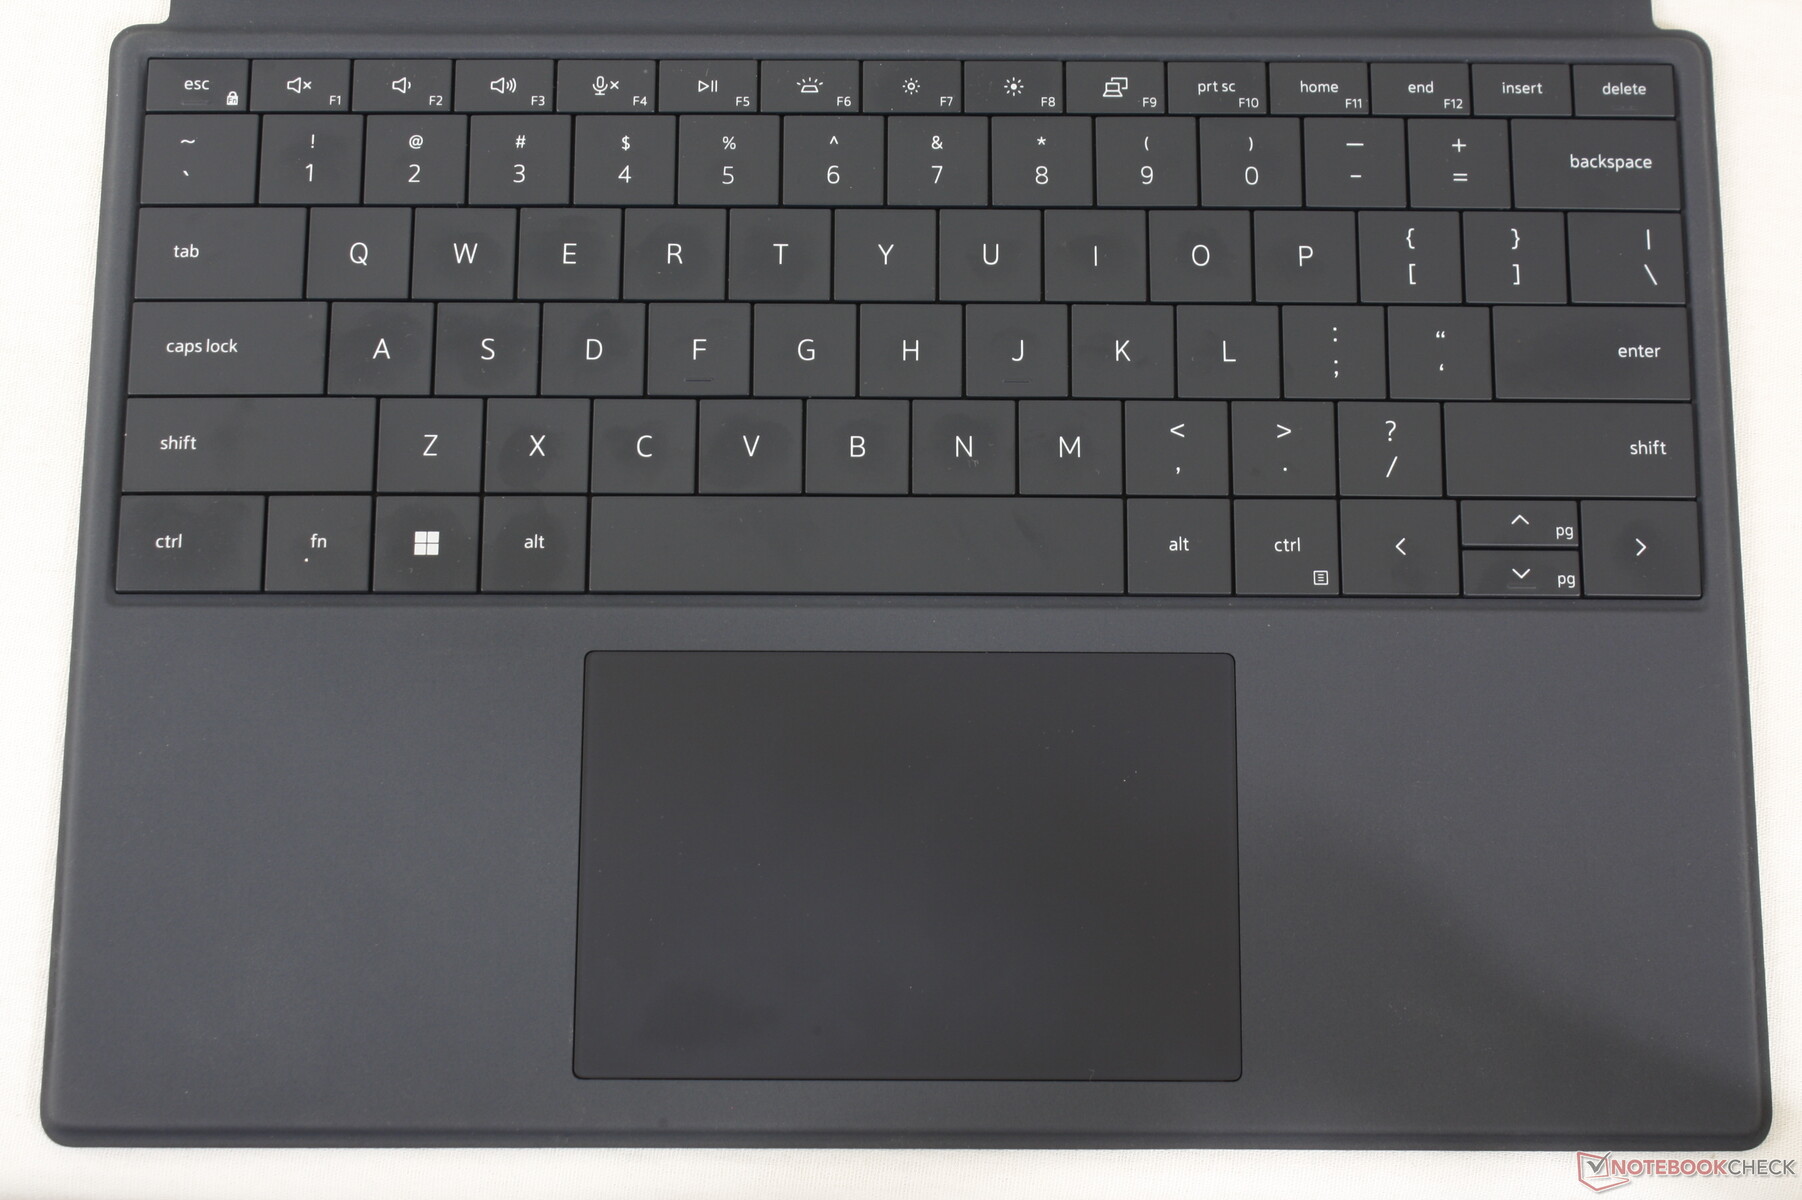
键盘是仿效了 XPS 13 Plus 9320所以在行程和反馈方面,它们的感觉几乎是一样的。有些人可能会发现1.0毫米的键程太浅,但总体感觉仍然比预期的可拆卸底座要好得多,因为该类别中的许多产品因其糟糕的按键反馈、廉价的感觉和海绵状按键而臭名昭著。到目前为止,XPS 13 9315二合一键盘最接近真正的超极本键盘。
也就是说,键盘布局与XPS 13 Plus 9320不是一对一的。后者的键盘略宽,同时纳入了电源按钮和电容式功能指令行。字体风格和白色背光在其他方面基本上是相同的。
触摸板
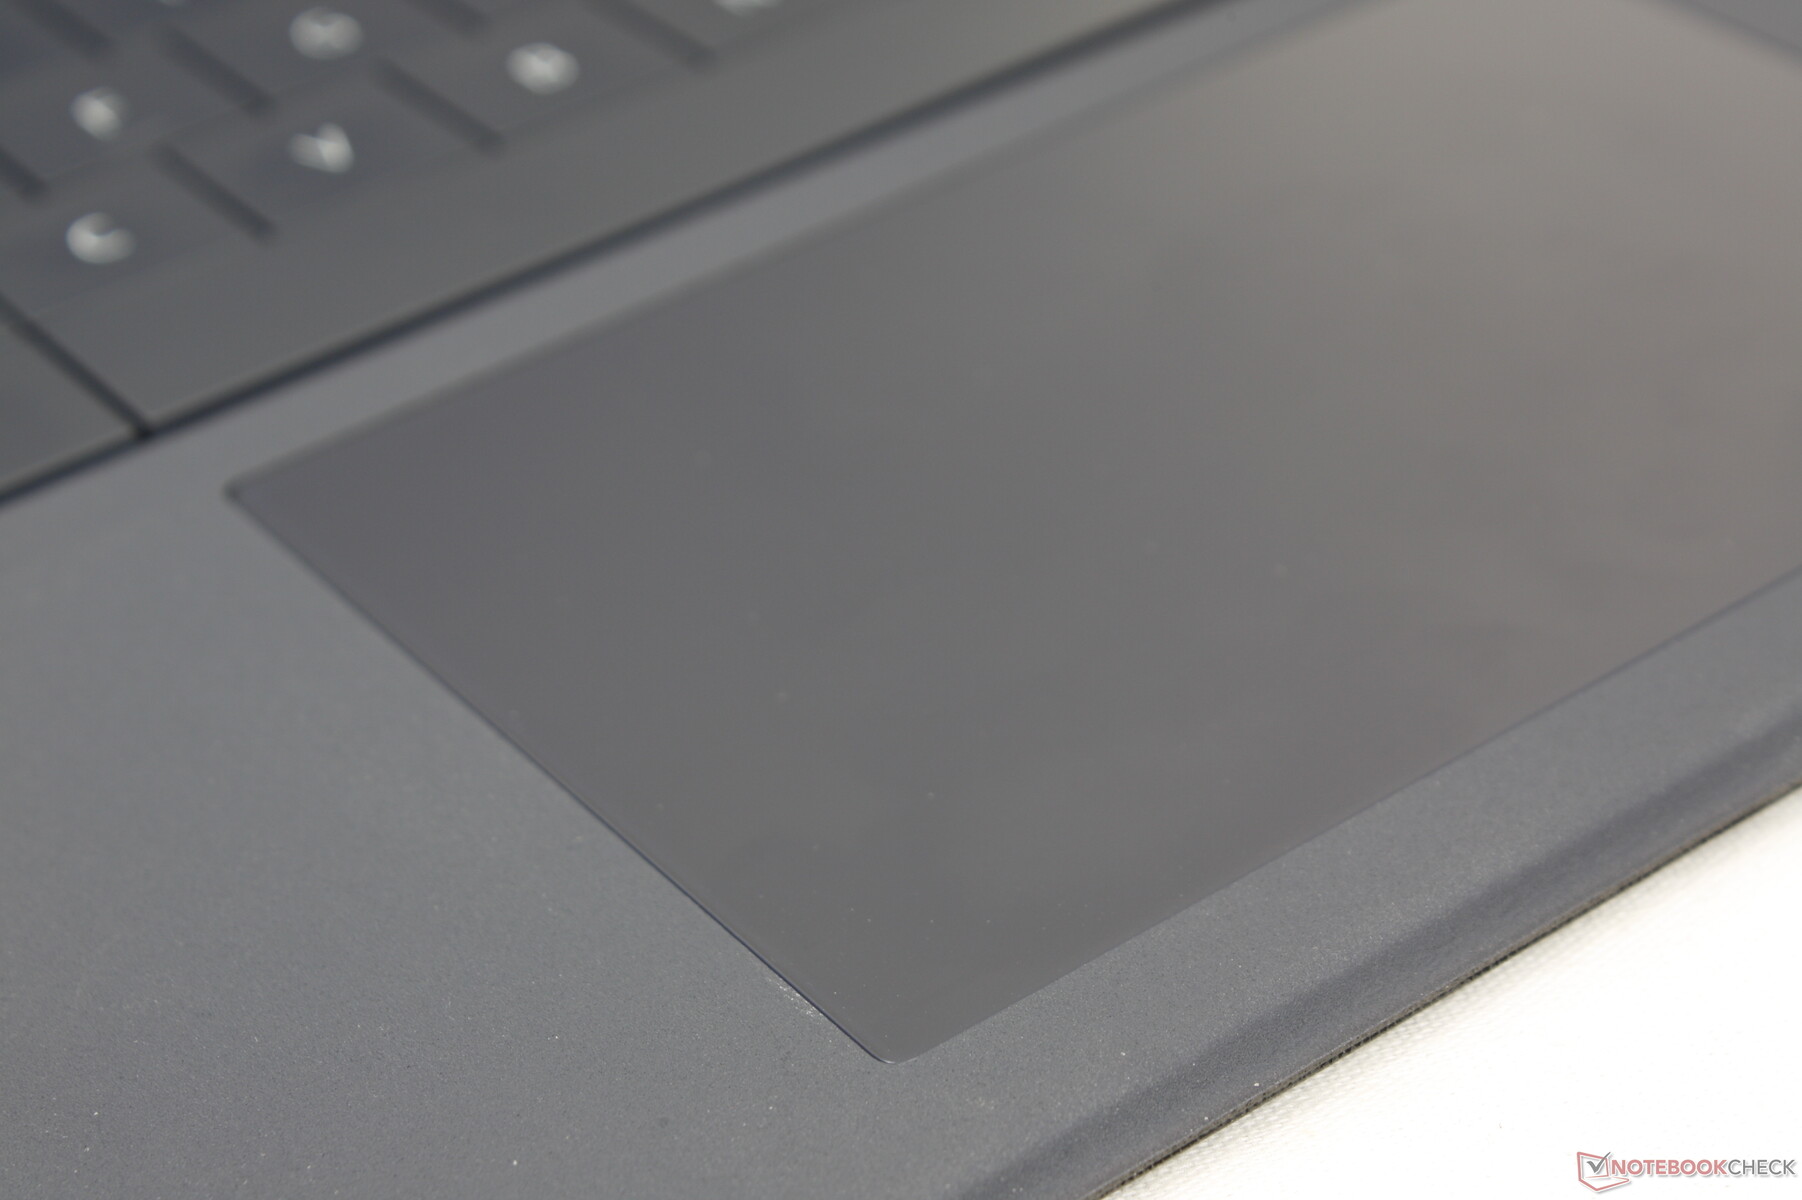
点击板的尺寸要比 键盘(11.4 x 7.5 vs. 10.2 x 5.3 cm),更容易滚动和执行多点触摸输入。它的表面完全光滑,即使以淋浴速度滑行也很少粘连。然而,点击时的反馈比大多数笔记本电脑上的要浅得多,所以它在使用时并不像更传统的点击板那样令人满意。 XPS 13 9315 蛤壳.
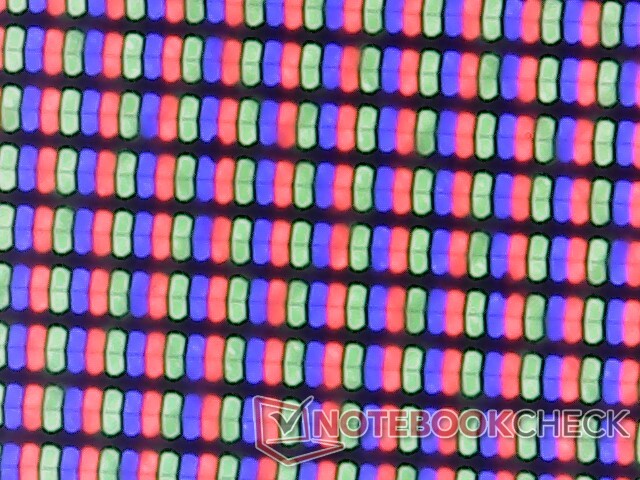
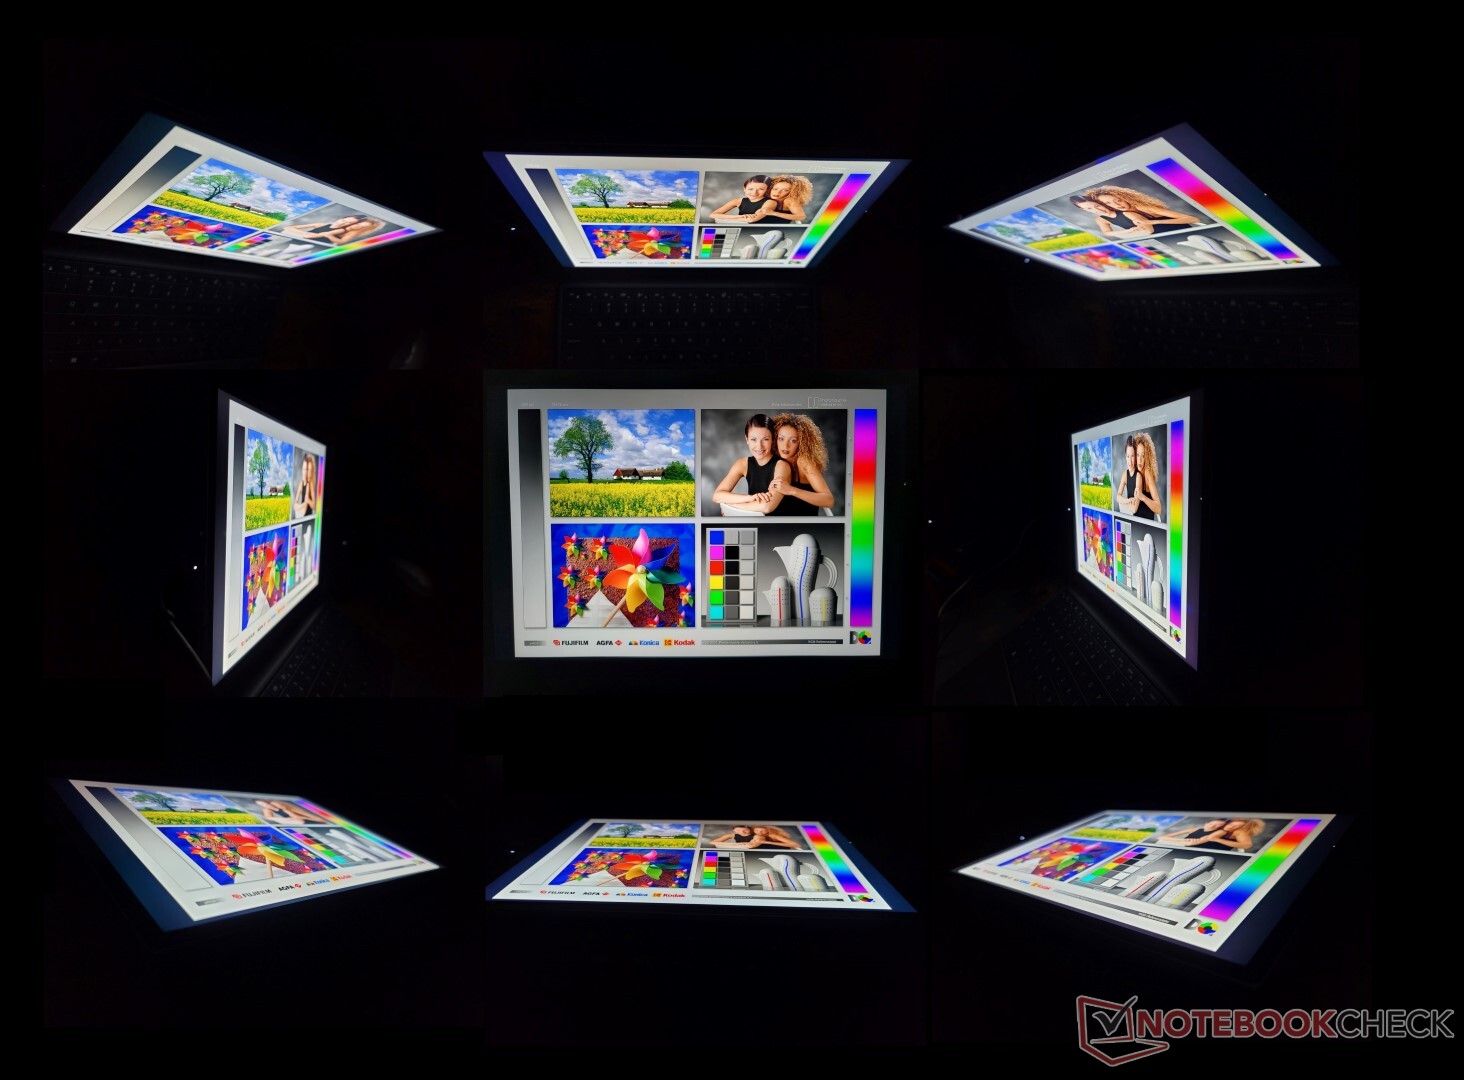
显示 - 仅限60赫兹
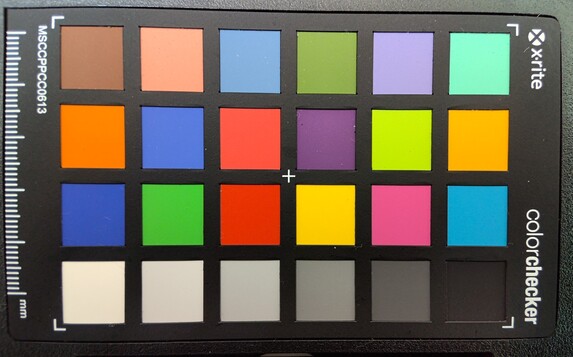
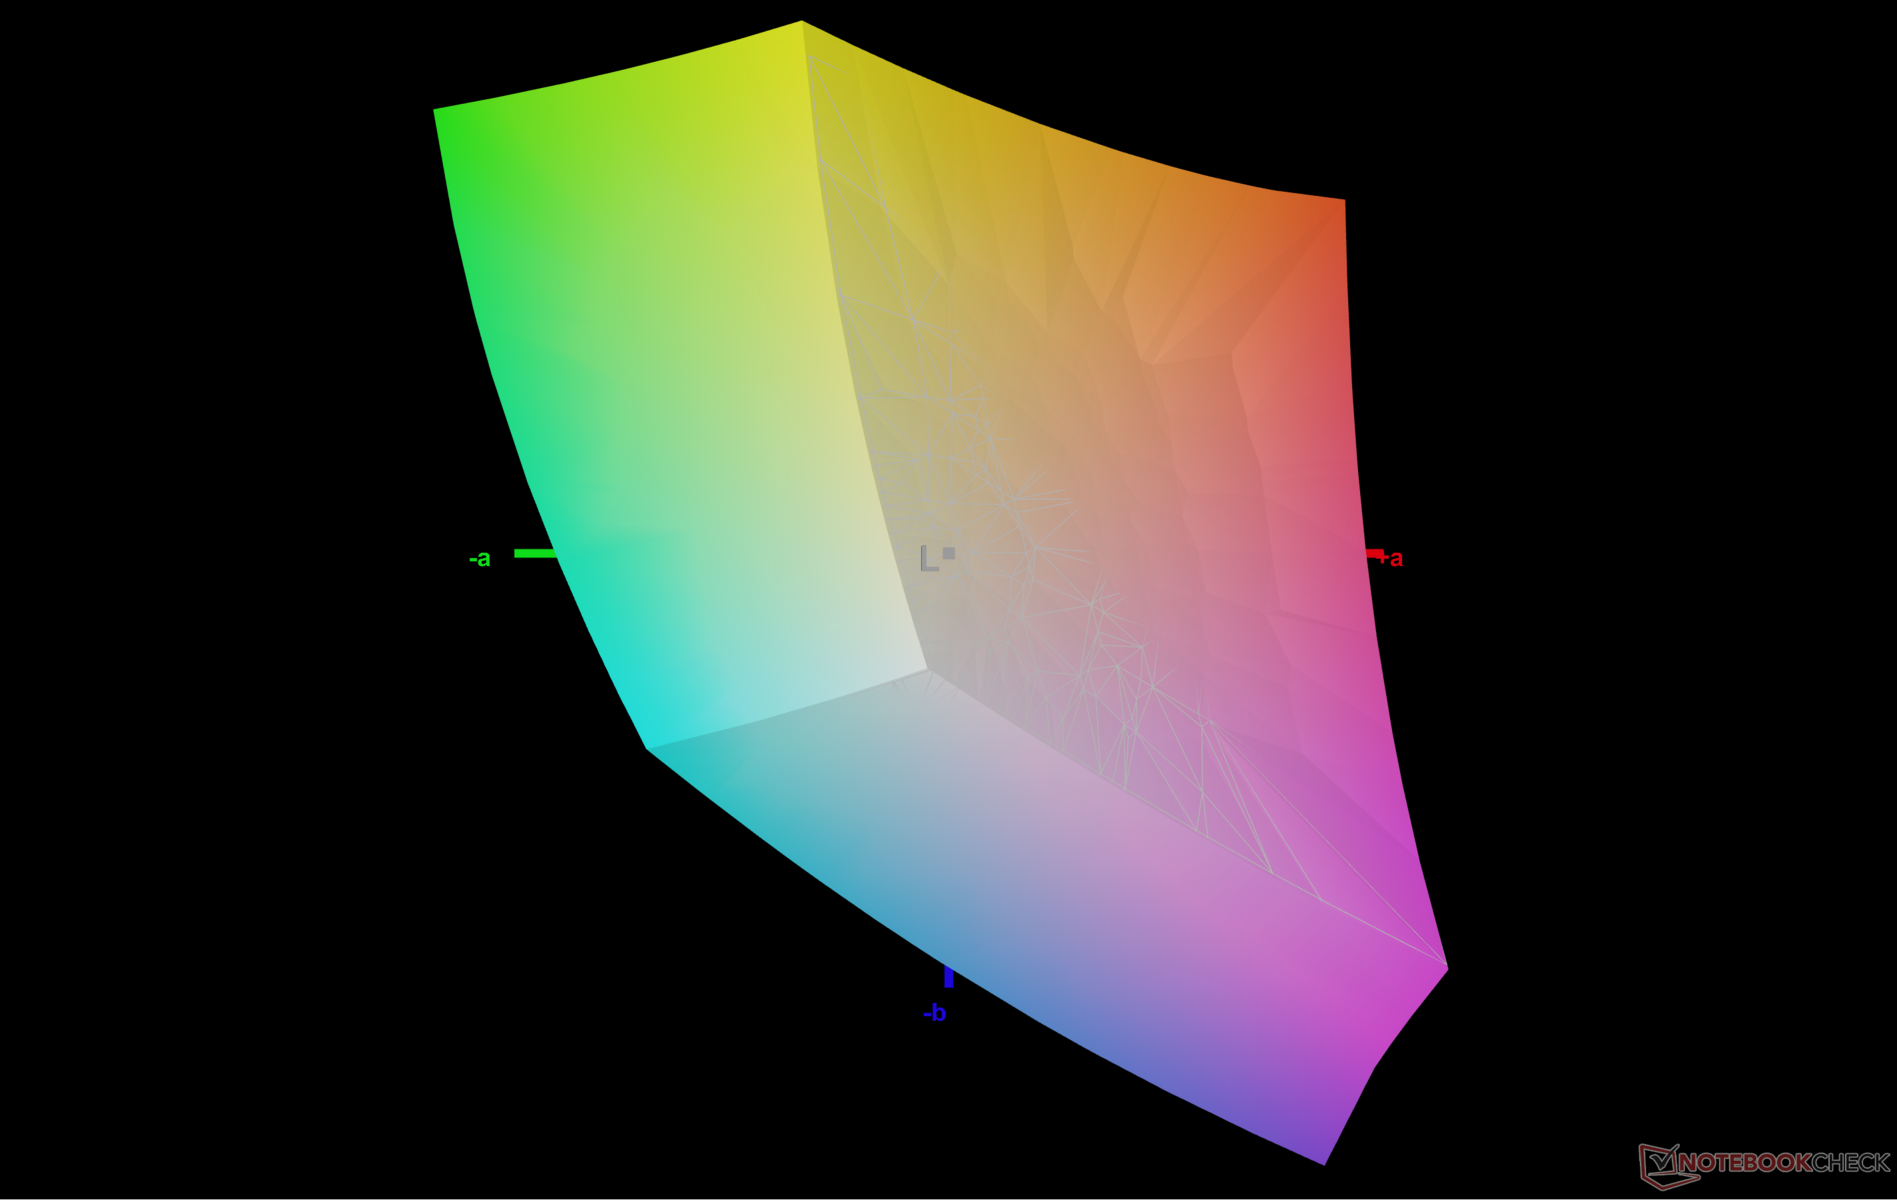
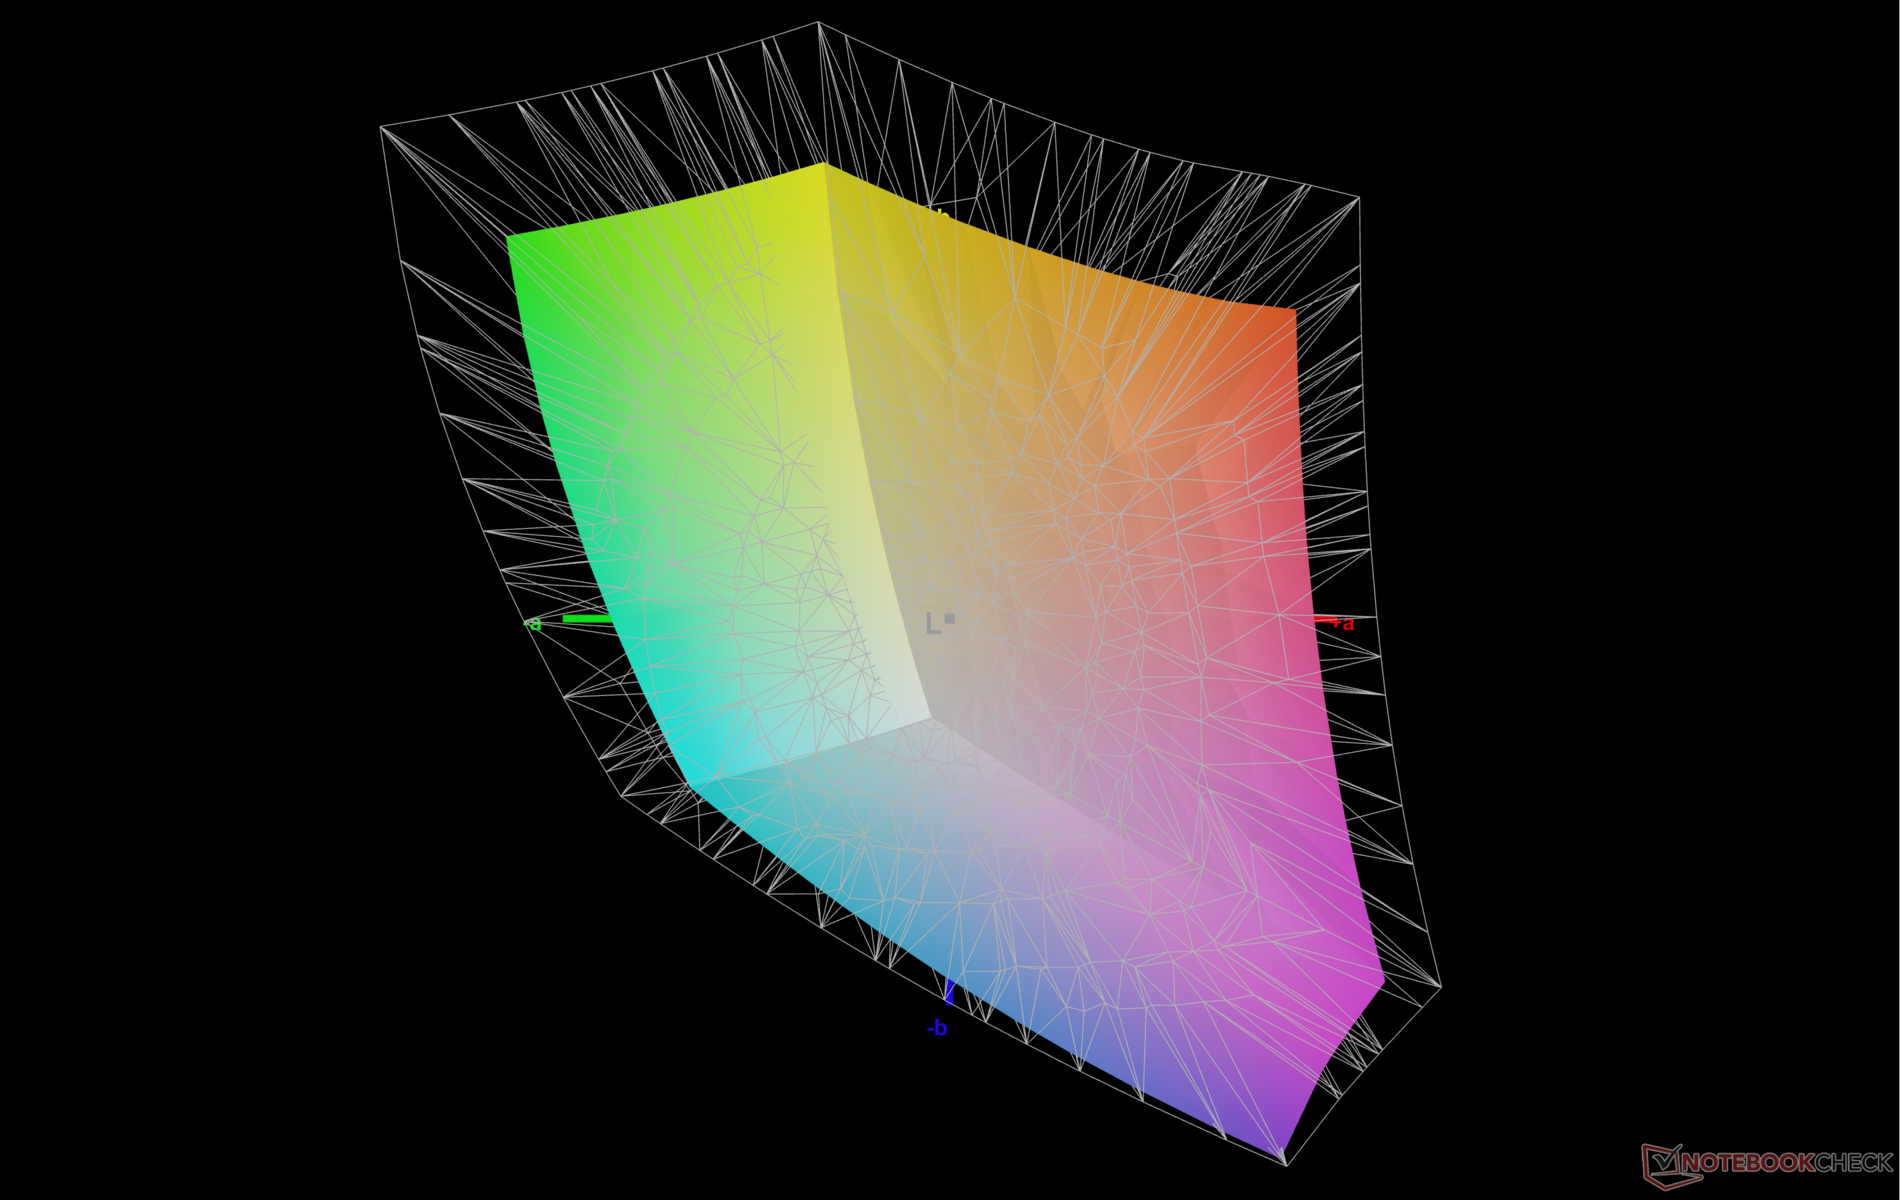
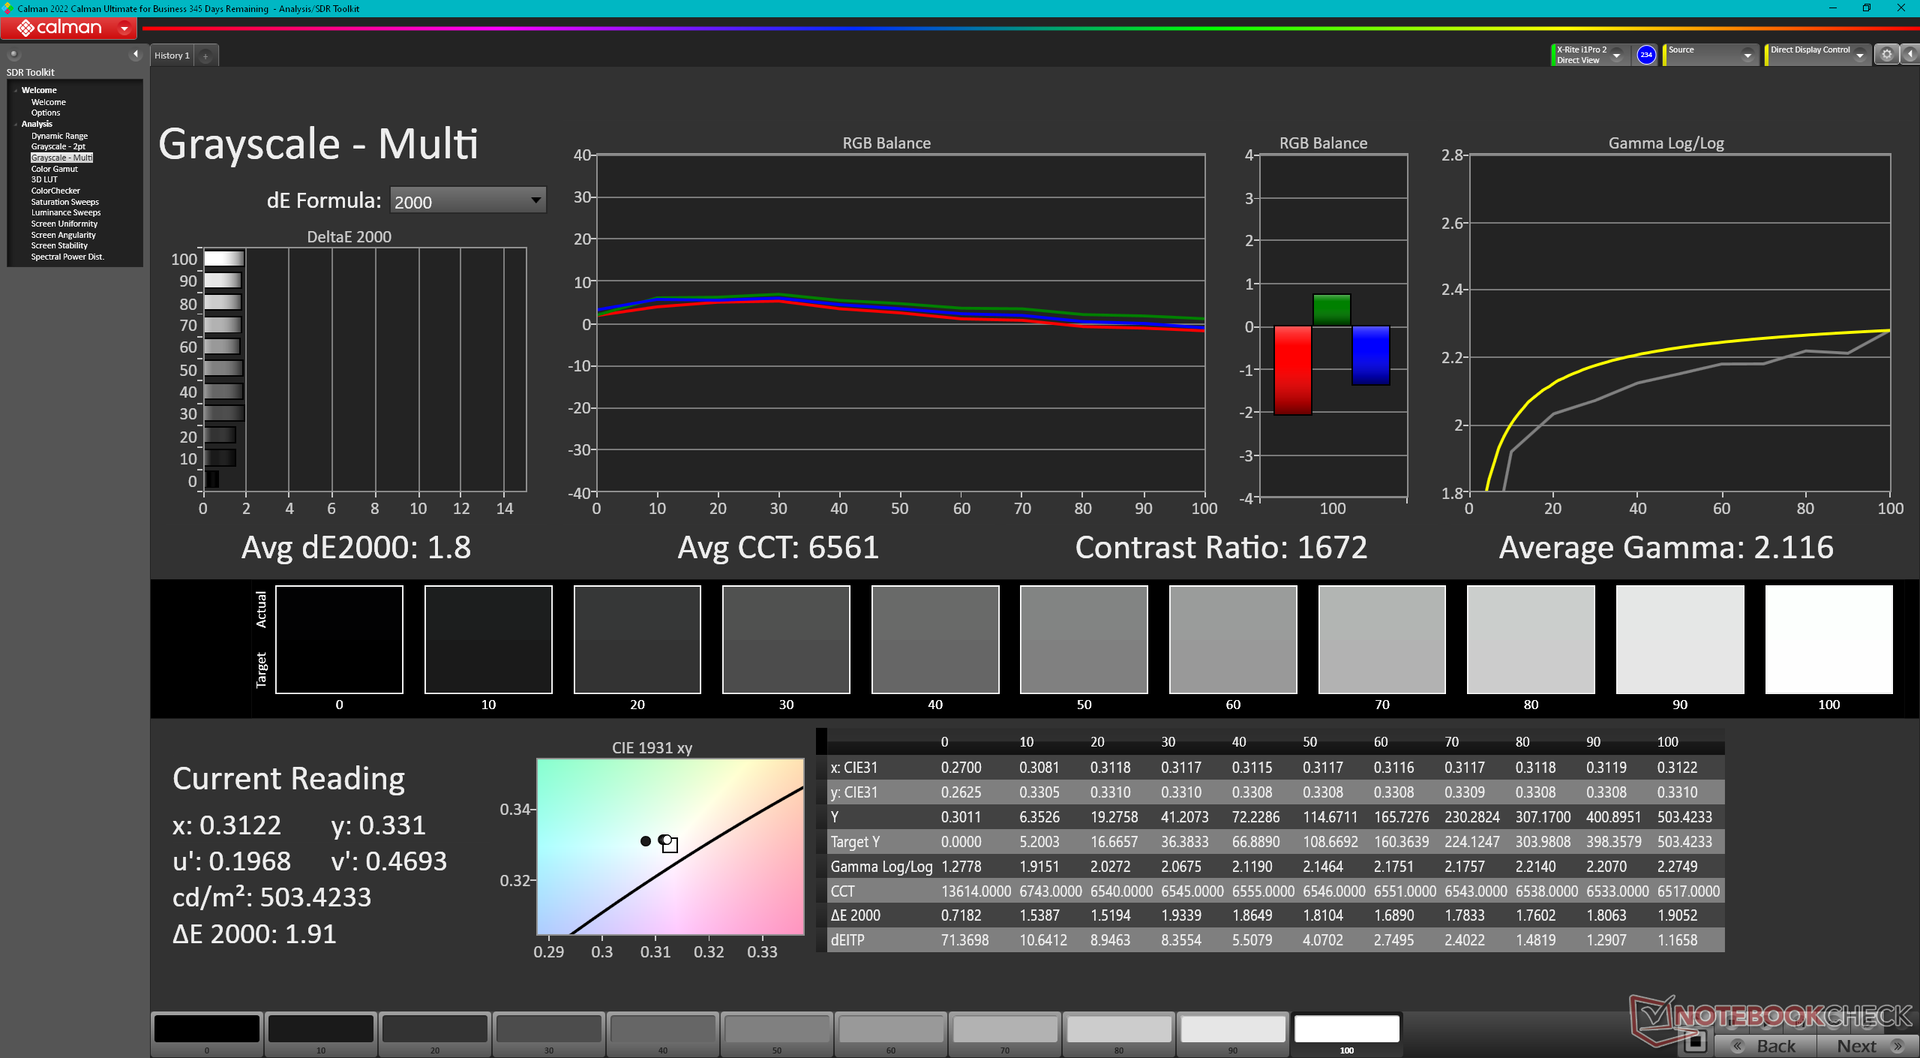
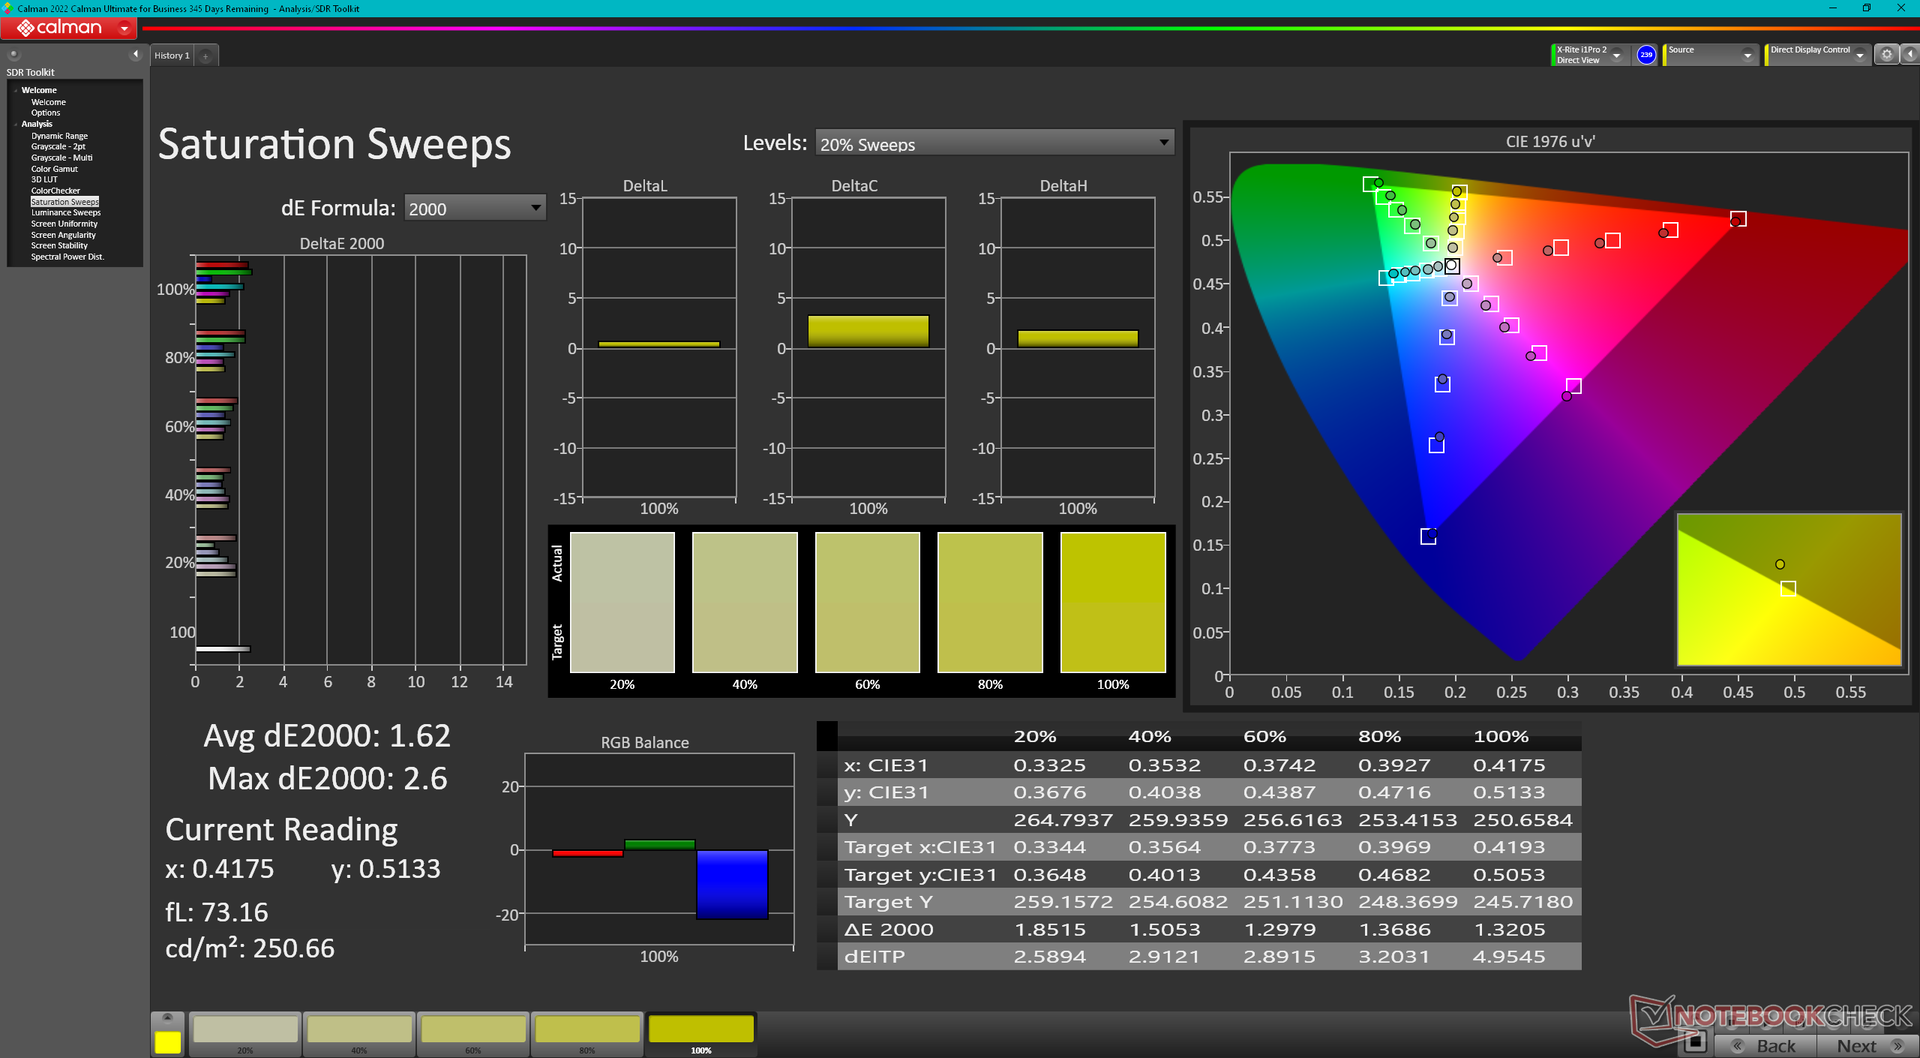
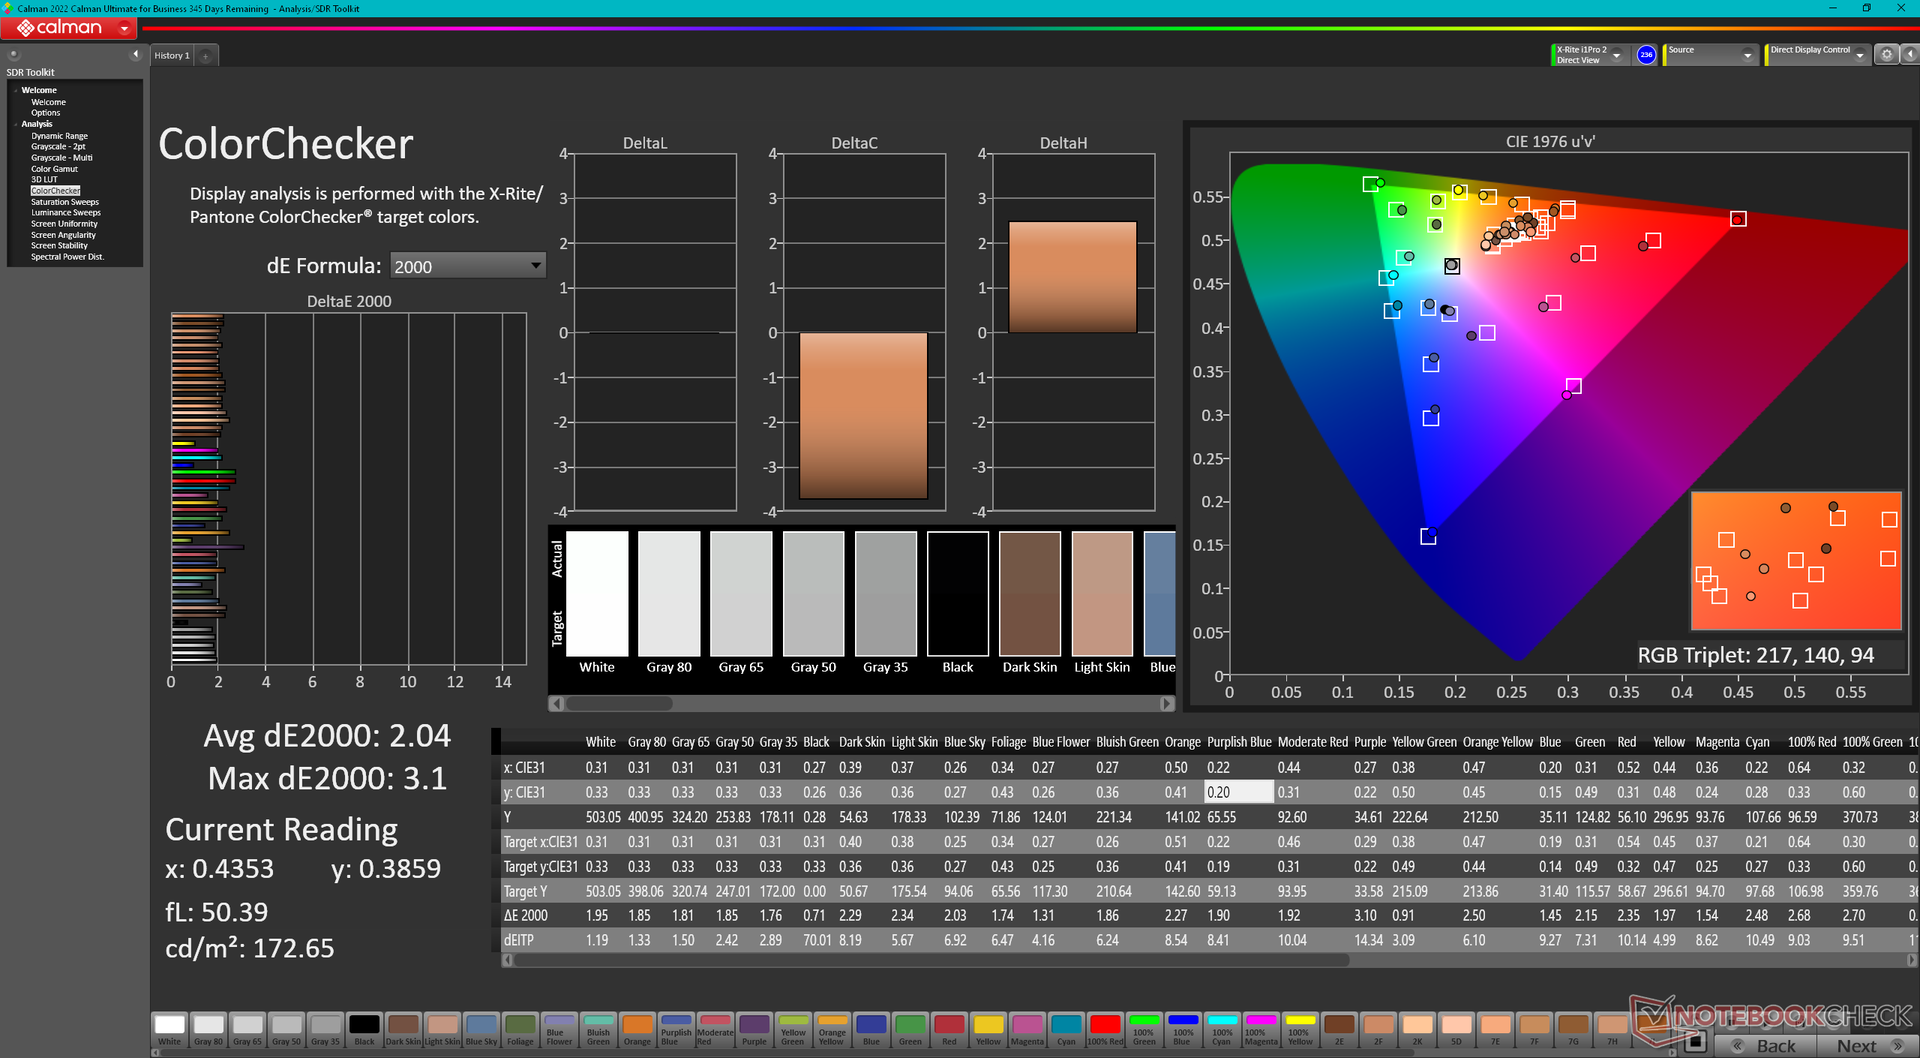
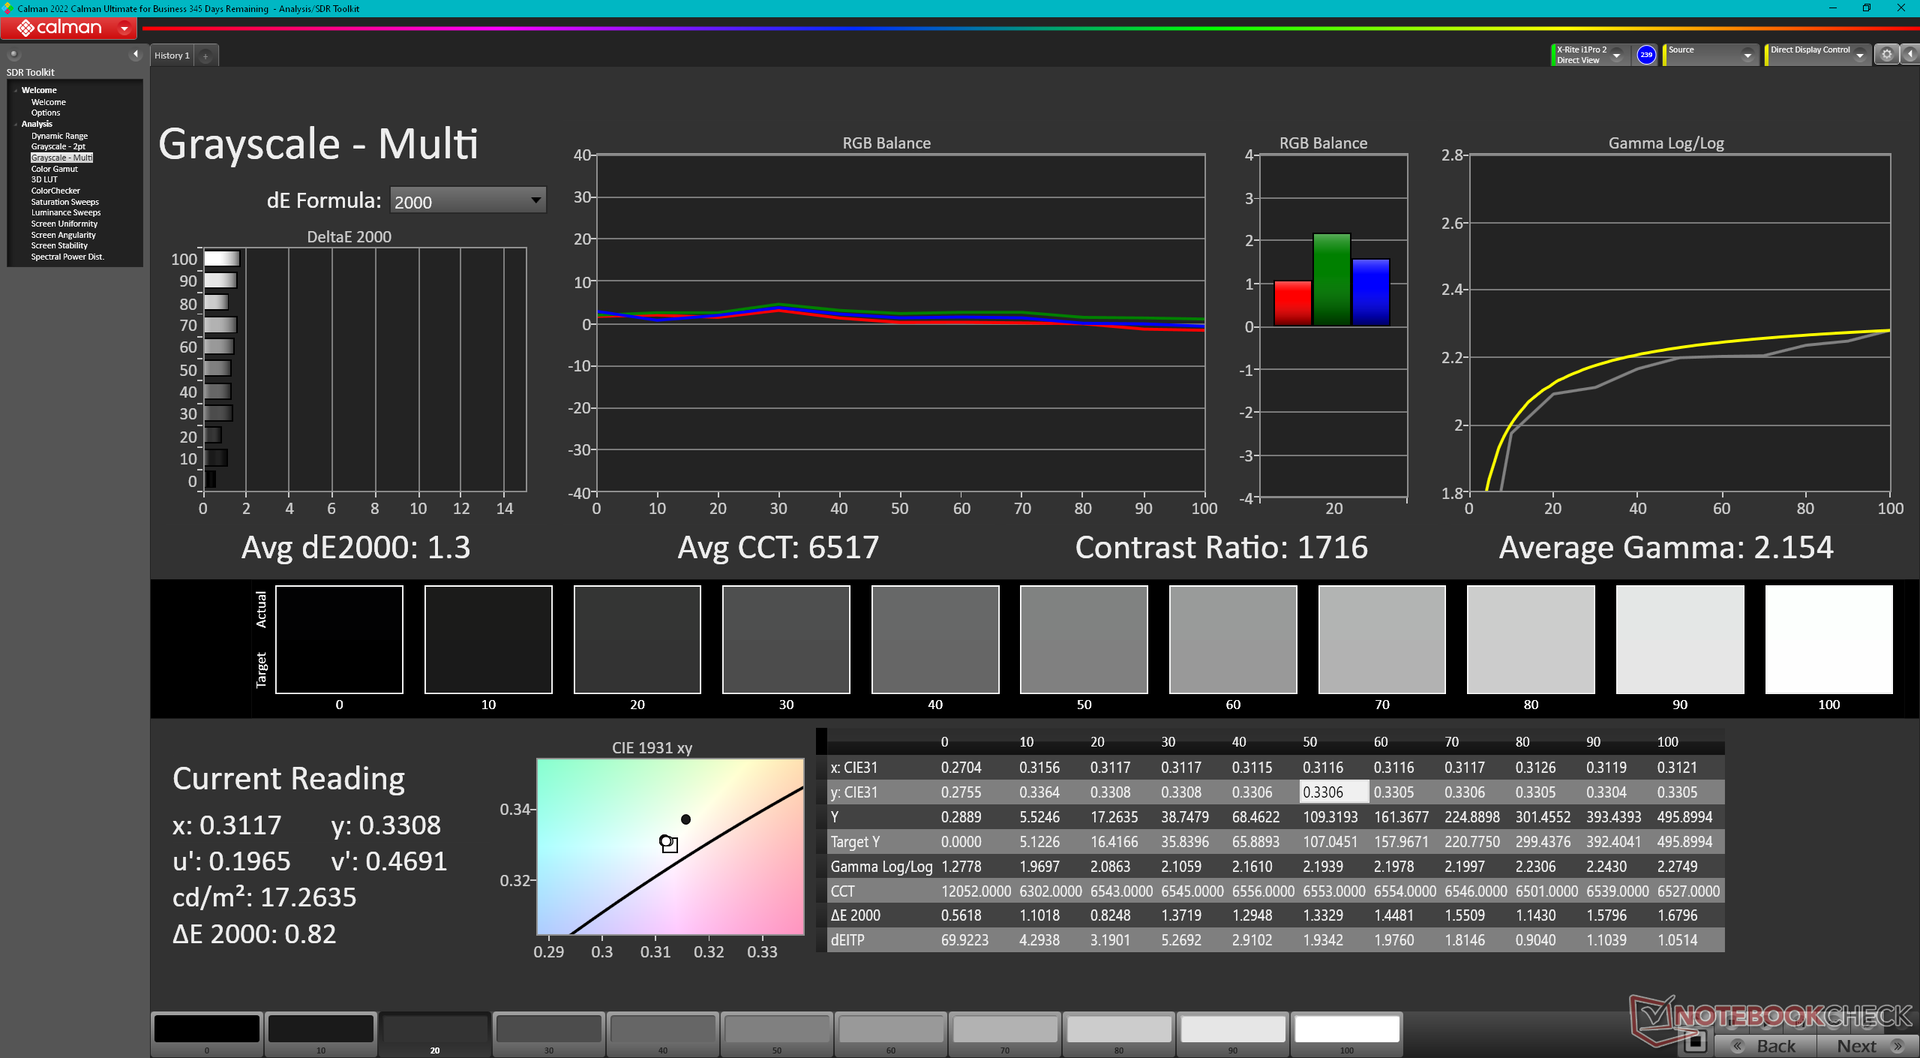
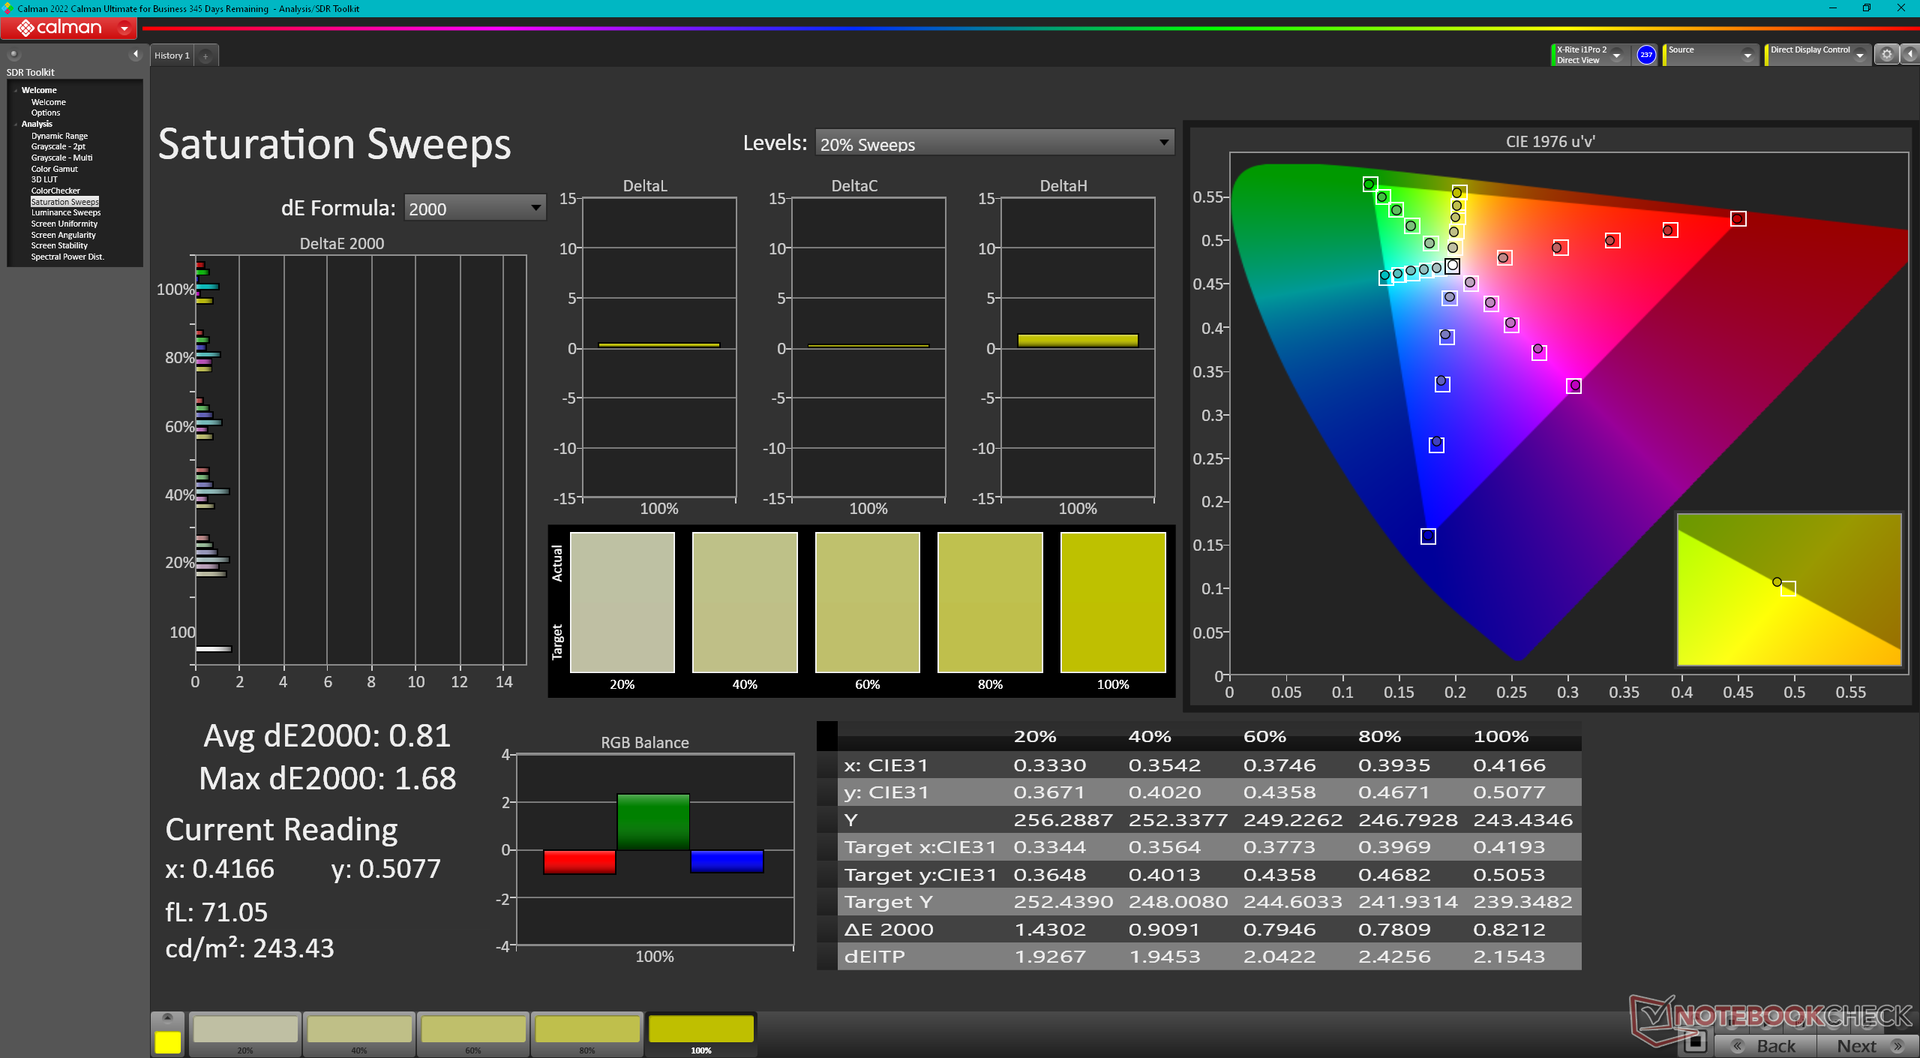
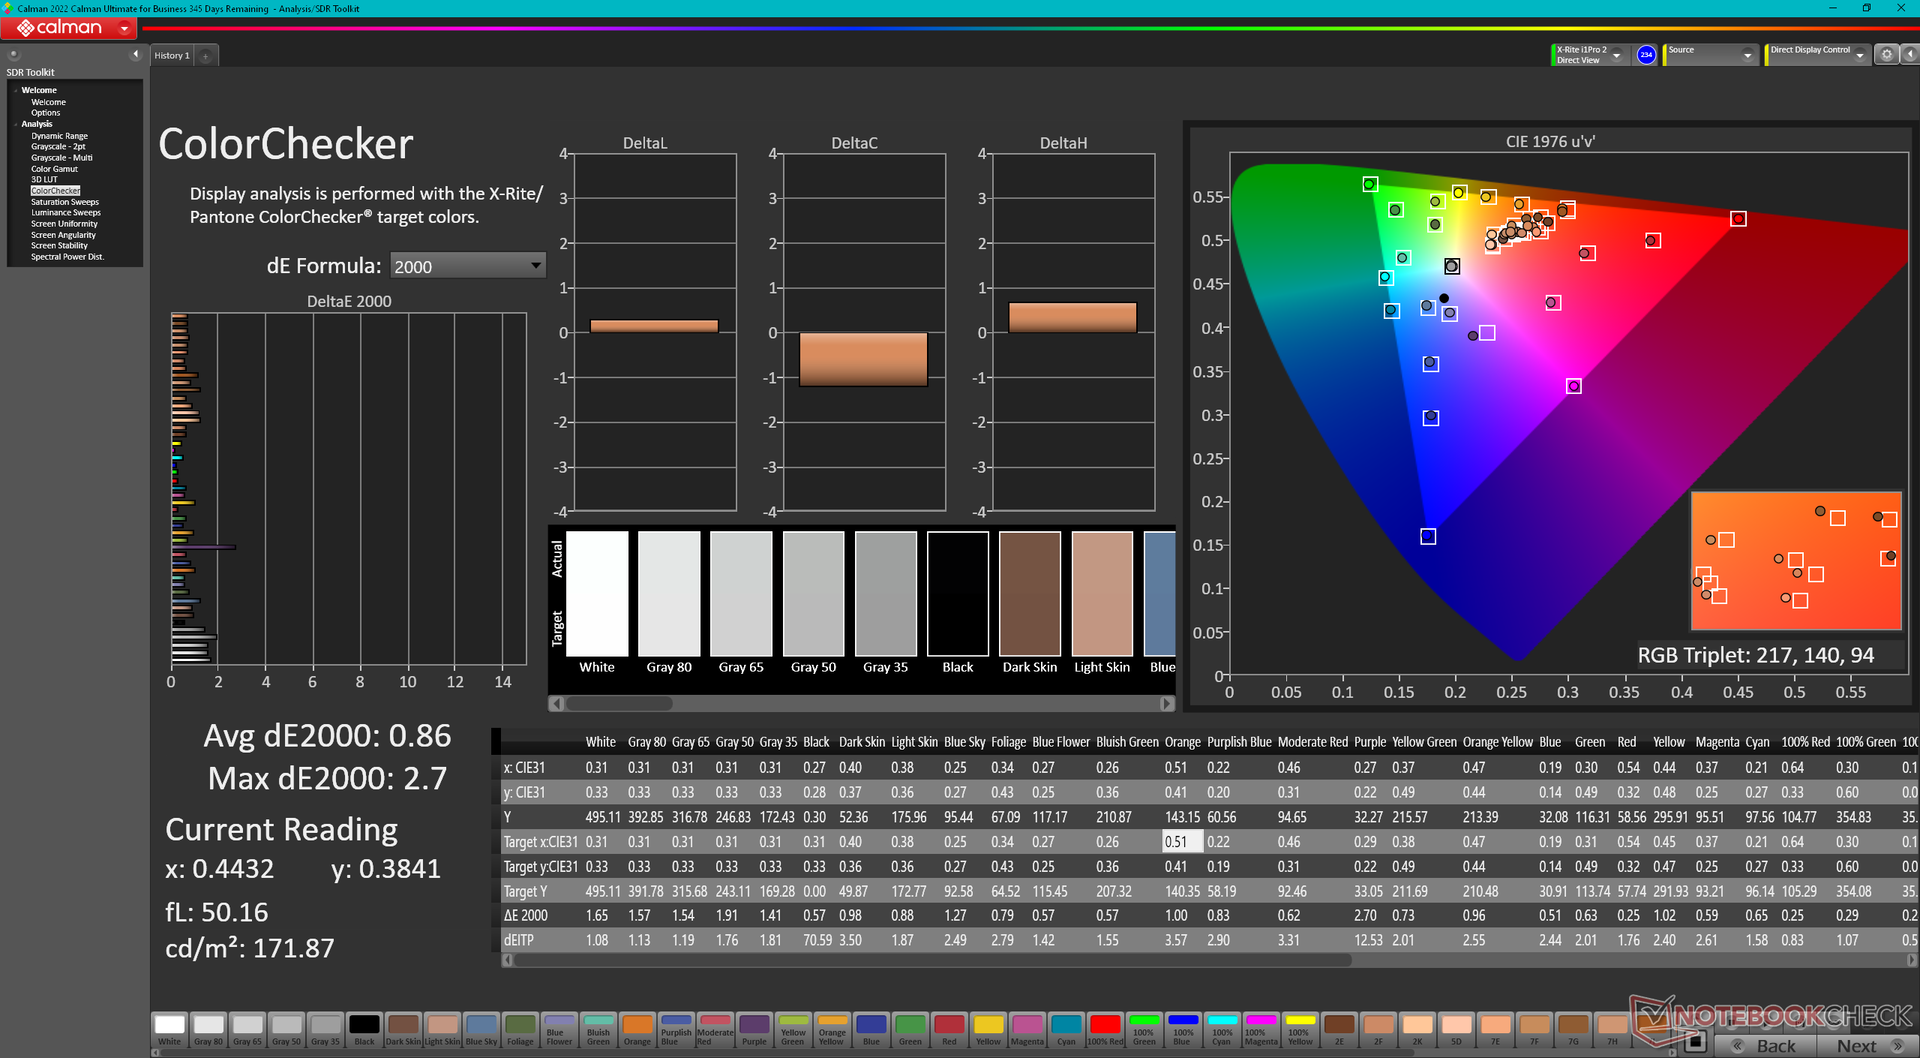
戴尔宣传的500尼特显示屏具有全sRGB覆盖率,我们可以通过自己的独立测量来确认。对比度对于IPS面板来说也非常好,大约为1500:1,而且在较低的亮度水平上没有PWM,与微软的同类产品不同。至少在第一眼看到时,视觉体验是适合高端Windows平板电脑的。
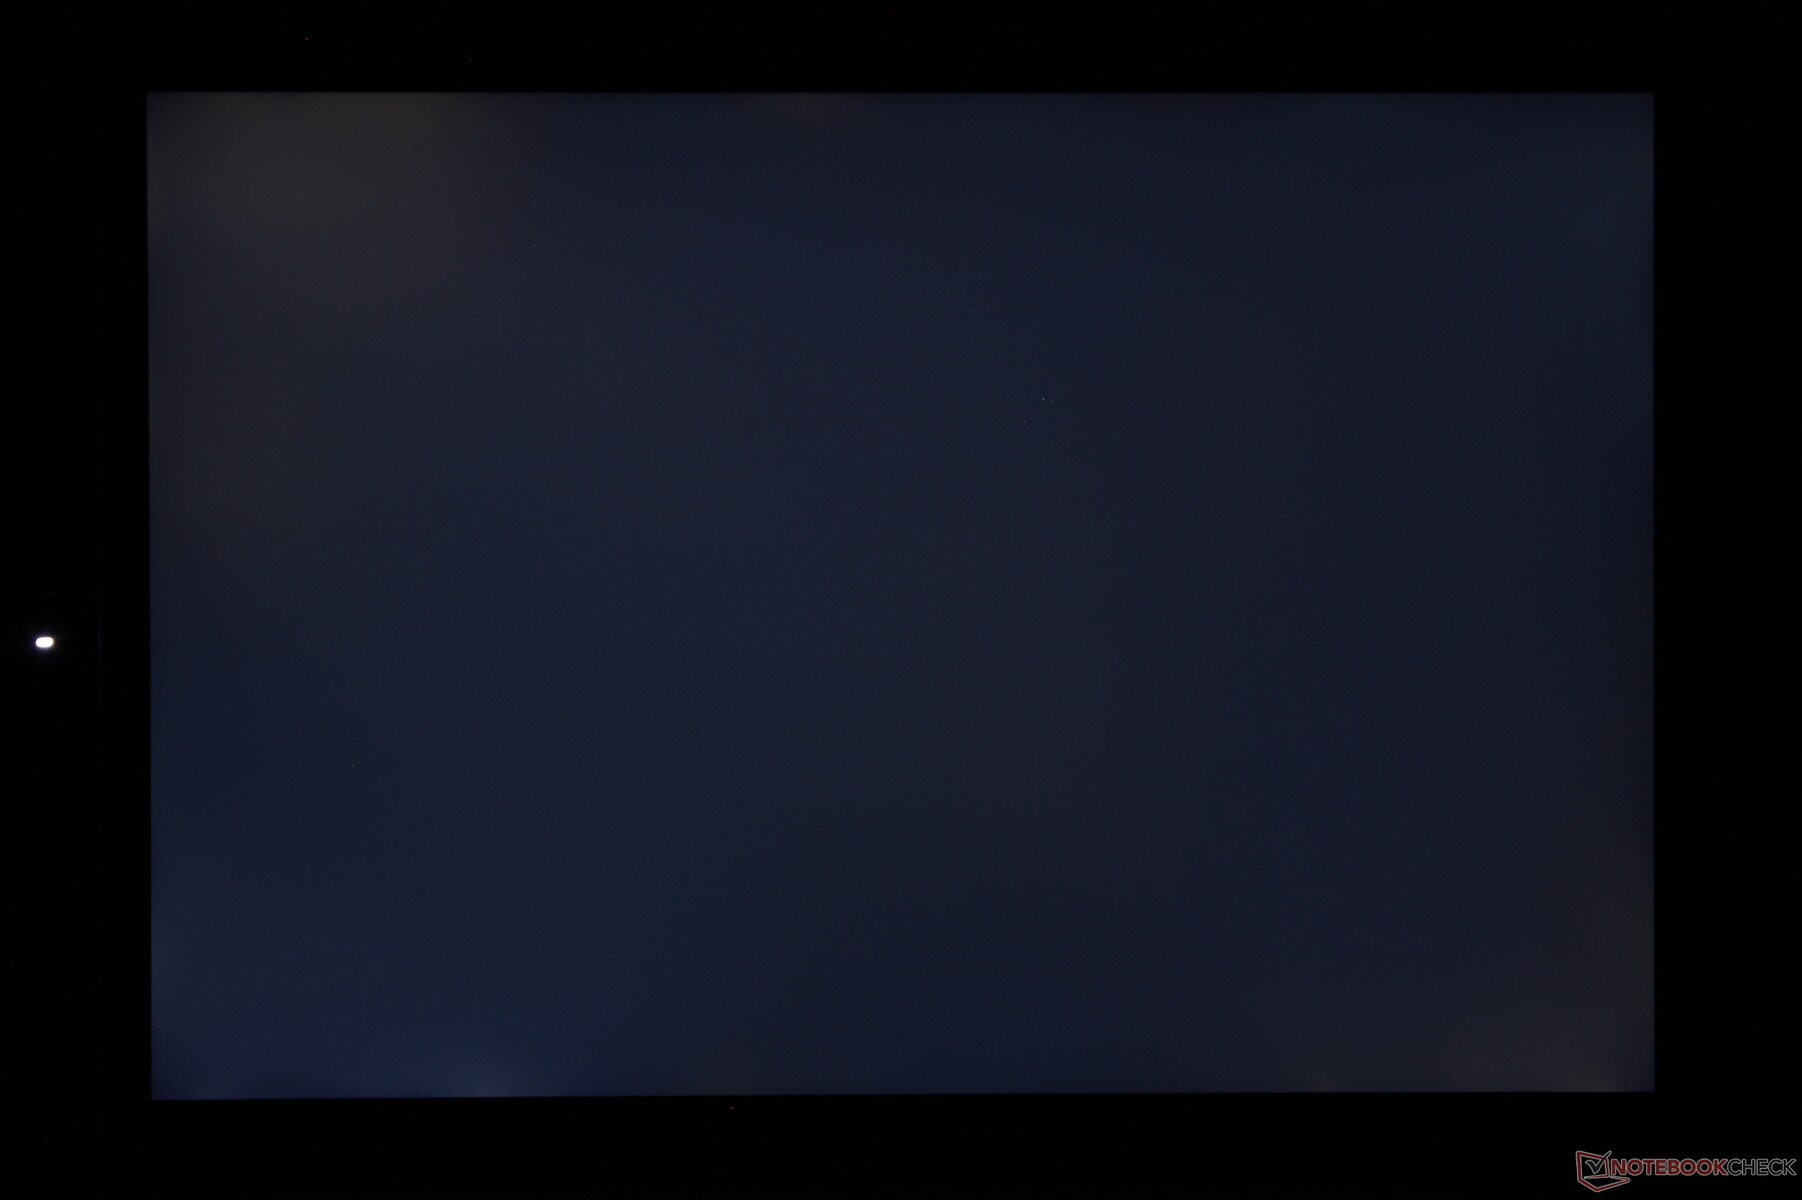
有两个明显的缺点值得一提。首先,在移动光标或滚动网页时,黑白和灰白的响应时间相对较慢,有明显的重影。第二,亮度的均匀性可能会更好,因为屏幕的左上角比右下角要亮50尼特左右。这不是什么大事,但OLED选项可以很容易地解决这两个缺点。
我们希望在未来的SKU上看到更高的刷新率面板,也许还有全P3色彩。例如,Surface Pro 8有120赫兹的刷新率选项,以提高UI响应速度。同时,用户将不得不考虑像戴尔XPS 13 Plus 9320或华硕VivoBook这样的蛤壳型笔记本电脑。 华硕VivoBook来寻找OLED功能。
| |||||||||||||||||||||||||
Brightness Distribution: 87 %
Center on Battery: 507 cd/m²
Contrast: 1491:1 (Black: 0.34 cd/m²)
ΔE Color 2.04 | 0.5-29.43 Ø5, calibrated: 0.86
ΔE Greyscale 1.8 | 0.57-98 Ø5.3
72.6% AdobeRGB 1998 (Argyll 2.2.0 3D)
99.8% sRGB (Argyll 2.2.0 3D)
70.7% Display P3 (Argyll 2.2.0 3D)
Gamma: 2.12
| Dell XPS 13 9315 2-in-1 Core i5-1230U BOE NE13A1M, IPS, 2880x1920, 13.00 | Dell XPS 13 Plus 9320 i7-1280P OLED Samsung 134XK04, OLED, 3456x2160, 13.40 | Microsoft Surface Pro 8, i7-1185G7 LP129WT212166, IPS, 2880x1920, 13.00 | HP Spectre x360 13.5 14t-ef000 SDC4160, OLED, 3000x2000, 13.50 | Lenovo ThinkBook Plus Gen2 Core i5 CSOT T3 MND307DA1-5 (LCD), IPS, E-Ink, 2560x1600, 13.30 | Apple MacBook Air M2 Entry IPS, 2560x1664, 13.60 | |
|---|---|---|---|---|---|---|
| Display | 26% | 6% | 22% | -1% | 20% | |
| Display P3 Coverage | 70.7 | 99.5 41% | 78.2 11% | 99.9 41% | 70.1 -1% | 98.4 39% |
| sRGB Coverage | 99.8 | 100 0% | 100 0% | 100 0% | 98 -2% | 99.9 0% |
| AdobeRGB 1998 Coverage | 72.6 | 98.4 36% | 77.6 7% | 90.8 25% | 72.2 -1% | 87.6 21% |
| Response Times | 93% | 1% | 94% | -5% | 13% | |
| Response Time Grey 50% / Grey 80% * | 44 ? | 2.6 ? 94% | 46.4 ? -5% | 1.9 ? 96% | 42.8 ? 3% | 32.9 ? 25% |
| Response Time Black / White * | 24.8 ? | 2.1 ? 92% | 23.2 ? 6% | 2.16 ? 91% | 28 ? -13% | 24.9 ? -0% |
| PWM Frequency | 59.5 | 29760 ? | 60.2 ? | |||
| Screen | -27% | -19% | -29% | -36% | 5% | |
| Brightness middle | 507 | 371.8 -27% | 444 -12% | 351.7 -31% | 404 -20% | 526 4% |
| Brightness | 486 | 374 -23% | 451 -7% | 351 -28% | 388 -20% | 486 0% |
| Brightness Distribution | 87 | 98 13% | 91 5% | 87 0% | 94 8% | 87 0% |
| Black Level * | 0.34 | 0.43 -26% | 0.24 29% | 0.38 -12% | ||
| Contrast | 1491 | 1033 -31% | 1683 13% | 1384 -7% | ||
| Colorchecker dE 2000 * | 2.04 | 2.37 -16% | 2 2% | 1.78 13% | 3.1 -52% | 1.3 36% |
| Colorchecker dE 2000 max. * | 3.1 | 6.1 -97% | 3.2 -3% | 6.14 -98% | 6.9 -123% | 2.7 13% |
| Colorchecker dE 2000 calibrated * | 0.86 | 1.7 -98% | 1.3 -51% | 0.7 19% | ||
| Greyscale dE 2000 * | 1.8 | 2 -11% | 1.8 -0% | 2.3 -28% | 3.7 -106% | 2 -11% |
| Gamma | 2.12 104% | 2.29 96% | 2.11 104% | 2.11 104% | 2.26 97% | 2.25 98% |
| CCT | 6561 99% | 6261 104% | 6417 101% | 6683 97% | 5936 110% | 6858 95% |
| Total Average (Program / Settings) | 31% /
9% | -4% /
-11% | 29% /
7% | -14% /
-24% | 13% /
9% |
* ... smaller is better
这款显示器在开箱后已经得到了很好的校准,灰度和色彩的平均DeltaE值分别只有1.8和2.04。用X-Rite色度计对显示器进行进一步的校准,可以将平均值提高到1.3和0.86,但对大多数人来说,最终用户校准是不必要的。
Display Response Times
| ↔ Response Time Black to White | ||
|---|---|---|
| 24.8 ms ... rise ↗ and fall ↘ combined | ↗ 11.6 ms rise | 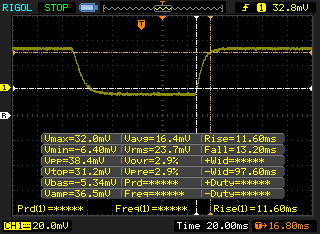 |
| ↘ 13.2 ms fall | ||
| The screen shows good response rates in our tests, but may be too slow for competitive gamers. In comparison, all tested devices range from 0.1 (minimum) to 240 (maximum) ms. » 52 % of all devices are better. This means that the measured response time is worse than the average of all tested devices (21.5 ms). | ||
| ↔ Response Time 50% Grey to 80% Grey | ||
| 44 ms ... rise ↗ and fall ↘ combined | ↗ 23.6 ms rise | 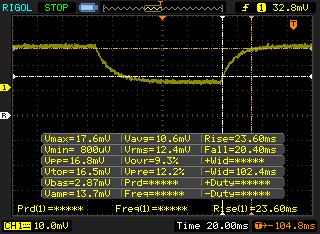 |
| ↘ 20.4 ms fall | ||
| The screen shows slow response rates in our tests and will be unsatisfactory for gamers. In comparison, all tested devices range from 0.2 (minimum) to 636 (maximum) ms. » 70 % of all devices are better. This means that the measured response time is worse than the average of all tested devices (33.7 ms). | ||
Screen Flickering / PWM (Pulse-Width Modulation)
| Screen flickering / PWM not detected | 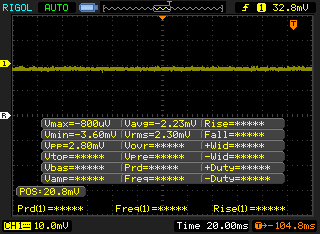 | ||
In comparison: 53 % of all tested devices do not use PWM to dim the display. If PWM was detected, an average of 17844 (minimum: 5 - maximum: 3846000) Hz was measured. | |||
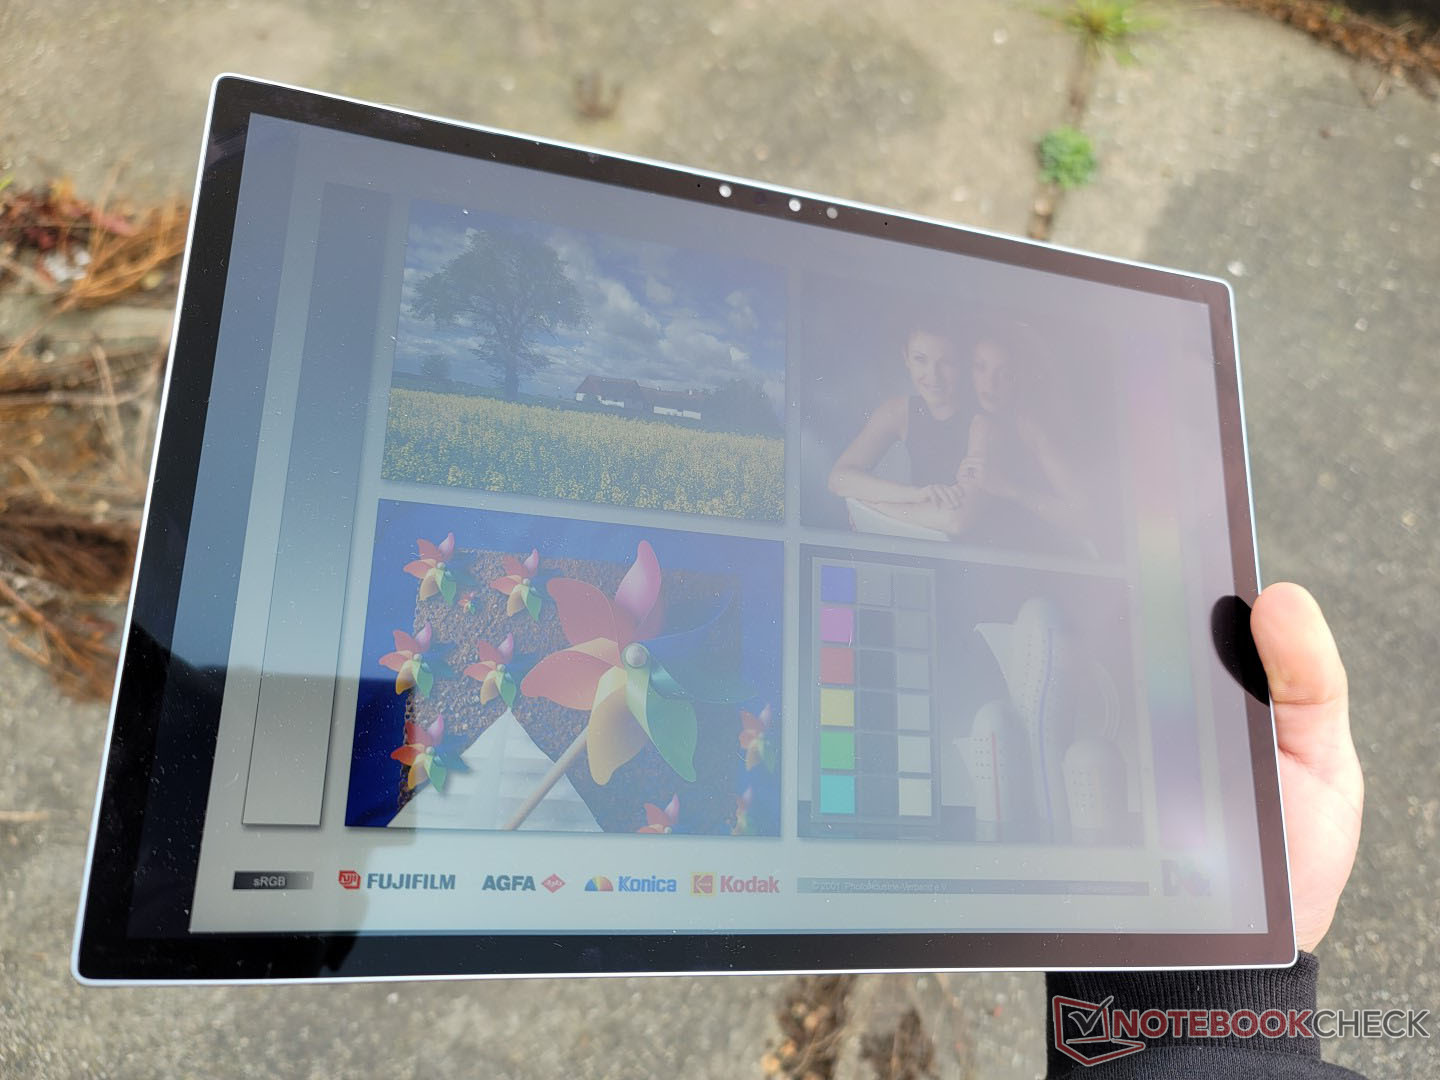
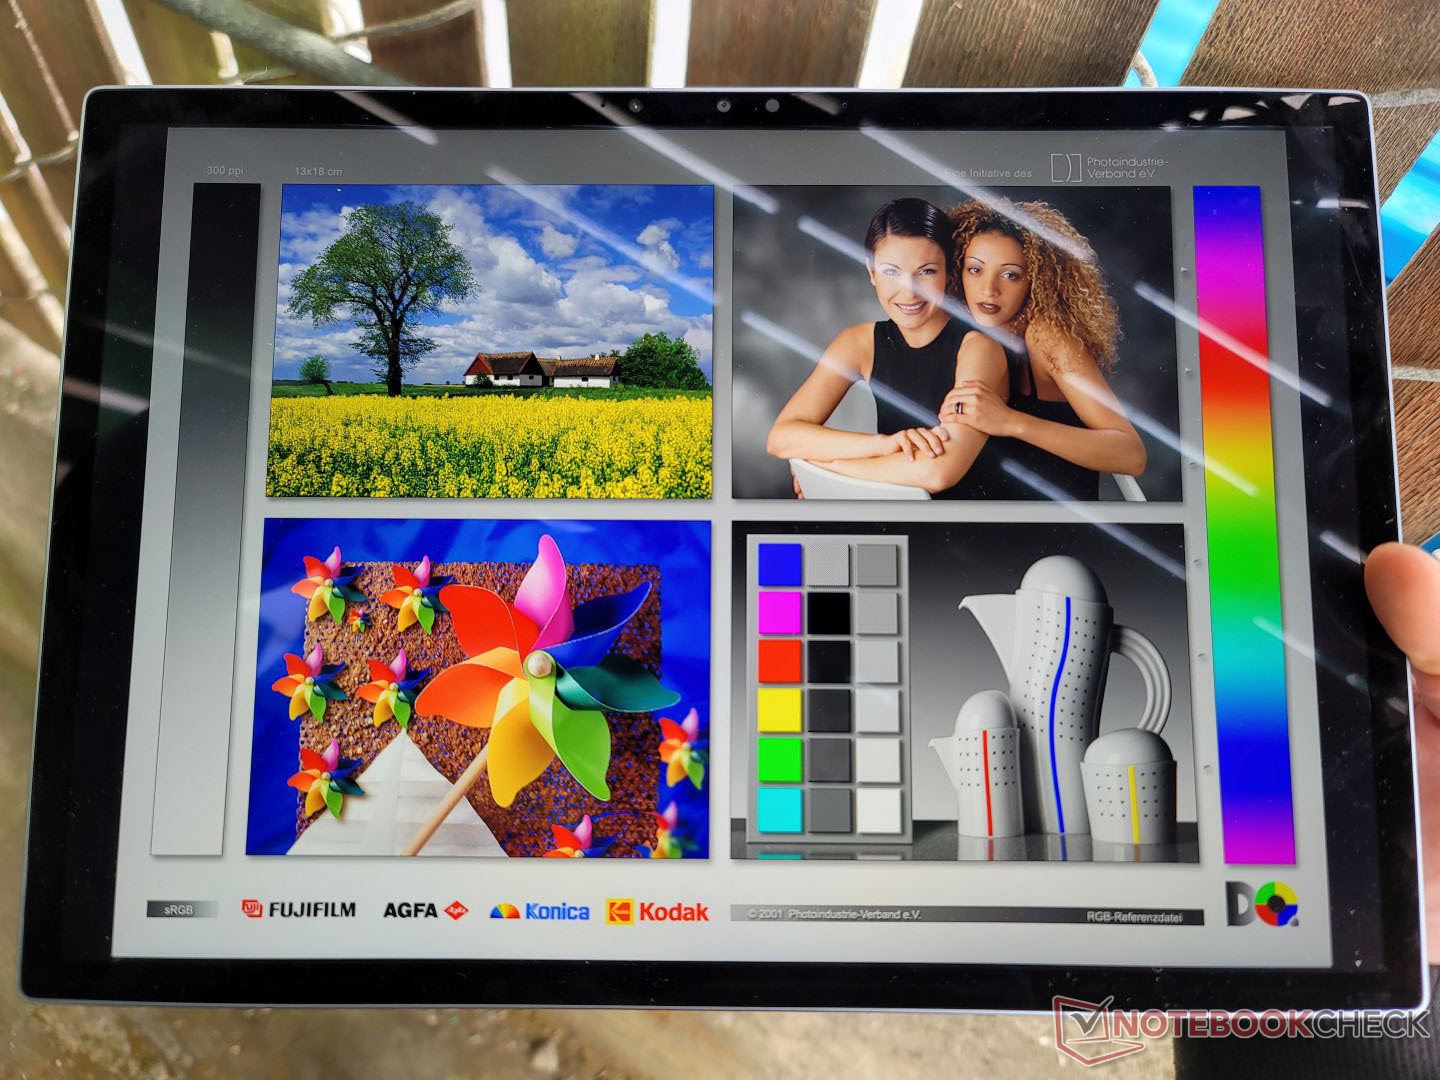
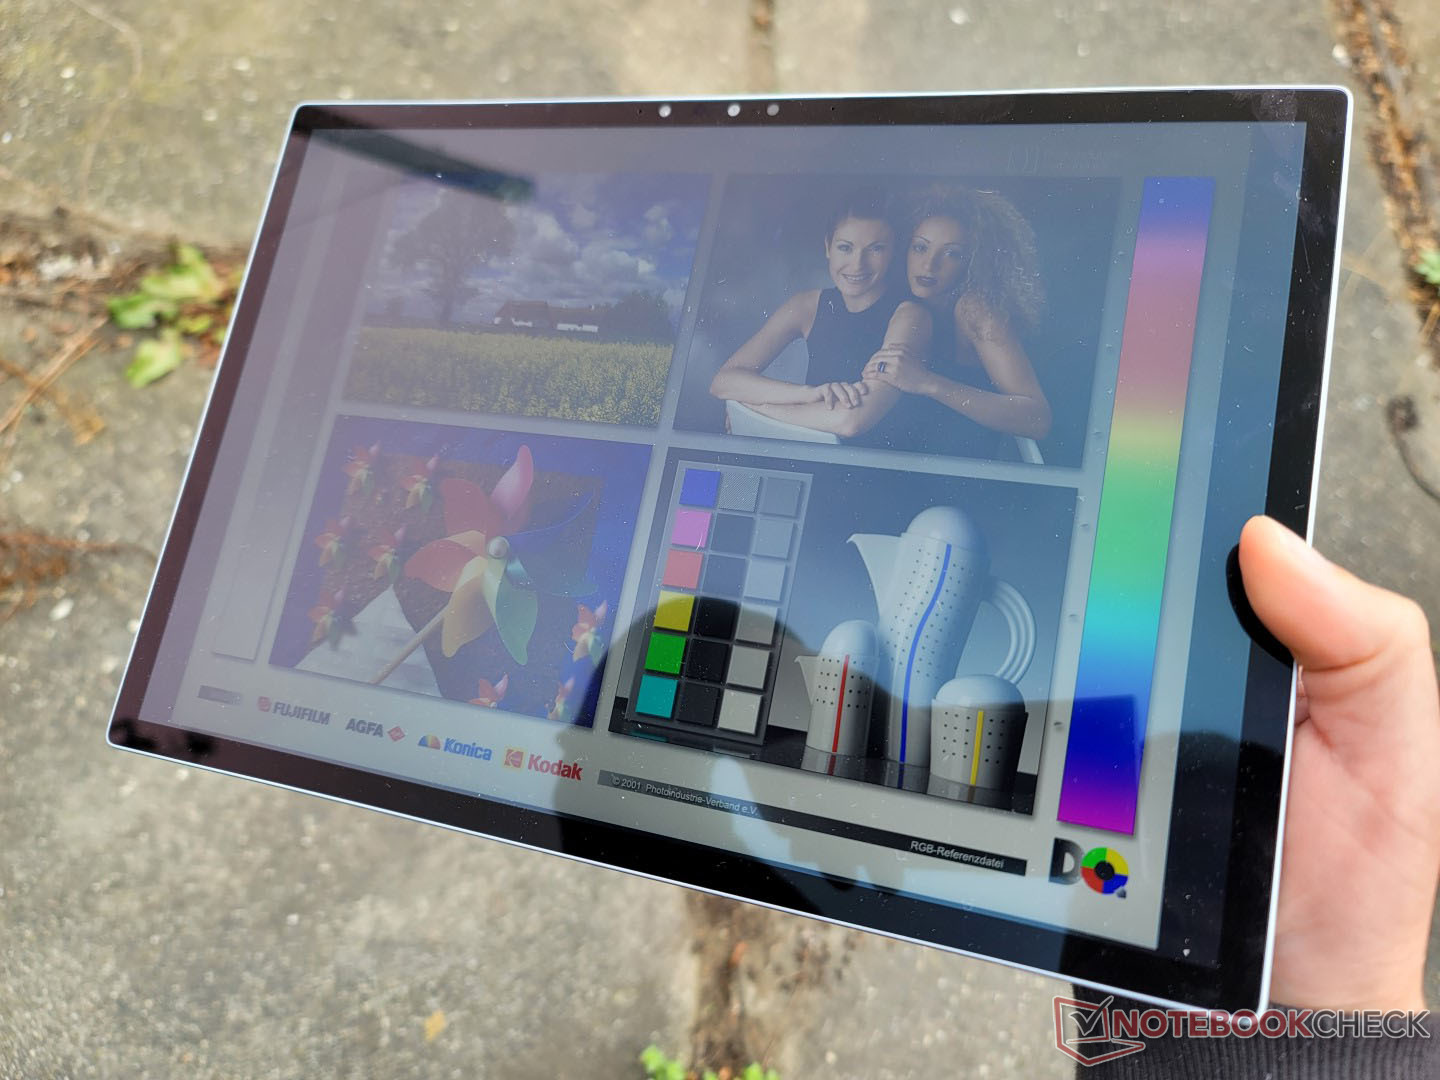
眩光是永远存在的,在光亮的触摸屏上基本上是不可避免的。幸运的是,当在户外阴凉处工作时,显示屏的亮度足以将眩光保持在最低水平。然而,如果在更明亮的条件下,颜色和观看体验迅速下降。某些惠普Elite x2型号有1000尼特显示选项,这将使它比戴尔的亮度高2倍,在户外更容易阅读。
性能 - CPU性能良好,GPU性能较差
测试条件
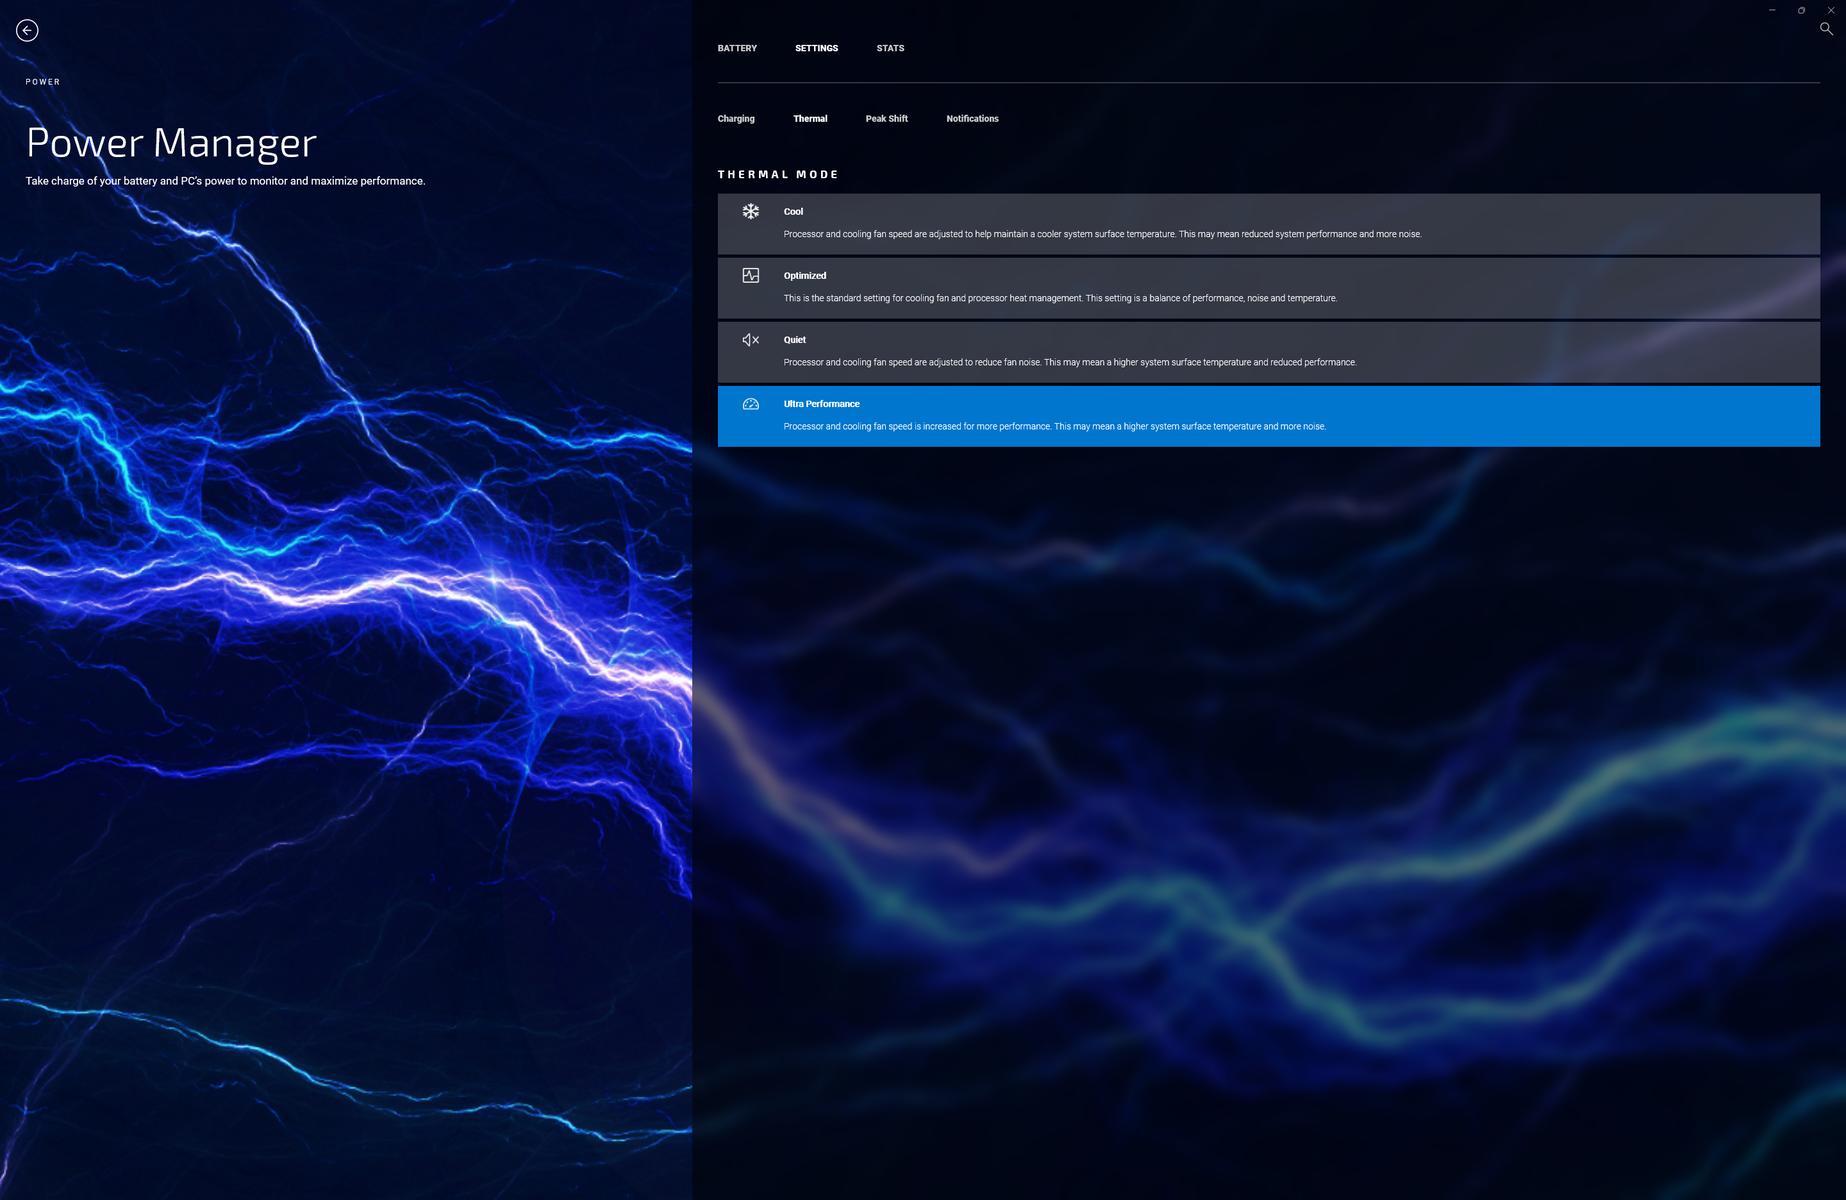
在运行以下任何基准测试之前,我们通过戴尔电源管理器和Windows分别将我们的设备设置为 "超性能模式 "和 "最佳性能 "模式。用户应该熟悉 "我的戴尔 "软件,因为它是调整充电行为、系统性能、通知等的控制中心,如下面的截图所示。

处理器
XPS 13 9315二合一产品共享相同的 酷睿i5-1230UCPU,与XPS 13 9315外壳上的CPU相同。人们可能会期望外壳模型比二合一模型表现得更快一点,但事实恰恰相反。我们下面的结果显示,在多线程工作负载中,XPS 13 9315二合一机型一直领先于XPS 13 9315蛤壳机型,差距很大,约为70%。这些结果足够广泛,甚至超过了 酷睿i7-1185G7在Surface Pro 8中。
升级到 酷睿i7-1250USKU预计只能将性能提高约5%,根据我们对最新的 HP Envy x360 13.要想获得更快的性能,你要考虑XPS 13 Plus 9320和它的P系列CPU选项。
性能的可持续性在XPS 13 9315 2-in-1上是有限的,因为它是一个无风扇设计。例如,在循环运行CineBench R15 xT时,最初的1252分将随着时间的推移稳步下降到750分,代表着40%的性能损失。尽管如此,即使考虑到两台机器的节流情况,性能仍然比XPS 13 9315蛤壳中的相同CPU快约50%。
Cinebench R15 Multi Loop
Cinebench R23: Multi Core | Single Core
Cinebench R15: CPU Multi 64Bit | CPU Single 64Bit
Blender: v2.79 BMW27 CPU
7-Zip 18.03: 7z b 4 | 7z b 4 -mmt1
Geekbench 5.5: Multi-Core | Single-Core
HWBOT x265 Benchmark v2.2: 4k Preset
LibreOffice : 20 Documents To PDF
R Benchmark 2.5: Overall mean
| HWBOT x265 Benchmark v2.2 / 4k Preset | |
| Dell XPS 13 Plus 9320 i7-1280P OLED | |
| HP Spectre x360 13.5 14t-ef000 | |
| Dell XPS 13 9315 2-in-1 Core i5-1230U | |
| Microsoft Surface Pro 8, i7-1185G7 | |
* ... smaller is better
AIDA64: FP32 Ray-Trace | FPU Julia | CPU SHA3 | CPU Queen | FPU SinJulia | FPU Mandel | CPU AES | CPU ZLib | FP64 Ray-Trace | CPU PhotoWorxx
| Performance Rating | |
| Dell XPS 13 Plus 9320 i7-1280P OLED | |
| HP Spectre x360 13.5 14t-ef000 | |
| Microsoft Surface Pro 8, i7-1185G7 | |
| Dell XPS 13 9315 2-in-1 Core i5-1230U | |
| Lenovo ThinkBook Plus Gen2 Core i5 | |
| Average Intel Core i5-1230U | |
| AIDA64 / FP32 Ray-Trace | |
| Dell XPS 13 Plus 9320 i7-1280P OLED | |
| HP Spectre x360 13.5 14t-ef000 | |
| Microsoft Surface Pro 8, i7-1185G7 | |
| Dell XPS 13 9315 2-in-1 Core i5-1230U | |
| Lenovo ThinkBook Plus Gen2 Core i5 | |
| Average Intel Core i5-1230U (2344 - 6360, n=3) | |
| AIDA64 / FPU Julia | |
| Dell XPS 13 Plus 9320 i7-1280P OLED | |
| HP Spectre x360 13.5 14t-ef000 | |
| Dell XPS 13 9315 2-in-1 Core i5-1230U | |
| Microsoft Surface Pro 8, i7-1185G7 | |
| Lenovo ThinkBook Plus Gen2 Core i5 | |
| Average Intel Core i5-1230U (11867 - 31714, n=3) | |
| AIDA64 / CPU SHA3 | |
| Dell XPS 13 Plus 9320 i7-1280P OLED | |
| HP Spectre x360 13.5 14t-ef000 | |
| Microsoft Surface Pro 8, i7-1185G7 | |
| Dell XPS 13 9315 2-in-1 Core i5-1230U | |
| Lenovo ThinkBook Plus Gen2 Core i5 | |
| Average Intel Core i5-1230U (772 - 1711, n=3) | |
| AIDA64 / CPU Queen | |
| Dell XPS 13 Plus 9320 i7-1280P OLED | |
| HP Spectre x360 13.5 14t-ef000 | |
| Dell XPS 13 9315 2-in-1 Core i5-1230U | |
| Microsoft Surface Pro 8, i7-1185G7 | |
| Average Intel Core i5-1230U (30824 - 52533, n=3) | |
| Lenovo ThinkBook Plus Gen2 Core i5 | |
| AIDA64 / FPU SinJulia | |
| Dell XPS 13 Plus 9320 i7-1280P OLED | |
| Microsoft Surface Pro 8, i7-1185G7 | |
| HP Spectre x360 13.5 14t-ef000 | |
| Dell XPS 13 9315 2-in-1 Core i5-1230U | |
| Lenovo ThinkBook Plus Gen2 Core i5 | |
| Average Intel Core i5-1230U (2269 - 3947, n=3) | |
| AIDA64 / FPU Mandel | |
| Dell XPS 13 Plus 9320 i7-1280P OLED | |
| HP Spectre x360 13.5 14t-ef000 | |
| Microsoft Surface Pro 8, i7-1185G7 | |
| Dell XPS 13 9315 2-in-1 Core i5-1230U | |
| Lenovo ThinkBook Plus Gen2 Core i5 | |
| Average Intel Core i5-1230U (6379 - 15896, n=3) | |
| AIDA64 / CPU ZLib | |
| Dell XPS 13 Plus 9320 i7-1280P OLED | |
| HP Spectre x360 13.5 14t-ef000 | |
| Dell XPS 13 9315 2-in-1 Core i5-1230U | |
| Average Intel Core i5-1230U (229 - 495, n=3) | |
| Lenovo ThinkBook Plus Gen2 Core i5 | |
| Microsoft Surface Pro 8, i7-1185G7 | |
| AIDA64 / FP64 Ray-Trace | |
| Dell XPS 13 Plus 9320 i7-1280P OLED | |
| HP Spectre x360 13.5 14t-ef000 | |
| Microsoft Surface Pro 8, i7-1185G7 | |
| Dell XPS 13 9315 2-in-1 Core i5-1230U | |
| Lenovo ThinkBook Plus Gen2 Core i5 | |
| Average Intel Core i5-1230U (1328 - 3305, n=3) | |
| AIDA64 / CPU PhotoWorxx | |
| Dell XPS 13 Plus 9320 i7-1280P OLED | |
| HP Spectre x360 13.5 14t-ef000 | |
| Lenovo ThinkBook Plus Gen2 Core i5 | |
| Microsoft Surface Pro 8, i7-1185G7 | |
| Dell XPS 13 9315 2-in-1 Core i5-1230U | |
| Average Intel Core i5-1230U (17516 - 37042, n=3) | |
系统性能
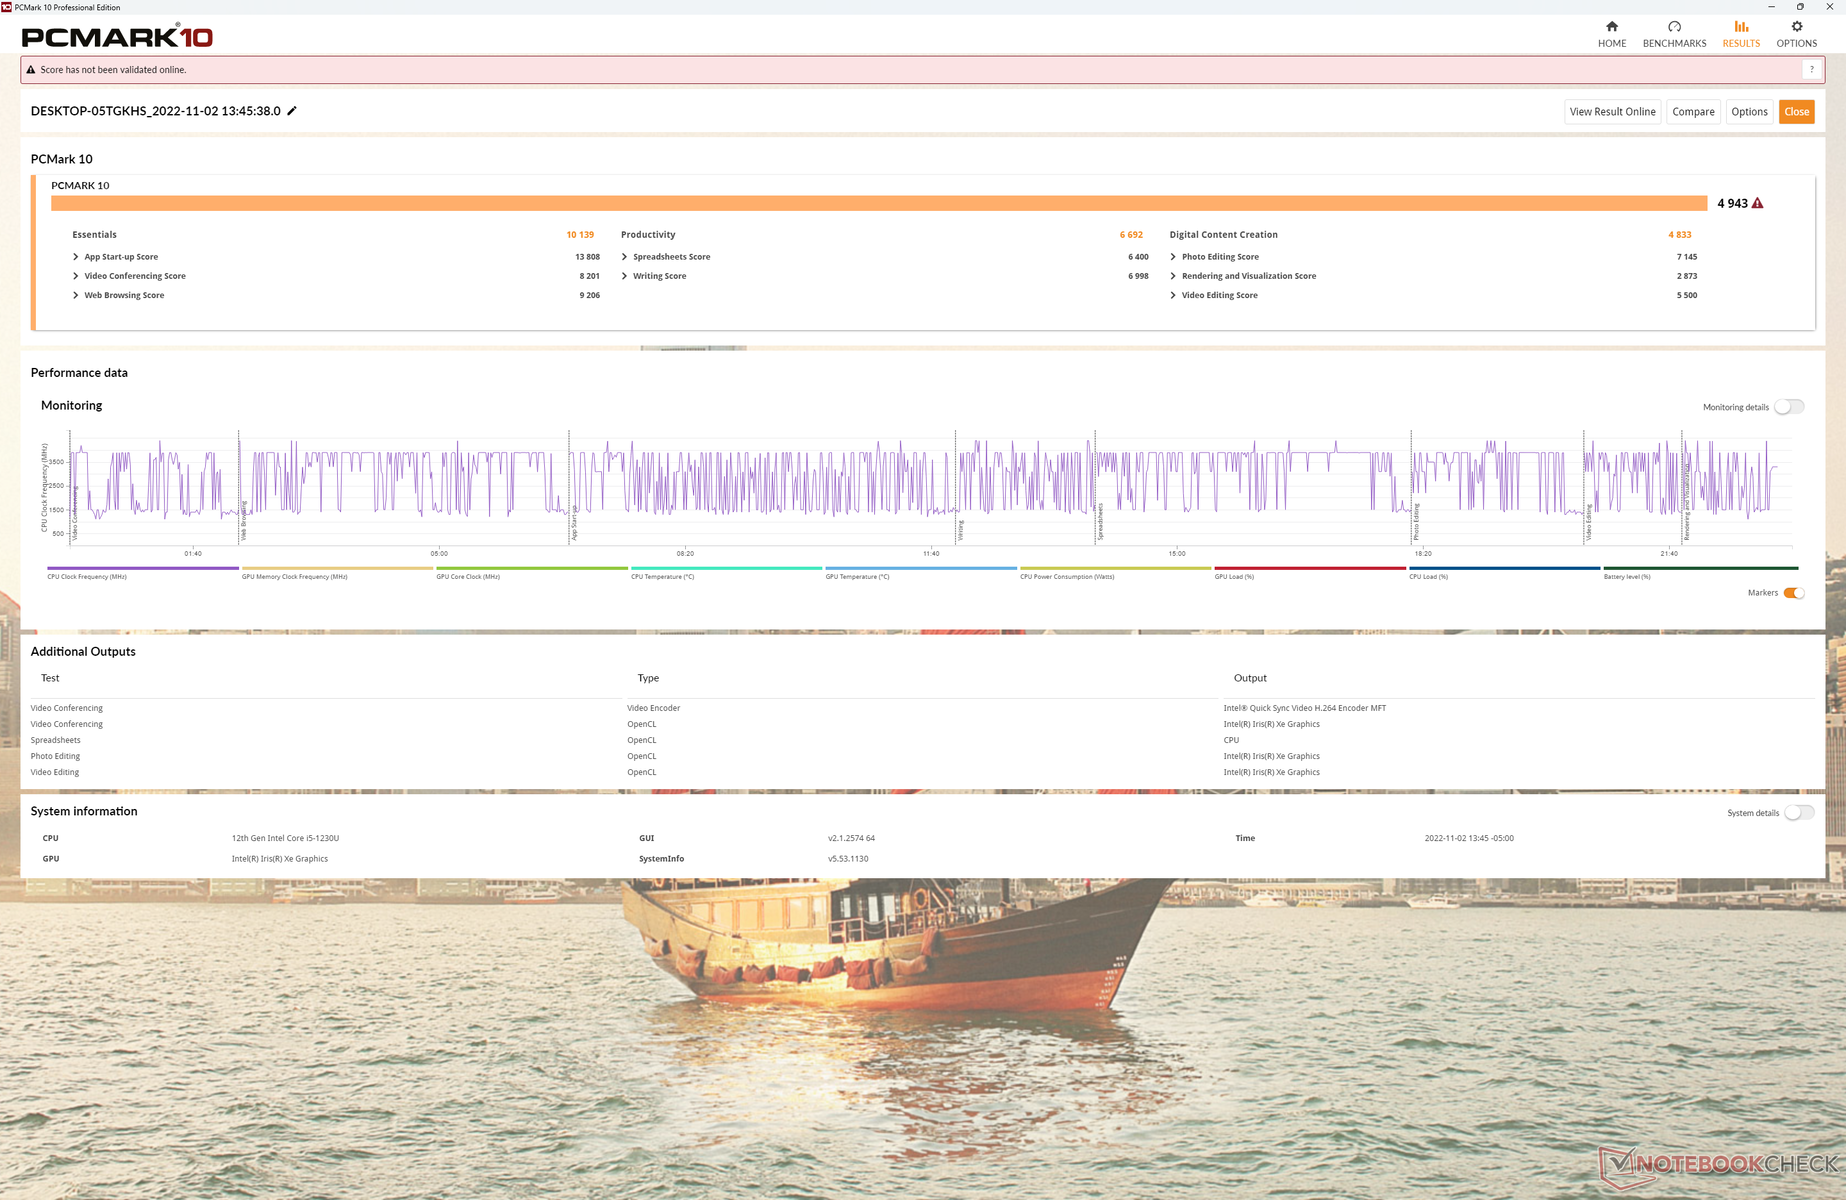
PCMark 10的结果与Surface Pro 8相当,但在图形性能最重要的数字内容创作分测试中除外。这与我们下面的GPU测试结果一致,XPS 13 9315 2-in-1将表现出慢于该类别平均水平的图形性能。
CrossMark: Overall | Productivity | Creativity | Responsiveness
| PCMark 10 / Score | |
| Dell XPS 13 Plus 9320 i7-1280P OLED | |
| HP Spectre x360 13.5 14t-ef000 | |
| Microsoft Surface Pro 8, i7-1185G7 | |
| Dell XPS 13 9315 2-in-1 Core i5-1230U | |
| Average Intel Core i5-1230U, Intel Iris Xe Graphics G7 80EUs (4001 - 4943, n=3) | |
| Lenovo ThinkBook Plus Gen2 Core i5 | |
| PCMark 10 / Essentials | |
| HP Spectre x360 13.5 14t-ef000 | |
| Dell XPS 13 Plus 9320 i7-1280P OLED | |
| Lenovo ThinkBook Plus Gen2 Core i5 | |
| Dell XPS 13 9315 2-in-1 Core i5-1230U | |
| Microsoft Surface Pro 8, i7-1185G7 | |
| Average Intel Core i5-1230U, Intel Iris Xe Graphics G7 80EUs (8348 - 10139, n=3) | |
| PCMark 10 / Productivity | |
| HP Spectre x360 13.5 14t-ef000 | |
| Dell XPS 13 Plus 9320 i7-1280P OLED | |
| Dell XPS 13 9315 2-in-1 Core i5-1230U | |
| Microsoft Surface Pro 8, i7-1185G7 | |
| Average Intel Core i5-1230U, Intel Iris Xe Graphics G7 80EUs (5735 - 6692, n=3) | |
| Lenovo ThinkBook Plus Gen2 Core i5 | |
| PCMark 10 / Digital Content Creation | |
| Dell XPS 13 Plus 9320 i7-1280P OLED | |
| Microsoft Surface Pro 8, i7-1185G7 | |
| HP Spectre x360 13.5 14t-ef000 | |
| Dell XPS 13 9315 2-in-1 Core i5-1230U | |
| Average Intel Core i5-1230U, Intel Iris Xe Graphics G7 80EUs (3632 - 4833, n=3) | |
| Lenovo ThinkBook Plus Gen2 Core i5 | |
| CrossMark / Overall | |
| Dell XPS 13 Plus 9320 i7-1280P OLED | |
| HP Spectre x360 13.5 14t-ef000 | |
| Apple MacBook Air M2 Entry | |
| Microsoft Surface Pro 8, i7-1185G7 | |
| Dell XPS 13 9315 2-in-1 Core i5-1230U | |
| Average Intel Core i5-1230U, Intel Iris Xe Graphics G7 80EUs (1117 - 1383, n=3) | |
| CrossMark / Productivity | |
| Dell XPS 13 Plus 9320 i7-1280P OLED | |
| HP Spectre x360 13.5 14t-ef000 | |
| Microsoft Surface Pro 8, i7-1185G7 | |
| Apple MacBook Air M2 Entry | |
| Dell XPS 13 9315 2-in-1 Core i5-1230U | |
| Average Intel Core i5-1230U, Intel Iris Xe Graphics G7 80EUs (1187 - 1356, n=3) | |
| CrossMark / Creativity | |
| Dell XPS 13 Plus 9320 i7-1280P OLED | |
| Apple MacBook Air M2 Entry | |
| HP Spectre x360 13.5 14t-ef000 | |
| Microsoft Surface Pro 8, i7-1185G7 | |
| Dell XPS 13 9315 2-in-1 Core i5-1230U | |
| Average Intel Core i5-1230U, Intel Iris Xe Graphics G7 80EUs (1095 - 1469, n=3) | |
| CrossMark / Responsiveness | |
| Dell XPS 13 Plus 9320 i7-1280P OLED | |
| HP Spectre x360 13.5 14t-ef000 | |
| Dell XPS 13 9315 2-in-1 Core i5-1230U | |
| Average Intel Core i5-1230U, Intel Iris Xe Graphics G7 80EUs (990 - 1224, n=3) | |
| Microsoft Surface Pro 8, i7-1185G7 | |
| Apple MacBook Air M2 Entry | |
| PCMark 10 Score | 4943 points | |
Help | ||
| AIDA64 / Memory Copy | |
| Dell XPS 13 Plus 9320 i7-1280P OLED | |
| HP Spectre x360 13.5 14t-ef000 | |
| Dell XPS 13 9315 2-in-1 Core i5-1230U | |
| Microsoft Surface Pro 8, i7-1185G7 | |
| Lenovo ThinkBook Plus Gen2 Core i5 | |
| Average Intel Core i5-1230U (32539 - 60944, n=3) | |
| AIDA64 / Memory Read | |
| Dell XPS 13 Plus 9320 i7-1280P OLED | |
| Lenovo ThinkBook Plus Gen2 Core i5 | |
| HP Spectre x360 13.5 14t-ef000 | |
| Microsoft Surface Pro 8, i7-1185G7 | |
| Dell XPS 13 9315 2-in-1 Core i5-1230U | |
| Average Intel Core i5-1230U (31342 - 60435, n=3) | |
| AIDA64 / Memory Write | |
| Dell XPS 13 9315 2-in-1 Core i5-1230U | |
| Lenovo ThinkBook Plus Gen2 Core i5 | |
| HP Spectre x360 13.5 14t-ef000 | |
| Dell XPS 13 Plus 9320 i7-1280P OLED | |
| Microsoft Surface Pro 8, i7-1185G7 | |
| Average Intel Core i5-1230U (33224 - 65665, n=3) | |
| AIDA64 / Memory Latency | |
| Dell XPS 13 9315 2-in-1 Core i5-1230U | |
| Dell XPS 13 Plus 9320 i7-1280P OLED | |
| Microsoft Surface Pro 8, i7-1185G7 | |
| HP Spectre x360 13.5 14t-ef000 | |
| Lenovo ThinkBook Plus Gen2 Core i5 | |
| Average Intel Core i5-1230U (104.3 - 105.3, n=3) | |
* ... smaller is better
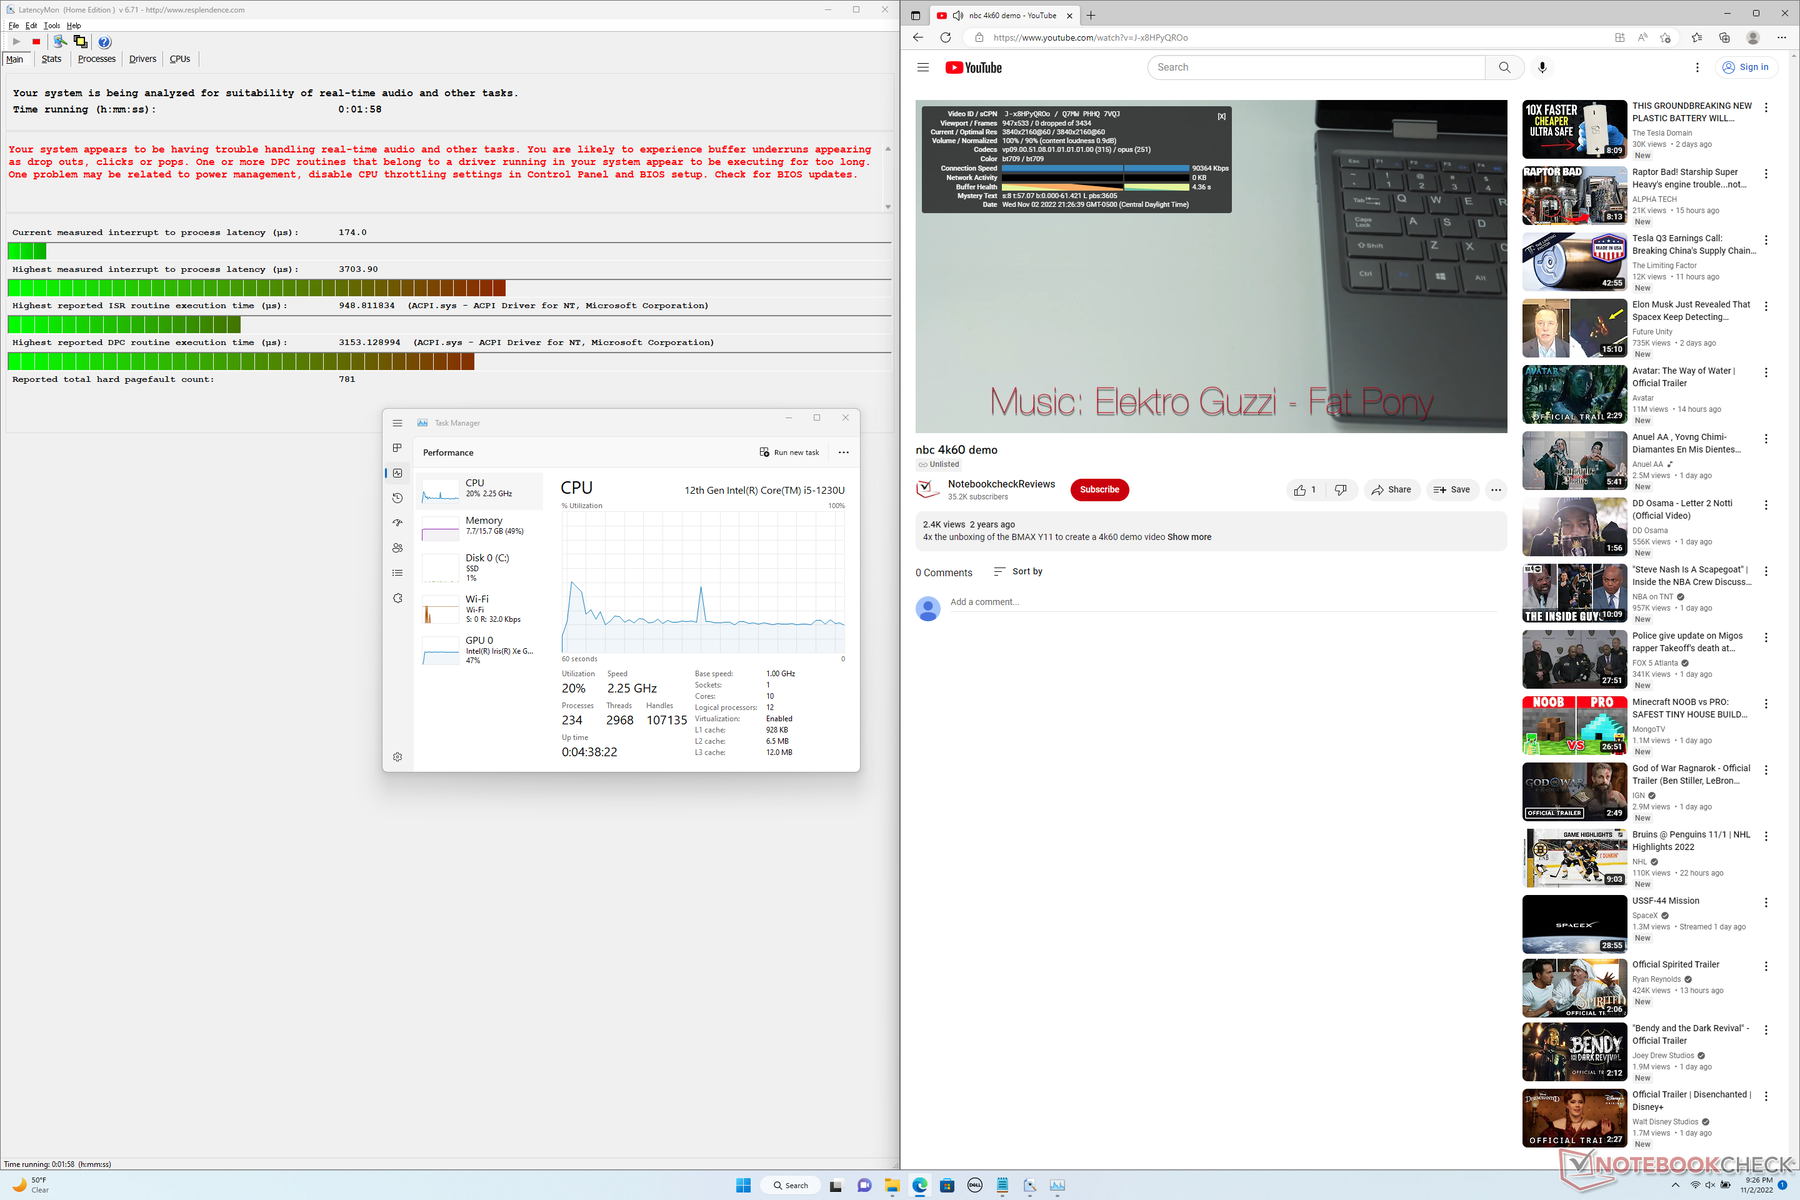
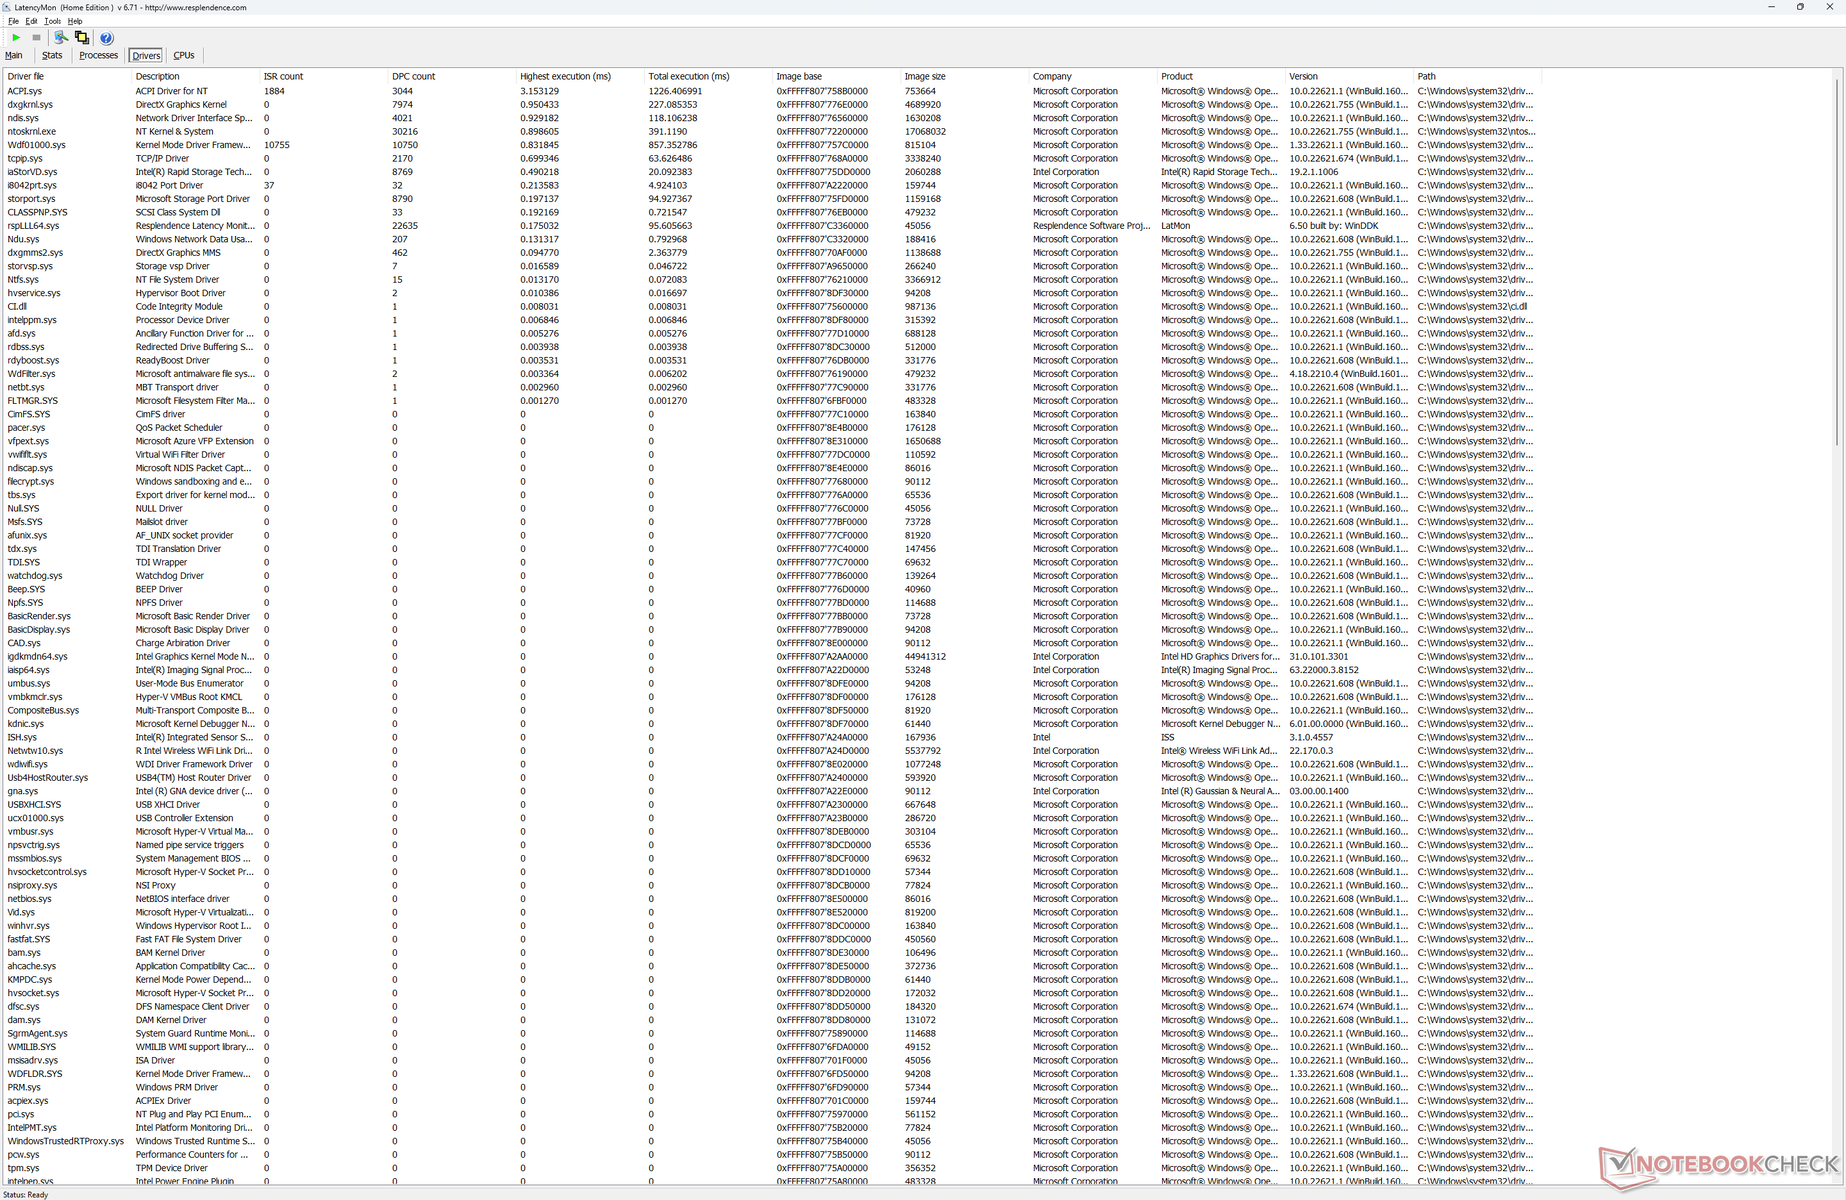
DPC延时
LatencyMon显示了在打开我们主页的多个浏览器标签时的DPC问题。在60 FPS的情况下,4K视频播放是完美的,没有掉帧。
| DPC Latencies / LatencyMon - interrupt to process latency (max), Web, Youtube, Prime95 | |
| Dell XPS 13 9315 2-in-1 Core i5-1230U | |
| Lenovo ThinkBook Plus Gen2 Core i5 | |
| HP Spectre x360 13.5 14t-ef000 | |
| Microsoft Surface Pro 8, i7-1185G7 | |
| Dell XPS 13 Plus 9320 i7-1280P OLED | |
* ... smaller is better
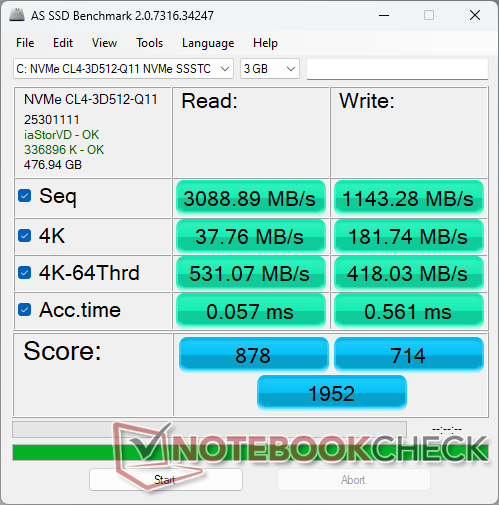
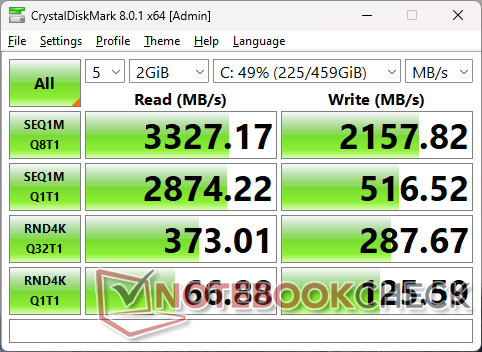
存储设备 - 以PCIe3的速度实现PCIe4
戴尔提供256GB、512GB和1TB PCIe4 x4存储选项。不幸的是,性能更接近于大多数PCIe3 x4硬盘,而不是PCIe4 x4。CrystalDiskMark和DiskSpd等基准测试显示,最大的读取和写入速度分别只有3300MB/s和2200MB/s,相比之下,7000MB/s或更快。 三星980 ProPCIe4 x4系列。即便如此,考虑到外形尺寸和酷睿U系列CPU,3000MB/s的范围已经足够了。

* ... smaller is better
Disk Throttling: DiskSpd Read Loop, Queue Depth 8
GPU性能
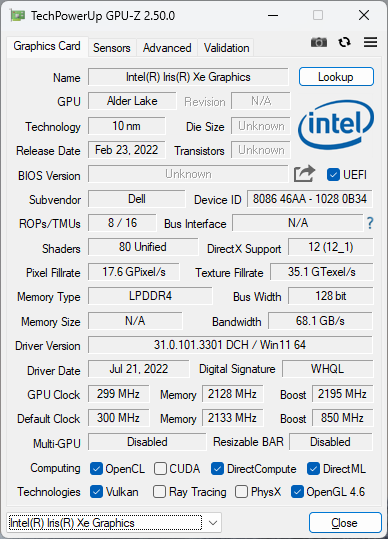
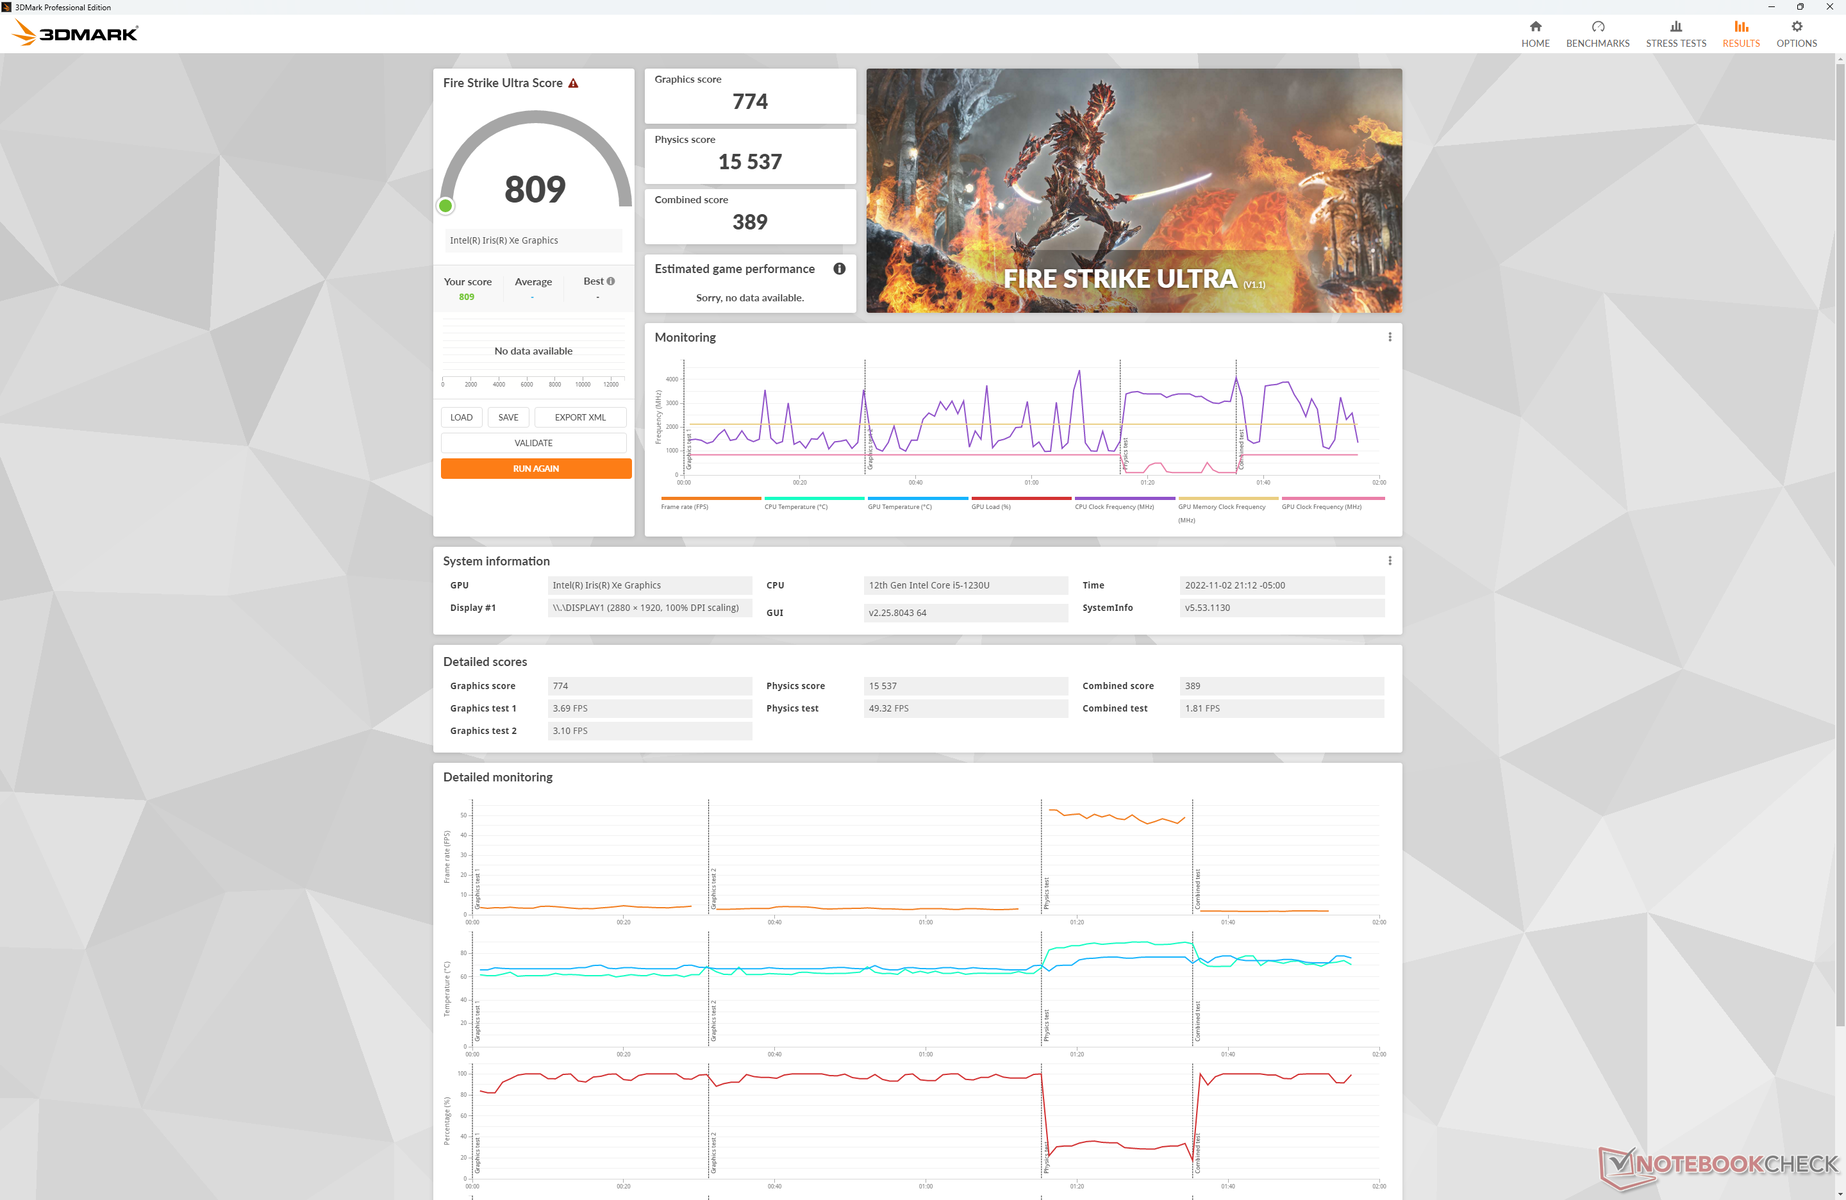
虽然CPU性能比预期的要好,但图形性能却没有那么好。3DMark结果比我们数据库中具有相同集成度的平均笔记本电脑慢10%到20%。 Iris Xe 80 EUs以媲美去年的ThinkBook Plus Gen 2.如果只在最低设置下,游戏仍然是可能的。
升级到酷睿i7-1250U SKU与 Iris Xe 96 EUs根据我们对惠普Envy x360 13的体验,预计图形性能将提高约36%。有些配置只有8GB内存,而不是16GB,我们不推荐这样的配置,否则图形性能会受到更大影响。
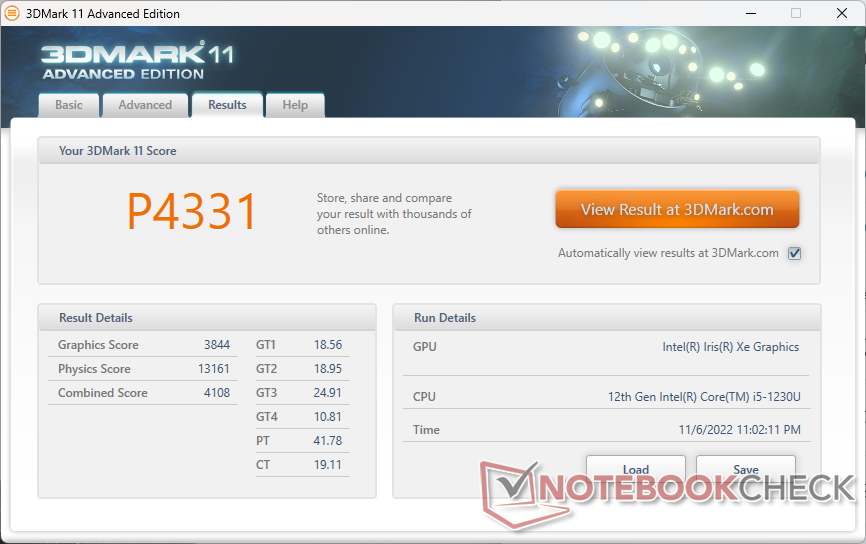
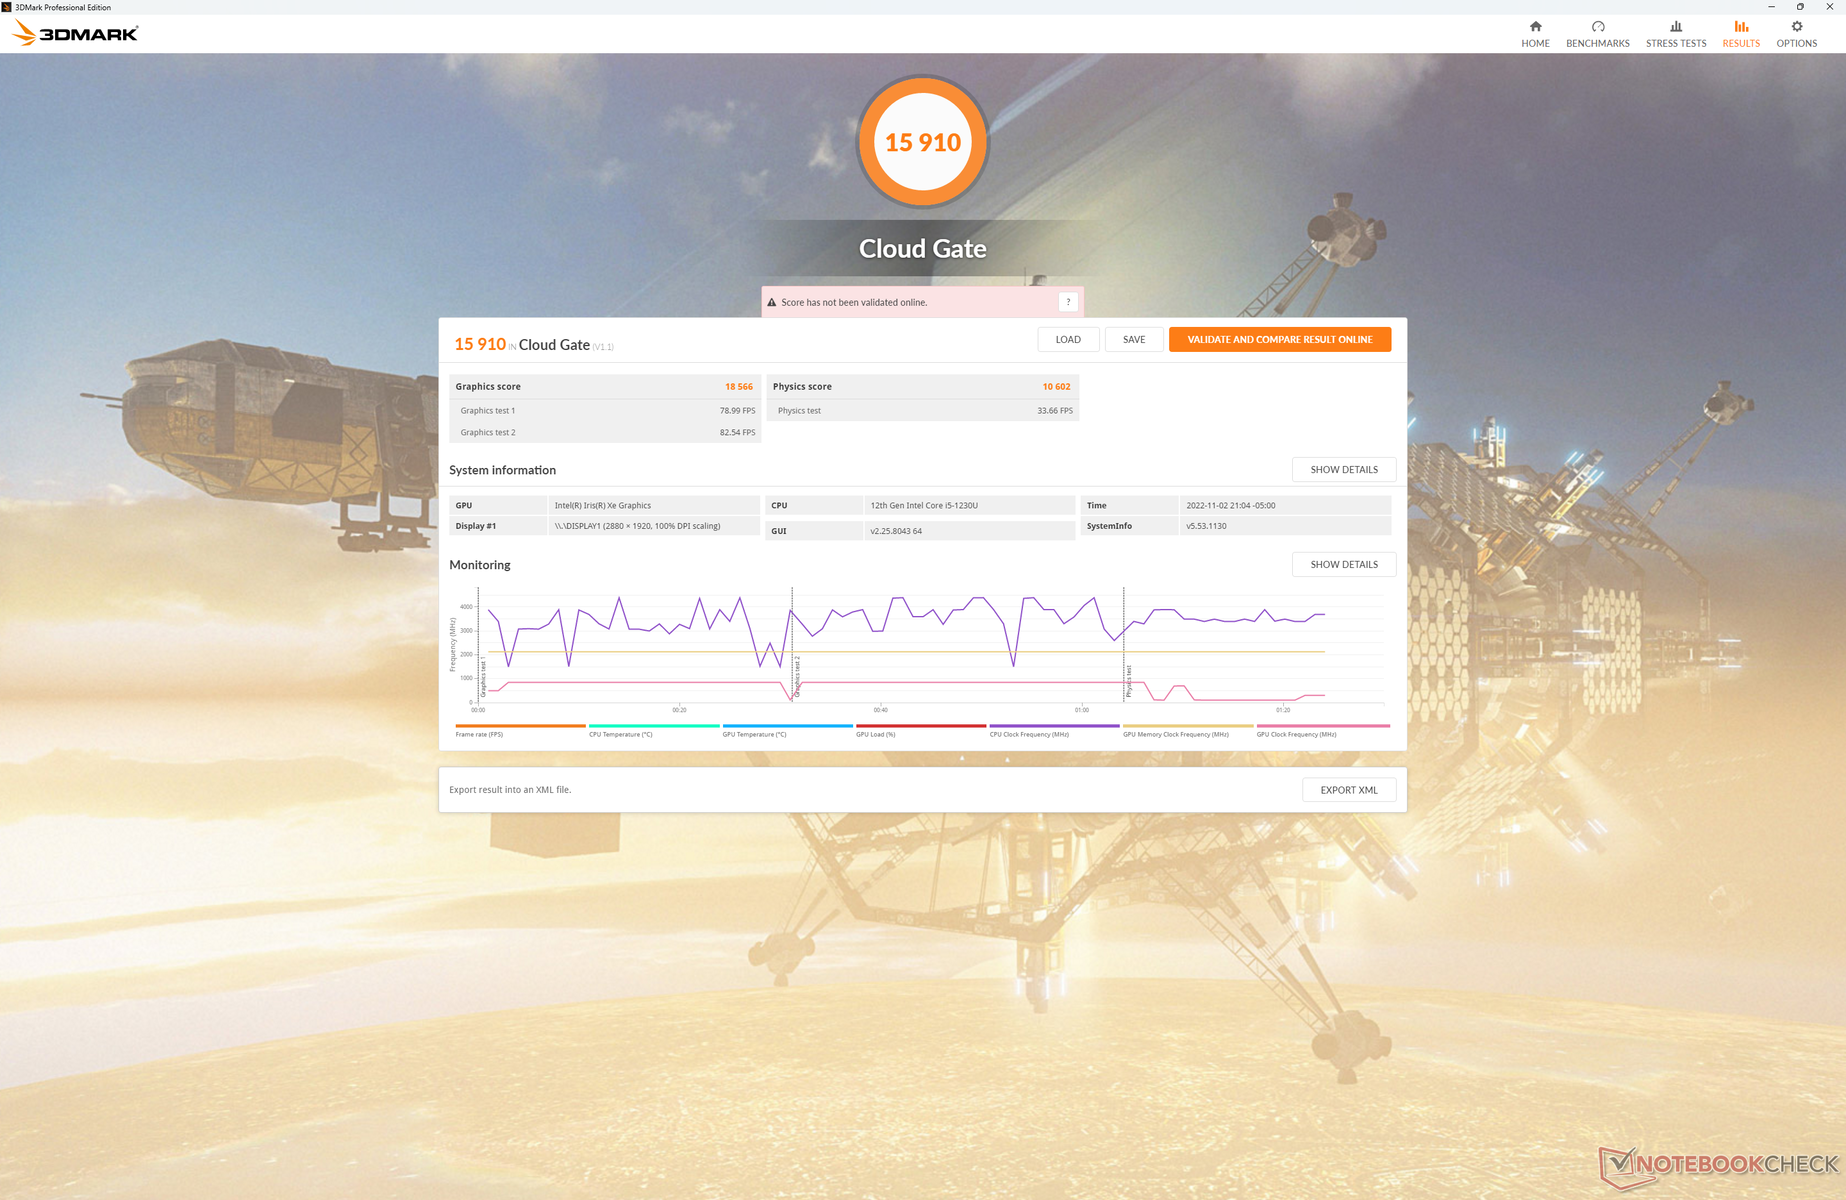
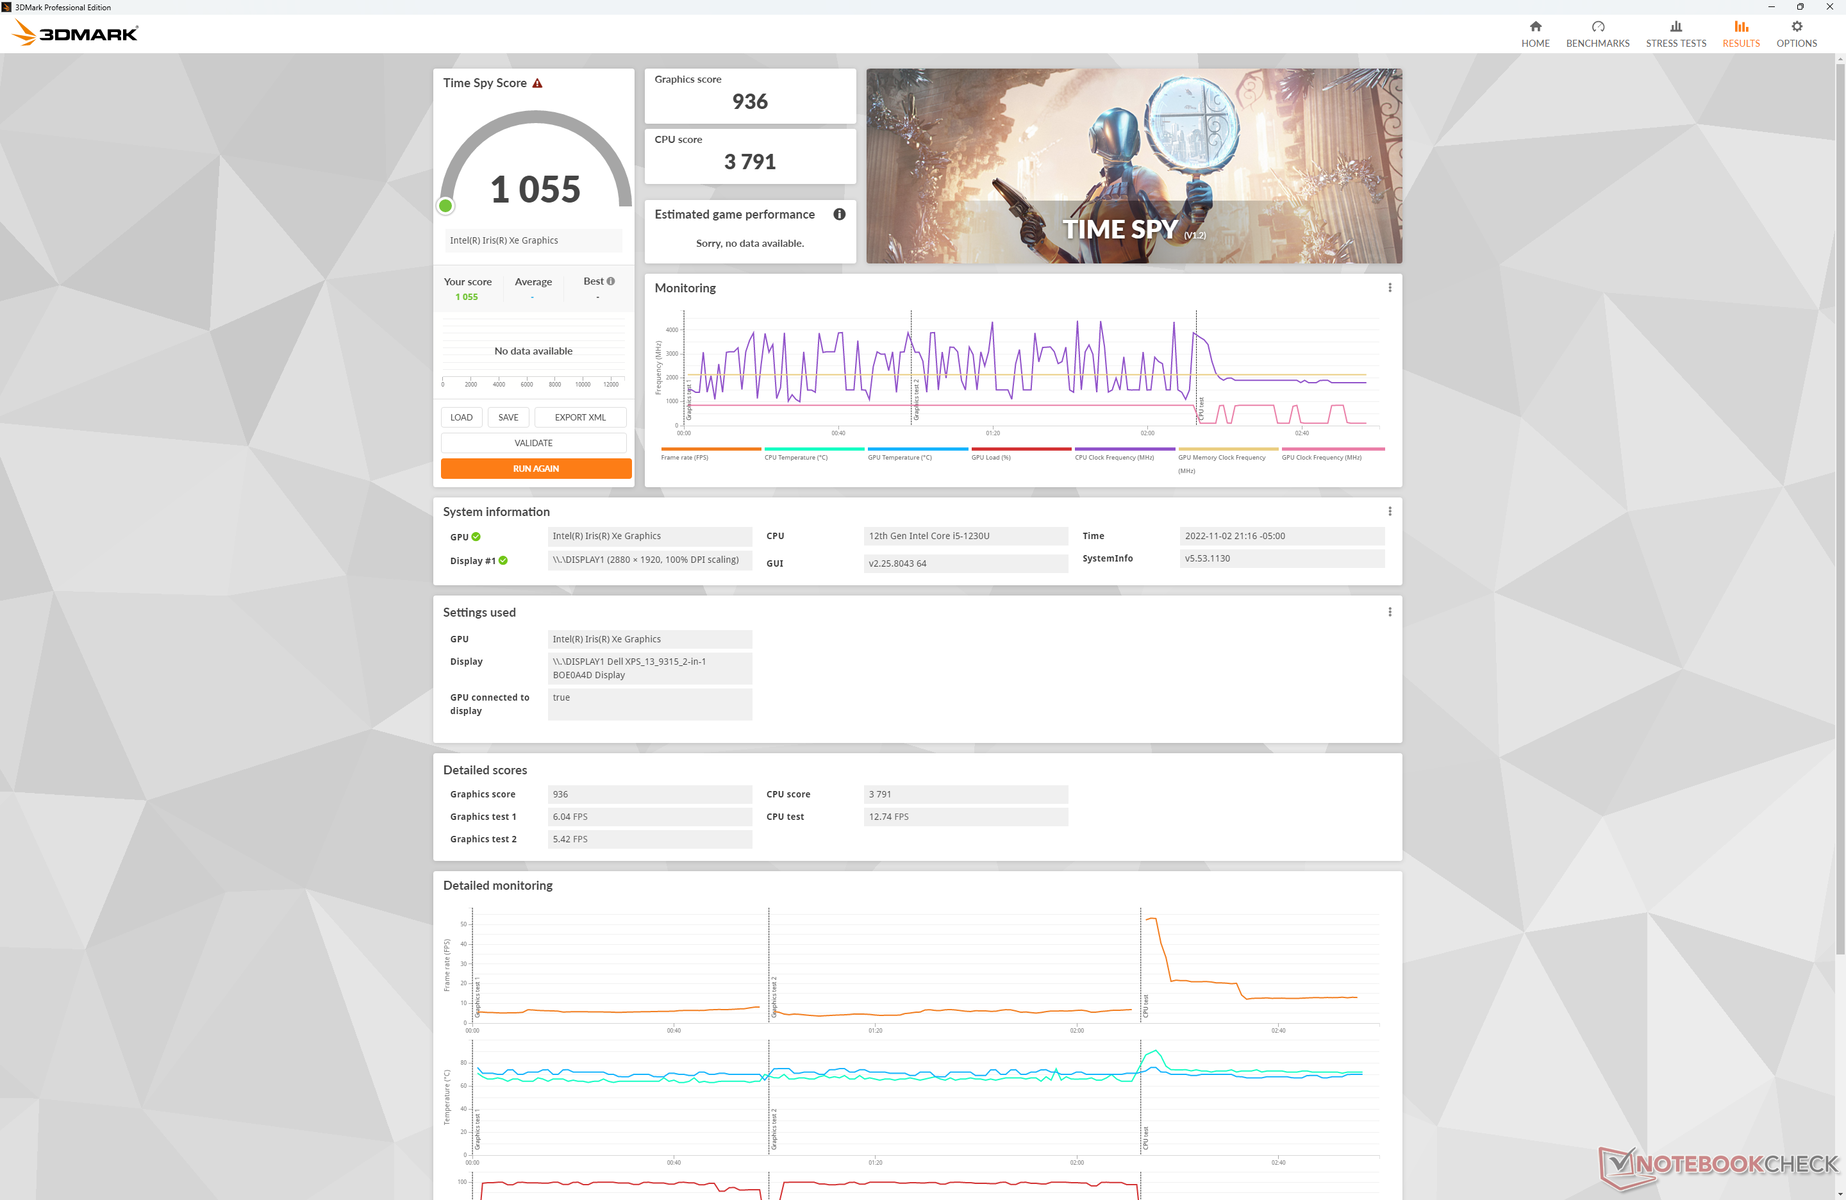
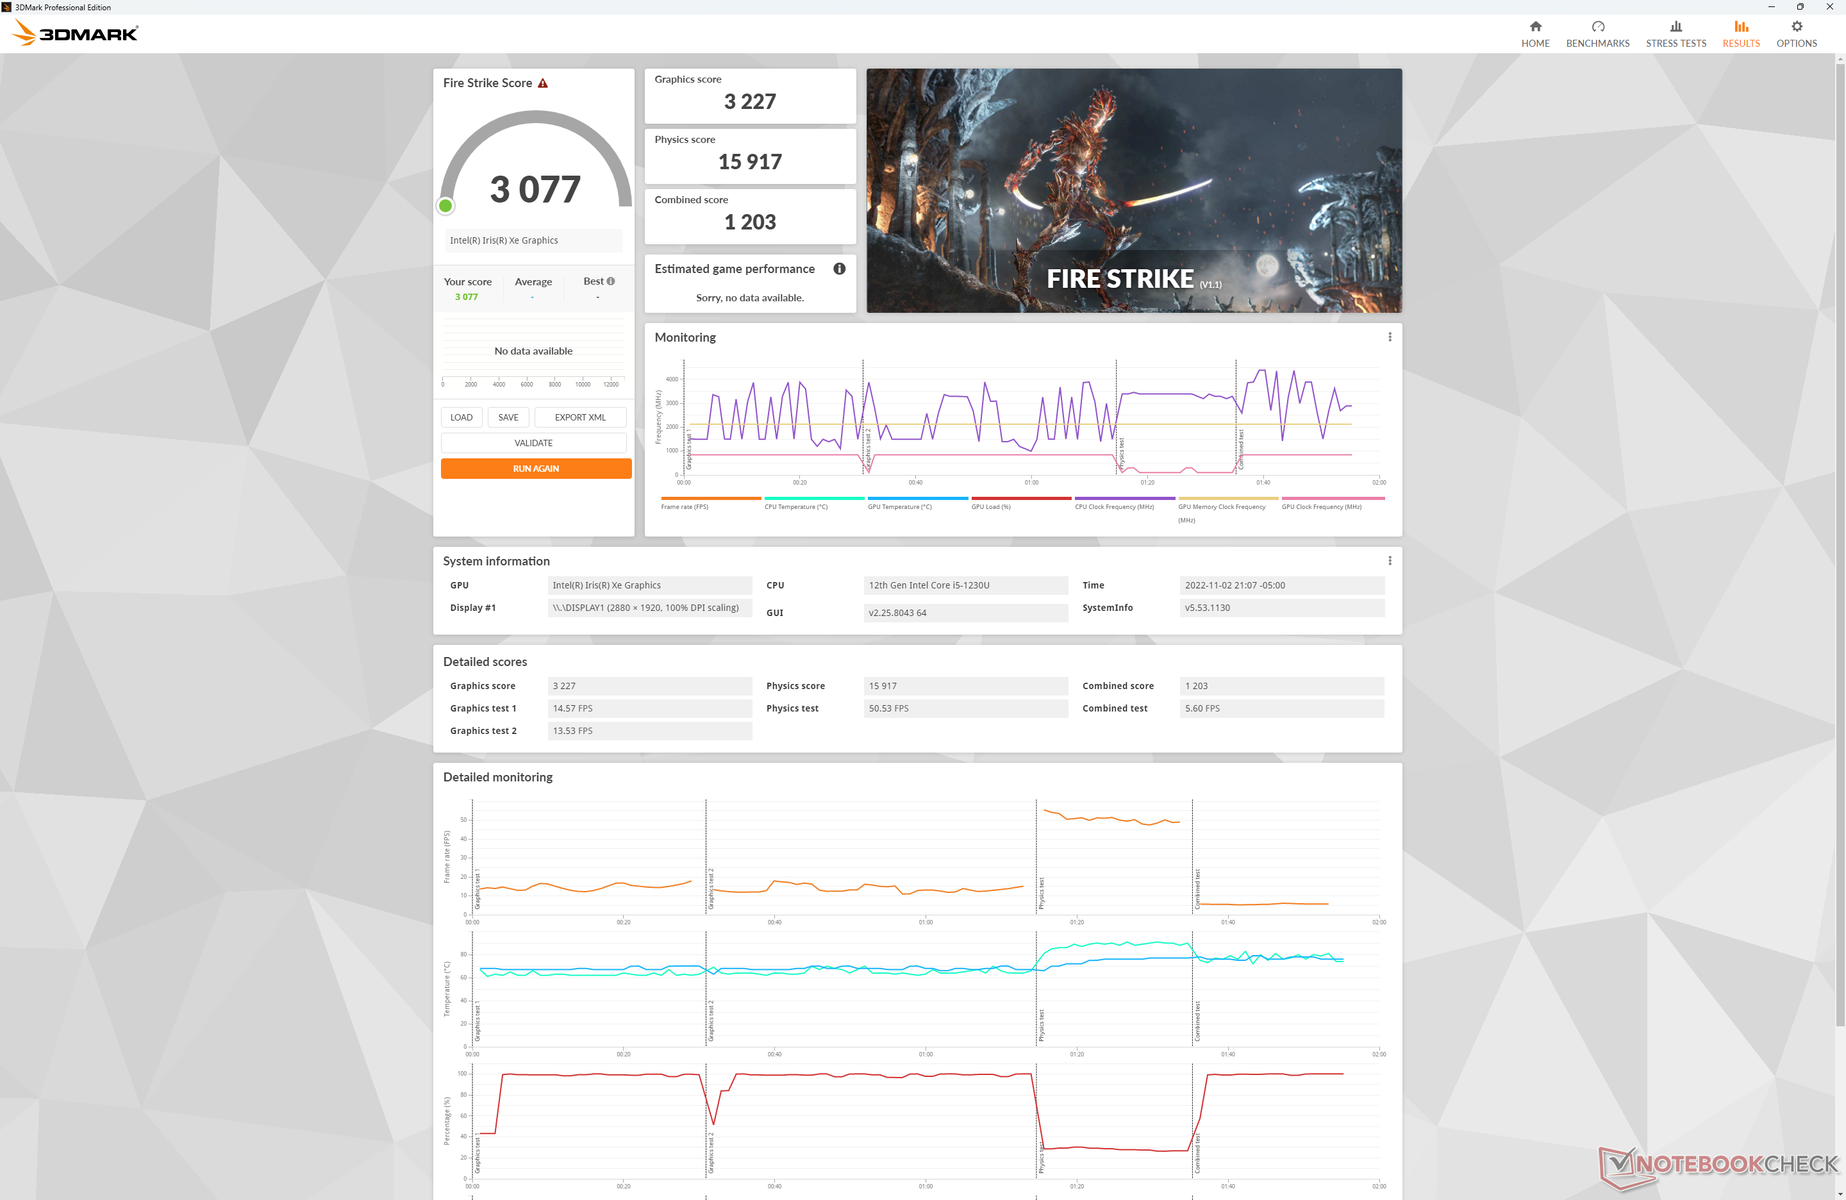
| 3DMark 11 Performance | 4331 points | |
| 3DMark Cloud Gate Standard Score | 15910 points | |
| 3DMark Fire Strike Score | 3077 points | |
| 3DMark Time Spy Score | 1055 points | |
Help | ||
* ... smaller is better
| Final Fantasy XV Benchmark - 1280x720 Lite Quality | |
| Microsoft Surface Pro 8, i7-1185G7 | |
| Dell XPS 13 Plus 9320 i7-1280P OLED | |
| HP Spectre x360 13.5 14t-ef000 | |
| Average Intel Iris Xe Graphics G7 80EUs (8.32 - 56.3, n=103) | |
| Dell XPS 13 9315 2-in-1 Core i5-1230U | |
帧率在空转时是稳定的 Witcher 3 代表背景中没有重大的干扰活动。我们经历了一次性能下降到36FPS,然后又上升到正常水平的情况,但幸运的是这只是一个例外和一种模式。
Witcher 3 FPS Chart
| low | med. | high | ultra | |
| GTA V (2015) | 60.9 | 38.4 | 11.7 | 6.06 |
| The Witcher 3 (2015) | 57.7 | 38.9 | 19.9 | 8.5 |
| Dota 2 Reborn (2015) | 101.2 | 75.8 | 37.6 | 34.2 |
| Final Fantasy XV Benchmark (2018) | 27 | |||
| X-Plane 11.11 (2018) | 31.2 | 25.1 | 22 |
排放 - 没有风扇!
系统噪音
而Surface Pro 8利用内部风扇进行冷却,XPS 13 9315二合一的所有配置,包括Core i7 SKU,都是被动冷却的。对于一个完全无声的系统来说,根本没有风扇噪音或线圈啸叫。
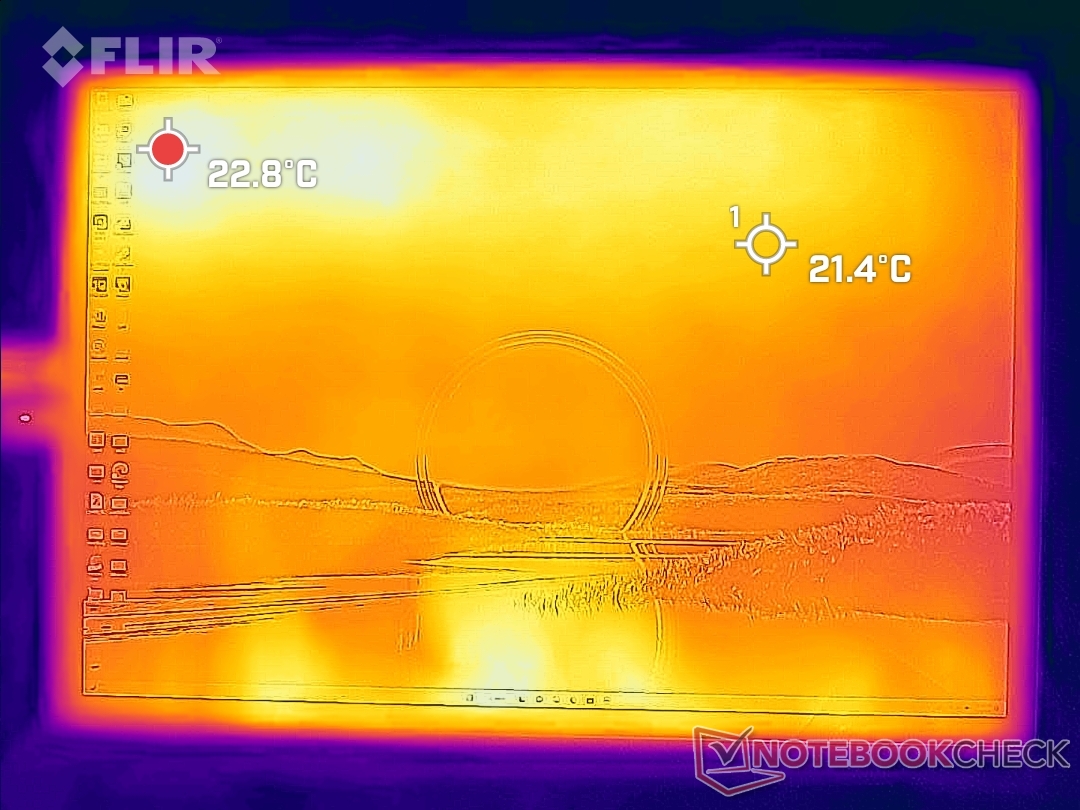
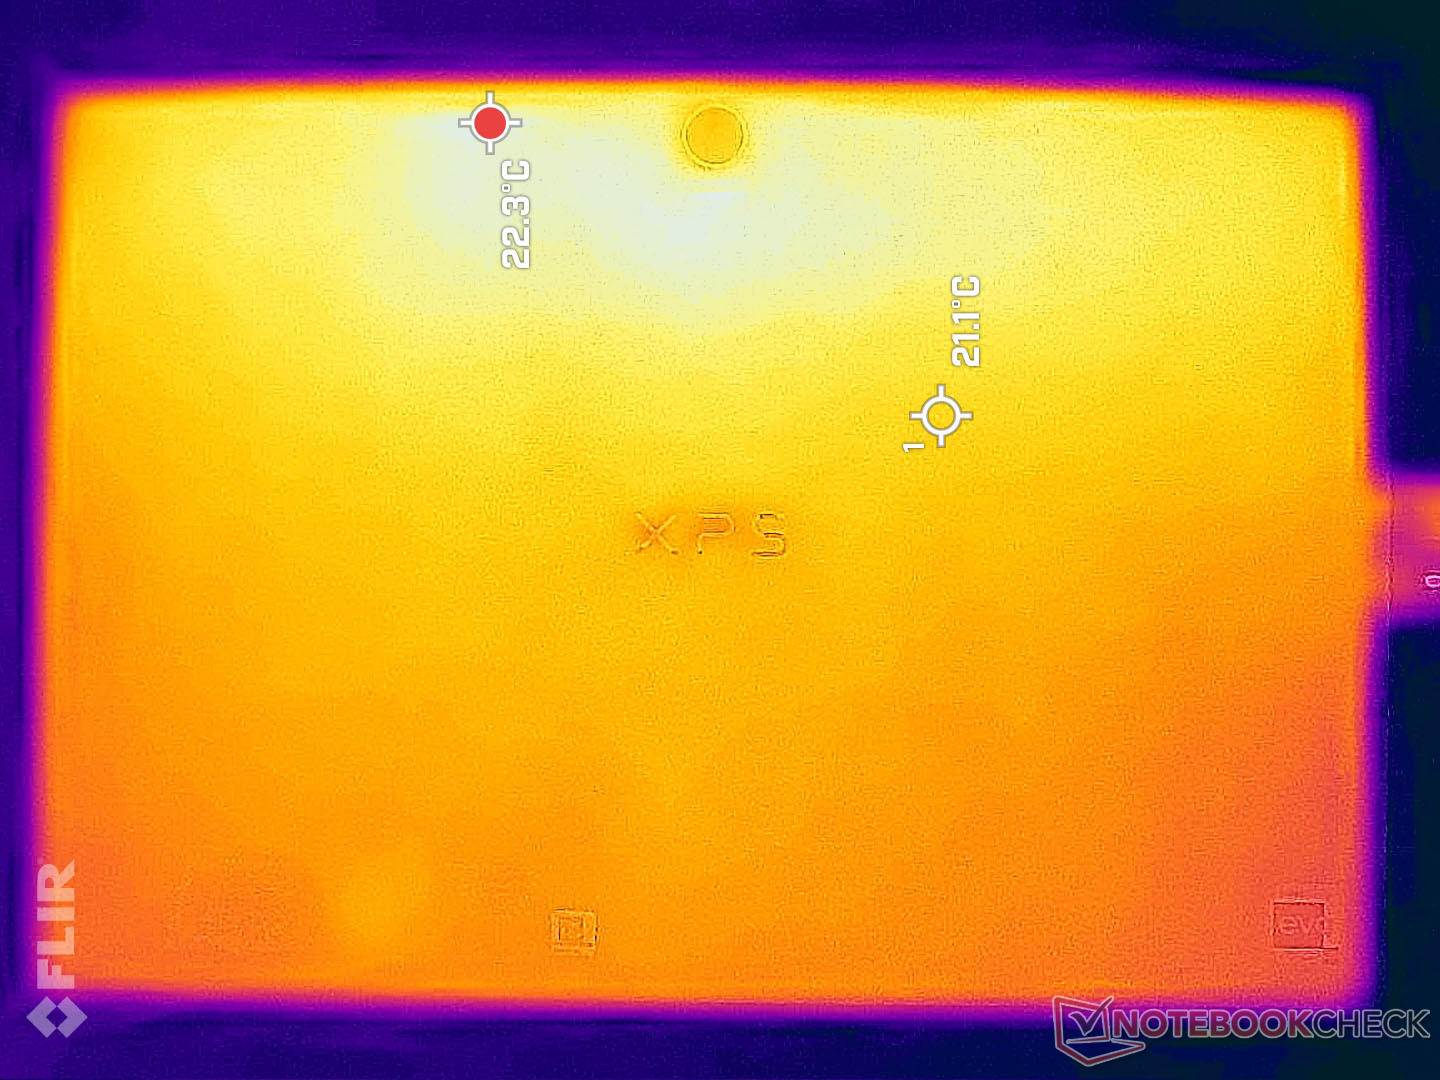
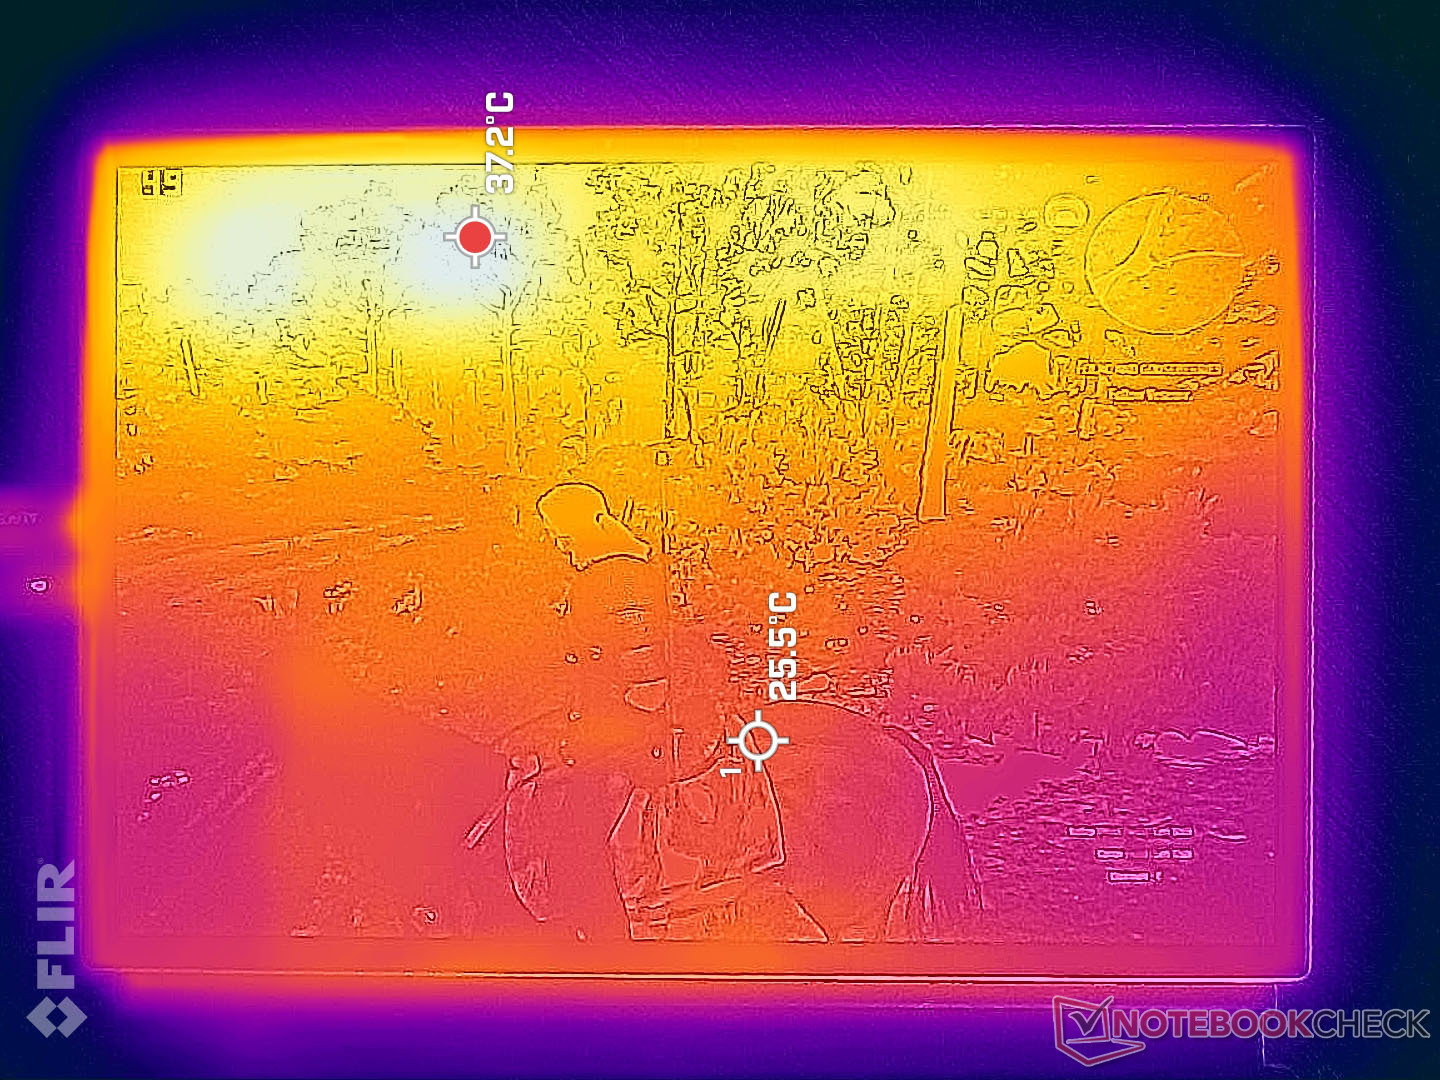
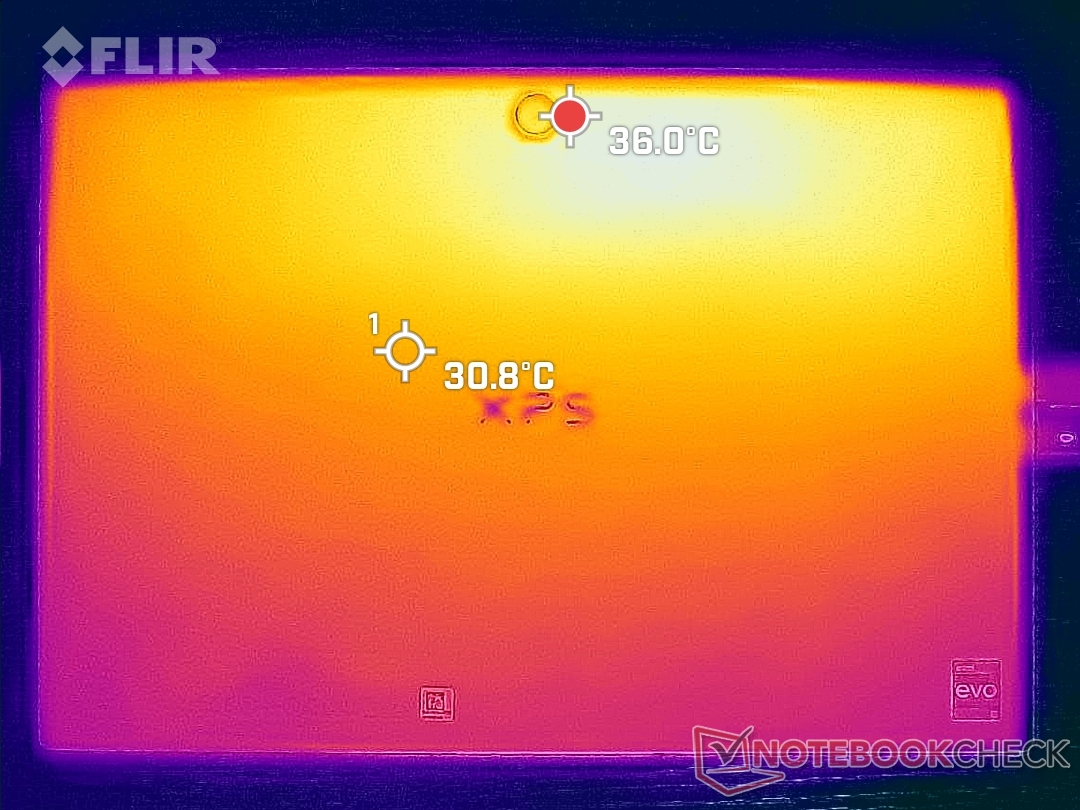
温度
沿着设备的上半部分,表面温度通常较高,而下半部分则明显较低。前面和后面的热点可以分别达到42摄氏度和39摄氏度,而在较冷的地方只有30摄氏度。无论方向或位置如何,该设备都不会让人感到不舒服。整体温度比我们在Surface Pro 8上记录的要低得多,在Surface Pro 8上,整个设备的正面和背面可以达到43℃至48℃。
(±) The maximum temperature on the upper side is 41.8 °C / 107 F, compared to the average of 35.3 °C / 96 F, ranging from 19.6 to 55.7 °C for the class Convertible.
(+) The bottom heats up to a maximum of 38.2 °C / 101 F, compared to the average of 36.7 °C / 98 F
(+) In idle usage, the average temperature for the upper side is 25.5 °C / 78 F, compared to the device average of 30.2 °C / 86 F.
(+) The palmrests and touchpad are cooler than skin temperature with a maximum of 29.8 °C / 85.6 F and are therefore cool to the touch.
(±) The average temperature of the palmrest area of similar devices was 28.1 °C / 82.6 F (-1.7 °C / -3 F).
| Dell XPS 13 9315 2-in-1 Core i5-1230U Intel Core i5-1230U, Intel Iris Xe Graphics G7 80EUs | Microsoft Surface Pro 8, i7-1185G7 Intel Core i7-1185G7, Intel Iris Xe Graphics G7 96EUs | HP Spectre x360 13.5 14t-ef000 Intel Core i7-1255U, Intel Iris Xe Graphics G7 96EUs | Lenovo ThinkBook Plus Gen2 Core i5 Intel Core i5-1130G7, Intel Iris Xe Graphics G7 80EUs | Apple MacBook Air M2 Entry Apple M2, Apple M2 8-Core GPU | |
|---|---|---|---|---|---|
| Heat | -2% | 14% | -11% | 1% | |
| Maximum Upper Side * | 41.8 | 45 -8% | 36.4 13% | 42 -0% | 44.5 -6% |
| Maximum Bottom * | 38.2 | 47.2 -24% | 37 3% | 44.5 -16% | 44.4 -16% |
| Idle Upper Side * | 27.4 | 24.1 12% | 20.8 24% | 29.8 -9% | 23.9 13% |
| Idle Bottom * | 27.2 | 23.4 14% | 22.6 17% | 31.9 -17% | 23.6 13% |
* ... smaller is better
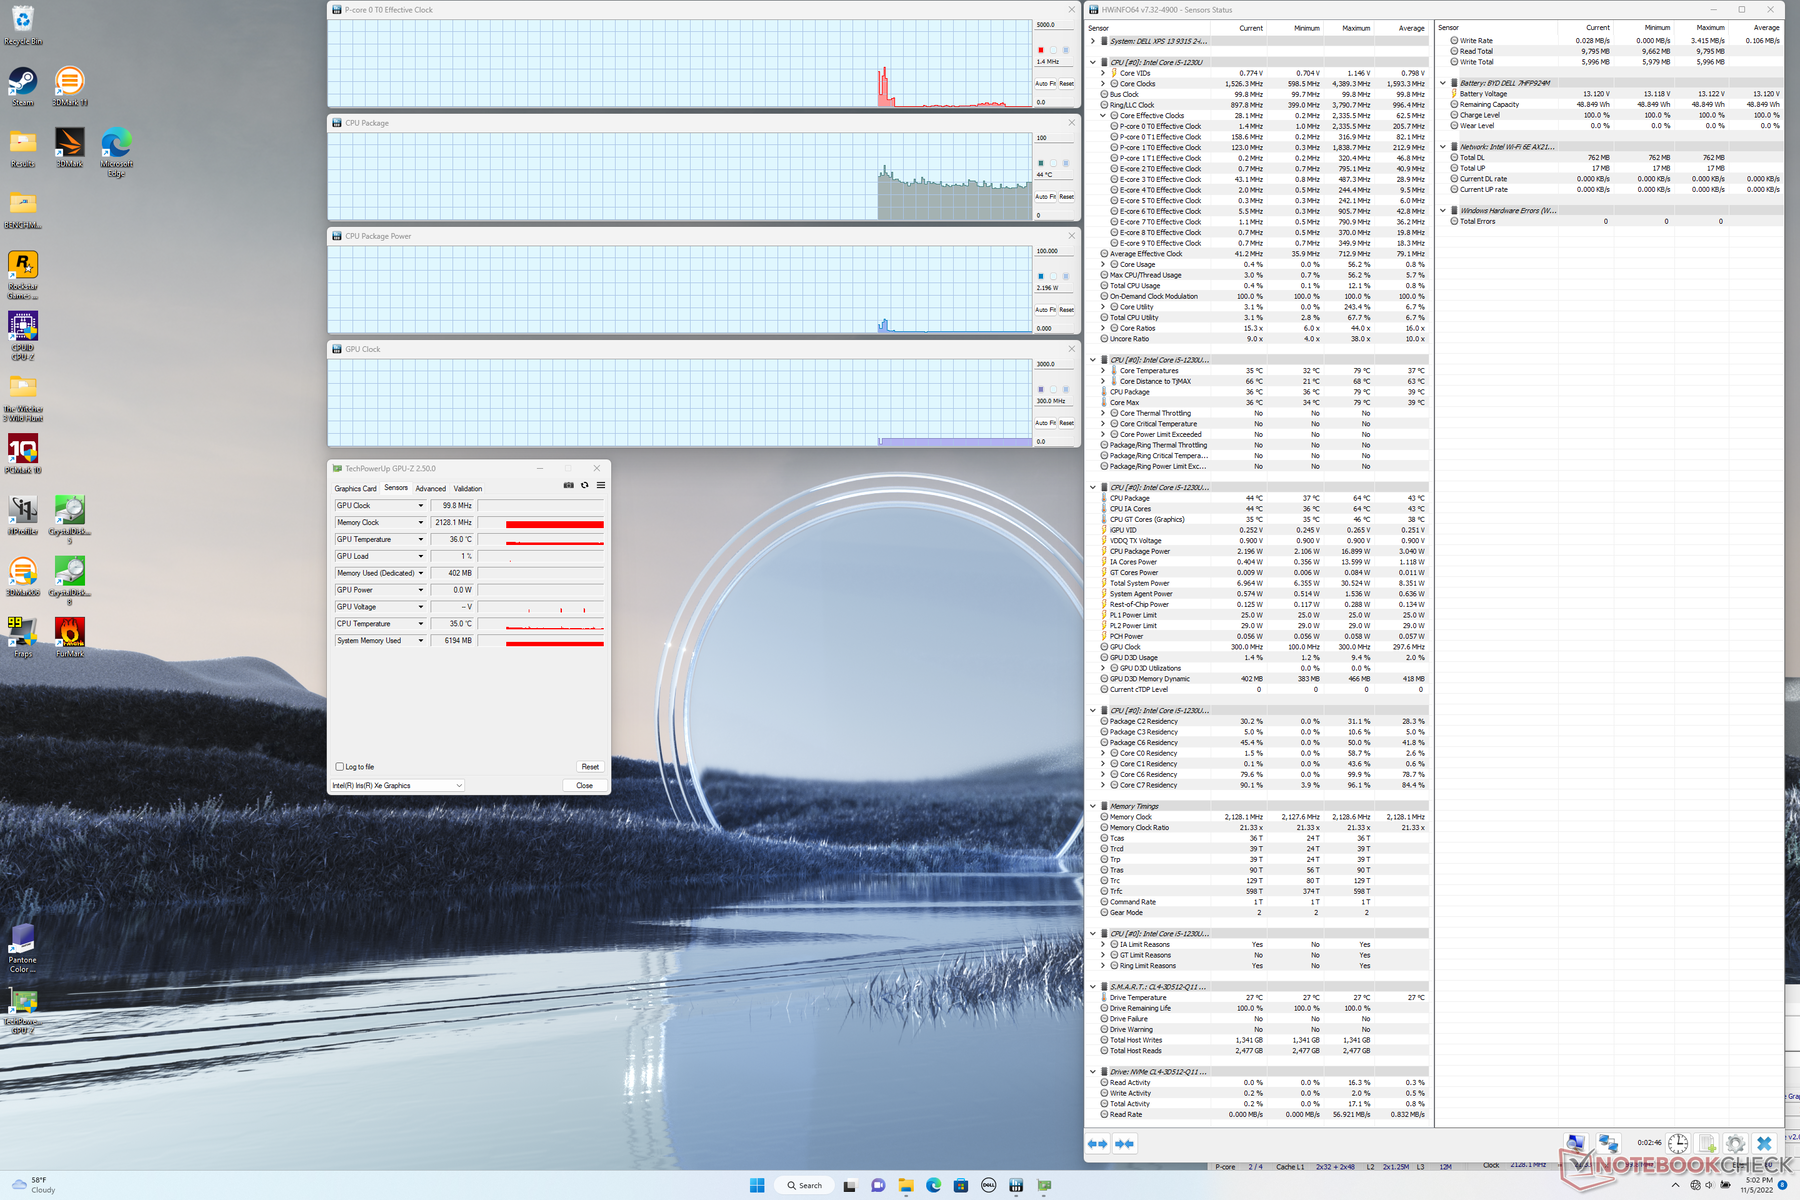
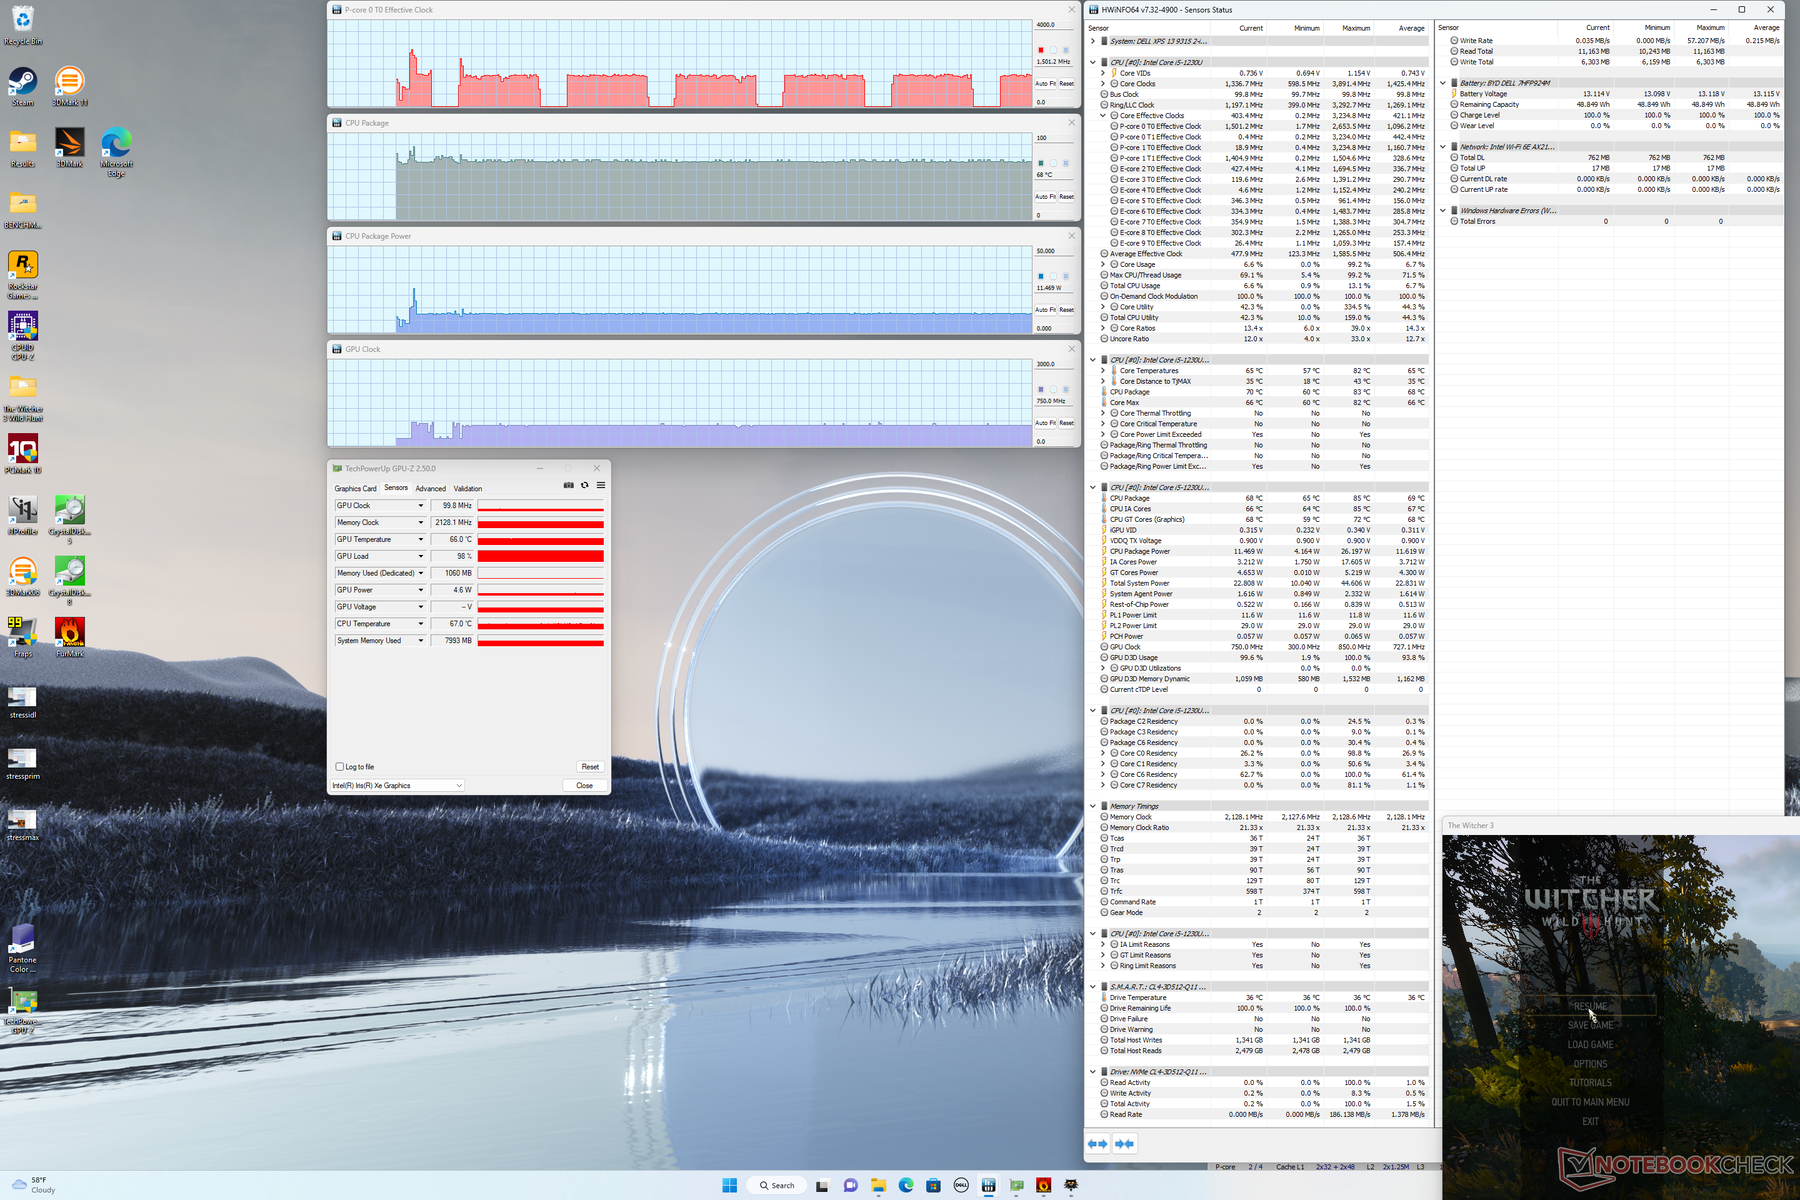
压力测试
在Prime95压力下,CPU会在大约20秒内提升到2.7GHz和29W,直到核心温度达到90C。此后,时钟频率和电路板功耗会稳步下降,最终分别稳定在1.4GHz和12W,以保持一个更冷的66C核心温度。考虑到无风扇设计和平板电脑的外形因素,有限的时钟速率并不令人意外。在有风扇冷却的Surface Pro 8上重复这一测试,会看到更高的CPU功耗为26W,但核心温度类似于65C。
运行时,GPU的时钟频率将稳定在750 MHz。 Witcher 3相比之下,更快的XPS 14 9320 Core i7蛤壳上的1147 MHz。
如果在电池电源上运行,CPU的性能不会被人为地扼杀。电池和主电源之间的3DMark 11结果几乎是相同的。
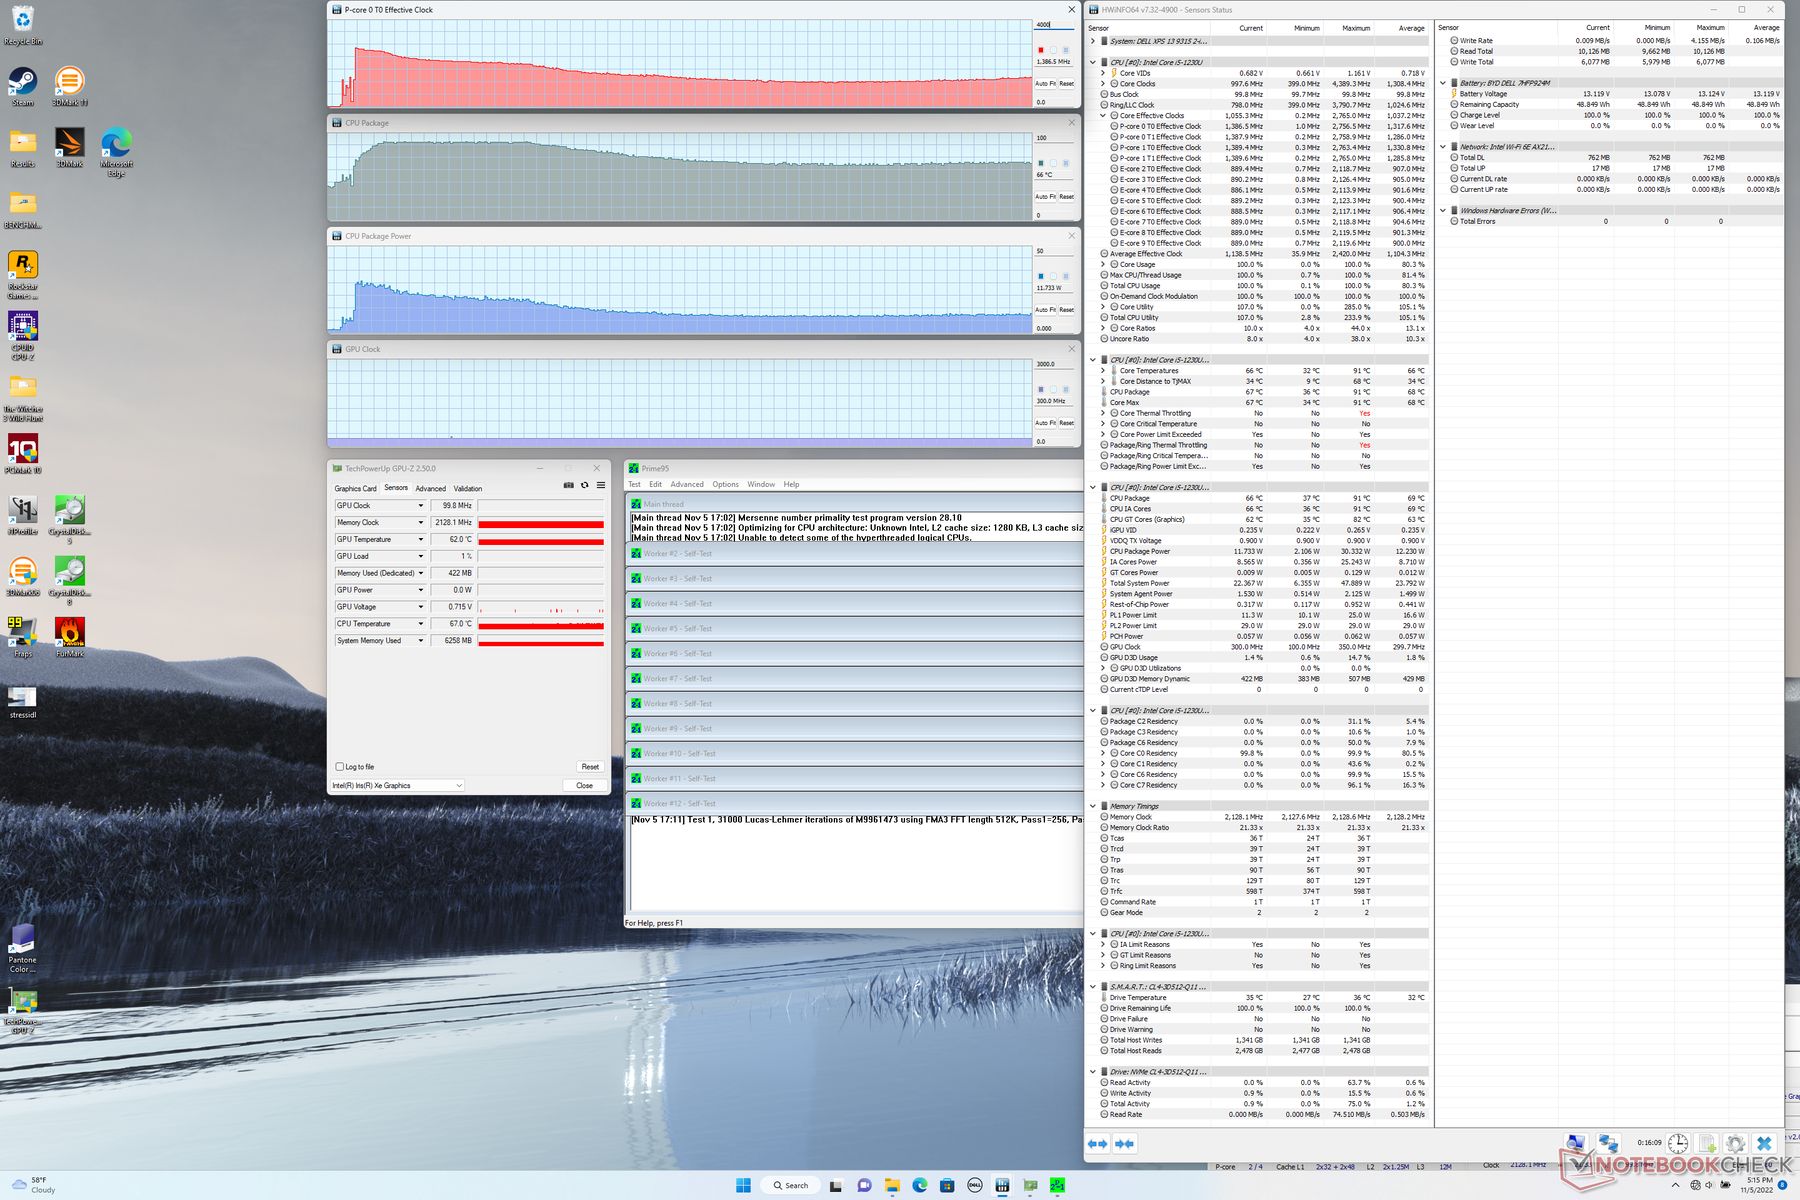
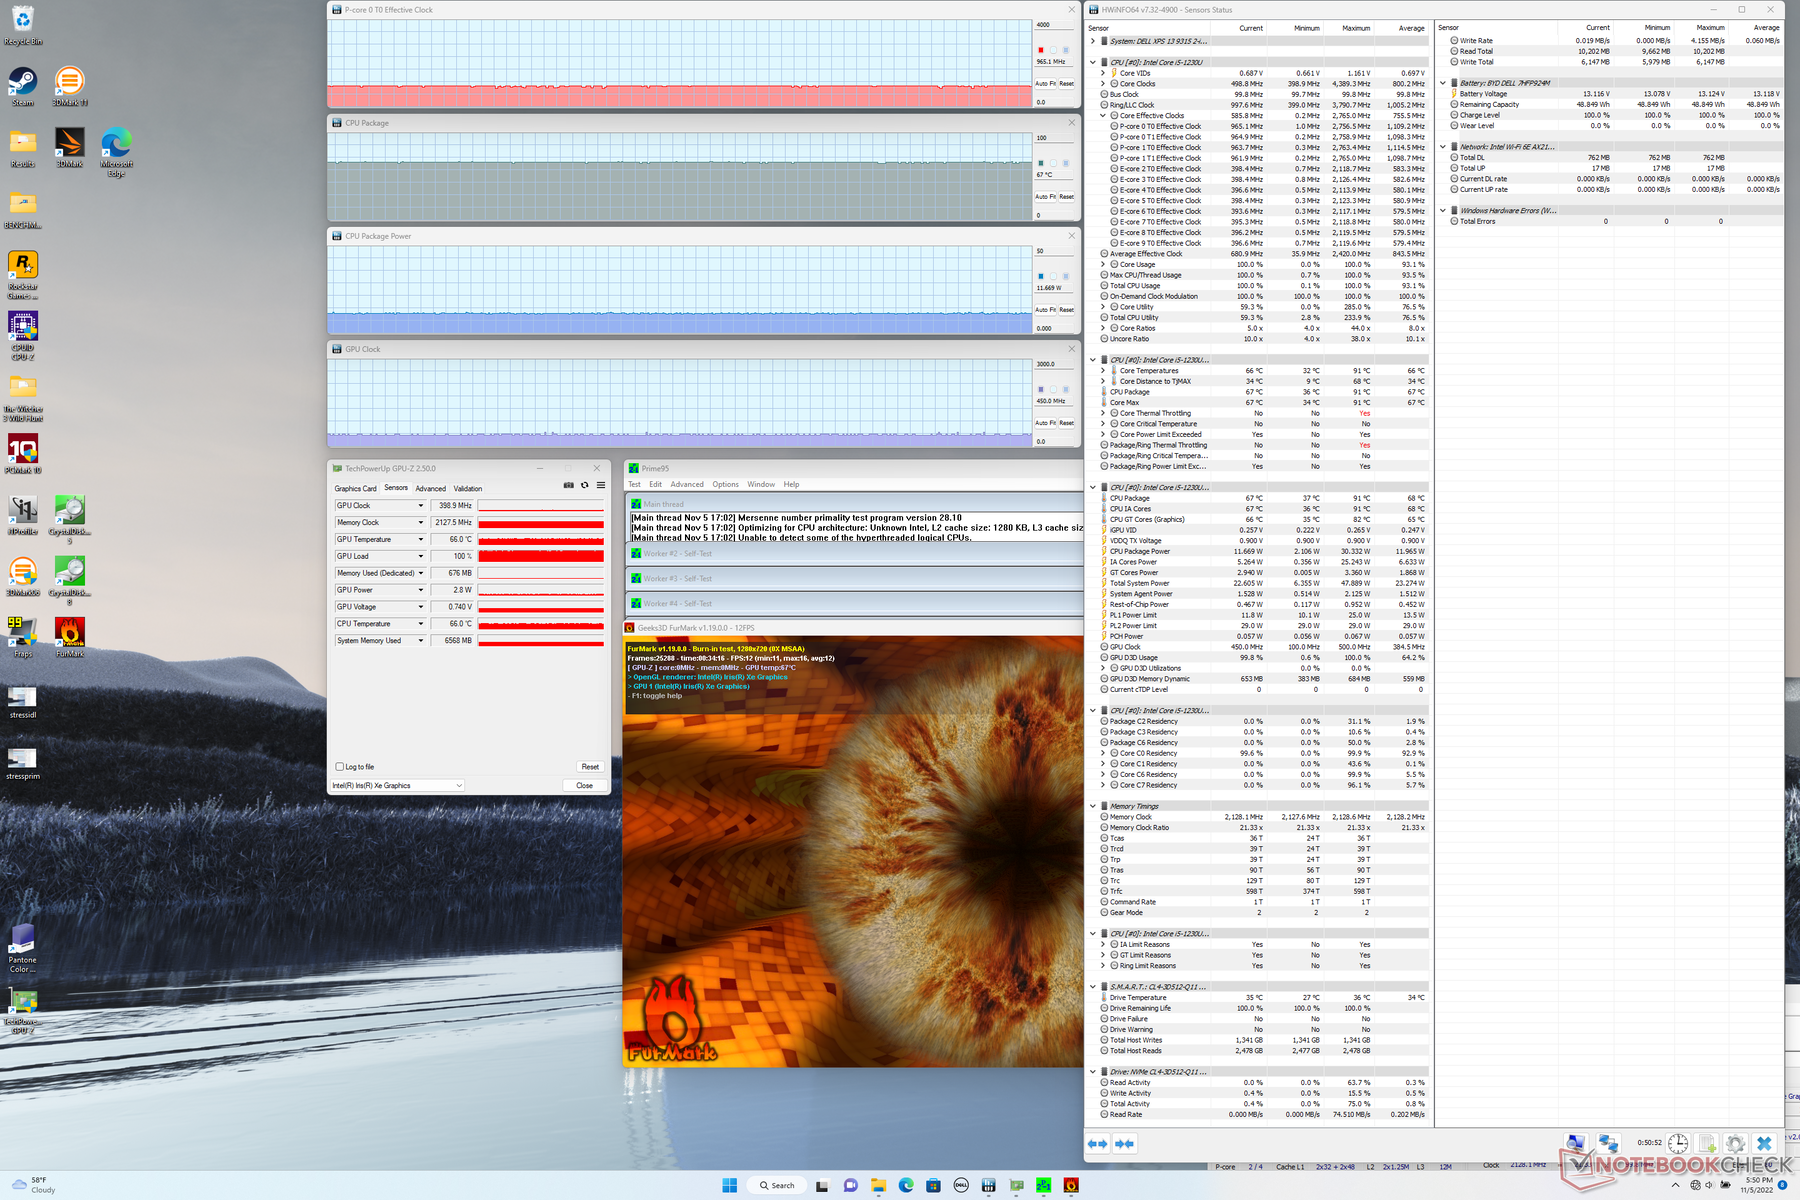
| CPU时钟(GHz) | GPU时钟(MHz) | CPU平均温度(°C) | |
| 系统空闲 | -- | -- | 44 |
| Prime95压力 | 1.4 | -- | 66 |
| Prime95 + FurMark 压力 | 1.0 | 450 | 67 |
| Witcher 3 应力 | ~1.5 | 750 | 68 |
发言人
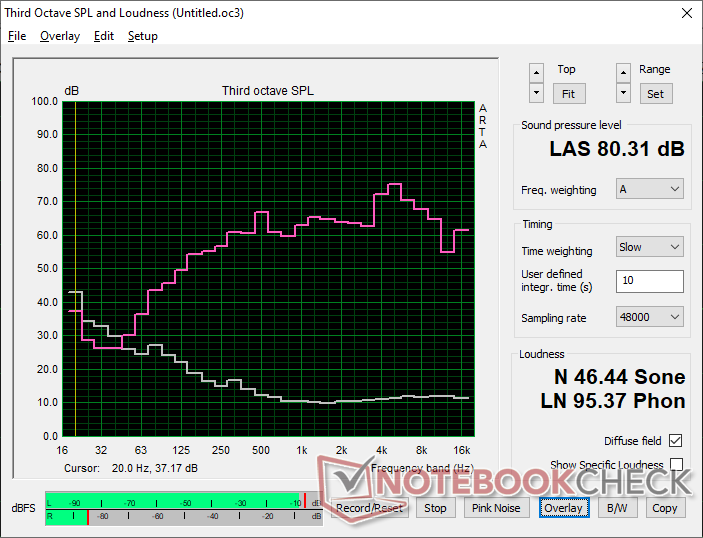
Dell XPS 13 9315 2-in-1 Core i5-1230U audio analysis
(±) | speaker loudness is average but good (80.3 dB)
Bass 100 - 315 Hz
(±) | reduced bass - on average 8.9% lower than median
(+) | bass is linear (5.7% delta to prev. frequency)
Mids 400 - 2000 Hz
(+) | balanced mids - only 2.2% away from median
(+) | mids are linear (5.2% delta to prev. frequency)
Highs 2 - 16 kHz
(±) | higher highs - on average 5.5% higher than median
(+) | highs are linear (6.8% delta to prev. frequency)
Overall 100 - 16.000 Hz
(+) | overall sound is linear (11.9% difference to median)
Compared to same class
» 9% of all tested devices in this class were better, 3% similar, 89% worse
» The best had a delta of 6%, average was 21%, worst was 57%
Compared to all devices tested
» 6% of all tested devices were better, 2% similar, 91% worse
» The best had a delta of 4%, average was 25%, worst was 134%
Apple MacBook Pro 16 2021 M1 Pro audio analysis
(+) | speakers can play relatively loud (84.7 dB)
Bass 100 - 315 Hz
(+) | good bass - only 3.8% away from median
(+) | bass is linear (5.2% delta to prev. frequency)
Mids 400 - 2000 Hz
(+) | balanced mids - only 1.3% away from median
(+) | mids are linear (2.1% delta to prev. frequency)
Highs 2 - 16 kHz
(+) | balanced highs - only 1.9% away from median
(+) | highs are linear (2.7% delta to prev. frequency)
Overall 100 - 16.000 Hz
(+) | overall sound is linear (4.6% difference to median)
Compared to same class
» 0% of all tested devices in this class were better, 0% similar, 100% worse
» The best had a delta of 5%, average was 18%, worst was 45%
Compared to all devices tested
» 0% of all tested devices were better, 0% similar, 100% worse
» The best had a delta of 4%, average was 25%, worst was 134%
能源管理 - 非常省电
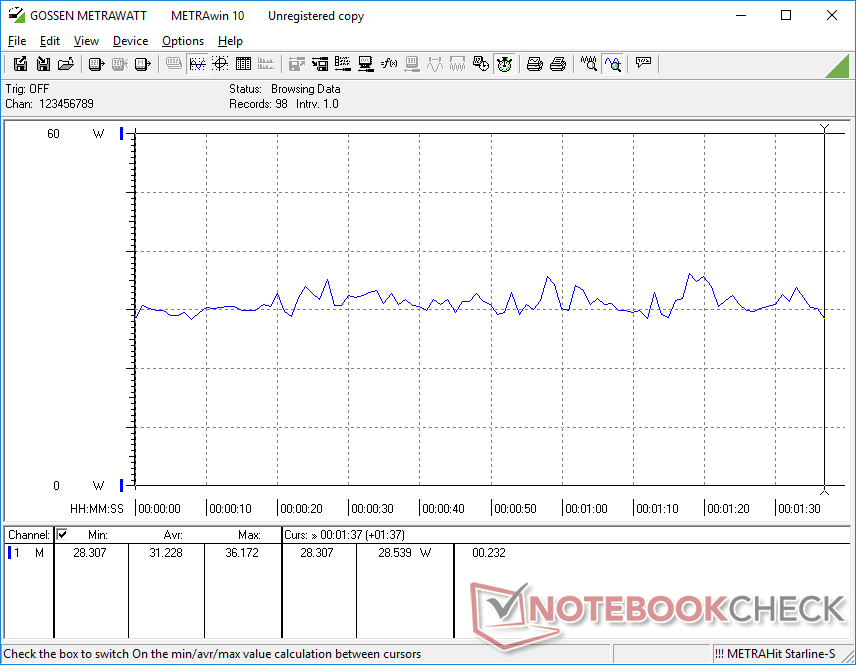
消耗功率
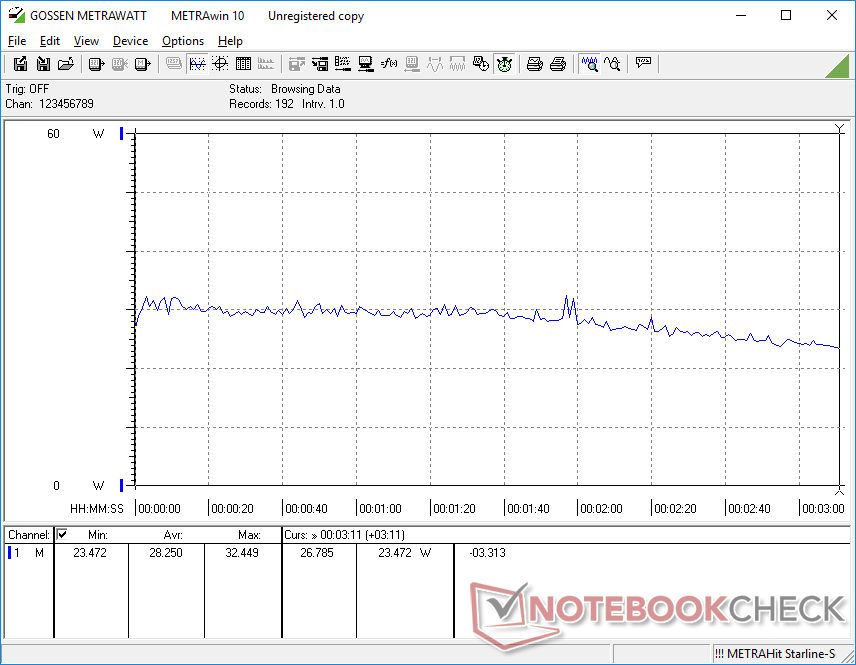
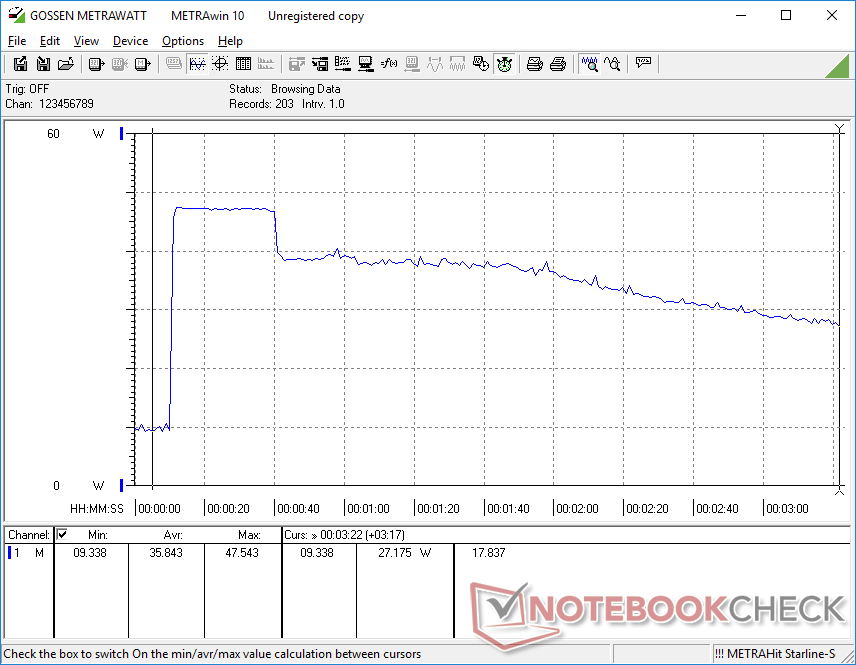
在最低亮度设置下,在桌面上空转只消耗5瓦,而最大亮度设置则需要多3瓦。结果与我们在ThinkBook Plus Gen 2上的记录非常接近。 装备相同的Core i5-1230U CPU的ThinkBook Plus Gen 2配备相同的Core i5-1230U CPU时,在类似负载下的结果非常接近。Surface Pro 8酷睿i7在高负载下的耗电量要高出50%,因为它的图形性能比我们的酷睿i5戴尔SKU要快得多。
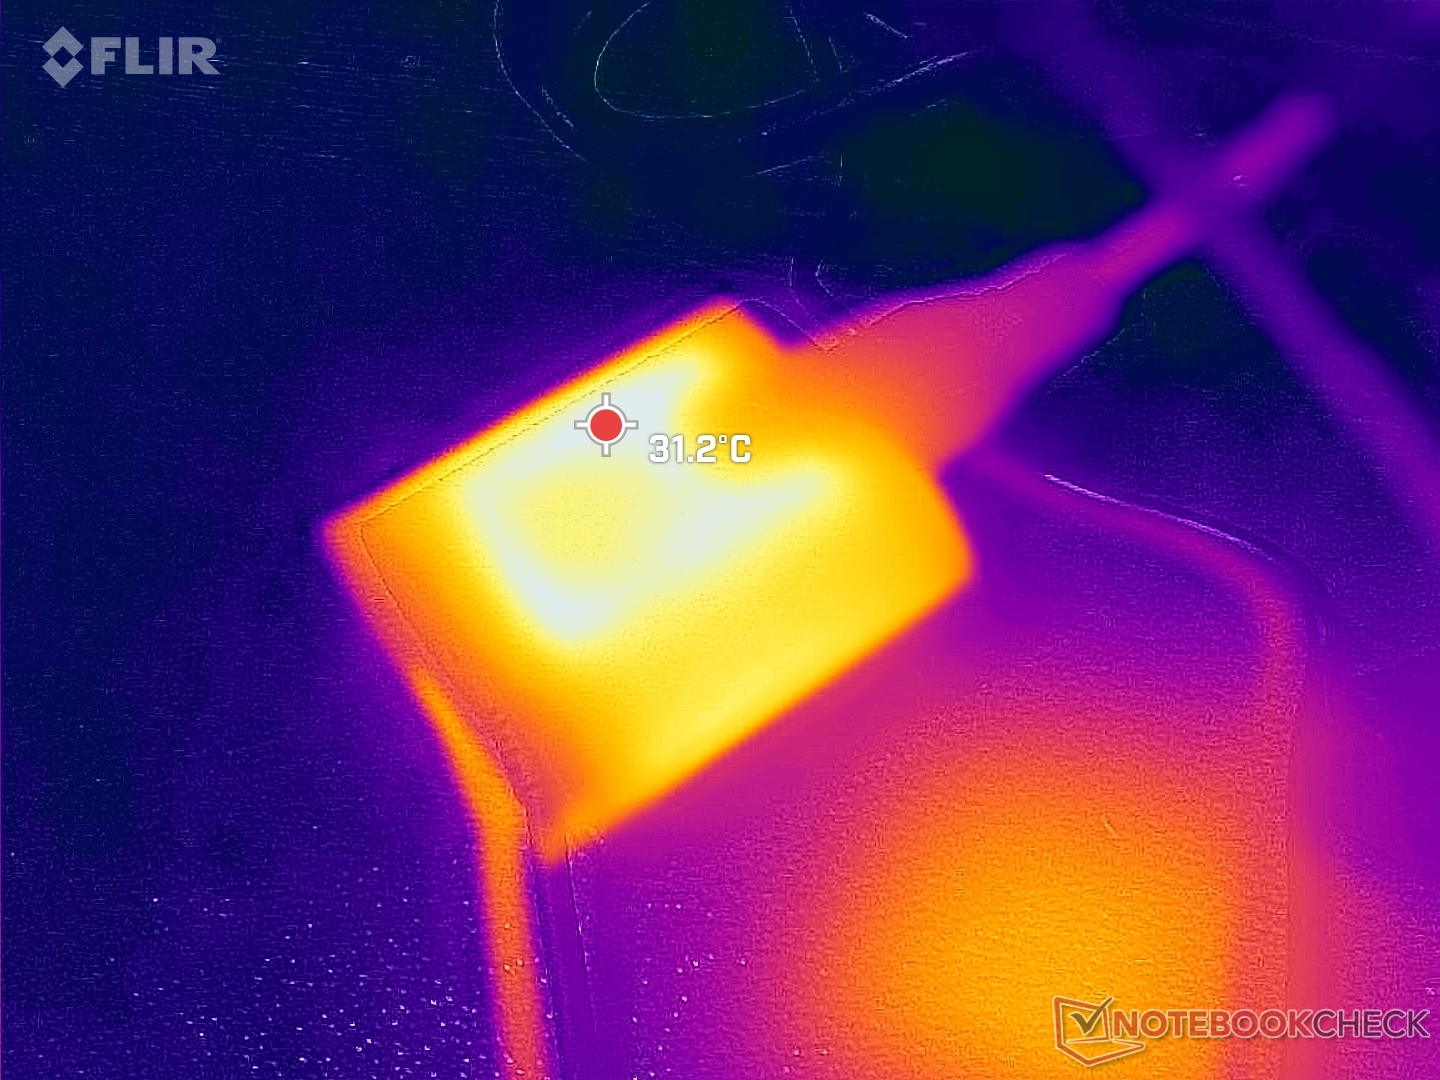
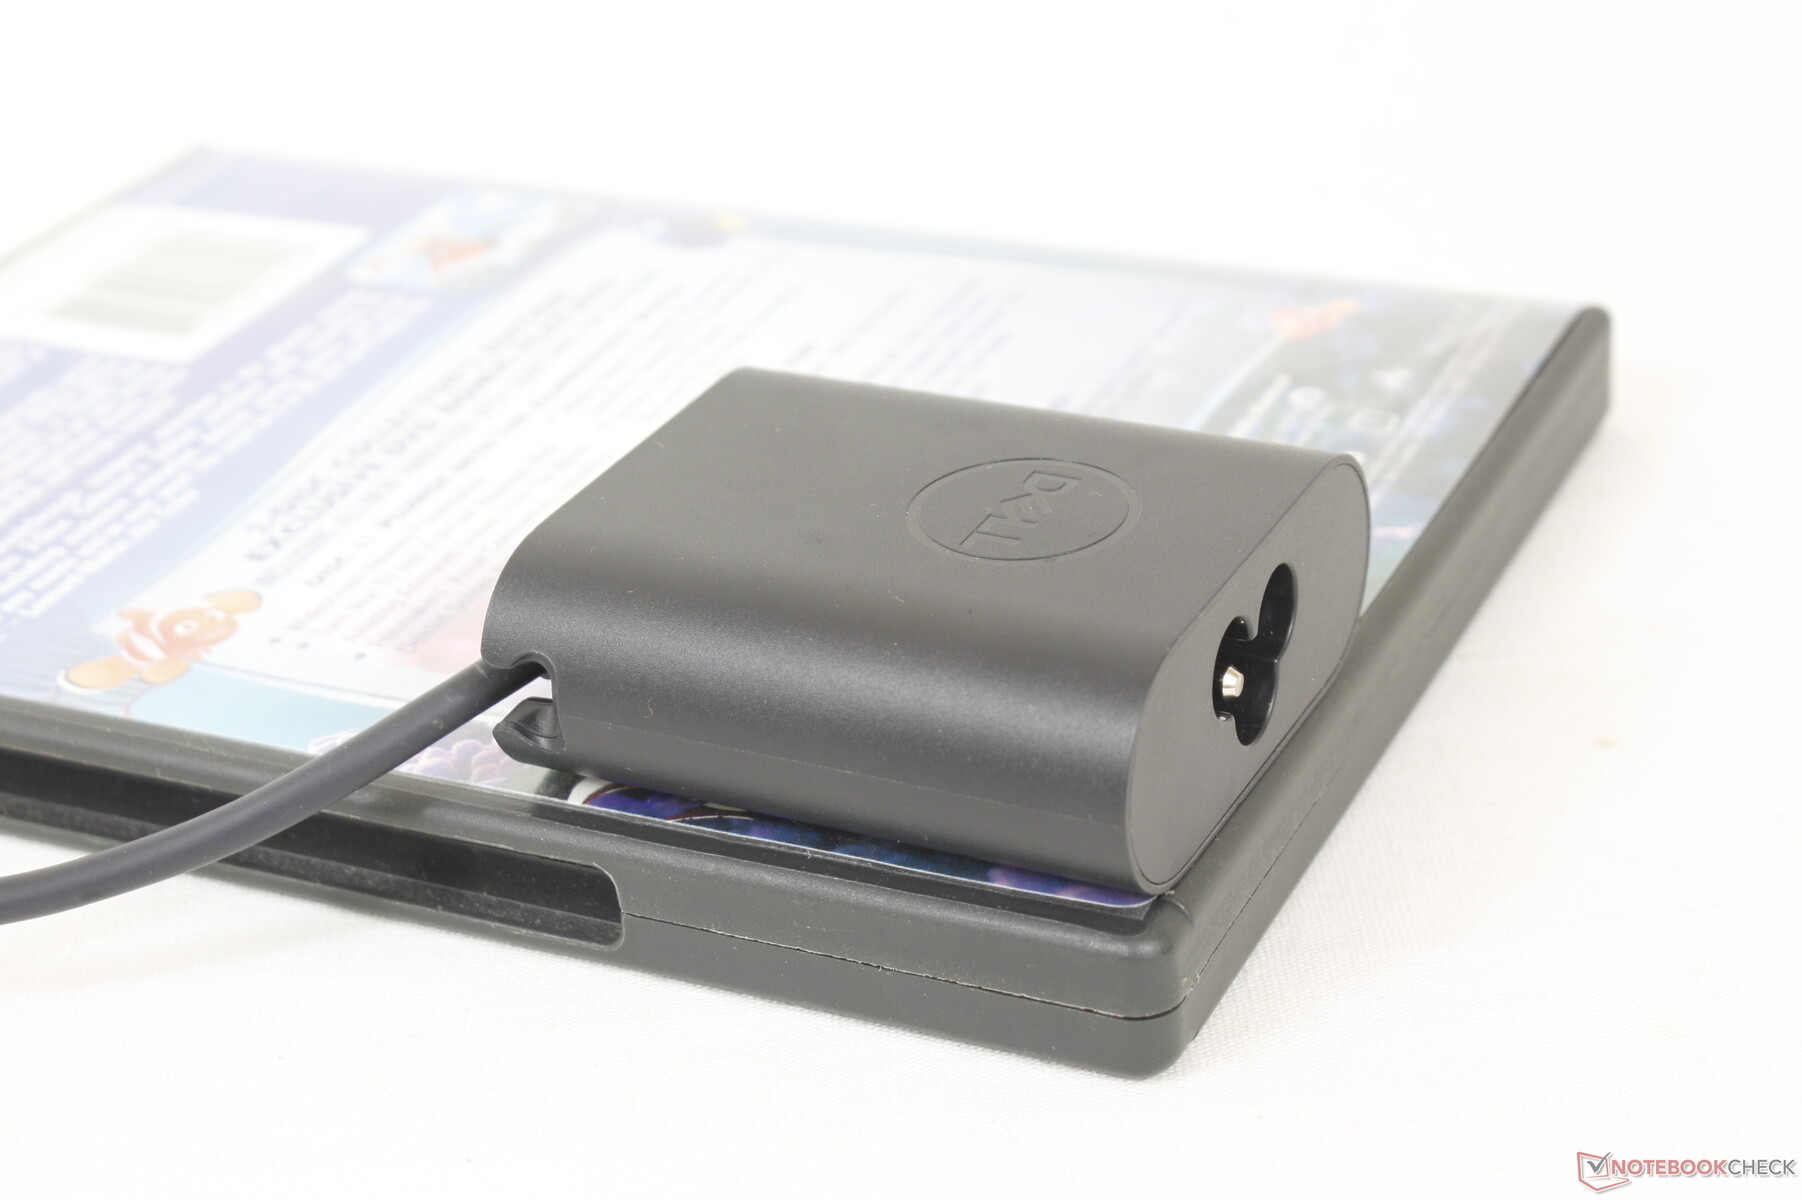
我们能够从小型(约6 x 5.5 x 2.2厘米)45瓦的USB-C交流适配器中记录到48瓦的最大消耗。正如我们下面的图表所示,这个速率只是暂时的,因为CPU Turbo Boost是有限的。

| Off / Standby | |
| Idle | |
| Load |
|
| Dell XPS 13 9315 2-in-1 Core i5-1230U i5-1230U, Iris Xe G7 80EUs, , IPS, 2880x1920, 13.00 | Dell XPS 13 Plus 9320 i7-1280P OLED i7-1280P, Iris Xe G7 96EUs, WDC PC SN810 512GB, OLED, 3456x2160, 13.40 | Microsoft Surface Pro 8, i7-1185G7 i7-1185G7, Iris Xe G7 96EUs, Toshiba KBG40ZNS256G NVMe, IPS, 2880x1920, 13.00 | HP Spectre x360 13.5 14t-ef000 i7-1255U, Iris Xe G7 96EUs, Micron 3400 1TB MTFDKBA1T0TFH, OLED, 3000x2000, 13.50 | Lenovo ThinkBook Plus Gen2 Core i5 i5-1130G7, Iris Xe G7 80EUs, Samsung PM9A1 MZVL2512HCJQ, IPS, E-Ink, 2560x1600, 13.30 | Apple MacBook Air M2 Entry M2, M2 8-Core GPU, Apple SSD AP0256Z, IPS, 2560x1664, 13.60 | |
|---|---|---|---|---|---|---|
| Power Consumption | -46% | -23% | -19% | -5% | 13% | |
| Idle Minimum * | 5.2 | 6.5 -25% | 3.9 25% | 4 23% | 5 4% | 1.87 64% |
| Idle Average * | 7.9 | 7.8 1% | 8.5 -8% | 4.9 38% | 7.9 -0% | 9.2 -16% |
| Idle Maximum * | 8 | 13 -63% | 9.8 -23% | 12.5 -56% | 8.3 -4% | 9.3 -16% |
| Load Average * | 31.2 | 56.6 -81% | 48 -54% | 48.1 -54% | 30.9 1% | 28.5 9% |
| Witcher 3 ultra * | 28.2 | 49.2 -74% | 41.5 -47% | 35.8 -27% | 25.2 11% | 27.4 3% |
| Load Maximum * | 47.6 | 63 -32% | 63 -32% | 65.2 -37% | 66.8 -40% | 31 35% |
* ... smaller is better
Power Consumption Witcher 3 / Stresstest
Power Consumption external Monitor
电池寿命
49.5Wh的电池仅比Surface Pro 8和ThinkBook Plus第二代的51.5Wh和53Wh电池略小。然而,运行时间非常好,实际使用WLAN的时间接近9小时,而上述微软和联想的替代品则为8小时。
从空电到满电大约需要2至2.5小时。
| Dell XPS 13 9315 2-in-1 Core i5-1230U i5-1230U, Iris Xe G7 80EUs, 49.5 Wh | Dell XPS 13 Plus 9320 i7-1280P OLED i7-1280P, Iris Xe G7 96EUs, 55 Wh | Microsoft Surface Pro 8, i7-1185G7 i7-1185G7, Iris Xe G7 96EUs, 51.5 Wh | HP Spectre x360 13.5 14t-ef000 i7-1255U, Iris Xe G7 96EUs, 66 Wh | Lenovo ThinkBook Plus Gen2 Core i5 i5-1130G7, Iris Xe G7 80EUs, 53 Wh | Apple MacBook Air M2 Entry M2, M2 8-Core GPU, 52.6 Wh | |
|---|---|---|---|---|---|---|
| Battery Runtime | -36% | -29% | 16% | -16% | 44% | |
| Reader / Idle | 815 | 1223 50% | ||||
| WiFi v1.3 | 538 | 346 -36% | 456 -15% | 481 -11% | 453 -16% | 910 69% |
| Load | 121 | 70 -42% | 133 10% | 144 19% | ||
| H.264 | 604 | 989 |
Pros
Cons
结论 - XPS还是Surface Pro?
XPS 13 9315 2-in-1是微软Surface Pro的最佳竞争者。 微软Surface Pro系列的最佳竞争对手。有些方面比微软的机型更好,而有些方面则更差。特别是可拆卸的键盘底座提供了更坚实的键盘按键,更大的点击板,以及更好的防刮伤保护。平板电脑本身也比Surface Pro 8更薄、更轻,而不需要对处理器性能进行大幅削减。事实上 酷睿i5-1230U的性能与Surface Pro 8的Core i7-1185G7相似,尽管戴尔采用无风扇设计。制造商承诺在不久的将来推出5G eSIM SKU,而在撰写本文时,Surface Pro还没有这样的选择。
仍然有一些理由考虑微软的机型而不是戴尔的。首先,Surface Pro 8集成了一个3.5毫米音频插孔,一些用户可能会喜欢。图形性能也明显更快,因为戴尔的GPU往往表现不佳,即使与其他具有类似集成图形的笔记本电脑相比也是如此。缺乏任何120赫兹的显示选项也许是最引人注目的,因为它使戴尔平板电脑感觉更笨重,反应更慢。60赫兹的限制在过去并不是一个大问题,但现在高刷新率的笔记本电脑、显示器和智能手机已经很普遍了,它正变得越来越成为一个障碍。
一个没有Surface Pro名字的Surface Pro。XPS 13 9315二合一在舒适度方面超过了微软Surface Pro Type Cover,但60赫兹的触摸屏在120赫兹的Surface Pro 8旁边感觉过时了。
如果你打算做大量的打字和发电子邮件,那么XPS 13 9315二合一可能是更好的选择,因为它有优越的键盘底座。如果你打算更频繁地在平板电脑模式下使用触摸屏,那么Surface Pro显示屏更高的刷新率和响应速度是难以拒绝的。如果戴尔未来能提供更多的显示屏选择,那么它的XPS 13 9315二合一系列可以更容易地推荐给更多使用场景。
价格和可用性
XPS 13 9315二合一产品将于11月14日广泛上市。亚马逊等零售商已经列出某些SKU进行预购。目前最好的订购地点是戴尔,,价格从1000美元起。 不含键盘底座或笔。
Dell XPS 13 9315 2-in-1 Core i5-1230U
-
11/08/2022 v7
Allen Ngo
Pricecompare

